Journal of Coastal Research 25 6 1264–1275 West Palm Beach, Florida November 2009 The Role of Remote Sensing in Predicting and Determining Coastal Storm Impacts Victor V. Klemas University of Delaware College of Marine and Earth Studies Newark, DE 19716, U.S.A. [email protected] ABSTRACT KLEMAS, V.V., 2009. The role of remote sensing in predicting and assessing coastal storm impacts. Journal of Coastal Research, 25(6), 1264–1275. West Palm Beach (Florida), ISSN 0749-0208. Storm-induced flooding and other damage present a major problem as the coastal population continues to increase rapidly and sea level keeps rising. To predict the path and landfall of a hurricane or other coastal storm and assess the damage, emergency managers and scientists need continuous information on the storm’s path, strength, predicted landfall, and expected damage over large areas. Satellite and airborne remote sensors can provide the required in- formation in a timely and reliable way, as demonstrated by a case study of hurricane Katrina’s impact on New Orleans and surrounding areas. Satellite images and hurricane hunter planes were used to track hurricane Katrina, with modelers predicting accurately its path, strength, surge level, and landfall location. Shore-based radars were used to confirm the data as the hurricane approached land. Medium- and high-resolution satellite sensors, helicopters, and aircraft were employed to assess damage to the city, including transportation, power, and communication infrastruc- tures, and to adjacent wetlands and other coastal ecosystems. The lessons learned from hurricane Katrina are helping to optimize future approaches for tracking hurricanes and predicting their impact on coastal ecosystems and developed areas. ADDITIONAL INDEX WORDS: Hurricane tracking, hurricane impact, coastal flooding, New Orleans case study, coast- al remote sensing. INTRODUCTION More than half the total U.S. population lives in the coastal zone, which represents only 18% of total U.S. land area. These areas are becoming more developed every year. Over the next 15 years, the U.S. coastal population is pro- jected to increase by about 25 million people, reaching 166 million people by the year 2015. These coastal communities will be highly vulnerable to coastal storms and flooding, which already account for more than 70% of annual U.S. di- saster losses. As more people move to the coast, coastal flood- ing and erosion from storm surges and sea level rise will claim more private and public structures each year. With events such as the strong hurricanes of 2004 and 2005, losses can total billions of dollars per year (Gregg, 2007; Island Press, 2000). In the U.S., tropical storms and hurricanes affect the coast from New England to Texas, with their season extending from June through November. Furthermore, each year, sev- eral mid-latitude cyclones evolve into powerful coastal storms along the U.S. Atlantic coast, called nor’easters, because of the strong winds that blow from the northeast. A particularly disastrous storm was the nor’easter of 1962, which ravaged the Mid-Atlantic Coast with a storm surge that tore down boardwalks and urban structures as it flooded communities up to 20 miles inland. Because commercial satellites were not DOI: 10.2112/08-1146.1 received 20 October 2008; accepted in revi- sion 29 January 2009. available at that time, the resulting coastal damage could only be mapped from low-altitude aircraft with simple aerial film cameras (Mather et al., 1964, 1967). Direct hits by major hurricanes are usually more devastat- ing than nor’easters because their wind speeds, storm surges, and waves are much higher. Environmental impacts from hurricanes include excessive nutrient loading, algal blooms, elevated oxygen demand resulting in hypoxia and anoxia, fish kills, large-scale releases of pollutants and debris, and spread of pathogens. Good overviews of the effects of hurricanes on coastal ecosystems are provided in recent journal articles (Greening et al., 2006; Mallin and Corbett, 2006; Sallenger et al., 2006). An important conclusion resulting from these ar- ticles is that many ecological components of estuaries and coastal systems were initially affected by the hurricanes, yet were quite resilient in sharp contrast to the long-term effects on coastal urban developments and infrastructure, such as roads and causeways. The greatest danger to coastal communities is from a hur- ricane’s storm surge. Storm surges develop when water is pushed toward the shore by the force of a hurricane’s wind. Horizontally, the surge can fan out over several hundred miles of coastline. In general, the more intense the hurricane, and the closer a community is to the right-front quadrant, the larger the area that must be evacuated. Vertically, the surge can reach heights of more than 20 feet near the center of a Category 5 hurricane. Furthermore, the astronomical tide can add several feet to the storm surge. Such a surge of

Welcome message from author
This document is posted to help you gain knowledge. Please leave a comment to let me know what you think about it! Share it to your friends and learn new things together.
Transcript
Journal of Coastal Research 25 6 1264–1275 West Palm Beach, Florida November 2009
The Role of Remote Sensing in Predicting and DeterminingCoastal Storm ImpactsVictor V. Klemas
University of DelawareCollege of Marine and Earth StudiesNewark, DE 19716, [email protected]
ABSTRACT
KLEMAS, V.V., 2009. The role of remote sensing in predicting and assessing coastal storm impacts. Journal of CoastalResearch, 25(6), 1264–1275. West Palm Beach (Florida), ISSN 0749-0208.
Storm-induced flooding and other damage present a major problem as the coastal population continues to increaserapidly and sea level keeps rising. To predict the path and landfall of a hurricane or other coastal storm and assessthe damage, emergency managers and scientists need continuous information on the storm’s path, strength, predictedlandfall, and expected damage over large areas. Satellite and airborne remote sensors can provide the required in-formation in a timely and reliable way, as demonstrated by a case study of hurricane Katrina’s impact on New Orleansand surrounding areas. Satellite images and hurricane hunter planes were used to track hurricane Katrina, withmodelers predicting accurately its path, strength, surge level, and landfall location. Shore-based radars were used toconfirm the data as the hurricane approached land. Medium- and high-resolution satellite sensors, helicopters, andaircraft were employed to assess damage to the city, including transportation, power, and communication infrastruc-tures, and to adjacent wetlands and other coastal ecosystems. The lessons learned from hurricane Katrina are helpingto optimize future approaches for tracking hurricanes and predicting their impact on coastal ecosystems and developedareas.
ADDITIONAL INDEX WORDS: Hurricane tracking, hurricane impact, coastal flooding, New Orleans case study, coast-al remote sensing.
INTRODUCTION
More than half the total U.S. population lives in thecoastal zone, which represents only 18% of total U.S. landarea. These areas are becoming more developed every year.Over the next 15 years, the U.S. coastal population is pro-jected to increase by about 25 million people, reaching 166million people by the year 2015. These coastal communitieswill be highly vulnerable to coastal storms and flooding,which already account for more than 70% of annual U.S. di-saster losses. As more people move to the coast, coastal flood-ing and erosion from storm surges and sea level rise willclaim more private and public structures each year. Withevents such as the strong hurricanes of 2004 and 2005, lossescan total billions of dollars per year (Gregg, 2007; IslandPress, 2000).
In the U.S., tropical storms and hurricanes affect the coastfrom New England to Texas, with their season extendingfrom June through November. Furthermore, each year, sev-eral mid-latitude cyclones evolve into powerful coastal stormsalong the U.S. Atlantic coast, called nor’easters, because ofthe strong winds that blow from the northeast. A particularlydisastrous storm was the nor’easter of 1962, which ravagedthe Mid-Atlantic Coast with a storm surge that tore downboardwalks and urban structures as it flooded communitiesup to 20 miles inland. Because commercial satellites were not
DOI: 10.2112/08-1146.1 received 20 October 2008; accepted in revi-sion 29 January 2009.
available at that time, the resulting coastal damage couldonly be mapped from low-altitude aircraft with simple aerialfilm cameras (Mather et al., 1964, 1967).
Direct hits by major hurricanes are usually more devastat-ing than nor’easters because their wind speeds, storm surges,and waves are much higher. Environmental impacts fromhurricanes include excessive nutrient loading, algal blooms,elevated oxygen demand resulting in hypoxia and anoxia, fishkills, large-scale releases of pollutants and debris, and spreadof pathogens. Good overviews of the effects of hurricanes oncoastal ecosystems are provided in recent journal articles(Greening et al., 2006; Mallin and Corbett, 2006; Sallenger etal., 2006). An important conclusion resulting from these ar-ticles is that many ecological components of estuaries andcoastal systems were initially affected by the hurricanes, yetwere quite resilient in sharp contrast to the long-term effectson coastal urban developments and infrastructure, such asroads and causeways.
The greatest danger to coastal communities is from a hur-ricane’s storm surge. Storm surges develop when water ispushed toward the shore by the force of a hurricane’s wind.Horizontally, the surge can fan out over several hundredmiles of coastline. In general, the more intense the hurricane,and the closer a community is to the right-front quadrant,the larger the area that must be evacuated. Vertically, thesurge can reach heights of more than 20 feet near the centerof a Category 5 hurricane. Furthermore, the astronomicaltide can add several feet to the storm surge. Such a surge of
1265Remote Sensing of Coastal Storm Impacts
Journal of Coastal Research, Vol. 25, No. 6, 2009
Table 1. Saffir-Simpson index for storm classification.
Hurricane classification
IntensityPressure
(mb)Wind Speed(mph [km/h])
Storm Surge(ft [m])
Class 5 �920 �155 [�250] �18 [�5.5]Class 4 925–940 131–155 [211–250] 13–18 [4.0–5.5]Class 3 945–965 111–130 [179–210] 9–12 [2.7–3.7]Class 2 965–980 96–110 [154–178] 6–8 [1.8–2.4]Class 1 �980 74–95 [119–153] 4–5 [1.2–1.5]
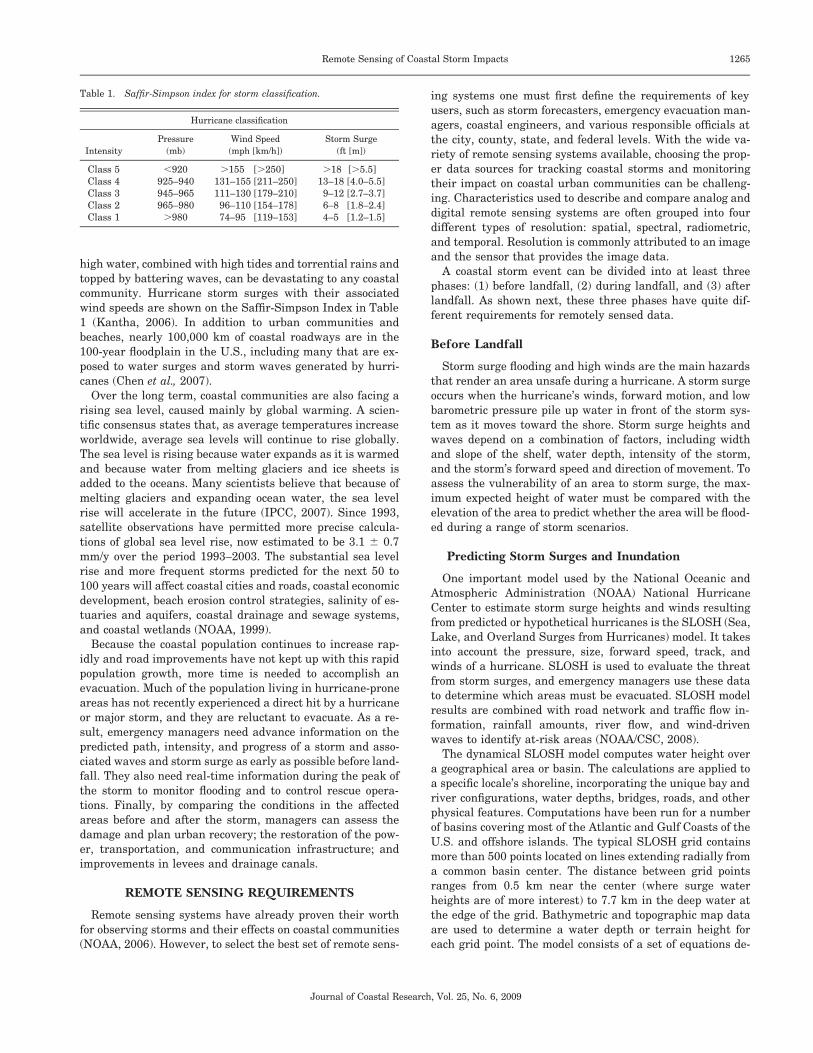
high water, combined with high tides and torrential rains andtopped by battering waves, can be devastating to any coastalcommunity. Hurricane storm surges with their associatedwind speeds are shown on the Saffir-Simpson Index in Table1 (Kantha, 2006). In addition to urban communities andbeaches, nearly 100,000 km of coastal roadways are in the100-year floodplain in the U.S., including many that are ex-posed to water surges and storm waves generated by hurri-canes (Chen et al., 2007).
Over the long term, coastal communities are also facing arising sea level, caused mainly by global warming. A scien-tific consensus states that, as average temperatures increaseworldwide, average sea levels will continue to rise globally.The sea level is rising because water expands as it is warmedand because water from melting glaciers and ice sheets isadded to the oceans. Many scientists believe that because ofmelting glaciers and expanding ocean water, the sea levelrise will accelerate in the future (IPCC, 2007). Since 1993,satellite observations have permitted more precise calcula-tions of global sea level rise, now estimated to be 3.1 � 0.7mm/y over the period 1993–2003. The substantial sea levelrise and more frequent storms predicted for the next 50 to100 years will affect coastal cities and roads, coastal economicdevelopment, beach erosion control strategies, salinity of es-tuaries and aquifers, coastal drainage and sewage systems,and coastal wetlands (NOAA, 1999).
Because the coastal population continues to increase rap-idly and road improvements have not kept up with this rapidpopulation growth, more time is needed to accomplish anevacuation. Much of the population living in hurricane-proneareas has not recently experienced a direct hit by a hurricaneor major storm, and they are reluctant to evacuate. As a re-sult, emergency managers need advance information on thepredicted path, intensity, and progress of a storm and asso-ciated waves and storm surge as early as possible before land-fall. They also need real-time information during the peak ofthe storm to monitor flooding and to control rescue opera-tions. Finally, by comparing the conditions in the affectedareas before and after the storm, managers can assess thedamage and plan urban recovery; the restoration of the pow-er, transportation, and communication infrastructure; andimprovements in levees and drainage canals.
REMOTE SENSING REQUIREMENTS
Remote sensing systems have already proven their worthfor observing storms and their effects on coastal communities(NOAA, 2006). However, to select the best set of remote sens-
ing systems one must first define the requirements of keyusers, such as storm forecasters, emergency evacuation man-agers, coastal engineers, and various responsible officials atthe city, county, state, and federal levels. With the wide va-riety of remote sensing systems available, choosing the prop-er data sources for tracking coastal storms and monitoringtheir impact on coastal urban communities can be challeng-ing. Characteristics used to describe and compare analog anddigital remote sensing systems are often grouped into fourdifferent types of resolution: spatial, spectral, radiometric,and temporal. Resolution is commonly attributed to an imageand the sensor that provides the image data.
A coastal storm event can be divided into at least threephases: (1) before landfall, (2) during landfall, and (3) afterlandfall. As shown next, these three phases have quite dif-ferent requirements for remotely sensed data.
Before Landfall
Storm surge flooding and high winds are the main hazardsthat render an area unsafe during a hurricane. A storm surgeoccurs when the hurricane’s winds, forward motion, and lowbarometric pressure pile up water in front of the storm sys-tem as it moves toward the shore. Storm surge heights andwaves depend on a combination of factors, including widthand slope of the shelf, water depth, intensity of the storm,and the storm’s forward speed and direction of movement. Toassess the vulnerability of an area to storm surge, the max-imum expected height of water must be compared with theelevation of the area to predict whether the area will be flood-ed during a range of storm scenarios.
Predicting Storm Surges and Inundation
One important model used by the National Oceanic andAtmospheric Administration (NOAA) National HurricaneCenter to estimate storm surge heights and winds resultingfrom predicted or hypothetical hurricanes is the SLOSH (Sea,Lake, and Overland Surges from Hurricanes) model. It takesinto account the pressure, size, forward speed, track, andwinds of a hurricane. SLOSH is used to evaluate the threatfrom storm surges, and emergency managers use these datato determine which areas must be evacuated. SLOSH modelresults are combined with road network and traffic flow in-formation, rainfall amounts, river flow, and wind-drivenwaves to identify at-risk areas (NOAA/CSC, 2008).
The dynamical SLOSH model computes water height overa geographical area or basin. The calculations are applied toa specific locale’s shoreline, incorporating the unique bay andriver configurations, water depths, bridges, roads, and otherphysical features. Computations have been run for a numberof basins covering most of the Atlantic and Gulf Coasts of theU.S. and offshore islands. The typical SLOSH grid containsmore than 500 points located on lines extending radially froma common basin center. The distance between grid pointsranges from 0.5 km near the center (where surge waterheights are of more interest) to 7.7 km in the deep water atthe edge of the grid. Bathymetric and topographic map dataare used to determine a water depth or terrain height foreach grid point. The model consists of a set of equations de-
1266 Klemas
Journal of Coastal Research, Vol. 25, No. 6, 2009
Table 2. Spaceborne ocean sensing techniques.
Color scanner Ocean color (chlorophyll concentration,suspended sediment, attenuation coeffi-cient)
Infrared radiometer Sea surface temperature (surface tempera-ture, current patterns)
Synthetic Aperture Radar Short surface waves (swell, internal waves,oil slicks, etc.)
Altimeter Topography and roughness of sea surface(sea level, currents, wave height)
Scatterometer Amplitude of short surface waves (surfacewind velocity, roughness)
Microwave radiometer Microwave brightness temperature (salini-ty, surface temperature, water vapor,soil moisture)
rived from the Newtonian equations of motion and the con-tinuity equation applied to a rotating fluid with a free sur-face. The equations are integrated from the sea floor to thesea surface. The coastline is represented as a physical bound-ary within the model domain. Subgrid-scale water features(cuts, chokes, sills, and channels) and vertical obstructions(levees, roads, spoil banks, etc.) can be parameterized withinthe model. Astronomical tides, rainfall, river flow, and wind-driven waves have not been incorporated into the model. Theprimary use of the SLOSH model is to define flood-prone ar-eas for evacuation planning. The flood areas are determinedby compositing the model surge values from 200 to 300 hy-pothetical hurricanes. Separate composite flood maps areproduced for each of the five Saffir-Simpson hurricane cate-gories. The SLOSH model can also be run with forecast trackand intensity data for an actual storm as it makes landfall(NOAA/CSC, 2008).
The U.S. Army Corps of Engineers merged the SLOSHmodel results with digital elevation models up to the 9-mcontour of South Carolina’s coast to create storm surge maps.These maps were developed by scanning U.S. Geological Sur-vey (USGS) quadrangle sheets to create an electronic back-ground map and by digitizing topographic information fromthese quad sheets along with supplemental elevation dataprovided by the U.S. Army Corps of Engineers. By processingthe elevation from the base maps, a ground surface modelwas created and merged with SLOSH model results to createa storm surge map. In areas where the water surface eleva-tion was greater than the terrain elevation, the area wasshaded. The resulting maps represent the ‘‘maximum of themaximum’’ storm surge composite of hypothetical storms cal-culated at high tide, one depicting storms with slow forwardspeeds (8 and 24 km/h), and one depicting storms with fastforward speeds (40 and 56 km/h).
Remote Sensing Data
If the SLOSH model is used to estimate storm surge for anactual, predicted hurricane, forecast data must be put intothe model every 6 hours over a 72-hour period and updatedas new data become available (NOAA/NHC, 2008). This isachieved to a large extent with the use of remotely senseddata. The remote sensing systems used to provide near–real-time data for the models, include geostationary satellites(GOES), which sit above a fixed point on the equator at analtitude of 36,000 km and can provide estimates of the loca-tion, size, and intensity of a storm with their visible and ther-mal infrared imagers over large areas at a spatial resolutionof 4 km (NOAA, 2006). In the visible region, clouds appearwhite because they scatter and reflect the sunlight. In ther-mal infrared images, clouds appear in varying shades of grey,depending on their temperature, which is determined bytheir height above Earth. Because geostationary satellitespermanently view the same part of the globe, they can pro-vide this information at very frequent intervals (e.g., every 15min). These images can be supplemented by daily passes ofthe NOAA Advanced Very High Resolution Radiometer(AVHRR) sensor, providing a resolution of 1.1 km.
Satellite radar systems can provide additional data on sea
surface height, surface winds, and wave fields with radar al-timeters, scatterometers, and Synthetic Aperture Radar(SAR), respectively (Table 2). Satellite microwave radiome-ters have also been used to estimate precipitation amountsand other hydrologic parameters for recent hurricanes likeKatrina (Parkinson, 2003). As shown in Table 2, radar sat-ellites can measure wave and sea surface height with altim-eters, sea surface winds with scatterometers, and wave fieldsand other surface features, such as oil slicks, with SAR (Ikedaand Dobson, 1995; Martin, 2004). Along the coast, ground-based radars, such as the X-band marine navigation radars,can monitor waves, storm surges, and fronts over a 10-kmrange with 50-m resolution. Shore-based high-frequency ra-dars can cover larger areas with a resolution of hundreds ofmeters. High-frequency radars can measure current speedsand wave height and direction. Because shore-based radarsare stationary, they can sample frequently and continuously,thus complementing satellite radar data (Cracknell andHayes, 2007; Robinson, 2004).
The NOAA National Hurricane Center uses NOAA and AirForce pilots to fly planes into the core of a hurricane to mea-sure wind, pressure, temperature, and humidity and to pro-vide the location of the center of the hurricane. When a hur-ricane gets close to land, it is monitored by land-based Na-tional Weather Service (NWS) Doppler weather radars. Thuslocal NWS stations are able to provide accurate short-termwarnings of floods, high winds, and other weather hazardsassociated with such storms. NWS hurricane centers use nu-merical computer and statistical models to forecast the path,speed, and strength of coastal storms. Data from geostation-ary and polar orbit satellites, reconnaissance aircraft, andother sources are fed into these computer models. The modelsare then used to predict storm surge heights and the extentof the predicted flooding (NOAA, 2006).
The interface between the near-surface, high-wind environ-ment of air and sea is critical in hurricane dynamics, yet toorisky for manned aircraft to observe directly. One of the manynew developments in hurricane tracking is unmanned hur-ricane hunter aircraft. An unmanned Aerosonde aircraft hasalready been used to track a hurricane’s eye and boundarylayer for 17 hours in wind gusts up to 105 km/h, from as lowas 90 m from the ocean surface. The data transmitted fromsuch unmanned aircraft will result in improved forecasting
1267Remote Sensing of Coastal Storm Impacts
Journal of Coastal Research, Vol. 25, No. 6, 2009
Table 3. High-resolution satellite parameters (Space Imaging, 2009; Digital Globe, 2008; Orbimage, 2009).
SatelliteName Sponsor Launched
SpatialResolution (m)
Pan-chro-matic
Multi-spec-tral
Spectral Range (nm)
Panchro-matic Blue Green Red
NearInfrared
SwathWidth(km)
OffNadir
Pointing
RevisitTime(days)
OrbitalAltitude
(km)
IKONOS Space Imaging Sept. 1999 1.0 4.0 525–928 450–520 510–600 630–690 760–850 11.3 �26� 2.3–3.4 681QuickBird Digital Globe Oct. 2001 0.61 2.44 450–900 450–520 520–600 630–690 760–890 16.5 �30� 1–3.5 450OrbView-3 Orbimage June 2003 1.0 4.0 450–900 450–520 520–600 625–695 760–900 8 �45� 1.5–3 470
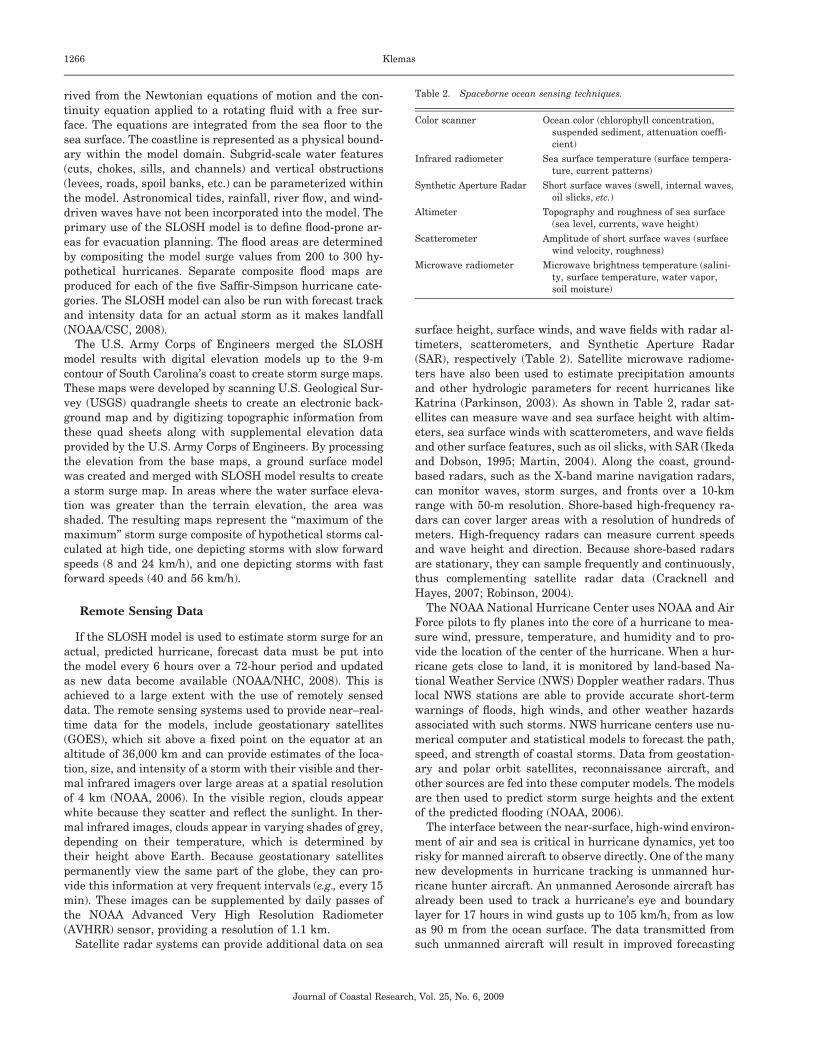
Figure 1. Laboratory spectroradiometer characteristics of common ur-ban materials (Jensen, 2007).
of winds and waves, protecting lives and minimizing econom-ic impact.
During Landfall
All remote sensing systems, such as GOES and NOAA/AVHRR, used to track the hurricane over open water can alsobe used to observe the storm’s landfall. However, duringlandfall, the emergency response teams need to know notonly the predicted storm surge, wave height, and wind veloc-ity, but also the actual flooding taking place. This requireshigh-resolution data obtained at frequent intervals with sen-sors that can penetrate the clouds and rain. Radar systems,such as SAR, qualify for this task because radar energy pen-etrates clouds and can detect flooding, even under tree can-opies (Ramsey, 1995). Airborne and satellite radar systemscan have resolutions from several to hundreds of meters de-pending on altitude. As soon as the hurricane clouds pass,high-resolution visible and near-infrared imagers on aircraftand satellites can be used to monitor flood conditions and
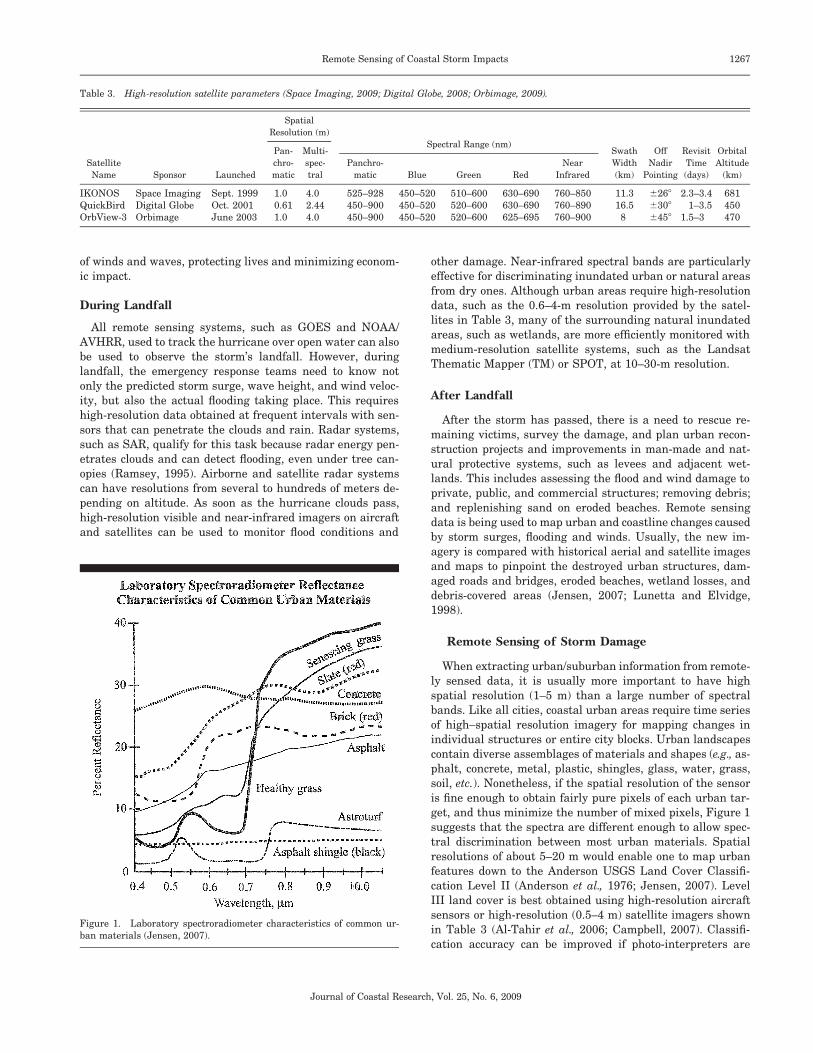
other damage. Near-infrared spectral bands are particularlyeffective for discriminating inundated urban or natural areasfrom dry ones. Although urban areas require high-resolutiondata, such as the 0.6–4-m resolution provided by the satel-lites in Table 3, many of the surrounding natural inundatedareas, such as wetlands, are more efficiently monitored withmedium-resolution satellite systems, such as the LandsatThematic Mapper (TM) or SPOT, at 10–30-m resolution.
After Landfall
After the storm has passed, there is a need to rescue re-maining victims, survey the damage, and plan urban recon-struction projects and improvements in man-made and nat-ural protective systems, such as levees and adjacent wet-lands. This includes assessing the flood and wind damage toprivate, public, and commercial structures; removing debris;and replenishing sand on eroded beaches. Remote sensingdata is being used to map urban and coastline changes causedby storm surges, flooding and winds. Usually, the new im-agery is compared with historical aerial and satellite imagesand maps to pinpoint the destroyed urban structures, dam-aged roads and bridges, eroded beaches, wetland losses, anddebris-covered areas (Jensen, 2007; Lunetta and Elvidge,1998).
Remote Sensing of Storm Damage
When extracting urban/suburban information from remote-ly sensed data, it is usually more important to have highspatial resolution (1–5 m) than a large number of spectralbands. Like all cities, coastal urban areas require time seriesof high–spatial resolution imagery for mapping changes inindividual structures or entire city blocks. Urban landscapescontain diverse assemblages of materials and shapes (e.g., as-phalt, concrete, metal, plastic, shingles, glass, water, grass,soil, etc.). Nonetheless, if the spatial resolution of the sensoris fine enough to obtain fairly pure pixels of each urban tar-get, and thus minimize the number of mixed pixels, Figure 1suggests that the spectra are different enough to allow spec-tral discrimination between most urban materials. Spatialresolutions of about 5–20 m would enable one to map urbanfeatures down to the Anderson USGS Land Cover Classifi-cation Level II (Anderson et al., 1976; Jensen, 2007). LevelIII land cover is best obtained using high-resolution aircraftsensors or high-resolution (0.5–4 m) satellite imagers shownin Table 3 (Al-Tahir et al., 2006; Campbell, 2007). Classifi-cation accuracy can be improved if photo-interpreters are
1268 Klemas
Journal of Coastal Research, Vol. 25, No. 6, 2009
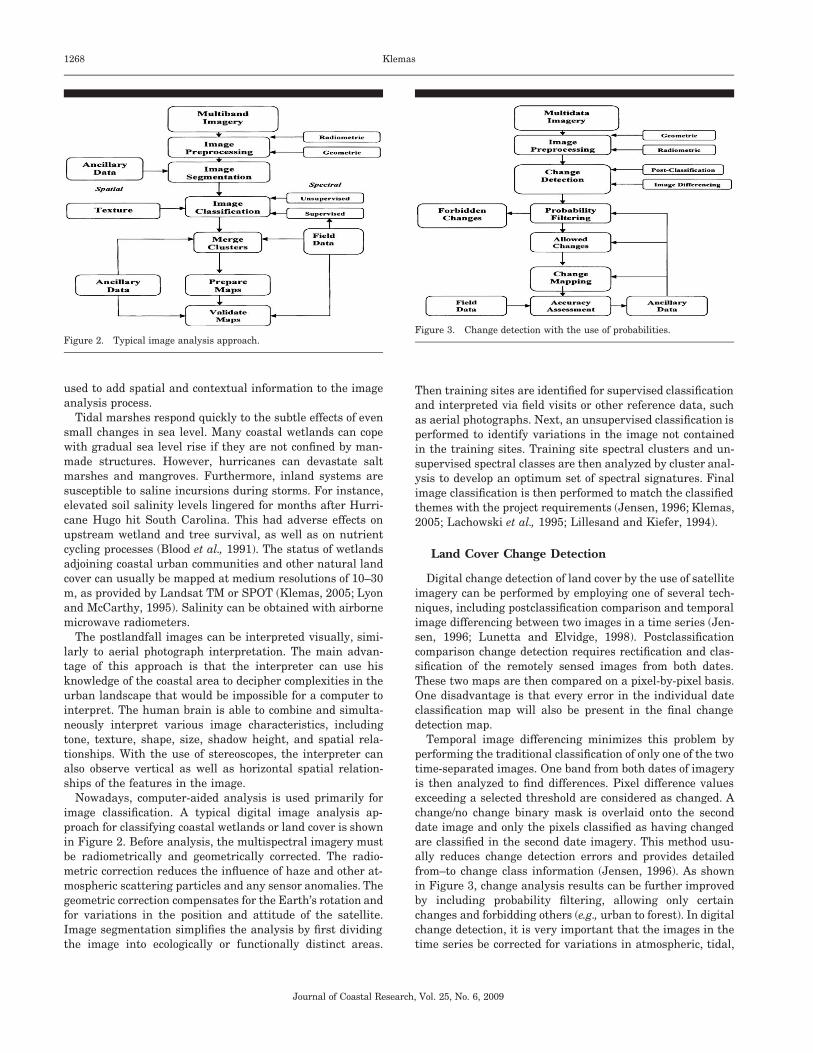
Figure 2. Typical image analysis approach.Figure 3. Change detection with the use of probabilities.
used to add spatial and contextual information to the imageanalysis process.
Tidal marshes respond quickly to the subtle effects of evensmall changes in sea level. Many coastal wetlands can copewith gradual sea level rise if they are not confined by man-made structures. However, hurricanes can devastate saltmarshes and mangroves. Furthermore, inland systems aresusceptible to saline incursions during storms. For instance,elevated soil salinity levels lingered for months after Hurri-cane Hugo hit South Carolina. This had adverse effects onupstream wetland and tree survival, as well as on nutrientcycling processes (Blood et al., 1991). The status of wetlandsadjoining coastal urban communities and other natural landcover can usually be mapped at medium resolutions of 10–30m, as provided by Landsat TM or SPOT (Klemas, 2005; Lyonand McCarthy, 1995). Salinity can be obtained with airbornemicrowave radiometers.
The postlandfall images can be interpreted visually, simi-larly to aerial photograph interpretation. The main advan-tage of this approach is that the interpreter can use hisknowledge of the coastal area to decipher complexities in theurban landscape that would be impossible for a computer tointerpret. The human brain is able to combine and simulta-neously interpret various image characteristics, includingtone, texture, shape, size, shadow height, and spatial rela-tionships. With the use of stereoscopes, the interpreter canalso observe vertical as well as horizontal spatial relation-ships of the features in the image.
Nowadays, computer-aided analysis is used primarily forimage classification. A typical digital image analysis ap-proach for classifying coastal wetlands or land cover is shownin Figure 2. Before analysis, the multispectral imagery mustbe radiometrically and geometrically corrected. The radio-metric correction reduces the influence of haze and other at-mospheric scattering particles and any sensor anomalies. Thegeometric correction compensates for the Earth’s rotation andfor variations in the position and attitude of the satellite.Image segmentation simplifies the analysis by first dividingthe image into ecologically or functionally distinct areas.
Then training sites are identified for supervised classificationand interpreted via field visits or other reference data, suchas aerial photographs. Next, an unsupervised classification isperformed to identify variations in the image not containedin the training sites. Training site spectral clusters and un-supervised spectral classes are then analyzed by cluster anal-ysis to develop an optimum set of spectral signatures. Finalimage classification is then performed to match the classifiedthemes with the project requirements (Jensen, 1996; Klemas,2005; Lachowski et al., 1995; Lillesand and Kiefer, 1994).
Land Cover Change Detection
Digital change detection of land cover by the use of satelliteimagery can be performed by employing one of several tech-niques, including postclassification comparison and temporalimage differencing between two images in a time series (Jen-sen, 1996; Lunetta and Elvidge, 1998). Postclassificationcomparison change detection requires rectification and clas-sification of the remotely sensed images from both dates.These two maps are then compared on a pixel-by-pixel basis.One disadvantage is that every error in the individual dateclassification map will also be present in the final changedetection map.
Temporal image differencing minimizes this problem byperforming the traditional classification of only one of the twotime-separated images. One band from both dates of imageryis then analyzed to find differences. Pixel difference valuesexceeding a selected threshold are considered as changed. Achange/no change binary mask is overlaid onto the seconddate image and only the pixels classified as having changedare classified in the second date imagery. This method usu-ally reduces change detection errors and provides detailedfrom–to change class information (Jensen, 1996). As shownin Figure 3, change analysis results can be further improvedby including probability filtering, allowing only certainchanges and forbidding others (e.g., urban to forest). In digitalchange detection, it is very important that the images in thetime series be corrected for variations in atmospheric, tidal,
1269Remote Sensing of Coastal Storm Impacts
Journal of Coastal Research, Vol. 25, No. 6, 2009
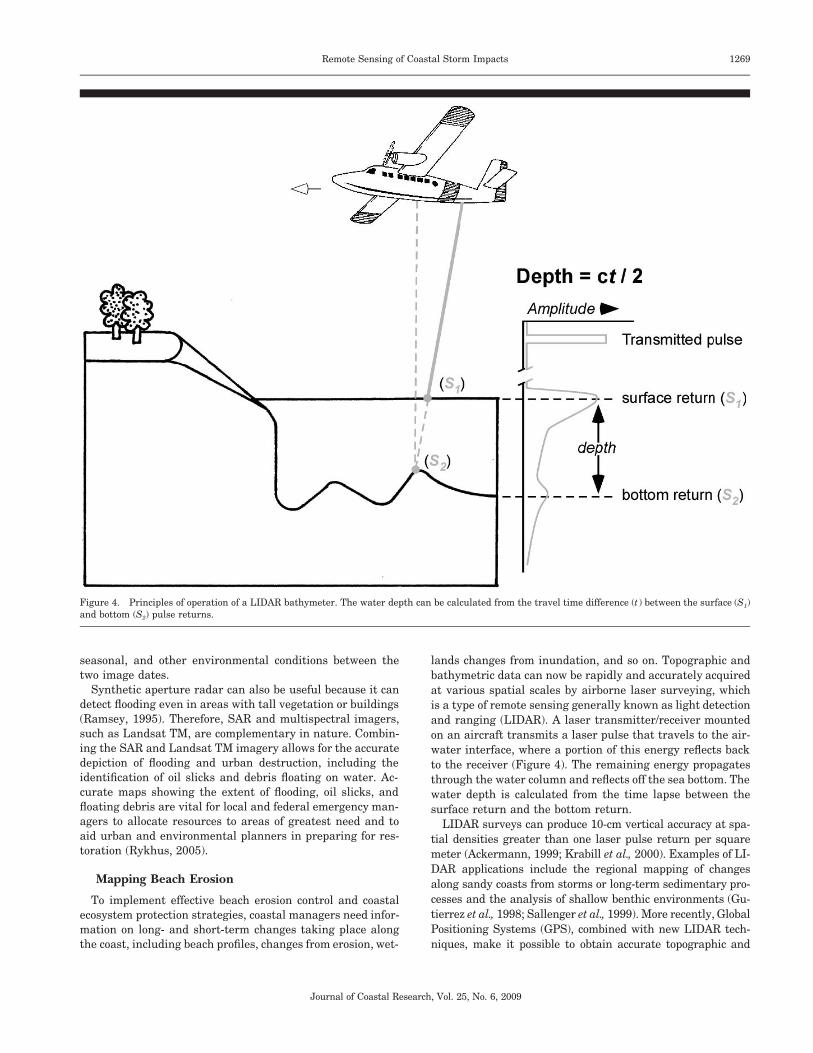
Figure 4. Principles of operation of a LIDAR bathymeter. The water depth can be calculated from the travel time difference (t ) between the surface (S1)and bottom (S2) pulse returns.
seasonal, and other environmental conditions between thetwo image dates.
Synthetic aperture radar can also be useful because it candetect flooding even in areas with tall vegetation or buildings(Ramsey, 1995). Therefore, SAR and multispectral imagers,such as Landsat TM, are complementary in nature. Combin-ing the SAR and Landsat TM imagery allows for the accuratedepiction of flooding and urban destruction, including theidentification of oil slicks and debris floating on water. Ac-curate maps showing the extent of flooding, oil slicks, andfloating debris are vital for local and federal emergency man-agers to allocate resources to areas of greatest need and toaid urban and environmental planners in preparing for res-toration (Rykhus, 2005).
Mapping Beach Erosion
To implement effective beach erosion control and coastalecosystem protection strategies, coastal managers need infor-mation on long- and short-term changes taking place alongthe coast, including beach profiles, changes from erosion, wet-
lands changes from inundation, and so on. Topographic andbathymetric data can now be rapidly and accurately acquiredat various spatial scales by airborne laser surveying, whichis a type of remote sensing generally known as light detectionand ranging (LIDAR). A laser transmitter/receiver mountedon an aircraft transmits a laser pulse that travels to the air-water interface, where a portion of this energy reflects backto the receiver (Figure 4). The remaining energy propagatesthrough the water column and reflects off the sea bottom. Thewater depth is calculated from the time lapse between thesurface return and the bottom return.
LIDAR surveys can produce 10-cm vertical accuracy at spa-tial densities greater than one laser pulse return per squaremeter (Ackermann, 1999; Krabill et al., 2000). Examples of LI-DAR applications include the regional mapping of changesalong sandy coasts from storms or long-term sedimentary pro-cesses and the analysis of shallow benthic environments (Gu-tierrez et al., 1998; Sallenger et al., 1999). More recently, GlobalPositioning Systems (GPS), combined with new LIDAR tech-niques, make it possible to obtain accurate topographic and
1270 Klemas
Journal of Coastal Research, Vol. 25, No. 6, 2009
Table 4. Typical LIDAR flight parameters.
Parameter Value
Flying height 200–500 mSpatial resolution 2–4 mVertical accuracy �30 cmMaximum map depth 50 m (clear water)Typical kd 4Coastal k 0.2–0.8 (d � 5–20 m)Estuarine k 1.0–4.0 (d � 1–4 m)Sounding density 3–15 mSun angle 18�–25� (minimize glare)Scan geometry CircularSea state Low (0–1 Beaufort scale)Water penetration Green LIDAR (532 nm)Aircraft height Infrared LIDAR (1064 nm)Positional accuracy Differential GPS (0.5–2 m)
bathymetric maps, including shoreline positions (Brock andSallenger, 2000; Irish and Lillycrop, 1999; Krabill et al., 2000;Stockdon et al., 2002). A particularly effective approach forstudying sand dynamics along coastlines includes the com-bined use of airborne hyperspectral data and airborne LIDARdata (Brock et al., 2001; Deronde et al., 2006).
Typical flight parameters for airborne LIDAR are shown inTable 4. Optical water clarity is the most limiting factor forLIDAR depth detection. Therefore, it is important to conductLIDAR overflights during tidal and current conditions thatminimize water turbidity from sediment resuspension andriver inflow. The LIDAR system must have a kd factor largeenough to accommodate the water depth and water turbidityat the study site (k � attenuation coefficient; d � waterdepth). For instance, if a given LIDAR system has a kd � 4and the turbid water has an attenuation coefficient of k � 1,the system will not be effective beyond depths of approxi-mately 4 m. Beyond that depth, one may have to use acousticecho-sounding techniques or side-scanning sonar systems.
Mapping hurricane damage sustained by submergedaquatic vegetation (SAV) and coral reefs requires high-reso-lution (1–4 m) imagery (Mumby and Edwards, 2002; Purkis,2005). Coral reef ecosystems usually exist in clear water andcan be classified to show different forms of coral reef, deadcoral, coral rubble, algal cover, and sand lagoons and differ-ent densities of seagrasses, for example. SAV may grow inmore turbid waters; thus, it is more difficult to map. High-resolution (e.g., IKONOS) multispectral imagers have beenused in the past to map eelgrass and coral reefs. Hyperspec-tral imagers should improve the results significantly by beingable to identify more estuarine and intertidal habitat classes(Garono et al., 2004; Maeder et al., 2002; Mishra et al., 2006).
CASE STUDY: HURRICANE KATRINA’S EFFECTON NEW ORLEANS
On the morning of August 29, 2005, Hurricane Katrinamade landfall near the Louisiana/Mississippi border as astrong Category 3 hurricane. Because the storm had reachedCategory 5 at sea, it brought with it the storm surge of amuch stronger hurricane. With wind speeds of about 205km/h, a storm surge of 7.4 m, and heavy rains, Katrina dev-astated coastal areas in the region. It caused major flooding
and destruction along the Central Gulf states of the UnitedStates, including such cities as New Orleans, Louisiana; Mo-bile, Alabama; and Gulfport, Mississippi. The storm surge,high winds, and resulting high water on Lake Pontchartrainbreached the levees protecting New Orleans, a city locatedbelow sea level, and flooded about 80% of the city and neigh-boring parishes. Katrina also caused major damage to theregion’s oil and natural gas production and refining facilities.As a result, Katrina became the costliest hurricane to makelandfall in the United States (Hayes, 2005; Rykhus, 2005).
Remote sensing played a major role in tracking the stormand the devastation it left behind in urban New Orleans andsurrounding areas, including highways, beaches, and wet-lands. Remotely sensed data were provided by many federal,state, and local agencies and commercial firms from satel-lites, aircraft, and helicopters. In this section, I review theeffect of Hurricane Katrina on New Orleans in 2005 and showhow remotely sensed data was used to track the hurricane,predict its future behavior, and survey the destruction itcaused (Stone and Muller, 2005).
Tracking Katrina before Landfall
Katrina originated as a tropical depression near the Ba-hamas on August 23, 2005, strengthened to a hurricane, andproceeded to make landfall on the southern tip of Florida.Passing across Florida, Katrina weakened to a tropical storm.However, the warm waters of the Gulf of Mexico allowed itto rapidly intensify to a Category 5 hurricane, with maximumsustained winds of 280 km/h and gusts of 346 km/h, gener-ating 16.7-m waves. Subsequently, Katrina made landfall asa Category 3 hurricane near Buras, Louisiana, and once morenear the Mississippi/Louisiana border with sustained windsof about 205 km/h.
At landfall, hurricane-force winds extended 190 km fromthe center (NOAA, 2005). During its entire passage acrossthe Atlantic and the Gulf of Mexico, Katrina was tracked bythe GOES-12 geostationary satellite, NOAA polar orbiterswith AVHRR sensors, other satellites, and many aircraftflights by NOAA and U.S. Air Force pilots. For instance,NOAA WP-3D Hurricane Hunter aircraft obtained airborneDoppler radar–derived wind speed cross sections as Katrinacrossed the Gulf and made landfall on the Louisiana coast onAugust 29, 2005. Other data gathered included the locationof the hurricane, its size, its speed and direction of movement,the size of the eye, the wind velocity, and the minimum cen-tral pressure.
The NWS National Hurricane Center was able to feed thesatellite data into several different numerical computer andstatistical models to attempt to forecast the path, speed, andstrength of the hurricane. The Center also used computerstorm surge models, such as the SLOSH model, to provideguidance on storm surge height and the extent of predictedflooding. Days before Katrina made landfall, NOAA’s stormsurge model predicted that Katrina’s surge could reach 5.5 to6.7 m above normal tide levels, and in some locations, as highas 8.5 m. The model predictions were sent in near–real timeto various disaster management agencies at the local, state,and federal levels. Emergency managers used the data from
1271Remote Sensing of Coastal Storm Impacts
Journal of Coastal Research, Vol. 25, No. 6, 2009
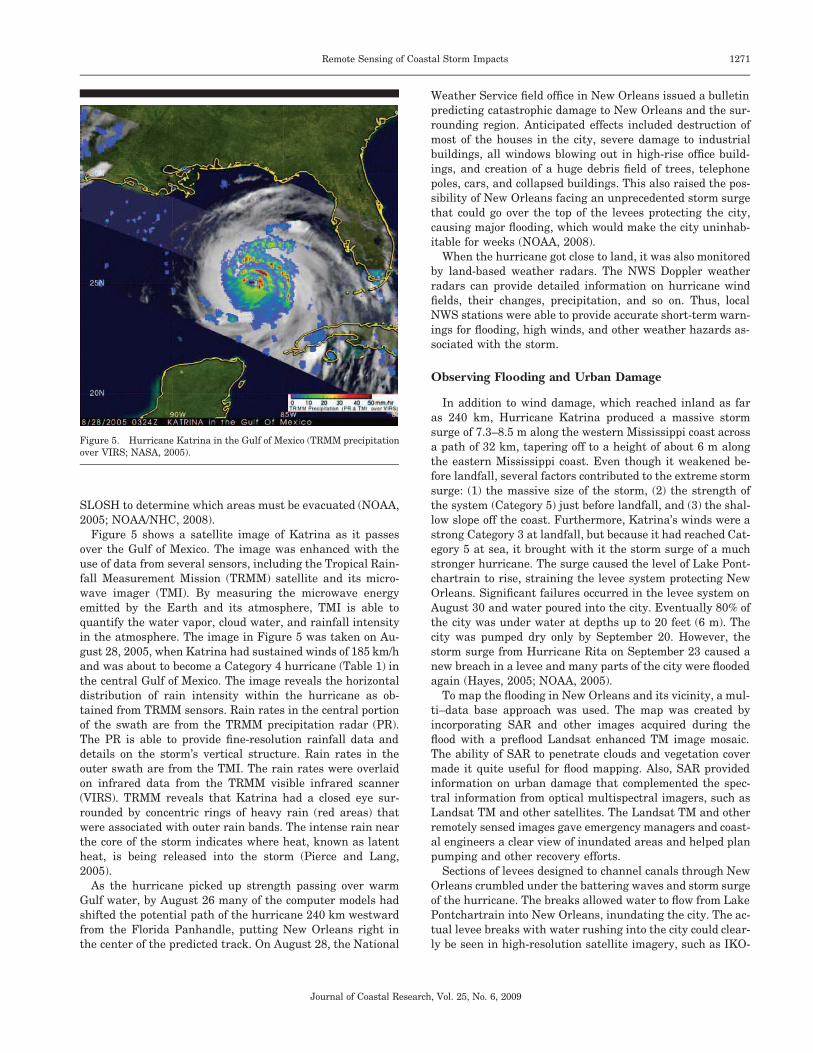
Figure 5. Hurricane Katrina in the Gulf of Mexico (TRMM precipitationover VIRS; NASA, 2005).
SLOSH to determine which areas must be evacuated (NOAA,2005; NOAA/NHC, 2008).
Figure 5 shows a satellite image of Katrina as it passesover the Gulf of Mexico. The image was enhanced with theuse of data from several sensors, including the Tropical Rain-fall Measurement Mission (TRMM) satellite and its micro-wave imager (TMI). By measuring the microwave energyemitted by the Earth and its atmosphere, TMI is able toquantify the water vapor, cloud water, and rainfall intensityin the atmosphere. The image in Figure 5 was taken on Au-gust 28, 2005, when Katrina had sustained winds of 185 km/hand was about to become a Category 4 hurricane (Table 1) inthe central Gulf of Mexico. The image reveals the horizontaldistribution of rain intensity within the hurricane as ob-tained from TRMM sensors. Rain rates in the central portionof the swath are from the TRMM precipitation radar (PR).The PR is able to provide fine-resolution rainfall data anddetails on the storm’s vertical structure. Rain rates in theouter swath are from the TMI. The rain rates were overlaidon infrared data from the TRMM visible infrared scanner(VIRS). TRMM reveals that Katrina had a closed eye sur-rounded by concentric rings of heavy rain (red areas) thatwere associated with outer rain bands. The intense rain nearthe core of the storm indicates where heat, known as latentheat, is being released into the storm (Pierce and Lang,2005).
As the hurricane picked up strength passing over warmGulf water, by August 26 many of the computer models hadshifted the potential path of the hurricane 240 km westwardfrom the Florida Panhandle, putting New Orleans right inthe center of the predicted track. On August 28, the National
Weather Service field office in New Orleans issued a bulletinpredicting catastrophic damage to New Orleans and the sur-rounding region. Anticipated effects included destruction ofmost of the houses in the city, severe damage to industrialbuildings, all windows blowing out in high-rise office build-ings, and creation of a huge debris field of trees, telephonepoles, cars, and collapsed buildings. This also raised the pos-sibility of New Orleans facing an unprecedented storm surgethat could go over the top of the levees protecting the city,causing major flooding, which would make the city uninhab-itable for weeks (NOAA, 2008).
When the hurricane got close to land, it was also monitoredby land-based weather radars. The NWS Doppler weatherradars can provide detailed information on hurricane windfields, their changes, precipitation, and so on. Thus, localNWS stations were able to provide accurate short-term warn-ings for flooding, high winds, and other weather hazards as-sociated with the storm.
Observing Flooding and Urban Damage
In addition to wind damage, which reached inland as faras 240 km, Hurricane Katrina produced a massive stormsurge of 7.3–8.5 m along the western Mississippi coast acrossa path of 32 km, tapering off to a height of about 6 m alongthe eastern Mississippi coast. Even though it weakened be-fore landfall, several factors contributed to the extreme stormsurge: (1) the massive size of the storm, (2) the strength ofthe system (Category 5) just before landfall, and (3) the shal-low slope off the coast. Furthermore, Katrina’s winds were astrong Category 3 at landfall, but because it had reached Cat-egory 5 at sea, it brought with it the storm surge of a muchstronger hurricane. The surge caused the level of Lake Pont-chartrain to rise, straining the levee system protecting NewOrleans. Significant failures occurred in the levee system onAugust 30 and water poured into the city. Eventually 80% ofthe city was under water at depths up to 20 feet (6 m). Thecity was pumped dry only by September 20. However, thestorm surge from Hurricane Rita on September 23 caused anew breach in a levee and many parts of the city were floodedagain (Hayes, 2005; NOAA, 2005).
To map the flooding in New Orleans and its vicinity, a mul-ti–data base approach was used. The map was created byincorporating SAR and other images acquired during theflood with a preflood Landsat enhanced TM image mosaic.The ability of SAR to penetrate clouds and vegetation covermade it quite useful for flood mapping. Also, SAR providedinformation on urban damage that complemented the spec-tral information from optical multispectral imagers, such asLandsat TM and other satellites. The Landsat TM and otherremotely sensed images gave emergency managers and coast-al engineers a clear view of inundated areas and helped planpumping and other recovery efforts.
Sections of levees designed to channel canals through NewOrleans crumbled under the battering waves and storm surgeof the hurricane. The breaks allowed water to flow from LakePontchartrain into New Orleans, inundating the city. The ac-tual levee breaks with water rushing into the city could clear-ly be seen in high-resolution satellite imagery, such as IKO-
1272 Klemas
Journal of Coastal Research, Vol. 25, No. 6, 2009
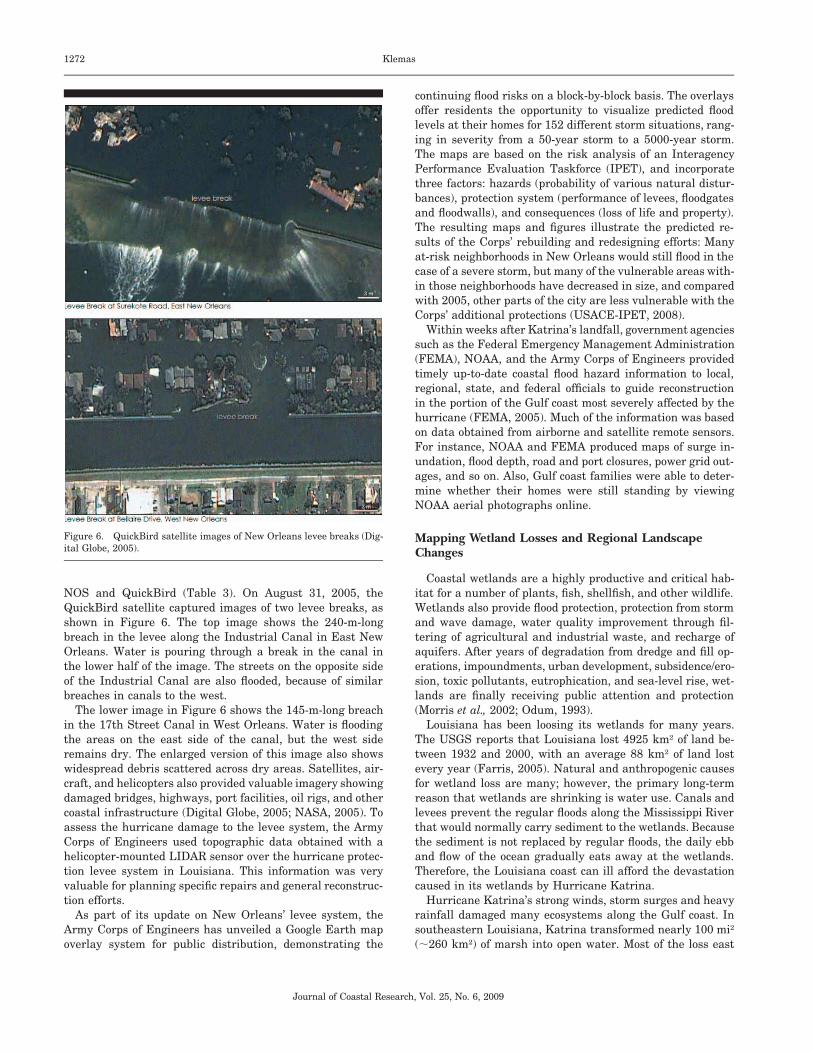
Figure 6. QuickBird satellite images of New Orleans levee breaks (Dig-ital Globe, 2005).
NOS and QuickBird (Table 3). On August 31, 2005, theQuickBird satellite captured images of two levee breaks, asshown in Figure 6. The top image shows the 240-m-longbreach in the levee along the Industrial Canal in East NewOrleans. Water is pouring through a break in the canal inthe lower half of the image. The streets on the opposite sideof the Industrial Canal are also flooded, because of similarbreaches in canals to the west.
The lower image in Figure 6 shows the 145-m-long breachin the 17th Street Canal in West Orleans. Water is floodingthe areas on the east side of the canal, but the west sideremains dry. The enlarged version of this image also showswidespread debris scattered across dry areas. Satellites, air-craft, and helicopters also provided valuable imagery showingdamaged bridges, highways, port facilities, oil rigs, and othercoastal infrastructure (Digital Globe, 2005; NASA, 2005). Toassess the hurricane damage to the levee system, the ArmyCorps of Engineers used topographic data obtained with ahelicopter-mounted LIDAR sensor over the hurricane protec-tion levee system in Louisiana. This information was veryvaluable for planning specific repairs and general reconstruc-tion efforts.
As part of its update on New Orleans’ levee system, theArmy Corps of Engineers has unveiled a Google Earth mapoverlay system for public distribution, demonstrating the
continuing flood risks on a block-by-block basis. The overlaysoffer residents the opportunity to visualize predicted floodlevels at their homes for 152 different storm situations, rang-ing in severity from a 50-year storm to a 5000-year storm.The maps are based on the risk analysis of an InteragencyPerformance Evaluation Taskforce (IPET), and incorporatethree factors: hazards (probability of various natural distur-bances), protection system (performance of levees, floodgatesand floodwalls), and consequences (loss of life and property).The resulting maps and figures illustrate the predicted re-sults of the Corps’ rebuilding and redesigning efforts: Manyat-risk neighborhoods in New Orleans would still flood in thecase of a severe storm, but many of the vulnerable areas with-in those neighborhoods have decreased in size, and comparedwith 2005, other parts of the city are less vulnerable with theCorps’ additional protections (USACE-IPET, 2008).
Within weeks after Katrina’s landfall, government agenciessuch as the Federal Emergency Management Administration(FEMA), NOAA, and the Army Corps of Engineers providedtimely up-to-date coastal flood hazard information to local,regional, state, and federal officials to guide reconstructionin the portion of the Gulf coast most severely affected by thehurricane (FEMA, 2005). Much of the information was basedon data obtained from airborne and satellite remote sensors.For instance, NOAA and FEMA produced maps of surge in-undation, flood depth, road and port closures, power grid out-ages, and so on. Also, Gulf coast families were able to deter-mine whether their homes were still standing by viewingNOAA aerial photographs online.
Mapping Wetland Losses and Regional LandscapeChanges
Coastal wetlands are a highly productive and critical hab-itat for a number of plants, fish, shellfish, and other wildlife.Wetlands also provide flood protection, protection from stormand wave damage, water quality improvement through fil-tering of agricultural and industrial waste, and recharge ofaquifers. After years of degradation from dredge and fill op-erations, impoundments, urban development, subsidence/ero-sion, toxic pollutants, eutrophication, and sea-level rise, wet-lands are finally receiving public attention and protection(Morris et al., 2002; Odum, 1993).
Louisiana has been loosing its wetlands for many years.The USGS reports that Louisiana lost 4925 km2 of land be-tween 1932 and 2000, with an average 88 km2 of land lostevery year (Farris, 2005). Natural and anthropogenic causesfor wetland loss are many; however, the primary long-termreason that wetlands are shrinking is water use. Canals andlevees prevent the regular floods along the Mississippi Riverthat would normally carry sediment to the wetlands. Becausethe sediment is not replaced by regular floods, the daily ebband flow of the ocean gradually eats away at the wetlands.Therefore, the Louisiana coast can ill afford the devastationcaused in its wetlands by Hurricane Katrina.
Hurricane Katrina’s strong winds, storm surges and heavyrainfall damaged many ecosystems along the Gulf coast. Insoutheastern Louisiana, Katrina transformed nearly 100 mi2
(�260 km2) of marsh into open water. Most of the loss east
1273Remote Sensing of Coastal Storm Impacts
Journal of Coastal Research, Vol. 25, No. 6, 2009
of the Mississippi River was attributed to the effects of Ka-trina’s storm surge. Vegetation was ripped out and sandwashed in, scouring and damaging mangrove roots and harm-ing the animals that live there. Large influxes of eroded sed-iment reduced habitat for coastal birds, mammals, and in-vertebrate species. Barrier islands were submerged and erod-ed. Entire seagrass beds, which are critical to fish, sea tur-tles, and marine mammals, were uprooted and destroyedduring the storm. Coral reef beds were scoured, torn, andflattened, causing population reductions in animals such assea urchins, snails, and fish. Katrina inundated marshes andswamps with saltwater and polluted runoff from urban areasand oil refineries, affecting amphibians and reptiles becauseof their sensitivity to toxins and other pollutants. Large areasof wetlands were lost, some of them permanently (Barras,2006; Provencher, 2007). The resulting wetland losses causedby Katrina were mapped by NASA, NOAA, and USGS sci-entists over large areas using medium-resolution satellite im-agery and GIS. Time series of Landsat TM, MODIS (moder-ate-resolution imaging spectroradiometer), and other imag-ery were used not only to observe the immediate damage towetlands, but also to monitor their recovery.
The satellite images demonstrated how coastal wetlandsfunction to protect inland regions and coastal communitiesfrom storm surges unleashed by powerful hurricanes. Thewetlands act as a sponge, soaking up water and diminishingthe storm surge. If the wetlands had not been there, thestorm surge could have penetrated much farther inland. Bycontrast, no wetlands existed to buffer New Orleans fromLake Pontchartrain; therefore, the storm forced lake waterto burst through the levees that separated it from the city(NASA, 2005).
SUMMARY AND CONCLUSIONS
Storms and their effects on coastal communities can bemonitored and mapped with the use of a wide range of remotesensors on satellites and aircraft. Hurricanes can be trackedat frequent intervals by aircraft and satellites equipped withthermal infrared, visible, and microwave sensors. As thestorm approaches land, satellite and land-based weather ra-dars can measure hurricane winds, ocean currents, waves,precipitation, and other key parameters. Flooding from thestorm surge can be monitored with high-resolution (1–4 m)multispectral imagers and radar on aircraft and satellites.The high-resolution images clearly show detailed damage,such as levee breaches in New Orleans caused by HurricaneKatrina. Wetland losses and changes in the surroundinglandscape are best mapped with medium-resolution (10–30m) systems, such as Landsat TM or SPOT. Airborne LIDARsystems can provide accurate data on coastline changes re-sulting from beach erosion, including bathymetry and topog-raphy. New satellites with advanced sensors are beinglaunched that will provide high–spatial resolution and hy-perspectral imaging capabilities. Also, new image classifica-tion algorithms and improved hydrologic models are beingdeveloped. These new remote sensors and models will furtherimprove our ability to track and predict storms and their im-pact on coastal communities.
During Hurricane Katrina, many types of remotely senseddata were provided by NOAA, NASA, and other agencies be-fore, during, and after landfall to hurricane modelers, whoissued warnings to emergency managers at the local, state,and federal levels. The path, strength, and speed of the hur-ricane were predicted quite accurately by the NOAA/NWSNational Hurricane Center with the use of data from geosta-tionary (GOES) and polar orbit (NOAA/AVHRR) satellitesand airborne trackers. Despite the timely environmental dataand urgent warnings, neither the officials nor the public re-acted fast enough in a coordinated manner to prevent majorloss of lives. Numerous studies had warned of this cata-strophic scenario, and as it developed, many scientistswatched with frustration. For weeks after landfall, boats andhelicopters were used to rescue people and survey the dam-age, using remotely sensed images of flooding to guide therescue operations. Thousands of employees from NOAA,NASA, the U.S. Coast Guard, and various other agencieswere involved with Hurricane Katrina, performing urgenttasks such as forecasting the storm, rescuing victims, sur-veying and clearing waterways and roads, responding to oiland chemical spills, and testing fisheries (NOAA, 2005, 2006,2008).
Katrina damaged 272 km of the 564-km hurricane protec-tion system that surrounds New Orleans and was blamed formore than 1570 deaths in Louisiana alone. The actual dam-age from the winds and storm surge and the resulting flood-ing was assessed from maps and observations provided bydigital imagers and film cameras on aircraft, helicopters, andsatellites. Several teams, including one from the Universityof Mississippi, used GIS with a beta version of Google Earthpreloaded on laptops to survey and map the destruction andflooding. Also, because the storm destroyed many of thestructures, landmarks, and signs along the Mississippi coast,the only reliable method of navigation was to use GPS(NOAA, 2008; USACE-IPET, 2008).
Google Earth delivered a vivid three-dimensional model ofthe city and its surroundings, providing a high-performancevisualization interface that runs on standard PCs and com-modity servers (Yarbrough and Easson, 2005). The technol-ogy’s ability to provide spatial information made it indis-pensable during the emergency response and recovery fromHurricane Katrina. In 2005, the Army Corps of Engineersunveiled a Google Earth map overlay for public distribution,demonstrating continuing flood risks on a block-by-block ba-sis, giving inhabitants the opportunity to visualize predictedflood levels at their homes for various storm conditions (USA-CE-IPET, 2008).
According to the External Review Panel of the AmericanSociety of Civil Engineers (ASCE), the repair work that hastaken place since Katrina struck has improved and strength-ened the hurricane protection system and has reduced therisk relative to pre-Katrina conditions. However, the risk tohuman life, property, and quality of life is still quite high.Flooding could still cause massive devastation to property,communities, the economy, and people. In the panel’s opin-ion, a 1-in-10 chance every 50 years of catastrophic floodingof the city and loss of property, life, and lifestyle is unac-ceptable as a design basis for an engineering system (ASCE-
1274 Klemas
Journal of Coastal Research, Vol. 25, No. 6, 2009
ERP, 2008). Nonetheless, the lessons learned from HurricaneKatrina’s impact on New Orleans will further improve ourability to remotely track coastal storms and document theireffects on coastal communities. The analysis of Katrina’s im-pact will help refine storm surge and wave prediction modelsas an effective tool for engineering design of coastal infra-structure, such as levees, and facilitate hurricane emergencymanagement. The data will also help improve vulnerabilityanalyses for evaluating flood risk, potential response costs,and wetland losses for different sea level rise scenarios andstorm conditions.
LITERATURE CITED
Ackermann, F., 1999. Airborne laser scanning—present status andfuture expectations. ISPRS Journal of Photogrammetry and Re-mote Sensing, 54, 64–67.
Al-Tahir, A.; Baban, S.M.J., and Ramlal, B., 2006. Utilizing emerg-ing geo-imaging technologies for the management of tropical coast-al environments. West Indian Journal of Engineering, 29(1), 11–22.
Anderson, J.R.; Hardy, E.E.; Roach, J.T., and Witmer, R.E., 1976. ALand Use and Land Cover Classification System for Use with Re-mote Sensor Data. Washington, DC: U.S. Geological Survey Pro-fessional Paper 964, 28p.
ASCE-ERP (American Society of Civil Engineers, External ReviewPanel), 2008. Preliminary Review Comments on IPET Draft Vol-ume VIII: Engineering and Operational Risk and Reliability Anal-ysis. Reston, VA: ASCE-ERP. April 15, 2008.
Barras, J., 2006. Land Area Change in Coastal Louisiana after the2005 Hurricanes—A Series of Three Maps. U.S. Geological SurveyOpen-File Report 06–1274, 12p.
Blood, E.R.; Anderson, P.; Smith, P.A.; Nybro, C., and Ginsberg,K.A., 1991. Effects of Hurricane Hugo on coastal soil solutionchemistry in South Carolina. Biotropica, 23, 348–355.
Brock, J. and Sallenger, A., 2000. Airborne Topographic Mapping forCoastal Science and Resource Management. CITY, STATE: U.S.Geological Survey Open-File Report 01-46, 4p.
Brock, J.C.; Sallenger, A.H.; Krabill, W.B.; Swift, R.N., and Wright,C.W., 2001. Recognition of fiducial surfaces in lidar surveys ofcoastal topography. Photogrammetric Engineering and RemoteSensing, 67(11), 1245–1258.
Campbell, J.B., 2007. Introduction to Remote Sensing, 4th edition.New York: The Guilford Press.
Chen, Q.; Wang, L.; Zhao, H., and Douglass, S.L., 2007. Predictionof storm surges and wind waves on coastal highways in hurricane-prone areas. Journal of Coastal Research, 23, 1304–1317.
Cracknell, A.P. and Hayes, L., 2007. Introduction to Remote Sensing.New York: CRC Press.
Deronde, B.; Houthuys, R..; Debruyn, W.; Fransaer, D.; Lancker,V.V., and Hernriet, J.P., 2006. Use of airborne hyperspectral dataand laserscan data to study beach morphodynamics along the Bel-gian Coast. Journal of Coastal Research, 22, 1108–1117.
Digital Globe, 2009. QuickBird. http://www.digitalglobe.com/index.php/85/QuickBird (accessed March 13, 2009).
Farris, G.S., 2005. USGS Reports New Wetland Loss from HurricaneKatrina in Southeastern Louisiana. http://www.usgs.gov/newsroom/article.
FEMA (Federal Emergency Management Agency), 2005. HurricaneKatrina Flood Recovery Maps. http:/www.fema.gov/hazard/flood/recoverydata/katrina/index.shtm (accessed March 16, 2009).
Garono, R.J.; Simenstad, C.A.; Robinson, R., and Ripley, H., 2004.Using high spatial resolution hyperspectral imagery to map inter-tidal habitat structure in Hood Canal Washington USA. CanadianJournal of Remote Sensing, 30, 54–63.
Greening, H.; Doering, P., and Corbett, C., 2006. Hurricane impactson coastal ecosystems. Estuaries and Coasts, 29, 877–879.
Gregg, M., 2007. NOAA’s Climate Goal. U.S. Department of Com-merce. NOAA Earth System Monitor, 16, 3–4.
Guttierez, R.; Gibeaut, J.C.; Crawford, M.M.; Mahoney, M.P.; Smith,S.; Gutelius, W.; Carswell, D., and MacPherson, E., 1998. Airbornelaser swath mapping of Galveston Island and Bolivar Peninsula,Texas. In: Proceedings of the Fifth International Conference on Re-mote Sensing for Marine and Coastal Environments (San Diego,California, Veridian, Inc.) 1, pp. 236–243.
Hayes, B., 2005. Natural and unnatural disasters. American Scien-tist, 93, 496–499.
Ikeda, M. and Dobson, F.W., 1995. Oceanographic Applications ofRemote Sensing. New York: CRC Press.
Intergovernmental Panel on Climate Changes, 2007. ClimateChange 2007: The Physical Science Basis. WMO/UNEP, Paris.http://www.ipcc.ch (accessed January 6, 2009).
Irish, J.L. and Lillycrop, W.J., 1999. Scanning laser mapping of thecoastal zone: the SHOALS system. ISPRS Journal of Photogram-metry and Remote Sensing, 54(1999), 123–129.
Island Press, 2000. The Hidden Costs of Coastal Hazards: Implica-tions for Risk Assessment and Mitigation. Washington, DC: IslandPress.
Jensen, J.R., 1996. Introductory Digital Image Processing: A RemoteSensing Perspective, 2nd edition. New Jersey: Prentice-Hall.
Jensen, J.R., 2007. Remote Sensing of the Environment: An EarthResource Perspective. New Jersey: Prentice-Hall.
Kantha, L., 2006. Time to replace the Saffir-Simpson HurricaneScale? EOS, Transactions, American Geophysical Union, 87, 1–6.
Klemas, V., 2005. Remote sensing: wetlands classification. In:Schwartz, M.L. (ed.), Encyclopedia of Coastal Science. Dordrecht,The Netherlands: Springer, pp. 804–807.
Krabill, W.B.; Wright, C.W.; Swift, R.N.; Frederick, E.B.; Manizade,S.S.; Yungel, J.K.; Martin, C.F.; Sonntag, J.G.; Duffy, M.; Huls-lander, W., and Brock, J.C., 2000. Airborne laser mapping of As-sateague National Seashore beach. Photogrammetric Engineeringand Remote Sensing, 66(1), 65–71.
Lachowski, H.; Maus, P.; Golden, M.; Johnson, J.; Landrum, V.; Pow-ell, J.; Varner, V.; Wirth, T.; Gonzales, J., and Bain, S., 1995.Guidelines for the Use of Digital Imagery for Vegetation Mapping.Washington, DC: U.S. Department of Agriculture, Forest Service.
Lillesand, T.M. and Kiefer, R.W., 1994. Remote Sensing and ImageInterpretation, 3rd edition. New York: John Wiley & Sons.
Lunetta, R.S. and Elvidge, C.D., 1998. Remote Sensing Change De-tection: Environmental Monitoring Methods and Applications. AnnArbor, Michigan: Ann Arbor Press.
Lyon, J.G. and McCarthy, J., 1995. Wetland and Environmental Ap-plications of GIS. Boca Raton, Florida: Lewis Publishers.
Maeder, J.; Narumalani, S.; Rundquist, D.; Perk, R.; Schalles, J.;Hutchins, K., and Keck, J., 2002. Classifying and mapping generalcoral-reef structure using Ikonos data. Photogrammetric Engineer-ing and Remote Sensing, 68, 1297–1305.
Mallin, M.A. and Corbett, C.A., 2006. How hurricane attributes de-termine the extent of environmental effects: multiple hurricanesand different coastal systems. Estuaries and Coasts, 29, 1046–1061.
Martin, S., 2004. An Introduction to Remote Sensing. Cambridge,UK: Cambridge University Press.
Mather, J.R.; Adams, H., and Yoshiola, G.A., 1964. Coastal stormsof the eastern United States. Journal of Applied Meteorology, 3,693–706.
Mather, J.R.; Field, R.T., and Yoshioka, G.A., 1967. Storm damagehazard along the East Coast of the United States. Journal of Ap-plied Meteorology 6, 20–30.
Mishra, D.; Narumalani, S.; Rundquist, D., and Lawson, M., 2006.Benthic habitat mapping in tropical marine environments usingQuickBird multispectral data. Photogrammetric Engineering andRemote Sensing, 72, 1037–1048.
Morris, J.T.; Sundareshwar, P.V.; Nietch, C.T.; Kjerfve, B., and Ca-hoon, D.R., 2002. Responses of coastal wetlands to rising sea level.Ecology, 83, 2869–2877.
Mumby, P.J. and Edwards, A.J., 2002. Mapping marine environ-ments with IKONOS imagery: enhanced spatial resolution can de-liver greater thematic accuracy. Remote Sensing of the Environ-ment, 82, 248–257.
NASA, 2005. EO Natural Hazards: Hurricane Katrina Floods the
1275Remote Sensing of Coastal Storm Impacts
Journal of Coastal Research, Vol. 25, No. 6, 2009
Southeastern United States. http://earthobservatory.nasa.gov/Natural�Hazards/natural�hazards�v2 (accessed May 2, 2008).
NOAA (National Oceanic and Atmospheric Administration), 1999.Trends in U.S. Coastal Regions, 1970–1998. In: Addendum to theProceedings: Trends, and Future Challenges for U.S. NationalOcean and Coastal Policy. (Washington, DC, NOAA), August 1999.
NOAA, 2005. Hurricane Katrina: A Climatological Perspective.Asheville, North Carolina: NOAA National Climatic Data CenterTechnical Report 2005-01, pp. 1–20.
NOAA, 2006. Hurricanes: Unleashing Nature’s Fury. A Prepared-ness Guide. Washington, DC: U.S. Department of Commerce,NOAA, National Weather Service, pp. 1–24.
NOAA, 2008. Hurricane Katrina. http://www.katrina.noaa.gov/ (ac-cessed November 10, 2008).
NOAA/CSC (Coastal Services Center), 2008. Hurricane Planning withSatellite Imagery. http://www.csc.noaa.gov/products/sccoasts/html/hazards/htm (accessed November 19, 2008).
NOAA/NHC (National Hurricane Center), 2008. Hurricane Pre-paredness: SLOSH Model. http://www.nhc.noaa.gov/HAW2/surge/slosh.shtml (accessed November 22, 2008).
Odum, E.P., 1993. Ecology and Our Endangered Life-Support Sys-tems, 2nd edition. Sunderland, Massachusetts: Sinauer Associ-ates, Inc.
O’Neil, R.A.; Buja-Bijunas, L., and Rayner, D.M., 1980. Field perfor-mance of a laser fluorosensor for the detection of oil spills. AppliedOptics, 19, 863–870.
Orbital Imaging Corp., 2009. OrbView-3. http://www.orbital.com/NewsInfo/Publications/OV3�Fact.pdf (accessed March 13, 2009).
Parkinson, C.L., 2003. Aqua: an Earth-observing satellite mission toexamine water and other climate variables. IEEE Transactions onGeoscience and Remote Sensing, 41(2), 173–183.
Pierce, H. and Lang, S., 2005. TRMM—Tropical Rainfall Mea-surement Mission: Katrina Intensifies into a Powerful Hurri-cane, Strikes Northern Gulf Coast. http://trmm.gsfc.nasa.gov/publications�dir/katrina�aug05�no2.html (accessed May 2,2008).
Provencher, J., 2007. Stronger storms are bad news for coastal eco-systems. Ocean News, 7, 2–4.
Purkis, S.J., 2005. A reef-up approach to classifying coral habitatsfrom IKONOS imagery. IEEE Transactions on Geoscience and Re-mote Sensing, 43, 1375–1390
Ramsey, E., 1995. Monitoring flooding in coastal wetlands by usingradar imagery and ground-based measurements. InternationalJournal of Remote Sensing, 16, 2495–2502.
Robinson, I.S., 2004. Measuring the Ocean from Space: The Principlesand Methods of Satellite Oceanography. Berlin: Springer-Verlag.
Rykhus, R.P., 2005. Satellite imagery maps Hurricane Katrina in-duced flooding and oil slicks. American Geophysical Union, EOS,86, 381–382.
Sallenger, A.H.; Krabill, W.B.; Brock, J.C.; Swift, R.N.; Jansen, M.;Manizade, S.; Richmond, B.; Hampton, M., and Eslinger, D., 1999.Airborne laser study quantifies El Nino–induced coastal change.American Geophysical Union, EOS Transactions, 80(8), 89–93.
Sallenger, A.H.; Stockdon, H.F.; Fauver, L.; Hansen, M.; Thompson,D.; Wright, C.W., and Lillycrop, J., 2006. Hurricanes 2004: anoverview of their characteristics and coastal change. Estuaries andCoasts, 29, 880–888.
Satellite Imaging Corporation, 2009. IKONOS Satellite Imagesand Sensor Specifications. http://www.Satimagingcorp.com/satellite-sensors/ikonos.html (accessed March 13, 2009).
Stockdon, H.F.; Sallenger, A.H.; List, J.H., and Holman, R.A.,2002. Estimation of shoreline position and change using airbornetopographic lidar data. Journal of Coastal Research, 18, 502–513.
Stone, G.W. and Muller, R.A., 2005. Meteorological effects on coasts.In: Encyclopedia of Coastal Science. Dordrecht, The Netherlands:Springer, pp. 636–637.
USACE-IPET (U.S. Army Corps of Engineers, Interagency Perfor-mance Evaluation Task Force), 2008. Volume VIII—Engineeringand Operational Risk and Reliability Analysis. Washington, DC:USACE-IPET, Interim Final Report.
Yarbrough, L. and Easson, G., 2005. Eye of the storm: Google Earthassists Katrina response and recovery. GeoWorld, November 2005,24–26.
Related Documents


