Role of Reading Proficiency in Assessing Mathematics and Science Learning for Students from English and Non-English Backgrounds: An International Perspective Kadriye Ercikan, University of British Columbia Michelle Y. Chen, University of British Columbia Juliette Lyons-Thomas, University of British Columbia Shawna Goodrich, University of British Columbia Debra Sandilands, University of British Columbia Wolff-Michael Roth, University of Victoria Marielle Simon, University of Ottawa Word count: 4195 Submission date: August 28, 2013 Contacting author: Kadriye Ercikan ([email protected] ) 2125 Main Mall, ECPS, Faculty of Education, University of British Columbia, Vancouver, Canada V6T 1Z4

Welcome message from author
This document is posted to help you gain knowledge. Please leave a comment to let me know what you think about it! Share it to your friends and learn new things together.
Transcript
Role of Reading Proficiency in Assessing Mathematics and Science Learning for
Students from English and Non-English Backgrounds: An International Perspective
Kadriye Ercikan, University of British Columbia
Michelle Y. Chen, University of British Columbia
Juliette Lyons-Thomas, University of British Columbia
Shawna Goodrich, University of British Columbia
Debra Sandilands, University of British Columbia
Wolff-Michael Roth, University of Victoria
Marielle Simon, University of Ottawa
Word count: 4195
Submission date: August 28, 2013
Contacting author: Kadriye Ercikan ([email protected]) 2125 Main Mall, ECPS, Faculty of Education, University of British Columbia, Vancouver, Canada V6T 1Z4
wolffmichael-roth
Text Box
Final version published as: Ercikan, K., Chen, M. Y., Lyons-Thomas, J., Goodrich, S., Sandilands, D., Roth, W.-M., & Simon, M. (2015). Role of reading proficiency in assessing mathematics and science learning for students from English and non-English backgrounds: An international perspective. International Journal of Testing, 15, 153–175

Role of reading proficiency on mathematics and science assessment
1
Comparability of Mathematics and Science Scores for Students from English and Non-English
Backgrounds in Australia, Canada, the UK, and the US
Role of reading proficiency on mathematics and science assessment
2
Abstract
The purpose of this research is to examine the comparability of mathematics and science
scores for students from English language backgrounds (ELB) and those from non-English
language backgrounds (NELB). We examine the relationship between English reading
proficiency and performance on mathematics and science assessments and how this relationship
affects comparability of scores for ELB and NELB. The research uses international assessment
data and examines this relationship in four countries with English language education systems:
Australia, Canada, the United Kingdom, and the United States. The findings indicate a strong
relationship between reading proficiency and performance on mathematics and science
assessments with reading proficiency accounting for large proportions of variance in both
mathematics (up to 43%) and science (up to 79%) scores. In all comparisons, ELB students
either outperformed NELB students or performed at the same level. However, when statistical
adjustments were made for reading proficiency, in mathematics, the score gap between the
groups remained in the US only, whereas the differences between the two groups became
significant with higher scores for NELB in Canada. In science, the differences between NELB
and ELB remained significant only in Australia. These findings point to differences in score
meaning and limitations in comparing performance on mathematics and science assessments for
NELB and ELB.
Keywords: reading proficiency, mathematics assessment, science assessment, language
backgrounds, language effects, international comparisons, ELL

Role of reading proficiency on mathematics and science assessment
3
Education systems around the world are faced with educating children who come from
multiple language and cultural backgrounds. Typically, children from a different language and
cultural background than the host country tend to have lower achievement levels on large-scale
assessments. This results in an equity and fairness problem that needs to be addressed (Au, 2013;
Ercikan, et al., in press; Nguyen & Cortes, 2013; Vale et al., 2013). Differences in performance
on assessments can be due to differences in achievement levels or inaccuracies in measurement
of knowledge and competencies and limitations in interpretation of scores from such
measurement. In mathematics and science assessments, scores are expected to indicate students’
knowledge and skills in these areas. Validity of such score interpretations depends on the degree
to which performance on assessments are accurate indicators of students’ competencies (Kane,
2013). There are two key sources of potential threats to validity of score interpretations:
construct-underrepresentation and construct-irrelevant variance (Messick, 1989).
Construct-underrepresentation can occur when a test does not provide a full
representation of the targeted construct, jeopardizing the generalizability of the score inferences
to the larger domain. This may occur when students have limited language proficiency in the test
language by limiting their access to their knowledge and ability to respond to the items. As a
result, scores are underestimated and fail to represent students’ proficiency in the domain.
Construct-irrelevant variance occurs when tests require competencies that are not targeted by the
test, such as linguistic demands of items, cultural references, and context and format of items that
may not be familiar to students. Construct-irrelevant variance also results in the underestimation
of scores for students disadvantaged by linguistic and cultural requirements. In this paper we
Role of reading proficiency on mathematics and science assessment
4
focus on two questions that arise when these sources of threats to validity occur. To what extent
are mathematics and science scores underestimated when students have limited proficiency in the
language of the test? Furthermore, to what extent can scores be compared for students who have
different proficiency levels in the language of the test?
Language Background and Performance on Assessments
There is growing evidence that limited English proficiency has significant implications
for students’ success in mathematics and science assessments (Abedi, 2004; Abedi, Hofstetter, &
Lord, 2004; Abedi & Lord, 2001; Butler, Bailey, Stevens, Huang, & Lord, 2004; Kopriva, Gabel,
& Cameron, 2011; Luykx et al., 2007; Noble et al., in press; Penfield & Lee, 2010;
Solano-Flores & Trumbull, 2003). Such research has demonstrated that English language
learners (ELLs) in the US confront substantial challenges with science and mathematics
assessments because of linguistically and culturally dependent content and representations in
assessments. Researchers investigating the validity of score interpretations for ELL and non-ELL
students demonstrated that linguistic complexity of items was associated with the identification
of differential item functioning (Martiniello, 2008). In this research, linguistic features that create
comprehension difficulties relate to complex vocabulary and sentence structure, including
multiple clauses, long noun phrases and vocabulary. Inaccuracies in measurement are expected
for all examinees. However, Noble et al. (in press) have shown that ELL students with the
required knowledge and skills were more likely to respond incorrectly to a set of science
assessment tasks compared to non-ELL students leading to greater measurement inaccuracy for
ELL students.
Role of reading proficiency on mathematics and science assessment
5
To minimize the effects of limited language proficiency on assessments for ELL in the
United States, accommodations including the provision of dictionaries or pop-up bilingual
glossaries are often provided to reduce language complexity (See Abedi, in press and Lane, in
press for comprehensive reviews of accommodations and modifications). Research on
modifications has demonstrated that reducing the linguistic complexity of mathematics items
resulted in higher performance for ELL students (Abedi, Hofstetter, & Lord, 2004; Abedi &
Lord, 2001). Other research demonstrates that the gap in achievement between ELL and
non-ELL students is largest when language demand is high and it is smaller for science and
mathematics problem solving than for reading and writing (Abedi, Leon, & Mirocha, 2003).
When students are asked to perform mathematics computation in which linguistic demands are
negligible the gap almost disappeared.
Although it is clear that the language competencies of examinees can affect their
performances on assessments, this process may be far more complex than just the language
competency of the examinee (Solano-Flores, 2008). Student performance on assessments is a
result of a complex interaction among factors such as the student’s home language and culture,
the context of the test, and the language proficiencies of students. Thus, ELL students may face
challenges with some types of mathematics problems even when language demand is low
because notations often vary between cultures, languages, and countries. For instance, a point or
a comma can represent a decimal number, depending on the cultural context. Another example is
the way in which some ordinal numbers are represented. For instance, fifth is numerically
represented by “5th” in the US, whereas Latin American countries use the “o” superscript in

Role of reading proficiency on mathematics and science assessment
6
place of the “th” and French uses “ième.” This problem may be further complicated because the
symbol for degree (°) appears to be very similar to the Latin American notation. Moreover, in a
study examining how elementary school students’ prior linguistic and cultural knowledge
mediates responses to science assessments, science terms were frequently interpreted in
reference to everyday meanings rather than specialized scientific meanings (Luykx et al., 2007).
Competency in a language involves four language modalities—listening and reading
(both receptive) and speaking and writing (productive use of language). In computer
administered large-scale assessment contexts, all four of these language modalities may be
utilized and may affect student performance. In paper-and-pencil large-scale assessment contexts
that rely on the examinee’s ability to read and understand the test questions and then respond in
writing, the most relevant aspects of language competency are reading and writing proficiencies...
In this research, we focus on reading competency instead of other language modalities for two
reasons. The first reason is difficulty in obtaining data on language proficiency of students in all
four modalities. Second, we assume competency in reading to be the most relevant language
modality in paper-and-pencil multiple-choice tests, which continue to be the dominant
assessment mode in large-scale assessments.
Purpose
Previous research provides strong evidence of language effects on ELL student
performance on mathematics and science assessments and threats to validity of score meaning
for these students (Abedi, 2004; Abedi et al., 2004; Abedi & Lord, 2001; Butler et al., 2004;
Kopriva et al., 2011; Luykx et al., 2007; Noble et al., in press; Penfield & Lee, 2010;
Role of reading proficiency on mathematics and science assessment
7
Solano-Flores & Trumbull, 2003). The purpose of this research is to estimate a measure of this
effect on mathematics and science scores and to examine the consistency of score meaning for
students from English and non-English backgrounds. This effect is investigated in four countries
with English language education systems: Australia, Canada, the United Kingdom (UK), and the
United States (US). The Programme for International Student assessment (PISA) 2009 is the data
source for the research.
Method
The sections below describe PISA 2009 measures, samples, language groups, differential
item functioning (DIF) analyses, score scale creation and analyses of covariance (ANCOVA)
conducted in the research.
Measures
In 2009, PISA was administered in 65 countries/jurisdictions in 42 languages (OECD,
2010a). PISA is administered to 15-year-old students in three-year cycles, with each cycle
focusing primarily on one cognitive domain. In 2009, the major cognitive domain was reading
literacy with science and mathematics as the minor domains. Our research used data on student
performance on all three of these cognitive domains. In addition to these assessments, PISA
collects data through background questionnaires on contexts of education from students, their
parents, and school administrators. The background questionnaires include questions about home
context, parental background, and student interests in and attitudes toward reading. PISA is
designed to assess students’ abilities to use their knowledge and skills to confront real-life
challenges rather than to assess the extent to which they master specific school curriculum
Role of reading proficiency on mathematics and science assessment
8
(OECD, 2010a). The three domains of reading literacy, scientific literacy, and mathematics
literacy are defined by PISA as follows:
Reading literacy: An individual’s capacity to understand, use, reflect on and engage with
written texts, in order to achieve one’s goals, to develop one’s knowledge and potential
and to participate in society;
Scientific literacy: An individual’s scientific knowledge and use of that knowledge to
identify questions, to acquire new knowledge, to explain scientific phenomena, and to
draw evidence based conclusions about science-related issues, understanding of the
characteristic features of science as a form of human knowledge and enquiry, awareness
of how science and technology shape our material, intellectual, and cultural environments,
and willingness to engage in science-related issues, and with the ideas of science, as a
reflective citizen;
Mathematical literacy: An individual’s capacity to identify and understand the role that
mathematics plays in the world, to make well-founded judgments and to use and engage
with mathematics in ways that meet the needs of that individual’s life as a constructive,
concerned and reflective citizen. (OECD, 2010a, p. 23)
The assessment was administered to students in 13 test booklets. Each booklet contained
four out of 13 possible clusters including seven reading clusters, and three clusters from each of
science and mathematics. Students were randomly assigned to one of the 13 booklets to be
completed within a two hour period.
The Reading Literacy Measure

Role of reading proficiency on mathematics and science assessment
9
For PISA 2009, countries were offered the option of administering a digital reading
assessment in addition to paper-and-pencil format (Mendelovits, Ramalingam, & Lumley, 2012).
This research used response data from the paper-and-pencil format only because all four
countries included in this study administered the paper and pencil format whereas only one
(Australia) also administered the digital reading assessment. The reading literacy items were
arranged in units that focused on a topic and included passages of texts, tables, graphs, and
diagrams. There were 37 reading units containing a total of 131 reading items (37 items used in
prior PISA assessments and 94 new items). Item formats were multiple-choice (MC, 52 items),
complex multiple choice (CMC, 10 items), closed constructed response items (CCR, 13 items),
short closed-constructed (CC, 11 items) and open-constructed responses (OCR, 45 items). For
the CMC items, respondents were asked a series of questions from which they chose a series of
answers (OECD, 2010a). Scale scores were reported for overall reading, the three reading
aspects (access and retrieve, integrate and interpret, and reflect and evaluate), and two of the
reading text formats (continuous text and non-continuous text).
The Mathematics Literacy Measure
PISA 2009 mathematics literacy emphasized students’ ability to formulate, solve and
interpret mathematical problems in real-life situations. The assessment framework consists of
three primary components that include the contexts or situations for the use of mathematics
(personal, public, occupational, educational, scientific, intra-mathematical), mathematical
concepts or content areas (space and shape, change and relationships, quantity, and uncertainty)
and cognitive mathematical competencies used to solve problems. There were 35 mathematics
Role of reading proficiency on mathematics and science assessment
10
items (9 MC, 7 CMC, 3 CCR, 8 CC, 8 CCR) contained in 24 units in the PISA 2009 assessment.
The mathematics assessment results were reported as a single overall mathematics scale (OECD,
2010a, 2010b).
The Scientific Literacy Measure
The PISA 2009 scientific literacy assessment framework centered on students’ science
competence, knowledge and attitudes situated within contexts relevant to their everyday lives.
The test items required students to apply science knowledge and use science competencies in
particular contexts such as personal, social, or global contexts. Scientific competencies included
identifying scientific issues, explaining phenomena scientifically, and drawing conclusions based
on evidence. Scientific knowledge included both knowledge of the natural world (physics,
chemistry, biological science, earth and space science and science-based technology) and
knowledge about science (i.e., processes of scientific enquiry and scientific explanation). Similar
to the reading items, the PISA 2009 science items were arranged in units that provided a
common stimulus and established the context for the items. A variety of stimuli were used such
as passages of text, photographs, tables, graphs, and diagrams. Most units assessed more than
one scientific competency and more than one knowledge category. In total there were 53 (18 MC,
17 CMC, 1 CCR, and 17 OCR) science items included in PISA 2009, contained in 18 units
(OECD, 2010a; OECD, 2010b).
Reliability Estimates
Since each student was administered only one booklet they were administered different
numbers of items for each subject area. The number of reading items per booklet ranged between

Role of reading proficiency on mathematics and science assessment
11
14 to 59; the number of mathematics items per booklet ranged between 11 to 27; and the number
of science items per booklet ranged between 17 to 36. The coefficient alpha reliability estimates
for reading scores from each booklet ranged between 0.82 and 0.94 except for Booklet 12, with
reliability estimates ranging from 0.73–0.75. Reliability estimates for mathematics and science
scores ranged between 0.70 and 0.90 for each booklet, except for Canadian and American
mathematics scores from Booklet 9, with 0.68 and 0.65 reliabilities respectively. Most of the
scores had high reliabilities. Moderate reliabilities for some of the scores were limited to only a
small proportion of students (8%) included in the analyses. Therefore, the inaccuracy in this
study’s correlational analyses due to moderate reliability of scores is expected to be minimal.
Samples
PISA employs a two-stage stratified sampling design. In the first stage, within each
jurisdiction individual schools are sampled using probability proportional to size sampling. In the
second stage, 35 15-year-old students are sampled with equal probability within the sampled
schools. A minimum sample size of 4,500 students in 150 schools per country was targeted by
PISA. The samples for the four countries in our research ranged between 5,233 students from
165 schools in the US to 23,207 students from 978 schools in Canada (Table 1).1
In each country, 13 booklets were distributed to the examinees. One of the booklets,
Booklet 6, only contained reading items, whereas all other booklets covered at least two content
areas (reading+math, or reading+science, or reading+math+science). Given our focus on the
relationship between reading competency and performance on either the mathematics or the 1 Only the students who took PISA in English in the four countries were included in our study.
Role of reading proficiency on mathematics and science assessment
12
science assessment, students who responded to Booklet 6 were not included in analyses that
examined correlational relationships between reading and the other two subjects.
Language Group Definitions
The research focused on investigating potential threats to validity of mathematics and
science score interpretations due to students’ low reading proficiency levels. Therefore, the first
step in our analyses was to identify groups of students with limited language proficiency levels
due to their societal contexts. To identify such groups of students in the four countries included
in this research we considered student responses to two variables contained in the PISA Student
Questionnaire. The first variable (Question 17) asks students about their country of birth, and the
second variable (Question 19) asks students what language they speak at home most of the time.
We compared reading scores of four language groups that were created by using both of these
variables: (a) students who were born in the country of the test and spoke English at home most
of the time; (b) students who were not born in the country of the test but spoke English at home
most of the time; (c) students who were born in the country of the test but spoke a different
language at home most of the time; and (d) students who were not born in the country of the test
and spoke a language other than English at home most of the time. A two-factor Analysis of
Variance (ANOVA) (immigrant status, language at home, and immigrant status x language at
home) was conducted to compare reading performances of these groups for each country. The
dependent variable was a q score from item response theory (IRT) based scaling from separate
country analyses that ranged from -4 to +4, with an approximate mean of 0 and standard
deviation of 1 (see the score scale creation section for more details). In all four countries,

Role of reading proficiency on mathematics and science assessment
13
language at home was a significant factor (Australia F(1,13804) = 42.649, p < 0.001; Canada;
F(1, 16831) = 38.218, p < 0.001; UK F(1, 11424)=57.079, p < 0.001; US F(1, 5078) = 31.296, p
< 0.001) with students who speak English at home most of the time scoring higher. The
immigrant status was significant only in the Canadian comparison (F(1,1)=10.357, p < 0.001)
with immigrant students scoring higher. The interaction between language at home and
immigrant status was significant in Australia (F(1,13804) = 7.966, p < .01) and in the UK
(F(1,11424) = 7.121, p < .01). In Australia and Canada, immigrant students who speak English at
home outperformed all the other three groups; in the UK and the US there were similar group
difference patterns but differences were not statistically significant at the α = 0.05 level. The
lowest performing group was that of immigrant students who did not speak English at home
most of the time. Based on these findings, whether English was spoken at home most of the time
was the key variable that distinguished students with respect to reading proficiency. A finer
grouping that splits the home language groups by immigrant status, that is four groups instead of
two, would be desirable. However, in such a grouping, sample sizes for some of the groups
would be as low as 120; this, however, would prohibit conducting analyses such as differential
item functioning. Therefore, we decided to focus on the home language background as the key
defining variable for the language groups in all four countries resulting in two groups with
students who speak English most of the time at home as English Language Background (ELB)
and those who do not speak English most of the time at home as Not English Language
Background (NELB). Based on the empirical evidence, home language proved to be more
important than immigrant status in identifying students with limited English proficiency.

Role of reading proficiency on mathematics and science assessment
14
Therefore, the research focused on the differential relationships between reading proficiency and
mathematics and science achievement and consistency of score meaning for ELB and NELB
students.
Differential Item Functioning Analyses
Previous research demonstrated considerable measurement incomparability between
countries in international assessments (Ercikan, Roth & Asil, in press; Kankaras & Moores, 2013;
Oliveri, Olson, Ercikan, & Zumbo, 2012). This incomparability existed even between countries
administering tests in the same language (Ercikan & McCreith, 2002; Ercikan et al., in press;
Roth et al., 2013) and between language groups within countries (Ercikan et al., in press;
Kankaras & Moores, 2013; Oliveri et al., 2012). As a first step in our analyses, we therefore
conducted differential item functioning (DIF) analyses to examine comparability of items
between countries and between the NELB and ELB groups within countries. It is important to
identify whether item scores are comparable across groups since, if item scores are not
comparable, the creation of a single scale score intended to represent all groups is not appropriate.
We used a procedure developed and described by Linn and Harnisch (LH; 1981) using an IRT
based approach (CTB/McGraw-Hill, 1991). The primary reason for selecting this DIF detection
method was its ability to accommodate matrix sampling in PISA and utilize data across booklets.
The response data from matrix-sampled assessments have large amounts of completely random
missing data because students take only one of the booklets in the assessment resulting in
missing data on the items that were not presented to them. Combining data across booklets
results in much larger samples and therefore greater power for the statistical analyses. In addition,
Role of reading proficiency on mathematics and science assessment
15
this method can be used to analyze both the dichotomously-scored and polytomously-scored
responses found in PISA; and it can detect both uniform DIF (equal degree of DIF across ability
levels) and non-uniform DIF (unequal, or no, degree of DIF for some ability levels) (Ercikan &
McCreith, 2002). Use of other DIF detection methods is desirable to verify DIF status of items.
However, the matrix sampling design in PISA creates a challenge for applying other DIF
detection methods such as Mantel-Haenzsel or logistic regression.
The Linn-Harnisch DIF detection procedure computes observed and predicted mean
responses for focus groups matched by the overall test score. In the IRT application of the
Linn-Harnisch method, the predicted score is based on a calibration using the combined data
across groups and the observed mean score is the average score for the matched ability level for
the focal group. IRT parameters were calibrated using the PARDUX software
(CTB/McGraw-Hill, 1991). From the differences between the predicted and observed
probabilities, a χ2 statistic is computed and converted to a Z statistic. The DIF status of an item is
determined by the statistical significance of the Z statistic and an effect size based on the average
difference between the predicted and observed scores, pdiff. Items with a Z statistic < 2.58 and
|pdiff| < 0.10 are identified as moderate DIF. Large DIF is identified by |Z| > 2.58 and |pdiff| < 0.10.
A negative difference implies bias against the focal group. Two sets of DIF analyses were
conducted examining the appropriateness of a (a) single score scale for the four countries and (b)
single score scale for NELB and ELB within countries.
Score Scale Creation
In large-scale surveys of achievement like PISA, students take a relatively small numbers of

Role of reading proficiency on mathematics and science assessment
16
items in one of many booklets administered to the total sample. Plausible values are created by
conditioning background variables in an effort to minimize measurement error due to small
number of items. The plausible value approach used by PISA draws from a posterior distribution
of ∂ for individuals, given that individual's item responses and background characteristics in a
conditioning model (Mislevy, 1991; Monseur & Adams, 2009). In estimation of plausible values
in PISA, many background variables are included in the conditioning model to minimize
measurement error. Researchers have demonstrated that inclusion of too few or too many
background characteristics in the conditioning model can lead to bias in subsequent analysis,
particularly when ∂ is an explanatory variable (Monseur & Adams, 2009; Scofield, Junker,
Taylor, & Black, in press). In particular, the conditioning used in the estimation of plausible
values may create biases in some secondary data analyses. Schofield et al. (in press) has
demonstrated problems when plausible values are used as covariates, as we did in our analyses
with the reading plausible values. In particular, these researchers recommend creating plausible
values that use only the specific independent variables used in the secondary analysis regression
model. Estimating plausible values that would not lead to biased secondary analyses is beyond
the scope of this research.
Therefore, in this research we did not use the plausible values available in the PISA
databases. Since students receive different booklets with different numbers and sets of items we
used an IRT based scaling approach to obtain individual student q scores instead of a number
correct score. A simultaneous calibration procedure that combined response data across 13
booklets was used. For each country, dichotomous items were scaled using the three parameter
Role of reading proficiency on mathematics and science assessment
17
logistic model (3PL) (Lord, 1980) and the polytomous items were scaled using the generalized
partial credit model (Muraki, 1992). The scaling analyses were conducted separately for reading,
mathematics, and science. We examined item fit with the Q1 statistic (Yen, 1993) and local item
dependence with Q3 statistic (Yen, 1993) to determine the appropriateness of a unidimensional
model fit with the data. The results indicated satisfactory fit and unidimensionality. Separate
score scales were created ranging approximately between -4 and +4 with means of 0 and
standard deviation of 1 for each country. Due to high proportions of DIF items in country
comparisons (see results section for details about the DIF findings), separate score scales were
created for each country. However, DIF was minimal between ELB and NELB within each of
the countries, therefore score scales within countries are based on a single calibration for each
content area which results in scores that are comparable for NELB and ELB.
Analysis of Covariance
A key method for examining the degree to which a particular variable accounts for
variation in an outcome variable is Analysis of Covariance (ANCOVA) (Maxwell, O’Callaghan,
& Delaney, 1993). This method also allows for estimating adjusted mean scores for the outcome
variable when the covariate is taken into account. Reading scores served as the covariate (CV)
for each of the group performance comparisons of NELB and ELB; and mathematics and science
scores were the dependent variables (DV). The independent variable (IV) was a grouping
variable that identified students as ELB or NELB.
Results
This research focuses on examining the relationship between reading proficiency and
Role of reading proficiency on mathematics and science assessment
18
performance on mathematics and science assessments and how this relationship affects
comparability of scores for ELB and NELB students. The first two steps of analyses involved
examining performances of ELB and NELB students on the assessments and conducting DIF
analyses to determine whether single scales across countries or ELB and NELB groups within
countries could be used. The findings from each step of our analyses are summarized below.
Descriptive Analyses
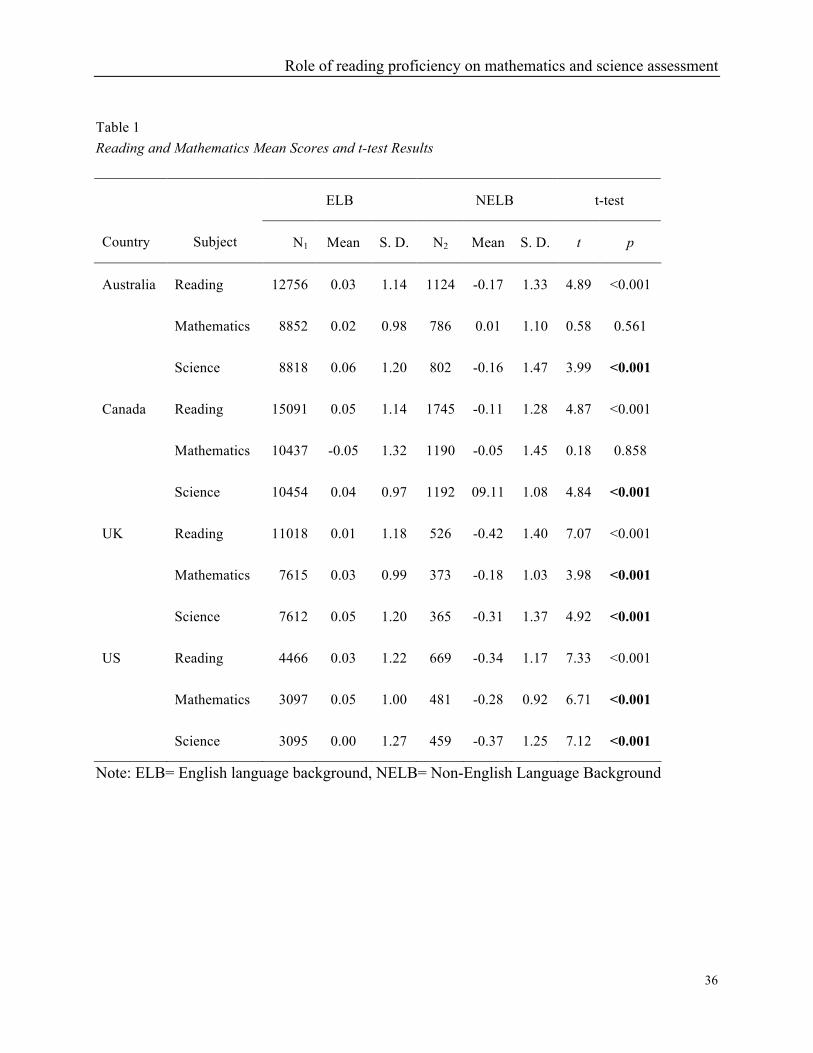
Student responses were used to estimate their reading, mathematics and science scores.
Findings summarized in Table 1 indicate significant differences between the two groups’ reading
(Australia t=4.89, p<0.001; Canada: t=4.87, p<.001; UK: t=7.07, p<.001; US: t=7.33, p<.001)
and science scores (Australia: t=3.99, p<0.001; Canada: t=4.84, p<.001; UK: t=4.92, p<.001; US:
t=7.12, p<.001) in all four countries and significant differences between the two groups’
mathematics scores in the UK (t=3.98, p < .001) and the US (t=6.71, p<.001). Where significant
differences were identified, the ELB group out-performed the NELB group.
««««« Insert Table 1 about here »»»»»
DIF
Two sets of DIF analyses were conducted. One set examined comparability of items
across the four countries in order to determine whether a single score scale can be created and
used in the analyses. The second set examined the comparability of items between language
groups within countries. In the DIF analyses across countries, each country was compared
against the combined international group (across the four countries) where each country served
as the focal group and the combined international group served as the reference group. The
Role of reading proficiency on mathematics and science assessment
19
findings indicated large proportions of DIF item in all three subjects (Table 2). Twenty-seven
percent to 39% of the reading items, 43% to 51% of the mathematics items and 40% to 74% of
the science items were identified as DIF. A great majority of these items exhibited moderate
level DIF. In reading, in each country analysis, approximately half of the DIF items were in
favor of the focus country. However, in mathematics, larger proportions of items were against
UK and US (31% against versus 20% in favor for UK and 26% against versus 17% in favor for
US). In science, there were similar proportions of items in favor of Canada as those against it.
However, whereas there were larger proportions of items in favor of Australia (25% in favor
versus 17% against), there were larger proportions of science DIF items against UK (42%
against versus 32% in favor) and against US (23% against versus 17% in favor). These DIF
results point to large degrees of measurement incomparability between countries even though in
each country the assessment was administered in English. They also point to the necessity for
creating separate reading, mathematics and science scales for each country.
««««« Insert Table 2 about here »»»»»
DIF analyses within countries between NELB and ELB groups identified a small number
of items as DIF, almost all in favor of ELB (Table 3). Among the reading items, 1% were
identified as DIF in favor of the ELB group in Canada and the UK, 1% of the reading items was
in favor of the NELB in Canada. In mathematics, there were only 3% of the items in favor of
ELB in each of the Australia and UK comparisons. In science, 3% of the items were identified as
DIF in Australia, Canada and the UK in favor of ELB. Except for two items (one science item in
the UK comparison and the other in the Australian comparison), all the items were identified as
Role of reading proficiency on mathematics and science assessment
20
moderate DIF. DIF between ELB and NELB status for items did not replicate across countries
and DIF items in each of the country comparison were different items.
««««« Insert Table 3 about here »»»»»
Given possible language effects on student performance, identifying sources of DIF
between the language groups is important. However, none of the DIF items were released by
OECD therefore it is not possible to review the items to investigate potential sources of DIF.
Other information provided by OECD about these items provided little insights about possible
sources of DIF except for one of the DIF items. The reading item that was identified as having
DIF against ELB in Canada was a CR item and was therefore rated by coders. The PISA
technical report (OECD, 2012) indicated that there was a high degree of disagreement between
coders for this item within all countries. For this reason, several countries chose not to use this
item. Also consistency of the item parameters was poor for this item across countries. All items
identified as DIF in the ELB and NELB comparisons were removed from scaling and score
creation procedures.
ANCOVA Analyses
To determine if the CV (reading proficiency) significantly interacts with the IV (home
language grouping variable), an ANCOVA model including the IV, CV and the interaction term
between IV and CV was tested. An assumption required for ANCOVA analyses is the
homogeneity of regression slopes. That is, the CV must not have a differential association with
the DV at different levels of the IV. If this assumption does not hold, then ANCOVA results
cannot be interpreted meaningfully for different levels of the IV (Henson, 1998; Shadish, Cook,

Role of reading proficiency on mathematics and science assessment
21
& Campbell, 2002). All the assumptions of ANCOVA including normality of residuals,
homogeneity of variances, linearity of regression, independence of error terms and homogeneity
of regression lines were tested. For those ANCOVA analyses where the assumption of
uniformity of regression lines was violated, ANCOVA was performed separately for each level
of the IV (i.e., for NELB and ELB). Since the sample sizes involved in our analyses were large,
and multiple comparisons were made in this study, we adjusted the significance level to be 0.001.
This significance level was applied to all the ANCOVA analyses when assessing the statistical
significance (p-value).
In two out of the eight models, significant interactions between the IV and CV were
identified. In the Australian analyses for science as the DV (F (342,8702) =1.42, p<0.001) and in
the Canadian analysis for mathematics as the DV (F (409,10618) =1.25, p<0.001) interactions
were significant, which suggested violation of the homogeneity of regression slopes assumption
for ANCOVA analyses. When the homogeneity of regression slopes assumption is violated,
instead of conducting the ANCOVA analysis across different groups, the relationship between
the CV and the DV is examined separately for each level of the IV (Green & Salkind, 2011). For
those analyses that met the homogeneity of regression slopes assumption, the ANCOVA models
were applied without the CV and IV interaction term.
The results of the ANCOVA analyses are summarized in Table 4. Reading proficiency
accounts for a large proportion of variance in both mathematics (up to 43%) and science (up to
79%). Reading scores contribute to more variance in science than in mathematics scores. In the
Canadian mathematics and Australian science analyses, the interaction between the IV and CV

Role of reading proficiency on mathematics and science assessment
22
was significant indicating different associations between reading and mathematics in Canada and
between reading and science in Australia for the two language groups. In both of these countries,
reading proficiency exhibits a stronger association with the DV for NELB (43% versus 39% in
the Canadian and 79% versus 58% in the Australian analyses).
««««« Insert Table 4 about here »»»»»
Group Differences Adjusted for Reading Proficiency
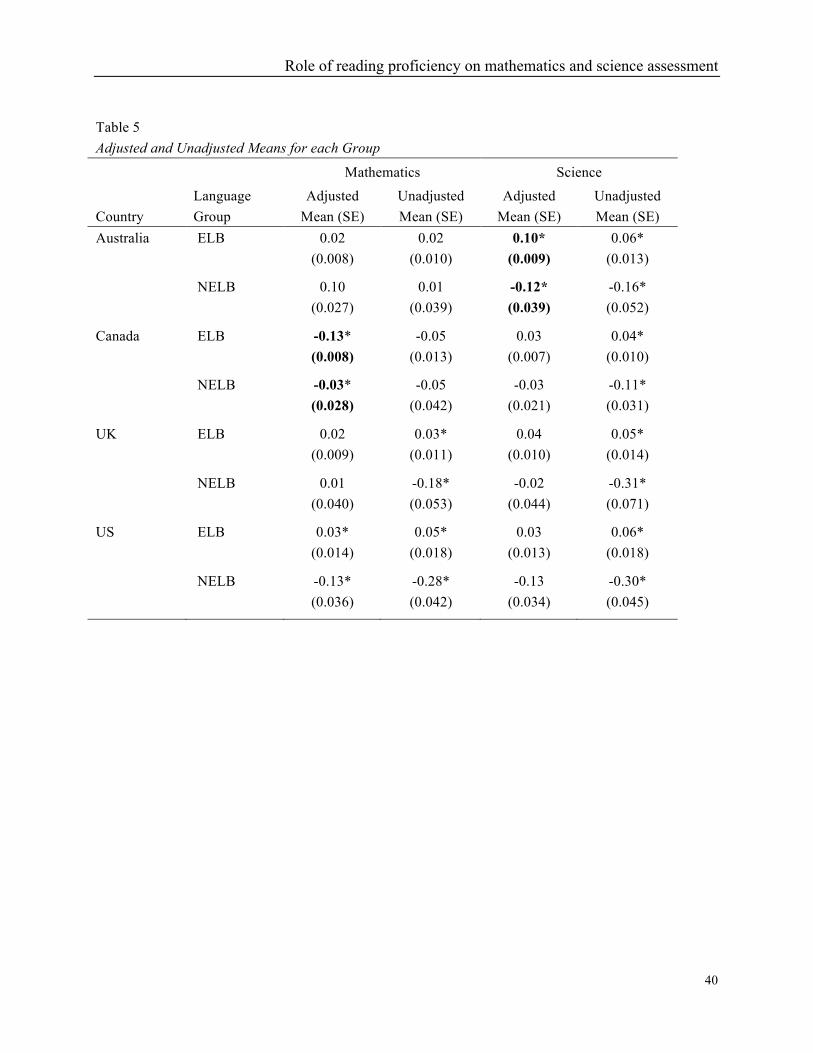
The mean scores of mathematics and science after statistically adjusting for reading
scores using the ANCOVA model for each country are presented in Table 5. After adjusting
scores to take reading proficiency into account using the regression lines obtained from the
ANCOVA, the scores for NELB increased in both mathematics and science in every country. For
ELB, on the other hand, the scores tended not to change greatly, and the changes tended to be in
the opposite direction leading to a drop in the scores. Exceptions were observed in Australia
where the ELB mathematics scores stayed the same and science scores showed slight increase.
The adjusted scores reflected a different pattern of group differences between ELB and
NELB. In mathematics, the score gap between the groups stayed significant in favor of the ELB
only in the US, whereas in Canada, the differences between the two groups became significant
(even though these were not significant based on the unadjusted scores) showing higher scores
for NELB. In science, the differences between NELB and ELB remained significant only in
Australia, even though they were significant in all four countries based on the unadjusted scores.
««««« Insert Table 5 about here »»»»»
Discussion

Role of reading proficiency on mathematics and science assessment
23
The purpose of this research is to examine the relationship between reading proficiency
and performance on mathematics and science assessments and how this relationship affects
comparability of scores for students from ELB and those from NELB. The findings indicate that
reading proficiency accounts for a large proportion of variance in both mathematics (up to 43%)
and science (up to 79%). The results tend to be similar across countries. In mathematics, across
all four countries, reading proficiency accounted for approximately 40% (ranging between 39%
to 43%). In science, reading proficiency accounted for approximately 50% of the variance
(ranging between 46% to 51%) in Canada, UK and US. However, in Australia, reading scores
accounted for much larger proportions (58% for ELB and 79% for NELB) of science scores..
These findings point to differences in the relationship between reading proficiency and
performance on science assessments in Australia, which may be due to differences in science
learning and assessment in Australia compared to other countries. This and other hypotheses for
such a difference will be explored in the next stage of this research. These results confirm
previous research on the effects of reading proficiency on mathematics and science assessment
performance (e.g., Abedi & Gandara, 2006; Hudson, Lane & Pullen, 2005; Noble, et al., in press)
and provide an estimate of the size of possible language background effects on student
performance. Statistical adjustment of scores controlling for reading proficiency indicates that
scores for NELB students were indeed underestimated, a phenomenon that already has raised
serious concerns (Abedi & Gandara, 2006; Noble, et al., in press; Solano-Flores, 2008).
There is consistent evidence across the four countries that group differences in
mathematics and science scores are smaller when the students’ reading proficiency levels are
Role of reading proficiency on mathematics and science assessment
24
taken into account. In Australia, the NELB and ELB mathematics achievement differences are
not statistically significant (in fact reversed, with NELB scoring higher), when reading
proficiency is taken into account. In Canada, differences in science scores between these
language groups disappear resulting in no achievement differences between the groups; and in
mathematics, the differences are reversed, with NELB group scoring higher. In the UK,
differences are no longer statistically significant between the two groups. In the US, in
mathematics and in Australia in science, the statistically reliable differences between groups are
smaller with ELB scoring higher when reading proficiency is taken into account. Even though
the correlational relationship between reading proficiency and performance on mathematics and
science assessments identified in the ANCOVA was similar for ELB and NELB in six of the
eight analyses, the patterns of differences between NELB and ELB mathematics and science
scores when reading proficiency is taken into account point to differences in mathematics and
science score meaning for these student groups.
DIF analyses are typically accompanied by expert reviews of items for identifying sources
of DIF. Such reviews result in hypotheses about sources of DIF which can be followed up with
further research using think aloud protocols to gather student response process data to test these
hypotheses or identify new ones (Ercikan et al., 2010). In this research, DIF analyses were
conducted to examine the degree to which score scales were comparable between countries and
between ELB and NELB within countries. The results indicated large degrees of DIF between
countries, therefore ANCOVA analyses were conducted separately for each country. Minimal
DIF was identified (at most one DIF item in each comparison, typically at moderate DIF level)
Role of reading proficiency on mathematics and science assessment
25
between ELB and NELB within each country.. Therefore, the kind of measurement
incomparability that is identified here is not the kind that is typically identified by DIF analyses.
Previous research has demonstrated differences in measurement incomparability identified at
item and test levels, such as those identified by confirmatory factor analyses and DIF analysis
(Ercikan & Koh, 2005; Oliveri, Erickan & Zumbo, 2011; Zumbo, 1999). The findings in this
research point to ANCOVA as an alternative approach to examine measurement comparability at
the test level.
Two limiting factors in the research may have resulted in an underestimation of potential
problems with interpretation of mathematics and science scores for NELB. The first is related to
reading proficiency as the only variable available to examine potential language effects. Writing
proficiency in English is essential for performance on assessments with constructed response
items. Inclusion of writing proficiency as an additional CV may account for greater degrees of
variation in mathematics and science assessments. The second is related to low measurement
accuracy for some of the scores due to small numbers of items. Low reliabilities for some of
these scales are expected to have affected the correlational relationships we investigated and, in
particular, may have underestimated correlational relationships, such as those between reading
and each of mathematics and science scores.
An additional limiting factor is related to the self-report nature of the questionnaire data in
PISA. Thus, the 15-year-olds’ reporting of whether the most commonly used language at home
was English or not may include inaccuracies. There is an expectation that students’ responses are
influenced by how they understand the question and by their perceptions of language most
Role of reading proficiency on mathematics and science assessment
26
spoken at home. For example, students may not have distinguished between language spoken
between their parents versus among all family members.
Finally, analysis of covariance captures correlational associations. Reading performance
that accounts for variation in science and mathematics scores does not indicate that reading
proficiency causes the achievement gap differences. Language group differences may be related
to many socio-cultural factors including differences in socio-economic background or the quality
of education that students’ receive. Exploration of socio-cultural differences between ELB and
NELB is one of the future directions for this research.
Conclusions and Implications
There are major limitations in how NELB versus ELB performances are interpreted on
mathematics and science assessments. Comparisons of these two groups may be made directly
by comparing group performance averages for these two language groups. In direct language
group comparisons, the findings from this research demonstrate that assessments may
underestimate NELB’s mathematics and science achievement. Often, these comparisons may be
indirect for example when performances of schools, districts, states and provinces are compared.
In indirect comparisons, different concentrations of NELB and ELB students in the comparison
units will inevitably lead to inappropriate interpretations of group performances. For example, if
effectiveness of school systems are evaluated through student achievement scores in
mathematics or science—as is often the case in formal accountability models used in the US and
informal accountability models used in Canada—schools or districts with high concentrations of
NELB will be interpreted to be demonstrating lower achievement, therefore, poorer effectiveness

Role of reading proficiency on mathematics and science assessment
27
in education . Since PISA results are not used for school accountability purposes, it is important
to investigate the degree to which these results would replicate in assessments that are used for
accountability.
A very small number of items (1% to 3%) were identified as DIF between ELB and NELB.
Yet, reading scores accounted for as high as 79% of the variation in science scores, which draws
attention to possible disadvantages on mathematics and science assessments for NELB students
with limited reading proficiencies.. This scenario is possible if low reading proficiency
disadvantages NELB across the whole mathematics and science assessments rather than on
specific items due to specific vocabulary or sentence structure. To determine whether linguistic
demands may have been the source of DIF we recommend a review of PISA items. The
findings highlight the importance of the need to minimize the effects of language on assessments
where the targeted construct for measurement is not reading. These efforts need to include
thorough reviews of test items, broader reviews of cultural, language, and curricular
characteristics of a test by experts and consideration of language and cultural perspectives in all
stages of test development. Previous research provides guidance on how test developers can
minimize such effects (Abedi, in press; Lane, in press; Solano-Flores, in press). PISA test items
go through multiple phases of piloting and field-testing. However, OECD does not report any
efforts to minimize language burden on the examinees. Even though the stakes for individual
examinees are not high in assessments such as PISA, the inaccurate estimation of student
competencies in mathematics and science is expected to impact the accuracy of overall results as
well as group comparisons.

Role of reading proficiency on mathematics and science assessment
28
This research also highlights the need for validity evidence that the scores accurately
measure the targeted constructs for NELB. For instance, cognitive interviews that focus on
examinee response processes may help to identify problems with science tasks for ELL students
(Noble et al., in press). Such approaches are necessary for determining linguistic and cultural
aspects of items that may contribute to measurement error for NELB examinees.
Finally, with respect to how scores are reported, the limitations of interpreting scores for
NELB should be addressed.. We recommend three approaches. One approach may be to include
measurement error due to language group membership as part of the overall measurement error.
A probabilistic approach to assessment recognizes uncertainty as a result of the multiple
linguistic factors that shape the ways in which students make sense of items (Solano-Flores, in
press). Based on this approach, language can be considered as a source of measurement error.
Estimating this type of measurement error in G-studies (see Solano-Flores, 2009) and including
error as part of the score reports is likely to lead to more cautious interpretation of scores.
A second strategy involves indicating NELB status of students and providing cautionary
statements about interpretation of scores in score reports. Such statements should caution users
of test scores that NELB students’ mathematics and science may be underestimated and that they
should not be compared with scores of ELB students.
A third strategy we recommend is an extension of the second strategy and involves
measuring and reporting of language proficiencies of NELB along with mathematics and science
achievement scores. Recommendations can be made about at what language proficiency level
scores can be meaningfully interpreted. Such recommendations will need to be based on
Role of reading proficiency on mathematics and science assessment
29
empirical evidence to determine a language proficiency level beyond which mathematics and
science scores are underestimated.
Role of reading proficiency on mathematics and science assessment
30
References
Au, K. (2013). Multicultural issues and literacy achievement. Mahwah, NJ: Lawrence Erlbaum.
Abedi, J. (in press). The Use of Computer Technology in Designing Appropriate Test
Accommodations for English Language Learners. Applied Measurement in Education.
Abedi, J. (2004). The no child left behind act and English language learners: Assessment and
accountability issues. Educational Researcher, 33(1), 4-14.
Abedi, J., & Gándara, P. (2006). Performance of English Language Learners as a Subgroup in
Large‐Scale Assessment: Interaction of Research and Policy. Educational Measurement:
Issues and Practice, 25(4), 36-46.
Abedi, J., Hofstetter, C., & Lord, C. (2004). Assessment accommodations for English language
learners: Implications for policy-based empirical research. Review of Educational Research,
74(1), 1–28.
Abedi, J., & Lord, C. (2001). The language factor in mathematics tests. Applied Measurement in
Education, 14(3), 219-234.
Abedi, J., Leon, S., & Mirocha, J. (2003). Impact of students’ language background on
content-based assessment: Analyses of extant data (CSE Tech. Rep. No. 603). Los Angeles:
University of California, National Center for Research on Evaluation, Standards, and
Student Testing.
Butler, F. A., Bailey, A. L., Stevens, R., Huang, B., & Lord, C. (2004). Academic English in
fifth-grade mathematics, science, and social studies textbooks (Final deliverable to IES,

Role of reading proficiency on mathematics and science assessment
31
Contract No. R305B960002; currently available as CSE Report No. 642). Los Angeles:
University of California. National Center for Research on Evaluation, Standards, and
Student Testing (CRESST).
CTB/McGraw-Hill. (1991). PARDUX [Computer software]. Monterey, CA:
CTB/McGraw-Hill.
Ercikan, K., Roth, M., Simon, M., Lyons-Thomas, J., & Sandilands, D. (in press). Assessment
of linguistic minority students. Applied Measurement in Education.
Ercikan, K. & McCreith, T. (2002). Effects of adaptations on comparability of test items and test
scores. In D. Robitaille & A. Beaton (Eds.), Secondary analysis of the TIMSS results: A
synthesis of current research (pp. 391-407). Dordrecht, The Netherlands: Kluwer
Academic.
Ercikan, K., Roth, W-M., Asil, M. (in press). Cautions about uses of international assessments.
Teachers College Record.
Green, S. B., & Salkind, N. J. (2011). Using SPSS for Windows and Macintosh: Analyzing and
Understanding Data (6th ed.). Upper Saddle River, NJ: Prentice Hall.
Henson, R. K. (1998, November). ANCOVA with intact groups: Don’t do it! Paper presented at
the annual meeting of the Mid-South Educational Research Association, New Orleans, LA.
Hudson, R. F., Lane, H. B., & Pullen, P. C. (2005). Reading fluency assessment and instruction:
What, why, and how? The Reading Teacher, 58(8), 702-714.
Kane, M. T. (2013). Validating the Interpretations and Uses of Test Scores. Journal of
Educational Measurement, 50(1), 1-73. doi: 10.1111/jedm.12000

Role of reading proficiency on mathematics and science assessment
32
Kopriva, R., Gabel, D., & Cameron, C. (2011). Designing Dynamic and Interactive Assessments
for English Learners That Directly Measure Targeted Science Constructs. Society for
Research on Educational Effectiveness.
Kankaraš, M., & Moors, G. (2013). Analysis of Cross-Cultural Comparability of PISA 2009
Scores. Journal of Cross-Cultural Psychology, 45 (3), 381-399. doi:
10.1177/0022022113511297.
Lane, S. (in press). Psychometric Challenges in Assessing English Language Learners and
Students with Disabilities. Review of Research in Education.
Linn, R. L., & Harnisch, D. L. (1981). Interactions between item content and group membership
on achievement test items. Journal of Educational measurement, 18(2), 109-118.
Lord, F. M. (1980). Applications of item response theory to practical testing problems. Hillsdale
NJ: Erlbaum.
Luykx, A., Lee, O., Mahotiere, M., Lester, B., Hart, J., & Deaktor, R. (2007). Cultural and home
language influences on children's responses to science assessments. The Teachers College
Record, 109(4), 897-926.
Martiniello, M. (2008). Language and the performance of English-language learners in math
word problems. Harvard Educational Review, 78(2), 333-368.
Maxwell, S. E., O’Callaghan, M. F., & Delaney, H. D. (1993). Analysis of covariance. In L. K.
Edwards (Ed.), Applied analysis of variance in behavioral science (pp. 63–104). New York:
Marcel Dekker.
Mendelovits, J., Ramalingam, D., & Lumley, T. (2012). Print and digital reading in PISA 2009 :

Role of reading proficiency on mathematics and science assessment
33
comparison and contrast. http://research.acer.edu.au/pisa/6.
Mislevy, R. J. (1991). Randomization-based inference about latent variables from complex
samples. Psychometrika, 56(2), 177-196.
Monseur, C., & Adams, R. (2009). Plausible values: How to deal with their limitations. Journal
of Applied Measurement, 10(3), 320-334.
Muraki, E. (1992). A generalized partial credit model: Application of an EM algorithm. Applied
Psychological Measurement, 16(2), 159-176.
Nguyen, H. T., & Cortes, M. (2013). Focus on Middle School: Teaching Mathematics to ELLs:
Practical Research-Based Methods and Strategies. Childhood Education, 89(6). 392-395.
Noble, T., Risebery, A., Suarez, C., Warren, B., & O’Connor, C. (in press). Science Assessments
and English Language Learners: Validity Evidence based on Response Processes. Applied
Measurement in Education.
OECD (2010a), PISA 2009 results: What students know and can do – Student performance in
reading, mathematics and science (Volume I) http://dx.doi.org/10.1787/9789264091450-en
OECD (2010b). PISA 2009 assessment framework: Key competencies in reading, mathematics
and science. OECD Publishing.
OECD (2012). PISA 2009 technical report, PISA, OECD Publishing,
http://dx.doi.org/10.1787/9789264167872-en
Oliveri, M. E., Olson, B. F., Ercikan, K., & Zumbo, B. D. (2012). Methodologies for
investigating item-and test-level measurement equivalence in international large-scale
assessments. International Journal of Testing, 12(3), 203-223.
Role of reading proficiency on mathematics and science assessment
34
Penfield, R. D., & Lee, O. (2010). Test‐based accountability: Potential benefits and pitfalls of
science assessment with student diversity. Journal of Research in Science Teaching, 47(1),
6-24.
Roth, W. M., Oliveri, M. E., Sandilands, D. D., Lyons-Thomas, J., & Ercikan, K. (2013).
Investigating Linguistic Sources of Differential Item Functioning Using Expert
Think-Aloud Protocols in Science Achievement Tests. International Journal of Science
Education, 35(4), 546-576.
Schofield, L. S., Junker, B., Taylor, L. J., & Black, D. A. (in press). Predictive Inference Using
Latent Variables with Covariates. Psychometrika.
Shadish, W. R., Cook, T. D., & Campbell, D. T. (2002). Experimental and quasi-experimental
designs for generalized causal inference. New York: Houghton Mifflin.
Solano-Flores, G. (2008). Who is given tests in what language by whom, when, and where? The
need for probabilistic views of language in the testing of English language learners.
Educational Researcher, 37(4), 189-199.
Solano-Flores, G. (in press). Probabilistic approaches to examining linguistic features of test
items and their effect on the performance of English Language Learners. Applied
Measurement in Education.
Solano-Flores, G. (2011). Language issues in mathematics and the assessment of English
language learners. In K. Tellez, J. N. Moschkovich, & M. Civil (Eds.), Latinos/as and
mathematics education: Research on learning and teaching in classrooms and communities
Role of reading proficiency on mathematics and science assessment
35
(pp. 283-314). Charlotte, NC: Information Age Publishing.
Solano-Flores, G. (2009). The testing of English language learners as a stochastic process:
Population misspecification, measurement error, and overgeneralization. K Ercikan &
W-M Roth (Eds.) Generalizing from educational research (pp. 33-48). New York:
Routledge Publishing.
Solano-Flores, G., & Trumbull, E. (2003). Examining language in context: The need for new
research and practice paradigms in the testing of English-language learners. Educational
Researcher, 32(2), 3-13.
Vale, C., Weaven, M., Davies, A., Hooley, N., Davidson, K., & Loton, D. (2013). Growth in
literacy and numeracy achievement: evidence and explanations of a summer slowdown in
low socio-economic schools. The Australian Educational Researcher, 40(1), 1-25.
Yen, W. M. (1993). Scaling performance assessments: Strategies for managing local item
dependence. Journal of Educational Measurement, 30, 187-213.
Role of reading proficiency on mathematics and science assessment
36
Table 1 Reading and Mathematics Mean Scores and t-test Results
ELB NELB t-test
Country Subject N1 Mean S. D. N2 Mean S. D. t p
Australia Reading 12756 0.03 1.14 1124 -0.17 1.33 4.89 <0.001
Mathematics 8852 0.02 0.98 786 0.01 1.10 0.58 0.561
Science 8818 0.06 1.20 802 -0.16 1.47 3.99 <0.001
Canada Reading 15091 0.05 1.14 1745 -0.11 1.28 4.87 <0.001
Mathematics 10437 -0.05 1.32 1190 -0.05 1.45 0.18 0.858
Science 10454 0.04 0.97 1192 09.11 1.08 4.84 <0.001
UK Reading 11018 0.01 1.18 526 -0.42 1.40 7.07 <0.001
Mathematics 7615 0.03 0.99 373 -0.18 1.03 3.98 <0.001
Science 7612 0.05 1.20 365 -0.31 1.37 4.92 <0.001
US Reading 4466 0.03 1.22 669 -0.34 1.17 7.33 <0.001
Mathematics 3097 0.05 1.00 481 -0.28 0.92 6.71 <0.001
Science 3095 0.00 1.27 459 -0.37 1.25 7.12 <0.001
Note: ELB= English language background, NELB= Non-English Language Background

Role of reading proficiency on mathematics and science assessment
37
Table 2 Number and percentage of DIF items between countries by subject
Reading (177 items)
Mathematics (35 items)
Science (53 items)
Country
Direction Moderate Large Moderate Large Moderate Large
Australia In favour 22 (19%) 0 8 (23%) 0 13 (25%) 0 Against 21 (18%) 0 8 (23%) 0 9 (17%) 0 Canada In favour 14 (12%) 0 8 (23%) 0 15 (28%) 0 Against 17 (15%) 0 8 (23%) 0 16 (30%) 0 UK In favour 22 (19%) 0 7 (20%) 0 14 (26%) 3 (6%) Against 21 (18%) 2 (2%) 11 (31%) 0 21 (40%) 1 (2%) US In favour 16 (14%) 1 (1%) 6 (17%) 0 9 (17%) 0 Against 18 (16%) 0 8 (23%) 1 (3%) 12 (23%) 0

Role of reading proficiency on mathematics and science assessment
38
Table 3 Number and percentage of DIF items between ELB and NELB groups within countries
Reading (166 items)
Mathematics (35 items)
Science (53 items)
Country Favouring
Moderate Large Moderate Large Moderate Large Australia ELB 0 0 1 (3%) 0 0 1 (3%) NELB 0 0 0 0 0 0 Canada ELB 1 (1%) 0 0 0 1 (3%) 0 NELB 1 (1%) 0 0 0 0 0 UK ELB 1 (1%) 0 1 (3%) 0 0 1 (3%) NELB 0 0 0 0 0 0 US ELB 0 0 0 0 0 0 NELB 0 0 0 0 0 0

Role of reading proficiency on mathematics and science assessment
39
Table 4 ANCOVA Results
DV Country Variable F p Partial Eta Square
Mathematics Australia Home Language 9.83 0.002 0.001
Reading 7028.25 <0.001 0.422
Canada Reading (ELB) 6649.07 <0.001 0.389
Reading (NELB) 888.79 <0.001 0.428
UK Home Language 0.01 0.913 0.000
Reading 5106.21 <0.001 0.390
US Home Language 15.78 <0.001 0.004
Reading 2271.38 <0.001 0.389
Science Australia Reading (ELB) 20.21 <0.001 0.580
Reading (NELB) 4.91 <0.001 0.794
Canada Home Language 7.85 0.005 0.001
Reading 10098.27 <0.001 0.464
UK Home Language 1.26 0.213 0.000
Reading 8284.00 <0.001 0.510
US Home Language 18.60 <0.001 0.005
Reading 3125.45 <0.001 0.468
Note: ANCOVA results highlighted in bold were estimated within each group separately since the assumption of uniformity of regression slopes was not met. This is also the reason for why separate fit statistic, significance level and effect size are reported for ELB and NELB in Canada (Mathematics) and Australia (Science)
Role of reading proficiency on mathematics and science assessment
40
Table 5 Adjusted and Unadjusted Means for each Group Mathematics Science
Country Language Group
Adjusted Mean (SE)
Unadjusted Mean (SE)
Adjusted Mean (SE)
Unadjusted Mean (SE)
Australia ELB 0.02 (0.008)
0.02 (0.010)
0.10* (0.009)
0.06* (0.013)
NELB 0.10 (0.027)
0.01 (0.039)
-0.12* (0.039)
-0.16* (0.052)
Canada ELB -0.13* (0.008)
-0.05 (0.013)
0.03 (0.007)
0.04* (0.010)
NELB -0.03* (0.028)
-0.05 (0.042)
-0.03 (0.021)
-0.11* (0.031)
UK ELB 0.02 (0.009)
0.03* (0.011)
0.04 (0.010)
0.05* (0.014)
NELB 0.01 (0.040)
-0.18* (0.053)
-0.02 (0.044)
-0.31* (0.071)
US ELB 0.03* (0.014)
0.05* (0.018)
0.03 (0.013)
0.06* (0.018)
NELB -0.13* (0.036)
-0.28* (0.042)
-0.13 (0.034)
-0.30* (0.045)
Related Documents