The Role of Oxygen on the Dynamics of Seizure and Spreading Depression Yina Wei Allen Ins?tute for Brain Science Feb 14, 2018 Mathema(cal Modeling of Cor(cal Spreading Depression (SD) and Related Phenomena, University of Minnesota

Welcome message from author
This document is posted to help you gain knowledge. Please leave a comment to let me know what you think about it! Share it to your friends and learn new things together.
Transcript
TheRoleofOxygenontheDynamicsofSeizureandSpreadingDepression
YinaWeiAllenIns?tuteforBrainScience
Feb14,2018
Mathema(calModelingofCor(calSpreadingDepression(SD)andRelatedPhenomena,UniversityofMinnesota
2/14/18 2
Outline• Whatisseizure?• Whatisspreadingdepression?• Commonality?• Whatismissingincurrentmodel?• Energyconsump?oninthebrain• PartI:oxygenandseizuredynamics• PartII:oxygenandspreadingdepression
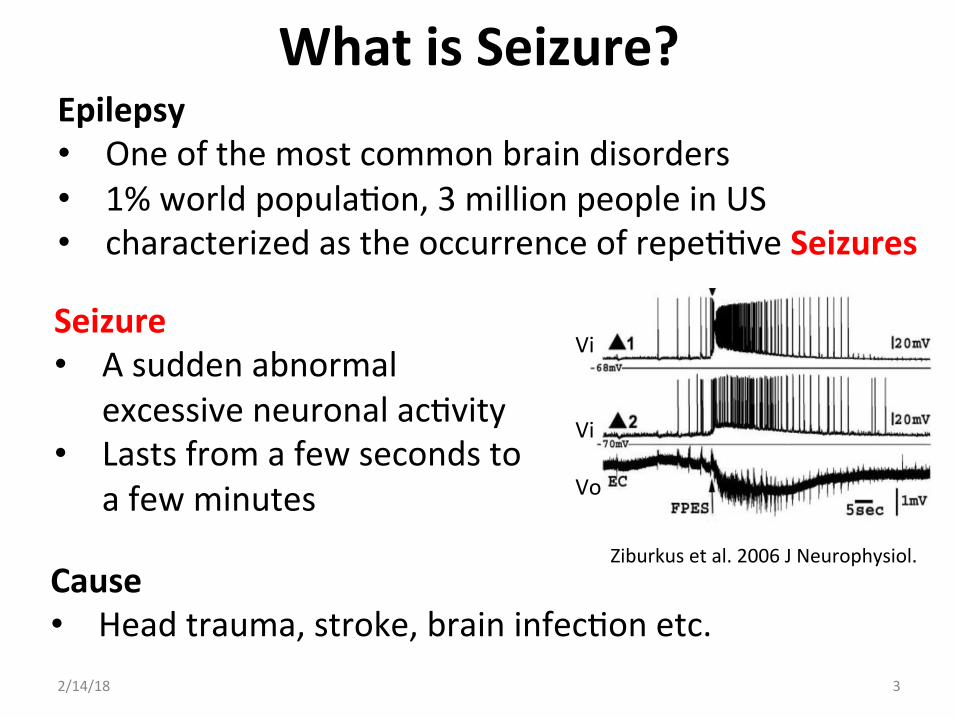
WhatisSeizure?Epilepsy• Oneofthemostcommonbraindisorders• 1%worldpopula(on,3millionpeopleinUS• characterizedastheoccurrenceofrepe((veSeizures
32/14/18
Ziburkusetal.2006JNeurophysiol.
ViViVo
Seizure• Asuddenabnormal
excessiveneuronalac(vity• Lastsfromafewsecondsto
afewminutes
Cause• Headtrauma,stroke,braininfec(onetc.
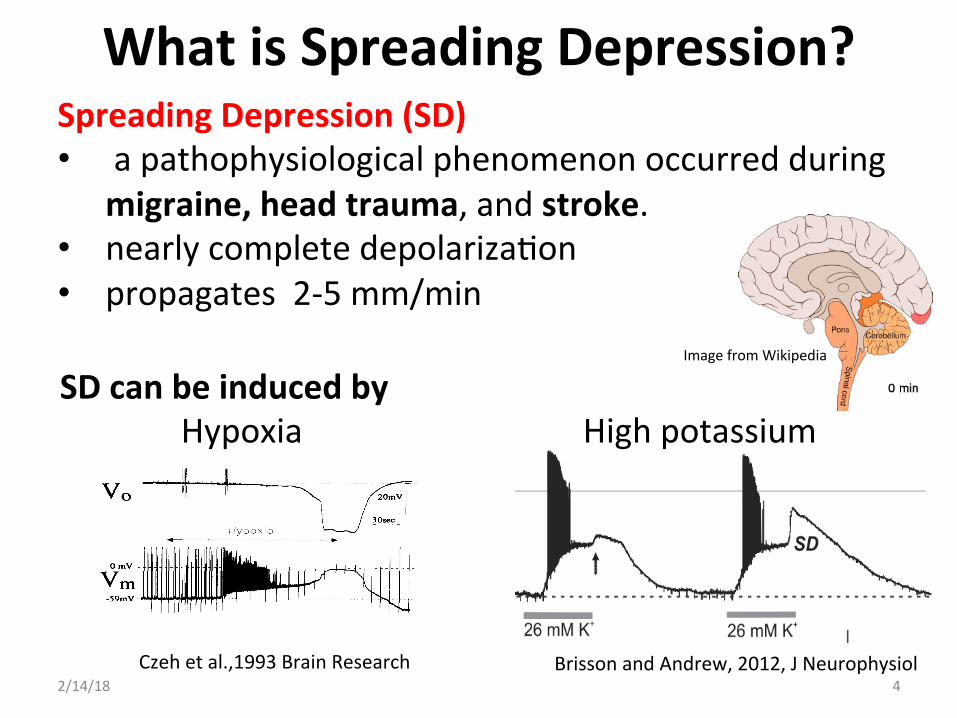
WhatisSpreadingDepression?
ImagefromWikipedia
SpreadingDepression(SD)• apathophysiologicalphenomenonoccurredduring
migraine,headtrauma,andstroke.• nearlycompletedepolariza(on• propagates2-5mm/min
42/14/18
SDcanbeinducedby Hypoxia Highpotassium
Czehetal.,1993BrainResearch BrissonandAndrew,2012,JNeurophysiol

2/14/18
Seizures HypoxiaSpreadingDepression
Commonali?es:• Shi]sofextracellularpoten(al• Redistribu(onofionsbetweenintracellularandextracellular
space• Canbeinducedbylowoxygenandhighpotassium,etc.
Czehetal.,1993BrainResearch
TheCommonali?es
5
Ziburkusetal.2006JNeurophysiol.
ViViVo
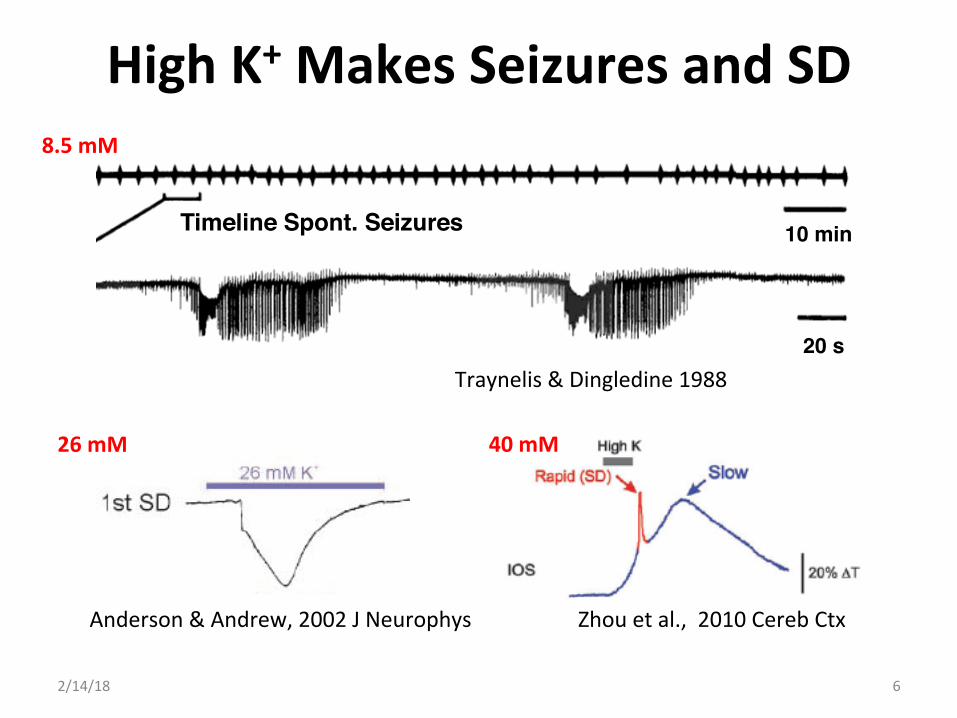
HighK+MakesSeizuresandSD
20 s
10 min Timeline Spont. Seizures
Traynelis&Dingledine1988
8.5mM
Anderson&Andrew,2002JNeurophys Zhouetal.,2010CerebCtx
26mM 40mM
62/14/18
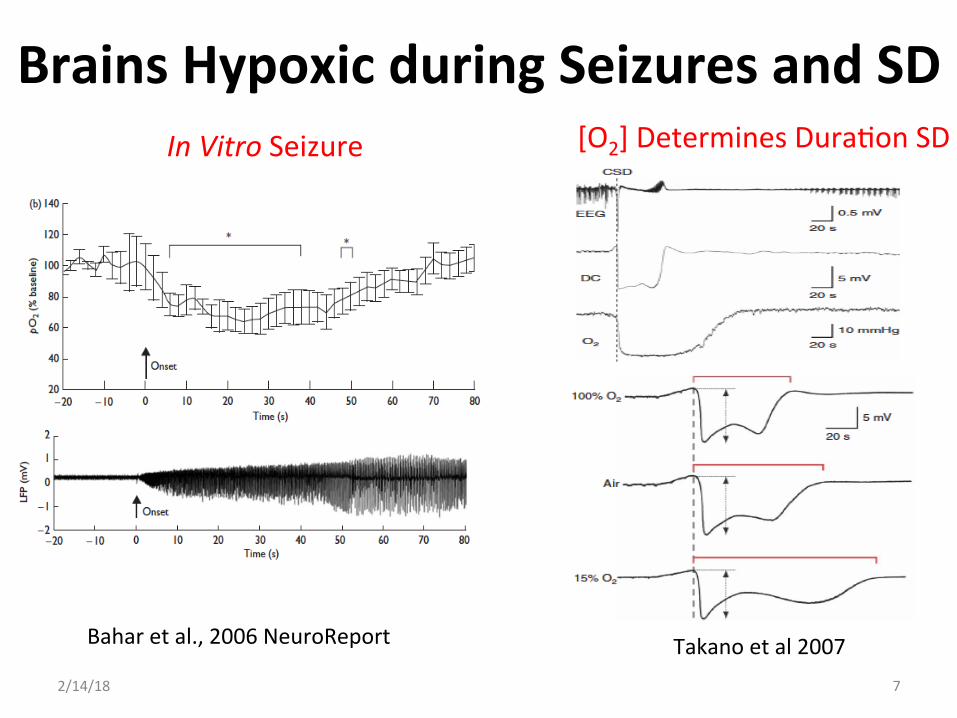
BrainsHypoxicduringSeizuresandSDInVitroSeizure
Baharetal.,2006NeuroReport Takanoetal2007
[O2]DeterminesDura(onSD
72/14/18
2/14/18
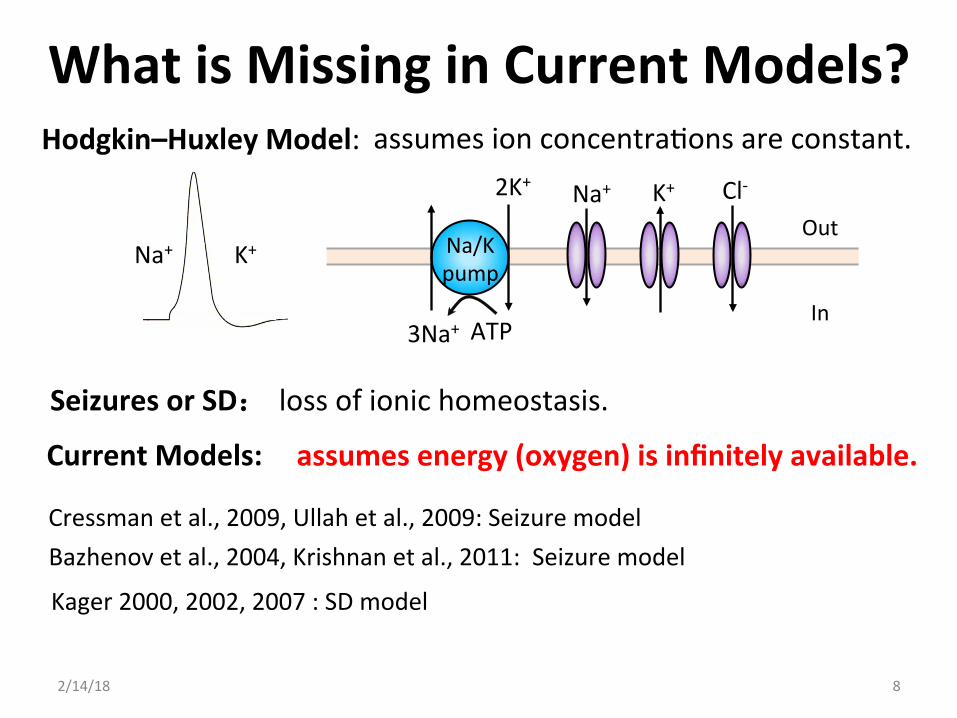
WhatisMissinginCurrentModels?Hodgkin–HuxleyModel:
OutIn
Na+ K+ Cl-2K+
3Na+
Na/Kpump
ATP
Na+ K+
SeizuresorSD��lossofionichomeostasis.
Kager2000,2002,2007:SDmodel
Cressmanetal.,2009,Ullahetal.,2009:Seizuremodel
assumesenergy(oxygen)isinfinitelyavailable.
assumesionconcentra(onsareconstant.
CurrentModels:
Bazhenovetal.,2004,Krishnanetal.,2011:Seizuremodel
8
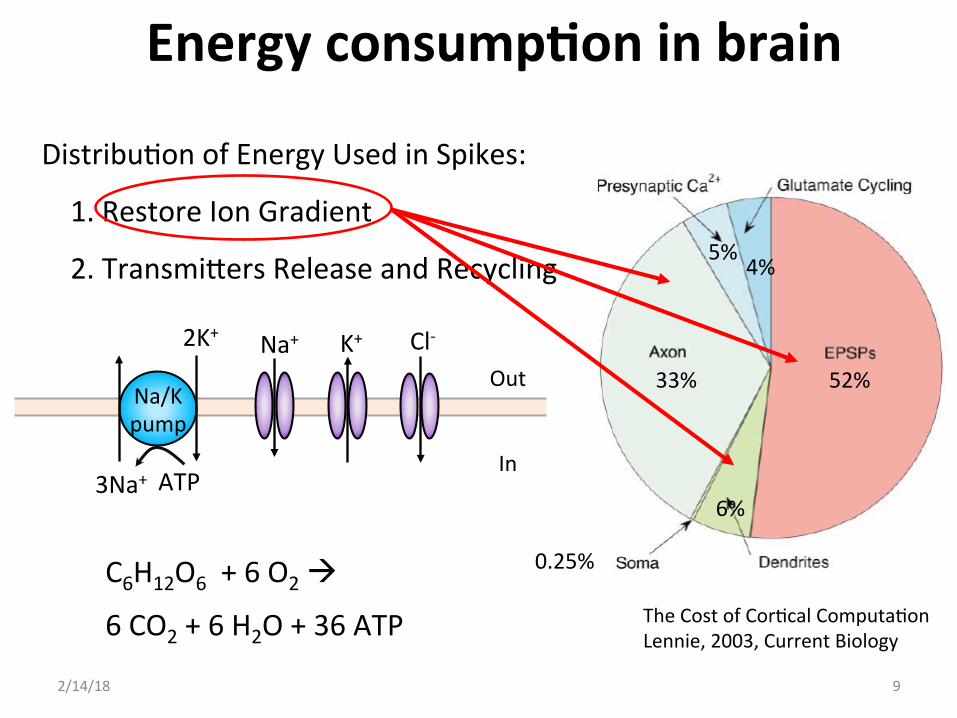
52%33%
6%
5%4%
0.25%
TheCostofCor(calComputa(onLennie,2003,CurrentBiology
Distribu(onofEnergyUsedinSpikes:
1.RestoreIonGradient
2.TransmihersReleaseandRecycling
2/14/18 9
OutIn
2K+
3Na+
Na+ K+ Cl-
Na/Kpump
ATP
C6H12O6+6O2à
6CO2+6H2O+36ATP
Energyconsump?oninbrain
2/14/18 10
PartI:OxygenandSeizure
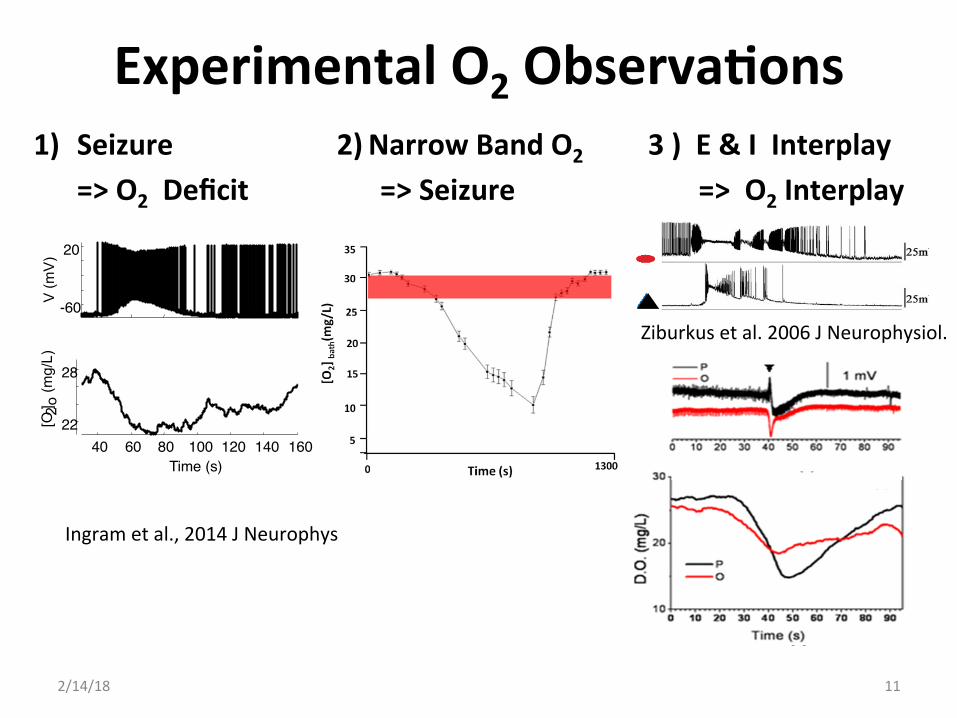
ExperimentalO2Observa?ons1) Seizure=>O2Deficit
2) NarrowBandO2=>Seizure
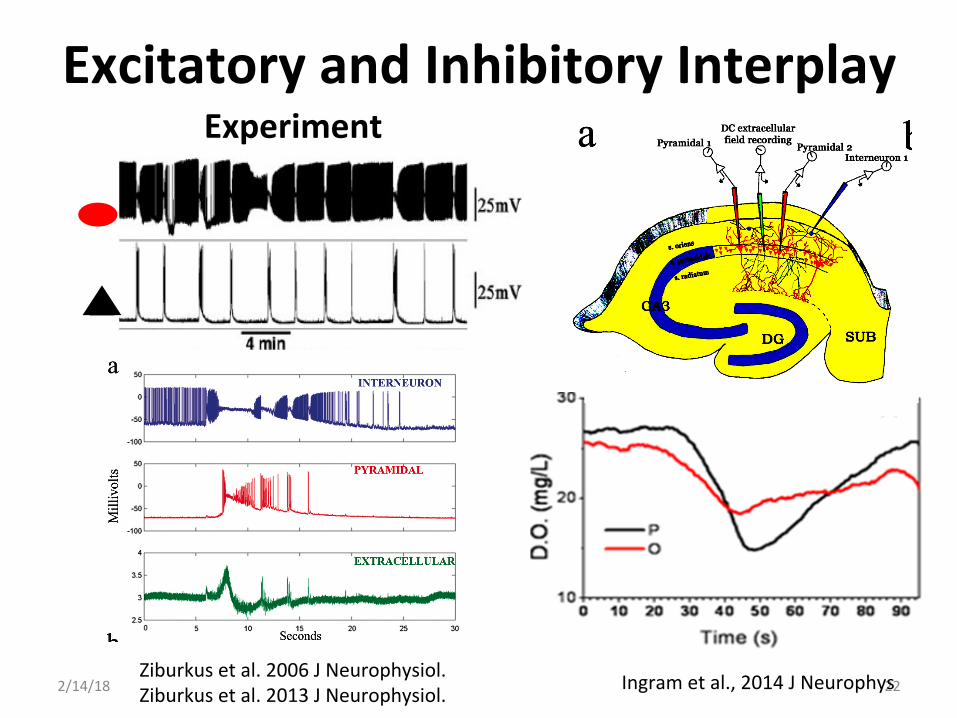
3)E&IInterplay=>O2Interplay
2/14/18
-60
20
V (m
V)
40 60 80 100 120 140 160 22
28
Time (s)
[O 2 ] o
(mg/
L)
11
Ingrametal.,2014JNeurophys
Ziburkusetal.2006JNeurophysiol.
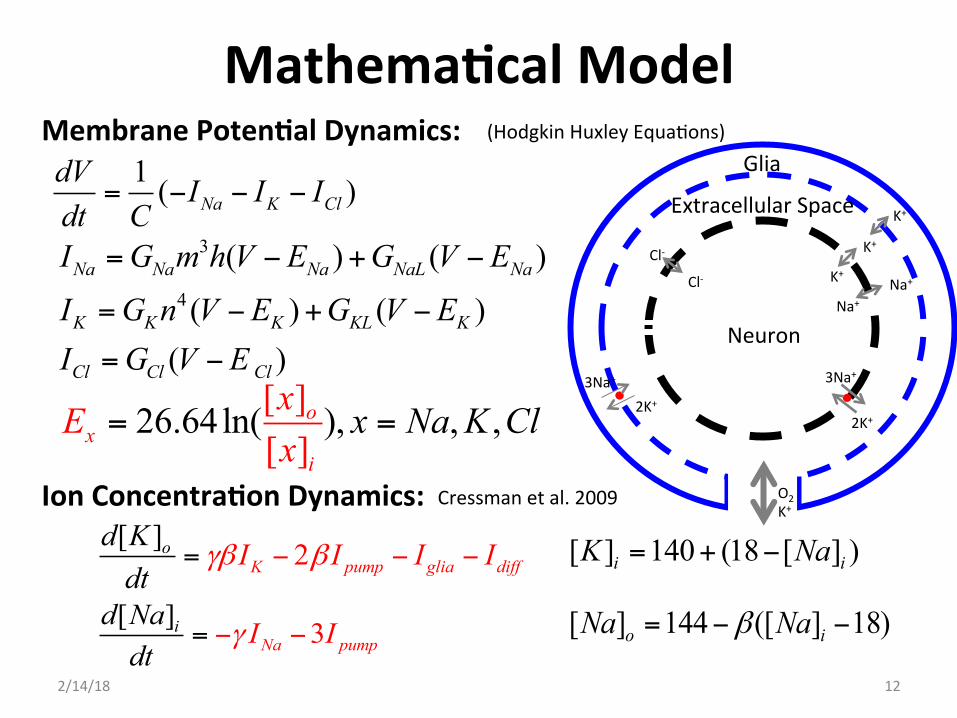
Mathema?calModel
IonConcentra?onDynamics:[ ] 2K pump glia diff
od Kd
I It
I Iγβ β− − −=
[ ] 3Na pumpid
tINa
dIγ− −=
MembranePoten?alDynamics:
[ ] 140 (18 [ ] )i iK Na= + −
[ ] 144 ([ ] 18)o iNa Naβ= − −
Cressmanetal.2009
2/14/18
(HodgkinHuxleyEqua(ons)
1 ( )Na K CldV I I Idt C
= − − −
[ ][
26.64ln( ), , ,]o
xi
xE
xx Na K Cl= =
3
4
( ) ( )
( ) ( )( )
Na Na Na NaL Na
K K K KL K
Cl Cl Cl
I G m h V E G V EI G n V E G V EI G V E
= − + −
= − + −
= −
12
Neuron
ExtracellularSpace
Glia
3Na+
2K+
O2K+
3Na+
2K+
Na+Cl- K+
K+
Na+
Cl-
K+
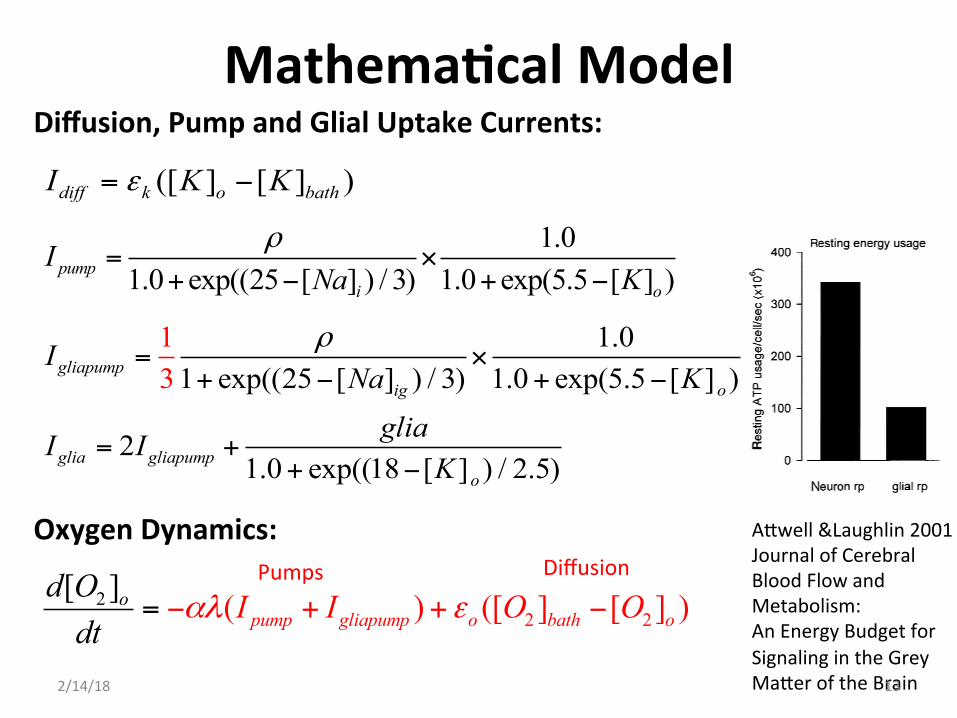
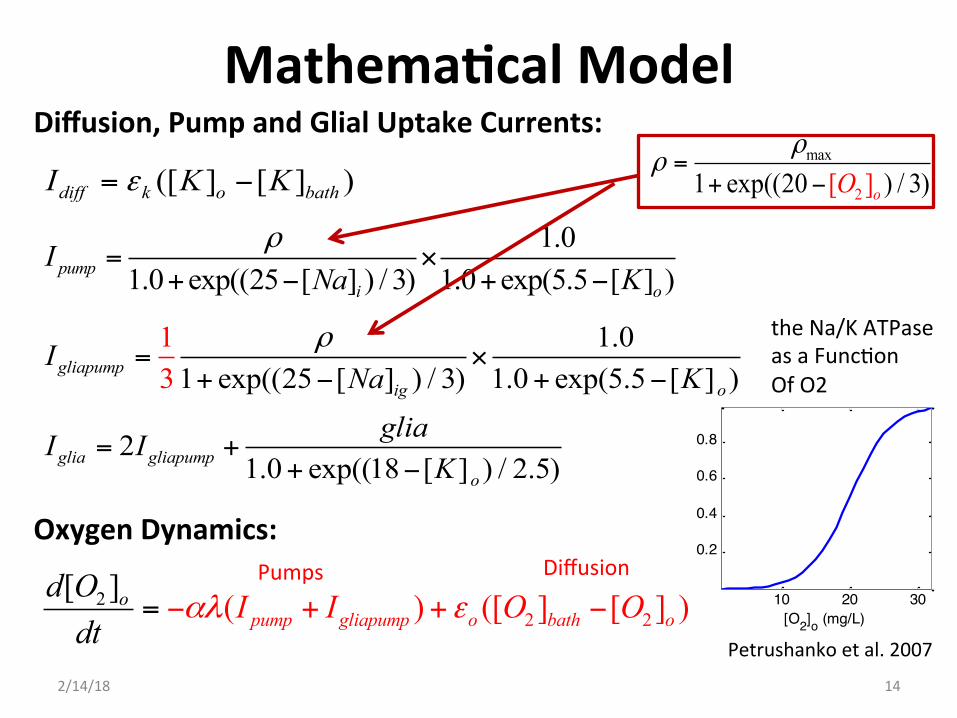
OxygenDynamics:
1.01.0 exp((25 [ ] ) / 3) 1.0 exp(5.5 [ ] )pump
i o
INa K
ρ= ×
+ − + −
1.01 exp((25 [ ] ) / 3) 1.0 exp(5.5 [ ] )
21.0 exp((18 [ ] ) / 2.5)
13gliapump
ig o
glia gliapumpo
INa K
gliaI I
K
ρ= ×
+ − + −
= ++ −
Diffusion,PumpandGlialUptakeCurrents:
([ ] [ ] )diff k o bathI K Kε= −
Ahwell&Laughlin2001JournalofCerebralBloodFlowandMetabolism:AnEnergyBudgetforSignalingintheGreyMaheroftheBrain
Mathema?calModel
2/14/18
2 22 ( ) ([[ ] [ ]] )pump gliapump o bath ood I O O
dtIO
αλ ε− −= + +
13
Pumps Diffusion
Mathema?calModel
OxygenDynamics:
2 22 ( ) ([[ ] [ ]] )pump gliapump o bath ood I O O
dtIO
αλ ε− −= + +
1.01.0 exp((25 [ ] ) / 3) 1.0 exp(5.5 [ ] )pump
i o
INa K
ρ= ×
+ − + −
1.01 exp((25 [ ] ) / 3) 1.0 exp(5.5 [ ] )
21.0 exp((18 [ ] ) / 2.5)
13gliapump
ig o
glia gliapumpo
INa K
gliaI I
K
ρ= ×
+ − + −
= ++ −
Diffusion,PumpandGlialUptakeCurrents:
([ ] [ ] )diff k o bathI K Kε= −max
21 exp((20 3)] /[ )oOρ
ρ =+ −
10 20 30
0.2
0.4
0.6
0.8
[O2]o (mg/L)
Petrushankoetal.2007
2/14/18 14
Pumps Diffusion
theNa/KATPaseasaFunc(onOfO2
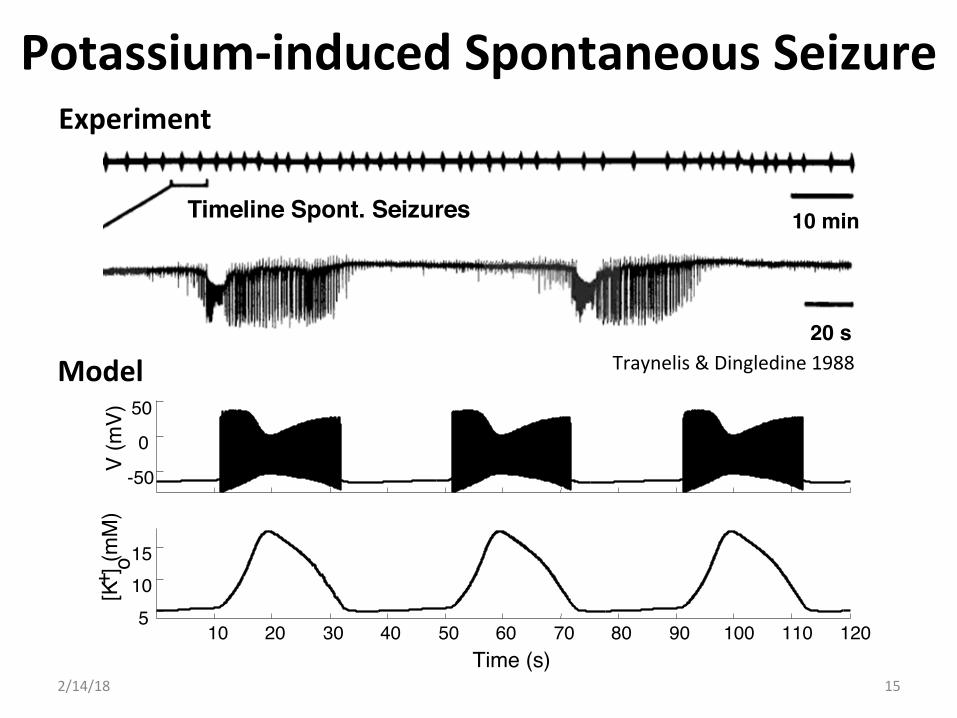
Potassium-inducedSpontaneousSeizure
2/14/18
-50
0
50
V (m
V)
10 20 30 40 50 60 70 80 90 100 110 120 5
10
15
[K + ]
o (mM
)
Time (s)
20 s
10 min Timeline Spont. Seizures
Traynelis&Dingledine1988
Experiment
Model
15
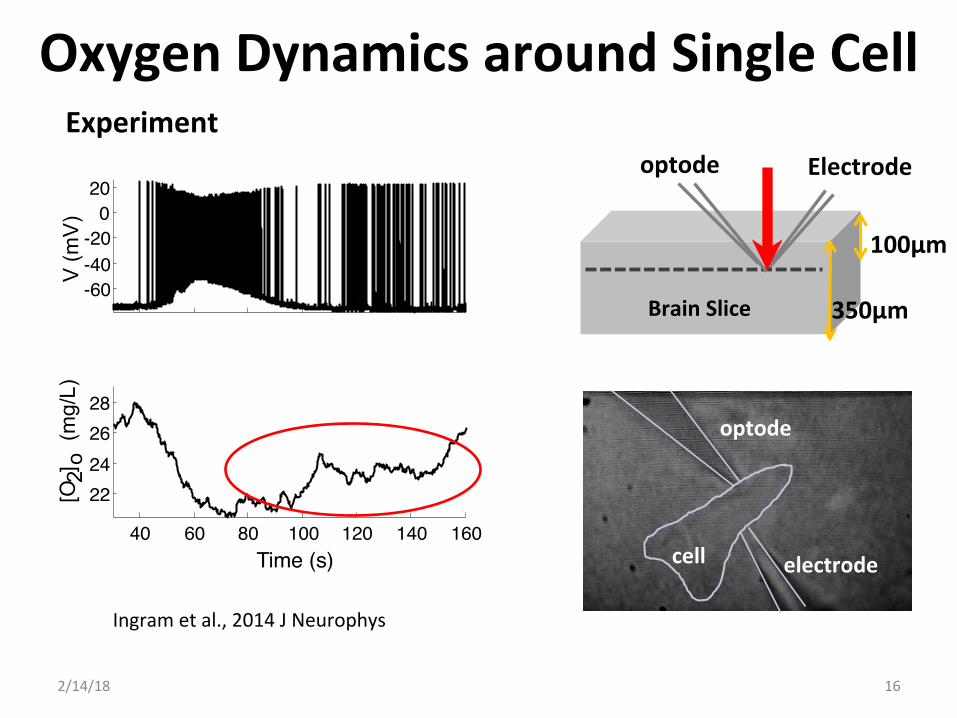
100µm
Electrode
350µmBrainSlice
optode
electrodecell
optode
OxygenDynamicsaroundSingleCellExperiment
2/14/18
-60 -40 -20
0 20
V (m
V)
40 60 80 100 120 140 160
22 24
26 28
Time (s)
[O 2 ]
o (m
g/L)
16
Ingrametal.,2014JNeurophys
Time (s)
-50
0
50
5
10
15
20 22 24 26 28
10 20 30 40 50 0.5
1 1.5
2 2.5
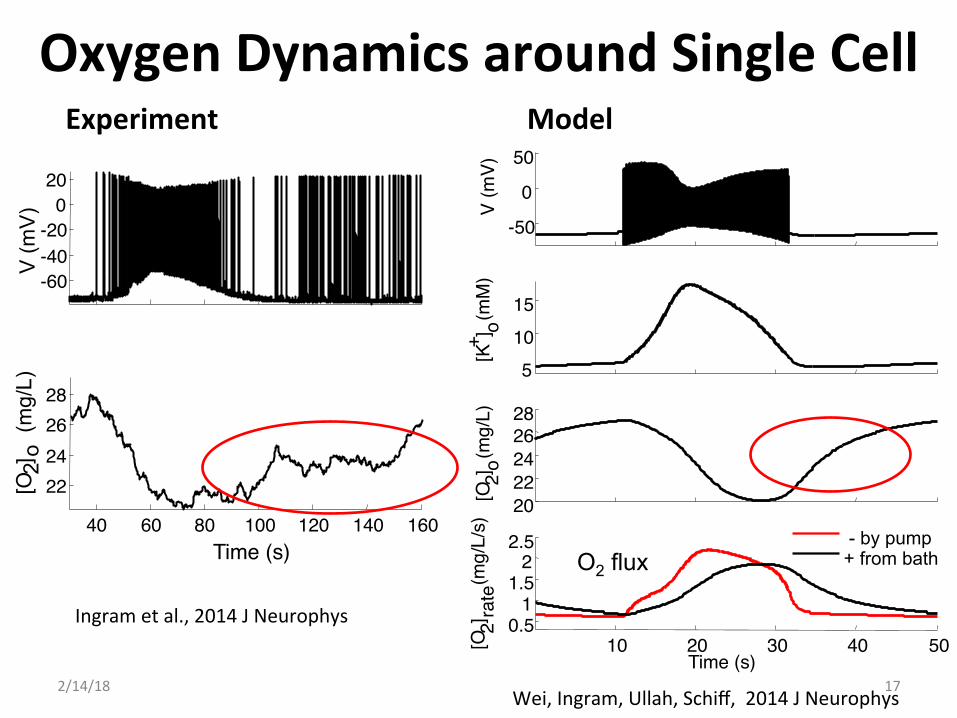
- by pump + from bath
V (m
V)
[K + ] o (m
M)
[O 2 ] o (m
g/L)
[O
2 ] rate
(mg/
L/s)
O2 flux
OxygenDynamicsaroundSingleCellExperiment
2/14/18
-60 -40 -20
0 20
V (m
V)
40 60 80 100 120 140 160
22 24
26 28
Time (s)
[O 2 ]
o (m
g/L)
Model
17
Ingrametal.,2014JNeurophys
Wei,Ingram,Ullah,Schiff,2014JNeurophys
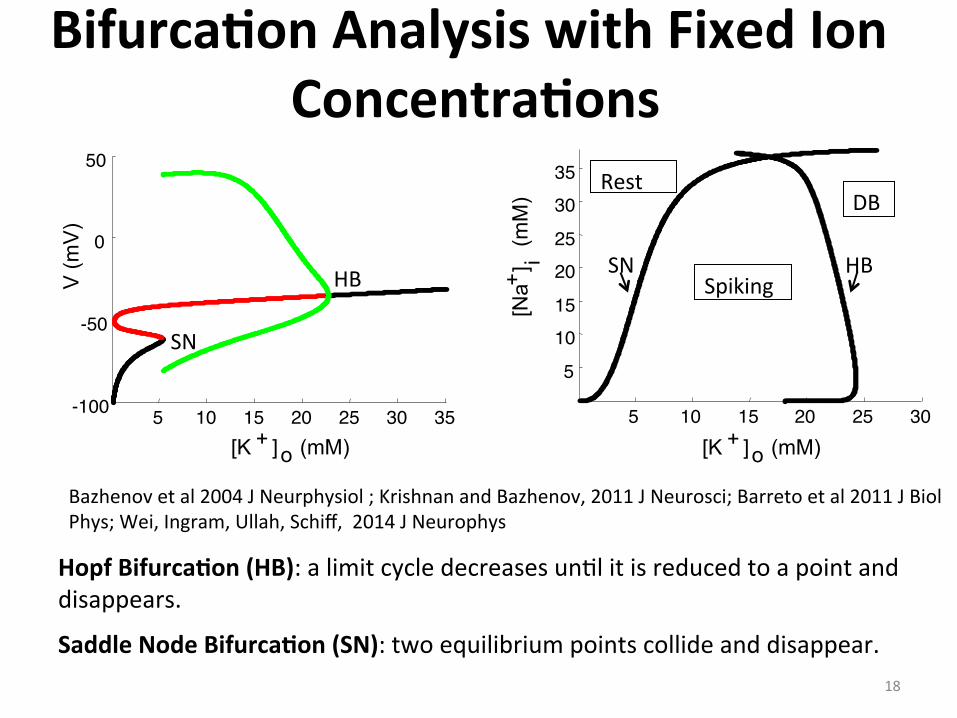
Bifurca?onAnalysiswithFixedIonConcentra?ons
18
5 10 15 20 25 30 35 -100
-50
0
50
HB
SN
5 10 15 20 25 30
5
10
15
20
25
30
35
HB SN
[K + ] o (mM)
V (m
V)
[Na +
] i (mM
)
[K + ] o (mM)
Rest
Spiking
DB
HopfBifurca?on(HB):alimitcycledecreasesun(litisreducedtoapointanddisappears.
SaddleNodeBifurca?on(SN):twoequilibriumpointscollideanddisappear.
Bazhenovetal2004JNeurphysiol;KrishnanandBazhenov,2011JNeurosci;Barretoetal2011JBiolPhys;Wei,Ingram,Ullah,Schiff,2014JNeurophys
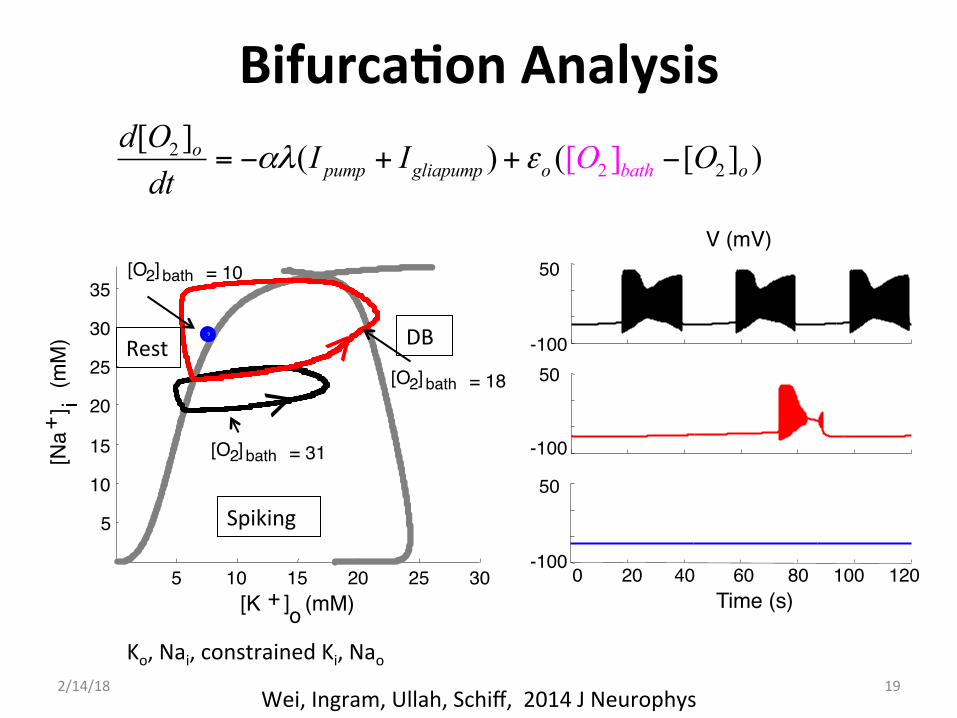
Bifurca?onAnalysis
2/14/18
-100
50
-100
50
0 20 40 60 80 100 120 -100
50
Time (s)
[Na +
] (m
M)
i
V (mV)
5 10 15 20 25 30
o [K + ] (mM)
5
10
15
20
25
30
35
[O 2 ] bath = 31
[O 2 ] bath = 18
[O 2 ] bath = 10
o [K + ] (mM)
>
22 2[( ) ( [ ] )[ ]]
pump gliapump o ath obod OOI
dtIO
αλ ε− −= + +
Rest
Spiking
DB
19Wei,Ingram,Ullah,Schiff,2014JNeurophys
Ko,Nai,constrainedKi,Nao
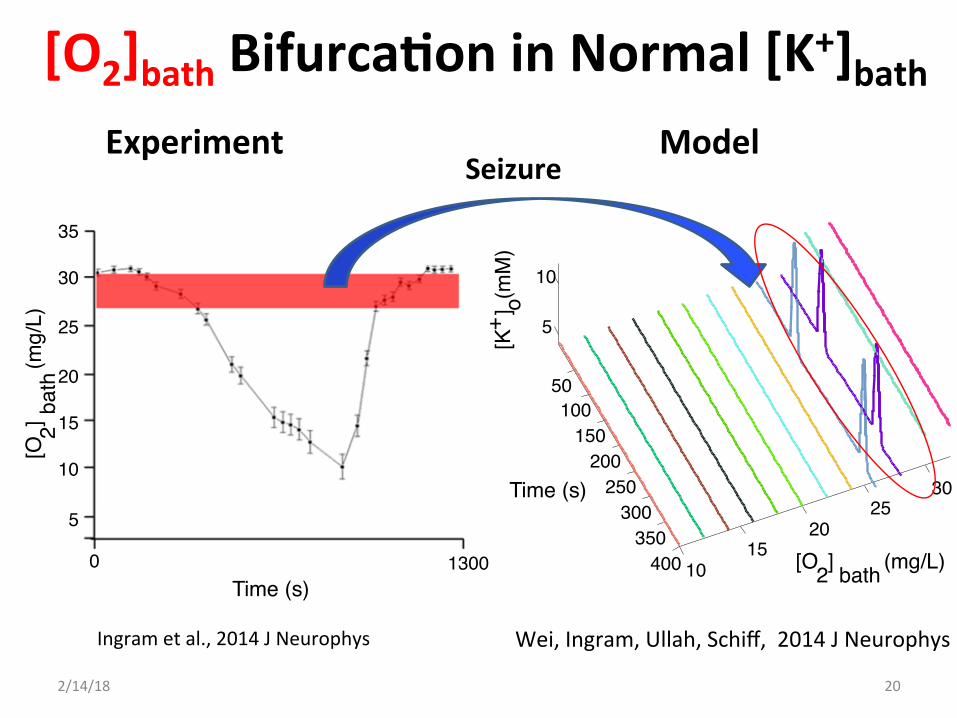
Time (s) 1300 0
5
[O 2 ] ba
th (m
g/L)
15
10
25
20
35
30
Experiment Model
[O2]bathBifurca?oninNormal[K+]bath
Seizure
2/14/18
[O 2 ] bath (mg/L)
Time (s) [K
+ ] o (mM
)
50 100
150 200
250 300
350 400 10
15 20
25 30
5
10
20
Ingrametal.,2014JNeurophys Wei,Ingram,Ullah,Schiff,2014JNeurophys
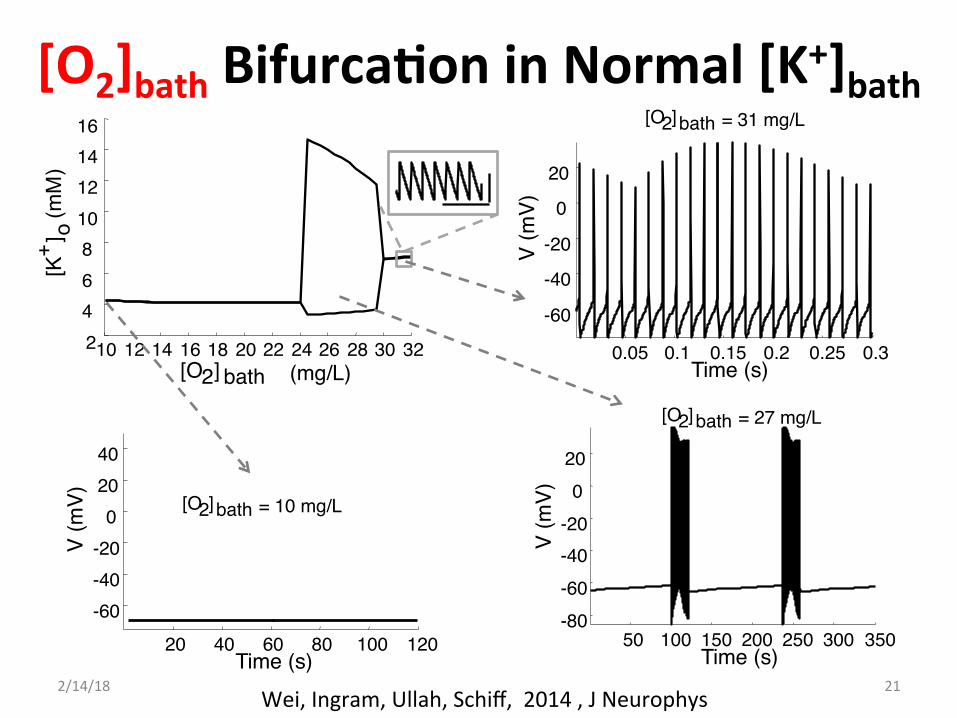
[O2]bathBifurca?oninNormal[K+]bath
2/14/18
0.05 0.1 0.15 0.2 0.25 0.3
-60
-40
-20
0
20
V (m
V)
Time (s)
[O 2 ] bath = 31 mg/L
10 12 14 16 18 20 22 24 26 28 30 32 2
4 6
8 10
12 14 16
[O 2 ] bath (mg/L)
[K + ] o
(mM
)
20 40 60 80 100 120
-60
-40
-20
0
20
40
V (m
V)
Time (s)
[O 2 ] bath = 10 mg/L
50 100 150 200 250 300 350 -80
-60
-40
-20
0
20
V (m
V)
Time (s)
[O 2 ] bath = 27 mg/L
21Wei,Ingram,Ullah,Schiff,2014,JNeurophys
Experiment
2/14/18
ExcitatoryandInhibitoryInterplay
22Ziburkusetal.2006JNeurophysiol.Ziburkusetal.2013JNeurophysiol.
Ingrametal.,2014JNeurophys
2/14/18
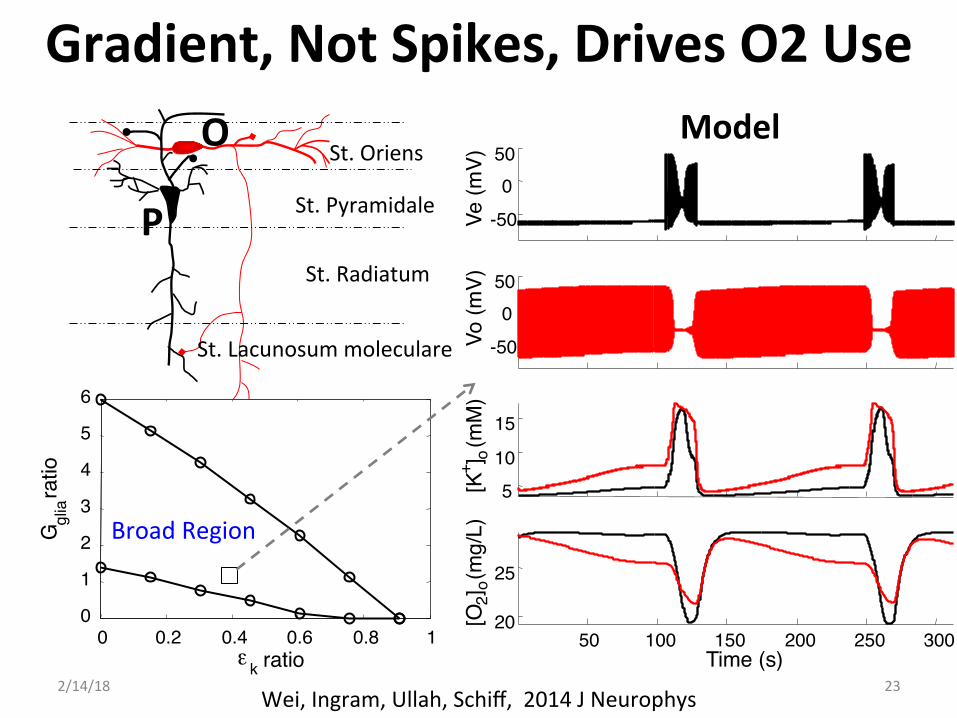
OSt.Oriens
St.Pyramidale
St.Radiatum
St.Lacunosummoleculare
P
ε k ratio
G gl
ia ra
tio
0 0.2 0.4 0.6 0.8 1 0
1
2
3
4
5
6
BroadRegion
Time (s)
Ve (m
V)
Vo (m
V)
[K + ] o
(mM
) [O
2 ] o (m
g/L)
-50
0
50
-50
0
50
5
10
15
50 100 150 200 250 300 20
25
Gradient,NotSpikes,DrivesO2UseModel
23Wei,Ingram,Ullah,Schiff,2014JNeurophys
Time (s)
-50
0
50
5
10
15
20 22 24 26 28
10 20 30 40 50 0.5
1 1.5
2 2.5
- by pump + from bath
V (m
V)
[K + ] o (m
M)
[O 2 ] o (m
g/L)
[O
2 ] rate
(mg/
L/s)
[O 2 ] bath
(mg/L)
Time (s)
[K + ] o (m
M)
100
200
300
400 10 15
20 25
30
5
10
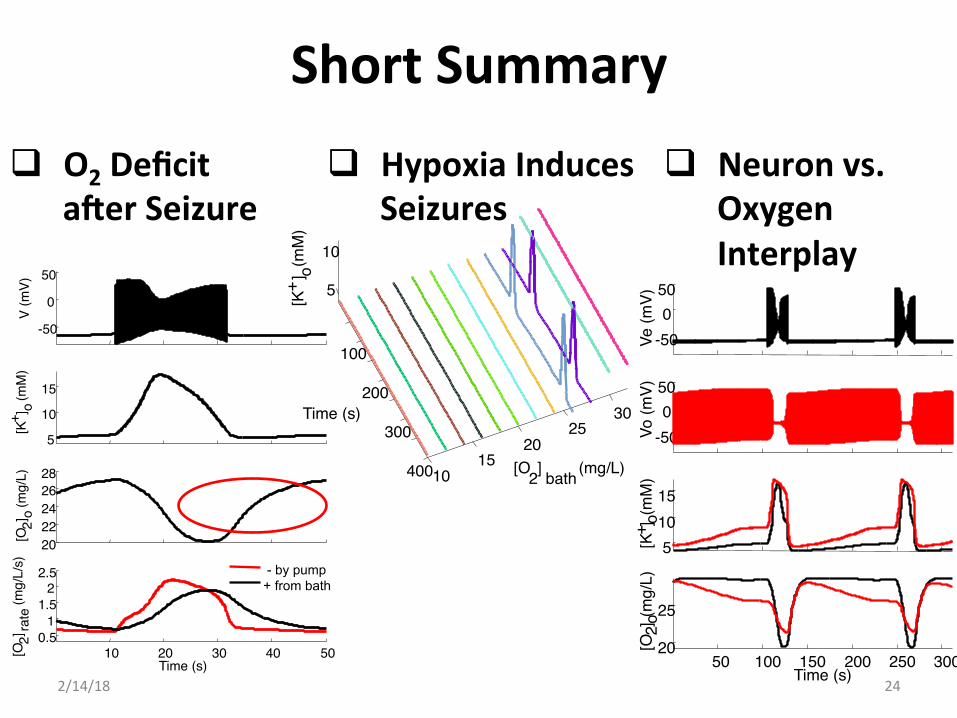
ShortSummaryq O2Deficit
aherSeizureq Neuronvs.
OxygenInterplay
q HypoxiaInducesSeizures
Time (s) Ve
(mV)
Vo
(mV)
[K
+ ] o (
mM
) [O
2 ] o (m
g/L)
-50 0
50
-50 0
50
5 10 15
50 100 150 200 250 300 20
25
2/14/18 24
PartII:OxygenandSpreadingDepression
2/14/18 25
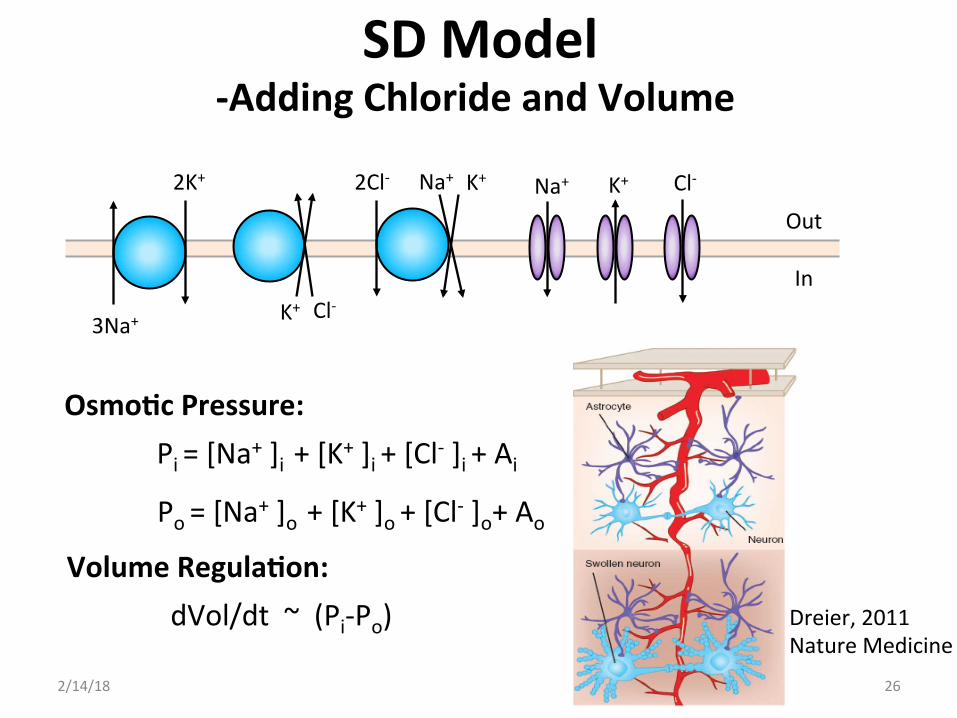
SDModel-AddingChlorideandVolume
2/14/18
Pi=[Na+]i+[K+]i+[Cl-]i+Ai
Po=[Na+]o+[K+]o+[Cl-]o+Ao
Osmo?cPressure:
VolumeRegula?on:
dVol/dt~(Pi-Po) Dreier,2011NatureMedicine
26
OutIn
2K+
3Na+K+ Cl-
K+2Cl- Na+ Na+ K+ Cl-
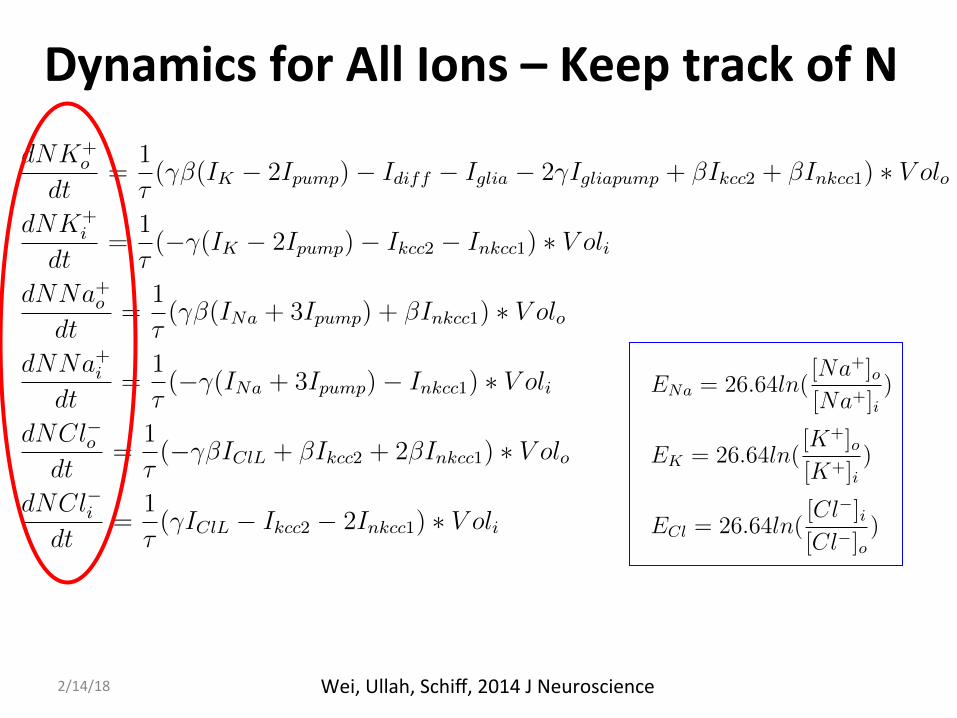
DynamicsforAllIons–KeeptrackofN
The activation and inactivation variables m, h, and n vary between 0 and 1 and represent the
fraction of ion selective channels in the closed and open states. The parameters ↵m, �m, ↵h, �h,
↵n, �n are opening and closing rates of the ion channel state transitions that are dependent on
V . The equations of these rates are from a pyramidal cell model31, originally derived from a
model of hippocampal neurons32, shown as follows:
↵m = 0.32(54 + V )/(1� exp(�(V + 54)/4))
�m = 0.28(V + 27)/(exp((V + 27)/5)� 1)
↵h = 0.128exp(�(50 + V )/18)
�h = 4/(1 + exp(�(V + 27)/5))
↵n = 0.032(V + 52)/(1� exp(�(V + 52)/5))
�n = 0.5exp(�(57 + V )/40).
(9)
The reversal potentials of Na+ (ENa) , K+ (EK ) and Cl� (ECl) are given by Nernst equations:
ENa = 26.64ln([Na+]o[Na+]i
)
EK = 26.64ln([K+]o[K+]i
)
ECl = 26.64ln([Cl�]i[Cl�]o
)
(10)
where [.]i and [.]o represent concentrations inside and outside the cell, respectively. The units
and description of all parameters are summarized in Table 1.
Ion concentration dynamics. Unlike the Hodgkin-Huxley equations where various ion concen-
trations are fixed, we have incorporated potassium, sodium, and chloride ion concentration
dynamics. The ion concentrations are calculated by the ion number over the volume within the
21
compartment, such as [.]i = Ni/V oli, [.]o = No/V olo.
dNK+o
dt=
1
⌧(��(IK � 2Ipump)� Idiff � Iglia � 2�Igliapump + �Ikcc2 + �Inkcc1) ⇤ V olo
dNK+i
dt=
1
⌧(��(IK � 2Ipump)� Ikcc2 � Inkcc1) ⇤ V oli
dNNa+odt
=1
⌧(��(INa + 3Ipump) + �Inkcc1) ⇤ V olo
dNNa+idt
=1
⌧(��(INa + 3Ipump)� Inkcc1) ⇤ V oli
dNCl�odt
=1
⌧(���IClL + �Ikcc2 + 2�Inkcc1) ⇤ V olo
dNCl�idt
=1
⌧(�IClL � Ikcc2 � 2Inkcc1) ⇤ V oli
(11)
where ⌧ = 1000 is used to convert second to millisecond. � = V oli/V olo is the ratio of intra-
/extracellular volume. � = S/(FV oli) is a conversion factor from the current unit (µA/cm2) into
the concentration unit (mM/s), where S is the surface area of the cell, and F is the Faraday
constant.
The neuronal Na/K pump current (Ipump), glial Na/K pump current (Igliapump), glial buffering
current (Iglia), and potassium diffusion current (Idiff ) are modified based on our previous work7.
The Na/K pump strength is modified by 1/3 for glia in our model because the relative resting
energy consumption in neurons versus glia is about 3:133.
Ipump =⇢F1([O2]o)
�
1.0
1.0 + exp((25� [Na+]i)/3)⇥ 1.0
1.0 + exp(3.5� [K+]o)
Igliapump =1
3
⇢F1([O2]o)
�
1.0
1.0 + exp((25� [Na+]gi)/3)⇥ 1.0
1.0 + exp(3.5� [K+]o)
Iglia =GgliaF2([O2]bath)
1.0 + exp((18� [K+]o)/2.5)
Idiff = ✏kF2([O2]bath)F3(�)⇥ ([K+]o � [K+]bath)
(12)
where ⇢, Gglia, ✏k, and [K+]bath represent maximum pump strength, maximum glial uptake
strength, potassium diffusion coefficient, and bath potassium concentration, respectively. Here,
22
Wei,Ullah,Schiff,2014JNeuroscience2/14/18
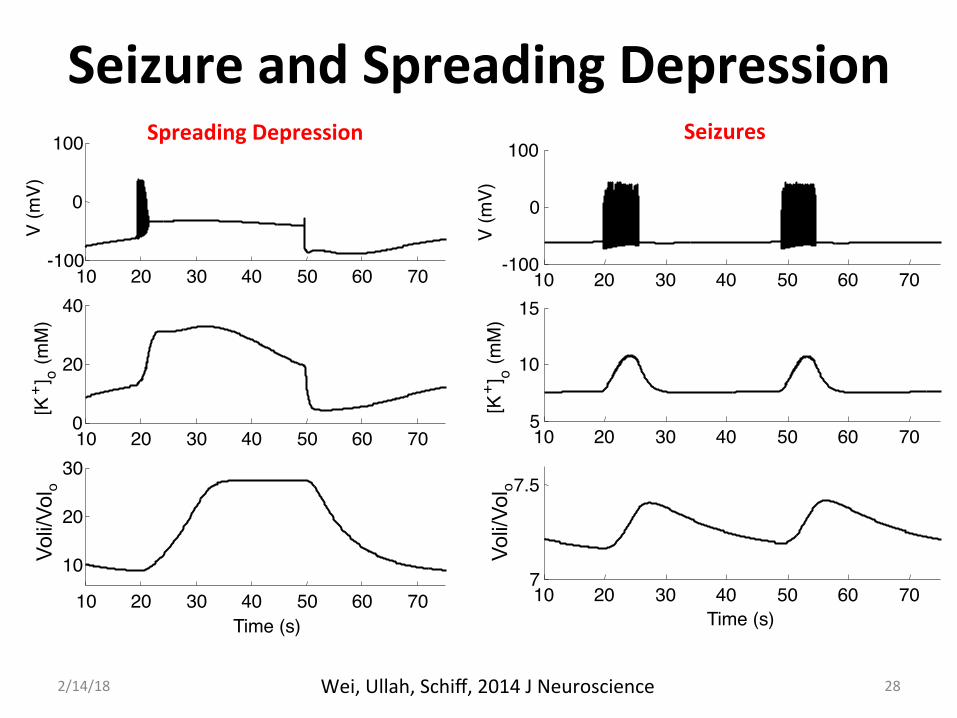
SeizureandSpreadingDepression
2/14/18
10 20 30 40 50 60 70 -100
0
100
V (m
V)
10 20 30 40 50 60 70 5
10
15
[K + ] o (m
M)
10 20 30 40 50 60 70 7
7.5
Time (s)
10 20 30 40 50 60 70 -100
0
100
V (m
V)
10 20 30 40 50 60 70 0
20
40
[K + ] o (
mM
)
10 20 30 40 50 60 70 10
20
30
Time (s)
SeizuresSpreadingDepression
Voli/
Vol o
Voli/
Vol o
28Wei,Ullah,Schiff,2014JNeuroscience

2/14/18 29
50 100 150 -100
50 V
(mV)
50 100 150 10 20 30
β
50 100 150 10
30
o [K
+ ] (m
M)
50 100 150 120
130 140
[K + ] i (
mM
)
50 100 150 50
150
[Na + ] o (m
M)
50 100 150 20
30
[Na + ] i (m
M)
50 100 150 50
100
[Cl - ] o (m
M)
50 100 150 10 15 20
[Cl - ] i (m
M)
50 100 150 20
25
[O 2 ] o (m
g/L)
Time (s) 50 100 150
5
10
I pum
p (uA/
cm 2 )
Time (s)
ModelVariablesduringSD
Wei,Ullah,Schiff,2014JNeuroscience
20 40 60 80 100 -80
20
V (m
V)
20 40 60 80 100
20 40 60
[K + ] o (m
M)
20 40 60 80 100 10 20 30
β
Time (s)
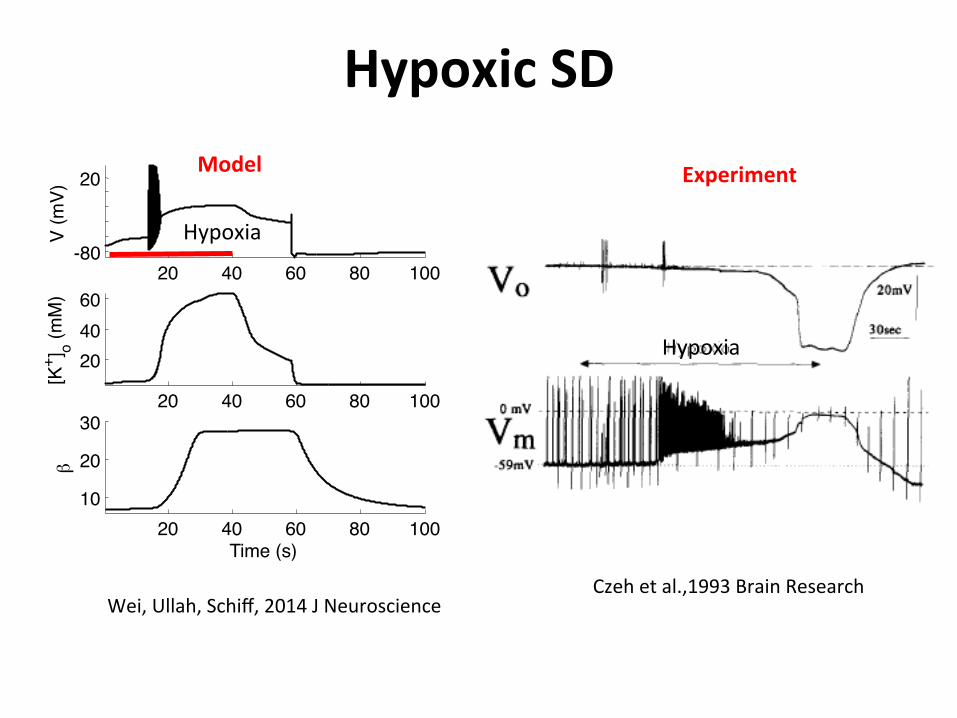
HypoxicSDModel
Hypoxia
Hypoxia
Czehetal.,1993BrainResearchWei,Ullah,Schiff,2014JNeuroscience
Experiment
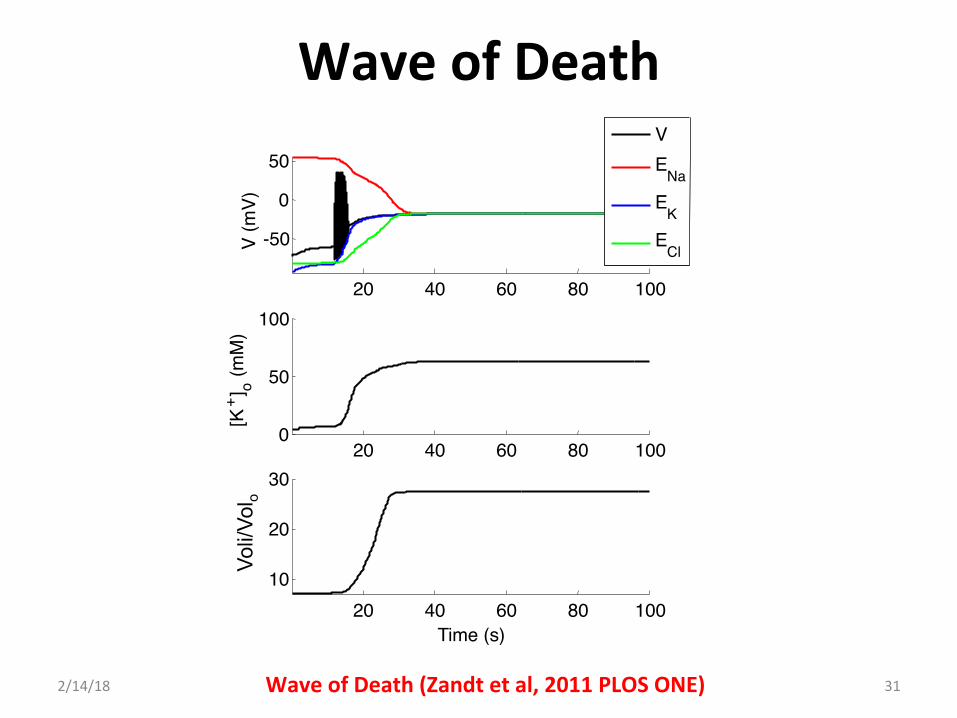
WaveofDeath
2/14/18
Voli/
Vol o
20 40 60 80 100
-50 0
50
V (m
V)
V E Na E K E Cl
20 40 60 80 100 0
50
100
[K + ] o (
mM
)
20 40 60 80 100 10
20
30
Time (s)
WaveofDeath(Zandtetal,2011PLOSONE) 31
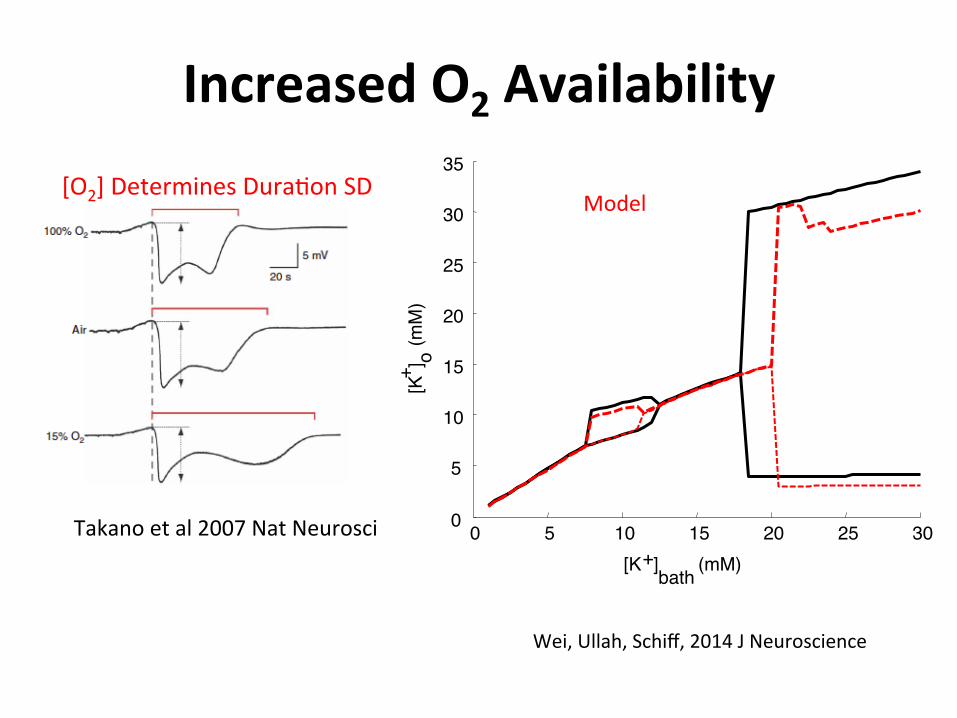
IncreasedO2Availability[O2]DeterminesDura(onSD
Takanoetal2007NatNeurosci 0 5 10 15 20 25 30
5
10
15
20
25
30
35
0
[K + ] o (m
M)
[K + ] bath (mM)
Model
Wei,Ullah,Schiff,2014JNeuroscience
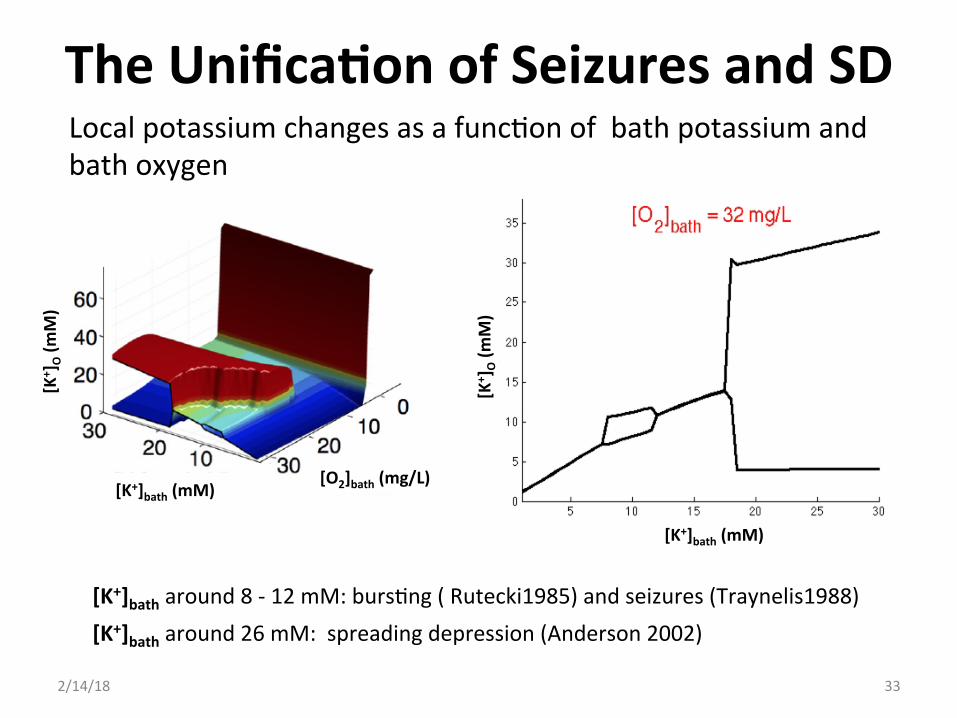
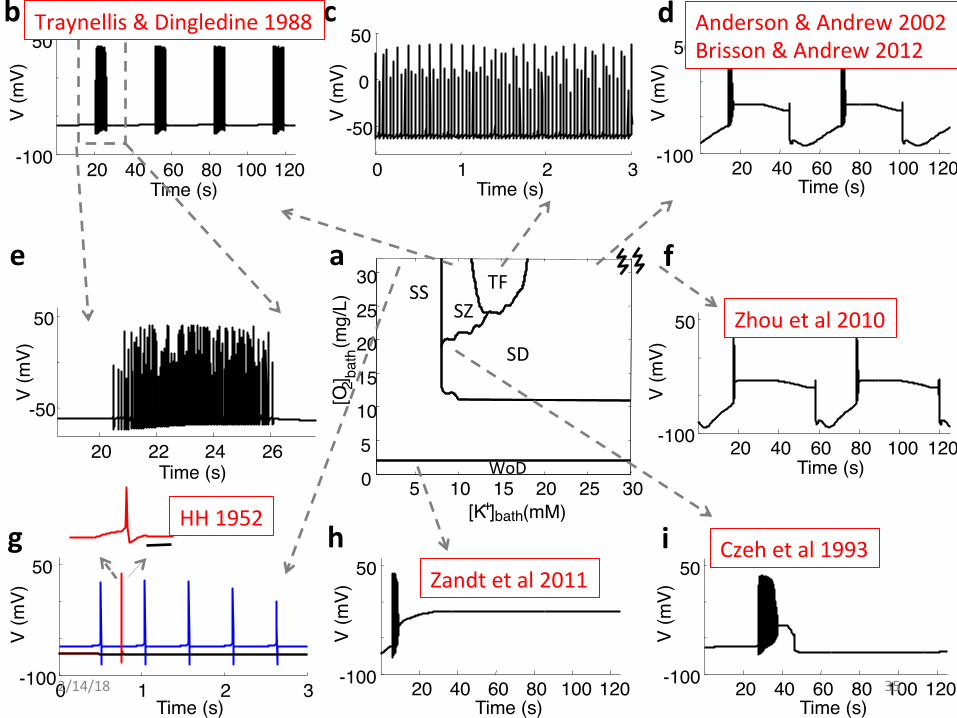
TheUnifica?onofSeizuresandSD
2/14/18
[K+]bath(mM)
[K+ ]O(m
M)
Localpotassiumchangesasafunc(onofbathpotassiumandbathoxygen
[K+]batharound8-12mM:burs(ng(Rutecki1985)andseizures(Traynelis1988)
[K+]batharound26mM:spreadingdepression(Anderson2002)
33
[K+ ]O(m
M)
[K+]bath(mM)[O2]bath(mg/L)
0 5 10 15 20 25 30 0
5
10
15
20
25
30
35
[K + ] o (m
M)
[K + ] bath (mg/L) -100 -50 0 50 -150
-100
-50
0
I Na
V (mV)
-100 -50 0 50 0
50
100
150
V (mV)
HH GHK ,P/G=3e-6 GHK ,P/G=2e-6
a" b" c"
(uA/
cm 2 )
I K (u
A/cm
2 )
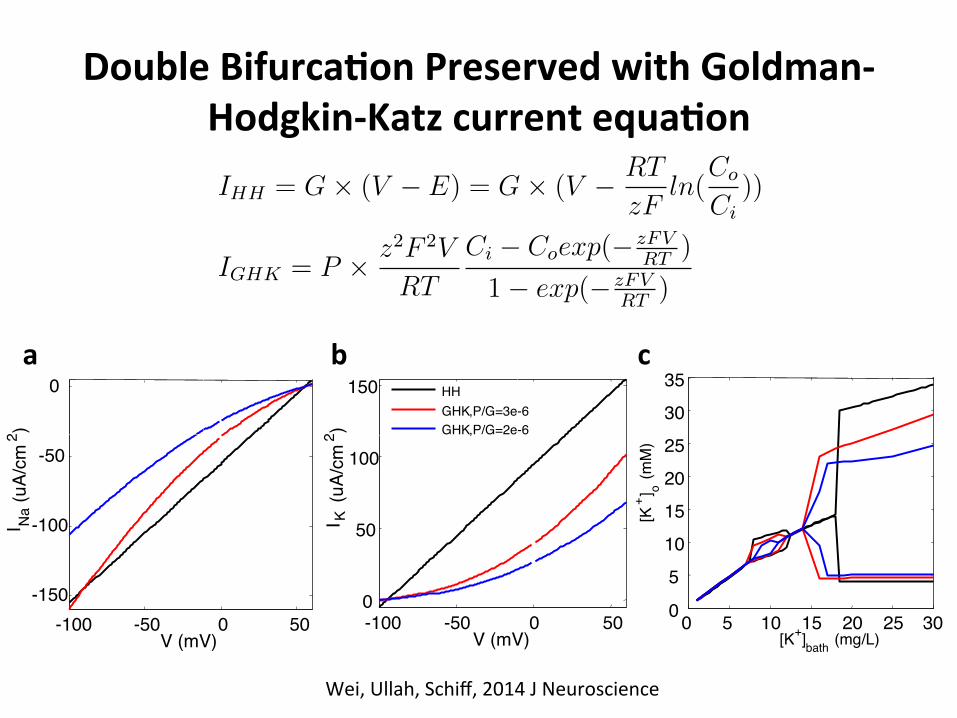
DoubleBifurca?onPreservedwithGoldman-Hodgkin-Katzcurrentequa?on
The bifurcation analysis of the simplified model were performed using XPPAUT42.
Goldman-Hodgkin-Katz (GHK) model. The Hodgkin-Huxley model uses linear relationships
for current and voltage (Ohms law). Nevertheless, it is well known that the actual current flow-
ing through ion-selective permeability channels in membranes is nonlinear and rectifying43,
and can be more accurately accounted for using the Goldman-Hodgkin-Katz equations44. The
equations modeling the current due to the flow of a given ion across the membrane given by the
Hodgkin-Huxley and GHK formalism respectively are:
IHH = G⇥ (V � E) = G⇥ (V � RT
zFln(
Co
Ci
))
IGHK = P ⇥ z2F 2V
RT
Ci � Coexp(� zFVRT
)
1� exp(� zFVRT
)
(21)
where E,R, T, z, and F , represent the Nernst potential, gas constant, absolute temperature, ion
valence, and Faraday’s constant respectively. Ci and Co are the concentrations of a specific ion
outside and inside the cell. P is the permeability of the membrane to the flow of a specific ion,
which depends only on the types and numbers of ion channels present in the membrane. G is
the ion conductance that measures the ability of the membrane to carry electrical current. The
detailed calculations for the conversion between P and G are as follows:
1) G (in units of S/m2), is equal to �/L, where � (in units of S/m) is electrical conductivity and
L (in units of m) is thickness of the cell membrane.
2) P (in units of m/s), is equal to D/L, where D (in units of m2/s) is diffusion coefficient.
3) The relation between ionic mobility µ (in units of m2/(Vs)) and electrical conductivity �
(in units of S/m) is � = neµ, where n (in units of m�3) is the number density of monovalent
ions and e is the electronic charge. For any substance, n can be expressed in terms of molar
28
Wei,Ullah,Schiff,2014JNeuroscience
20 22 24 26
-50
50
V (m
V)
Time (s)
20 40 60 80 100 120 -100
50 V
(mV)
Time (s) 20 40 60 80 100 120 -100
50
V (m
V)
Time (s)
20 40 60 80 100 120 -100
50
V (m
V)
Time (s) 20 40 60 80 100 120 -100
50
V (m
V)
Time (s)
b c d
g h i
e a f
5 10 15 20 25 30 0
5
10
15
20
25
30
[O 2 ] ba
th (m
g/L)
[K + ] (mM) bath
SZ
SD
WoD
SS TF
0 1 2 3
-50
0
50
V (m
V)
Time (s)
20 40 60 80 100 120 -100
50
V (m
V)
Time (s)
0 1 2 3 -100
50
V (m
V)
Time (s)
Traynellis&Dingledine1988 Anderson&Andrew2002Brisson&Andrew2012
Zhouetal2010
Czehetal1993Zandtetal2011
HH1952
2/14/18 35

Acknowledgements
Justin M. Ingram Steven J. Schiff Ghanim Ullah
US-GermanCollabora?veResearchinComputa?onalNeuroscience(CRCNS)
2/14/18 36Code Archive: https://scholarsphere.psu.edu/!

2/14/18 37
Related Documents