Department of Quantitative Social Science The role of non-cognitive and cognitive skills, behavioural and educational outcomes in accounting for the intergenerational transmission of worklessness Lindsey Macmillan DoQSS Working Paper No. 13-01 January 2013

Welcome message from author
This document is posted to help you gain knowledge. Please leave a comment to let me know what you think about it! Share it to your friends and learn new things together.
Transcript

Department of Quantitative Social Science
The role of non-cognitive and cognitive skills, behavioural and educational outcomes in accounting for the intergenerational transmission of worklessness
Lindsey Macmillan
DoQSS Working Paper No. 13-01
January 2013

Disclaimer
Any opinions expressed here are those of the author(s) and not those of the Institute of Education. Research published in this series may include views on policy, but the institute itself takes no institutional policy positions.
DoQSS Workings Papers often represent preliminary work and are circulated to encourage discussion. Citation of such a paper should account for its provisional character. A revised version may be available directly from the author.
Department of Quantitative Social Science, Institute of Education, University of London
20 Bedford Way, London WC1H 0AL, UK

3
The role of non-cognitive and cognitive skills, behavioural and educational outcomes in accounting for the intergenerational transmission of worklessness
Lindsey Macmillan1
Abstract
Previous work has shown that there is a significant intergenerational correlation of worklessness for the UK which varies across local labour markets (Macmillan, 2011). Using a decomposition from the intergenerational mobility literature (Blanden et. al, 2007), this research is the first to consider the drivers of this transmission. I consider the role of four sets of characteristics of the son in childhood; his non-cognitive skills, cognition, behavioural outcomes and educational attainment, to assess which characteristics are important predictors of later workless spells and whether those characteristics are associated with growing up with a workless father. The wide range of characteristics can only account for 12% of the intergenerational transmission, with the vast majority remaining unaccounted for. While cognition and education dominate the intergenerational transmission of incomes, non-cognitive skills and behavioural outcomes play a more important role in the intergenerational transmission of worklessness. Many of the characteristics considered become increasingly important predictors of future worklessness as the unemployment rate in the local labour market increases. This descriptive analysis suggests that there are benefits to improving the soft skills of the most disadvantaged children, alongside their attainment, to ensure a successful connection with the labour market in adulthood.
JEL classification: J62, J64, J13, J31
Keywords: Intergenerational mobility, unemployment, children, skills
1 Department of Quantitative Social Science, Institute of Education, University of London (L.Macmillan
@ioe.ac.uk)
Acknowledgements I would like to thank Paul Gregg, Simon Burgess and Kjell Salvanes for their insightful comments. This work was
funded by the ESRC as part of an ESRC studentship.
4
1. Introduction
There has been very little research into the intergenerational transmission of worklessness in
the UK despite increasing interest in the topic. Frequent references are made to the ‘curse of
intergenerational worklessness’2 by politicians and this has been used to justify large-scale
welfare reforms. Recent work by Macmillan (2011) found that in the UK, sons with workless
fathers spent an average of 8 to 11% more time out of work from 16-23 than sons with
employed fathers. This correlation varied considerably by the local labour market experience
of the son. Sons with workless fathers in local labour markets with high unemployment spent
over 25% more time out of work than sons with employed fathers in the same local labour
market. In contrast, in low unemployment local labour markets, sons’ workless experiences
were not associated with their father’s workless experiences. Gregg and Macmillan (2012)
used a comparative study of the UK and the US to examine the role of intergenerational
welfare dependency in this correlation. They found that the intergenerational relationships
were identical in both settings despite the large differences in access to welfare in the two
countries. The evidence suggests that intergenerational welfare dependency is therefore
unlikely to be the main driver of this relationship. This research explores for the first time
which childhood characteristics are important mechanisms in transmitting worklessness
across generations using a methodology introduced in the intergenerational mobility literature
by Blanden, Gregg and Macmillan (2007).
The model of Solon (2004) presents a theoretical framework for thinking about the
intergenerational transmission. This model asserts that human capital is the principle
transmitter of incomes across generations. In the context of worklessness, workless parents
will have less money to invest in their child’s human capital and may find it harder to get the
same returns to these investments due to the strains of worklessness. This model, along with
work on labour market discrimination, suggests that individuals may also invest less in
education and skills if they perceive that they have less chance of being employed in
adulthood (List and Rasul, 2010, Coates and Loury, 1993). While Gregg and Macmillan
(2012) argue that there is unlikely to be a culture of dependency passed through the
endowment of a taste for welfare, there may be scope for a genetic transmission of ability and
other non-cognitive skills. There has been an increasing body of literature in the past decade,
driven by the work of Nobel Laureate James Heckman, into the role of not only cognition but
2 http://www.dwp.gov.uk/newsroom/press-releases/2010/may-2010/dwp070-10-270510.shtml (accessed 15
th
May 2012).

5
also non-cognitive skills and behaviours in predicting later life outcomes for individuals. This
research builds on this work by exploring the role of non-cognitive and cognitive skills and
later behavioural and educational outcomes in accounting for the intergenerational
transmission of worklessness using the British Cohort Study (BCS). This work does not
attempt to decipher between the role of genetics, resources and capabilities in the
transmission, focusing solely on the characteristics of the son.
I implement a two-stage decomposition introduced by Blanden et. al. (2007) to assess
the role of the four sets of characteristics in driving the intergenerational transmission of
worklessness. For potential mediators to play a role in this transmission they must not only
predict the future work experiences of individuals but also be related to growing up with a
workless father. There is value in considering both stages of this relationship. In the current
climate of rising youth unemployment it is important to understand the important childhood
predictors of later unemployment. Unlike in the standard returns to schooling literature, there
has been very little work that focuses on which characteristics may be important in this
context. In terms of understanding why people are more at risk of experiencing youth
unemployment, this is a first step in this process while recognising that this is not a causal
analysis. For the other stage of the decomposition, estimating the association between fathers’
worklessness and the sons’ characteristics, there has been little work to date that considers
whether the characteristics that are important in predicting future workless spells are
associated with having a workless father in childhood. Schoon et. al. (2012) found strong
associations between parental worklessness and early cognitive, academic and behavioural
development in the Millennium Cohort Study (MCS).
When these two stages are combined, the decomposition provides a tool to assess how
much of the observed intergenerational correlation can be accounted for by the observable
characteristics of the child. Understanding the mechanisms that underpin the
intergenerational relationship is important for informing future policy debates. Heckman,
Stixrud and Urzuac (2006) illustrated the relative importance of non-cognitive skills and
behaviours for predicting future work experience compared to cognition and education in the
US. As in Heckman et. al. (2006) and Blanden et. al. (2007), the model is built sequentially,
based on the timing of earlier skills and later outcomes, to gain a picture of both the
importance of early non-cognitive and cognitive skills alone and their role in feeding into
later behavioural and educational outcomes. There is a great deal of heterogeneity in the
transmission of worklessness with much of the intergenerational correlation remaining
unaccounted for (88%). Non-cognitive skills along with behavioural outcomes dominate

6
cognition and educational attainment in accounting for this transmission. These
characteristics also play a more important role in the transmission of worklessness across
generations than they do in the corresponding literature on the transmission of incomes.
Given the earlier finding that the intergenerational correlation varies considerably by
local labour market conditions (Macmillan, 2011), this research also asks which of the
characteristics are important in driving this increasing intergenerational correlation as
unemployment rates increases. It may be the case that this trend is driven by more
disadvantaged workers with a lower skill set being the last in and first out of jobs as labour
market conditions change, as is found in the US and the UK in the case of minority groups
(Wilson, 2009, Freeman and Rodgers, 2000, Li, 2012, List and Rasul, 2010). If this were the
case, we would expect to see the characteristics of the son that predict future labour market
participation also varying by the local labour market conditions. There is suggestive evidence
of these skills mattering more as unemployment rises.
The next section reviews the recent literature on intergenerational worklessness and
related literatures that motivates the characteristics considered here. Sections 3 and 4 present
the methodology and data while the results are discussed in 5. I end with some brief
conclusions.
2. Related literature
To date, there are only a handful of studies that estimate the intergenerational correlation of
workless spells: three from the UK (Johnson and Reed,1996, O’Neill and Sweetman,1998,
and Macmillan, 2011), one from Norway (Ekhaugen, 2009) and one comparison of the US
and the UK (Gregg and Macmillan, 2012). All studies find very similar magnitudes of
intergenerational worklessness of around 0.10. In the related intergenerational welfare
dependency literature, Corak et. al. (2000) find a similar sized correlation in unemployment
insurance claims of fathers and sons for Sweden and Canada. This paper presents the first
research into the drivers of this intergenerational relationship.
Previous work by Blanden et. al. (2007) within the intergenerational mobility
literature introduced a decomposition based on the model from Solon (2004). By combining
the association between family income and childhood characteristics and the returns to these
characteristics in the labour market in adulthood, the role of these childhood characteristics
could be assessed in the context of the transmission of income persistence across generations.

7
More recently work by Mood et. al. (2010) and Hirvonen (2010) have replicated this analysis
using Swedish data. These papers find important roles for not only cognition and educational
attainment but also non-cognitive traits in the intergenerational transmission of incomes
across generations although these are mostly contributing through the total educational
attainment that the individual obtains.
The role of cognition and educational attainment in intergenerational transmissions is
explicitly brought out in the model of Becker and Tomes (1986) and Solon (2004). There is a
vast amount of research detailing educational inequalities by family background (Gregg and
Macmillan, 2009) and the differential returns that each education level buys you in the labour
market (Oreopolus et. al., 2006, Meghir and Palme, 2005, Dickson, 2011). The model of
Solon (2004) predicts that sons with workless fathers are likely to have lower cognition and
educational attainment for a variety of reasons such as poorer genetic endowments, limited
resources, lower potential returns to schooling and less capabilities of turning investments (or
inputs) into outputs. These sons will also send weaker signals on the job market to potential
employers. Signalling theory highlights the importance of this attainment in hiring decisions
(Spence, 1973).
More recently, the important role of non-cognitive traits alongside cognitive traits in
predicting later life outcomes has been examined, predominantly in research by James
Heckman. Heckman, Hsse And Rubinstein (2002) presents evidence to suggest that whilst
those who select into taking a General Education Development (GED) qualification in the US
have higher cognitive ability than other High School Dropouts, they also have lower non-
cognitive abilities that make them far less employable in later life. This accounts for GED
recipients’ lower levels of labour force participation and higher turnover rates. Similarly,
work by Bowles and Gintis (1976) and Edwards (1976), demonstrates that job stability and
dependability are the traits most valued by employers in the work place. Heckman, Stixrud
and Urzuac (2006) find that non-cognitive traits play a more important role in predicting
future employability and work experience than cognitive traits. Carneiro and Heckman
(2003) and Cuhna, Heckman, Lochner and Masterov (2006) establish the importance of
parents in the formation of these skills. Schoon et. al. (2012) recently produced a report
considering the impact of parental worklessness on children’s cognitive ability, education,
behaviours and attitudes and aspirations using two young cohorts from Britain and England.
They found significant penalties from parental worklessness on a range of characteristics and
early measures of employability.

8
This research combines these strands of literature, considering both the association
between the workless experiences of fathers and childhood characteristics, and the
importance of these childhood characteristics in predicting later life workless experiences.
3. Methodology
The intergenerational correlation3 of worklessness is the estimated coefficient from
equation (1) where
captures the workless experience of the 1st generation and
captures the workless experience of the 2
nd generation
4.
(1)
i) Decomposing intergenerational worklessness
To assess the relative contribution of child characteristics in the intergenerational
transmission, following the decomposition originally presented by Blanden, Gregg and
Macmillan (2007), the intergenerational relationship can be thought of in two stages. The first
stage is the relationship between having a workless father,
, and the characteristic of
interest, using the example of cognition, in equation (2). is the association between
growing up in a family where the father is workless and the specific characteristic of the son.
The second stage is the relationship between this characteristic, , and the sons’ future
work experience, , conditional on the work experience of the father,
, shown in
(3)5. This is similar to a returns to schooling model but instead considers the characteristics
that are important in predicting future workless spells. This can provide a valuable
description of the key characteristics that might matter in terms of future employability6.
(2)
3 This research frequently refers to an intergenerational correlation, as is standard across the intergenerational
literature, rather than an intergenerational coefficient. 4 Age controls of the father are included to control for age effects although they are suppressed here to keep the
notation simple. Age controls for the son are not required as the sons are all the same age in the analysis.
Macmillan (2011) suggests that life-cycle bias is only an issue if the workless measures focus only on a period
either very early or late in working life. The workless measure here covers the period 16-29 and therefore should
not be affected by this bias. 5 The Linear Probability Model is used as the dependent variable is spending a year or more in concurrent spells
out of work. Predicted probabilities fall within the 0,1 bounds throughout. This decomposition requires the use
of linear models. 6 Note that age controls are included in all estimation but ignored here for notational simplicity.

9
(3)
Assuming that 7, (2) can be substituted into (3) as shown in (4) and then
rearranged to obtain (5).
(4)
(5)
Taking marginal effects, the total intergenerational correlation, , can be decomposed into
the part accounted for by the characteristic , and the direct effect of fathers’
workless spells on sons’ workless spells, as shown in (6).
(6)
In this model the characteristics are included in four blocks. The separation of early non-
cognitive skills from behavioural outcomes and cognition from educational outcomes is
motivated by research by Heckman et. al. (2006). While non-cognitive and cognitive skills
are early characteristics (determined by genetics, resources and parental capabilities to
change inputs into outputs) later behavioural and educational outcomes are decisions or
actions of the son that, in part, the earlier skills feed into. However in part these later
outcomes measures are also capturing some unobserved differences in the sons that affects
development as individuals age. In this statistical framework the earlier skills can either
directly impact the individuals’ future work experiences or transmit through later decisions
and actions in predicting workless spells. To allow for this, the later behavioural and
educational outcomes can be added into the model sequentially, after non-cognitive skills and
cognition. Equation (7) through (9) illustrates this ordering for cognition and educational
outcomes.
7 The consequences of this assumption and some further robustness analysis are discussed in the appendix

10
(7)
(8)
(9)
Equations (7) and (8) estimate separately the association between fathers’ worklessness and
each characteristic. Subbing these into (9) assuming and
, and rearranging gives
(10)
(11)
The direct effect of cognition will be captured by from equation (11) while the effect of
cognition that feeds into educational outcomes will be captured by the difference between
from (6) and from (11). The total accounted for by educational outcomes is captured by
while the direct effect of workless spells in the 1st generation is . This simple
decomposition therefore allows us to both assess the two important stages independently: i)
the association between the sons’ characteristics and the workless experience of the father
and ii) the importance of these characteristics in predicting later youth unemployment. It also
allows us to combine these effects to get a sense of which characteristics are important in the
overall intergenerational transmission.
ii) Local labour market variation
As shown in Macmillan (2011), the intergenerational correlation in workless spells varies by
the unemployment rate in the local labour market that the son experiences. Gregg and
Macmillan (2012) found that this relationship is very similar in both the UK and the US
despite the differences in geographical mobility within the two countries. As discussed, one
potential reason for this variation in the intergenerational correlation by local labour market
conditions is that the skills associated with employment become more important as

11
unemployment, and therefore the supply of labour that employers can choose from, increases.
I assess whether the association between characteristics and future employability varies by
local labour market conditions. This would support the idea that this variation across local
labour markets in the intergenerational correlation is driven, in part at least, by the varying
characteristics of individuals with workless fathers.
To examine this, equation (9) (suppressing cognition for this example for notational
simplicity) can be extended to include the county level unemployment rate, and
interactions between each of the characteristics of interest and the unemployment rate across
the period, . In this example education is the only characteristics listed to keep the
notation simple. An interaction between fathers’ workless experience and the unemployment
rate,
is also included as illustrated in equation (12). These interaction effects
indicate which of the characteristics’ association with future workless experiences change
across different levels of unemployment.
(12)
As within-county unemployment rates range from 2% to 24% across time and local labour
markets within the sample of interest, (12) can be estimated across this range of values,
assessing the impact of characteristics on future worklessness at both the average
unemployment rate, , and across different values of the unemployment rate ,
resulting in a range of different coefficients for each characteristic of the son,
and father’s workless experience,
(13)
The relationships between the characteristics and future workless experiences can therefore
be plotted by each unemployment rate to get a sense of whether some characteristics that may
not appear important at the mean level of unemployment matter more in labour markets with
particularly low or high levels of unemployment. Note that the simple bivariate relationship
between fathers’ workless experiences and the sons’ characteristics (as in (2) and (8)) is not

12
of interest for this analysis as this interaction between child characteristics and later local
labour market experiences is focused on the 2nd
generations’ experiences.
4. Data
This research uses the vast amount of information available on the cohort members of the
British Cohort Study (BCS), a longitudinal survey of all individuals born in one week in
April, 1970 in Great Britain. Despite the more recent British Household Panel Survey
(BHPS) providing more information on the workless experience of fathers there is very
limited information available on the characteristics of the sons. The BCS is therefore the most
recent survey available in the UK for measuring the drivers of the intergenerational
correlation in its entirety. Information is available in the BCS for two generations of workless
experiences: the 1st generation (fathers) when their son is aged 10 and 16 and the 2nd
generation (sons - the cohort members), for every month from age 16 to 29. There is also
detailed information on the non-cognitive skills, cognition, behavioural outcomes and
educational attainment of the sons throughout their childhood.
Workless measures are constructed by combining information from the two
observations of the employment status of the father when the son is 10 and 16 to create a
measure of 1st generation worklessness equal to 1 if the father is only observed as workless
and 0 otherwise. This measure of worklessness is therefore designed to measure a persistent
experience of worklessness. Table 1 illustrates that 4.4% of the final sample of sons had
workless fathers in childhood. Macmillan (2011) explores the implications of measurement
error from only observing two snapshots of employment history for the father rather than a
longer window of work history. Using a longer window (8 years) in the BHPS data, the
research shows that measurement error has only a limited impact on the estimates of the
intergenerational correlation, reducing the estimate by 11%.
The workless measure for the 2nd generation is constructed using the monthly work
history data from the BCS (Galindo-Rueda, 2002). For each month, sons are assigned as not
workless if they are in employment or full-time education and workless otherwise. The
monthly information is combined to create a measure of whether the son spent a year or more
in concurrent spells out of work from 16-29. Table 1 indicates that 13.9% of the sample spent
a year or more in concurrent spells out of work across the period. The analysis is restricted to
sons only to avoid differences in participation decisions across gender. I restrict the sample to
those sons with work history information and at least one observation of fathers’ employment

13
status. The focus is therefore on coupled households8. Macmillan (2011) illustrates that based
on observable characteristics, the final sample are from families with slightly higher social
class and education than the nationally representative sample at birth in the BCS.
Measures of the characteristics of the sons are split into four main categories: non-
cognitive skills, cognition, behavioural outcomes and educational outcomes. Research from
psychology on the big five personality traits (Digman, 1990) was utilised to create non-
cognitive measures of the son from a number of mother and teacher-reported behavioural
scales from the BCS at ages 5 and 10. From the non-cognitive scales available, four of the big
five personality measures can be constructed (the fifth, intelligence is measured in the
cognition grouping). User guides from the Centre for Longitudinal Surveys point to factor
constructs for agreeableness, emotionality, extroversion and conscientiousness (Butler et. al.,
1980). Agreeableness is a measure of how well the child socialises with others while
emotionality captures their emotional stability or neuroticism. Measures of extroversion
capture self-confidence and assertiveness while conscientiousness is designed to measure
control, attentiveness and constraint. In addition to these measures, a measure of
hyperactivity is included given the interest in attention deficit hyperactivity disorder
(ADHD). To minimise any impact of measurement error in the separate scales, averages are
taken across the scales reported at 5 and 10 by the mother and at age 10 by the teacher to
create early childhood measures of each non-cognitive scale9. Appendix Table A1 provides
information on the specific questions asked within each measure. In addition to the mother
and teacher-reported scales, the BCS also contains self-reported scales at age 10 of the son’s
self-esteem and locus of control (self efficacy). Similar measures are used by Heckman et. al.
(2006). All scores, with the exception of hyperactivity, are positively coded so that higher
scores are typically associated with better outcomes and are standardised to mean 0, standard
deviation 1 at the population level to impose some form of comparable scale across measures.
Cognition is measured using three different cognitive test scores from the BCS. The
British Ability Scale (BAS) is measured when the child is aged 10 and is used as a proxy for
IQ, the fifth of the big five personality measures, as in previous studies (Galindo-Rueda and
Vignoles, 2005, Blanden et. al., 2007). There are two additional test scores available at age 5,
a copying test and early picture and vocabulary test, that are included as cognition as they are
8 Lone parents are considered Gregg and Macmillan (2012). They find similar intergenerational correlations
when estimating intergenerational correlations for head-of-household – son pairs. 9 With the exception of conscientiousness which is only measured in the teacher reported scale at age 10 and
hyperactivity which is measured in the mother and teacher scale at age 10 but not at age 5.
14
measured early in life and are therefore thought of as a proxy for early cognition. Each of the
cognitive test scores are standardised to mean 0, standard deviation 1.
The behavioural outcomes are whether the son has a part time job whilst at school
capturing early connection to the labour market and observed attitudes to capture the son’s
connection to school. These include whether the son likes school at age 16, whether he views
school as a waste of time at 16 and whether he truants at age 10. These outcomes are distinct
from the non-cognitive skills listed above as they are observed choices made by the teenage
son during adolescence. These outcomes will be determined to some degree by the earlier
non-cognitive and cognitive skills but may also capture additional differences across sons,
given prior test scores.
In a similar vein, educational outcomes are viewed as distinct from measures of
cognition, recognising the difference between early ability and later attainment. Educational
attainment variables include a reading and maths tests at age 10 (standardised mean 0,
standard deviation 1) and the number of GCSEs that the son obtained at grade A-C at 16. The
separation of educational attainment from cognition is less obvious than separating early non-
cognitive skills from behavioural choices as it could be argued that reading and maths tests at
age 10 are still measuring cognition, or conversely, all measures of cognition are measuring
educational attainment to some degree. The choice to include maths and reading at age 10 as
a later attainment (but not the IQ test at the same age) is based on the fact that by construction
IQ tests are not as easily ‘taught to’ compared to maths and reading tests. I argue therefore
that while the reading and maths tests at age 10 will be measuring the sons’ attainment during
primary school, the IQ test will still measure early cognition. The GCSEs measure is more
obviously a measure of attainment based on the progress made by the son throughout school.
Table 1 presents sample level summary statistics from each group of characteristics of
the son. The standardised variables, the non-cognitive scales and cognition measures plus
reading and maths, were standardised to mean 0 and standard deviation 1 at the population
level so this information also gives some sense of differences between the final sample and
the population level data. As was found in Macmillan (2011), the final sample seem to have
slightly higher scores than the average population-level score in most scales (with the
exception of the conscientiousness score). 17% of sons reported not liking school at 16 while
4% thought school was a waste of time. Less than 1% truanted at age 10. The majority, 62%
of sons, had worked in a part-time job while still at school. On average, sons achieved 4
GCSEs at grade A-C.
15
When looking at the differential effect of characteristics across different levels of
unemployment the dependent variable of interest is the proportion of time spent workless
every year from 1986-1998. This allows the use of cross-sectional and time-series variation to
estimate the impact of unemployment rates on worklessness (see Macmillan, 2011).
Information from the BCS 1986 data on the local educational authority (LEA) of the cohort
member is matched with annual county-level unemployment rates from the Employment
Gazette from 1986 until 1998. There is a further sample restriction for this analysis that the
family’s LEA of residence must be observed in 198610
. This information enables us to assess
any variation in the impact of each characteristic on the workless experience of the son by the
local labour market conditions experienced across the period. This is based on the implicit
assumption that individuals remain in the same county that they are observed to live in 1986.
Later county level data from 2000 suggests that 80% of the sample reside in the same county
in 2000 that they were observed to live in 1986.
5. Results
The intergenerational correlation of worklessness is reported in Table 2. Sons with workless
fathers in childhood are 25% more likely to experience a year or more in concurrent spells
out of work from 16-29 than sons with employed fathers11
. This is the intergenerational
correlation that will now be decomposed.
i) Child characteristics and later workless experiences
Table 3 presents the results from estimating equation (3), the relationship between
characteristics of the son and their future workless experiences, conditional on the fathers’
worklessness. The regressions are built up in stages to allow us to assess which of the non-
cognitive and cognitive skills are important predictors of workless spells in their own right
before assessing which are working through later behavioural and educational outcomes.
Non-cognitive and cognitive skills are included separately in columns 1 and 2 and then
10
This decreases the sample by just under 1,000 observations. The intergenerational correlation is slightly lower
for this sub-sample suggesting that those who do not have information on their LEA of residence in 1986 have a
higher intergenerational correlation than the remaining sample. 11
This estimate is larger than in Macmillan (2011) as the window considered is 16-29 rather than 16-23. This
illustrates there is some life-cycle bias in measuring the intergenerational correlation too early.

16
together in column 3. Behavioural and educational outcomes are added separately in columns
4 and 5 and then all characteristics are included in column 6.
The first column indicates that a number of non-cognitive traits are significantly
associated with future workless experiences. Extroversion, hyperactivity and
conscientiousness are important predictors of future spells out of work with a standard
deviation higher score in conscientiousness reducing the chance of spending a year or more
out of work by 2.7%. Having more internal locus of control (believing you are in control of
your own choices) is significantly negatively associated with spending a year or more out of
work in adulthood although this appears to be mediated through later behaviours. The early
cognition test scores dominate the British Ability Scale IQ measure at 10 in predicting the
likelihood of sustained worklessness in adulthood but around half of the initial effect works
through later educational outcomes for the copying test. The early picture and vocabulary test
remains a strong predictor of future worklessness in the full model. The behavioural
outcomes are independently associated with future worklessness12
with those observed
truanting at age 10 being 18% more likely to spend a year or more out of work in adulthood
than those not observed truanting at age 10. Those sons who do some part-time work while at
school are 5.8% less likely to spend a year or more out of work than those that do not. Having
negative attitudes to school also remains a strong predictor of later worklessness, even with
the inclusion of educational attainment measures, with those who report not liking school
6.3% more likely to be out of work for a year or more from 16-29 than those who like school,
regardless of their final GCSE attainment. Scoring higher in the age 10 maths test and
obtaining more GCSEs grade A-C are both negatively associated with future workless
experiences although the reading test is significantly positively associated with future
worklessness.
Overall, these characteristics account for 7% of the variation in the workless
experience of the son from 16-29. The Adjusted R-squared when using a similar set of
characteristics in a regression of earnings at 30 is 0.17 (Blanden et. al., 2007). There is
therefore more variation unaccounted for in the workless measure compared to earnings,
although earnings is a more continuous measure and so this may not be entirely surprising.
Typical Mincer wage equations can predict more variation by including later education
measures, experience and tenure as predictors of earnings but the set of characteristics used
12
The addition of these variables has little impact on the effect sizes of the early non-cognitive and cognitive
scales

17
here is restricted to those that occur during compulsory schooling, before the outcome
measure begins (at age 16).
ii) Fathers’ worklessness and child characteristics
To move on to consider whether each of the characteristics are associated with coming from a
family with a workless father at 10 and 16 (the other part of the intergenerational story) Table
4 presents the bivariate regression coefficients from estimating equation (2) for each separate
characteristic. As found by Schoon et. al. (2012), many of the non-cognitive skills are
strongly associated with having a workless father in childhood. Agreeableness, self-esteem
and locus of control have the strongest effects out of all of the non-cognitive traits with sons
with workless fathers scoring 0.3 of a standard deviation lower on these scales on average
than sons with employed fathers. Conscientiousness and extroversion all have a slightly
lower association of 0.2 of a standard deviation. Hyperactivity is positively associated with
coming from a home with a workless father with sons with workless fathers scoring 0.01 of a
standard deviation higher on average than sons with employed fathers. The emotionality scale
is the only personality trait not associated with having a workless father.
Cognition and educational outcomes are more strongly associated with coming from a
home with a workless father than non-cognitive skills. Sons with workless fathers scored on
average 0.3 to 0.4 of a standard deviation less on early cognitive tests than sons with
employed fathers. They are also likely to obtain 1.14 fewer GCSE grades A-C on average. By
contrast, the behavioural outcomes are only weakly associated with having a workless father
in childhood. Sons with workless fathers are 1.5% more likely to report that they think that
school is a waste of time but the other school attitude variable and truanting at age 10 are not
associated with fathers’ worklessness. Sons with workless fathers are 4.6% less likely on
average to work in a part-time job whilst at school than sons with employed fathers.
This evidence suggests that having a workless father is associated with significant
penalties in terms of both non-cognitive and cognitive skills. Interestingly, although
educational attainment is strongly related to the workless experiences of the father, the
behavioural outcomes are less related to having a workless father. Therefore although these
are independent predictors of the sons’ workless experience, negative outcomes across some
of the measures are just as likely to be observed in sons with employed fathers as sons with
workless fathers.

18
iii) Accounting for the intergenerational correlation
Table 5 presents the combined decomposition of the intergenerational correlation. Each cell
gives the product of the relationship between fathers’ worklessness and the characteristic
from Table 4 and the characteristics’ association with future worklessness from Tables 3.
This is equivalent to , from equation (6) in Section 3i). The direct effect of fathers’
worklessness on sons’ worklessness, , is reported as ‘Not accounted for’ through the
characteristics. The bottom rows of each table present summary statistics of the total amount
accounted for and the contribution of each group.
The total accounted for by all characteristics included in the model is just 12%. 88%
of the intergenerational transmission of worklessness remains unaccounted for in this model
despite the inclusion of a broad range of non-cognitive skills, cognition, behavioural and
educational outcomes. Similar characteristics in the intergenerational mobility literature can
account for up to 40% of the intergenerational transmission of income (Blanden et. al., 2007).
There appears to be a great deal more heterogeneity in intergenerational worklessness than
intergenerational income mobility.
Non-cognitive skills alone account for 0.022 or 8.6% of the intergenerational
correlation whilst cognition alone accounts for 0.024 or 9.5% of the total correlation. When
these are included together, the contribution of non-cognitive skills only diminishes slightly,
to 7.5% or 0.019 of the total correlation, while around one third of the impact of cognition is
removed reducing the total accounted for by cognition to 0.014. The addition of behavioural
and educational outcomes add around 2% each to the model when included separately with
behaviour dominating education when the two are included together in the full model (2%
through behaviour compared to 1% through education). Non-cognitive skills appear to
dominate the role of cognition in accounting for worklessness across generations. From the
total 11.9% accounted for in the full model in column 6, 5.7% (48% of the total accounted
for) is transmitted through the measured non-cognitive skills over and above the impact of
cognition, educational attainment and later behavioural outcomes.
There appears to be something quite distinct about the role of non-cognitive skill and
behaviours in the intergenerational transmission of worklessness compared to the
intergenerational transmission of incomes. Non-cognitive skills and behavioural outcomes
appear to be more important predictors of intergenerational worklessness than they are of
intergenerational income persistence. They also appear to matter more than cognition or
19
educational attainment. This is in line with the findings of Heckman et. al. (2006) who find
that non-cognitive skills are stronger predictors of future employability than cognitive skills.
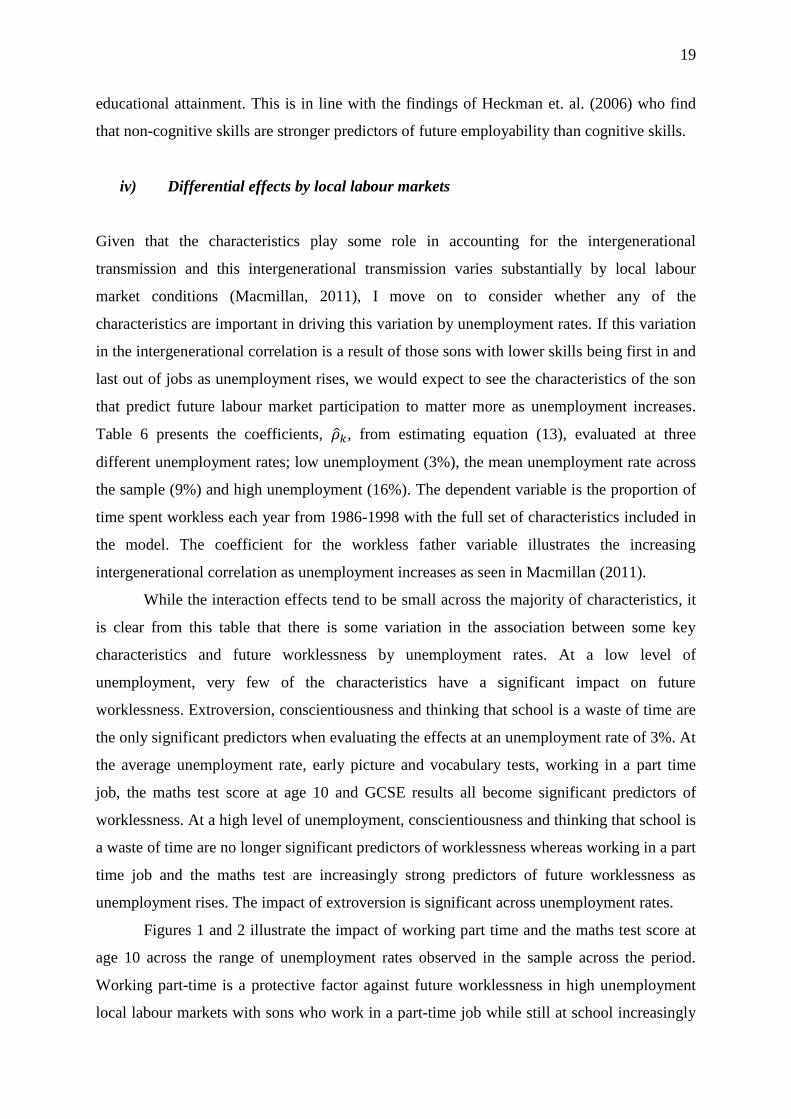
iv) Differential effects by local labour markets
Given that the characteristics play some role in accounting for the intergenerational
transmission and this intergenerational transmission varies substantially by local labour
market conditions (Macmillan, 2011), I move on to consider whether any of the
characteristics are important in driving this variation by unemployment rates. If this variation
in the intergenerational correlation is a result of those sons with lower skills being first in and
last out of jobs as unemployment rises, we would expect to see the characteristics of the son
that predict future labour market participation to matter more as unemployment increases.
Table 6 presents the coefficients, , from estimating equation (13), evaluated at three
different unemployment rates; low unemployment (3%), the mean unemployment rate across
the sample (9%) and high unemployment (16%). The dependent variable is the proportion of
time spent workless each year from 1986-1998 with the full set of characteristics included in
the model. The coefficient for the workless father variable illustrates the increasing
intergenerational correlation as unemployment increases as seen in Macmillan (2011).
While the interaction effects tend to be small across the majority of characteristics, it
is clear from this table that there is some variation in the association between some key
characteristics and future worklessness by unemployment rates. At a low level of
unemployment, very few of the characteristics have a significant impact on future
worklessness. Extroversion, conscientiousness and thinking that school is a waste of time are
the only significant predictors when evaluating the effects at an unemployment rate of 3%. At
the average unemployment rate, early picture and vocabulary tests, working in a part time
job, the maths test score at age 10 and GCSE results all become significant predictors of
worklessness. At a high level of unemployment, conscientiousness and thinking that school is
a waste of time are no longer significant predictors of worklessness whereas working in a part
time job and the maths test are increasingly strong predictors of future worklessness as
unemployment rises. The impact of extroversion is significant across unemployment rates.
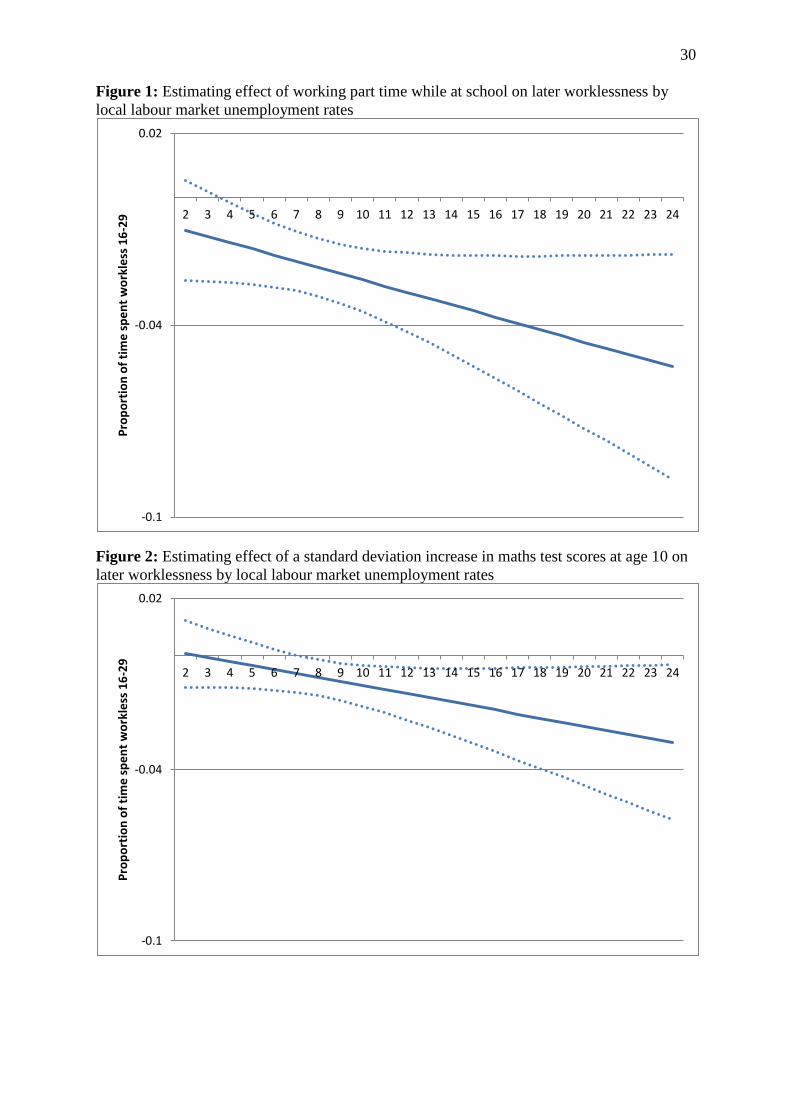
Figures 1 and 2 illustrate the impact of working part time and the maths test score at
age 10 across the range of unemployment rates observed in the sample across the period.
Working part-time is a protective factor against future worklessness in high unemployment
local labour markets with sons who work in a part-time job while still at school increasingly

20
spending less time workless compared to those who did not work part-time as unemployment
increases. As the unemployment rate rises above 20%, sons who work part time while still at
school spend over 4% less time workless from 16-29 than sons who do not work part time, in
the same local labour markets. This suggests that employers may favour those with previous
work experience in looser labour markets. Similarly for the maths test scores at age 10, sons
who score a standard deviation higher on their maths test scores at age 10 in high
unemployment local labour markets spend 2-3% less time workless than equivalent sons in
the same local labour market. In both cases, there is no effect of these characteristics on
future workless experiences in low unemployment labour markets. This is also true for
emotionality, early picture and vocabulary test scores and the number of GCSEs grade A-C
achieved. These skills all become increasingly significant predictors of later worklessness as
the supply of labour increases.
6. Conclusions
These results offer a new insight into the drivers of the intergenerational transmission of
worklessness. While there has been much research into the predictors of later life earnings,
there has been little focus on the attributes that predict future employability and whether these
characteristics are related to having a workless father in childhood. Four groups of
characteristics are considered. Non-cognitive skills play an important role in predicting future
workless spells. Cognition also plays a significant role although the IQ measure from this
data source does not predict later worklessness. The inclusion of behavioural outcomes adds
additional information about the difference between sons with workless fathers compared to
sons with employed fathers with similar non-cognitive and cognitive skills, in contrast to
educational attainment which appears to be capturing a lot of differences in cognition from
the earlier measures used. In addition to having negative consequences for future
employability, the evidence here suggests that for non-cognitive skills, cognition and
educational attainment, sons with workless fathers consistently score worse than sons with
employed fathers, exhibiting lower skills in these domains. Carneiro and Heckman (2003)
and Cuhna, et. al. (2006) document the important role of parents in the formation of these
skills.
It is difficult to account for much of the overall intergenerational transmission of
worklessness in the UK despite using a wide variety of characteristics from the son’s
childhood that account for over 40% of the intergenerational transmission of income in the

21
same data source. 12% of the intergenerational correlation is accounted for by measures of
non-cognitive skills, cognition, behavioural outcomes and educational attainment with the
remaining 88% unaccounted for. Of the part that can be accounted for, non-cognitive skills
and behaviours appear to play a more substantial role in the story of the intergenerational
transmission of worklessness than they do in the intergenerational transmission of incomes.
Non-cognitive skills and behaviours also play a dominant role compared to cognition and
educational attainment.
When considering the role of these characteristics in different local labour market
settings, there is a clear pattern of a range of characteristics becoming increasingly important
predictors of future worklessness as the unemployment rate increases. While in local labour
markets with low unemployment very few of the characteristics significantly predict future
worklessness, in local labour markets with higher unemployment rates, emotionality, early
picture and vocabulary tests, working part time while still at school, maths tests and GCSE
attainment are all increasingly associated with future workless spells. This suggests that
these skills are more important as the supply of labour increases with employers placing
additional value on skills when making hiring decisions from a larger pool of workers.
These findings suggest that investments to improve life chances should focus not only
on the cognition and educational attainment but perhaps more importantly the soft skills of
children as these may be vital in influencing their experiences in the labour market in
adulthood. In particular, efforts should be made to increase the skills of those already facing
greater barriers to employment through their fathers being out of work. In addition, the
evidence across local labour market experiences suggests that improving the wider skill set of
these children is particularly important in local labour markets with high unemployment rates
and at times of recession.

22
Bibliography
Becker, G. and Tomes, N. (1986) “Human Capital and the Rise and Fall of Families,”
Journal of Labor Economics, Vol. 4(3). pp. S1-39.
Blanden, J., Gregg, P. and Macmillan, L. (2007) “Accounting for Intergenerational Income
Persistence: Non-cognitive Skills, Ability and Education,” Economic Journal, Vol.
117. pp. C43-C60.
Bowles, S and Gintis, H. (1976) Schooling in Capitalist America. Basic books: New York.
Butler, N., Despotidou, S. and Sheperd, P. (1980) “1970 British Cohort Study (BCS70) Ten
Year Follow-up: A Guide to the BCS70 10-year Data available at the Economic and
Social Research Council Data Archive” (part three) Centre for Longitudinal Studies.
Carneiro, P and Heckman, J. (2003) ‘Human Capital Policy’ in Inequality in America: What
role for human capital policies?’ (J. Heckman, A. Krueger and B. Friedman, eds.)
MIT Press: Cambridge, MA. pp. 77-239.
Coate, S and Loury, G. (1993) “Will Affirmative-Action Policies Eliminate Negative
Stereotypes?,” American Economic Review, Vol. 82(5). pp. 1220-1240.
Corak, M., Gustafsson, B. and Osterberg, T. (2000) “Intergenerational influences on the
receipt of Unemployment Insurance in Canada and Sweden,” IZA Discussion Paper
Number 184.
Cuhna, F, Heckman, J, Lochner, L and Masterov, D. (2006) “Interpreting the evidence on life
cycle skill formation” in ‘Handbook of the economics of education, (E. Hanushek
and F. Welch, eds.) North-Holland: Amsterdam. pp. 697-812
Dickson, M. (2011) “The Causal Effect of Education and Wages Revisited,” forthcoming
Oxford Bulletin of Economics and Statistics.
Digman, J. (1990) “Personality structure: Emergence of the five factor model”, Annual
Review of Psychology Vol. 41. pp. 417-440.
Edwards, R. (1976) “Personal Traits and Success in Schooling and Work,” Educational and
Psychological Measurement Vol. 37. pp. 125-138.
Ekhaugen, T. (2009) “Extracting the causal component from the intergenerational correlation
in unemployment,” Journal of Population Economics, Vol. 22. pp. 97-113.
Galindo-Rueda, F. (2002) “Progression routes of cohort members: NCDS (1974-2000) and
BCS70 (1986-2000). Description of the data work on British Cohort Surveys,”
London, Centre for Economics of Education, London School of Economics.
Galindo-Rueda, F. and Vignoles, A. (2005) “The declining relative importance of ability in
predicting educational attainment,” Journal of Human Resources Vol. 40(2). pp.
335-353.

23
Gregg, P. and Macmillan, L. (2009) “Family income, education and cognitive ability in the
next generation: exploring income gradients in education and test scores for current
cohorts of youth,” Longitudinal and Life Course Studies, Vol. 1(3). pp. 259-280.
Gregg, P and Macmillan, L (2012) ‘The Comparing the Intergenerational Transmission of
Worklessness in the US and the UK’ mimeo, University of Bristol Phd Chapter
Heckman, J. Hsse, J and Rubinstein, Y. (2002) “The GED is a ‘Mixed Signal’: The effect of
Cognitive and Non-cognitive Skills on Human Capital and Labor Market Outcomes”
University of Chicago, unpublished manuscript.
Heckman, J, Stixrud, J and Urzua, S. (2006) “The effects of Cognitive and Non-cognitive
Abilities on Labor Market Outcomes and Social Behavior,” Journal of Labor
Economics Vol. 24 (3). pp. 411-482.
Hirvonen, L. (2010) “Accounting for intergenerational earnings persistence: Can we
distinguish between education, skills and health?,” Swedish Institute for Social
Research (SOFI) working paper 2/2010.
Johnson, P. & Reed, H. (1996) “Intergenerational Mobility Among the Rich and Poor:
Results from the National Child Development Survey,” Oxford Review of Economic
Policy, Vol. 12 (1). pp.127-143.
Leuven, E. and Sianesi, B. (2010) “PSMATCH2: Stata module to perform full Mahalanobis
and propensity score matching, common support graphing and covariate imbalance
testing,” Version 4.0.4
http://ideas.repec.org/c/boc/bocode/s432001.html.
Li, Y. (2012) “Hard Times, Worklessness and Unemployment in Britain and the USA 1972-
2011,” University of Manchester, unpublished manuscript.
List, J and Rasul, I. (2010) “Field Experiments in Labour Economics,” in Handbook of Labor
Economics (O. Ashenfelter and D. Card eds.) Vol. 3C. pp. 3143-3259.
Macmillan, L. (2011) ‘Measuring the intergenerational correlation of worklessness’ CMPO
working paper 11/278
Meghir, C. and Palme, M. (2005) “Educational Reform, Ability and Parental Background,”
American Economic Review, Vol.95(1). pp. 414-424.
Mood, C, Bihagen, E and Jonsson, J. (2010) “Socioeconomic persistence across generations:
The role of cognitive and non-cognitive processes,” Stockholm University,
unpublished manuscript.
O’Neill, D. and Sweetman, O. (1998) “Intergenerational mobility in Britain: Evidence from
Unemployment Patterns,” Oxford Bulletin of Economics and Statistics, Vol. 60 (4).
pp. 431-447.
Oreopoulos, P., Page, M. and Stevens, AH. (2006) “The intergenerational effects of
compulsory schooling,” Journal of Labor Economics Vol. 24. pp. 729-760.

24
Osborne-Groves, M. (2005) “Personality and intergenerational transmission of earnings,” in
Unequal chances: Family Background and Economic Success (S. Bowles, H. Gintis
and M. Osborne-Groves, eds.) Princeton University Press: Princeton. pp. 208-231.
Schoon, I., Barnes, M., Brown, V., Parsons, S., Ross, A., and Vignoles, A. (2012)
“Intergenerational transmission of worklessness: Evidence from the Millennium
Cohort Study and the Longitudinal Survey of Young People in England,” CAYT,
DfE research report DFE-RR234
Spence, M. (1973) “Job Market Signalling,” Quarterly Journal of Economics Vol. 87(3). pp.
355-374.
Solon, G. (2004) “A model of intergenerational mobility variation over time and place,” in
Generational Income mobility in North America and Europe (M. Corak, ed.)
Cambridge University Press: Cambridge. pp. 38-47.
Wilson, W. J. (2009) More than Just Race: Being Black and Poor in the Inner City W. W.
Norton & Company: New York.
Wooldridge, J. (2003) Introductory Econometrics – A Modern Approach (Second Edition)
Thomson Learning: South-Western.

25
Table 1: Descriptive statistics of the workless measures and the 2nd
generation’s (son) non-
cognitive skills, cognition, behavioural outcomes and educational attainment
1st generation measure
Sample
average
Sample
standard
Deviation
Father workless at 10 & 16 0.044 0.206
Sons spent a year or more out of work 0.139 0.346
Agreeableness 0.158 0.762
Emotionality 0.189 0.835
Extroversion 0.082 0.920
Hyperactivity 0.177 0.975
Conscientiousness -0.078 0.927
Self Esteem 0.127 0.878
Locus of Control 0.074 0.921
Copying test 0.067 0.927
Early picture and vocabulary 0.157 0.893
Ability Scale 0.101 0.866
Don’t like school 0.174 0.241
School a waste of time 0.037 0.125
Early truant 0.004 0.059
Part-time job at school 0.623 0.307
Maths test 0.130 0.889
Reading test 0.039 0.889
No. of GCSE grade A-C 4.058 3.120
Table 2: Estimating intergenerational worklessness in the BCS
2nd
generation measure
16 - 29
A year or more
workless
Father workless at 10 and 16 0.2511
(.034)***
R-squared 0.0269
N 4646 Robust standard errors in parenthesis. * 90% confidence, ** 95% confidence, *** 99% confidence
26
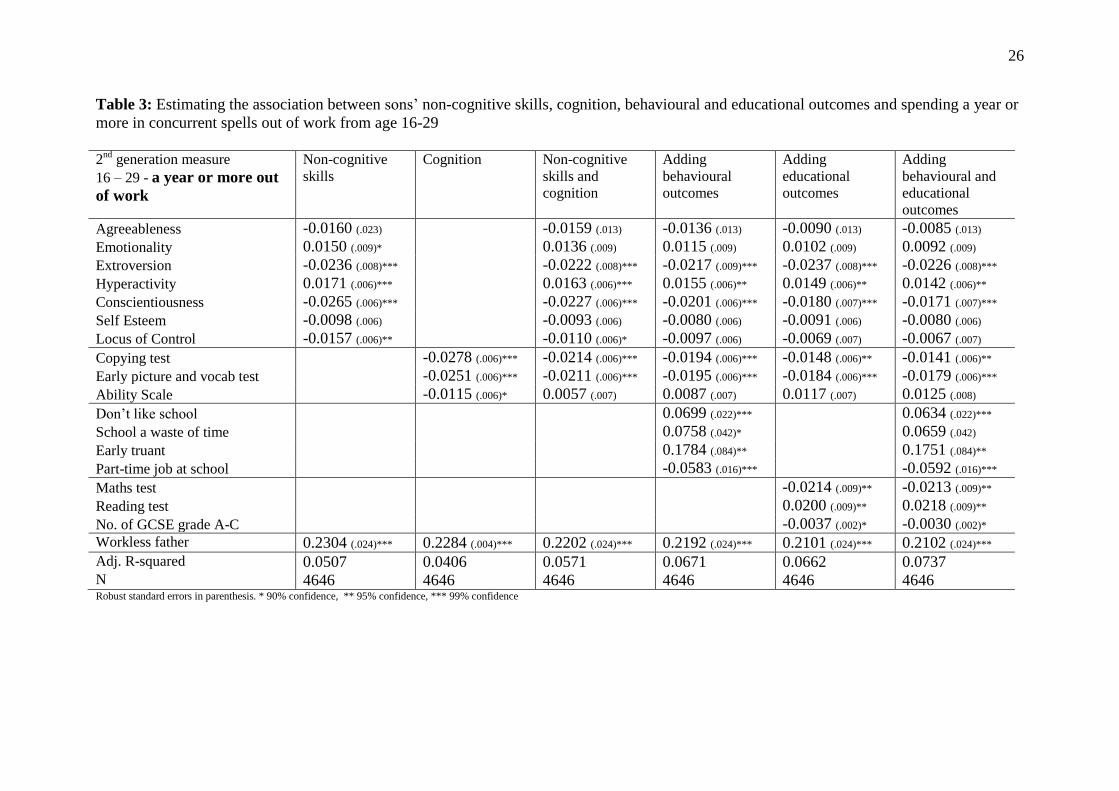
Table 3: Estimating the association between sons’ non-cognitive skills, cognition, behavioural and educational outcomes and spending a year or
more in concurrent spells out of work from age 16-29
2
nd generation measure
16 – 29 - a year or more out
of work
Non-cognitive
skills Cognition Non-cognitive
skills and
cognition
Adding
behavioural
outcomes
Adding
educational
outcomes
Adding
behavioural and
educational
outcomes
Agreeableness -0.0160 (.023) -0.0159 (.013) -0.0136 (.013) -0.0090 (.013) -0.0085 (.013)
Emotionality 0.0150 (.009)* 0.0136 (.009) 0.0115 (.009) 0.0102 (.009) 0.0092 (.009)
Extroversion -0.0236 (.008)*** -0.0222 (.008)*** -0.0217 (.009)*** -0.0237 (.008)*** -0.0226 (.008)***
Hyperactivity 0.0171 (.006)*** 0.0163 (.006)*** 0.0155 (.006)** 0.0149 (.006)** 0.0142 (.006)**
Conscientiousness -0.0265 (.006)*** -0.0227 (.006)*** -0.0201 (.006)*** -0.0180 (.007)*** -0.0171 (.007)***
Self Esteem -0.0098 (.006) -0.0093 (.006) -0.0080 (.006) -0.0091 (.006) -0.0080 (.006)
Locus of Control -0.0157 (.006)** -0.0110 (.006)* -0.0097 (.006) -0.0069 (.007) -0.0067 (.007)
Copying test -0.0278 (.006)*** -0.0214 (.006)*** -0.0194 (.006)*** -0.0148 (.006)** -0.0141 (.006)**
Early picture and vocab test -0.0251 (.006)*** -0.0211 (.006)*** -0.0195 (.006)*** -0.0184 (.006)*** -0.0179 (.006)***
Ability Scale -0.0115 (.006)* 0.0057 (.007) 0.0087 (.007) 0.0117 (.007) 0.0125 (.008)
Don’t like school 0.0699 (.022)*** 0.0634 (.022)***
School a waste of time 0.0758 (.042)* 0.0659 (.042)
Early truant 0.1784 (.084)** 0.1751 (.084)**
Part-time job at school -0.0583 (.016)*** -0.0592 (.016)***
Maths test -0.0214 (.009)** -0.0213 (.009)**
Reading test 0.0200 (.009)** 0.0218 (.009)**
No. of GCSE grade A-C -0.0037 (.002)* -0.0030 (.002)*
Workless father 0.2304 (.024)*** 0.2284 (.004)*** 0.2202 (.024)*** 0.2192 (.024)*** 0.2101 (.024)*** 0.2102 (.024)*** Adj. R-squared 0.0507 0.0406 0.0571 0.0671 0.0662 0.0737 N 4646 4646 4646 4646 4646 4646 Robust standard errors in parenthesis. * 90% confidence, ** 95% confidence, *** 99% confidence

27
Table 4: Estimating bivariate associations between sons’ non-cognitive skills, cognition,
behavioural and educational outcomes and the workless experience of their father
1st generation measure
Only observed
as workless at
10/16
Agreeableness -0.2854 (.043)***
Emotionality -0.1434 (.052)
Extroversion -0.1932 (.066)***
Hyperactivity 0.0109 (.068)**
Conscientiousness -0.2458 (.067)***
Self Esteem -0.2784 (.062)***
Locus of Control -0.3272 (.066)***
Copying test -0.3503 (.066)***
Early picture and vocabulary -0.3920 (.063)***
Ability Scale -0.3390 (.062)***
Don’t like school 0.0037 (.017)
School a waste of time 0.0148 (.009)*
Early truant 0.0063 (.042)
Part-time job at school -0.0459 (.022)**
Maths test -0.3369 (.064)***
Reading test -0.3667 (.064)***
No. of GCSE grade A-C -1.1423 (.224)***
Robust standard errors in parenthesis. * 90% confidence, ** 95% confidence, *** 99% confidence. Coefficients from separate univariate
regressions of sons’ characteristic on fathers’ workless status and quadratic fathers’ age controls. N=4646

28
Table 5: Accounting for the intergenerational relationship in spending a year or more in concurrent spells out of work of the sons with their non-
cognitive skills, cognition, behavioural and educational outcomes in childhood
A year or more concurrent
spells out of work (i) (ii) (iii) (iv) (v) (vi) Agreeableness 0.005 0.005 0.004 0.003 0.002
Emotionality -0.002 -0.002 -0.002 -0.001 -0.001
Extroversion 0.005 0.004 0.004 0.005 0.004
Hyperactivity 0.000 0.000 0.000 0.000 0.000
Conscientiousness 0.007 0.006 0.005 0.004 0.004
Self Esteem 0.003 0.003 0.002 0.003 0.002
Locus of Control 0.005 0.004 0.003 0.002 0.002
Total personality traits 0.022 0.019 0.017 0.015 0.014
Copying test 0.010 0.008 0.007 0.005 0.005
Early picture and vocab test 0.010 0.008 0.008 0.007 0.007
Ability Scale 0.004 -0.002 -0.003 -0.004 -0.004
Total cognition 0.024 0.014 0.012 0.009 0.008
Don’t like school 0.000 0.000
School a waste of time 0.001 0.001
Early truant 0.001 0.001
Part-time job at school 0.003 0.003
Total behavioural outcomes 0.005 0.005
Maths test 0.007 0.007
Reading test -0.007 -0.008
No. of GCSE grade A-C 0.004 0.003
Total educational attainment 0.004 0.003
Total accounted for 0.0215 0.0238 0.0328 0.0338 0.0277 0.0298
Not accounted for 0.2296 0.2274 0.2183 0.2174 0.2234 0.2213
Total 0.2511 0.2511 0.2511 0.2511 0.2511 0.2511
% through non-cognitive 8.57 7.49 6.74 5.98 5.68
% through cognition 9.46 5.58 4.64 3.42 3.13
% through beh. outcomes 2.06 2.00
% through ed. outcomes 1.63 1.06
% of total 8.57 9.46 13.07 13.44 11.03 11.87 Each cell represents the product of table 3 and table 4, , from equation (6) in Section 3i). N=4646

29
Table 6: Estimating the association between sons’ non-cognitive skills, cognition,
behavioural and educational outcomes and the proportion of time spent workless each year
from 16-29 at different local labour market levels of unemployment
2nd
generation measure
16 – 29 - proportion of time
spent out of work each year
Low
unemployment (u=3%)
Average
unemployment
(u=9%)
High
unemployment (u=16%)
Agreeableness 0.0024 (.010) -0.0035 (.006) -0.0095 (.010)
Emotionality -0.0062 (.008) 0.0066 (.004) 0.0194 (.008)**
Extroversion -0.0187 (.007)*** -0.0148 (.004)*** -0.0111 (.006)*
Hyperactivity 0.0059 (.005) 0.0030 (.003) 0.0001 (.005)
Conscientiousness -0.0131 (.005)*** -0.0063 (.003)** 0.0004 (.006)
Self Esteem -0.0044 (.005) -0.0018 (.003) 0.0008 (.006)
Locus of Control 0.0081 (.005) 0.0043 (.003) 0.0005 (.006)
Copying test -0.0013 (.005) -0.0038 (.003) -0.0088 (.006)
Early picture and vocab test 0.0001 (.006) -0.0063 (.003)** -0.0127 (.006)**
Ability Scale 0.0048 (.005) 0.0045 (.003) 0.0042 (.007)
Don’t like school 0.0035 (.015) 0.0125 (.008) 0.0214 (.017)
School a waste of time 0.0729 (.045)* 0.0414 (.024)* 0.0100 (.043)
Early truant 0.0051 (.103) 0.0734 (.060) 0.1412 (.119)
Part-time job at school -0.0103 (.010) -0.0239 (.006)*** -0.0374 (.012)***
Maths test 0.0007 (.007) -0.0092 (.004)** -0.0191 (.009)**
Reading test -0.0021 (.007) 0.0023 (.004) 0.0067 (.008)
No. of GCSE grade A-C -0.0015 (.001) -0.0017 (.001)** -0.0019 (.001)**
Workless father 0.0097 (.031) 0.0790 (.010)*** 0.1566 (.041)*** Adj. R-squared 0.0626 0.0626 0.0626 N 3672 3672 3672
30
Figure 1: Estimating effect of working part time while at school on later worklessness by
local labour market unemployment rates
Figure 2: Estimating effect of a standard deviation increase in maths test scores at age 10 on
later worklessness by local labour market unemployment rates
-0.1
-0.04
0.02
2 3 4 5 6 7 8 9 10 11 12 13 14 15 16 17 18 19 20 21 22 23 24
Pro
po
rtio
n o
f ti
me
sp
en
t w
ork
less
16
-29
-0.1
-0.04
0.02
2 3 4 5 6 7 8 9 10 11 12 13 14 15 16 17 18 19 20 21 22 23 24
Pro
po
rtio
n o
f ti
me
sp
en
t w
ork
less
16
-29

31
Appendix
Table A1: Examples of the scales used in the Principle Components Analysis to
create the personality trait measures in the BCS
Non-cognitive
scale
Examples of the scales and statements How scored?
Agreeableness
Moody, Temper, Interferes, Bullies, Lies, Fights,
Destructive, Takes Things, Disliked Mother and
Teacher choose a
place on the scale
to score the child
(1-100)
Emotionality Fussy, Fears New Things, Worried
Extroversion Excitable, Sullen, Solitary
Hyperactivity Hums, Taps, Restless, Twitches, Squirmy
Conscientiousness
Concentrates, Bored, Perseveres, Confused, Listless,
Fails Complete Tasks, Distracted
Child directly
responds
positively or
negatively to
statements
Self Esteem Lonely at school, People think foolish, People think
nasty, Would like to change self
Locus of Control Why try, Wishing Helps, Bad things happen, Nice
things are luck, People are good
Robustness test of the decomposition
The decomposition used in this analysis requires a strong assumption to hold, namely
from equations (2) and (3) that . There are two problems with this
assumption. First, the classic omitted variable bias problem where there is likely to be
some important determinants of both the sons’ characteristics and the sons’ workless
spells that are not included in the estimation of either (2) or (3). This will lead to a
correlation between the two error terms and result in us overstating the contribution of
cognition, in this example, in the transmission of intergenerational worklessness. To
some degree, the inclusion of later educational attainment and behavioural outcomes
helps reduce this bias as these later outcomes will add more information about the
unobserved differences between sons. Secondly, if the correlation between the errors
in (7) and (9) is stronger than the errors between (8) and (9), the overall contribution
of each set of characteristics may be misleading.
To attempt to minimise any likely bias in this decomposition, a robustness test
can be run that will reduce the impact of omitted variable bias. To do this the sample
of workless fathers are matched to the sample of employed fathers based on a
propensity score from their predicted likelihood of being workless given a vector of

32
family background controls, by running a probit regression as seen in equation
(A1). The family background controls are carefully chosen so that they are pre-
determined and exogenous. To control for observable differences across families,
information on parental education, father’s social class when the son is aged 10, the
region the family live in at 10 and housing tenure at 10 are all available. The model
explicitly attempts to control for any selection into worklessness rather than any
potential causal mechanisms. No potential causal mechanisms are included as
background controls. The class of the father when the son is aged 10, for example, is
included to capture a long term indicator of the socio-economic status of the father
(workless fathers can and do still report a ‘typical occupation’). In contrast, the family
income in childhood is not included as this is a measure of resources which will be
directly affected by the father’s workless status.
(A1)
The workless fathers (treated) are matched to employed fathers (control) based
on their nearest-neighbour, the member of the control group with the most similar
propensity score to the treated individual. Replacement is allowed so that the same
control group individual can be matched to numerous treated fathers. Given that the
treatment group (206) make up a small proportion of the total sample, the 3 nearest
neighbours are found for each treatment group member to ensure that the sample sizes
are sufficient. The control group consists of 618 fathers. The aim of this matching is
to balance the sample so that the likelihood of being workless is the same for
employed and workless fathers, minimising any differences between the two groups.
This will reduce any covariance in the error terms of the two stage regressions
towards zero. Figure A1 plots the distribution of propensity scores for the treatment
and control groups for the sample of matched fathers. Using three control group
members for every one treated father leads to some imprecision in the matching of the
propensity scores, particularly in the right tail of the distribution. The 1st matched
nearest neighbour in the control group exhibit very similar propensity scores to the
treated group but there are slightly less 2nd
and 3rd
matched fathers at the top end of
the propensity score distribution.
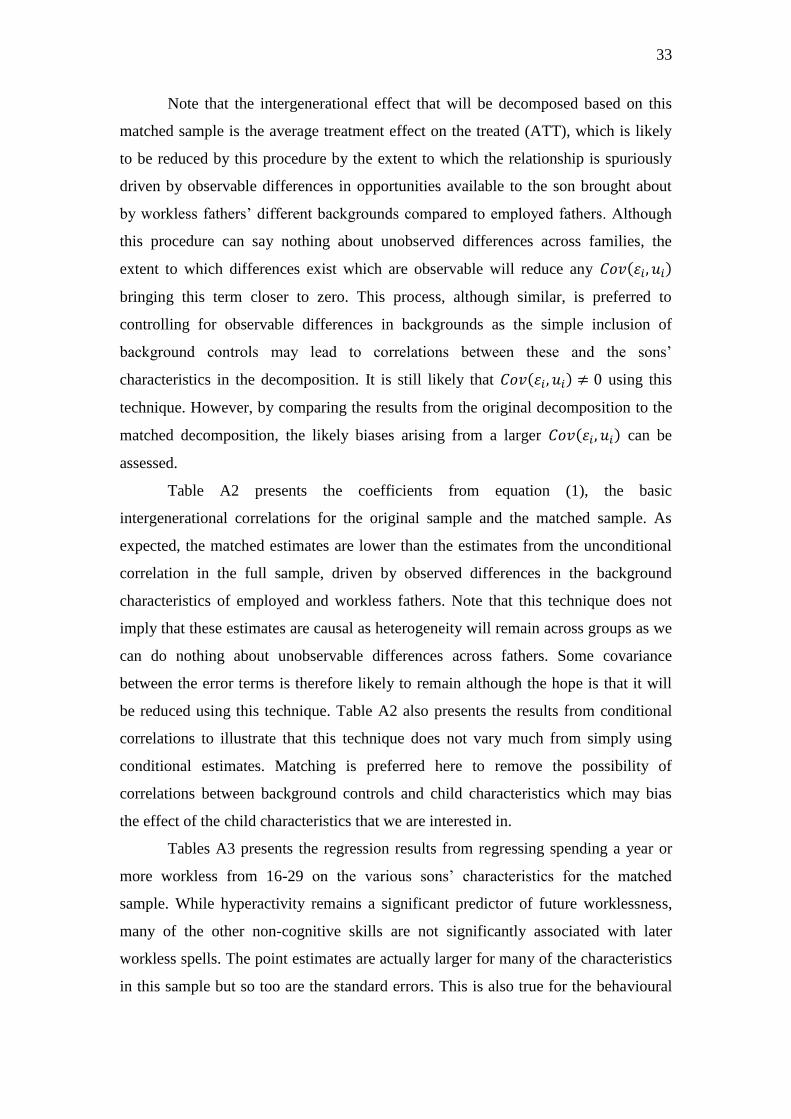
33
Note that the intergenerational effect that will be decomposed based on this
matched sample is the average treatment effect on the treated (ATT), which is likely
to be reduced by this procedure by the extent to which the relationship is spuriously
driven by observable differences in opportunities available to the son brought about
by workless fathers’ different backgrounds compared to employed fathers. Although
this procedure can say nothing about unobserved differences across families, the
extent to which differences exist which are observable will reduce any
bringing this term closer to zero. This process, although similar, is preferred to
controlling for observable differences in backgrounds as the simple inclusion of
background controls may lead to correlations between these and the sons’
characteristics in the decomposition. It is still likely that using this
technique. However, by comparing the results from the original decomposition to the
matched decomposition, the likely biases arising from a larger can be
assessed.
Table A2 presents the coefficients from equation (1), the basic
intergenerational correlations for the original sample and the matched sample. As
expected, the matched estimates are lower than the estimates from the unconditional
correlation in the full sample, driven by observed differences in the background
characteristics of employed and workless fathers. Note that this technique does not
imply that these estimates are causal as heterogeneity will remain across groups as we
can do nothing about unobservable differences across fathers. Some covariance
between the error terms is therefore likely to remain although the hope is that it will
be reduced using this technique. Table A2 also presents the results from conditional
correlations to illustrate that this technique does not vary much from simply using
conditional estimates. Matching is preferred here to remove the possibility of
correlations between background controls and child characteristics which may bias
the effect of the child characteristics that we are interested in.
Tables A3 presents the regression results from regressing spending a year or
more workless from 16-29 on the various sons’ characteristics for the matched
sample. While hyperactivity remains a significant predictor of future worklessness,
many of the other non-cognitive skills are not significantly associated with later
workless spells. The point estimates are actually larger for many of the characteristics
in this sample but so too are the standard errors. This is also true for the behavioural

34
outcomes although working part time is an increasingly important predictor of later
worklessness. For the cognitive test scores and the educational outcomes, the copying
test and GCSE attainment becomes insignificant but early picture and vocabulary tests
and the maths test are stronger significant predictors of future worklessness. The
amount of variation captured by these characteristics improves across both outcomes
with the R-squared increasing to 0.13 from 0.07.
The bivariate relationship between workless fathers and the characteristics of
the son for the matched sample are found in Table A4. While many of the associations
between having a workless father and the sons’ characteristics are weaker for the
matched sample, suggesting that part of the correlations observed in Table 4 are
driven by the other differences in the background characteristics of workless fathers
compared to employed fathers, the majority of the characteristics still have a
significant association with coming from a family with a workless father. This is in
contrast to the findings of Schoon et. al. (2012), who find that the relationship
between parental worklesness and child characteristics in their analysis is driven by
other background characteristics of the parent rather than by worklessness itself for
more recent cohorts. The non-cognitive and cognitive coefficients diminish by around
50% but the relationship between working part time and hyperactivity and having a
workless father increases for this matched sample.
Tables A5 presents the results from the matched decomposition. Non-
cognitive skills remain the dominant driver even when accounting for observed
differences between employed and workless fathers. These alone account for 11% of
the total correlation while cognition alone account for 11.2% of the total correlation.
However, when the two groups of characteristics are included together, as seen in
Table 5, non-cognitive skills dominate the role of cognition, contributing two-thirds
of the total amount accounted for with one-third working through cognition.
Behavioural outcomes are also contributing relatively more to the picture for this
matched sample accounting for just less than 6% of the total intergenerational
correlation compared to 2% in Table 5. This is driven mainly by the increased
association between fathers’ worklessness and working part time combined with an
increase in the association between working part time and future workless
experiences. Sons who work part time are 15% less likely to spend a year or more out
of work in the matched sample compared to sons who do not work part time. For the
most disadvantaged sons, in terms of coming from a home with a workless father,
35
personality traits and behaviours again dominate cognition and educational attainment
in terms of predicting long spells of worklessness in adulthood. The evidence is
therefore consistent with the results from the unmatched sample that soft skills are
playing more of a role compared cognition and educational attainment.
Overall, this suggests that we should be aware of the biases introduced by this
decomposition technique as they may cause us to understate the importance of
characteristics in these transmissions overall and may lead us to mistakenly count one
group of characteristics as more important than another. That said, the main results do
not actually change much from those in the matched decomposition and if anything
the precision of the decomposition increases in the matched estimation. The two main
conclusions from the analysis remain the same; that personality traits and behaviours
dominate cognition and education; and that personality traits and behaviours
contribute far more to the total intergenerational correlation that we are able to
account for when considering worklessness rather than incomes.
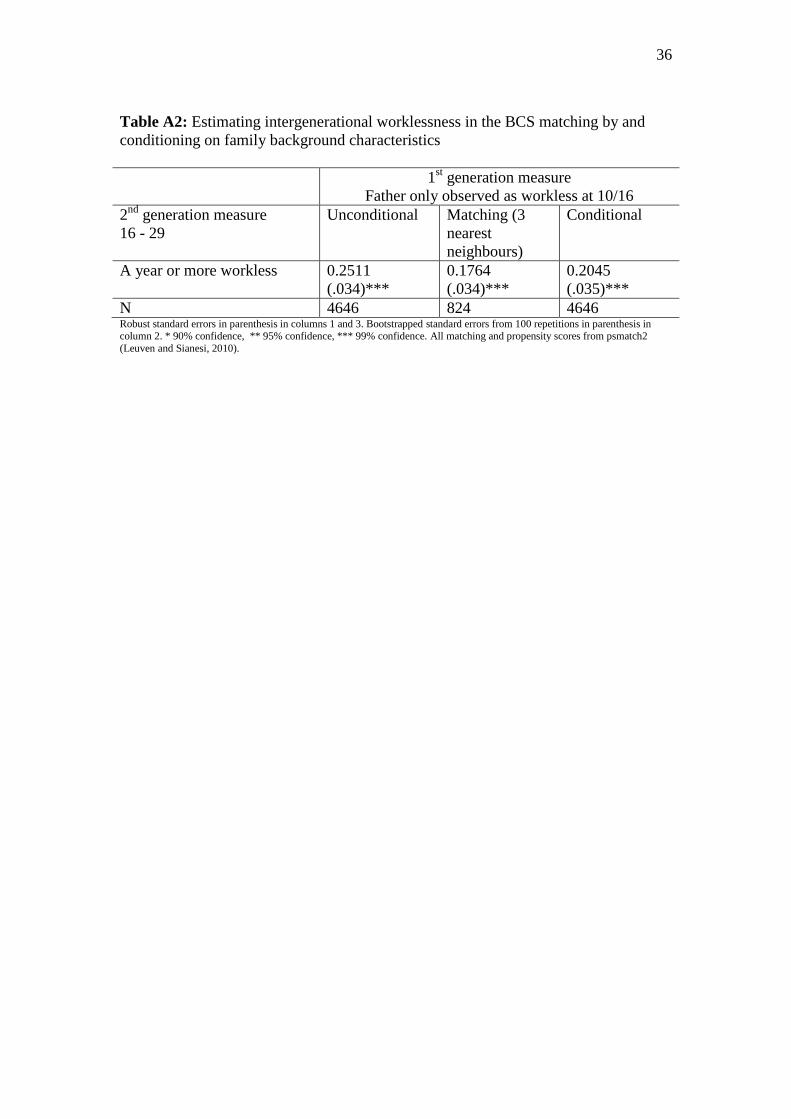
36
Table A2: Estimating intergenerational worklessness in the BCS matching by and
conditioning on family background characteristics
1st generation measure
Father only observed as workless at 10/16
2nd
generation measure
16 - 29
Unconditional Matching (3
nearest
neighbours)
Conditional
A year or more workless 0.2511
(.034)***
0.1764
(.034)***
0.2045
(.035)***
N 4646 824 4646 Robust standard errors in parenthesis in columns 1 and 3. Bootstrapped standard errors from 100 repetitions in parenthesis in column 2. * 90% confidence, ** 95% confidence, *** 99% confidence. All matching and propensity scores from psmatch2
(Leuven and Sianesi, 2010).
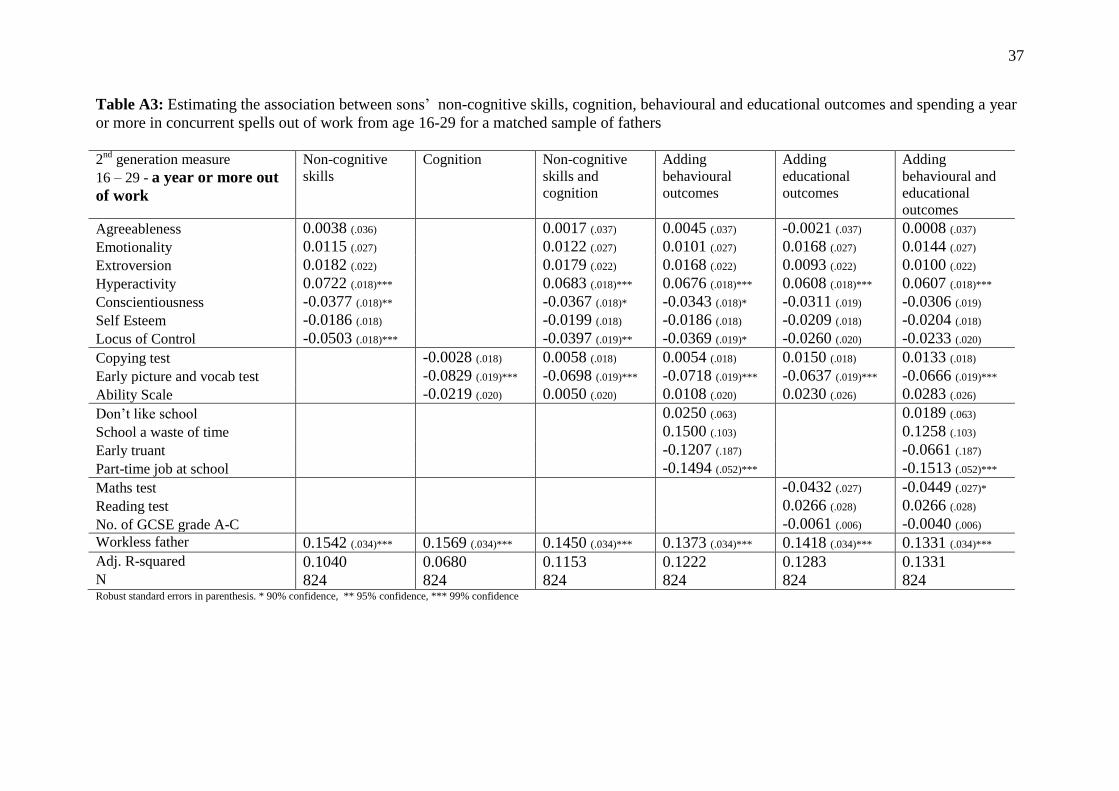
37
Table A3: Estimating the association between sons’ non-cognitive skills, cognition, behavioural and educational outcomes and spending a year
or more in concurrent spells out of work from age 16-29 for a matched sample of fathers
2
nd generation measure
16 – 29 - a year or more out
of work
Non-cognitive
skills Cognition Non-cognitive
skills and
cognition
Adding
behavioural
outcomes
Adding
educational
outcomes
Adding
behavioural and
educational
outcomes
Agreeableness 0.0038 (.036) 0.0017 (.037) 0.0045 (.037) -0.0021 (.037) 0.0008 (.037)
Emotionality 0.0115 (.027) 0.0122 (.027) 0.0101 (.027) 0.0168 (.027) 0.0144 (.027)
Extroversion 0.0182 (.022) 0.0179 (.022) 0.0168 (.022) 0.0093 (.022) 0.0100 (.022)
Hyperactivity 0.0722 (.018)*** 0.0683 (.018)*** 0.0676 (.018)*** 0.0608 (.018)*** 0.0607 (.018)***
Conscientiousness -0.0377 (.018)** -0.0367 (.018)* -0.0343 (.018)* -0.0311 (.019) -0.0306 (.019)
Self Esteem -0.0186 (.018) -0.0199 (.018) -0.0186 (.018) -0.0209 (.018) -0.0204 (.018)
Locus of Control -0.0503 (.018)*** -0.0397 (.019)** -0.0369 (.019)* -0.0260 (.020) -0.0233 (.020)
Copying test -0.0028 (.018) 0.0058 (.018) 0.0054 (.018) 0.0150 (.018) 0.0133 (.018)
Early picture and vocab test -0.0829 (.019)*** -0.0698 (.019)*** -0.0718 (.019)*** -0.0637 (.019)*** -0.0666 (.019)***
Ability Scale -0.0219 (.020) 0.0050 (.020) 0.0108 (.020) 0.0230 (.026) 0.0283 (.026)
Don’t like school 0.0250 (.063) 0.0189 (.063)
School a waste of time 0.1500 (.103) 0.1258 (.103)
Early truant -0.1207 (.187) -0.0661 (.187)
Part-time job at school -0.1494 (.052)*** -0.1513 (.052)***
Maths test -0.0432 (.027) -0.0449 (.027)*
Reading test 0.0266 (.028) 0.0266 (.028)
No. of GCSE grade A-C -0.0061 (.006) -0.0040 (.006)
Workless father 0.1542 (.034)*** 0.1569 (.034)*** 0.1450 (.034)*** 0.1373 (.034)*** 0.1418 (.034)*** 0.1331 (.034)*** Adj. R-squared 0.1040 0.0680 0.1153 0.1222 0.1283 0.1331 N 824 824 824 824 824 824 Robust standard errors in parenthesis. * 90% confidence, ** 95% confidence, *** 99% confidence

38
Table A4: Estimating bivariate associations between sons’ non-cognitive skills, cognition,
behavioural and educational outcomes and the workless experience of their father for a
matched sample of fathers
1st generation measure
Matched
sample
Agreeableness -0.1152 (.064)*
Emotionality -0.0831 (.072)
Extroversion -0.1020 (.078)
Hyperactivity 0.0543 (.079)**
Conscientiousness -0.1282 (.075)
Self Esteem -0.1345 (.072)*
Locus of Control -0.2291 (.071)***
Copying test -0.2353 (.070)***
Early picture and vocabulary -0.1835 (.066)***
Ability Scale -0.1769 (.065)***
Don’t like school -0.0087 (.017)
School a waste of time 0.0091 (.012)
Early truant 0.0543 (.063)
Part-time job at school -0.0645 (.023)***
Maths test -0.1819 (.069)***
Reading test -0.2177 (.067)***
No. of GCSE grade A-C -0.5941 (.219)***
Robust standard errors in parenthesis. * 90% confidence, ** 95% confidence, *** 99% confidence. Coefficients from separate univariate regressions of sons’ characteristic on fathers’ workless status and quadratic fathers’ age controls. N=824
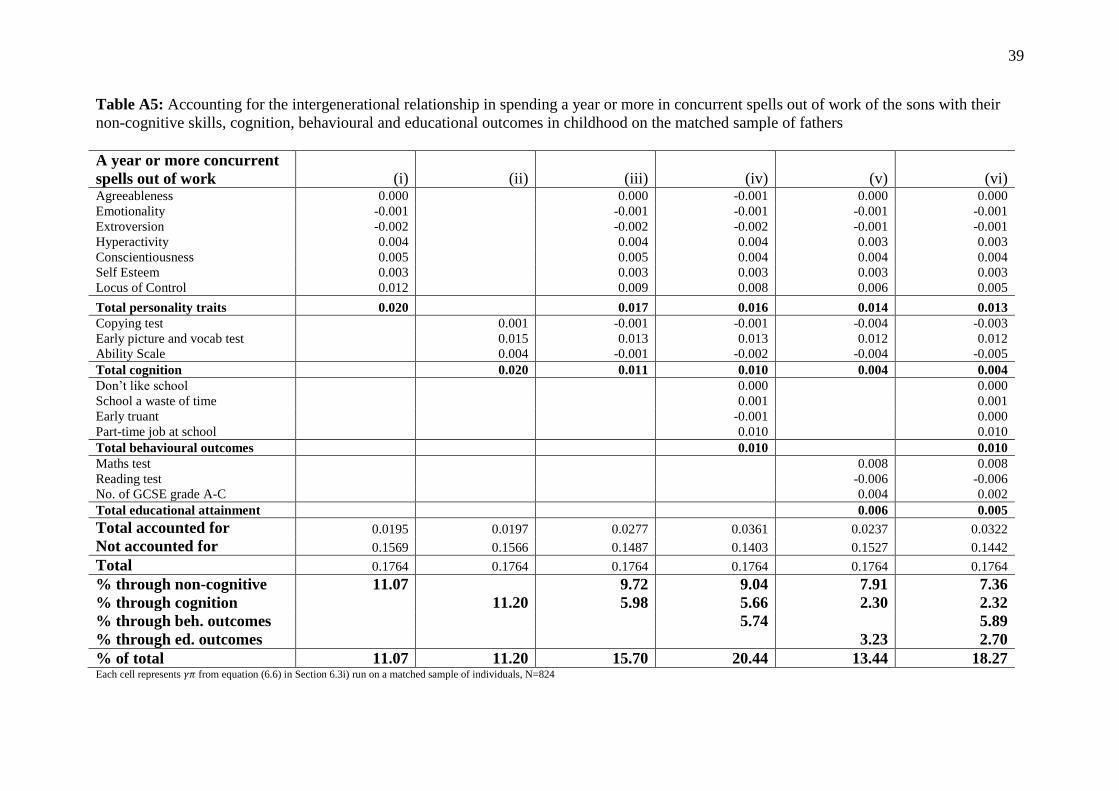
39
Table A5: Accounting for the intergenerational relationship in spending a year or more in concurrent spells out of work of the sons with their
non-cognitive skills, cognition, behavioural and educational outcomes in childhood on the matched sample of fathers
A year or more concurrent
spells out of work (i) (ii) (iii) (iv) (v) (vi) Agreeableness 0.000 0.000 -0.001 0.000 0.000
Emotionality -0.001 -0.001 -0.001 -0.001 -0.001
Extroversion -0.002 -0.002 -0.002 -0.001 -0.001
Hyperactivity 0.004 0.004 0.004 0.003 0.003
Conscientiousness 0.005 0.005 0.004 0.004 0.004
Self Esteem 0.003 0.003 0.003 0.003 0.003
Locus of Control 0.012 0.009 0.008 0.006 0.005
Total personality traits 0.020 0.017 0.016 0.014 0.013
Copying test 0.001 -0.001 -0.001 -0.004 -0.003
Early picture and vocab test 0.015 0.013 0.013 0.012 0.012
Ability Scale 0.004 -0.001 -0.002 -0.004 -0.005
Total cognition 0.020 0.011 0.010 0.004 0.004
Don’t like school 0.000 0.000
School a waste of time 0.001 0.001
Early truant -0.001 0.000
Part-time job at school 0.010 0.010
Total behavioural outcomes 0.010 0.010
Maths test 0.008 0.008
Reading test -0.006 -0.006
No. of GCSE grade A-C 0.004 0.002
Total educational attainment 0.006 0.005
Total accounted for 0.0195 0.0197 0.0277 0.0361 0.0237 0.0322
Not accounted for 0.1569 0.1566 0.1487 0.1403 0.1527 0.1442
Total 0.1764 0.1764 0.1764 0.1764 0.1764 0.1764
% through non-cognitive 11.07 9.72 9.04 7.91 7.36
% through cognition 11.20 5.98 5.66 2.30 2.32
% through beh. outcomes 5.74 5.89
% through ed. outcomes 3.23 2.70
% of total 11.07 11.20 15.70 20.44 13.44 18.27 Each cell represents from equation (6.6) in Section 6.3i) run on a matched sample of individuals, N=824

40
Figure A1: The distribution of the propensity scores of the treatment (workless fathers) and
control (employed fathers) groups from 3 nearest neighbours matching
All matching and propensity scores from psmatch2 (Leuven and Sianesi, 2010).
Related Documents