Twenty Second European Conference on Information Systems, Tel Aviv 2014 1 THE ROLE OF MOBILE BI CAPABILITIES IN MOBILE BI SUCCESS Complete Research Peters, Twan, Tilburg University, Tilburg, The Netherlands, [email protected] Popovič, Aleš, University of Ljubljana, Faculty of Economics, Ljubljana, Slovenia, [email protected] Işık, Öykü, Vlerick Business School, Information Systems Management Cluster, Leuven, Belgium, [email protected] Weigand, Hans, Dept Management, Tilburg University, Tilburg, The Netherlands, [email protected] Abstract While IS success research has gained considerable attention within academia in the past, understanding its constituents and the relationships among them has also emerged within professional fields. Since extant inquiries on the relationships among IS success dimensions have produced equivocal findings, the need to address IS success in the context of specific technologies has been regularly highlighted. Within business intelligence (BI) field one such pervasive technology gaining considerable attention is mobile BI (m-BI). Despite the recognized value that m-BI brings to firms, our understanding of the success of m-BI is limited. To address this gap, we conducted a quantitative study of key informants using m-BI, employing multiple data collection methods to understand what the key m-BI capabilities are and other success dimensions being perceived as important by users, and how they can be assessed. Our contribution to the BI and IT business value literature is twofold. First, our results highlight the users’ perceptions about m-BI capabilities that are deemed important for increasing satisfaction with m-BI and its use. Second, while these capabilities have a relatively high explanatory power for user satisfaction, their power to explain m-BI use is found to be rather low, suggesting there are other unobserved organizational characteristics importantly affecting m-BI usage behaviour, thus calling for further investigation. Keywords: Business Intelligence, BI success, Mobile BI, IS success, capabilities. 1 Introduction The value of information systems (IS) to advance decision-making and organizational performance has been increasingly highlighted in the information technology (IT) business value literature (e.g. Melville, Kraemer and Gurbaxani, 2004; Mithas, Ramasubbu and Sambamurthy, 2011). In firm performance studies, IS have been found to support timely decisions, provide information to manage uncertainty in the business environment, and promote innovation (Dewett and Jones, 2001; Melville et al., 2004). Quality information, i.e. information that is relevant, reliable, accurate and timely (Low and Mohr, 2001; Wixom, Watson and Werner, 2011), enables improved decisions and can, consecutively, boost improvement in performance (Raghunathan, 1999).

Welcome message from author
This document is posted to help you gain knowledge. Please leave a comment to let me know what you think about it! Share it to your friends and learn new things together.
Transcript
Twenty Second European Conference on Information Systems, Tel Aviv 2014 1
THE ROLE OF MOBILE BI CAPABILITIES IN MOBILE BI
SUCCESS
Complete Research
Peters, Twan, Tilburg University, Tilburg, The Netherlands, [email protected]
Popovič, Aleš, University of Ljubljana, Faculty of Economics, Ljubljana, Slovenia,
Işık, Öykü, Vlerick Business School, Information Systems Management Cluster, Leuven,
Belgium, [email protected]
Weigand, Hans, Dept Management, Tilburg University, Tilburg, The Netherlands,
Abstract
While IS success research has gained considerable attention within academia in the past, understanding
its constituents and the relationships among them has also emerged within professional fields. Since extant inquiries on the relationships among IS success dimensions have produced equivocal findings,
the need to address IS success in the context of specific technologies has been regularly highlighted.
Within business intelligence (BI) field one such pervasive technology gaining considerable attention is
mobile BI (m-BI).
Despite the recognized value that m-BI brings to firms, our understanding of the success of m-BI is
limited. To address this gap, we conducted a quantitative study of key informants using m-BI, employing
multiple data collection methods to understand what the key m-BI capabilities are and other success dimensions being perceived as important by users, and how they can be assessed.
Our contribution to the BI and IT business value literature is twofold. First, our results highlight the
users’ perceptions about m-BI capabilities that are deemed important for increasing satisfaction with
m-BI and its use. Second, while these capabilities have a relatively high explanatory power for user satisfaction, their power to explain m-BI use is found to be rather low, suggesting there are other
unobserved organizational characteristics importantly affecting m-BI usage behaviour, thus calling for
further investigation.
Keywords: Business Intelligence, BI success, Mobile BI, IS success, capabilities.
1 Introduction
The value of information systems (IS) to advance decision-making and organizational performance has
been increasingly highlighted in the information technology (IT) business value literature (e.g. Melville,
Kraemer and Gurbaxani, 2004; Mithas, Ramasubbu and Sambamurthy, 2011). In firm performance studies, IS have been found to support timely decisions, provide information to manage uncertainty in
the business environment, and promote innovation (Dewett and Jones, 2001; Melville et al., 2004).
Quality information, i.e. information that is relevant, reliable, accurate and timely (Low and Mohr, 2001; Wixom, Watson and Werner, 2011), enables improved decisions and can, consecutively, boost
improvement in performance (Raghunathan, 1999).
Peters et al. /Mobile BI capabilities and success
Twenty Second European Conference on Information Systems, Tel Aviv 2014 2
Within the IT/IS and business intelligence (BI) studies, BI systems are well recognized to contribute to
decision-making (Popovič, Hackney, Coelho and Jaklič, 2012). These systems are distinctive complex
IS and are currently ranked among the top 10 strategic technologies (Tapadinhas, 2012). In exploring business value of BI, extant studies suggest BI aid improvements in firms’ strategic planning, business
processes, and improvements of performance (Negash and Gray, 2008; Shanks, Bekmamedova, Adam
and Daly, 2012).
While research suggests achieving such performance benefits depends largely on the ability to best
utilize the information in decision-making processes and less on the technology itself (Rindfleisch and
Moorman, 2001), inquiries on the relationships among IS success dimensions have produced equivocal findings (e.g. Auster and Choo, 1993; Todd and Benbasat, 1992). Researchers, consequently, have
highlighted the need to understand these relationships in the context of a specific technology. One such
technology within BI field that has recently gained attention from both academia and practice is mobile
BI (hereafter referred to as “m-BI”). M-BI could be viewed as the extension of BI to smartphones and tablets. For the purpose of this study, we consider m-BI as a system comprised of both technical and
organizational elements that presents historical and/or real-time information to its users for analysis
on mobile devices such as smartphones and tablets (not laptops), to enable effective decision making and management support, for the overall purpose of increasing firm performance (Isik, Jones and
Sidorova, 2011).
This topic is worth exploring, because even though m-BI is considered as a sub-field or sub-market of BI, it is complementary to traditional BI rather than a substitute (Tona and Carlsson, 2013). This is
because m-BI differs from traditional BI in terms of system characteristics as well as user experience.
Today, m-BI is mostly used for information consumption via simple yet almost real-time analysis
methods, whereas traditional BI is still preferred for advanced techniques as well as information creation (Tona and Carlsson, 2013). A critical difference also exists from a usage perspective; m-BI introduces
a new way of delivering information through the new generation of mobile devices.
Despite the recognition of the value of m-BI and overall interest in the topic, our understanding of the success of m-BI, specifically m-BI capabilities and their effect on users’ satisfaction and m-BI use, is
limited. To address this gap, we conducted an empirical investigation using multiple data collection
methods to gather responses from key informants of various firms. We explored the following research
question; which m-BI success dimensions are deemed important by the users?
The rest of this paper is organized as follows. We first set the theoretical background for our research.
More specifically, we examine m-BI capabilities and their links to user satisfaction and actual use, as
well as the relationships of the latter to potential net benefits. We then outline the research approach followed in this study. We introduce the research model, hypotheses, outline the sources of data and
explain our data analysis procedure. This is followed by our findings on key m-BI capabilities’ influence
on user satisfaction and system use, and the link to actual benefits. In the discussion section, we explore the theoretical contributions and managerial implications of our findings. The paper concludes with
acknowledged limitations and opportunities for future research.
2 BI success
BI success is the positive value an organization obtains from its BI investment (Isik, Jones and Sidorova,
2013). BI success can be measured by an increase in firms’ profits, or enhancement to competitive advantage (Farrokhi and Pokoradi, 2012). However, these are difficult to measure, because many BI-
enabled benefits are intangible and non-financial, such as improved decision-making or timely
information. When these advantages transfer into financial benefits, such as cost-savings or profit increase, the time lag between the actual production of intelligence and financial gain makes it difficult
Peters et al. /Mobile BI capabilities and success
Twenty Second European Conference on Information Systems, Tel Aviv 2014 3
to tie the benefits to BI (Lönnqvist and Pirttimäki, 2006). Therefore, subjective measures are often used
to measure BI success, which enables researchers and firms to understand the perceptions and the extent
to which the users realised their expected benefits with BI, and to investigate which BI capabilities are important to increase the perceived benefits (Isik et al., 2013; Popovič et al., 2012). This enables firms
to take BI adoption decisions whilst having a clear understanding of the BI capabilities that define the
success of BI from the user’s perspective. Firms that take advantage of these BI capabilities can expect an increase in BI usage and, as a result, an increase in the value BI systems provide (Isik et al., 2013).
The extant body of knowledge about abovementioned BI capabilities in the m-BI context is scarce. To
the best of our knowledge no prior research has explored the relationship between the m-BI capabilities and its success. It may very well be that the use of m-BI will change the decision processes in the
organization, e.g. lead to decentralization, hence, we cannot assume that the same BI capabilities apply.
Therefore we set out to understand, from the users’ perspective, the relationship between m-BI
capabilities and m-BI success.
Drawing upon renowned DeLone and McLean’s IS success model (2003), lately investigated within
traditional BI context (Tona, Carlsson and Eom, 2012), we examine the relationship between m-BI
capabilities and m-BI success at an individual level of analysis. We believe applying the model to m-BI context will help us understand the multi-dimensional nature of m-BI success. Because of our interest
in the role of user satisfaction and use, Isik et al.’s (2013) BI success model was not inclusive enough
for our purposes. We have decided to use the updated DeLone and McLean’s model (2003) as it was refined based on ten years of research and the net benefits construct implies that the impact of m-BI is
beyond its immediate user.
To be applicable to the m-BI context, the original IS success model required certain adjustments. First,
DeLone and McLean (DeLone and McLean, 2003) argued that the service quality construct is of greater relevance for measuring the success of an IS department than measuring an IS instance. This argument
is supported by various studies that did not find a significant relationship between service quality and
user satisfaction, and service quality and use constructs at the individual level (e.g. Petter, DeLone and McLean, 2008; Petter and McLean, 2009). Next to that, service quality is a multidimensional construct
which also includes a combination of system quality and information quality constructs (Kang, 2006).
Therefore, in order not to overlap the quality constructs, we have focused on system and information
quality, and excluded service quality. Also, it is important to emphasize that service quality is not necessarily irrelevant for m-BI; but the context should dictate whether or not to include this construct
(DeLone and McLean, 2003). We opted not to as we focus on the functionality of the m-BI, and consider
the overall support delivered by the service provider out of scope for this research. Second, for the system quality construct, we have only selected the desired system quality characteristics that are
deemed significant in BI studies, m-BI capabilities that are pointed as important in m-BI articles and
can be measured from the users’ perspectives. While the DeLone and McLean’s IS success model (2003) integrates system quality characteristics into one construct, we chose to keep system quality related m-
BI capabilities as separate constructs in order to be able to investigate the potential difference in
significance levels. To more comprehensively link the constructs from seminal IS success research to
m-BI context, we now present each construct in greater detail.
2.1 System Quality
2.1.1 Accessibility
Accessibility of information is an important attribute of information use (Jeong and Lambert, 2001).
Within the BI context, research shows that the way users access and use BI is critical for BI success and high quality user access methods increases decision making effectiveness (Isik et al., 2013). It is
Peters et al. /Mobile BI capabilities and success
Twenty Second European Conference on Information Systems, Tel Aviv 2014 4
important for organisations to achieve the necessary balance among the ways in which users access
information, to fit the types of decisions they make using BI (Işık et al., 2013). How organisations
provide access to information with authorization/authentication controls should match the user’s needs. For example, store managers may need access to the current sales results for theirs and other stores in
the region, while sales people may only need access to customer data. User access is a critical BI
capability that impacts BI success as well as user satisfaction with BI (Isik et al., 2011; Isik et al., 2013).
Research has also examined information access quality as a combination of bandwidth, customization
capabilities and interactivity dimensions (Popovič et al., 2012). These correspond to the three
information quality criteria of Eppler’s (2006) information quality framework, namely; timeliness, convenience and traceability. When m-BI is used outside the wireless business network, its accessibility
depends on the provider’s bandwidth capabilities. When accessed information is not processed and
delivered as expected, this could frustrate the user, and decrease m-BI usage. Hence,
bandwidth/timeliness could be an important accessibility attribute for m-BI. Anywhere and anytime accessibility is one of the success factors of m-BI (Tapadinhas, 2012). The portability of a mobile device
makes it possible to access information anytime and anywhere. Research has examined the impact of
accessibility in the context of other mobile technologies, such as mobile banking (Lee and Chung, 2009), and showed that it significantly impacts system success. We believe accessibility anytime and anywhere
may be a critical capability for m-BI as well. Based on these implications, we define accessibility
according to the users’ perceptions of the user access quality, bandwidth and anytime and anywhere accessibility.
2.1.2 Attractive Interface Design
IS are not only judged by their functionality, but also their looks; users like systems with an attractive
and appealing user interface (Mishra, 2012). Research shows that a visually appealing interface has a
significant positive effect on user satisfaction with information seeking activities (Santosa, Wei and Chan, 2005). Even though users who deal with data access and manipulation on a daily basis may have
a higher tolerance for unappealing interfaces, an appealing interface provides a powerful first
impression; it can engage users, improve the adoption rate of BI, and also affect the degree in which one enjoys continued use of a particular BI tool (Howson, 2007). Business users also prefer software with
attractive interfaces (Schrepp, Held and Laugwitz, 2006). Appealing and attractive visualisations are
one of the features that make BI attractive for business users (Williams and Williams, 2007).
We posit that a visually attractive interface design not only makes a BI tool more pleasant to work with, but also affects the adoption rate and user satisfaction with m-BI. The attractive interface design of m-
BI includes visualisations, graphs, tables, dashboard layouts etc. and they may be among the factors that
explain the success of m-BI.
2.1.3 Ease of Use
Ease of use can be defined as the degree to which a system is user friendly (Doll and Torkzadeh, 1988).
An empirically validated end-user computer satisfaction instrument (Doll and Torkzadeh, 1988) has
been previously employed within the BI context to examine the effect of user satisfaction on system
usage and individual performance with BI (Hou, 2012), and found significant evidence that ease of use impacts BI performance. Another research that examines what users consider as key features that
enhance use and adoption of BI showed that ease of use is vital or very important for BI use (Howson,
2007). Ease of use is also a key adoption driver for m-BI (Tapadinhas, 2012). It is therefore intuitive to suggest that for users to benefit from m-BI they must be able to navigate dashboards and guided analytics
as comfortably as the mobile device will allow (Chandras, 2011).
Peters et al. /Mobile BI capabilities and success
Twenty Second European Conference on Information Systems, Tel Aviv 2014 5
2.1.4 Flexibility
Users should easily be able to modify their BI to their needs, insufficient flexibility may withhold users
from using BI. However, too much flexibility may increase complexity and reduce usability (Gebauer
and Schober, 2006). Although organizations need flexibility and robust functionality to experience the
optimal potential of BI (Isik et al., 2013), technology does not always support exceptional situations. A m-BI user should be able to modify the m-BI solution to his needs, and therefore, we define flexibility
as an important capability of m-BI.
2.2 Information quality
Information quality refers to the quality of the information the system produces (DeLone and McLean,
2003). If the information coming out of BI environment is not of expected quality as considered by decision makers, it can significantly impact the decision making activities and further affect firm
performance. High information quality is not only important for firms, but it is also a business value
driver for BI through business processes (Popovič, Turk and Jaklič, 2010). Recent research findings indicate that BI users still have issues with reliability and accuracy of the data in their BI environments
(Isik et al., 2011). Research also shows that the unsuitability of information quality affects future uses
of information and can easily lead to less desirable business decisions (Popovič et al., 2012). This may
result in dissatisfaction with BI and ultimately in the non-use of BI. Hence, we suggest information quality has significant impact on the success of m-BI.
2.3 Use
System use is a key variable in understanding IS success (DeLone and McLean, 2003) and has played a
central role in IS research (Burton-Jones and Straub, 2006). It can be defined as the consumption of an IS or its output described in terms of actual or self-reported usage (Petter and McLean, 2009). Research
has showed that use significantly impacts net benefits gained from the IS, at the individual level (Petter
et al., 2008). Intention to use a system does not always result in an actual use behaviour (Petter and
McLean, 2009). Hence, many has studied the actual use (behaviour) versus the intention to use (an attitude) a system. Intention to use can be defined as expected future consumption of an IS or its output
(Petter and McLean, 2009). Even though intention to use seems to significantly impact net benefits, we
have chosen not to use this construct in our research, as we are interested in examining the current actual users of m-BI and how it impacts m-BI success.
2.4 User satisfaction
The regular use of an IS along with user satisfaction leads to net benefits with the system (DeLone and
McLean, 2003). User satisfaction is a common surrogate measure for IS success and effectiveness, for
which several standard instruments have been developed and tested (DeLone and McLean, 2003). Even though user satisfaction has been frequently tested within different contexts, it has not received much
attention from BI researchers. Limited research provides evidence that higher levels of user satisfaction
may lead to increased BI use and to improved individual performance (Hou, 2012). It is suggested that more experienced BI users tend to be more satisfied with user friendliness of and the decision-making
support provided by their BI (Isik et al., 2011). Interestingly, BI capabilities that most strongly relate to
BI success are not necessarily the ones with which users are most satisfied with (Isik et al., 2011).
Finally, Cox’s (2010) research confirms the positive relationship between frequent BI use and quality and speed of decisions made. Following these indications with regards to satisfaction with BI and also
taking into consideration that an increasing number of companies are adopting m-BI, there is a need to
better understand how user satisfaction relates to benefits obtained from m-BI.
Peters et al. /Mobile BI capabilities and success
Twenty Second European Conference on Information Systems, Tel Aviv 2014 6
2.5 Net benefits
Net benefits construct captures the balance of positive and negative impacts of the IS and represents its
success level. Net benefits of an IS may be always the same, but they are context specific (DeLone and
McLean, 2003; Seddon, Staples, Patnayakuni and Bowtell, 1999). Hence, this study looks at the benefits
that can be realised through the use of m-BI at the individual level of analysis.
The output of m-BI is processed information, yet, such information has to be used to actually have an
impact on performance. In other words, m-BI must be utilised before it can deliver performance effects
(Hou, 2012). For example, when used properly, BI enables line managers to access relevant and timely information, such as daily customer and product updates, and to make better and instantaneous
decisions. However, Negash and Gray (2008) states that BI is not only beneficial for operational
business processes, but also for making decisions at the tactical and strategic level. In the light of these findings, we suggest that both use of and user satisfaction with m-BI significantly impact net benefits
obtained from it.
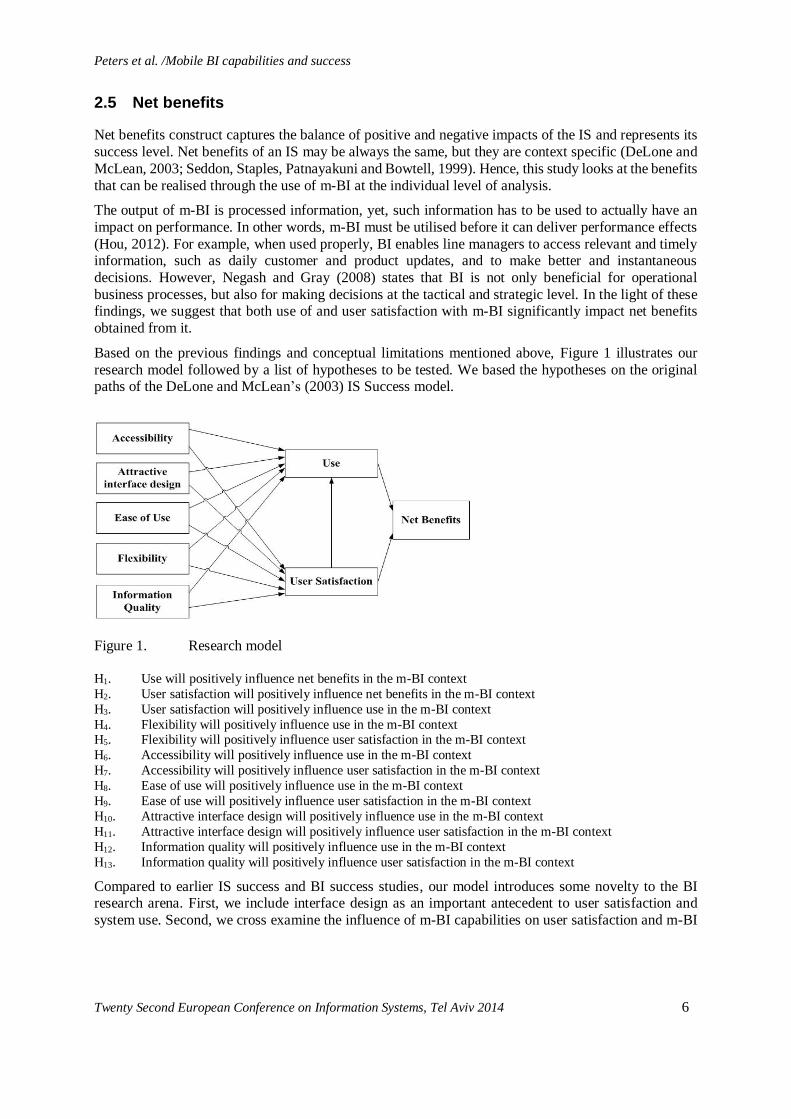
Based on the previous findings and conceptual limitations mentioned above, Figure 1 illustrates our
research model followed by a list of hypotheses to be tested. We based the hypotheses on the original paths of the DeLone and McLean’s (2003) IS Success model.
Figure 1. Research model
H1. Use will positively influence net benefits in the m-BI context
H2. User satisfaction will positively influence net benefits in the m-BI context
H3. User satisfaction will positively influence use in the m-BI context
H4. Flexibility will positively influence use in the m-BI context H5. Flexibility will positively influence user satisfaction in the m-BI context
H6. Accessibility will positively influence use in the m-BI context
H7. Accessibility will positively influence user satisfaction in the m-BI context
H8. Ease of use will positively influence use in the m-BI context
H9. Ease of use will positively influence user satisfaction in the m-BI context
H10. Attractive interface design will positively influence use in the m-BI context
H11. Attractive interface design will positively influence user satisfaction in the m-BI context
H12. Information quality will positively influence use in the m-BI context
H13. Information quality will positively influence user satisfaction in the m-BI context
Compared to earlier IS success and BI success studies, our model introduces some novelty to the BI research arena. First, we include interface design as an important antecedent to user satisfaction and
system use. Second, we cross examine the influence of m-BI capabilities on user satisfaction and m-BI
Peters et al. /Mobile BI capabilities and success
Twenty Second European Conference on Information Systems, Tel Aviv 2014 7
table continues
use. Third, we try to shed light on the relationships between user satisfaction, system use and net benefits
in the context of m-BI.
3 Methodology
3.1 Research design, instrument development, and data collection
Our study employed a structured questionnaire, combining five-point Likert and five-point semantic differential scales. To ensure content validity, we developed questions by building on established theory
and validated surveys. The final questionnaire was refined by several BI experts from the industry and
three BI professors from different universities. Based on their suggestions, ambiguity, sequencing and
flow of the questions were improved. The participants were given introduction letters which explained the aims and procedures of the study. Pre-notifications, reminders, keeping the survey as short as
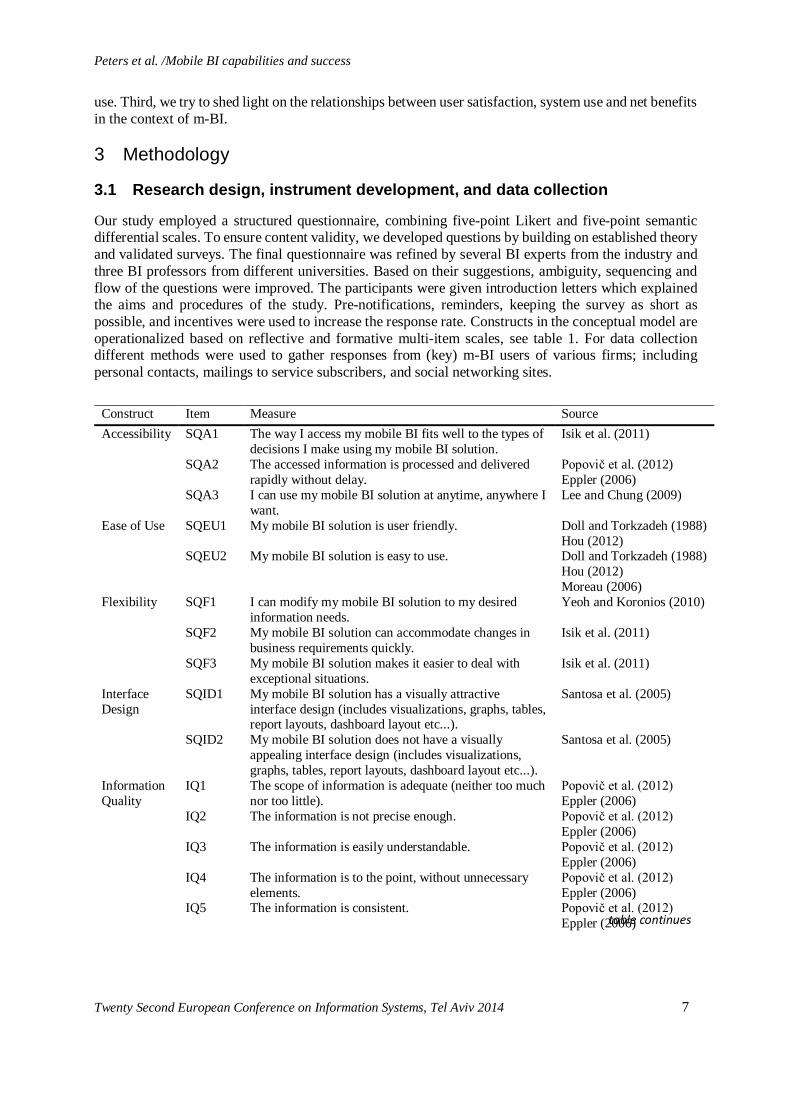
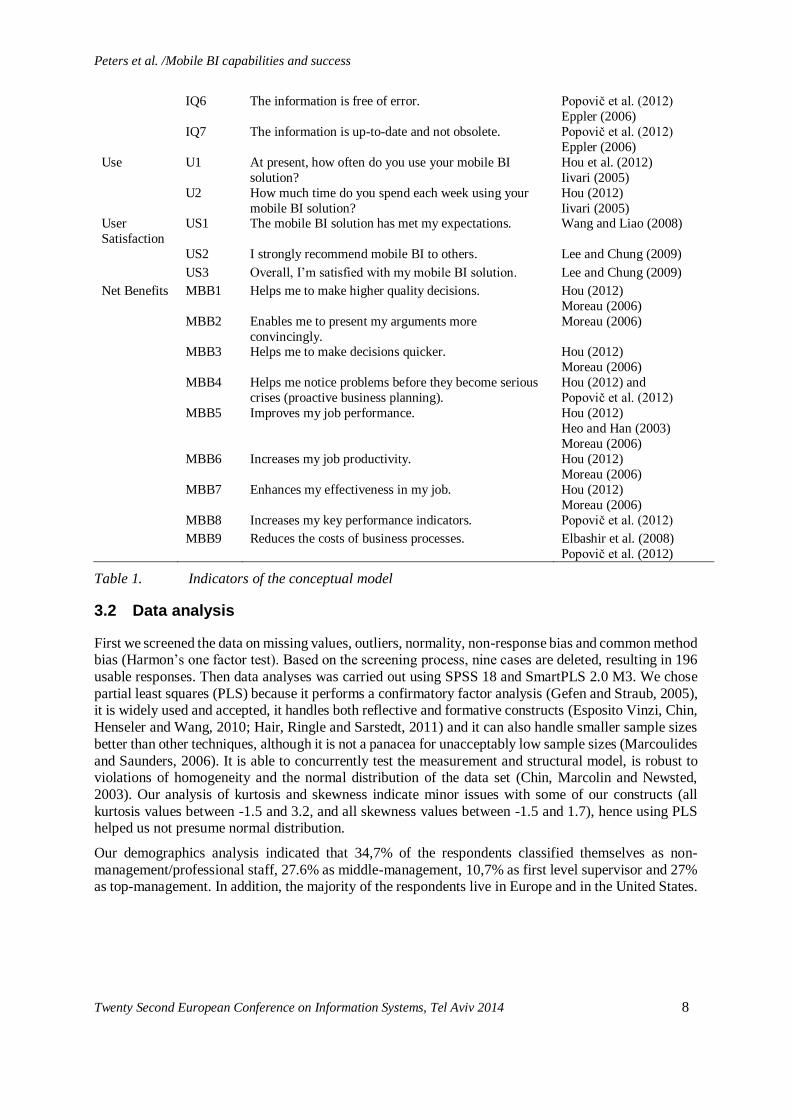
possible, and incentives were used to increase the response rate. Constructs in the conceptual model are
operationalized based on reflective and formative multi-item scales, see table 1. For data collection different methods were used to gather responses from (key) m-BI users of various firms; including
personal contacts, mailings to service subscribers, and social networking sites.
Construct Item Measure Source
Accessibility SQA1 The way I access my mobile BI fits well to the types of
decisions I make using my mobile BI solution.
Isik et al. (2011)
SQA2 The accessed information is processed and delivered
rapidly without delay.
Popovič et al. (2012)
Eppler (2006)
SQA3 I can use my mobile BI solution at anytime, anywhere I
want.
Lee and Chung (2009)
Ease of Use SQEU1 My mobile BI solution is user friendly. Doll and Torkzadeh (1988)
Hou (2012) SQEU2 My mobile BI solution is easy to use. Doll and Torkzadeh (1988)
Hou (2012)
Moreau (2006)
Flexibility SQF1 I can modify my mobile BI solution to my desired
information needs.
Yeoh and Koronios (2010)
SQF2 My mobile BI solution can accommodate changes in
business requirements quickly.
Isik et al. (2011)
SQF3 My mobile BI solution makes it easier to deal with
exceptional situations.
Isik et al. (2011)
Interface
Design
SQID1 My mobile BI solution has a visually attractive
interface design (includes visualizations, graphs, tables, report layouts, dashboard layout etc...).
Santosa et al. (2005)
SQID2 My mobile BI solution does not have a visually
appealing interface design (includes visualizations,
graphs, tables, report layouts, dashboard layout etc...).
Santosa et al. (2005)
Information
Quality
IQ1 The scope of information is adequate (neither too much
nor too little).
Popovič et al. (2012)
Eppler (2006)
IQ2 The information is not precise enough. Popovič et al. (2012)
Eppler (2006)
IQ3 The information is easily understandable. Popovič et al. (2012)
Eppler (2006)
IQ4 The information is to the point, without unnecessary
elements.
Popovič et al. (2012)
Eppler (2006) IQ5 The information is consistent. Popovič et al. (2012)
Eppler (2006)
Peters et al. /Mobile BI capabilities and success
Twenty Second European Conference on Information Systems, Tel Aviv 2014 8
IQ6 The information is free of error. Popovič et al. (2012)
Eppler (2006)
IQ7 The information is up-to-date and not obsolete. Popovič et al. (2012)
Eppler (2006)
Use U1 At present, how often do you use your mobile BI
solution?
Hou et al. (2012)
Iivari (2005)
U2 How much time do you spend each week using your
mobile BI solution?
Hou (2012)
Iivari (2005) User
Satisfaction
US1 The mobile BI solution has met my expectations. Wang and Liao (2008)
US2 I strongly recommend mobile BI to others. Lee and Chung (2009)
US3 Overall, I’m satisfied with my mobile BI solution. Lee and Chung (2009)
Net Benefits MBB1 Helps me to make higher quality decisions. Hou (2012)
Moreau (2006)
MBB2 Enables me to present my arguments more
convincingly.
Moreau (2006)
MBB3 Helps me to make decisions quicker. Hou (2012)
Moreau (2006)
MBB4 Helps me notice problems before they become serious
crises (proactive business planning).
Hou (2012) and
Popovič et al. (2012)
MBB5 Improves my job performance. Hou (2012)
Heo and Han (2003)
Moreau (2006)
MBB6 Increases my job productivity. Hou (2012)
Moreau (2006)
MBB7 Enhances my effectiveness in my job. Hou (2012)
Moreau (2006)
MBB8 Increases my key performance indicators. Popovič et al. (2012)
MBB9 Reduces the costs of business processes. Elbashir et al. (2008)
Popovič et al. (2012)
Table 1. Indicators of the conceptual model
3.2 Data analysis
First we screened the data on missing values, outliers, normality, non-response bias and common method bias (Harmon’s one factor test). Based on the screening process, nine cases are deleted, resulting in 196
usable responses. Then data analyses was carried out using SPSS 18 and SmartPLS 2.0 M3. We chose
partial least squares (PLS) because it performs a confirmatory factor analysis (Gefen and Straub, 2005), it is widely used and accepted, it handles both reflective and formative constructs (Esposito Vinzi, Chin,
Henseler and Wang, 2010; Hair, Ringle and Sarstedt, 2011) and it can also handle smaller sample sizes
better than other techniques, although it is not a panacea for unacceptably low sample sizes (Marcoulides
and Saunders, 2006). It is able to concurrently test the measurement and structural model, is robust to violations of homogeneity and the normal distribution of the data set (Chin, Marcolin and Newsted,
2003). Our analysis of kurtosis and skewness indicate minor issues with some of our constructs (all
kurtosis values between -1.5 and 3.2, and all skewness values between -1.5 and 1.7), hence using PLS helped us not presume normal distribution.
Our demographics analysis indicated that 34,7% of the respondents classified themselves as non-
management/professional staff, 27.6% as middle-management, 10,7% as first level supervisor and 27% as top-management. In addition, the majority of the respondents live in Europe and in the United States.
Peters et al. /Mobile BI capabilities and success
Twenty Second European Conference on Information Systems, Tel Aviv 2014 9
4 Results
In our research model, we used three formative constructs; accessibility, information quality and net
benefits. We used formative constructs because according to Fornell and Bookstein (1982), ‘constructs
such as ‘personality‘ or ‘attitude‘ are typically viewed as underlying factors that give rise to something that is observed. Their indicators tend to be realized then as reflective. On the other hand, when
constructs are conceived as explanatory combinations of indicators (such as population change, or
marketing mix) that are determined by a combination of variables, their indicators should be formative’. Working out this definition, accessibility, net benefits and information quality are specified as formative
constructs in this study. However, reliability and validity assessments that are used for the reflective
constructs are not appropriate for these constructs (Edwards, 2011; MacKenzie, Podsakoff and Jarvis,
2005). Petter, Straub and Rai (2007) developed a framework to assess the validity and reliability of formative constructs, which was also recommended by Hair et al. (2011) and Henseler, Ringle and
Sinkovics (2009). In this study, we also employ this framework to assess the validity and reliability of
the formative constructs.
4.1 Confirmatory factor analysis
This study is confirmatory in nature and the conceptual model is built on the basis of findings of previous empirical research. Hence, the structural equation modelling (SEM) method was used to test the research
model. To ensure data validity and reliability of the reflective constructs, the Cronbach's alpha,
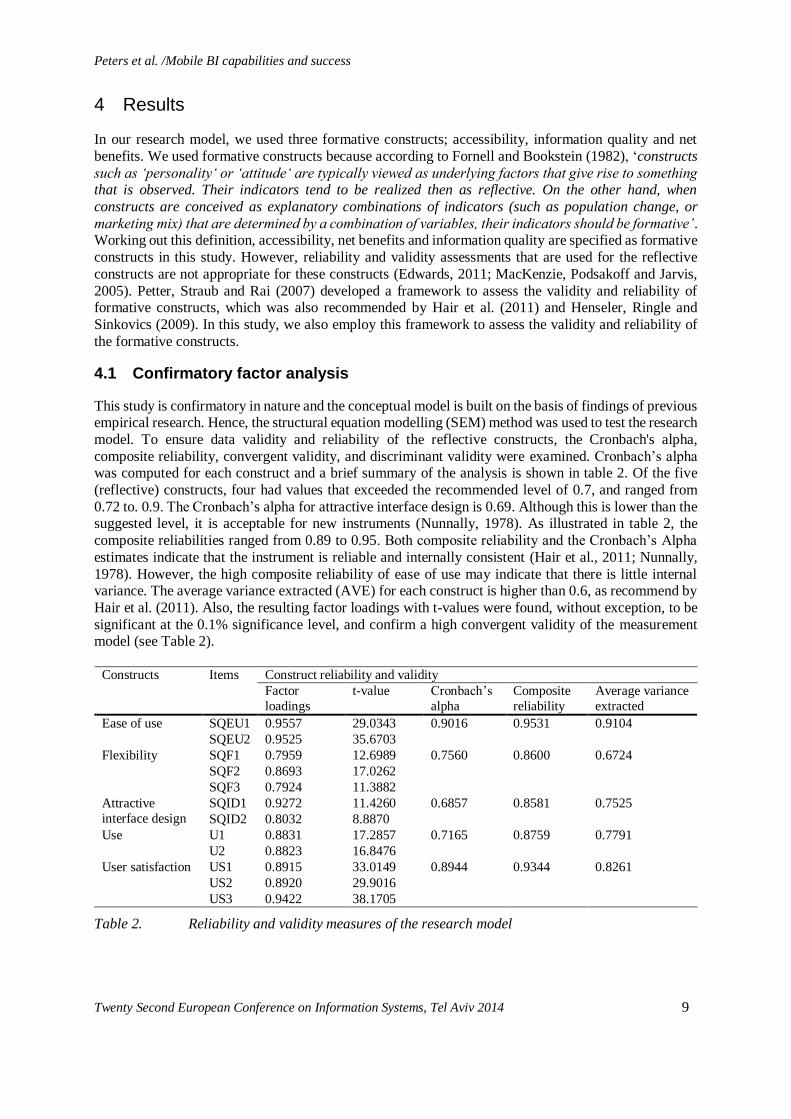
composite reliability, convergent validity, and discriminant validity were examined. Cronbach’s alpha was computed for each construct and a brief summary of the analysis is shown in table 2. Of the five
(reflective) constructs, four had values that exceeded the recommended level of 0.7, and ranged from
0.72 to. 0.9. The Cronbach’s alpha for attractive interface design is 0.69. Although this is lower than the suggested level, it is acceptable for new instruments (Nunnally, 1978). As illustrated in table 2, the
composite reliabilities ranged from 0.89 to 0.95. Both composite reliability and the Cronbach’s Alpha
estimates indicate that the instrument is reliable and internally consistent (Hair et al., 2011; Nunnally,
1978). However, the high composite reliability of ease of use may indicate that there is little internal variance. The average variance extracted (AVE) for each construct is higher than 0.6, as recommend by
Hair et al. (2011). Also, the resulting factor loadings with t-values were found, without exception, to be
significant at the 0.1% significance level, and confirm a high convergent validity of the measurement model (see Table 2).
Constructs Items Construct reliability and validity
Factor
loadings
t-value Cronbach’s
alpha
Composite
reliability
Average variance
extracted
Ease of use SQEU1 0.9557 29.0343 0.9016 0.9531 0.9104
SQEU2 0.9525 35.6703
Flexibility SQF1 0.7959 12.6989 0.7560 0.8600 0.6724
SQF2 0.8693 17.0262
SQF3 0.7924 11.3882
Attractive
interface design
SQID1 0.9272 11.4260 0.6857 0.8581 0.7525
SQID2 0.8032 8.8870
Use U1 0.8831 17.2857 0.7165 0.8759 0.7791
U2 0.8823 16.8476
User satisfaction US1 0.8915 33.0149 0.8944 0.9344 0.8261
US2 0.8920 29.9016
US3 0.9422 38.1705
Table 2. Reliability and validity measures of the research model
Peters et al. /Mobile BI capabilities and success
Twenty Second European Conference on Information Systems, Tel Aviv 2014 10
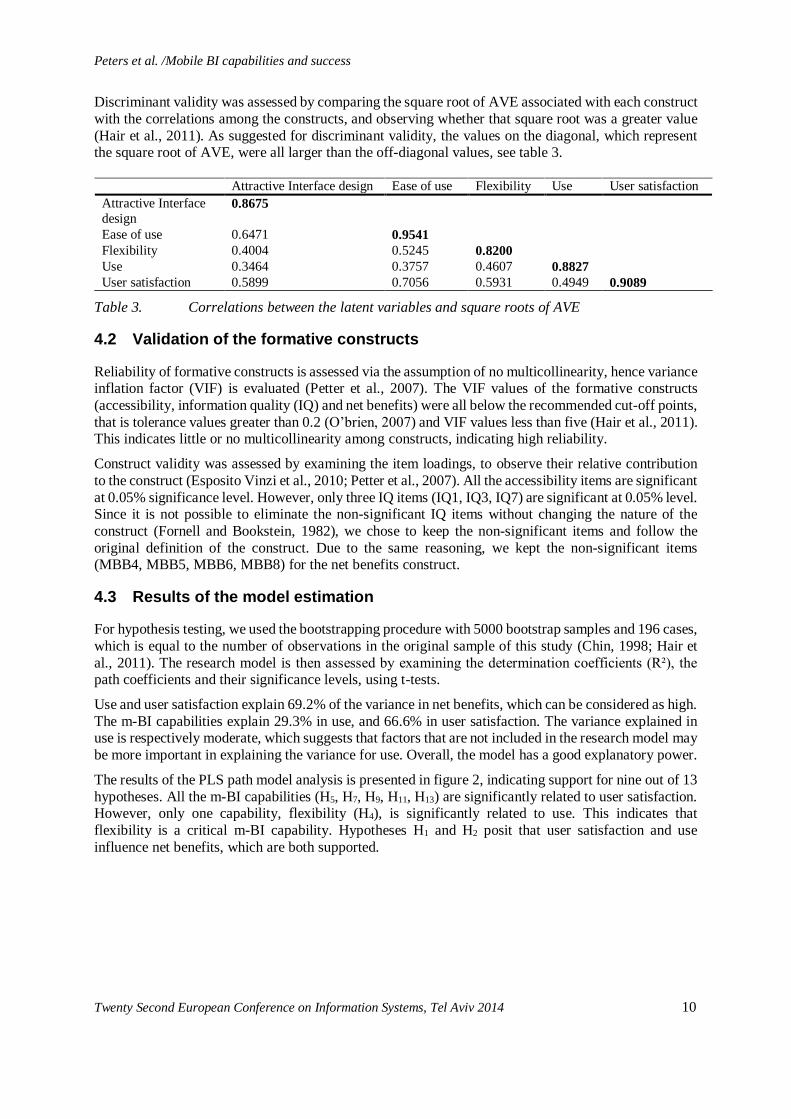
Discriminant validity was assessed by comparing the square root of AVE associated with each construct
with the correlations among the constructs, and observing whether that square root was a greater value
(Hair et al., 2011). As suggested for discriminant validity, the values on the diagonal, which represent the square root of AVE, were all larger than the off-diagonal values, see table 3.
Attractive Interface design Ease of use Flexibility Use User satisfaction
Attractive Interface
design 0.8675
Ease of use 0.6471 0.9541
Flexibility 0.4004 0.5245 0.8200
Use 0.3464 0.3757 0.4607 0.8827
User satisfaction 0.5899 0.7056 0.5931 0.4949 0.9089
Table 3. Correlations between the latent variables and square roots of AVE
4.2 Validation of the formative constructs
Reliability of formative constructs is assessed via the assumption of no multicollinearity, hence variance inflation factor (VIF) is evaluated (Petter et al., 2007). The VIF values of the formative constructs
(accessibility, information quality (IQ) and net benefits) were all below the recommended cut-off points,
that is tolerance values greater than 0.2 (O’brien, 2007) and VIF values less than five (Hair et al., 2011). This indicates little or no multicollinearity among constructs, indicating high reliability.
Construct validity was assessed by examining the item loadings, to observe their relative contribution
to the construct (Esposito Vinzi et al., 2010; Petter et al., 2007). All the accessibility items are significant
at 0.05% significance level. However, only three IQ items (IQ1, IQ3, IQ7) are significant at 0.05% level. Since it is not possible to eliminate the non-significant IQ items without changing the nature of the
construct (Fornell and Bookstein, 1982), we chose to keep the non-significant items and follow the
original definition of the construct. Due to the same reasoning, we kept the non-significant items (MBB4, MBB5, MBB6, MBB8) for the net benefits construct.
4.3 Results of the model estimation
For hypothesis testing, we used the bootstrapping procedure with 5000 bootstrap samples and 196 cases,
which is equal to the number of observations in the original sample of this study (Chin, 1998; Hair et
al., 2011). The research model is then assessed by examining the determination coefficients (R²), the path coefficients and their significance levels, using t-tests.
Use and user satisfaction explain 69.2% of the variance in net benefits, which can be considered as high.
The m-BI capabilities explain 29.3% in use, and 66.6% in user satisfaction. The variance explained in use is respectively moderate, which suggests that factors that are not included in the research model may
be more important in explaining the variance for use. Overall, the model has a good explanatory power.
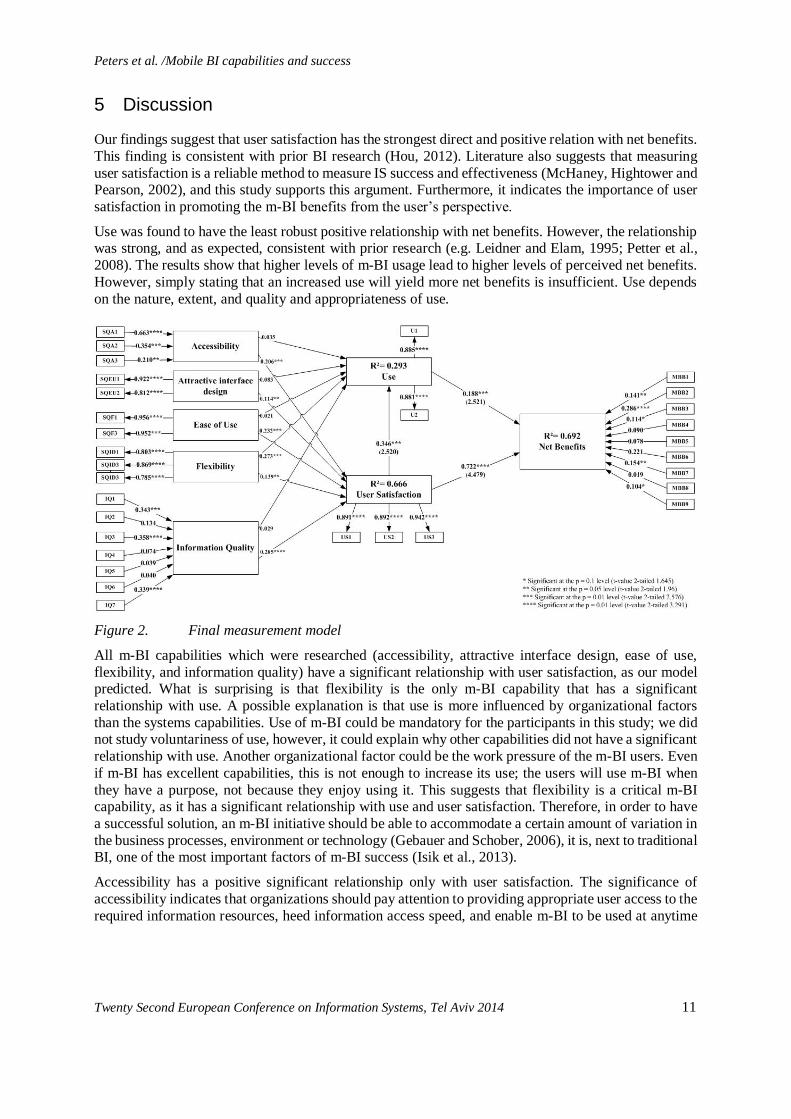
The results of the PLS path model analysis is presented in figure 2, indicating support for nine out of 13
hypotheses. All the m-BI capabilities (H5, H7, H9, H11, H13) are significantly related to user satisfaction. However, only one capability, flexibility (H4), is significantly related to use. This indicates that
flexibility is a critical m-BI capability. Hypotheses H1 and H2 posit that user satisfaction and use
influence net benefits, which are both supported.
Peters et al. /Mobile BI capabilities and success
Twenty Second European Conference on Information Systems, Tel Aviv 2014 11
5 Discussion
Our findings suggest that user satisfaction has the strongest direct and positive relation with net benefits.
This finding is consistent with prior BI research (Hou, 2012). Literature also suggests that measuring
user satisfaction is a reliable method to measure IS success and effectiveness (McHaney, Hightower and Pearson, 2002), and this study supports this argument. Furthermore, it indicates the importance of user
satisfaction in promoting the m-BI benefits from the user’s perspective.
Use was found to have the least robust positive relationship with net benefits. However, the relationship was strong, and as expected, consistent with prior research (e.g. Leidner and Elam, 1995; Petter et al.,
2008). The results show that higher levels of m-BI usage lead to higher levels of perceived net benefits.
However, simply stating that an increased use will yield more net benefits is insufficient. Use depends
on the nature, extent, and quality and appropriateness of use.
Figure 2. Final measurement model
All m-BI capabilities which were researched (accessibility, attractive interface design, ease of use,
flexibility, and information quality) have a significant relationship with user satisfaction, as our model predicted. What is surprising is that flexibility is the only m-BI capability that has a significant
relationship with use. A possible explanation is that use is more influenced by organizational factors
than the systems capabilities. Use of m-BI could be mandatory for the participants in this study; we did not study voluntariness of use, however, it could explain why other capabilities did not have a significant
relationship with use. Another organizational factor could be the work pressure of the m-BI users. Even
if m-BI has excellent capabilities, this is not enough to increase its use; the users will use m-BI when
they have a purpose, not because they enjoy using it. This suggests that flexibility is a critical m-BI capability, as it has a significant relationship with use and user satisfaction. Therefore, in order to have
a successful solution, an m-BI initiative should be able to accommodate a certain amount of variation in
the business processes, environment or technology (Gebauer and Schober, 2006), it is, next to traditional BI, one of the most important factors of m-BI success (Isik et al., 2013).
Accessibility has a positive significant relationship only with user satisfaction. The significance of
accessibility indicates that organizations should pay attention to providing appropriate user access to the
required information resources, heed information access speed, and enable m-BI to be used at anytime
Peters et al. /Mobile BI capabilities and success
Twenty Second European Conference on Information Systems, Tel Aviv 2014 12
and anywhere. This is in line with existing research suggesting that user access quality is the cornerstone
of the overall user satisfaction with BI (Isik et al., 2013).
It is also suggested that information access quality is important as perceived by the user, however, lower access quality is less likely to be used for excluding criterion when information is needed (Popovič et
al., 2012). This may indicate why IQ has the strongest relationship with user satisfaction. High quality
information is important in the decision making process as it reduces the uncertainty of the decision (Mithas et al., 2011), and it is one of the critical BI capabilities that allow users deal with uncertainty
(Isik et al., 2013). The unsuitability of information, even if high quality, can easily lead to a less
appropriate business decision. Such approaches, therefore, result in dissatisfaction with m-BI solutions, and ultimately, in the non-use of these solutions, yielding a lower success rate (Popovič et al., 2012).
This may explain why IQ has a strong significant relationship with user satisfaction.
Ease of use has a positive significant relationship with user satisfaction. This finding is also in line with
the argument of Tapadinhas (2012), who suggests that ease of use is a key adoption driver of m-BI. Thus, when m-BI is not experienced as easy to use, it may result in dissatisfaction and non-use.
Attractive interface design has a positive significant relationship with user satisfaction. Several authors
recognized that attractive visualizations such as graphs are particularly useful for the identification of trends and relationships among data and can result in higher quality decisions (e.g. Harvey and Bolger,
1996; Umanath, 1994; Umanath and Vessey, 1994). Furthermore, the finding confirms the suggestion
of Mishra (2012) that IS are not only judged by their functionality, but also on looks. As results indicate, m-BI users are more satisfied with an attractive user interface.
5.1 Implications for theory and practice
As discussed earlier, subjective measures are often used to measure BI success, however, at the present
moment, no studies have used subjective measures to measure m-BI success at the individual level. This
study presents and empirically tests an adapted DeLone and McLean research framework and validates it in the area of m-BI. Our study provides strong evidence that m-BI success is a multidimensional
construct, and that for m-BI and other IS success, the system quality construct should be replaced by the
desired characteristics of the IS that is to be measured. This enables a researcher to investigate the
potentially different significance levels of those characteristics. This study pointed out, especially compared to user satisfation, that explaining the use of m-BI is more complex than we initially expected.
Hence, researchers should be careful with taking system quality as a single construct in measuring IS
success. Many organizations have begun implementing m-BI or are considering deploying an m-BI solution. This study provides a list and description of capabilities that are important for a successful m-
BI implementation. It helps organizations to deploy m-BI and to improve their m-BI solution in order
to increase the derived benefits from their m-BI investment. Furthermore, this study could also be useful
for vendors to promote m-BI, to explain its potential value for their customers and it eventually may even help to accelerate the adoption rate of m-BI.
5.2 Limitations and future work
Although this study resulted in some interesting findings, there were several limitations. First, the list of
studied m-BI capabilities is not exhaustive. The m-BI capabilities investigated here were identified through an extensive literature review, which consisted of BI studies and m-BI reports. However,
because BI academic literature lacks studies about m-BI capabilities and because it is a relatively new
innovation, it is possible that there are important capabilities that are not yet revealed by research and
reports. Especially the variance explained in use, only 29.3%, suggests that factors that are not included in the research model may be more important in explaining the variance for use. Also, other dimensions
Peters et al. /Mobile BI capabilities and success
Twenty Second European Conference on Information Systems, Tel Aviv 2014 13
such as engagement may be important to understand m-BI success, because an engaging experience
provided by m-BI is considered globally to be more relevant than the breadth and depth of the
functionality of m-BI (Tapadinhas, 2012). Next to that, our study is mainly focused on system and information quality, we did not test the importance of the organizational component service quality on
m-BI success. Our study indicates that individuals can make faster decisions with m-BI, which could
suggest that the service quality factor, that is for example responsiveness of the support organization (Kang, 2006) for the m-BI user, may influence m-BI success. Future research is needed to explore other
m-BI capabilities or organizational factors that may be important for m-BI success.
Another limitation is that this study is based on user perceptions. Studies have found that self-reported measures are not always consistent with actual measures, and therefore not always reliable substitutes
for objective measures (Petter et al., 2008). Goodhue (1995) states that the connection between user
evaluations and actual performance is dependent on the user’s ability to recognize improvements in
performance and attribute it to the used IS. This explains the difficulty in measuring m-BI benefits with user evaluations, in other words, does an m-BI solution enhance performance or not, and do users
recognize this or not. This may lead to four possible situations (Althuizen, Reichel and Wierenga, 2012);
(1) Harmful Neglect: the IS enhances performance, but users do not recognize this; (2) Seductive Illusion: the IS does not enhance performance, but users think it does; (3) Wise Abstention: the IS does
not enhance performance and users recognize this; (4) Rightful Conviction: the IS enhances performance
and users recognize this. Althuizen et al. (2012) conducted two empirical studies in which the researchers failed to find significant positive correlations between user evaluations of the IS and actual
performance. In fact, the researchers did find significant negative correlations, meaning that
improvements in actual performance were associated with less favourable evaluations of the IS in
question. It suggests that there is a possibility that there are m-BI users who fail to recognize the benefits already experienced from their m-BI solution. Another limitation is that the sample consists of m-BI
users from four different work positions: non-management, middle management, first level supervisor
and top management. The kind of decision-making differs per work position level. Therefore, it is possible that there exists a difference in the way how these four kind of decision-makers have
experienced their m-BI solution. Future research is needed to determine if there exist a difference for
different levels of decision makers in organizations. The final limitation is that this study measures user
perceptions at a precise point in time. It is logical to assume that user perceptions may change as they gain more experience using m-BI (Hou, 2012). Hence, a longitudinal approach should be considered in
future research.
6 Conclusion
The purpose of this study was to explore the m-BI success dimensions deemed important by its users. The DeLone and McLean’s (2003) IS success model was adapted and extended for use in investigating
this. Data was collected from 196 m-BI users to perform an empirical analysis. Findings pointed out
several implications for developing better m-BI solutions. Improving the m-BI capabilities, accessibility
(user access quality, bandwidth and use at anytime and anywhere), flexibility, attractive interface design, ease of use and information quality may be key for m-BI success. They influence the use and user
satisfaction level, which explains the variance in the perceived net benefits. However, while these
capabilities have a relatively high explanatory power for user satisfaction with m-BI their power to explain m-BI use is found to be rather low, suggesting there are other unobserved (organizational)
characteristics that significantly affect m-BI use behaviour. M-BI adoption in organizations particularly
enables individuals to present their arguments more convincingly, make faster and better quality decisions, increase their job effectiveness, and reduce the costs of business processes. Hence, a better
understanding of how to improve m-BI success based on the findings of this study can improve how
vendors approach to the development of m-BI and also significantly contribute to scholarly literature.
Peters et al. /Mobile BI capabilities and success
Twenty Second European Conference on Information Systems, Tel Aviv 2014 14
References
Althuizen, N., Reichel, A. and Wierenga, B. (2012) Help that is not recognized: Harmful neglect of
decision support systems, Decision Support Systems, 54 (1), 719-728.
Auster, E. and Choo, C. W. (1993) Environmental scanning by CEOs in two Canadian industries, Journal of the American Society for Information Science, 44 (4), 194-203.
Burton-Jones, A. and Straub, D. W. (2006) Reconceptualizing System Usage: An Approach and
Empirical Test, Information Systems Research, 17 (3), 228-246. Chandras, R. (2011) Is Mobile BI Worth the Hype?, InformationWeek.
Chin, W. W. (1998) Issues and opinion on structure equation modeling, MIS Quarterly, 22 (1), vii-xvi.
Chin, W. W., Marcolin, B. L. and Newsted, P. R. (2003) A Partial Least Squares Latent Variable
Modeling Approach for Measuring Interaction Effects: Results From a Monte Carlo Simulation Study and an Electronic-Mail Emotion/Adoption Study, Information Systems Research, 14 (2),
189-217.
Cox, C. (2010) Balancing decision speed and decision quality: Assessing the impact of Business Intelligence Systems in high velocity environments, Faculty of the College of Business
Administration, TUI University, United States - California.
DeLone, W. H. and McLean, E. R. (2003) The DeLone and McLean Model of Information Systems Success: A Ten-Year Update, Journal of Management Information Systems, 19 (4), 9-30.
Dewett, T. and Jones, G. R. (2001) The role of information technology in the organization: a review,
model, and assessment, Journal of Management, 27 (3), 313-346.
Doll, W. J. and Torkzadeh, G. (1988) The Measurement of End-User Computing Satisfaction, MIS Quarterly, 12 (2), 259-274.
Edwards, J. R. (2011) The Fallacy of Formative Measurement, Organizational Research Methods, 14
(2), 370-388. Elbashir, M. Z., Collier, P. A. and Davern, M. J. (2008) Measuring the effects of business intelligence
systems: The relationship between business process and organizational performance, International
Journal of Accounting Information Systems, 9 (3), 135-153. Eppler, M. J. (2006) Managing Information Quality: Increasing the Value of Information in
Knowledge-Intensive Products and Processes, Springer.
Esposito Vinzi, V., Chin, W. W., Henseler, J. and Wang, H. (2010) Handbook of Partial Least
Squares: Concepts, Methods and Applications, Springer. Farrokhi, V. and Pokoradi, L. (2012) The necessities for building a model to evaluate Business
Intelligence projects - Literature Review, International Journal of Computer Science & Engineering
Survey, 3 (2). Fornell, C. and Bookstein, F. L. (1982) A Comparative Analysis of Two Structural Equation Models:
LISREL and PLS Applied to Market Data., In A Second Generation of Multivariate Analysis(Ed,
Fornell, C.) Praeger, New York, 289-324.
Gebauer, J. and Schober, F. (2006) Information System Flexibility and the Cost Efficiency of Business Processes, Journal of the Association for Information Systems, 7 (3), 122-146.
Gefen, D. and Straub, D. (2005) A practical guide to factorial validity using PLS-graph: tutorial and
annotated example, Communications of the Association for Information Systems, 16 91-109. Goodhue, D. L. (1995) Understanding User Evaluations of Information Systems, Management
Science, 41 (12), 1827-1844.
Hair, J. F., Ringle, C. M. and Sarstedt, M. (2011) PLS-SEM: Indeed a silver bullet, The Journal of Marketing Theory and Practice, 19 (2), 139-152.
Harvey, N. and Bolger, F. (1996) Graphs versus tables: Effects of data presentation format on
judgemental forecasting, International Journal of Forecasting, 12 (1), 119-137.
Peters et al. /Mobile BI capabilities and success
Twenty Second European Conference on Information Systems, Tel Aviv 2014 15
Henseler, J., Ringle, C. M. and Sinkovics, R. R. (2009) The use of partial least squares path modeling
in international marketing, In New Challenges to International Marketing, Vol. 20 Emerald Group
Publishing Limited, 277-319. Heo, J. and Han, I. (2003) Performance measure of information systems (IS) in evolving computing
environments: an empirical investigation, Information & Management, 40 (4), 243-256.
Hou, C.-K. (2012) Examining the effect of user satisfaction on system usage and individual performance with business intelligence systems: An empirical study of Taiwan's electronics
industry, International Journal of Information Management, 32 (6), 560-573.
Howson, C. (2007) Successful Business Intelligence: Secrets to Making BI a Killer App, McGraw-Hill Osborne Media.
Iivari, J. (2005) An empirical test of the DeLone-McLean model of information system success,
SIGMIS Database, 36 (2), 8-27.
Isik, O., Jones, M. C. and Sidorova, A. (2011) BUSINESS INTELLIGENCE (BI) SUCCESS AND THE ROLE OF BI CAPABILITIES, Intelligent Systems in Accounting, Finance and Management,
18 (4), 161-176.
Isik, O., Jones, M. C. and Sidorova, A. (2013) Business intelligence success: The roles of BI capabilities and decision environments, Information & Management, 50 (1), 13-23.
Jeong, M. and Lambert, C. U. (2001) Adaptation of an information quality framework to measure
customers’ behavioral intentions to use lodging Web sites, International Journal of Hospitality Management, 20 (2), 129-146.
Kang, G.-D. (2006) The hierarchical structure of service quality: integration of technical and
functional quality, Managing Service Quality, 16 (1), 37-50.
Lee, K. C. and Chung, N. (2009) Understanding factors affecting trust in and satisfaction with mobile banking in Korea: A modified DeLone and McLean’s model perspective, Interacting with
Computers, 21 (5–6), 385-392.
Leidner, D. E. and Elam, J. J. (1995) The Impact of Executive Information Systems on Organizational Design, Intelligence, and Decision Making, Organization Science, 6 (6), 645-664.
Lönnqvist, A. and Pirttimäki, V. (2006) The measurement of business intelligence, Information
Systems Management, 23 (1), 32-40.
Low, G. S. and Mohr, J. J. (2001) Factors Affecting the Use of Information in the Evaluation of Marketing Communications Productivity, Journal of the Academy of Marketing Science, 29 (1),
70-88.
MacKenzie, S. B., Podsakoff, P. M. and Jarvis, C. B. (2005) The Problem of Measurement Model Misspecification in Behavioral and Organizational Research and Some Recommended Solutions,
Journal of Applied Psychology, 90 (4), 710-730.
Marcoulides, G. A. and Saunders, C. (2006) Editor's comments: PLS: a silver bullet?, MIS Quarterly, 30 (2), iii-ix.
McHaney, R., Hightower, R. and Pearson, J. (2002) A validation of the end-user computing
satisfaction instrument in Taiwan, Information & Management, 39 (6), 503-511.
Melville, N., Kraemer, K. and Gurbaxani, V. (2004) Information Technology and Organizational Performance: An Integrative Model of IT Business Value, MIS Quarterly, 28 (2), 283-322.
Mishra, J. (2012) Software Engineering, Pearson Education India.
Mithas, S., Ramasubbu, N. and Sambamurthy, V. (2011) How information management capability influences firm performance, MIS Quarterly, 35 (1), 237-256.
Moreau, É. M. F. (2006) The impact of intelligent decision support systems on intellectual task
success: An empirical investigation, Decision Support Systems, 42 (2), 593-607. Negash, S. and Gray, P. (2008) Business Intelligence, In Handbook on Decision Support Systems
2(Eds, Burstein, F. and Holsapple, C. W.) Springer Berlin Heidelberg, 175-193.
Nunnally, J. C. (1978) Psychometric Theory, McGraw-Hill, New York.
Peters et al. /Mobile BI capabilities and success
Twenty Second European Conference on Information Systems, Tel Aviv 2014 16
O’brien, R. M. (2007) A Caution Regarding Rules of Thumb for Variance Inflation Factors, Quality &
Quantity, 41 (5), 673-690.
Petter, S., DeLone, W. H. and McLean, E. R. (2008) Measuring information systems success: models, dimensions, measures, and interrelationships, European Journal of Information Systems, 17 (3),
236-263.
Petter, S. and McLean, E. R. (2009) A meta-analytic assessment of the DeLone and McLean IS success model: An examination of IS success at the individual level, Information & Management,
46 (3), 159-166.
Petter, S., Straub, D. and Rai, A. (2007) Specifying formative constructs in information systems research, MIS Quarterly, 31 (4), 623-656.
Popovič, A., Hackney, R., Coelho, P. S. and Jaklič, J. (2012) Towards business intelligence systems
success: Effects of maturity and culture on analytical decision making, Decision Support Systems,
54 (1), 729-739. Popovič, A., Turk, T. and Jaklič, J. (2010) Conceptual Model of Business Value of Business
Intelligence Systems, Management, 15 (1), 5-30.
Raghunathan, S. (1999) Impact of information quality and decision-maker quality on decision quality: a theoretical model and simulation analysis, Decision Support Systems, 26 (4), 275-286.
Rindfleisch, A. and Moorman, C. (2001) The Acquisition and Utilization of Information in New
Product Alliances: A Strength-of-Ties Perspective, Journal of Marketing, 65 (2), 1-18. Santosa, P. I., Wei, K. K. and Chan, H. C. (2005) User involvement and user satisfaction with
information-seeking activity, European Journal of Information Systems, 14 (4), 361-370.
Schrepp, M., Held, T. and Laugwitz, B. (2006) The influence of hedonic quality on the attractiveness
of user interfaces of business management software, Interacting with Computers, 18 (5), 1055-1069.
Seddon, P. B., Staples, S., Patnayakuni, R. and Bowtell, M. (1999) Dimensions of information systems
success, Communications of the Association for Information Systems, 2 (3es). Shanks, G., Bekmamedova, N., Adam, F. and Daly, M. (2012) Embedding Business Intelligence
Systems within Organisations, In Fusing Decision Support Systems into the Fabric of the Context
(Eds, Respício, A. and Burstein, F.), 113-124.
Tapadinhas, J. (2012) Critical Capabilities for Mobile BI What You Need to Know, Gartner. Todd, P. and Benbasat, I. (1992) The Use of Information in Decision Making: An Experimental
Investigation of the Impact of Computer-Based Decision Aids, MIS Quarterly, 16 (3), 373-393.
Tona, O. and Carlsson, S. (2013) The organizing vision of mobile business intelligence, 21st European Conference on Information Systems, Utrecht, The Netherlands.
Tona, O., Carlsson, S. and Eom, S. (2012) An Empirical Test of DeLone and McLean’s Information
System Success Model in a Public Organization, Americas Conference on Information Systems, Seattle, Washington.
Umanath, N. S. (1994) Effect of IS variables on information acquisition modes: An experimental
investigation, Information & Management, 27 (5), 287-301.
Umanath, N. S. and Vessey, I. (1994) Multiattribute Data Presentation and Human Judgment: A Cognitive Fit Perspective, Decision Sciences, 25 (5-6), 795-824.
Wang, Y.-S. and Liao, Y.-W. (2008) Assessing eGovernment systems success: A validation of the
DeLone and McLean model of information systems success, Government Information Quarterly, 25 (4), 717-733.
Williams, S. and Williams, N. (2007) The Profit Impact of Business Intelligence, Morgan Kaufmann.
Wixom, B. H., Watson, H. J. and Werner, T. (2011) Developing an Enterprise Business Intelligence Capability: The Norfolk Southern Journey, MIS Quarterly Executive, 10 (2), 61-71.
Yeoh, W. and Koronios, A. (2010) Critical Success Factors for Business Intelligence Systems, Journal
of Computer Information Systems, 50 (3), 23-32.
Related Documents