INTERNATIONAL JOURNAL OF CLIMATOLOGY Int. J. Climatol. 29: 1493–1507 (2009) Published online 26 November 2008 in Wiley InterScience (www.interscience.wiley.com) DOI: 10.1002/joc.1818 The role of large-scale eddies in the occurrence of winter precipitation deficits in Portugal J. A. Santos, a * C. Andrade, b,c J. Corte-Real c and S. Leite a a Universidade de Tr´ as-os-Montes e Alto Douro, Centre for Research and Technology of Agro-Environment and Biological Sciences (CITAB), Quinta dos Prados, Apartado 1013, 5000-911 Vila Real, Portugal b Instituto Polit´ ecnico de Tomar, E.S.G.T., ´ Area interdepartamental de Matem´ atica, Quinta do Contador, Estrada da Serra, 2300-313 Tomar, Portugal c Universidade de ´ Evora, Instituto de Ciˆ encias Agr´ arias Mediterrˆ anicas (ICAM): Grupo ´ Agua, Solo e Clima, N´ ucleo da Mitra, Apartado 94, 7002-774 ´ Evora, Portugal ABSTRACT: The severest winter precipitation deficits in Portugal result from an enhancement in the stationary wave pattern of the atmospheric large-scale circulation over the Northern Hemisphere, which implies a strengthening of the axially asymmetric eddies, mainly over the North Atlantic and adjacent continental areas. This enhancement leads to a strong warm-core ridge westward of Iberia, with a nearly equivalent barotropic structure, and a clear separation between the subtropical and polar-front jet. These atmospheric conditions are clearly unfavourable to the establishment of rain-generating mechanisms over Portugal, leading to a lack of precipitation and to extremely dry conditions with a high potential to trigger drought episodes. Conversely, the atmospheric flow during extremely wet winters contrasts highly with the above-described conditions by presenting a significantly weakened North Atlantic ridge and a relatively unclear separation between the two westerly jets. A diagnosis of the main forcing dynamical mechanisms that generate and maintain the anomalous flow is carried out in two ways: by analyzing the Eliassen–Palm fluxes, zonally averaged over a North Atlantic window, and by calculating the third and sixth components of the empirical forcing functions. The former approach enables a quantification of the contributions made by the transient and stationary-eddy transports of enthalpy and momentum to the establishment of the contrasting dynamical structures. The latter approach explores the role of local transient transports of enthalpy and angular momentum in forcing large-scale asymmetries. Copyright 2008 Royal Meteorological Society KEY WORDS extreme precipitation; droughts; Portugal; eddy fluxes; forcing functions Received 12 January 2008; Revised 5 June 2008; Accepted 24 October 2008 1. Introduction The development of drought episodes in Portugal is often related to winter precipitation deficits throughout the country. In fact, the most extreme droughts on record were triggered by severe winter precipitation deficits (SWPD), namely the 1944/45, 1980/81, 1982/83, 1991/92, 1998/99 and 2004/05 droughts (Bernardino, 2003). Particular attention has been devoted to the recent 2004/05 drought, since it was among the severest according to a number of drought indices (e.g. Palmer Drought Severity Index, Standard Precipitation Index) and it had significant socio–economic impacts across almost all sectors of the Portuguese economy (Santos et al., 2007a). The relevance of the winter precipitation for the Por- tuguese hydrological cycle can be easily explained by the prevailing Mediterranean-type climate that concen- trates most of precipitation during the winter half of the year (strong seasonality that peaks in winter). As such, * Correspondence to: J. A. Santos, Universidade de Tr´ as-os-Montes e Alto Douro, Departamento de F´ ısica, Quinta dos Prados, Apartado 1013, 5000-911 Vila Real, Portugal. E-mail: [email protected] a lack of winter precipitation (meteorological drought) might be of utmost significance in the establishment of a hydrological drought in the upcoming months. In case of anomalously low springtime precipitation, the scarce and irregular summer rainfall, mainly linked to mesoscale systems (Serrano et al., 1999), is usually far from being enough to make up for the accumulated deficit. Several previous studies attested the downward trends in the annual precipitation over Portugal (Zhang et al., 1997; Santos, 1999), which are more accentuated in the early spring months (Trigo and DaCamara, 2000; Pare- des et al., 2006). Furthermore, most of Southern Europe experienced an increase in the length of dry spells dur- ing the last decades (Tank and Konnen, 2003) and this trend is expected to be sustained as a response of the cli- mate system to anthropogenic forcing (Houghton et al., 2001; Giorgi and Mearns, 2003; Salinger, 2005). Future multi-model scenarios employed in the Intergovernmen- tal Panel on Climate Change (IPCC) Fourth Assessment Report revealed significant negative trends in the annual mean precipitation over Iberia (Kharin et al., 2007) and increases in the probability of occurrence of droughts in the Mediterranean Basin until the end of the 21st Copyright 2008 Royal Meteorological Society

Welcome message from author
This document is posted to help you gain knowledge. Please leave a comment to let me know what you think about it! Share it to your friends and learn new things together.
Transcript
INTERNATIONAL JOURNAL OF CLIMATOLOGYInt. J. Climatol. 29: 1493–1507 (2009)Published online 26 November 2008 in Wiley InterScience(www.interscience.wiley.com) DOI: 10.1002/joc.1818
The role of large-scale eddies in the occurrence of winterprecipitation deficits in Portugal
J. A. Santos,a* C. Andrade,b,c J. Corte-Realc and S. Leitea
a Universidade de Tras-os-Montes e Alto Douro, Centre for Research and Technology of Agro-Environment and Biological Sciences (CITAB),Quinta dos Prados, Apartado 1013, 5000-911 Vila Real, Portugal
b Instituto Politecnico de Tomar, E.S.G.T., Area interdepartamental de Matematica, Quinta do Contador, Estrada da Serra, 2300-313 Tomar,Portugal
c Universidade de Evora, Instituto de Ciencias Agrarias Mediterranicas (ICAM): Grupo Agua, Solo e Clima, Nucleo da Mitra, Apartado 94,7002-774 Evora, Portugal
ABSTRACT: The severest winter precipitation deficits in Portugal result from an enhancement in the stationary wavepattern of the atmospheric large-scale circulation over the Northern Hemisphere, which implies a strengthening of theaxially asymmetric eddies, mainly over the North Atlantic and adjacent continental areas. This enhancement leads to astrong warm-core ridge westward of Iberia, with a nearly equivalent barotropic structure, and a clear separation between thesubtropical and polar-front jet. These atmospheric conditions are clearly unfavourable to the establishment of rain-generatingmechanisms over Portugal, leading to a lack of precipitation and to extremely dry conditions with a high potential to triggerdrought episodes. Conversely, the atmospheric flow during extremely wet winters contrasts highly with the above-describedconditions by presenting a significantly weakened North Atlantic ridge and a relatively unclear separation between the twowesterly jets. A diagnosis of the main forcing dynamical mechanisms that generate and maintain the anomalous flow iscarried out in two ways: by analyzing the Eliassen–Palm fluxes, zonally averaged over a North Atlantic window, and bycalculating the third and sixth components of the empirical forcing functions. The former approach enables a quantificationof the contributions made by the transient and stationary-eddy transports of enthalpy and momentum to the establishmentof the contrasting dynamical structures. The latter approach explores the role of local transient transports of enthalpy andangular momentum in forcing large-scale asymmetries. Copyright 2008 Royal Meteorological Society
KEY WORDS extreme precipitation; droughts; Portugal; eddy fluxes; forcing functions
Received 12 January 2008; Revised 5 June 2008; Accepted 24 October 2008
1. Introduction
The development of drought episodes in Portugal isoften related to winter precipitation deficits throughoutthe country. In fact, the most extreme droughts onrecord were triggered by severe winter precipitationdeficits (SWPD), namely the 1944/45, 1980/81, 1982/83,1991/92, 1998/99 and 2004/05 droughts (Bernardino,2003). Particular attention has been devoted to therecent 2004/05 drought, since it was among the severestaccording to a number of drought indices (e.g. PalmerDrought Severity Index, Standard Precipitation Index)and it had significant socio–economic impacts acrossalmost all sectors of the Portuguese economy (Santoset al., 2007a).
The relevance of the winter precipitation for the Por-tuguese hydrological cycle can be easily explained bythe prevailing Mediterranean-type climate that concen-trates most of precipitation during the winter half of theyear (strong seasonality that peaks in winter). As such,
* Correspondence to: J. A. Santos, Universidade de Tras-os-Montes eAlto Douro, Departamento de Fısica, Quinta dos Prados, Apartado1013, 5000-911 Vila Real, Portugal. E-mail: [email protected]
a lack of winter precipitation (meteorological drought)might be of utmost significance in the establishment ofa hydrological drought in the upcoming months. In caseof anomalously low springtime precipitation, the scarceand irregular summer rainfall, mainly linked to mesoscalesystems (Serrano et al., 1999), is usually far from beingenough to make up for the accumulated deficit.
Several previous studies attested the downward trendsin the annual precipitation over Portugal (Zhang et al.,1997; Santos, 1999), which are more accentuated in theearly spring months (Trigo and DaCamara, 2000; Pare-des et al., 2006). Furthermore, most of Southern Europeexperienced an increase in the length of dry spells dur-ing the last decades (Tank and Konnen, 2003) and thistrend is expected to be sustained as a response of the cli-mate system to anthropogenic forcing (Houghton et al.,2001; Giorgi and Mearns, 2003; Salinger, 2005). Futuremulti-model scenarios employed in the Intergovernmen-tal Panel on Climate Change (IPCC) Fourth AssessmentReport revealed significant negative trends in the annualmean precipitation over Iberia (Kharin et al., 2007) andincreases in the probability of occurrence of droughtsin the Mediterranean Basin until the end of the 21st
Copyright 2008 Royal Meteorological Society

1494 J. A. SANTOS ET AL.
century (Sheffield and Wood, 2007). Therefore, there isgrowing scientific evidence for an increase in the fre-quency and severity of droughts in Portugal in the nearfuture. Therefore, ongoing climatic changes are likely toplace important challenges on water management poli-cies in Portugal. Although much work on the Portuguesedroughts has been carried out so far, particularly in thestatistical analysis of several drought indices and param-eters, less attention has been devoted to the physicalmechanisms underlying their occurrence.
The precipitation regime in Portugal is deeply influ-enced by the seasonal migration of the mid-latitude west-erlies and associated weather systems, where the location,extent and intensity of the North Atlantic ridge, man-ifested at the surface as the Azores High, play a con-trolling role in establishing or blocking rain-generatingmechanisms over Portugal (Santos et al., 1980; Fer-reira and Ferreira, 1983; Santos et al., 2007a). The totalrainfall amounts in Portugal are thus highly controlledby large-scale anomalies in the atmospheric circulationover the North Atlantic (Santos et al., 2007b). Since thephase of the North Atlantic Oscillation (NAO) is closelyrelated to the position of the Atlantic storm-track (Hur-rell, 1996; Osborn et al., 1999; Trigo et al., 2002) throughanti-cyclonic and cyclonic wave breaking mechanisms(Riviere and Orlanski, 2007), the significant negative cor-relations between precipitation in Portugal and the NAO(Ulbrich et al., 1999; Goodess and Jones, 2002;) onlyreflect this strong large-scale coupling. In effect, the twoopposite phases of the NAO clearly favour the occur-rence of the NAO+ (dry) and NAO− (wet) precipitationregimes in Portugal (Santos et al., 2005). Nevertheless,this relatively simple NAO dependence is only a firstand rough approximation, since other large-scale patternsare also significantly coupled with the winter precipita-tion in Portugal, namely the Eastern Atlantic Oscillation(Barnston and Livezey, 1987) that significantly governsthe occurrence of the C (wet) and E (dry) weather regimesand there is also the W (wet) regime that is much less cor-related with the common teleconnection patterns (Santoset al., 2005).
Since recent studies have shown a clear northwarddisplacement of the North Atlantic storm-track during thelast decades in connection with the strengthening of theNAO towards its positive phase (Wang et al., 2006), itcan be stated that atmospheric conditions have graduallybecome more favourable for drought development inPortugal. The effects of the NAO are not confinedsolely to the North Atlantic, but the NAO influencesatmospheric circulations on a broader hemispheric scale(Feldstein and Franzke, 2006), usually known as theNorthern Annular Mode or Artic Oscillation (Thompsonand Wallace, 2000). Hence, despite not being a generalrule, a strong and persistent ridge (large-scale eddy)in the atmospheric flow over the North Atlantic justwestward of Portugal (commonly connected to a positivephase of the NAO and an enhanced Azores High)during winter months has a very high potential for thedevelopment of a hydrological drought in Portugal. The
role played by these large-scale eddies in the occurrenceof precipitation extremes in Portugal and their underlyingforcing mechanisms will be further investigated herein.
The boundary conditions at the earth’s surface (dia-batic heating and orographic effects) lead to a zonallyasymmetric atmospheric flow that converts eddy avail-able potential energy into eddy kinetic energy throughprocesses such as baroclinic instability (Holton, 2004).Although a large amount of this kinetic energy is even-tually dissipated by turbulent cascading processes andby molecular viscosity, the meridional eddy fluxes ofmomentum and heat associated with the asymmetric dis-turbances play a key role in the maintenance and forcingof the zonal-mean kinetic energy and of the large-scaleatmospheric flow. The latter two fluxes are commonlycombined by the Eliassen–Palm (EP) flux, which is avirtual vector developed in order to diagnose the interac-tion between eddies and zonal-mean circulation (Andrewsand McIntyre, 1976; Hoskins et al., 1983). Additionally,the divergence of the EP flux corresponds to the forcingof the zonal-mean circulation by the eddies (Peixoto andOort, 1992).
The mean atmospheric state is thus a forced responseto a set of physical mechanisms that naturally encom-pass diabatic heating processes and orographic effects,where the preferentially located eddies play a centralrole in the transport of energy from each forcing to themean atmospheric flow (Saltzman, 1963). In fact, theforced atmospheric regime can be considered as a dynam-ical response to the various sources and sinks of heatand momentum resulting from large-scale transient-eddytransports (Saltzman, 1963). The combination of the dif-ferent sources and sinks leads to a forcing function of theasymmetric potential vorticity that generates and main-tains the axially asymmetric flow. In order to explore thedynamical mechanisms underlying the occurrence of win-ter precipitation extremes in Portugal, both the EP fluxesand the forcing function are analysed for winters withextremely high and low precipitation totals in Portugal.Data and methodologies are described in Section 2. Sec-tion 3 is devoted to the description and discussion of theresults and Section 4 outlines the main conclusions.
2. Data and methodology
In the present study, the National Centers for Envi-ronmental Prediction (NCEP)/National Center of Atmo-spheric Research (NCAR) reanalysis dataset was used(Kalnay et al., 1996). The high reliability, the large dataavailability and the updated datasets were decisive fac-tors in choosing NCEP/NCAR reanalysis against otherreanalysis projects. Even though the European Centrefor Medium-range Weather Forecast (ECMWF) ERA-40 reanalysis dataset comprises substantial improvementswhen compared to NCEP/NCAR reanalysis, data is nottimely updated for the analysis of relatively recent events.The climatic variables employed in the different analyseswere: geopotential height (in gpm), air temperature (in
Copyright 2008 Royal Meteorological Society Int. J. Climatol. 29: 1493–1507 (2009)DOI: 10.1002/joc

ROLE OF EDDIES IN WINTER PRECIPITATION DEFICITS IN PORTUGAL 1495
K) and the zonal and meridional wind components (inm s−1). Potential temperature was indirectly attained byapplying Poisson’s equation.
All the analyses are based on daily data defined overthe regular 2.5° latitude × 2.5° longitude grid and thefirst 12 standard constant-pressure levels (1000, 925, 850,700, 600, 500, 400, 300, 250, 200, 150 and 100 hPa)were selected. Since this study is devoted to the anal-ysis of the atmospheric circulation mechanisms relatedto the occurrence of extremes in the winter precipitationover Portugal, only data for the period from 1 Decem-ber–28/29 February is considered here. Climate-meanconditions refer to 1961–1990, which is also the standardperiod for calculating ‘climatic normals’ (WMO, 1996).Four meteorological stations in Portugal – two stationsin the north (Porto and Braganca) and two stations in thesouth (Lisboa and Beja) – with daily precipitation recordswere also selected in order to compute the area-mean win-ter precipitation time series for all winters in the period1945–2007 (Figures 1 and 2). Prior to 1945, data fromBraganca is not available. This data was provided by theEuropean Climate Assessment & Dataset project (Tanket al., 2002). From this area-mean time series, a set ofextremely dry and extremely wet winters was chosen forthe subsequent analyses (Figure 2).
The EP flux diagrams were computed according to themass-weighting method (Edmon et al., 1980). A comple-mentary approach to the previous analysis is the assess-ment of two components of the aforementioned forcingfunction for the large-scale atmospheric disturbances. Infact, this approximation asserts that the time-average stateof the atmosphere can be regarded as a forced response tothe geographically fixed mean convergence fields of thetransient heat and momentum fluxes. These componentsarise from a development of the time-averaged potentialvorticity equation for asymmetric eddies (see Appendixfor details).
The third component is associated with the differentialdivergence of the horizontal transient enthalpy flux andthe sixth component is related to the horizontal transienttransport of momentum. In this study, only these last twocomponents are analysed; as they are the leading forcingsin mid- and high-troposphere, they can be more feasi-bly and accurately computed than the other components,
Figure 1. Map showing the geographical locations of the weatherstations used in the area-mean winter precipitation in Portugal.
which include vertical transports, humidity transports anddiabatic and frictional dissipation terms. Their mathemat-ical formulation is as follows (see Appendix for notation):
ff3 = −f∂
∂p[1�
(1
a cos φ∂u′T ′∂λ
)+ 1
a cos φ∂v′T ′ cos φ
∂φ
]∗
ff6 = − 1
a2 cos φ[1
cos φ∂∂λ
(∂u′v′∂λ
+ ∂v′2 cos φ∂φ
+ u′2 sin φ
)−
− ∂
∂φ
(∂u′2
∂λ+ ∂u′v′ cos φ
∂φ− u′v′ sin φ
)]∗.
Figure 2. Chronogram of the area-mean winter (DJF) precipitation in Portugal for the period 1945–2007, using data recorded at four meteorologicalstations (Porto, Braganca, Lisboa and Beja). The years in abscissa correspond to the December of each winter. White (black) bars represent
extremely high (low) winter precipitation amounts. The linear regression trend and its value (LT) are also plotted.
Copyright 2008 Royal Meteorological Society Int. J. Climatol. 29: 1493–1507 (2009)DOI: 10.1002/joc

1496 J. A. SANTOS ET AL.
All partial derivatives were computed using centredfinite differences, except at the boundaries, where one-sided differences were applied instead. Averages wereestimated by sample means. Time-means were applied todaily mean values for a full winter period (DJF), which isconsidered long enough to produce a statistically stableaverage (cross-covariance) that represent the accumulatedeffect of a relatively large number of individual events(James, 1983).
3. Results
3.1. Severe winter precipitation deficits (SWPD) inPortugal
In order to isolate the most significant winter (DJF) pre-cipitation deficits in Portugal, an area-mean precipitationtime series was computed using rain-gauge data recordedat the selected four meteorological stations (Figure 1).The accumulated winter precipitation values were firstcomputed for each weather station separately and thenthe average of the four time series was taken. This pro-cedure is followed since daily precipitation fields areless spatially coherent than total winter precipitation. Theresulting area-mean time series is considered represen-tative of the winter precipitation interannual variability(Figure 2), since its correlation coefficients with the localtime series range from 0.91 (Beja) up to 0.95 (Bragancaand Lisboa); these coefficients are statistically significantat least at a confidence level of 99%. This result showsa common variability throughout Portugal that is in clearconformity with the strong relationship between winterprecipitation and large-scale anomalies in the atmosphericcirculation (Santos et al., 2005, 2007b).
The average of the area-mean precipitation in theperiod 1945–2007 is about 318 mm with a high stan-dard deviation (SD) of 151 mm (coefficient of variationof nearly 47%). The least-squares linear trend has avalue of −1.3 mm/year (Figure 2) for the entire period
(1945–2007), which is not statistically significant (at asignificance level of 5%) according to both the Spearmanand Mann–Kendall non-parametric tests (Sneyers, 1975).However, this trend tends to be more accentuated andstatistically significant after the beginning of the 1960s,as suggested by the progressive Mann–Kendall analysis(not shown). The distribution of total winter precipitationin Portugal possesses positive skewness that can be eas-ily confirmed by the asymmetric distribution of values(Figure 3(a)). Both the Kolmogorov–Smirnov (with Lil-liefors correction) and the Shapiro–Wilk tests revealedthat a Gaussian distribution is not suitable for a theoreti-cal representation of the empirical distribution of winterprecipitation values. Among a set of more than forty fam-ily distributions, estimated by the maximum likelihoodmethod, the Rayleigh distribution presents the best-fitaccording to the Kolmogorov–Smirnov test (Figure 3).Therefore, winter precipitation in Portugal in the period1945–2007 is characterized by a slight downward trendsuperimposed on a strong, Rayleigh-distributed and pos-itively skewed interannual variability.
The 1978 winter precipitation can be considered anoutlier (circle in Figure 3(a)), since it is above the thresh-old: 75th percentile +1.5 × IQR, where inter-quartilerange (IQR) is the difference between the third and firstquartiles. This value is not erroneous, but it is ratheran exceptionally high precipitation amount; it was therainiest winter at the four individual weather stations. ASWPD is here considered when the winter precipitationamount is below the 10th percentile (146 mm) computedfor the entire time period (62 winters). Higher percentiles,such as the 25th percentile, showed to be relatively per-missive by including winters with more regional and lessimportant deficits. With the purpose of comparing theatmospheric fields during markedly contrasting condi-tions, the winter precipitation amounts above the 90thpercentile (extremely wet winters) were also consideredhere. Therefore, six extremely dry and six extremely wetwinters were selected and used in the following analyses
Figure 3. (a) Box & whiskers plot of the area-mean winter (DJF) precipitation in Portugal for the period 1947–2007 with minimum value(lower limit; 68 mm), first quartile (lower box limit; 209 mm), median (thick black line; 284 mm), third quartile (upper box limit; 417 mm) and
maximum value (outlier; 766 mm); (b) quantile–quantile plot of the area-mean winter precipitation using the Rayleigh distribution (best-fit).
Copyright 2008 Royal Meteorological Society Int. J. Climatol. 29: 1493–1507 (2009)DOI: 10.1002/joc

ROLE OF EDDIES IN WINTER PRECIPITATION DEFICITS IN PORTUGAL 1497
Table I. Ranking of the six driest (below the 10th percentile)and six wettest (above the 90th percentile) winters in the
area-mean winter (DJF) precipitation in Portugal.
Winter precipitation extremes
Extremely dry winters 1980/812004/051991/921999/001982/832001/02
Extremely wet winters 1978/791995/961965/662000/011976/771962/63
(Figure 2 and Table I). It is worth noting that the SWPDare confined to the last three decades, which might alsosuggest an increase in the frequency of these extremeepisodes.
3.2. Large-scale atmospheric circulation duringprecipitation extremes
After isolating the winters with extreme precipitation inPortugal, the analyses that follow are mainly focussedon the dynamical aspects of the large-scale atmosphericcirculation over the Euro–Atlantic sector. Although adescriptive analysis of several dynamical aspects prevail-ing during extremely dry winters in Portugal has alreadybeen presented in a previous study (Santos et al., 2007a),the underlying physical processes will be investigatedhere in greater detail, giving much more emphasis tothe forcing mechanisms. The present study thus aims atgetting a deeper insight into the dynamics.
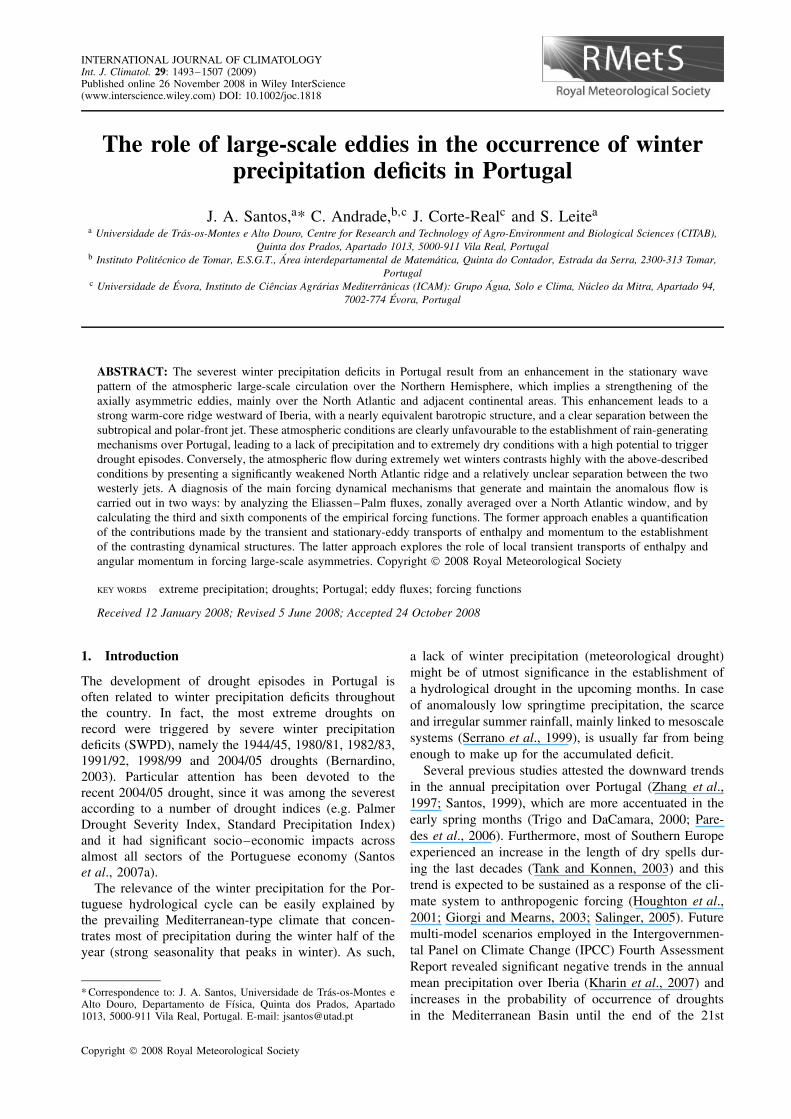
The climate-mean pattern of the advection of potentialvorticity shows a wave-like pattern that is a manifes-tation of the meridional and zonal Rossby wave prop-agation (Figure 4(a)). This pattern also clearly distin-guishes between high and low latitude regimes, nearlyseparated by the 40°N latitude parallel. The advectionof cyclonic potential vorticity (positive values) over theNorth Atlantic poleward of 40°N is consistent with thetrough located upstream over northeastern Canada, whilethe advection of anti-cyclonic potential vorticity (negativevalues) over Europe is in agreement with the persistentNorth Atlantic ridge (Figure 4(a)). The difluence of thewesterly winds from North America to Europe is note-worthy.
When considering only the extreme winters, theclimate-mean wave pattern undergoes an enhancement(weakening) for the dry (wet) winters (Figure 4(b), (c)).This is particularly clear over North America, the NorthAtlantic and Europe, with statistically significant differ-ences in the main advection cores (Figure 4(d)). TheNorth Atlantic ridge is intensified during the dry winters(Figure 4(b)) and almost absent during the wet winters
(Figure 4(c)), explaining the statistically significant dif-ferences in the positive core over the North Atlanticand in the negative core over Europe. The accentuatedsouthwest–northeast tilt in the axis of maximum positiveadvection over the North Atlantic is quite remarkable dur-ing the dry winters, particularly when compared with therespective pattern for the wet winters, where all advec-tions are weakened. The inspection of the geopotentialheights also reveals that the weakening of the patternis related to a more symmetric (zonal) flow, while thestrengthening is associated to an increase in the axialasymmetries of the flow. This means that the driest(wettest) winters in Portugal occurred under a low (high)index circulation regime.
Therefore, the extremely dry and wet winters in Portu-gal are a result of significant changes in the hemisphericstationary wave pattern of the large-scale flow, whichare known to be driven by topography and diabatic pro-cesses. The weakening (strengthening) of the large-scalestationary eddies, mainly over the North Atlantic andadjacent continental areas, is favourable (unfavourable)to the occurrence of precipitation in Portugal. This resultalso corroborates the already referred strong relationshipbetween winter precipitation in Portugal and large-scaleatmospheric circulation.
Since the meridional (north–south) gradient of theabsolute vorticity at 300 hPa tends to get maximumvalues in the vicinity of the westerly jet cores, theirapproximate paths can be identified by mapping thisgradient field. While the subtropical jet is generated byangular momentum transports at the poleward boundaryof the thermally driven Hadley cell, the polar-frontjet is driven by baroclinic eddies. For climate-meanconditions (1961–1990), the presence of the westerlysubtropical jet over low latitudes and North Africa and thewesterly polar-front jet over mid-latitudes are apparent(Figure 5(a)). The maximum gradients along the polar-front jet are located just off the North American coastand extend eastward towards the British Isles.
Nevertheless, during dry winters, the maximum gradi-ents over the polar-front jet are northwardly displaced andweakened, with highest values over the North Atlanticwithin the latitude range of 50–60°N (Figure 5(b)). Dur-ing the wet winters, a remarkably different pattern is ver-ified, with the polar-front jet travelling towards northernIberia (Figure 5(c)), favouring the occurrence of rain-generating weather systems over Portugal (Santos et al.,2005). The spacing between the subtropical jet and polar-front jet is significantly reduced for the wet winters,though their separation is still clear in this pattern, whichis an important advantage over the zonal-mean windcross-sections, as will be shown below. The differencebetween the two extreme patterns depicts a strong merid-ional mode over the North Atlantic that clearly reflectsthe shift between a particularly strong asymmetric flowand a quasi-zonal flow (Figure 5(d)).
As the intensity of the meridional gradient of potentialvorticity is related to the strength of the jets, Figure 5(d)
Copyright 2008 Royal Meteorological Society Int. J. Climatol. 29: 1493–1507 (2009)DOI: 10.1002/joc
1498 J. A. SANTOS ET AL.
Figure 4. Composites of the winter potential vorticity advection (in 10−8 s−2) at 300 hPa (shaded areas) along with the corresponding geopotentialheights (contours; units: 102 gpm) over the Northern Hemisphere for (a) 1961–1990; (b) dry winters; (c) wet winters. (d) Difference between
(b) and (c) (contours) with the corresponding p-values of the t-Student test (shading).
is quite similar to the difference pattern of the horizon-tal wind magnitude (not shown). Therefore, the north-ward displacement and weakening of the polar-front jetis also accompanied by a strengthening of the subtropi-cal jet (Figure 5(d)). Since the baroclinic wave growth atmid-latitudes is controlled by the intensity of the sub-tropical jet (Lee and Kim, 2003), a strengthening ofthis jet explains the weakening of the polar-front jetby the meridional trapping of the Rossby wave prop-agation (Hoskins and Ambrizzi, 1993; Swanson et al.,1997).
The differences in the jet positions and intensities willbe further investigated by analyzing the winter meanzonal wind component, zonally averaged over the NorthAtlantic (60 °W–0°). For climate-mean conditions, thereis some evidence for a double-jet structure, since twocores can be distinguished above 300 hPa: one centrednear 45°N and another, stronger and at slightly upper lev-els, near 20°N (Figure 6(a)). However, during the SWPD,the mean zonal wind highlights a clear difluence of the
westerlies over the North Atlantic, mainly at upper tro-pospheric levels. In fact, the zonal-mean wind shows twowell-separated cores of westerly wind, one near 20°N andthe other near 50–60 °N, which undoubtedly correspondto the subtropical and polar-front winter troposphericjets, respectively (Figure 6(b)). In contrast, during theextremely wet winters only a single core can be iden-tified between 20 and 45°N (Figure 6(c)); the close pathsof the westerly jets make them indistinguishable in thiszonal-mean pattern.
The strong negative (positive) differences at 30° –45°N(50° –70 °N) in the upper troposphere (200–300 hPa)reach absolute values higher than 15 m s−1 and arein close agreement with the jet separation over theNorth Atlantic (Figure 6(d)). The strengthening of thesubtropical jet for the dry winters is manifested by thepositive differences at 10–20 °N (Figure 6(d)). It canthereby be stated that during SWPD in Portugal thereare two clearly differentiated jets over the North Atlantic(polar-front and subtropical jets), while during the wet
Copyright 2008 Royal Meteorological Society Int. J. Climatol. 29: 1493–1507 (2009)DOI: 10.1002/joc

ROLE OF EDDIES IN WINTER PRECIPITATION DEFICITS IN PORTUGAL 1499
Figure 5. Composites of the winter mean meridional gradients of the absolute vorticity at 300 hPa (in 10−11 s−1 m−1) in the Euro–Atlanticsector for: (a) 1961–1990; (b) dry winters and (c) wet winters. (d) Difference between (b) and (c) (contours) with the corresponding p-values
of the t-Student test (shading).
Figure 6. Cross-sections of the winter mean zonal wind component (contours in m s−1) averaged over the North Atlantic (60 °W–0°) for:(a) 1961–1990; (b) dry winters and (c) wet winters. (d) Difference between (b) and (c) (contours) with the corresponding p-values of the
t-Student test (shading).
winters their differentiation is less clear. However, thesedifferences are also statistically significant throughout thetroposphere, with p-level values almost invariant in the
vertical from the surface up to 100 hPa, with almost novertical tilt. This result suggests that the changes in thelarge-scale wave pattern are nearly barotropic.
Copyright 2008 Royal Meteorological Society Int. J. Climatol. 29: 1493–1507 (2009)DOI: 10.1002/joc

1500 J. A. SANTOS ET AL.
For dry winters, the enhanced difluence of the west-erly jets over the North Atlantic is indeed connectedto a noteworthy strengthening of the North Atlanticridge, particularly apparent at upper tropospheric levels(300–200 hPa) and over 40° –50 °N, where the ampli-tude of the ridge attains values higher than 200 gpm(Figure 7(a)). Furthermore, the almost absence of a verti-cal tilt in the maximum amplitude of the ridge throughoutthe troposphere suggests an equivalent barotropic struc-ture. In response to the strengthening of the ridge, thereare also important upward motions (negative values of theomega-vertical velocity) poleward of its core. For the wetwinters, the ridge is significantly weakened and north-wardly displaced (Figure 7(b)); subsidence increases oversubtropical latitudes and upward vertical velocities in thesubpolar latitudes decrease. The strong subsidence in thelow troposphere poleward of 60°N is due to the cold-corehigh-pressure systems over Greenland.
The differences confirm the equivalent barotropicstructure of the anomalies over the North Atlantic; p-level values almost invariant in the vertical (Figure 7(c)).The enhancement of the stationary eddies over the NorthAtlantic is also accompanied by dynamically coherent
changes in the potential temperatures; differences ofmore than 3 °C can be found just below the ridge core(Figure 7(d)). Owing to dynamical compensation mech-anisms (increase in the tropopause height), a significantstratospheric cooling over the warm-core is also notable.The other statistically significant differences are alsoplainly consistent with the changes in the strength ofthe ridge. As a result, during the SWPD in Portugal aclear differentiation between the subtropical and polar-front jets, accompanied by a nearly equivalent barotropicwarm-core ridge, are observed over the North Atlantic asa result of the enhancement of the large-scale stationarywave pattern.
At this point, it is important to distinguish the dis-ruption of the prevailing westerly circumpolar flow overthe North Atlantic during a blocking episode from thestrengthening of the North Atlantic ridge that favoursdroughts in Portugal. The North Atlantic Basin containsa major centre of blocking activity, particularly clear inwinter and spring (Shabbar et al., 2001), which is nega-tively correlated with the NAO phase (Barriopedro et al.,2006; Croci-Maspoli et al., 2007). On the contrary, theSWPD and their coupled atmospheric flow tend to occur
Figure 7. Cross-sections of the difference between the zonal-mean (60 °W–0°) geopotential height (shading in gpm) over the North Atlantic(60 °W–0°) and the corresponding hemispherical zonal-mean for the (a) dry winters and (b) wet winters. In (a) and (b), the correspondingomega-vertical velocity is also displayed (contours in Pa s−1). (c) Difference between (a) and (b) (contours) with the p-values of the t-Studenttest (shading). (d) Difference between the winter mean potential temperature over the North Atlantic (60 °W–0°) for the dry and wet winters
(contours) with the corresponding p-values of the t-Student test (shading).
Copyright 2008 Royal Meteorological Society Int. J. Climatol. 29: 1493–1507 (2009)DOI: 10.1002/joc

ROLE OF EDDIES IN WINTER PRECIPITATION DEFICITS IN PORTUGAL 1501
during NAO positive phases (enhanced Azores High). Infact, the Gibraltar-Iceland NAO index (Jones et al., 1997;Osborn, 2006) takes slightly positive mean values in thedriest winters of 1980/81 and 2004/05 (+1.2 and +0.28,respectively), whereas it takes a value of −1.97 in therainiest winter of 1978/79. Hence, the drought-inducingflow is linked to an enhancement and northward displace-ment of the mid-latitude meridional geopotential gradient,rather than being related to its inversion.
3.3. Large-scale forcing over the North Atlantic
3.3.1. Eliassen–Palm (EP) fluxes
After diagnosing the main differences in the atmo-spheric flow between the selected precipitation extremes,a more detailed analysis of the large-scale forcing iscrucial for improving the understanding of the phys-ical mechanisms underlying the observed strong/weakridge vacillation. The EP flux diagram for climate-mean conditions (1961–1990) over the North Atlanticdepicts very high convergences at low tropospheric lev-els over mid-latitudes and in the polar-front area due tostrong upward decreases in the meridional enthalpy trans-ports (Figure 8(a)). These convergence areas are coherentwith the strong baroclinic instability that is commonlyobserved in these areas. In the low and middle tropo-sphere, the northward enthalpy transports (upward EPfluxes) are clearly dominant (EP flux vectors essentially
vertical), while at upper levels the northward angularmomentum transports (southward EP fluxes) play a keyrole in the zonal forcing (EP flux vectors mostly horizon-tal). Two divergence areas (positive forcing) are foundnear the mean cores of the two tropospheric westerly jets(Figures 6(a) and 8(a)), explaining the presence and themaintenance of these jets against frictional dissipation.
During the dry winters, there is a significant enhance-ment of the EP flux divergence pattern (Figure 8(b), (d)).In fact, this particular pattern underlies the occurrenceof the previously described double-jet structure over theNorth Atlantic (Figure 6(b)), with enhanced positive forc-ing over the jet cores and important negative forcing inbetween. The EP flux diagram for wet winters displaysa remarkably different pattern with a single divergencezone, which is in agreement with the dynamical structuredescribed above (Figures 6(c) and 8(c)). Moreover, theconvergence (negative forcing) at low troposphere forthe dry winters is significantly higher than for the wetwinters, which is in accordance with the blocking of thewesterly winds by the enhanced ridge.
After the decomposition of the EP fluxes into thetransient-eddy and stationary-eddy components, it isapparent that transient-eddy transport is the main con-tributor to the climatological mean. In fact, the transienttransports have large contributions to the total trans-ports, as can be seen when comparing their magnitudes(Figures 8(a) and 9(a)). Furthermore, the mid-latitude
Figure 8. Cross-sections of the total EP fluxes (arrows) and their divergence (shading) for the North Atlantic (20°N–80 °N; 60 °W–0°) and for:(a) winter mean conditions (1961–1990), (b) dry winters, (c) wet winters. (d) Difference between (b) and (c) (contours) with the corresponding
p-values of the t-Student test (shading). Arrows are scaled in 1015 m3 and divergence is in 1015 m3.
Copyright 2008 Royal Meteorological Society Int. J. Climatol. 29: 1493–1507 (2009)DOI: 10.1002/joc
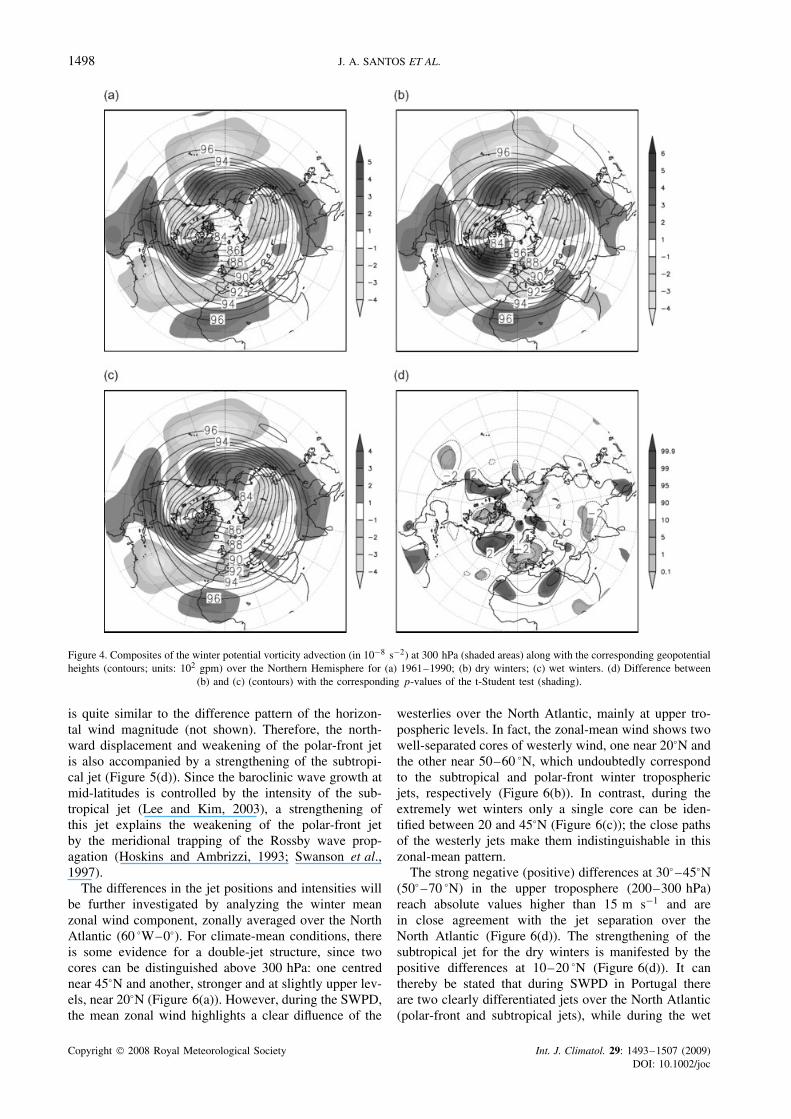
1502 J. A. SANTOS ET AL.
Figure 9. As in Figure 8, but for transient-eddy EP fluxes.
core of high convergence at low troposphere is essentiallydue to the transient transports (Figures 8(a) and 9(a)). Theconvergence of the transports at mid-tropospheric levelsis significantly increased and northwardly shifted for thedry winters when compared to the wet winters, whichis also in agreement with the establishment of a strongridge (Figure 9(b), (c), (d)).
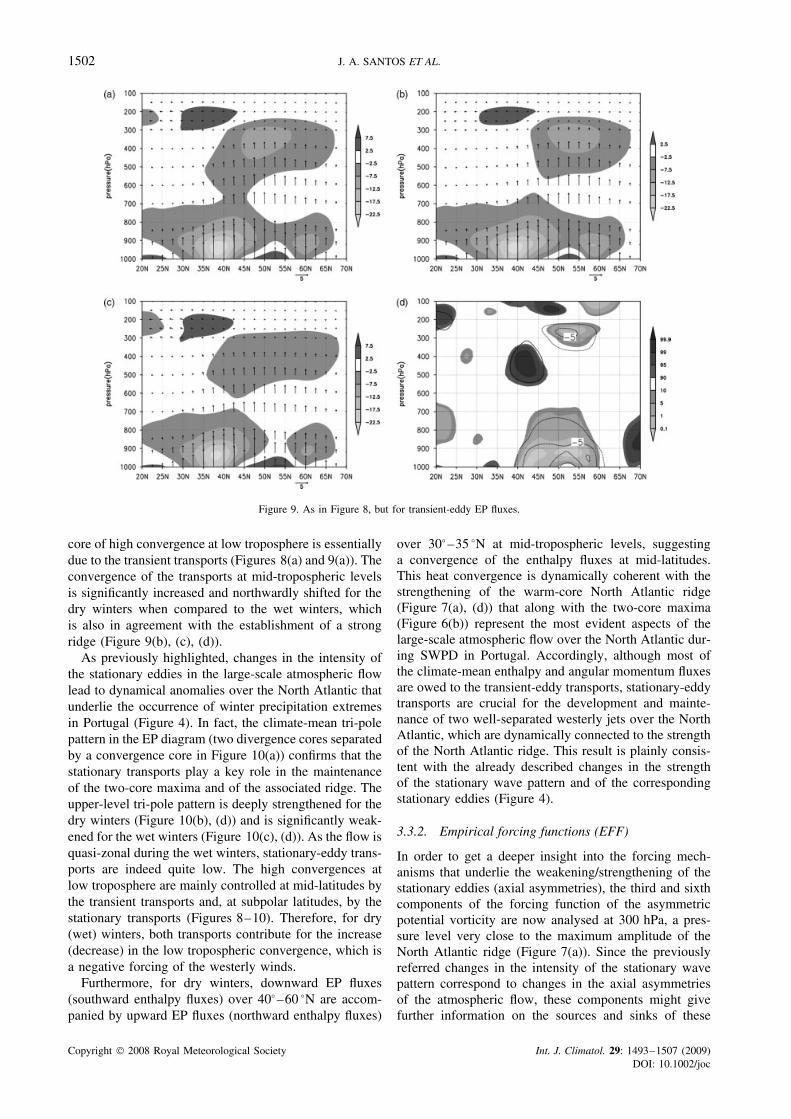
As previously highlighted, changes in the intensity ofthe stationary eddies in the large-scale atmospheric flowlead to dynamical anomalies over the North Atlantic thatunderlie the occurrence of winter precipitation extremesin Portugal (Figure 4). In fact, the climate-mean tri-polepattern in the EP diagram (two divergence cores separatedby a convergence core in Figure 10(a)) confirms that thestationary transports play a key role in the maintenanceof the two-core maxima and of the associated ridge. Theupper-level tri-pole pattern is deeply strengthened for thedry winters (Figure 10(b), (d)) and is significantly weak-ened for the wet winters (Figure 10(c), (d)). As the flow isquasi-zonal during the wet winters, stationary-eddy trans-ports are indeed quite low. The high convergences atlow troposphere are mainly controlled at mid-latitudes bythe transient transports and, at subpolar latitudes, by thestationary transports (Figures 8–10). Therefore, for dry(wet) winters, both transports contribute for the increase(decrease) in the low tropospheric convergence, which isa negative forcing of the westerly winds.
Furthermore, for dry winters, downward EP fluxes(southward enthalpy fluxes) over 40° –60 °N are accom-panied by upward EP fluxes (northward enthalpy fluxes)
over 30° –35 °N at mid-tropospheric levels, suggestinga convergence of the enthalpy fluxes at mid-latitudes.This heat convergence is dynamically coherent with thestrengthening of the warm-core North Atlantic ridge(Figure 7(a), (d)) that along with the two-core maxima(Figure 6(b)) represent the most evident aspects of thelarge-scale atmospheric flow over the North Atlantic dur-ing SWPD in Portugal. Accordingly, although most ofthe climate-mean enthalpy and angular momentum fluxesare owed to the transient-eddy transports, stationary-eddytransports are crucial for the development and mainte-nance of two well-separated westerly jets over the NorthAtlantic, which are dynamically connected to the strengthof the North Atlantic ridge. This result is plainly consis-tent with the already described changes in the strengthof the stationary wave pattern and of the correspondingstationary eddies (Figure 4).
3.3.2. Empirical forcing functions (EFF)
In order to get a deeper insight into the forcing mech-anisms that underlie the weakening/strengthening of thestationary eddies (axial asymmetries), the third and sixthcomponents of the forcing function of the asymmetricpotential vorticity are now analysed at 300 hPa, a pres-sure level very close to the maximum amplitude of theNorth Atlantic ridge (Figure 7(a)). Since the previouslyreferred changes in the intensity of the stationary wavepattern correspond to changes in the axial asymmetriesof the atmospheric flow, these components might givefurther information on the sources and sinks of these
Copyright 2008 Royal Meteorological Society Int. J. Climatol. 29: 1493–1507 (2009)DOI: 10.1002/joc
ROLE OF EDDIES IN WINTER PRECIPITATION DEFICITS IN PORTUGAL 1503
Figure 10. As in Figure 8, but for stationary-eddy EP fluxes.
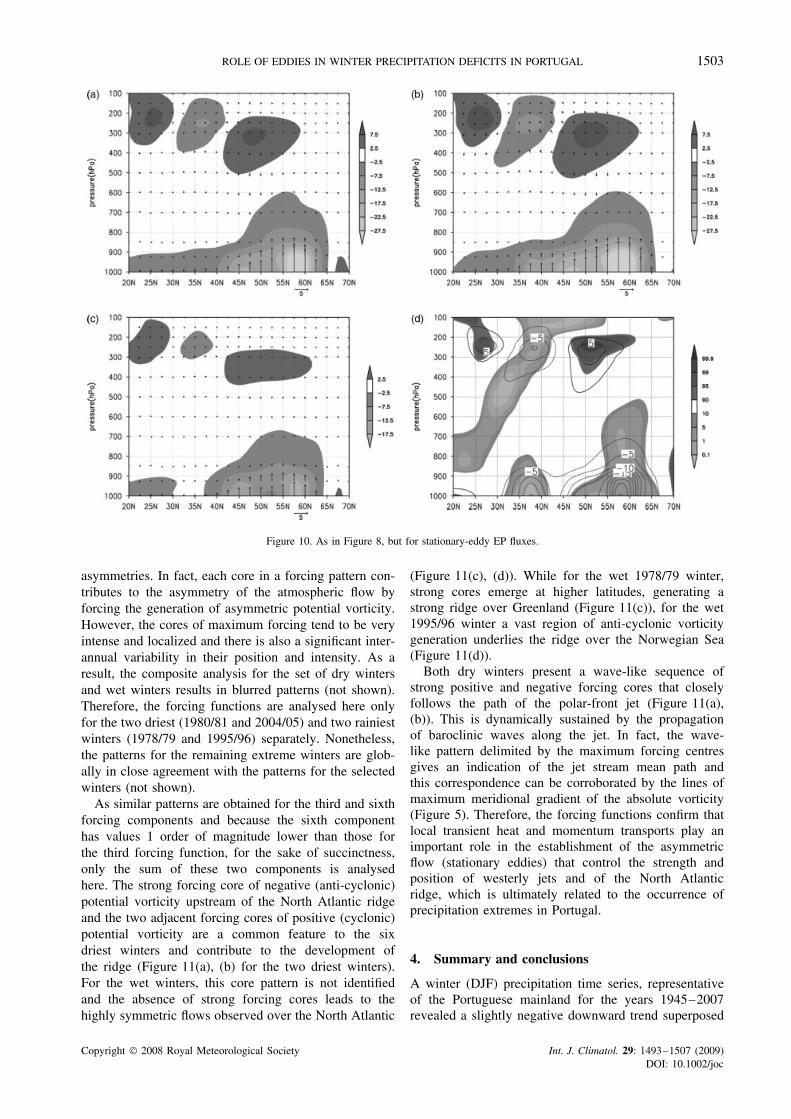
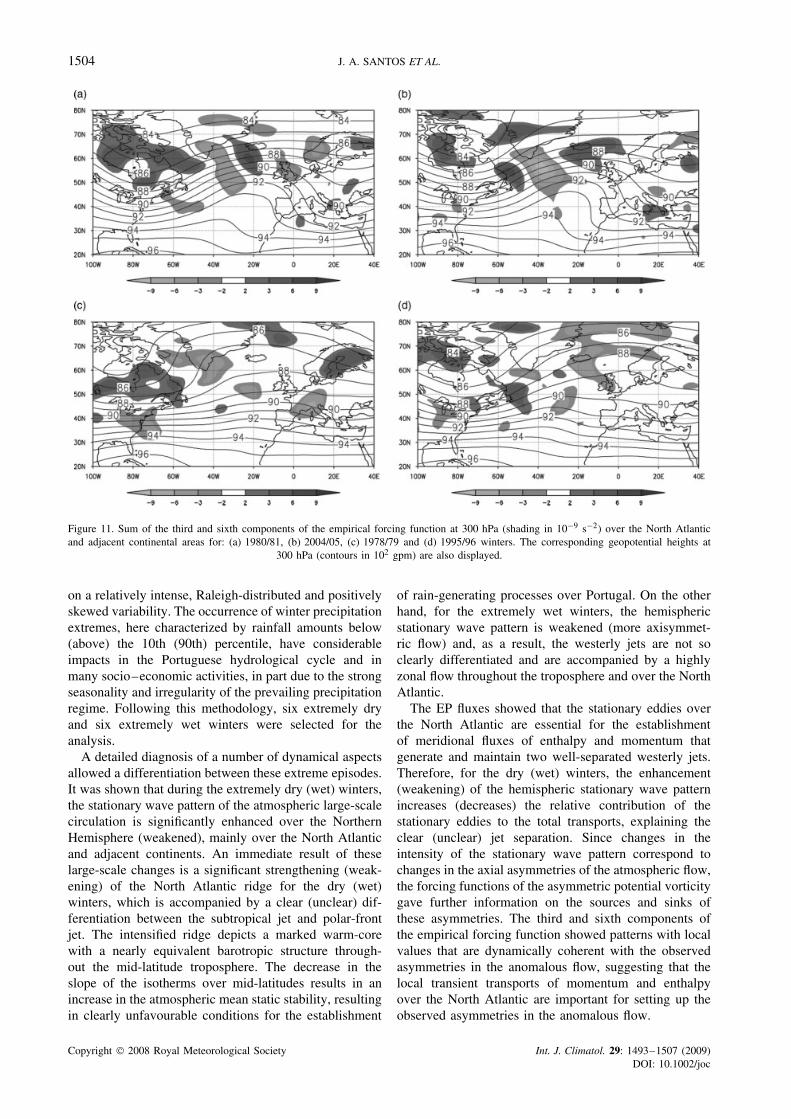
asymmetries. In fact, each core in a forcing pattern con-tributes to the asymmetry of the atmospheric flow byforcing the generation of asymmetric potential vorticity.However, the cores of maximum forcing tend to be veryintense and localized and there is also a significant inter-annual variability in their position and intensity. As aresult, the composite analysis for the set of dry wintersand wet winters results in blurred patterns (not shown).Therefore, the forcing functions are analysed here onlyfor the two driest (1980/81 and 2004/05) and two rainiestwinters (1978/79 and 1995/96) separately. Nonetheless,the patterns for the remaining extreme winters are glob-ally in close agreement with the patterns for the selectedwinters (not shown).
As similar patterns are obtained for the third and sixthforcing components and because the sixth componenthas values 1 order of magnitude lower than those forthe third forcing function, for the sake of succinctness,only the sum of these two components is analysedhere. The strong forcing core of negative (anti-cyclonic)potential vorticity upstream of the North Atlantic ridgeand the two adjacent forcing cores of positive (cyclonic)potential vorticity are a common feature to the sixdriest winters and contribute to the development ofthe ridge (Figure 11(a), (b) for the two driest winters).For the wet winters, this core pattern is not identifiedand the absence of strong forcing cores leads to thehighly symmetric flows observed over the North Atlantic
(Figure 11(c), (d)). While for the wet 1978/79 winter,strong cores emerge at higher latitudes, generating astrong ridge over Greenland (Figure 11(c)), for the wet1995/96 winter a vast region of anti-cyclonic vorticitygeneration underlies the ridge over the Norwegian Sea(Figure 11(d)).
Both dry winters present a wave-like sequence ofstrong positive and negative forcing cores that closelyfollows the path of the polar-front jet (Figure 11(a),(b)). This is dynamically sustained by the propagationof baroclinic waves along the jet. In fact, the wave-like pattern delimited by the maximum forcing centresgives an indication of the jet stream mean path andthis correspondence can be corroborated by the lines ofmaximum meridional gradient of the absolute vorticity(Figure 5). Therefore, the forcing functions confirm thatlocal transient heat and momentum transports play animportant role in the establishment of the asymmetricflow (stationary eddies) that control the strength andposition of westerly jets and of the North Atlanticridge, which is ultimately related to the occurrence ofprecipitation extremes in Portugal.
4. Summary and conclusions
A winter (DJF) precipitation time series, representativeof the Portuguese mainland for the years 1945–2007revealed a slightly negative downward trend superposed
Copyright 2008 Royal Meteorological Society Int. J. Climatol. 29: 1493–1507 (2009)DOI: 10.1002/joc
1504 J. A. SANTOS ET AL.
Figure 11. Sum of the third and sixth components of the empirical forcing function at 300 hPa (shading in 10−9 s−2) over the North Atlanticand adjacent continental areas for: (a) 1980/81, (b) 2004/05, (c) 1978/79 and (d) 1995/96 winters. The corresponding geopotential heights at
300 hPa (contours in 102 gpm) are also displayed.
on a relatively intense, Raleigh-distributed and positivelyskewed variability. The occurrence of winter precipitationextremes, here characterized by rainfall amounts below(above) the 10th (90th) percentile, have considerableimpacts in the Portuguese hydrological cycle and inmany socio–economic activities, in part due to the strongseasonality and irregularity of the prevailing precipitationregime. Following this methodology, six extremely dryand six extremely wet winters were selected for theanalysis.
A detailed diagnosis of a number of dynamical aspectsallowed a differentiation between these extreme episodes.It was shown that during the extremely dry (wet) winters,the stationary wave pattern of the atmospheric large-scalecirculation is significantly enhanced over the NorthernHemisphere (weakened), mainly over the North Atlanticand adjacent continents. An immediate result of theselarge-scale changes is a significant strengthening (weak-ening) of the North Atlantic ridge for the dry (wet)winters, which is accompanied by a clear (unclear) dif-ferentiation between the subtropical jet and polar-frontjet. The intensified ridge depicts a marked warm-corewith a nearly equivalent barotropic structure through-out the mid-latitude troposphere. The decrease in theslope of the isotherms over mid-latitudes results in anincrease in the atmospheric mean static stability, resultingin clearly unfavourable conditions for the establishment
of rain-generating processes over Portugal. On the otherhand, for the extremely wet winters, the hemisphericstationary wave pattern is weakened (more axisymmet-ric flow) and, as a result, the westerly jets are not soclearly differentiated and are accompanied by a highlyzonal flow throughout the troposphere and over the NorthAtlantic.
The EP fluxes showed that the stationary eddies overthe North Atlantic are essential for the establishmentof meridional fluxes of enthalpy and momentum thatgenerate and maintain two well-separated westerly jets.Therefore, for the dry (wet) winters, the enhancement(weakening) of the hemispheric stationary wave patternincreases (decreases) the relative contribution of thestationary eddies to the total transports, explaining theclear (unclear) jet separation. Since changes in theintensity of the stationary wave pattern correspond tochanges in the axial asymmetries of the atmospheric flow,the forcing functions of the asymmetric potential vorticitygave further information on the sources and sinks ofthese asymmetries. The third and sixth components ofthe empirical forcing function showed patterns with localvalues that are dynamically coherent with the observedasymmetries in the anomalous flow, suggesting that thelocal transient transports of momentum and enthalpyover the North Atlantic are important for setting up theobserved asymmetries in the anomalous flow.
Copyright 2008 Royal Meteorological Society Int. J. Climatol. 29: 1493–1507 (2009)DOI: 10.1002/joc

ROLE OF EDDIES IN WINTER PRECIPITATION DEFICITS IN PORTUGAL 1505
On the whole, local transient transports of momentumand enthalpy over the North Atlantic play a key role intriggering large-scale axially asymmetric anomalies in theatmospheric circulation that govern the strength and sep-aration of the westerly jets. These eddy-driven structuresare largely connected to the strength of the North Atlanticridge, which is ultimately coupled with the occurrence ofwinter precipitation extremes all across Portugal. In asubsequent study, other components of the forcing func-tion will be presented in order to improve the assess-ment of the role played by the different mechanical andthermal forcings of the general atmospheric circulation.Furthermore, some of these functions will be employedin the development of dynamical indices for modellingthe occurrence of precipitation extremes in Portugal andfor the assessment of likely future changes induced byanthropogenic forcing.
Acknowledgements
This research was developed under the projects: DeSur-vey – a surveillance system for assessing and monitoringof desertification (EU Contract IP-003950), BioAridRisk– Space-Time Evaluation of the Risks of Climate Changes
Based on an Aridity Index (POCI/CLI/56371/2004) andConnections between precipitation extremes in SouthernEurope and large-scale climate variability (CRUP N° A-28/08). All maps were produced by the Grid Analysis andDisplay System developed at the Center for Ocean-Land-Atmosphere Interactions. We would also like to thank theanonymous reviewers for their valuable comments on thispaper.
5. Appendix
The following notation was employed in the text:
i,j ,k Unit vectors in eastward, northward and upward directionsλ Longitudeφ Latitudep Pressuret Timea = 6.371 × 10⁶ m Mean radius of the Earth� = 7.292 × 10⁻⁵ rad s−1 Angular velocity of the Earthg = 9.80 m s−2 Apparent gravity accelerationu = a cos φ dλ
dtZonal wind component
v = adφdt
Meridional wind component
v = ui + vj Horizontal wind
ω = dpdt
Omega-vertical wind component� = gz Geopotential (specific potential energy)T Air temperature
θ = T[p0p
]k
Potential temperature (Poisson’s equation)
ζ Vertical component of the relative vorticityf = 2� cos φ Coriolis parameter/planetary vorticityη = ζ + f Vertical component of the absolute vorticitycp = 1004 J kg−1 K−1 Specific heat at constant pressureR = 287 J kg−1 .K−1 Gas constant for dry airκ = R/cp = 0.286 Poisson’s indexLv = 2.501 × 10⁶ J kg−1 Latent heat of condensationFλ Specific eastward/zonal frictional forceFφ Specific northward/meridional frictional force�F = Fλi + Fφi Specific horizontal frictional force�E = Eφj + Epk Eliassen–Palm flux vectorq Specific humidityqF Specific diabatic heating rate due to conduction and frictionqR Specific diabatic heating rate due to radiationqε Specific diabatic heating rate due to latent heat release� = ∂T
∂p− κ T
p = Tθ
∂θ∂p
Static stability parameter
Empirical forcing functionffn n-th component of the empirical forcing function〈 〉 Zonal-mean( )∗ = ( ) − 〈 〉 Departure from zonal-mean( ) Time-mean( )′ = ( ) − ( ) Departure from time-mean
Copyright 2008 Royal Meteorological Society Int. J. Climatol. 29: 1493–1507 (2009)DOI: 10.1002/joc
1506 J. A. SANTOS ET AL.
Considering the vorticity equation in the isobariccoordinate system (Saltzman, 1963; Saltzman and Rao,1963):
∂η
∂t+ v · ∇η + ω
∂η
∂p+ η∇ · v
+ k ·(∇ω × ∂ �v
∂p
)− k · (∇ × �F) = 0 A1
and using the thermodynamic energy equation:
∂T
∂t+ v · ∇T + ω� − (qF + qε + qR)
cp
= 0 A2
in order to eliminate ω, the potential vorticity equation isthen obtained:
∂ξ
∂t+ v · ∇ξ = f
∂
∂p
(qF + qε + qR
cp
)+ k · ∇ × �F
+ ζ∂ω
∂p− ω
∂ζ
∂p− k ·
(∇ω × ∂v
∂p
)+
+ ∂
∂p
(T
�
)v · ∇f − f
�
(∂v
∂p· ∇T
)+
f T
�2
(∂v∂p
· ∇�
)− f
∂
∂p
(T
�2 v · ∇�
)
− f∂
∂p
(T
�2
∂�
∂t
)A3
where ξ = η + f ∂∂p
(T�
)is a form of potential vorticity,
defined as the sum of the absolute vorticity with astability term.
With the aim of discussing the winter mean atmo-spheric state, after some mathematical development, thetime-averaged potential vorticity equation can be writtenas:
∂ξ
∂t+ v · ∇ξ − = ζ
∂ω
∂p− ω
∂ζ
∂p
− k ·(∇ω × ∂v
∂p
)+ ∂
∂p
(T
�
)v · ∇f −
− f
�
∂v∂p
· ∇T + f T
�2
∂v∂p
· ∇�
− f∂
∂p
(T
�2 v · ∇�
)− f
∂
∂p
(T
�2
∂�
∂t
)A4
with the following variable definitions:
= f∂
∂p
(Q
�
)
+ 1
a cos φ
(∂Y
∂λ− ∂X cos φ
∂φ
)A5
Q = qF + qε + qR
cp
− 1
a cos φ
(∂u′T ′
∂λ+ ∂
∂φv′T ′ cos φ
)
− ∂
∂pω′T ′ − κ
pω′T ′ A6
X = F λ − 1
a cos φ∂u′2∂λ
+ 1a cos φ
∂∂φ
u′v′ cos φ − tan φa u′v′ + ∂u′ω′
∂p
A7
Y = F φ − 1
a cos φ∂u′v′∂λ
+ 1a cos φ
∂∂φ
v′2 cos φ + tan φa u′2 + ∂v′ω′
∂p
. A8
From the latter equation, two derived equations canalso be resolved (not shown): one governing the symmet-ric (zonal-mean) flow and other the asymmetric (eddy)flow. For the asymmetric components and for a relativelylong time period, all terms on the right side of the time-average potential vorticity equation can be neglected,which results in the following expression (Saltzman,1963):
∂ξ∗
∂t∼= −(v · ∇ξ)∗ + ∼= 0 A9
where is the empirical forcing function (EFF) for thelarge-scale mean disturbances in the atmosphere. Fora stationary flow, which might also be a reasonableapproximation for a time period corresponding to anentire winter season, the local tendency of the time-meanpotential vorticity of the asymmetric perturbations mustbe balanced by the asymmetric advection of time-meanpotential vorticity by the time-mean flow. For steadyconditions, potential cyclonic (anti-cyclonic) vorticitytends to be advected by the mean flow in areas of negative(positive) EFF. This function can thus be thought ofas a tendency for the generation of cyclonic time-meanpotential vorticity in the asymmetric perturbations.
The empirical forcing function can then be separatedinto seven physically significant components, relatedto both mechanical (momentum fluxes) and thermalprocesses (heat fluxes):
(λ, φ, p) =7∑
n=1
ffn(λ, φ, p) A10
where ffn(λ, φ, p) represents the n-th component of theEFF. These components are thereby scalar atmosphericfields that can be mapped at different pressure levels overthe globe.
References
Andrews DG, McIntyre ME. 1976. Planetary waves in horizontal andvertical shear: the generalized Eliassen-Palm relation and the meanzonal acceleration. Journal of Atmospheric Sciences 33: 2031–2048.
Barnston AG, Livezey RE. 1987. Classification seasonality andpersistence of low-frequency atmospheric circulation patterns.Monthly Weather Review 115: 1083–1126.
Barriopedro D, Garcıa-Herrera R, Lupo AR, Hernandez E. 2006. Aclimatology of Northern Hemispheric Blocking. Journal of Climate19: 1042–1062.
Copyright 2008 Royal Meteorological Society Int. J. Climatol. 29: 1493–1507 (2009)DOI: 10.1002/joc

ROLE OF EDDIES IN WINTER PRECIPITATION DEFICITS IN PORTUGAL 1507
Bernardino M. 2003. Climate change and drought regimes in Europe.PhD Thesis, Faculty of Sciences, University of Lisboa, Lisboa.
Croci-Maspoli M, Schwierz C, Davies HC. 2007. A multifacetedclimatology of atmospheric blocking and its recent linear trend.Journal of Climate 20: 633–649.
Edmon HJ, Hoskins BJ, McIntyre ME. 1980. Eliassen-Palm crosssections for the troposphere. Journal of Atmospheric Sciences 37:2600–2616.
Feldstein SB, Franzke C. 2006. Are the North Atlantic oscillationand the northern annular mode distinguishable? Journal of theAtmospheric Sciences 63: 2915–2930.
Ferreira AB, Ferreira DB. 1983. A Seca de 1980–1981 em Portugal.Causas Meteorologicas e Tipos de Tempo. Finisterra 35: 27–63.
Giorgi F, Mearns LO. 2003. Probability of regional climate changebased on the Reliability Ensemble Averaging (REA) method.Geophysical Research Letters 30: 1629–1632.
Goodess CM, Jones PD. 2002. Links between circulation and changesin the characteristics of the Iberian rainfall. International Journal ofClimatology 22: 1593–1615.
Holton JR. 2004. An Introduction to Dynamical Meteorology, 4th edn.Elsevier Academic Press: New York.
Hoskins BJ, Ambrizzi T. 1993. Rossby wave propagation on a realisticlongitudinally varying flow. Journal of the Atmospheric Sciences 50:1661–1671.
Hoskins BJ, James IN, White GH. 1983. The shape, propagation, andmean-flow interaction of large-scale weather systems. Journal ofAtmospheric Sciences 40: 1595–1612.
Houghton JT, Ding Y, Griggs DJ, Noguer M, van der Linden PJ XDai K Maskell CA Johnson. 2001. Climate Change: The ScientificBasis. Cambridge University Press: Cambridge.
Hurrell JW. 1996. Influence of variations in extratropical wintertimeteleconnections on Northern Hemisphere temperatures. GeophysicalResearch Letters 23: 665–668.
James IN. 1983. Some aspects of the global circulation of theatmosphere in January and July 1980. In Large-Scale DynamicalProcesses in the Atmosphere, Hoskins BJ, Pearce RP (eds).Academic Press: London.
Jones PD, Jonsson T, Wheeler D. 1997. Extension to the NorthAtlantic Oscillation using early instrumental pressure observationsfrom Gibraltar and South-West Iceland. International Journal ofClimatology 17: 1433–1450.
Kalnay E, Kanamitsu M, Kistler R, Collins W, Deaven D, Gandin L,Iredell M, Saha S, White G, Woollen J, Zhu Y, Chelliah M,Ebisuzaki W, Higgins W, Janowiak J, Mo KC, Ropelewski C,Wang J, Leetmaa A, Reynolds R, Jenne R, Joseph D. 1996. TheNCEP/NCAR 40-year reanalysis project. Bulletin of the AmericanMeteorological Society 77: 437–471.
Kharin VV, Zwiers FW, Zhang X, Hegerl GC. 2007. Changes intemperature and precipitation extremes in the IPCC ensembleof global coupled model simulations. Journal of Climate 20:1419–1444.
Lee S, Kim H. 2003. The Dynamical relationship between subtropicaland eddy-driven jets. Journal of Atmospheric Sciences 60:1490–1503.
Osborn TJ. 2006. Recent variations in the winter North AtlanticOscillation. Weather 61: 353–355.
Osborn TJ, Briffa KR, Tett SFB, Jones PD, Trigo RM. 1999.Evaluation of the North Atlantic oscillation as simulated by a coupledclimate model. Climate Dynamics 15: 685–702.
Paredes D, Trigo RM, Garcia-Herrera R, Trigo IF. 2006. Understand-ing precipitation changes in Iberia in early spring: weather typ-ing and storm-tracking approaches. Journal of Hydrometeorology 7:101–113.
Peixoto JP, Oort AH. 1992. Physics of Climate. American Institute ofPhysics: New York.
Riviere G, Orlanski I. 2007. Characteristics of the Atlantic Storm-trackeddy activity and its relation with the North Atlantic Oscillation.Journal of the Atmospheric Sciences 64: 241–266.
Salinger M. 2005. Climate variability and change: Past, present andfuture – An overview. Climatic Change 70: 9–29.
Saltzman B. 1963. A generalized solution for the Large-scale time-average perturbations in the atmosphere. Journal of the AtmosphericSciences 20: 226–235.
Saltzman B, Rao MS. 1963. A Diagnostic study of the mean state ofthe atmosphere. Journal of the Atmospheric Sciences 20: 438–447.
Santos J. 1999. Contribuicao para a analise da variabilidade interanualdos campos da precipitacao e da temperatura na Penınsula Iberica,Trabalho de Sıntese, PAPCC: UTAD: Vila Real.
Santos J, Corte-Real J, Leite SM. 2005. Weather regimes and theirconnection to the winter rainfall in Portugal. International Journalof Climatology 25: 33–50, DOI: 10.1002/joc.1101.
Santos J, Corte-Real J, Leite SM. 2007a. Atmospheric Large-scale dynamics during the 2004/2005 winter drought inPortugal. International Journal of Climatology 27: 571–586, DOI:10.1002/joc.1425.
Santos J, Corte-Real J, Ulbrich U, Palutikof J. 2007b. European winterprecipitation extremes and surface large-scale circulation: a coupledmodel and its scenarios. Theoretical and Applied Climatology 87:85–102, DOI: 10.1007/s00704-005-0224-2.
Santos MA, Correia FN, Cunha LV. 1980. Drought Characterizationand Impacts in Portugal. A Case Study. NATO ASI, LNEC: Lisboa.
Serrano A, Garcia J, Mateos VL, Cancillo ML, Garrido J. 1999.Monthly modes of variation of precipitation over the IberianPeninsula. Journal of Climate 12: 2894–2919.
Shabbar A, Huang JP, Higuchi K. 2001. The relationship between thewintertime North Atlantic Oscillation and blocking episodes in theNorth Atlantic. International Journal of Climatology 21: 355.
Sheffield J, Wood EF. 2007. Projected changes in drought occurrenceunder future global warming from multi-model, multi-scenario, IPCCAR4 simulations. Climate Dynamics Online First. 31: 79–105. DOI:10.1007/s00382-007-0340-z.
Sneyers R. 1975. Sur L’analyse Statistique des Series d’observation.World Meteorological Organization, Technical note no. 143: Geneva.
Swanson KL, Kushner PJ, Held M. 1997. Dynamics of the barotropicstorm tracks. Journal of the Atmospheric Sciences 54: 791–810.
Tank AMGK, Konnen GP. 2003. Trends in indices of daily temperatureand precipitation extremes in Europe, 1946–1999. Journal ofClimate 16: 3665–3680.
Tank AMGK, Wijngaard JB, Konnen GP, Bohm R, Demaree G,Gocheva A, Mileta M, Pashiardis S, Hejkrlik L, Kern-Hansen C,Heino R, Bessemoulin P, Muller-Westermeier G, Tzanakou M, Sza-lai S, Palsdottir T, Fitzgerald D, Rubin S, Capaldo M, Maugeri M,Leitass A, Bukantis A, Aberfeld R, Van Engelen AFV, Forland E,Mietus M, Coelho F, Mares C, Razuvaev V, Nieplova E, Ceg-nar T, Lopez JA, Dahlstrom B, Moberg A, Kirchhofer W, Cey-lan A, Pachaliuk O, Alexander LV, Petrovic P. 2002. Daily datasetof 20th-century surface air temperature and precipitation series for theEuropean Climate Assessment. International Journal of Climatology22: 1441–1453.
Thompson DWJ, Wallace JM. 2000. Annular modes in the extratropi-cal circulation. Part I: month-to-month variability. Journal of Climate13: 1000–1016.
Trigo RM, DaCamara CC. 2000. Circulation weather types and theirinfluence on the precipitation regime in Portugal. InternationalJournal of Climatology 20: 1559–1581.
Trigo RM, Osborn TJ, Corte-Real JM. 2002. The North AtlanticOscillation influence on Europe. Climate impacts and associatedphysical mechanisms. Climate Research 20: 9–17.
Ulbrich U, Cristoph M, Pinto JG, Corte-Real J. 1999. Dependence ofwinter precipitation over Portugal on NAO and baroclinic waveactivity. International Journal of Climatology 19: 379–390.
Wang XL, Swail VR, Zwiers FW. 2006. Climatology and changesof extratropical cyclone activity: Comparison of ERA-40 withNCEP-NCAR reanalysis for 1958–2001. Journal of Climate 19:3145–3166.
WMO. 1996. Climatological Normals (CLINO) for the Period1961–1990. World Meteorological Organization Doc. WMO/OMM– No. 847 : Geneva.
Zhang X, Wang XL, Corte-Real J. 1997. On the relationships betweendaily circulation patterns and precipitation in Portugal. Journal ofGeophysical Research 102: 13495–13-507.
Copyright 2008 Royal Meteorological Society Int. J. Climatol. 29: 1493–1507 (2009)DOI: 10.1002/joc
Related Documents