WASHINGTON, DC // LONDON // BRUSSELS // HONG KONG // WWW.ICI.ORG ICI RESEARCH PERSPECTIVE JANUARY 2022 // VOL. 28, NO. 1 The Role of IRAs in US Households’ Saving for Retirement, 2021 KEY FINDINGS » In mid-2021, 37 percent of US households owned individual retirement accounts (IRAs). More than eight in 10 IRA-owning households also had employer-sponsored retirement plan accumulations or had defined benefit plan coverage. All told, more than six in 10 US households had retirement plans through work or IRAs; more than three-quarters of near-retiree households did. » In mid-2021, 28 percent of US households owned traditional IRAs. Traditional IRAs were the most common type of IRA owned, followed by Roth IRAs and employer-sponsored IRAs. » Rollovers from employer-sponsored retirement plans have fueled the growth in IRAs. In mid-2021, 57 percent of traditional IRA–owning households indicated that their IRAs contained rollovers from employer-sponsored retirement plans. Among households with rollovers in their traditional IRAs, 85 percent indicated that they had rolled over the entire retirement account balance in their most recent rollover; 44 percent had also made contributions to their traditional IRAs at some point. » Traditional IRA–owning households with rollovers cite multiple reasons for rolling over their retirement plan assets into traditional IRAs. The three most common primary reasons for rolling over were not wanting to leave assets behind at the former employer, wanting to consolidate assets, and wanting more investment options (25 percent, 22 percent, and 13 percent of traditional IRA–owning households with rollovers, respectively). Key findings continued »

Welcome message from author
This document is posted to help you gain knowledge. Please leave a comment to let me know what you think about it! Share it to your friends and learn new things together.
Transcript
WASHINGTON, DC // LONDON // BRUSSELS // HONG KONG // WWW.ICI.ORG
ICI RESEARCH
PERSPECTIVEJANUARY 2022 // VOL. 28, NO. 1
The Role of IRAs in US Households’ Saving for Retirement, 2021
KEY FINDINGS
» In mid-2021, 37 percent of US households owned individual retirement accounts (IRAs). More than eight in 10 IRA-owning households also had employer-sponsored retirement plan accumulations or had defined benefit plan coverage. All told, more than six in 10 US households had retirement plans through work or IRAs; more than three-quarters of near-retiree households did.
» In mid-2021, 28 percent of US households owned traditional IRAs. Traditional IRAs were the most common type of IRA owned, followed by Roth IRAs and employer-sponsored IRAs.
» Rollovers from employer-sponsored retirement plans have fueled the growth in IRAs. In mid-2021, 57 percent of traditional IRA–owning households indicated that their IRAs contained rollovers from employer-sponsored retirement plans. Among households with rollovers in their traditional IRAs, 85 percent indicated that they had rolled over the entire retirement account balance in their most recent rollover; 44 percent had also made contributions to their traditional IRAs at some point.
» Traditional IRA–owning households with rollovers cite multiple reasons for rolling over their retirement plan assets into traditional IRAs. The three most common primary reasons for rolling over were not wanting to leave assets behind at the former employer, wanting to consolidate assets, and wanting more investment options (25 percent, 22 percent, and 13 percent of traditional IRA–owning households with rollovers, respectively).
Key findings continued »
2 ICI RESEARCH PERSPECTIVE, VOL. 28, NO. 1 // JANUARY 2022
What’s Inside
Key findings continued »
» Although most US households were eligible to make IRA contributions, few did so. Only 13 percent of US households contributed to traditional or Roth IRAs in tax year 2020. Thirty-seven percent of households owning traditional or Roth IRAs in mid-2021 made contributions in tax year 2020. Other research finds that confusion over rules or satisfying savings needs at work may explain lack of contributions. In addition, traditional IRA–owning households without contributions tended to have rollovers (60 percent) or have defined contribution (DC) plan accounts (73 percent). Forty-four percent of traditional IRA–owning households without contributionswere retired.
» IRA withdrawals were infrequent and mostly retirement related. Twenty-three percent of traditional IRA–owning households in mid-2021 took withdrawals in tax year 2020 compared with 27 percent in tax year 2019.The Coronavirus Aid, Relief, and Economic Security (CARES) Act, enacted March 27, 2020, suspended requiredminimum distributions (RMDs) for tax year 2020.
» The majority of traditional IRA withdrawals were made by retirees. Eighty-three percent of households thatmade traditional IRA withdrawals were retired. Indeed, only 7 percent of traditional IRA–owning householdsin mid-2021 headed by individuals younger than 59 took withdrawals. Sixty-one percent of traditional IRA–owning households with withdrawals calculated the withdrawal using the RMD rule—this was the most commonamount withdrawn.
» Most traditional IRA–owning households have a planned retirement strategy. Seventy percent of traditionalIRA–owning households in mid-2021 indicated that they have a strategy for managing income and assets inretirement. Typically, these strategies have many components. Many traditional IRA–owning households with astrategy reported taking the following steps: 72 percent reviewed their asset allocation, 69 percent developeda retirement income plan, 66 percent determined their retirement expenses, 61 percent set aside emergencyfunds, and 57 percent determined when to take Social Security benefits.
Sarah Holden, senior director of retirement and investor research, and Daniel Schrass, economist, prepared this report.
Suggested citation: Holden, Sarah, and Daniel Schrass. 2022. “The Role of IRAs in US Households’ Saving for Retirement, 2021.” ICI Research Perspective 28, no. 1 (January). Available at www.ici.org/files/2022/per28-01.pdf.
For more information about the role of IRAs in US households’ saving for retirement, see the appendix to this paper, available at www.ici.org/files/per28-01_data.xls.
3 IRAs Play an Increasingly Important Role in Saving for Retirement
6 Incidence of IRA Ownership Increases with Age and Income
9 IRA Owners Tend to Be Savers
11 Rollovers to Traditional IRAs Fuel Growth
18 Few Households Make Contributions to IRAs
20 Roth IRA Owners Are More Likely to Contribute
22 Traditional IRAs Are Held Through a Variety of Financial Institutions
22 IRA Withdrawals Are Infrequent, Mostly Retirement Related
29 The Role of Traditional IRA Withdrawals in Retirement
30 Most Traditional IRA Owners Have a Planned Retirement Strategy
32 Notes
35 References
38 Glossary
ICI RESEARCH PERSPECTIVE, VOL. 28, NO. 1 // JANUARY 2022 3
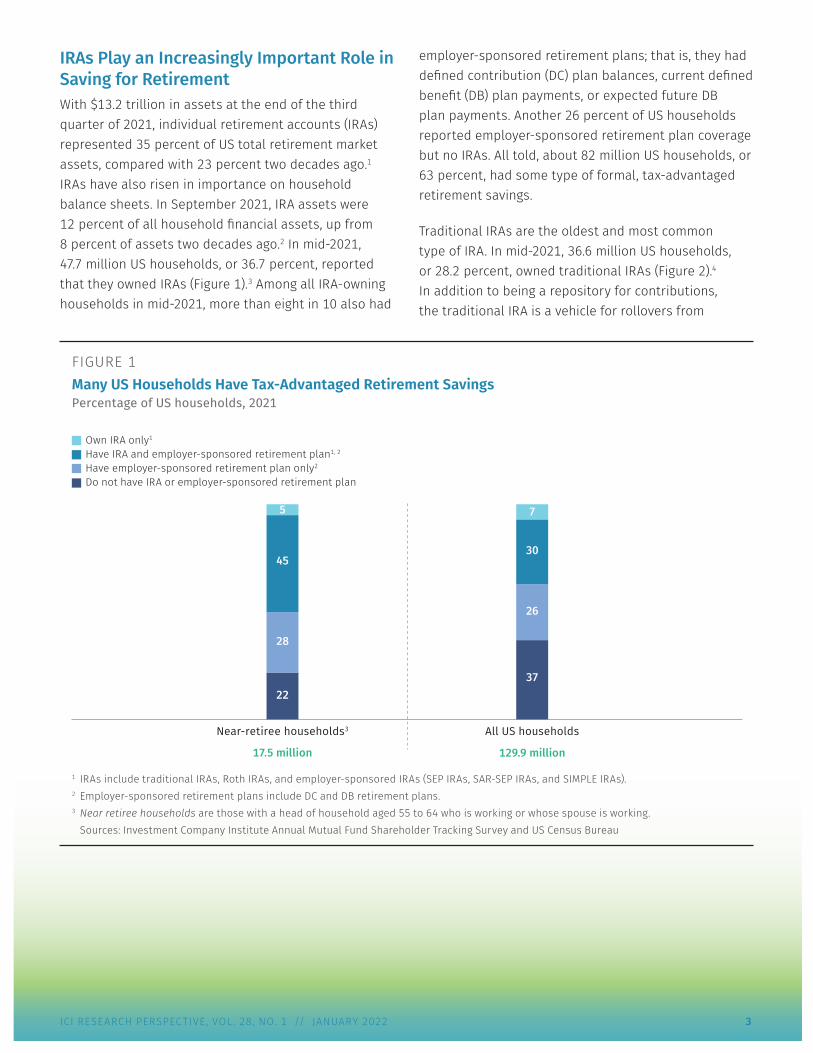
IRAs Play an Increasingly Important Role in Saving for Retirement With $13.2 trillion in assets at the end of the third quarter of 2021, individual retirement accounts (IRAs) represented 35 percent of US total retirement market assets, compared with 23 percent two decades ago.1 IRAs have also risen in importance on household balance sheets. In September 2021, IRA assets were 12 percent of all household financial assets, up from 8 percent of assets two decades ago.2 In mid-2021, 47.7 million US households, or 36.7 percent, reported that they owned IRAs (Figure 1).3 Among all IRA-owning households in mid-2021, more than eight in 10 also had
employer-sponsored retirement plans; that is, they had defined contribution (DC) plan balances, current defined benefit (DB) plan payments, or expected future DB plan payments. Another 26 percent of US households reported employer-sponsored retirement plan coverage but no IRAs. All told, about 82 million US households, or 63 percent, had some type of formal, tax-advantaged retirement savings.
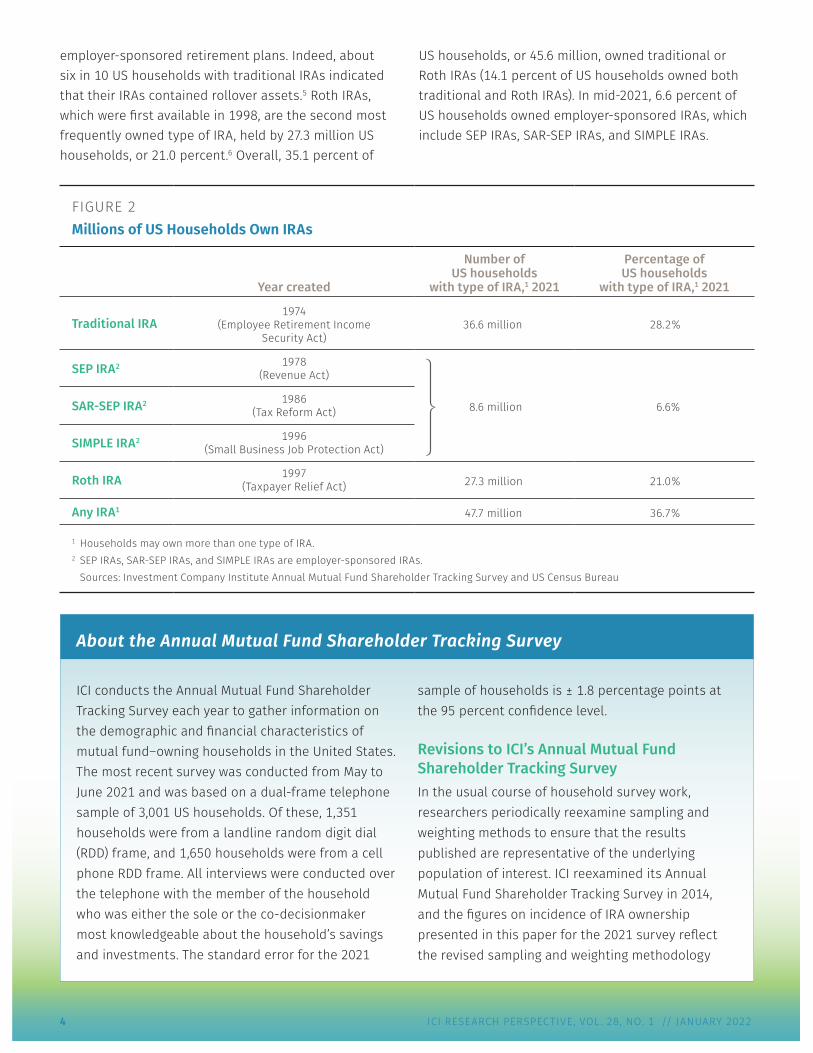
Traditional IRAs are the oldest and most common type of IRA. In mid-2021, 36.6 million US households, or 28.2 percent, owned traditional IRAs (Figure 2).4 In addition to being a repository for contributions, the traditional IRA is a vehicle for rollovers from
FIGURE 1Many US Households Have Tax-Advantaged Retirement SavingsPercentage of US households, 2021
Own IRA only1
Have IRA and employer-sponsored retirement plan1, 2
Have employer-sponsored retirement plan only2
Do not have IRA or employer-sponsored retirement plan
All US householdsNear-retiree households3
5
45
28
22
7
30
26
37
129.9 million17.5 million
1 IRAs include traditional IRAs, Roth IRAs, and employer-sponsored IRAs (SEP IRAs, SAR-SEP IRAs, and SIMPLE IRAs).2 Employer-sponsored retirement plans include DC and DB retirement plans.3 Near retiree households are those with a head of household aged 55 to 64 who is working or whose spouse is working.
Sources: Investment Company Institute Annual Mutual Fund Shareholder Tracking Survey and US Census Bureau
4 ICI RESEARCH PERSPECTIVE, VOL. 28, NO. 1 // JANUARY 2022
employer-sponsored retirement plans. Indeed, about six in 10 US households with traditional IRAs indicated that their IRAs contained rollover assets.5 Roth IRAs, which were first available in 1998, are the second most frequently owned type of IRA, held by 27.3 million US households, or 21.0 percent.6 Overall, 35.1 percent of
US households, or 45.6 million, owned traditional or Roth IRAs (14.1 percent of US households owned both traditional and Roth IRAs). In mid-2021, 6.6 percent of US households owned employer-sponsored IRAs, which include SEP IRAs, SAR-SEP IRAs, and SIMPLE IRAs.
FIGURE 2Millions of US Households Own IRAs
Year created
Number of US households
with type of IRA,1 2021
Percentage of US households
with type of IRA,1 2021
Traditional IRA1974
(Employee Retirement Income Security Act)
36.6 million 28.2%
SEP IRA2 1978 (Revenue Act)
SAR-SEP IRA2 1986 (Tax Reform Act) 8.6 million 6.6%
SIMPLE IRA2 1996 (Small Business Job Protection Act)
Roth IRA 1997 (Taxpayer Relief Act) 27.3 million 21.0%
Any IRA1 47.7 million 36.7%
1 Households may own more than one type of IRA.2 SEP IRAs, SAR-SEP IRAs, and SIMPLE IRAs are employer-sponsored IRAs.
Sources: Investment Company Institute Annual Mutual Fund Shareholder Tracking Survey and US Census Bureau
About the Annual Mutual Fund Shareholder Tracking Survey
ICI conducts the Annual Mutual Fund Shareholder Tracking Survey each year to gather information on the demographic and financial characteristics of mutual fund–owning households in the United States. The most recent survey was conducted from May to June 2021 and was based on a dual-frame telephone sample of 3,001 US households. Of these, 1,351 households were from a landline random digit dial (RDD) frame, and 1,650 households were from a cell phone RDD frame. All interviews were conducted over the telephone with the member of the household who was either the sole or the co-decisionmaker most knowledgeable about the household’s savings and investments. The standard error for the 2021
sample of households is ± 1.8 percentage points at the 95 percent confidence level.
Revisions to ICI’s Annual Mutual Fund Shareholder Tracking Survey In the usual course of household survey work, researchers periodically reexamine sampling and weighting methods to ensure that the results published are representative of the underlying population of interest. ICI reexamined its Annual Mutual Fund Shareholder Tracking Survey in 2014, and the figures on incidence of IRA ownership presented in this paper for the 2021 survey reflect the revised sampling and weighting methodology
ICI RESEARCH PERSPECTIVE, VOL. 28, NO. 1 // JANUARY 2022 5
that was adopted in 2014. To achieve a representative sample of US households, the 2014, 2015, 2016, 2017, and 2018 Annual Mutual Fund Shareholder Tracking Surveys were based on dual-frame samples of landline (about half) and cell phone numbers (about half). The combined samples for 2019, 2020, and 2021 include about 45 percent of households reached on a landline and about 55 percent of households reached on a cell phone. Before 2014, the Annual Mutual Fund Shareholder Tracking Survey was based on a sample of landline phone numbers only. The change to a combined sample of cell and landline phone numbers improves the representativeness of the sample. For a detailed description of the survey methodology, see “Ownership of Mutual Funds, Shareholder Sentiment, and Use of the Internet, 2021,” ICI Research Perspective 27, no. 11 (October), available at www.ici.org/files/2021/per27-11.pdf.
About the IRA Owners Survey ICI conducts the IRA Owners Survey each year to gather information on the characteristics and activities of IRA-owning households in the United States. The most recent survey was conducted in June 2021 using the KnowledgePanel®, a probability-based online panel designed to be representative of the US population. The KnowledgePanel® was designed and administered by Ipsos, an online consumer research company. The 2021 sample of IRA owners included 3,257 representative US households owning traditional IRAs or Roth IRAs. All surveys were conducted online with the member of the household aged 18 or older who was the sole or co-decisionmaker most knowledgeable about the household’s savings and investments. The standard error for the total sample is ± 1.7 percentage points at the 95 percent confidence level. In 2016, 2017, 2018, 2019, 2020, and 2021, households owning traditional or Roth IRAs were surveyed, and thus households owning only employer-sponsored IRAs (SEP IRAs, SAR-SEP IRAs, and SIMPLE IRAs) or Coverdell education savings accounts (formerly called education IRAs) are not included.
Revisions to ICI’s IRA Owners Survey Starting in 2016, the ICI IRA Owners Survey was changed from a dual-frame RDD telephone survey to a self-administered online survey on the KnowledgePanel®, a probability-based online panel administered by Ipsos. In 2021, the KnowledgePanel® includes about 60,000 individuals from randomly sampled households. Initially, participants are chosen scientifically by a random selection of telephone numbers and residential addresses. Persons in selected households are then invited by telephone or by mail to participate in the web-enabled KnowledgePanel®. For those who agree to participate but do not already have internet access, Ipsos provides a laptop and internet service provider (ISP) connection at no cost. People who already have computers and internet service are permitted to participate using their own equipment. Panelists then receive unique log-in information for accessing surveys online and are sent emails throughout each month inviting them to participate in research.
In addition to the change in the survey mode for the ICI IRA Owners Survey in 2016, the questionnaire was also revised to collect only demographic and financial characteristics of households owning traditional IRAs or Roth IRAs. In previous years, the survey collected information on households owning employer-sponsored IRAs (SEP IRAs, SAR-SEP IRAs, and SIMPLE IRAs). These survey changes were implemented in 2016 to reduce the cost of data collection, improve the representativeness of the sample, and reduce the burden on survey respondents.
Because the methodology for the IRA Owners Survey was changed to an online survey in 2016, it was necessary to adjust the weighting methodology for the survey. For the 2016, 2017, 2018, 2019, 2020, and 2021 data, the weighting included the standard raking to control totals based on census region, householder age, household income, and educational attainment of US households owning traditional or Roth IRAs.
About the Annual Mutual Fund Shareholder Tracking Survey continued
6 ICI RESEARCH PERSPECTIVE, VOL. 28, NO. 1 // JANUARY 2022
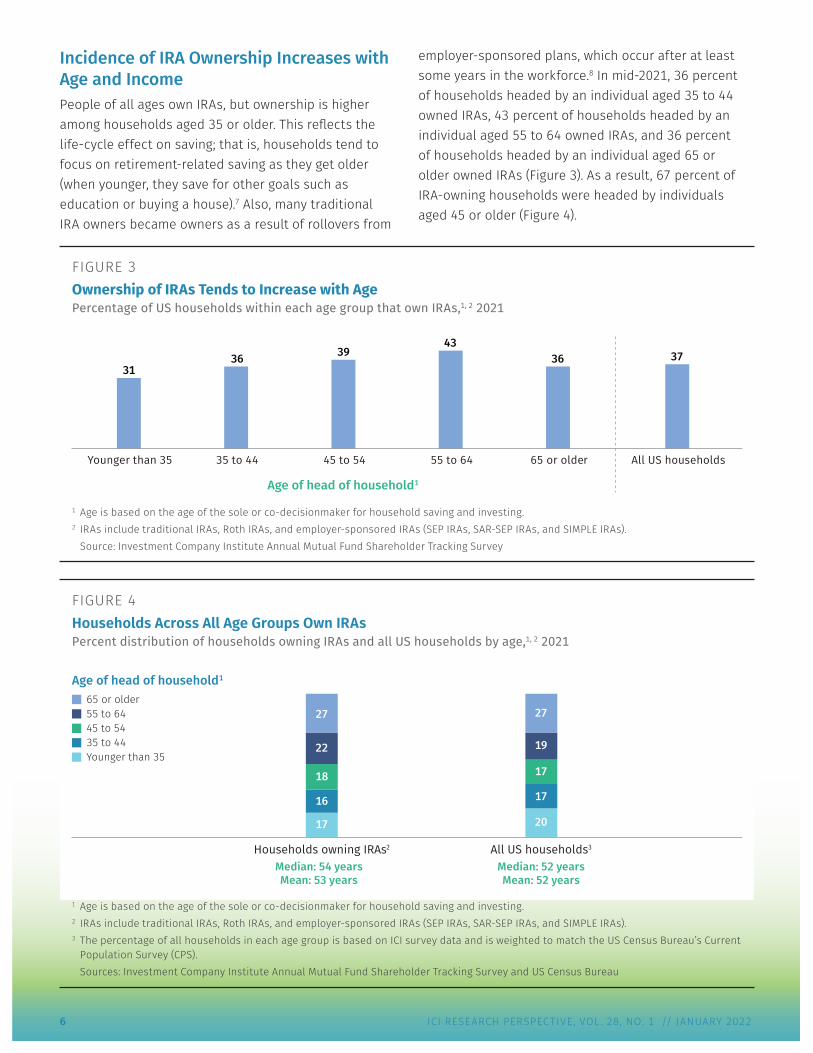
Incidence of IRA Ownership Increases with Age and Income People of all ages own IRAs, but ownership is higher among households aged 35 or older. This reflects the life-cycle effect on saving; that is, households tend to focus on retirement-related saving as they get older (when younger, they save for other goals such as education or buying a house).7 Also, many traditional IRA owners became owners as a result of rollovers from
employer-sponsored plans, which occur after at least some years in the workforce.8 In mid-2021, 36 percent of households headed by an individual aged 35 to 44 owned IRAs, 43 percent of households headed by an individual aged 55 to 64 owned IRAs, and 36 percent of households headed by an individual aged 65 or older owned IRAs (Figure 3). As a result, 67 percent of IRA-owning households were headed by individuals aged 45 or older (Figure 4).
FIGURE 3Ownership of IRAs Tends to Increase with Age Percentage of US households within each age group that own IRAs,1, 2 2021
All US households65 or older55 to 6445 to 5435 to 44Younger than 35
3631
3943
36 37
Age of head of household1
1 Age is based on the age of the sole or co-decisionmaker for household saving and investing.2 IRAs include traditional IRAs, Roth IRAs, and employer-sponsored IRAs (SEP IRAs, SAR-SEP IRAs, and SIMPLE IRAs).
Source: Investment Company Institute Annual Mutual Fund Shareholder Tracking Survey
FIGURE 4Households Across All Age Groups Own IRAsPercent distribution of households owning IRAs and all US households by age,1, 2 2021
65 or older55 to 6445 to 5435 to 44Younger than 35
All US households3Households owning IRAs2
Median: 52 yearsMean: 52 years
Median: 54 yearsMean: 53 years
27
19
17
17
20
27
22
18
16
17
Age of head of household1
1 Age is based on the age of the sole or co-decisionmaker for household saving and investing.2 IRAs include traditional IRAs, Roth IRAs, and employer-sponsored IRAs (SEP IRAs, SAR-SEP IRAs, and SIMPLE IRAs).3 The percentage of all households in each age group is based on ICI survey data and is weighted to match the US Census Bureau’s Current
Population Survey (CPS).Sources: Investment Company Institute Annual Mutual Fund Shareholder Tracking Survey and US Census Bureau
ICI RESEARCH PERSPECTIVE, VOL. 28, NO. 1 // JANUARY 2022 7
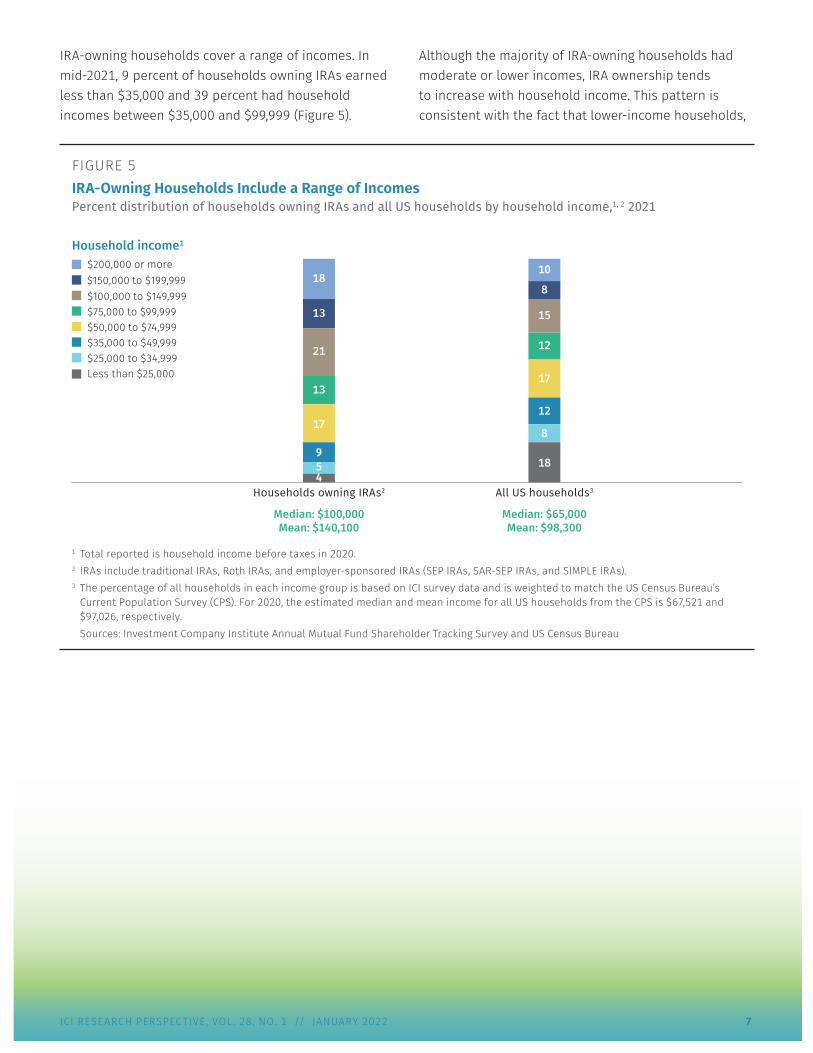
IRA-owning households cover a range of incomes. In mid-2021, 9 percent of households owning IRAs earned less than $35,000 and 39 percent had household incomes between $35,000 and $99,999 (Figure 5).
Although the majority of IRA-owning households had moderate or lower incomes, IRA ownership tends to increase with household income. This pattern is consistent with the fact that lower-income households,
FIGURE 5IRA-Owning Households Include a Range of IncomesPercent distribution of households owning IRAs and all US households by household income,1, 2 2021
$200,000 or more
$100,000 to $149,999$75,000 to $99,999$50,000 to $74,999$35,000 to $49,999 $25,000 to $34,999Less than $25,000
All US households3Households owning IRAs2
Median: $65,000Mean: $98,300
Median: $100,000Mean: $140,100
$150,000 to $199,999
13
18
21
13
17
459
8
10
15
12
17
18
8
12
Household income1
1 Total reported is household income before taxes in 2020.2 IRAs include traditional IRAs, Roth IRAs, and employer-sponsored IRAs (SEP IRAs, SAR-SEP IRAs, and SIMPLE IRAs).3 The percentage of all households in each income group is based on ICI survey data and is weighted to match the US Census Bureau’s
Current Population Survey (CPS). For 2020, the estimated median and mean income for all US households from the CPS is $67,521 and $97,026, respectively.Sources: Investment Company Institute Annual Mutual Fund Shareholder Tracking Survey and US Census Bureau
8 ICI RESEARCH PERSPECTIVE, VOL. 28, NO. 1 // JANUARY 2022
FIGURE 6Incidence of IRA Ownership Increases with Household Income Percentage of US households within each income group that own IRAs,1, 2 2021
$200,000 or more
$150,000 to $199,999
$100,000 to $149,999
$75,000 to $99,999
$50,000 to $74,999
$35,000 to $49,999
$25,000 to $34,999
Less than $25,000 9
28
22
38
38
65
60
50
18%Less than $50,000
48%$50,000 or more
Household income1
1 Total reported is household income before taxes in 2020.2 IRAs include traditional IRAs, Roth IRAs, and employer-sponsored IRAs (SEP IRAs, SAR-SEP IRAs, and SIMPLE IRAs).
Source: Investment Company Institute Annual Mutual Fund Shareholder Tracking Survey
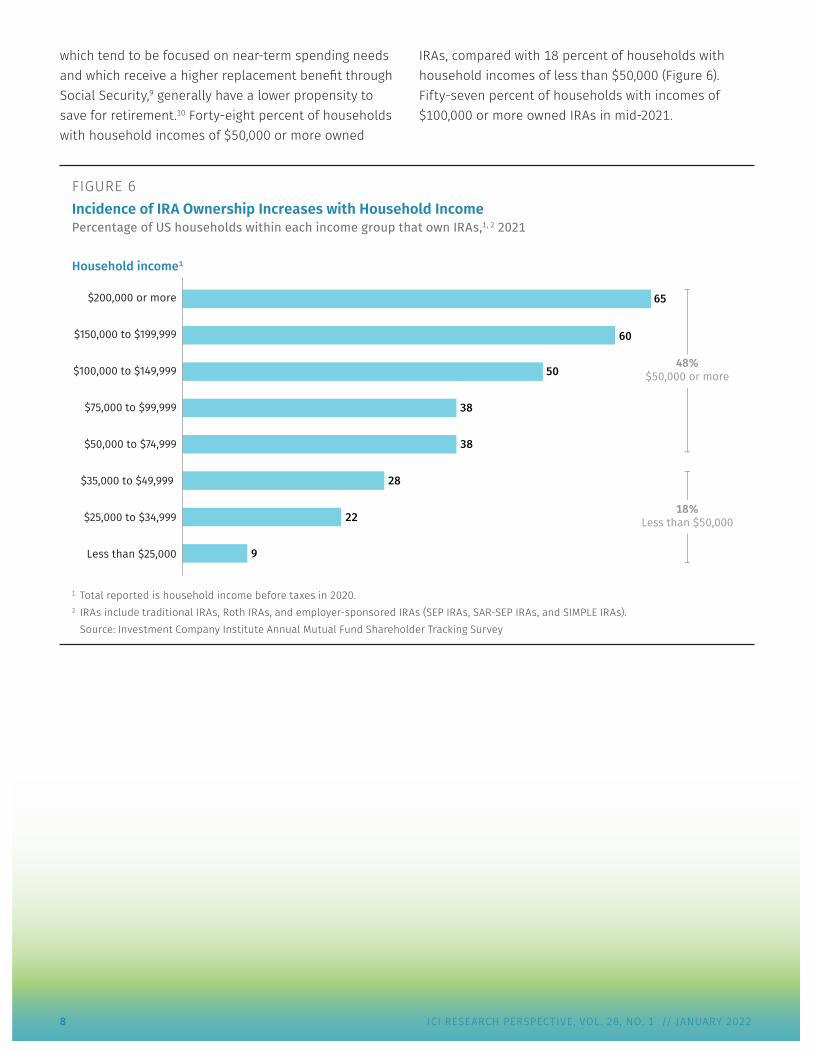
which tend to be focused on near-term spending needs and which receive a higher replacement benefit through Social Security,9 generally have a lower propensity to save for retirement.10 Forty-eight percent of households with household incomes of $50,000 or more owned
IRAs, compared with 18 percent of households with household incomes of less than $50,000 (Figure 6). Fifty-seven percent of households with incomes of $100,000 or more owned IRAs in mid-2021.
ICI RESEARCH PERSPECTIVE, VOL. 28, NO. 1 // JANUARY 2022 9
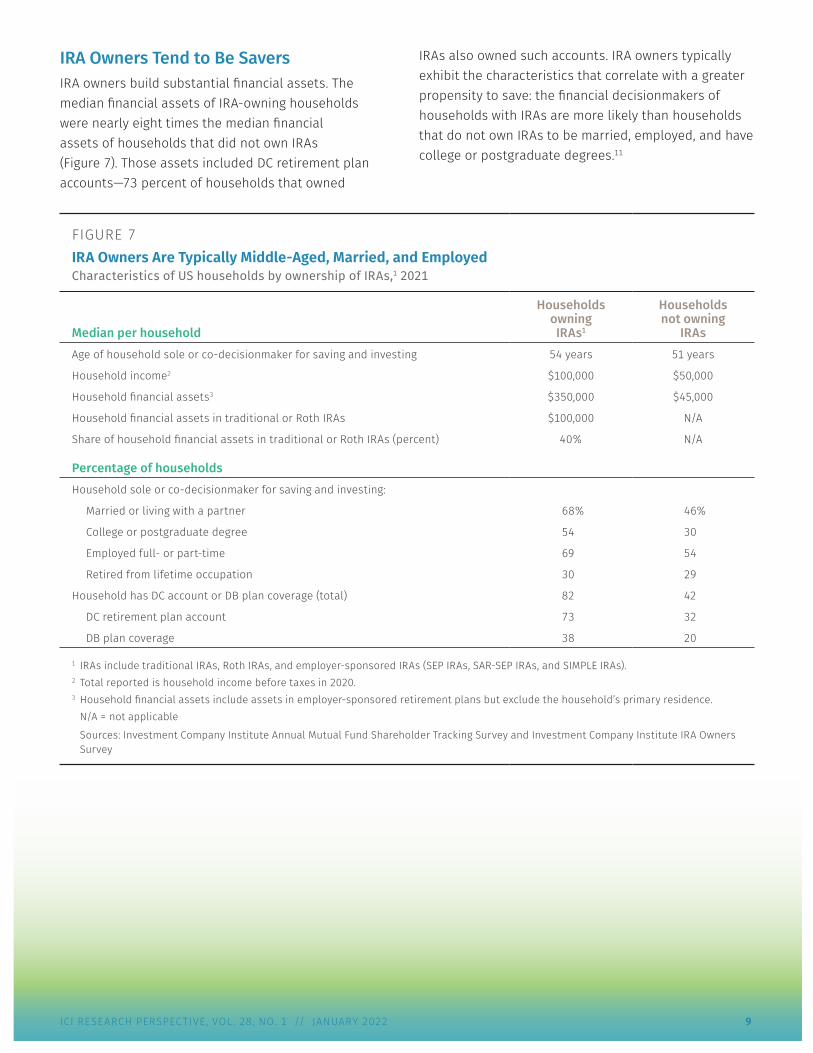
IRA Owners Tend to Be Savers IRA owners build substantial financial assets. The median financial assets of IRA-owning households were nearly eight times the median financial assets of households that did not own IRAs (Figure 7). Those assets included DC retirement plan accounts—73 percent of households that owned
IRAs also owned such accounts. IRA owners typically exhibit the characteristics that correlate with a greater propensity to save: the financial decisionmakers of households with IRAs are more likely than households that do not own IRAs to be married, employed, and have college or postgraduate degrees.11
FIGURE 7IRA Owners Are Typically Middle-Aged, Married, and EmployedCharacteristics of US households by ownership of IRAs,1 2021
Median per household
HouseholdsowningIRAs1
Householdsnot owning
IRAsAge of household sole or co-decisionmaker for saving and investing 54 years 51 years
Household income2 $100,000 $50,000
Household financial assets3 $350,000 $45,000
Household financial assets in traditional or Roth IRAs $100,000 N/A
Share of household financial assets in traditional or Roth IRAs (percent) 40% N/A
Percentage of households Household sole or co-decisionmaker for saving and investing:
Married or living with a partner 68% 46%
College or postgraduate degree 54 30
Employed full- or part-time 69 54
Retired from lifetime occupation 30 29
Household has DC account or DB plan coverage (total) 82 42
DC retirement plan account 73 32
DB plan coverage 38 20
1 IRAs include traditional IRAs, Roth IRAs, and employer-sponsored IRAs (SEP IRAs, SAR-SEP IRAs, and SIMPLE IRAs).2 Total reported is household income before taxes in 2020.3 Household financial assets include assets in employer-sponsored retirement plans but exclude the household’s primary residence.
N/A = not applicable
Sources: Investment Company Institute Annual Mutual Fund Shareholder Tracking Survey and Investment Company Institute IRA Owners Survey
10 ICI RESEARCH PERSPECTIVE, VOL. 28, NO. 1 // JANUARY 2022
FIGURE 8Willingness to Take Investment Risk Tends to Fall with AgePercentage of US households by age,1, 2 2021
65 or older55 to 6445 to 5435 to 44 Younger than 35All US households
Substantial risk for substantial gainAbove-average risk for above-average gainAverage risk for average gainBelow-average risk for below-average gainUnwilling to take any risk
65 or older55 to 6445 to 5435 to 44 Younger than 35All IRA-owninghouseholds
Level of risk willing to take with financial investments
Households owning IRAs2
All US households
Age of head of household1
Age of head of household1
26
19
17
17
21
620
32
9
33
31
40
1110
9 7 5 8 2
23 23 27 2010
31 34 33 32
30
13 8 8 6
10
24 28 27 3448
12 11 5 10 3
39 35 42 3117
26 38 38 47
47
12 8 9 8
14
11 8 6 4 19
39
21
51
23
46
16
47
15
41
12
20
33
26
42
32
37
30
36
32
35
28
40
12
58
8
1 Age is based on the age of the sole or co-decisionmaker for household saving and investing.2 IRAs include traditional IRAs, Roth IRAs, and employer-sponsored IRAs (SEP IRAs, SAR-SEP IRAs, and SIMPLE IRAs).
Source: Investment Company Institute Annual Mutual Fund Shareholder Tracking Survey
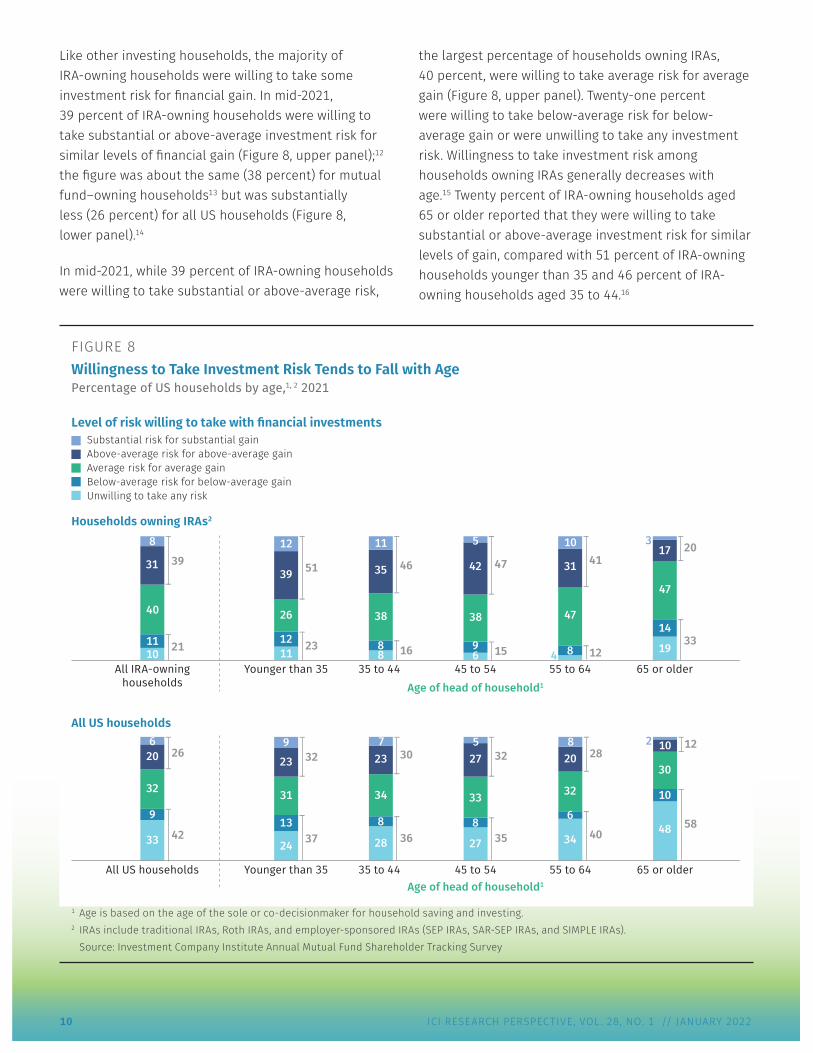
Like other investing households, the majority of IRA-owning households were willing to take some investment risk for financial gain. In mid-2021, 39 percent of IRA-owning households were willing to take substantial or above-average investment risk for similar levels of financial gain (Figure 8, upper panel);12 the figure was about the same (38 percent) for mutual fund–owning households13 but was substantially less (26 percent) for all US households (Figure 8, lower panel).14
In mid-2021, while 39 percent of IRA-owning households were willing to take substantial or above-average risk,
the largest percentage of households owning IRAs, 40 percent, were willing to take average risk for average gain (Figure 8, upper panel). Twenty-one percent were willing to take below-average risk for below-average gain or were unwilling to take any investment risk. Willingness to take investment risk among households owning IRAs generally decreases with age.15 Twenty percent of IRA-owning households aged 65 or older reported that they were willing to take substantial or above-average investment risk for similar levels of gain, compared with 51 percent of IRA-owning households younger than 35 and 46 percent of IRA-owning households aged 35 to 44.16
ICI RESEARCH PERSPECTIVE, VOL. 28, NO. 1 // JANUARY 2022 11
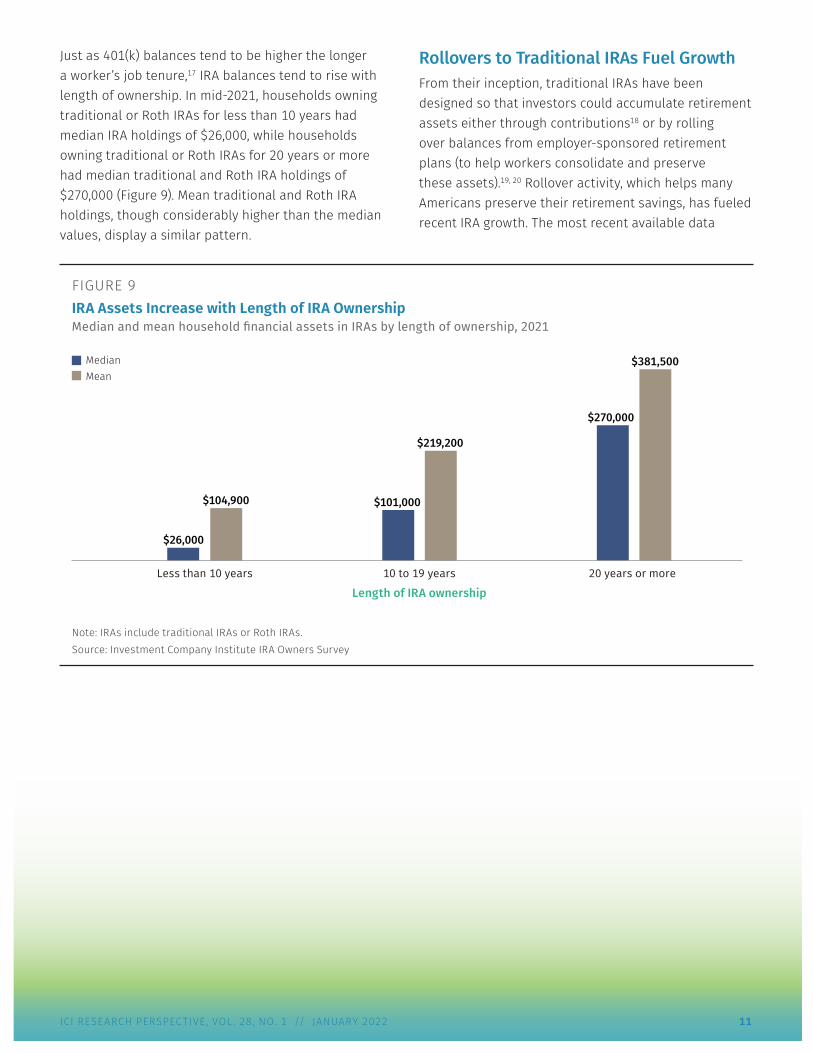
Just as 401(k) balances tend to be higher the longer a worker’s job tenure,17 IRA balances tend to rise with length of ownership. In mid-2021, households owning traditional or Roth IRAs for less than 10 years had median IRA holdings of $26,000, while households owning traditional or Roth IRAs for 20 years or more had median traditional and Roth IRA holdings of $270,000 (Figure 9). Mean traditional and Roth IRA holdings, though considerably higher than the median values, display a similar pattern.
Rollovers to Traditional IRAs Fuel Growth From their inception, traditional IRAs have been designed so that investors could accumulate retirement assets either through contributions18 or by rolling over balances from employer-sponsored retirement plans (to help workers consolidate and preserve these assets).19, 20 Rollover activity, which helps many Americans preserve their retirement savings, has fueled recent IRA growth. The most recent available data
FIGURE 9IRA Assets Increase with Length of IRA OwnershipMedian and mean household financial assets in IRAs by length of ownership, 2021
MeanMedian
20 years or more 10 to 19 yearsLess than 10 years
$26,000
$104,900 $101,000
$219,200
$381,500
$270,000
Length of IRA ownership
Note: IRAs include traditional IRAs or Roth IRAs. Source: Investment Company Institute IRA Owners Survey
12 ICI RESEARCH PERSPECTIVE, VOL. 28, NO. 1 // JANUARY 2022
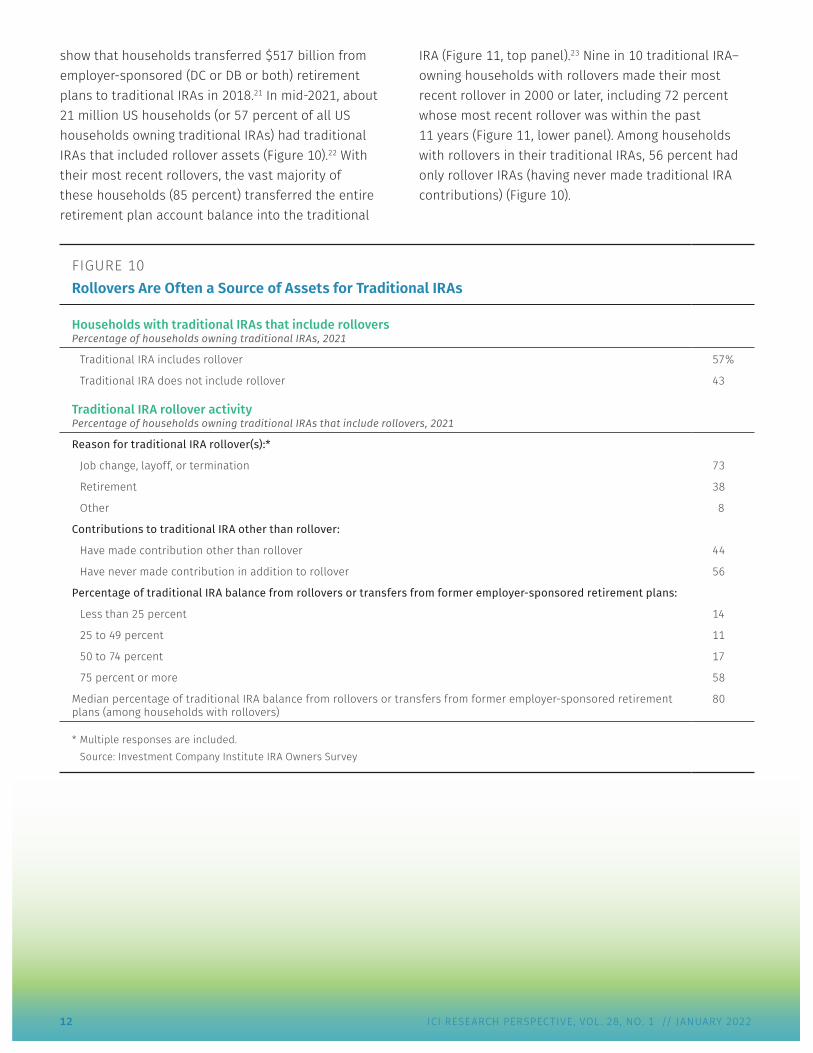
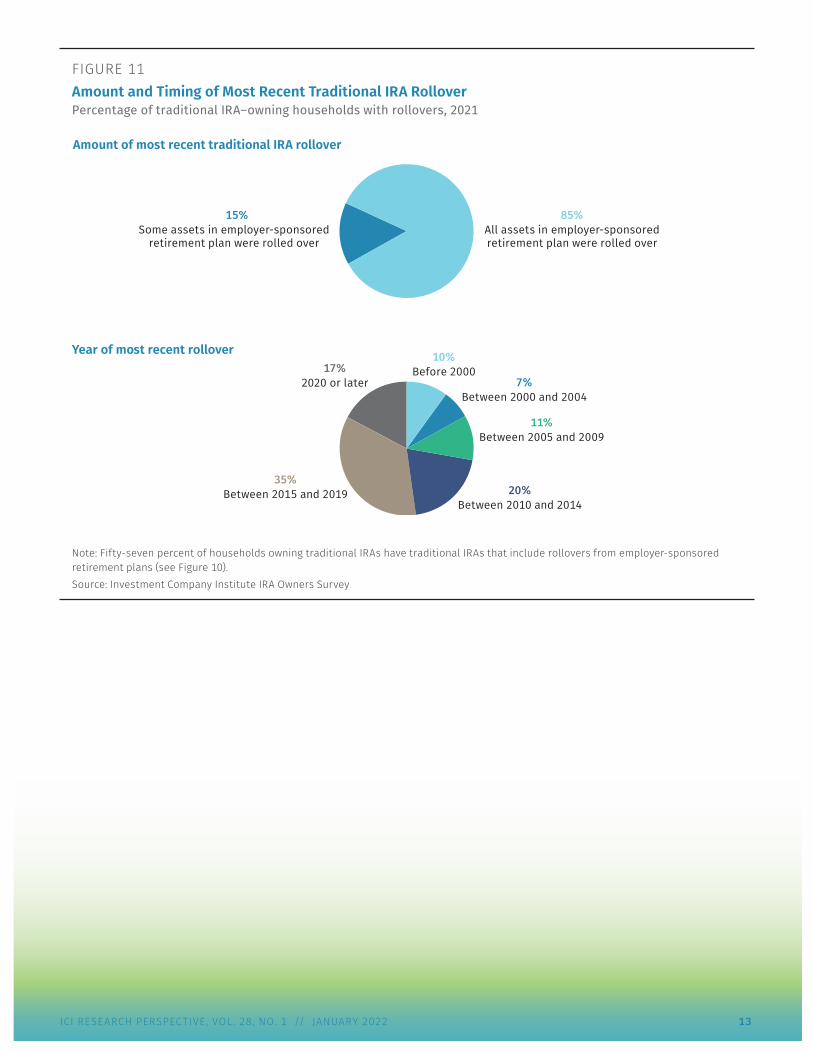
show that households transferred $517 billion from employer-sponsored (DC or DB or both) retirement plans to traditional IRAs in 2018.21 In mid-2021, about 21 million US households (or 57 percent of all US households owning traditional IRAs) had traditional IRAs that included rollover assets (Figure 10).22 With their most recent rollovers, the vast majority of these households (85 percent) transferred the entire retirement plan account balance into the traditional
IRA (Figure 11, top panel).23 Nine in 10 traditional IRA–owning households with rollovers made their most recent rollover in 2000 or later, including 72 percent whose most recent rollover was within the past 11 years (Figure 11, lower panel). Among households with rollovers in their traditional IRAs, 56 percent had only rollover IRAs (having never made traditional IRA contributions) (Figure 10).
FIGURE 10Rollovers Are Often a Source of Assets for Traditional IRAs
Households with traditional IRAs that include rolloversPercentage of households owning traditional IRAs, 2021
Traditional IRA includes rollover 57%
Traditional IRA does not include rollover 43
Traditional IRA rollover activityPercentage of households owning traditional IRAs that include rollovers, 2021
Reason for traditional IRA rollover(s):*
Job change, layoff, or termination 73
Retirement 38
Other 8
Contributions to traditional IRA other than rollover:
Have made contribution other than rollover 44
Have never made contribution in addition to rollover 56
Percentage of traditional IRA balance from rollovers or transfers from former employer-sponsored retirement plans:
Less than 25 percent 14
25 to 49 percent 11
50 to 74 percent 17
75 percent or more 58
Median percentage of traditional IRA balance from rollovers or transfers from former employer-sponsored retirement plans (among households with rollovers)
80
* Multiple responses are included.Source: Investment Company Institute IRA Owners Survey
ICI RESEARCH PERSPECTIVE, VOL. 28, NO. 1 // JANUARY 2022 13
FIGURE 11Amount and Timing of Most Recent Traditional IRA RolloverPercentage of traditional IRA–owning households with rollovers, 2021
15%Some assets in employer-sponsored
retirement plan were rolled over
85%All assets in employer-sponsoredretirement plan were rolled over
17%2020 or later
35%Between 2015 and 2019 20%
Between 2010 and 2014
11%Between 2005 and 2009
7%Between 2000 and 2004
10%Before 2000
Amount of most recent traditional IRA rollover
Year of most recent rollover
Note: Fifty-seven percent of households owning traditional IRAs have traditional IRAs that include rollovers from employer-sponsored retirement plans (see Figure 10).Source: Investment Company Institute IRA Owners Survey
14 ICI RESEARCH PERSPECTIVE, VOL. 28, NO. 1 // JANUARY 2022
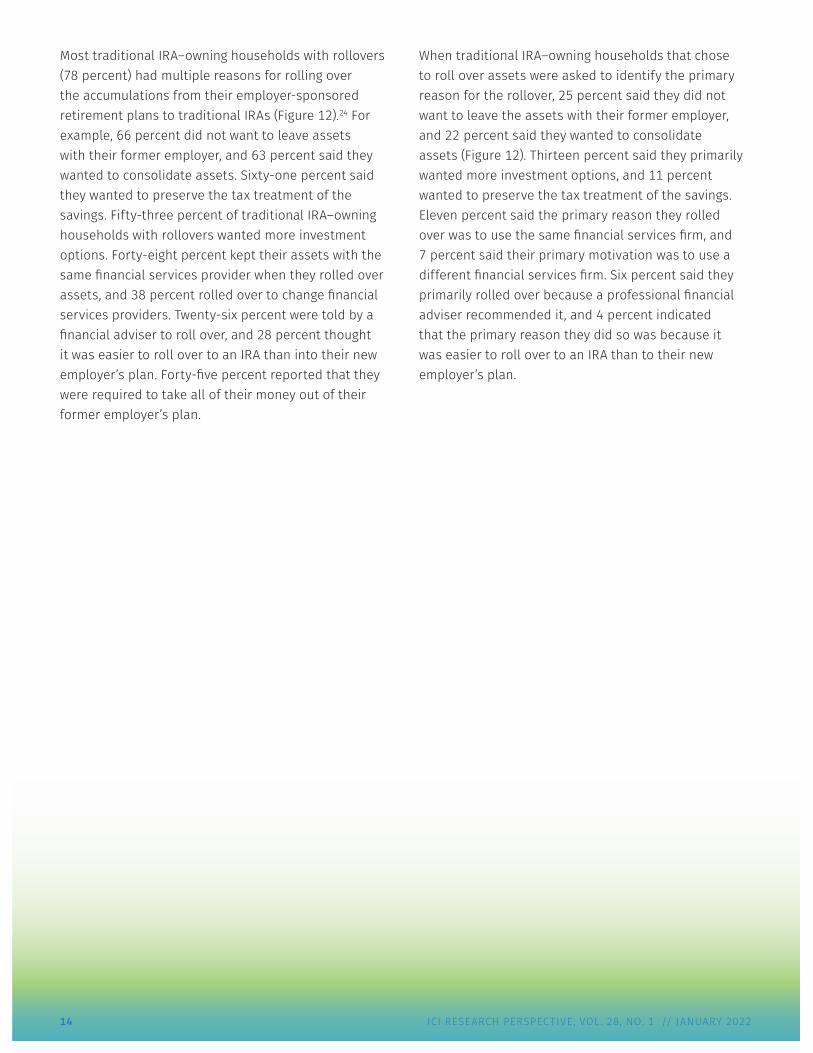
Most traditional IRA–owning households with rollovers (78 percent) had multiple reasons for rolling over the accumulations from their employer-sponsored retirement plans to traditional IRAs (Figure 12).24 For example, 66 percent did not want to leave assets with their former employer, and 63 percent said they wanted to consolidate assets. Sixty-one percent said they wanted to preserve the tax treatment of the savings. Fifty-three percent of traditional IRA–owning households with rollovers wanted more investment options. Forty-eight percent kept their assets with the same financial services provider when they rolled over assets, and 38 percent rolled over to change financial services providers. Twenty-six percent were told by a financial adviser to roll over, and 28 percent thought it was easier to roll over to an IRA than into their new employer’s plan. Forty-five percent reported that they were required to take all of their money out of their former employer’s plan.
When traditional IRA–owning households that chose to roll over assets were asked to identify the primary reason for the rollover, 25 percent said they did not want to leave the assets with their former employer, and 22 percent said they wanted to consolidate assets (Figure 12). Thirteen percent said they primarily wanted more investment options, and 11 percent wanted to preserve the tax treatment of the savings. Eleven percent said the primary reason they rolled over was to use the same financial services firm, and 7 percent said their primary motivation was to use a different financial services firm. Six percent said they primarily rolled over because a professional financial adviser recommended it, and 4 percent indicated that the primary reason they did so was because it was easier to roll over to an IRA than to their new employer’s plan.
ICI RESEARCH PERSPECTIVE, VOL. 28, NO. 1 // JANUARY 2022 15
FIGURE 12Reasons for Most Recent RolloverPercentage of households owning traditional IRAs that include rollovers, 2021
Reason for most recent rollover1
Primary reason for most recent rollover2
Did not want to leave assetswith the former employer
Wanted to consolidate assets
Wanted to preservetax treatment of the savings
Wanted more investment options
Wanted to keep assets with thesame financial services provider
Were required to take all moneyout of the former employer's plan
Wanted to use a differentfinancial services provider
Were told by a financial adviserto roll over assets
Thought it was easier to roll overassets to an IRA than intoyour new employer’s plan
Wanted the same investments thatwere in the former employer’s plan
45
38
28
26
7
48
53
66
63
61
1
6
4
7
11
13
25
22
11
1 Multiple responses are included for all responses except for respondents who were required to take the money out of their former employer’s plan. Seventy-eight percent of traditional IRA–owning households with rollovers had multiple reasons for rolling over.
2 Figure does not include households with traditional IRAs that made their most recent or only rollover because they were required to take the money out of their former employer’s plan.Source: Investment Company Institute IRA Owners Survey

16 ICI RESEARCH PERSPECTIVE, VOL. 28, NO. 1 // JANUARY 2022
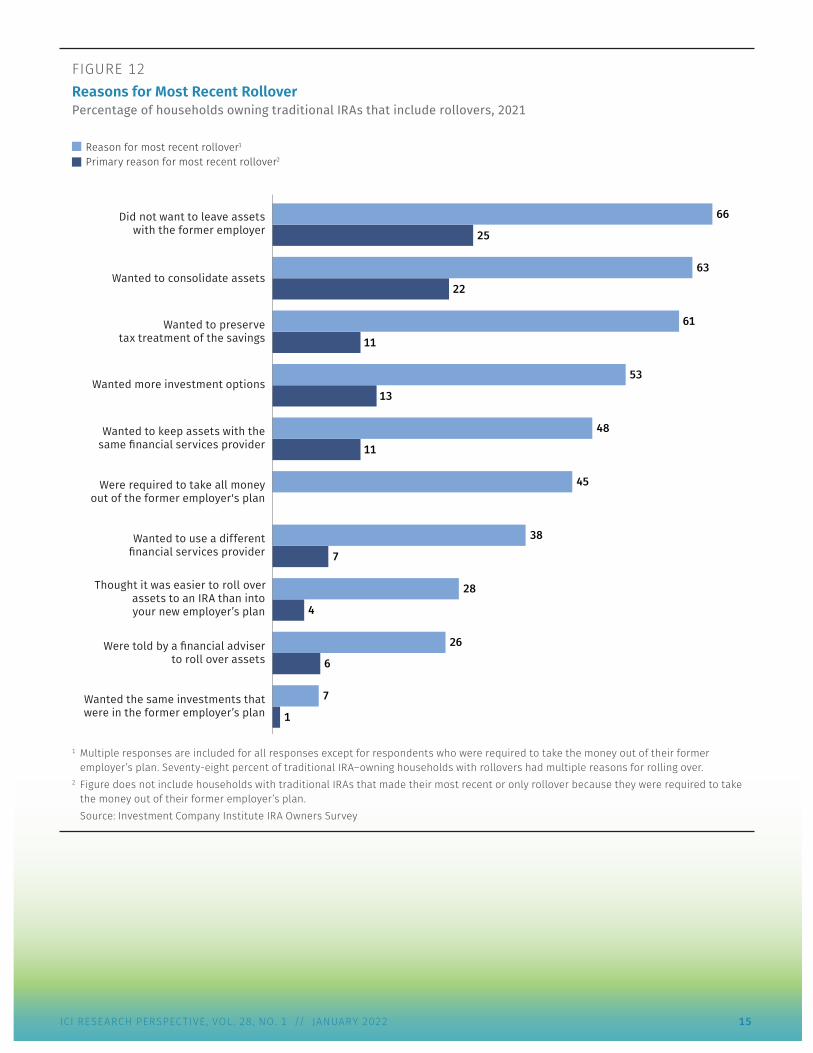
Traditional IRA–owning households generally researched the decision to roll over money from their former employer’s retirement plan into a traditional IRA. Sixty-five percent consulted multiple sources of information—the most common source of information was professional financial advisers, who were consulted by 65 percent of traditional IRA–owning households with rollovers (Figure 13, first panel). Thirty-nine percent of traditional IRA–owning households with rollovers relied on information provided by their employers, with 30 percent using printed materials from their employers as a source of information and 23 percent consulting online materials from their employers. Forty-nine percent of traditional IRA–owning households with rollovers relied on information provided by financial services firms, with 26 percent using printed materials provided by financial services firms. Twenty-eight percent indicated that they used online materials from financial services firms.
When asked to identify their primary source of information on the rollover decision, 52 percent of traditional IRA–owning households with rollovers primarily relied on professional financial advisers; older households were more likely to consult professional financial advisers than younger households (Figure 13, second panel). Twenty percent of traditional IRA–owning households with rollovers identified their primary source of information on the rollover decision as financial services firms. Nine percent of traditional IRA–owning households with rollovers said their primary source of information was online materials from these firms, with younger households more likely to rely primarily on online resources than older households.
ICI RESEARCH PERSPECTIVE, VOL. 28, NO. 1 // JANUARY 2022 17
FIGURE 13Sources of Information Consulted for Rollover DecisionPercentage of traditional IRA–owning households with rollovers by age,1 2021
Sources of information2 All
Age of head of household
Younger than 50 50 to 59 60 to 69
70 or older
Spouse or partner 35 29 41 39 30
Coworker, friend, or family member 16 23 13 14 14
Employer (printed or online materials, seminars, workshops) 39 37 38 40 39
Seminar or workshop sponsored by your employer 10 7 8 11 15
Printed materials provided by your employer 30 26 29 33 33
Online materials from your employer 23 28 22 20 19
Financial services firms (printed or online materials, seminars, workshops, phone representative)
49 47 46 47 49
Seminar or workshop sponsored by financial services firms 10 7 10 9 17
Printed materials provided by financial services firms 26 21 19 30 34
Online materials from financial services firms 28 35 27 25 27
Phone representative from a financial services firm 18 23 18 16 15
IRS rules or publications 28 24 26 27 37
Professional financial adviser 65 52 60 73 73
Other 5 5 6 5 3
Primary source of informationSpouse or partner 5 6 6 4 4
Coworker, friend, or family member 4 7 2 3 4
Employer (printed or online materials, seminars, workshops) 11 14 12 8 12
Seminar or workshop sponsored by your employer 2 2 1 1 5
Printed materials provided by your employer 6 5 8 6 6
Online materials from your employer 3 7 3 1 1
Financial services firms (printed or online materials, seminars, workshops, phone representative)
20 27 21 16 13
Seminar or workshop sponsored by financial services firms 1 0 1 1 1
Printed materials provided by financial services firms 3 2 2 3 4
Online materials from financial services firms 9 16 9 7 4
Phone representative from a financial services firm 7 9 9 5 4
IRS rules or publications 5 5 5 3 7
Professional financial adviser 52 38 49 63 58
Other 3 3 5 3 2
Number of respondents 1,488 415 340 399 334
1 Age is based on the age of the sole or co-decisionmaker for household saving and investing.2 Multiple responses are included; 65 percent of traditional IRA–owning households with rollovers consulted multiple sources of
information.Note: Other responses given included myself, other online information, bank, and books and magazines.
Source: Investment Company Institute IRA Owners Survey
18 ICI RESEARCH PERSPECTIVE, VOL. 28, NO. 1 // JANUARY 2022
When asked about the selection of the initial asset allocation of rollover assets in traditional IRAs, 22 percent of traditional IRA–owning households with rollovers indicated that their professional financial adviser selected the investments, and 42 percent indicated that they worked together with a professional financial adviser to select the investments. Thirty-six percent of traditional IRA–owning households with rollovers reported that the household selected the investments without outside help.
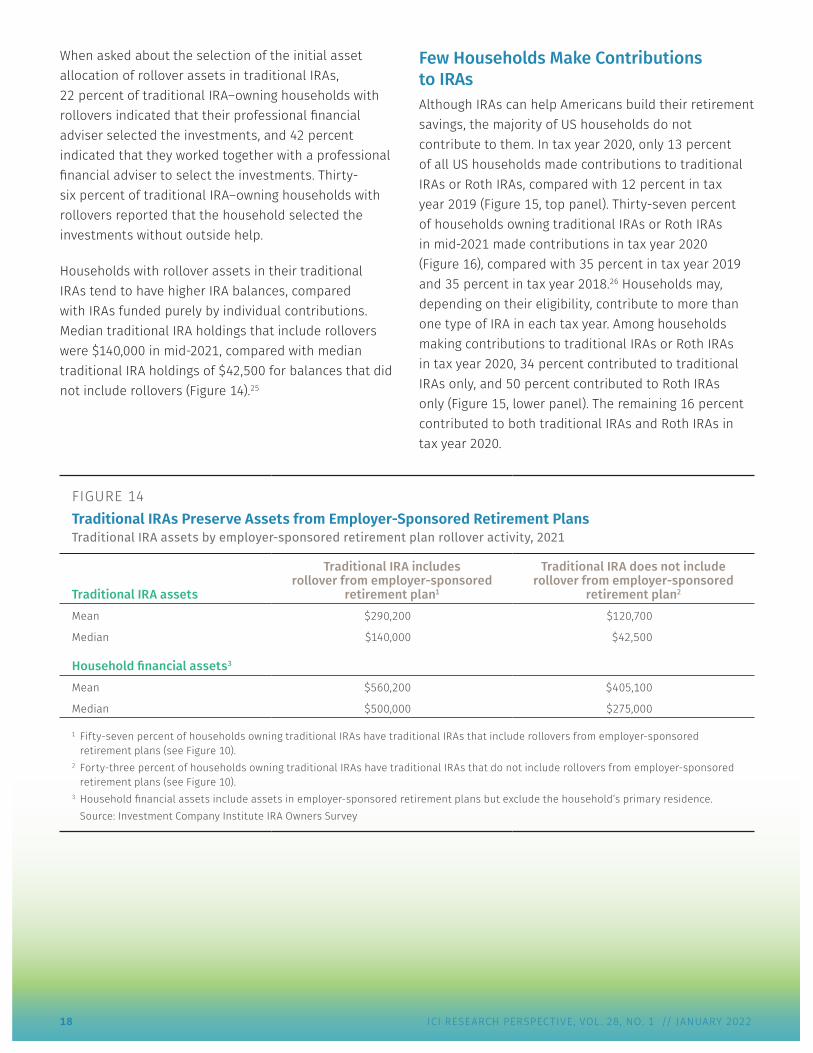
Households with rollover assets in their traditional IRAs tend to have higher IRA balances, compared with IRAs funded purely by individual contributions. Median traditional IRA holdings that include rollovers were $140,000 in mid-2021, compared with median traditional IRA holdings of $42,500 for balances that did not include rollovers (Figure 14).25
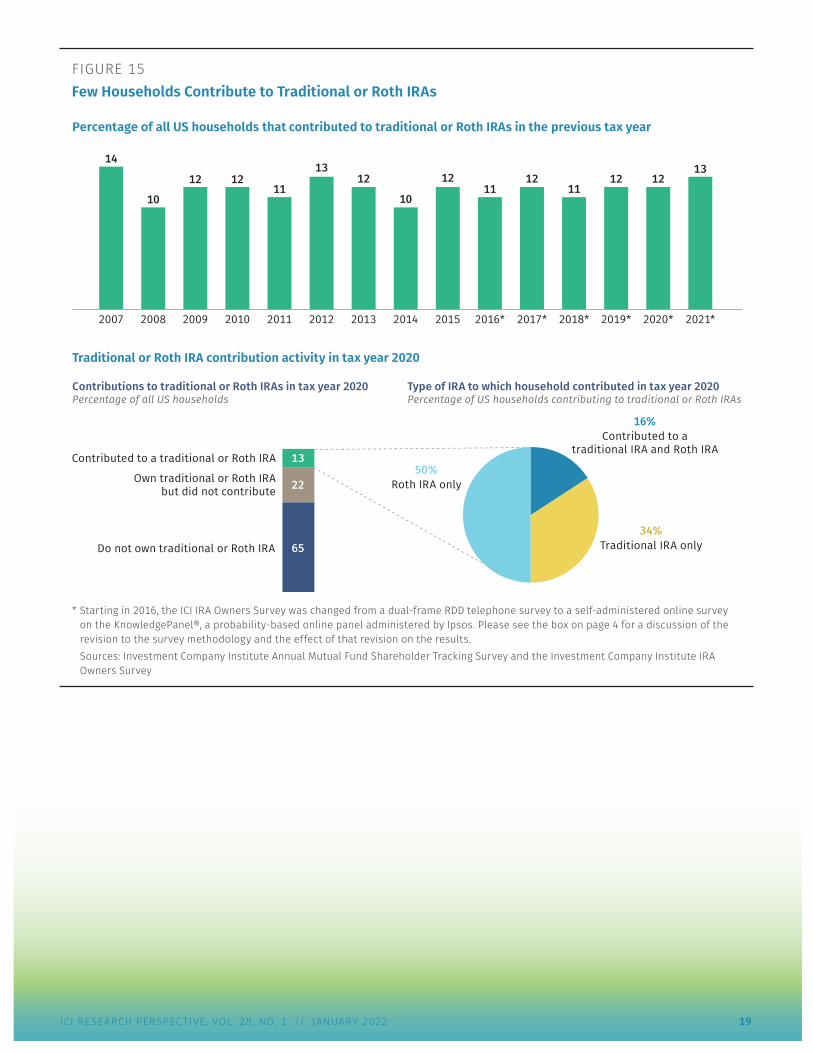
Few Households Make Contributions to IRAs Although IRAs can help Americans build their retirement savings, the majority of US households do not contribute to them. In tax year 2020, only 13 percent of all US households made contributions to traditional IRAs or Roth IRAs, compared with 12 percent in tax year 2019 (Figure 15, top panel). Thirty-seven percent of households owning traditional IRAs or Roth IRAs in mid-2021 made contributions in tax year 2020 (Figure 16), compared with 35 percent in tax year 2019 and 35 percent in tax year 2018.26 Households may, depending on their eligibility, contribute to more than one type of IRA in each tax year. Among households making contributions to traditional IRAs or Roth IRAs in tax year 2020, 34 percent contributed to traditional IRAs only, and 50 percent contributed to Roth IRAs only (Figure 15, lower panel). The remaining 16 percent contributed to both traditional IRAs and Roth IRAs in tax year 2020.
FIGURE 14Traditional IRAs Preserve Assets from Employer-Sponsored Retirement Plans Traditional IRA assets by employer-sponsored retirement plan rollover activity, 2021
Traditional IRA assets
Traditional IRA includes rollover from employer-sponsored
retirement plan1
Traditional IRA does not include rollover from employer-sponsored
retirement plan2
Mean $290,200 $120,700
Median $140,000 $42,500
Household financial assets3
Mean $560,200 $405,100
Median $500,000 $275,000
1 Fifty-seven percent of households owning traditional IRAs have traditional IRAs that include rollovers from employer-sponsored retirement plans (see Figure 10).
2 Forty-three percent of households owning traditional IRAs have traditional IRAs that do not include rollovers from employer-sponsored retirement plans (see Figure 10).
3 Household financial assets include assets in employer-sponsored retirement plans but exclude the household’s primary residence.Source: Investment Company Institute IRA Owners Survey
ICI RESEARCH PERSPECTIVE, VOL. 28, NO. 1 // JANUARY 2022 19
FIGURE 15Few Households Contribute to Traditional or Roth IRAs
Roth IRA Only
Traditional IRA Only
Contributed to a traditional IRA and Roth IRA
Do Not Own traditional or Roth IRA
Own traditional or Roth IRA But Did Not Contribute
Contributed to a traditional or Roth IRA
Do not own traditional or Roth IRA
Own traditional or Roth IRAbut did not contribute
Contributed to a traditional or Roth IRA
2020* 2021*2019*2018*2017*2016*201520142013201220112010200920082007
16%Contributed to a
traditional IRA and Roth IRA
34%Traditional IRA only
50%Roth IRA only
Percentage of all US households that contributed to traditional or Roth IRAs in the previous tax year
Traditional or Roth IRA contribution activity in tax year 2020
13
22
65
14
10
12 1211
1312
10
1211
1211
12 1213
Contributions to traditional or Roth IRAs in tax year 2020Percentage of all US households
Type of IRA to which household contributed in tax year 2020Percentage of US households contributing to traditional or Roth IRAs
* Starting in 2016, the ICI IRA Owners Survey was changed from a dual-frame RDD telephone survey to a self-administered online survey on the KnowledgePanel®, a probability-based online panel administered by Ipsos. Please see the box on page 4 for a discussion of the revision to the survey methodology and the effect of that revision on the results. Sources: Investment Company Institute Annual Mutual Fund Shareholder Tracking Survey and the Investment Company Institute IRA Owners Survey
20 ICI RESEARCH PERSPECTIVE, VOL. 28, NO. 1 // JANUARY 2022
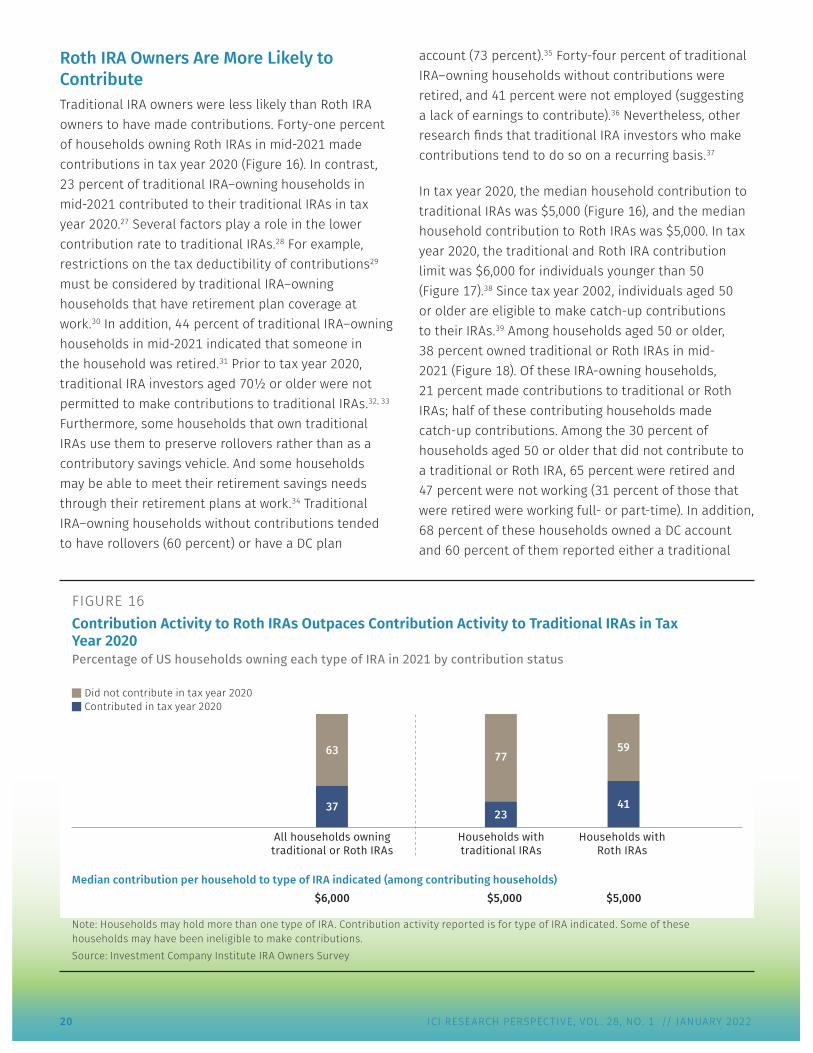
Roth IRA Owners Are More Likely to Contribute Traditional IRA owners were less likely than Roth IRA owners to have made contributions. Forty-one percent of households owning Roth IRAs in mid-2021 made contributions in tax year 2020 (Figure 16). In contrast, 23 percent of traditional IRA–owning households in mid-2021 contributed to their traditional IRAs in tax year 2020.27 Several factors play a role in the lower contribution rate to traditional IRAs.28 For example, restrictions on the tax deductibility of contributions29 must be considered by traditional IRA–owning households that have retirement plan coverage at work.30 In addition, 44 percent of traditional IRA–owning households in mid-2021 indicated that someone in the household was retired.31 Prior to tax year 2020, traditional IRA investors aged 70½ or older were not permitted to make contributions to traditional IRAs.32, 33 Furthermore, some households that own traditional IRAs use them to preserve rollovers rather than as a contributory savings vehicle. And some households may be able to meet their retirement savings needs through their retirement plans at work.34 Traditional IRA–owning households without contributions tended to have rollovers (60 percent) or have a DC plan
account (73 percent).35 Forty-four percent of traditional IRA–owning households without contributions were retired, and 41 percent were not employed (suggesting a lack of earnings to contribute).36 Nevertheless, other research finds that traditional IRA investors who make contributions tend to do so on a recurring basis.37
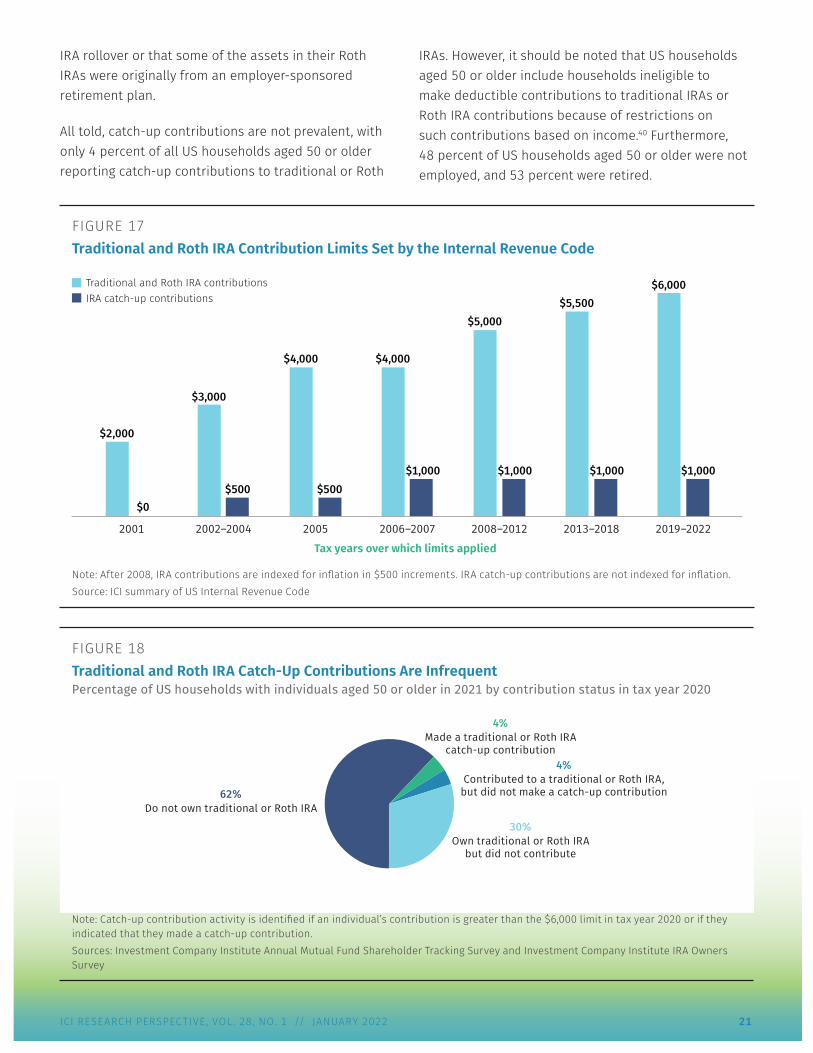
In tax year 2020, the median household contribution to traditional IRAs was $5,000 (Figure 16), and the median household contribution to Roth IRAs was $5,000. In tax year 2020, the traditional and Roth IRA contribution limit was $6,000 for individuals younger than 50 (Figure 17).38 Since tax year 2002, individuals aged 50 or older are eligible to make catch-up contributions to their IRAs.39 Among households aged 50 or older, 38 percent owned traditional or Roth IRAs in mid-2021 (Figure 18). Of these IRA-owning households, 21 percent made contributions to traditional or Roth IRAs; half of these contributing households made catch-up contributions. Among the 30 percent of households aged 50 or older that did not contribute to a traditional or Roth IRA, 65 percent were retired and 47 percent were not working (31 percent of those that were retired were working full- or part-time). In addition, 68 percent of these households owned a DC account and 60 percent of them reported either a traditional
FIGURE 16Contribution Activity to Roth IRAs Outpaces Contribution Activity to Traditional IRAs in Tax Year 2020Percentage of US households owning each type of IRA in 2021 by contribution status
Did not contribute in tax year 2020Contributed in tax year 2020
Households withRoth IRAs
Households withtraditional IRAs
All households owningtraditional or Roth IRAs
Median contribution per household to type of IRA indicated (among contributing households)
37
$6,000 $5,000 $5,000
63 77
23
59
41
Note: Households may hold more than one type of IRA. Contribution activity reported is for type of IRA indicated. Some of these households may have been ineligible to make contributions.Source: Investment Company Institute IRA Owners Survey
ICI RESEARCH PERSPECTIVE, VOL. 28, NO. 1 // JANUARY 2022 21
FIGURE 17Traditional and Roth IRA Contribution Limits Set by the Internal Revenue Code
2019–20222013–20182008–20122006–200720052002–20042001
Traditional and Roth IRA contributionsIRA catch-up contributions
$2,000
$0
$3,000
$500 $500$1,000 $1,000 $1,000 $1,000
$6,000$5,500
$5,000
$4,000$4,000
Tax years over which limits applied
Note: After 2008, IRA contributions are indexed for inflation in $500 increments. IRA catch-up contributions are not indexed for inflation.Source: ICI summary of US Internal Revenue Code
FIGURE 18Traditional and Roth IRA Catch-Up Contributions Are InfrequentPercentage of US households with individuals aged 50 or older in 2021 by contribution status in tax year 2020
4%Made a traditional or Roth IRA
catch-up contribution
30%Own traditional or Roth IRA
but did not contribute
4%Contributed to a traditional or Roth IRA,
but did not make a catch-up contribution62%Do not own traditional or Roth IRA
Note: Catch-up contribution activity is identified if an individual’s contribution is greater than the $6,000 limit in tax year 2020 or if they indicated that they made a catch-up contribution.Sources: Investment Company Institute Annual Mutual Fund Shareholder Tracking Survey and Investment Company Institute IRA Owners Survey
IRA rollover or that some of the assets in their Roth IRAs were originally from an employer-sponsored retirement plan.
All told, catch-up contributions are not prevalent, with only 4 percent of all US households aged 50 or older reporting catch-up contributions to traditional or Roth
IRAs. However, it should be noted that US households aged 50 or older include households ineligible to make deductible contributions to traditional IRAs or Roth IRA contributions because of restrictions on such contributions based on income.40 Furthermore, 48 percent of US households aged 50 or older were not employed, and 53 percent were retired.
22 ICI RESEARCH PERSPECTIVE, VOL. 28, NO. 1 // JANUARY 2022
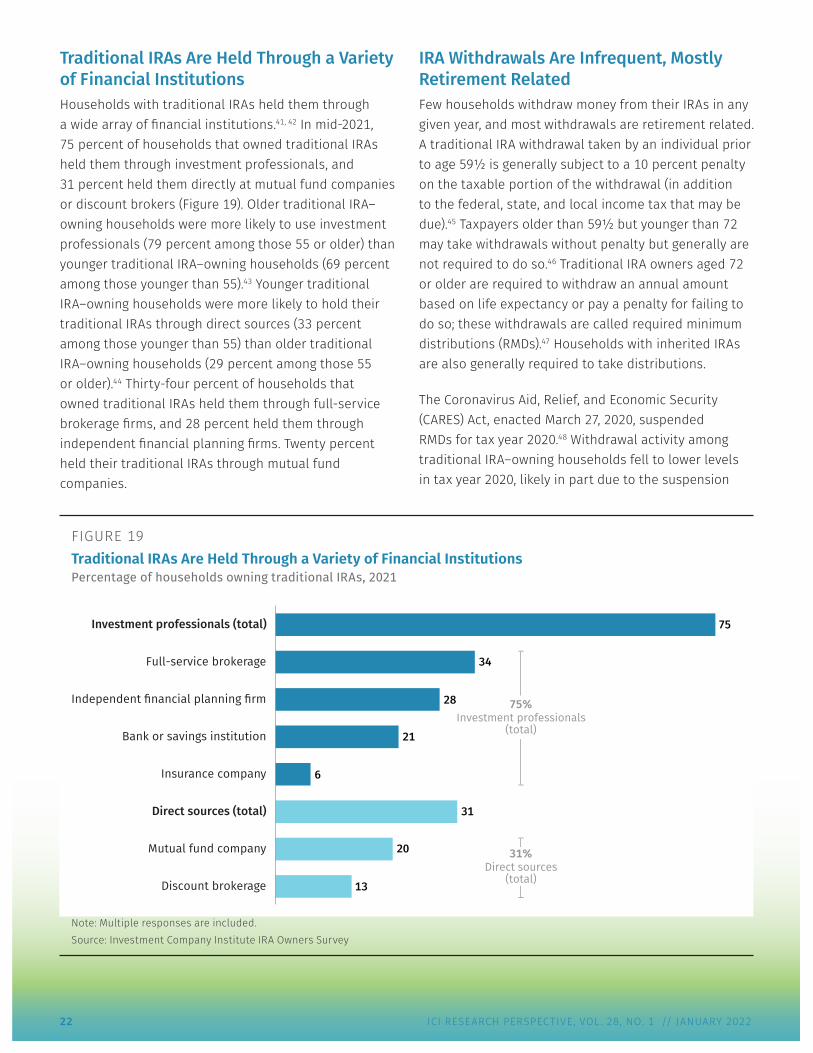
Traditional IRAs Are Held Through a Variety of Financial Institutions Households with traditional IRAs held them through a wide array of financial institutions.41, 42 In mid-2021, 75 percent of households that owned traditional IRAs held them through investment professionals, and 31 percent held them directly at mutual fund companies or discount brokers (Figure 19). Older traditional IRA–owning households were more likely to use investment professionals (79 percent among those 55 or older) than younger traditional IRA–owning households (69 percent among those younger than 55).43 Younger traditional IRA–owning households were more likely to hold their traditional IRAs through direct sources (33 percent among those younger than 55) than older traditional IRA–owning households (29 percent among those 55 or older).44 Thirty-four percent of households that owned traditional IRAs held them through full-service brokerage firms, and 28 percent held them through independent financial planning firms. Twenty percent held their traditional IRAs through mutual fund companies.
IRA Withdrawals Are Infrequent, Mostly Retirement Related Few households withdraw money from their IRAs in any given year, and most withdrawals are retirement related. A traditional IRA withdrawal taken by an individual prior to age 59½ is generally subject to a 10 percent penalty on the taxable portion of the withdrawal (in addition to the federal, state, and local income tax that may be due).45 Taxpayers older than 59½ but younger than 72 may take withdrawals without penalty but generally are not required to do so.46 Traditional IRA owners aged 72 or older are required to withdraw an annual amount based on life expectancy or pay a penalty for failing to do so; these withdrawals are called required minimum distributions (RMDs).47 Households with inherited IRAs are also generally required to take distributions.
The Coronavirus Aid, Relief, and Economic Security (CARES) Act, enacted March 27, 2020, suspended RMDs for tax year 2020.48 Withdrawal activity among traditional IRA–owning households fell to lower levels in tax year 2020, likely in part due to the suspension
FIGURE 19Traditional IRAs Are Held Through a Variety of Financial InstitutionsPercentage of households owning traditional IRAs, 2021
Investment professionals (total)
Full-service brokerage
Independent financial planning firm
Bank or savings institution
Insurance company
Direct sources (total)
Mutual fund company
Discount brokerage 13
20
6
28
31
34
75
21
75%Investment professionals
(total)
31%Direct sources
(total)
Note: Multiple responses are included.Source: Investment Company Institute IRA Owners Survey
ICI RESEARCH PERSPECTIVE, VOL. 28, NO. 1 // JANUARY 2022 23
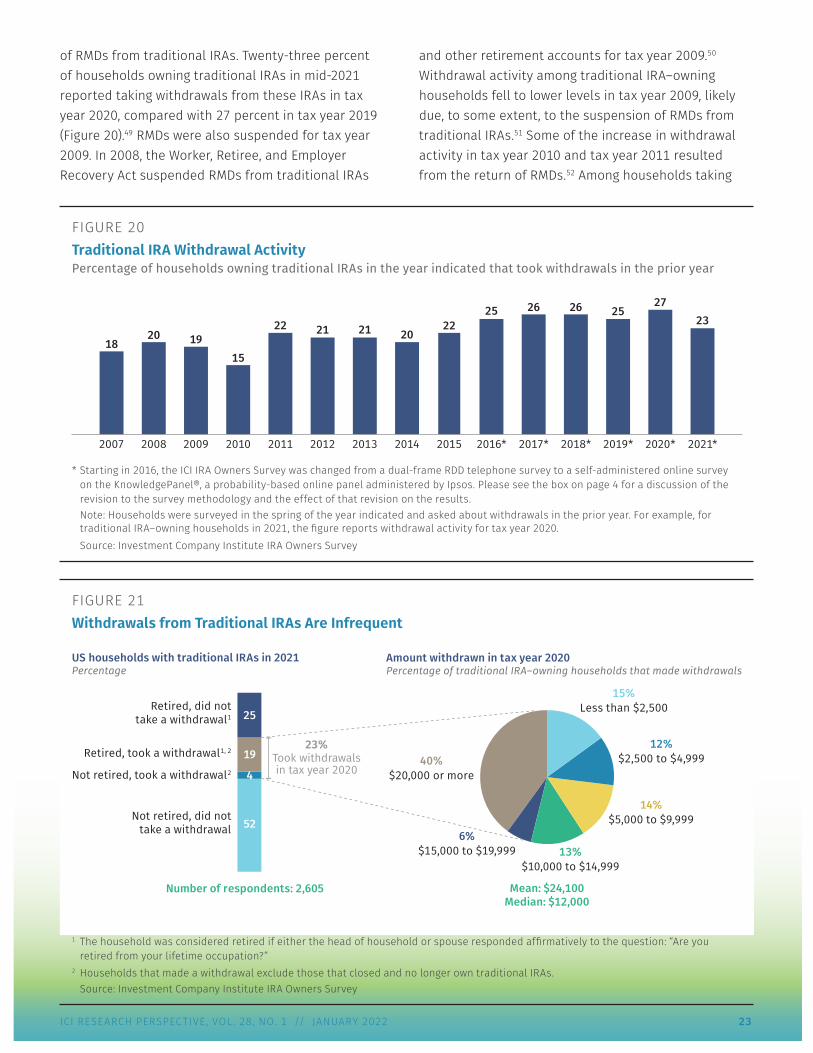
of RMDs from traditional IRAs. Twenty-three percent of households owning traditional IRAs in mid-2021 reported taking withdrawals from these IRAs in tax year 2020, compared with 27 percent in tax year 2019 (Figure 20).49 RMDs were also suspended for tax year 2009. In 2008, the Worker, Retiree, and Employer Recovery Act suspended RMDs from traditional IRAs
and other retirement accounts for tax year 2009.50 Withdrawal activity among traditional IRA–owning households fell to lower levels in tax year 2009, likely due, to some extent, to the suspension of RMDs from traditional IRAs.51 Some of the increase in withdrawal activity in tax year 2010 and tax year 2011 resulted from the return of RMDs.52 Among households taking
FIGURE 20Traditional IRA Withdrawal ActivityPercentage of households owning traditional IRAs in the year indicated that took withdrawals in the prior year
2020* 2021*2019*2018*2017*2016*201520142013201220112010200920082007
1820 19
15
22 21 21 2022
25 26 26 2527
23
* Starting in 2016, the ICI IRA Owners Survey was changed from a dual-frame RDD telephone survey to a self-administered online survey on the KnowledgePanel®, a probability-based online panel administered by Ipsos. Please see the box on page 4 for a discussion of the revision to the survey methodology and the effect of that revision on the results. Note: Households were surveyed in the spring of the year indicated and asked about withdrawals in the prior year. For example, for traditional IRA–owning households in 2021, the figure reports withdrawal activity for tax year 2020. Source: Investment Company Institute IRA Owners Survey
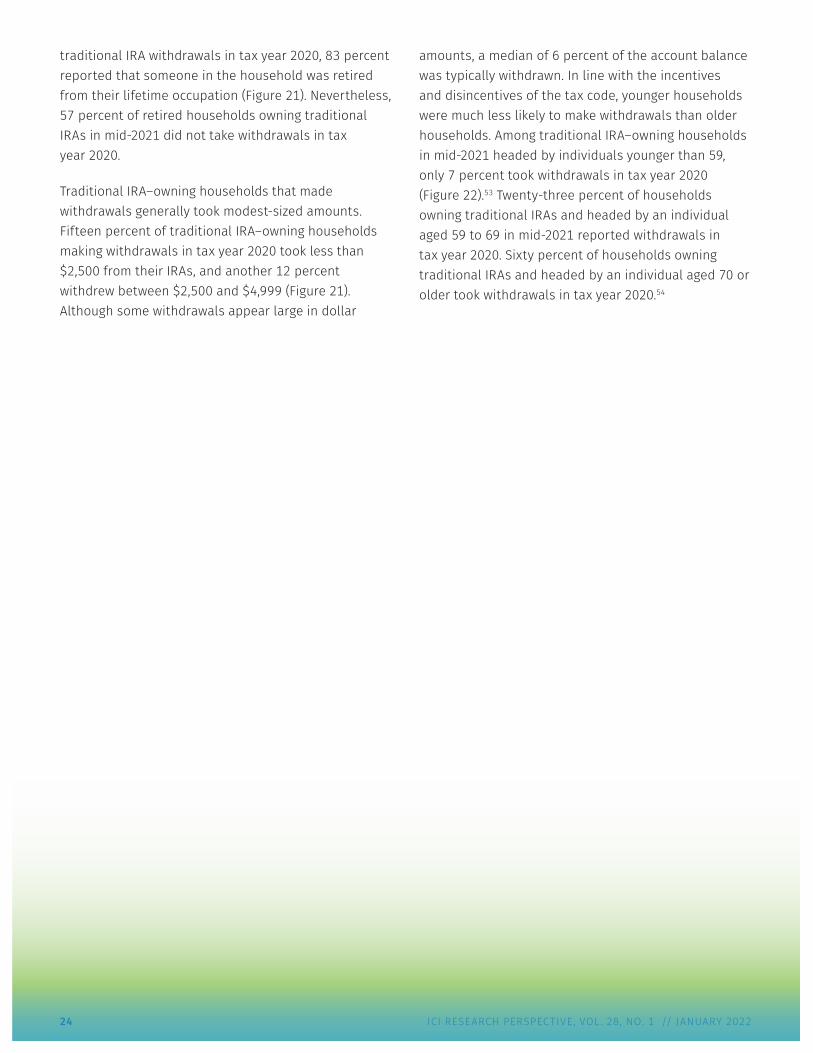
FIGURE 21Withdrawals from Traditional IRAs Are Infrequent
Retired, did nottake a withdrawal1
Retired, took a withdrawal1, 2
Not retired, took a withdrawal2
Not retired, did nottake a withdrawal
15%Less than $2,500
12%$2,500 to $4,999
14%$5,000 to $9,999
13%$10,000 to $14,999
6%$15,000 to $19,999
40%$20,000 or more
Amount withdrawn in tax year 2020Percentage of traditional IRA–owning households that made withdrawals
23%Took withdrawalsin tax year 2020
Number of respondents: 2,605 Mean: $24,100Median: $12,000
25
19
4
52
US households with traditional IRAs in 2021Percentage
1 The household was considered retired if either the head of household or spouse responded affirmatively to the question: “Are you retired from your lifetime occupation?”
2 Households that made a withdrawal exclude those that closed and no longer own traditional IRAs.Source: Investment Company Institute IRA Owners Survey
24 ICI RESEARCH PERSPECTIVE, VOL. 28, NO. 1 // JANUARY 2022
traditional IRA withdrawals in tax year 2020, 83 percent reported that someone in the household was retired from their lifetime occupation (Figure 21). Nevertheless, 57 percent of retired households owning traditional IRAs in mid-2021 did not take withdrawals in tax year 2020.
Traditional IRA–owning households that made withdrawals generally took modest-sized amounts. Fifteen percent of traditional IRA–owning households making withdrawals in tax year 2020 took less than $2,500 from their IRAs, and another 12 percent withdrew between $2,500 and $4,999 (Figure 21). Although some withdrawals appear large in dollar
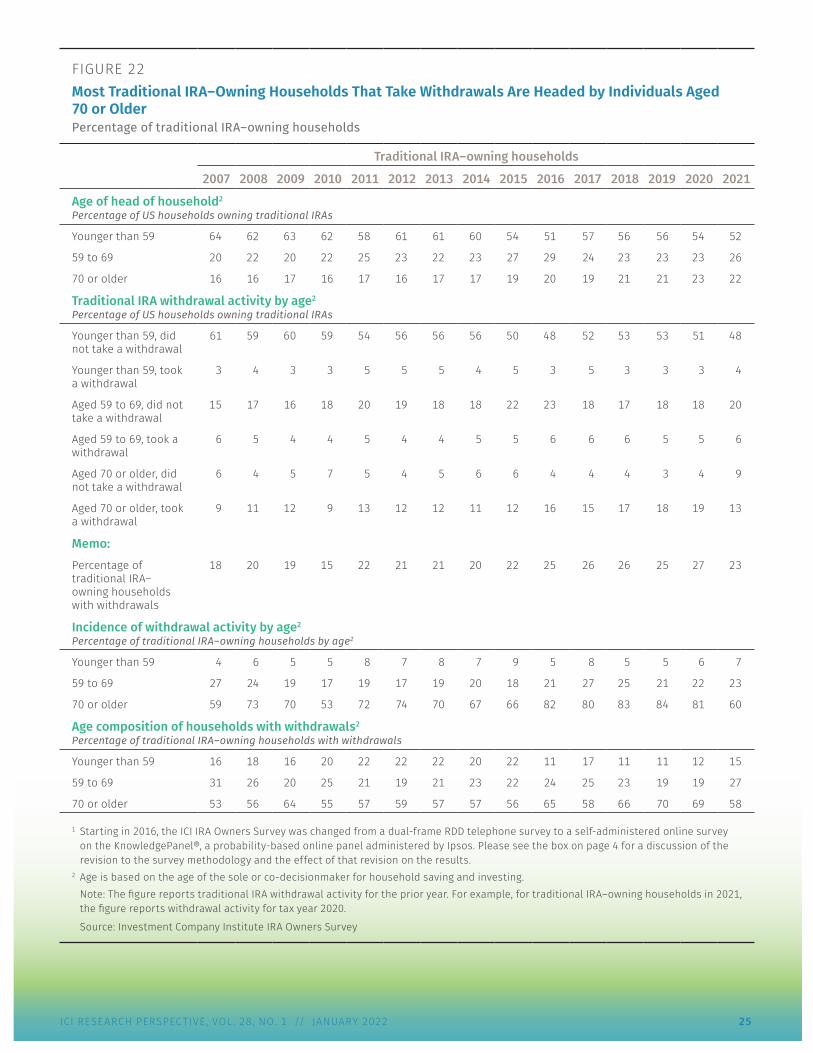
amounts, a median of 6 percent of the account balance was typically withdrawn. In line with the incentives and disincentives of the tax code, younger households were much less likely to make withdrawals than older households. Among traditional IRA–owning households in mid-2021 headed by individuals younger than 59, only 7 percent took withdrawals in tax year 2020 (Figure 22).53 Twenty-three percent of households owning traditional IRAs and headed by an individual aged 59 to 69 in mid-2021 reported withdrawals in tax year 2020. Sixty percent of households owning traditional IRAs and headed by an individual aged 70 or older took withdrawals in tax year 2020.54
ICI RESEARCH PERSPECTIVE, VOL. 28, NO. 1 // JANUARY 2022 25
FIGURE 22Most Traditional IRA–Owning Households That Take Withdrawals Are Headed by Individuals Aged 70 or OlderPercentage of traditional IRA–owning households
Traditional IRA–owning households
2007 2008 2009 2010 2011 2012 2013 2014 2015 2016 2017 2018 2019 2020 2021
Age of head of household2
Percentage of US households owning traditional IRAs
Younger than 59 64 62 63 62 58 61 61 60 54 51 57 56 56 54 52
59 to 69 20 22 20 22 25 23 22 23 27 29 24 23 23 23 26
70 or older 16 16 17 16 17 16 17 17 19 20 19 21 21 23 22
Traditional IRA withdrawal activity by age2
Percentage of US households owning traditional IRAs
Younger than 59, did not take a withdrawal
61 59 60 59 54 56 56 56 50 48 52 53 53 51 48
Younger than 59, took a withdrawal
3 4 3 3 5 5 5 4 5 3 5 3 3 3 4
Aged 59 to 69, did not take a withdrawal
15 17 16 18 20 19 18 18 22 23 18 17 18 18 20
Aged 59 to 69, took a withdrawal
6 5 4 4 5 4 4 5 5 6 6 6 5 5 6
Aged 70 or older, did not take a withdrawal
6 4 5 7 5 4 5 6 6 4 4 4 3 4 9
Aged 70 or older, took a withdrawal
9 11 12 9 13 12 12 11 12 16 15 17 18 19 13
Memo:Percentage of traditional IRA–owning households with withdrawals
18 20 19 15 22 21 21 20 22 25 26 26 25 27 23
Incidence of withdrawal activity by age2
Percentage of traditional IRA–owning households by age2
Younger than 59 4 6 5 5 8 7 8 7 9 5 8 5 5 6 7
59 to 69 27 24 19 17 19 17 19 20 18 21 27 25 21 22 23
70 or older 59 73 70 53 72 74 70 67 66 82 80 83 84 81 60
Age composition of households with withdrawals2
Percentage of traditional IRA–owning households with withdrawals
Younger than 59 16 18 16 20 22 22 22 20 22 11 17 11 11 12 15
59 to 69 31 26 20 25 21 19 21 23 22 24 25 23 19 19 27
70 or older 53 56 64 55 57 59 57 57 56 65 58 66 70 69 58
1 Starting in 2016, the ICI IRA Owners Survey was changed from a dual-frame RDD telephone survey to a self-administered online survey on the KnowledgePanel®, a probability-based online panel administered by Ipsos. Please see the box on page 4 for a discussion of the revision to the survey methodology and the effect of that revision on the results.
2 Age is based on the age of the sole or co-decisionmaker for household saving and investing.Note: The figure reports traditional IRA withdrawal activity for the prior year. For example, for traditional IRA–owning households in 2021, the figure reports withdrawal activity for tax year 2020.
Source: Investment Company Institute IRA Owners Survey
26 ICI RESEARCH PERSPECTIVE, VOL. 28, NO. 1 // JANUARY 2022
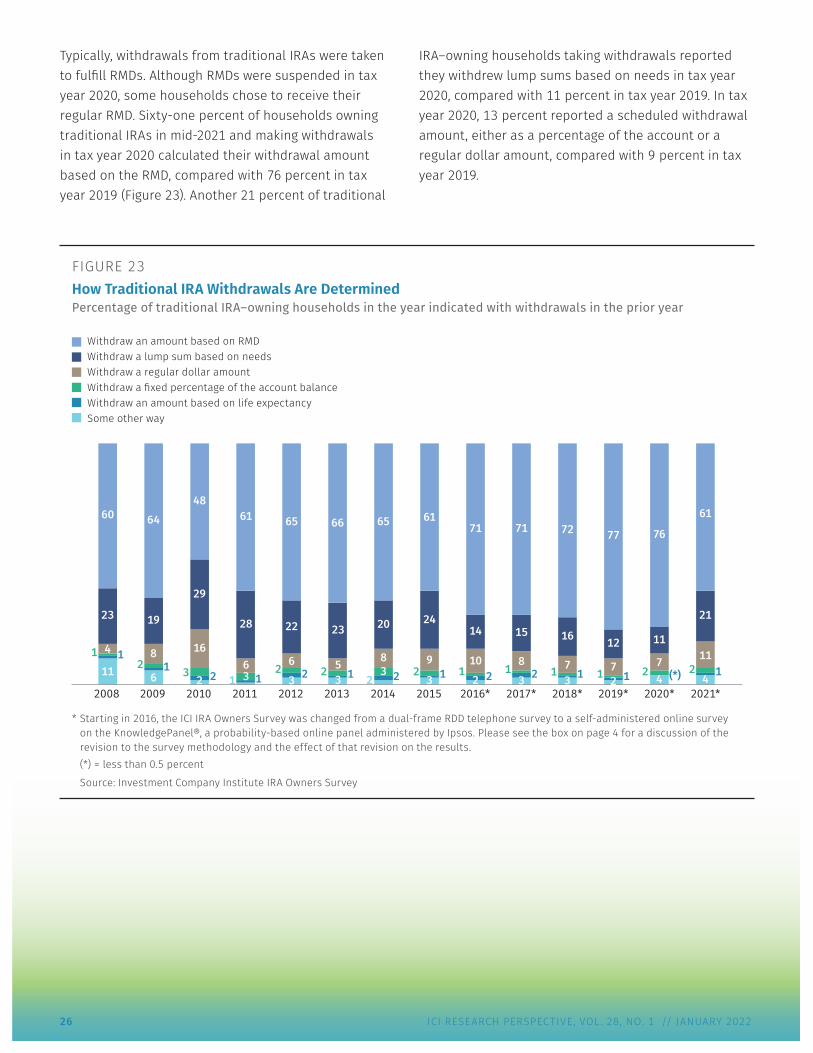
Typically, withdrawals from traditional IRAs were taken to fulfill RMDs. Although RMDs were suspended in tax year 2020, some households chose to receive their regular RMD. Sixty-one percent of households owning traditional IRAs in mid-2021 and making withdrawals in tax year 2020 calculated their withdrawal amount based on the RMD, compared with 76 percent in tax year 2019 (Figure 23). Another 21 percent of traditional
IRA–owning households taking withdrawals reported they withdrew lump sums based on needs in tax year 2020, compared with 11 percent in tax year 2019. In tax year 2020, 13 percent reported a scheduled withdrawal amount, either as a percentage of the account or a regular dollar amount, compared with 9 percent in tax year 2019.
FIGURE 23How Traditional IRA Withdrawals Are DeterminedPercentage of traditional IRA–owning households in the year indicated with withdrawals in the prior year
Withdraw an amount based on RMDWithdraw a lump sum based on needsWithdraw a regular dollar amountWithdraw a fixed percentage of the account balanceWithdraw an amount based on life expectancySome other way
2019*2018*2017*2016*2015201420132012201120102008 2009 2020* 2021*
23
41 111
60
19
82 16
64
29
16
232
48
28
61 13
61
22
622
3
65
20
823
2
65
23
512
3
66
24
912
3
61
15
821
3
71
11
16
73
72
11
12
72
77
(*)2
11
74
76
12
21
11
4
61
14
1021
2
71
* Starting in 2016, the ICI IRA Owners Survey was changed from a dual-frame RDD telephone survey to a self-administered online survey on the KnowledgePanel®, a probability-based online panel administered by Ipsos. Please see the box on page 4 for a discussion of the revision to the survey methodology and the effect of that revision on the results. (*) = less than 0.5 percent
Source: Investment Company Institute IRA Owners Survey
ICI RESEARCH PERSPECTIVE, VOL. 28, NO. 1 // JANUARY 2022 27
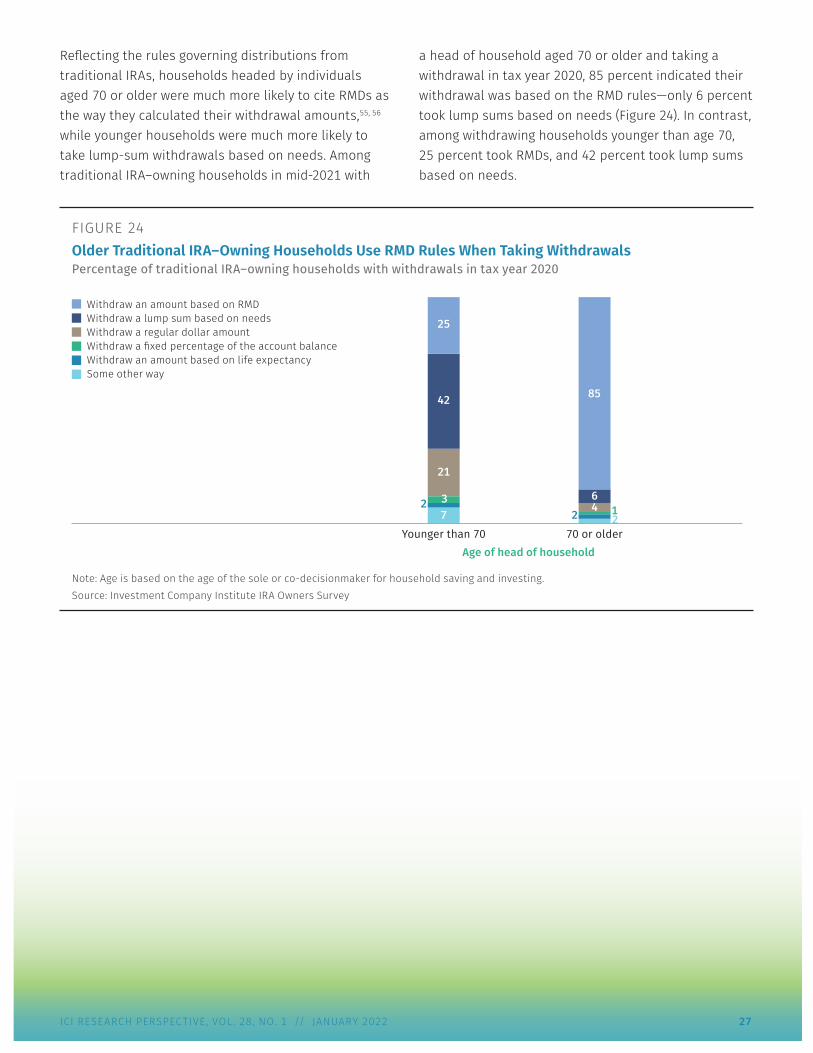
Reflecting the rules governing distributions from traditional IRAs, households headed by individuals aged 70 or older were much more likely to cite RMDs as the way they calculated their withdrawal amounts,55, 56 while younger households were much more likely to take lump-sum withdrawals based on needs. Among traditional IRA–owning households in mid-2021 with
a head of household aged 70 or older and taking a withdrawal in tax year 2020, 85 percent indicated their withdrawal was based on the RMD rules—only 6 percent took lump sums based on needs (Figure 24). In contrast, among withdrawing households younger than age 70, 25 percent took RMDs, and 42 percent took lump sums based on needs.
FIGURE 24Older Traditional IRA–Owning Households Use RMD Rules When Taking WithdrawalsPercentage of traditional IRA–owning households with withdrawals in tax year 2020
Withdraw an amount based on RMDWithdraw a lump sum based on needsWithdraw a regular dollar amountWithdraw a fixed percentage of the account balanceWithdraw an amount based on life expectancySome other way
70 or olderYounger than 70Age of head of household
42
21
272
25
13
46
2
85
Note: Age is based on the age of the sole or co-decisionmaker for household saving and investing.Source: Investment Company Institute IRA Owners Survey
28 ICI RESEARCH PERSPECTIVE, VOL. 28, NO. 1 // JANUARY 2022
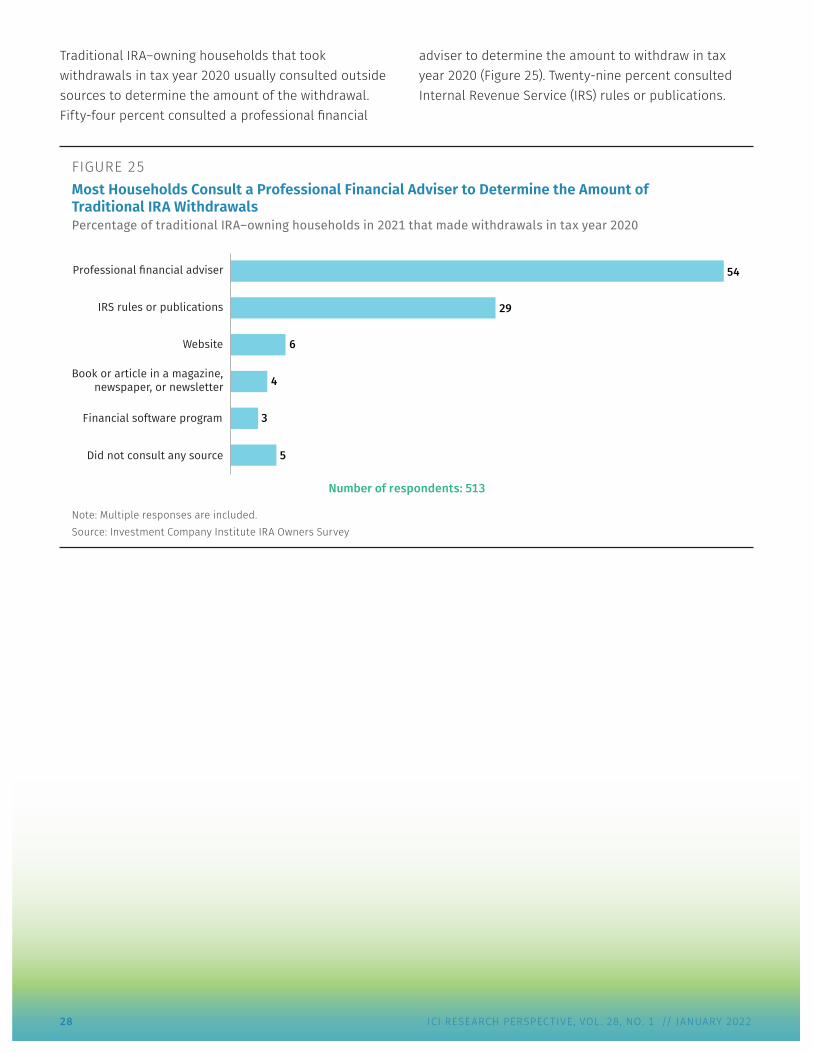
Traditional IRA–owning households that took withdrawals in tax year 2020 usually consulted outside sources to determine the amount of the withdrawal. Fifty-four percent consulted a professional financial
adviser to determine the amount to withdraw in tax year 2020 (Figure 25). Twenty-nine percent consulted Internal Revenue Service (IRS) rules or publications.
FIGURE 25Most Households Consult a Professional Financial Adviser to Determine the Amount of Traditional IRA WithdrawalsPercentage of traditional IRA–owning households in 2021 that made withdrawals in tax year 2020
Professional financial adviser
IRS rules or publications
Financial software program
Book or article in a magazine,newspaper, or newsletter
Did not consult any source 5
3
4
54
29
6
Number of respondents: 513
Website
Note: Multiple responses are included.Source: Investment Company Institute IRA Owners Survey
ICI RESEARCH PERSPECTIVE, VOL. 28, NO. 1 // JANUARY 2022 29
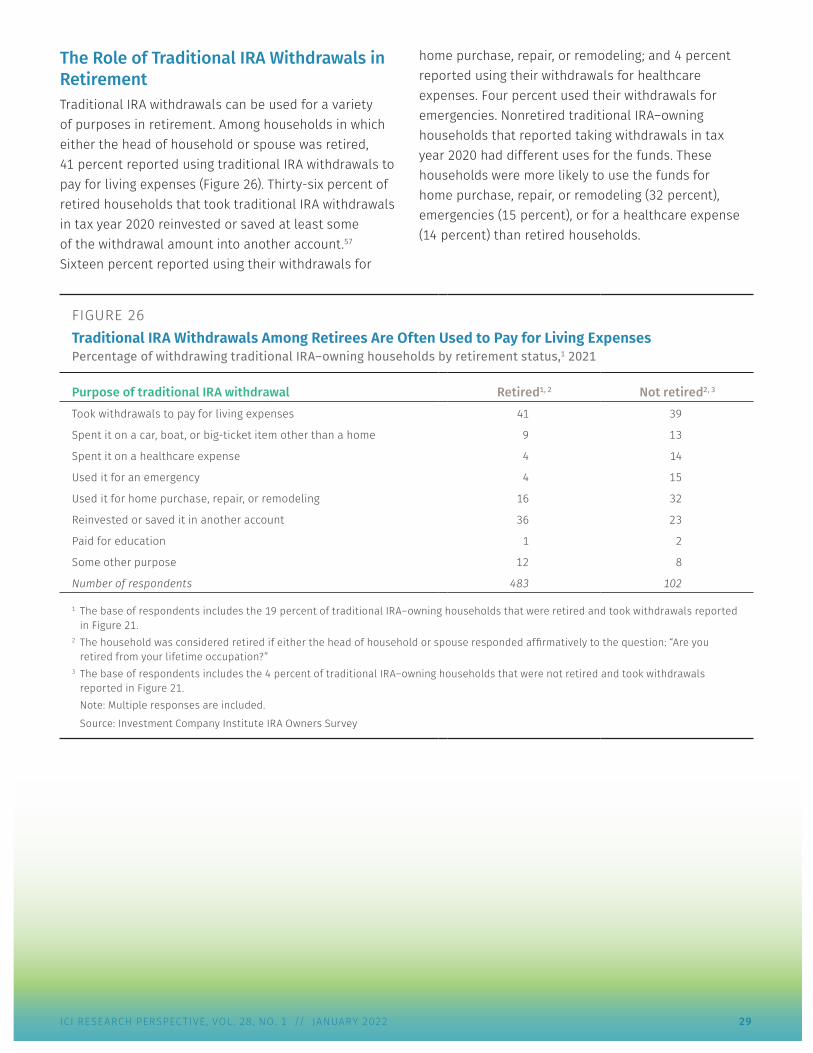
The Role of Traditional IRA Withdrawals in Retirement Traditional IRA withdrawals can be used for a variety of purposes in retirement. Among households in which either the head of household or spouse was retired, 41 percent reported using traditional IRA withdrawals to pay for living expenses (Figure 26). Thirty-six percent of retired households that took traditional IRA withdrawals in tax year 2020 reinvested or saved at least some of the withdrawal amount into another account.57 Sixteen percent reported using their withdrawals for
home purchase, repair, or remodeling; and 4 percent reported using their withdrawals for healthcare expenses. Four percent used their withdrawals for emergencies. Nonretired traditional IRA–owning households that reported taking withdrawals in tax year 2020 had different uses for the funds. These households were more likely to use the funds for home purchase, repair, or remodeling (32 percent), emergencies (15 percent), or for a healthcare expense (14 percent) than retired households.
FIGURE 26Traditional IRA Withdrawals Among Retirees Are Often Used to Pay for Living ExpensesPercentage of withdrawing traditional IRA–owning households by retirement status,1 2021
Purpose of traditional IRA withdrawal Retired1, 2 Not retired2, 3
Took withdrawals to pay for living expenses 41 39
Spent it on a car, boat, or big-ticket item other than a home 9 13
Spent it on a healthcare expense 4 14
Used it for an emergency 4 15
Used it for home purchase, repair, or remodeling 16 32
Reinvested or saved it in another account 36 23
Paid for education 1 2
Some other purpose 12 8
Number of respondents 483 102
1 The base of respondents includes the 19 percent of traditional IRA–owning households that were retired and took withdrawals reported in Figure 21.
2 The household was considered retired if either the head of household or spouse responded affirmatively to the question: “Are you retired from your lifetime occupation?”
3 The base of respondents includes the 4 percent of traditional IRA–owning households that were not retired and took withdrawals reported in Figure 21.Note: Multiple responses are included.
Source: Investment Company Institute IRA Owners Survey
30 ICI RESEARCH PERSPECTIVE, VOL. 28, NO. 1 // JANUARY 2022
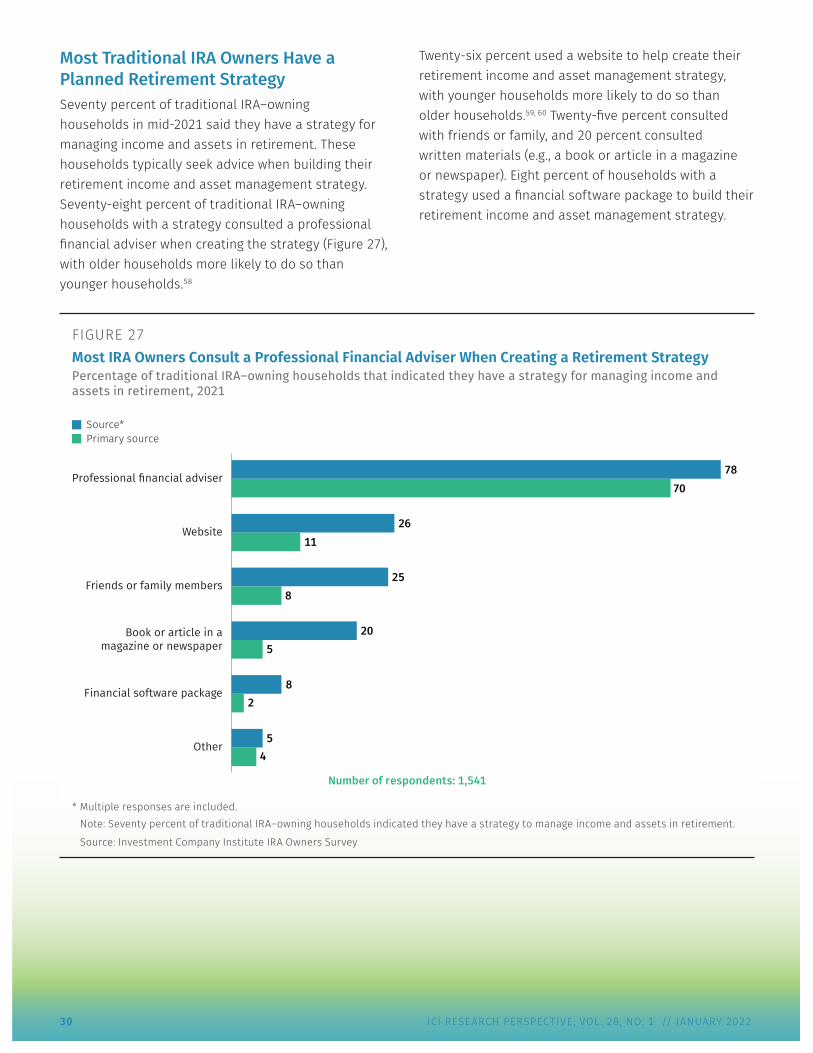
Most Traditional IRA Owners Have a Planned Retirement Strategy Seventy percent of traditional IRA–owning households in mid-2021 said they have a strategy for managing income and assets in retirement. These households typically seek advice when building their retirement income and asset management strategy. Seventy-eight percent of traditional IRA–owning households with a strategy consulted a professional financial adviser when creating the strategy (Figure 27), with older households more likely to do so than younger households.58
Twenty-six percent used a website to help create their retirement income and asset management strategy, with younger households more likely to do so than older households.59, 60 Twenty-five percent consulted with friends or family, and 20 percent consulted written materials (e.g., a book or article in a magazine or newspaper). Eight percent of households with a strategy used a financial software package to build their retirement income and asset management strategy.
FIGURE 27Most IRA Owners Consult a Professional Financial Adviser When Creating a Retirement StrategyPercentage of traditional IRA–owning households that indicated they have a strategy for managing income and assets in retirement, 2021
Source*Primary source
Professional financial adviser
Website
Friends or family members
Book or article in amagazine or newspaper
Financial software package
Other4
2
5
8
70
11
8
5
20
78
26
25
Number of respondents: 1,541
* Multiple responses are included.Note: Seventy percent of traditional IRA–owning households indicated they have a strategy to manage income and assets in retirement.
Source: Investment Company Institute IRA Owners Survey
ICI RESEARCH PERSPECTIVE, VOL. 28, NO. 1 // JANUARY 2022 31
Additional Reading
» Individual Retirement Accounts in the Investment Company Fact Book www.icifactbook.org/21_fb_ch8.html#ira
» The IRA Investor Database www.ici.org/research/investors/database
» The Evolving Role of IRAs in US Retirement Planning www.ici.org/pdf/per15-03.pdf
» The Individual Retirement Account at Age 30: A Retrospective www.ici.org/pdf/per11-01.pdf
» The US Retirement Market, Third Quarter 2021 www.ici.org/research/stats/retirement
» Ten Important Facts About IRAs www.ici.org/pdf/ten_facts_iras.pdf
» Ten Important Facts About Roth IRAs www.ici.org/pdf/ten_facts_roth_iras.pdf
» Individual Retirement Account Resource Center www.ici.org/iraresource
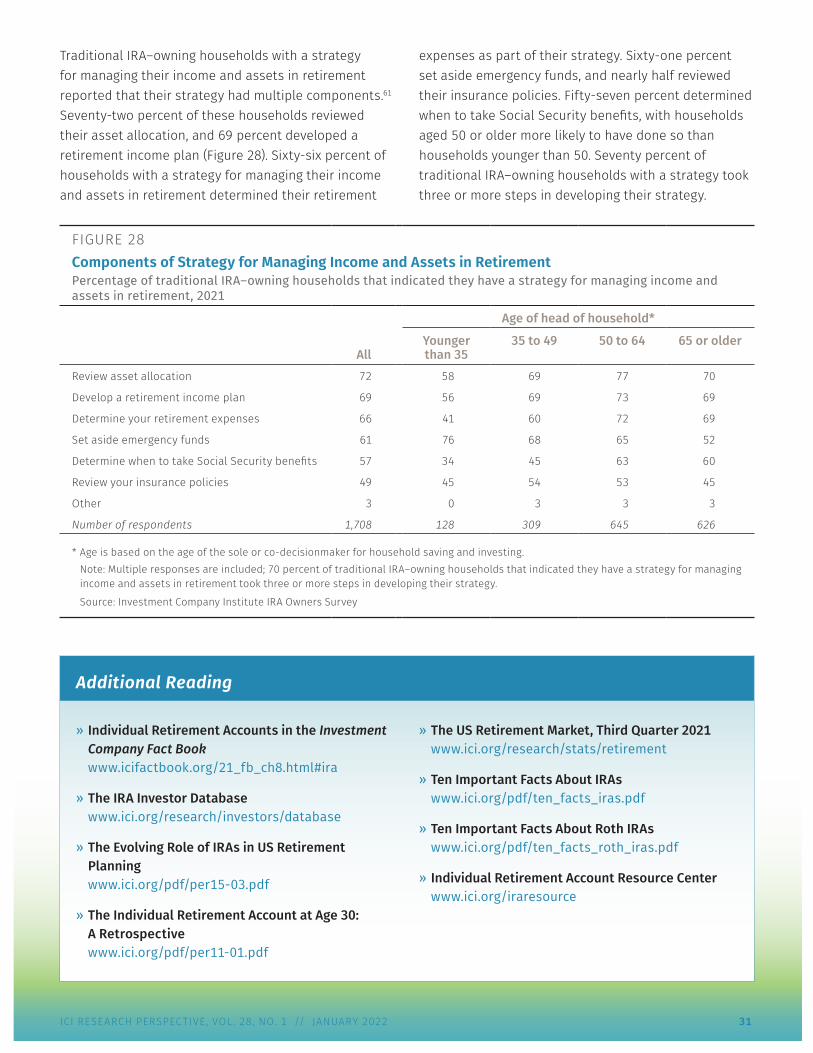
Traditional IRA–owning households with a strategy for managing their income and assets in retirement reported that their strategy had multiple components.61 Seventy-two percent of these households reviewed their asset allocation, and 69 percent developed a retirement income plan (Figure 28). Sixty-six percent of households with a strategy for managing their income and assets in retirement determined their retirement
expenses as part of their strategy. Sixty-one percent set aside emergency funds, and nearly half reviewed their insurance policies. Fifty-seven percent determined when to take Social Security benefits, with households aged 50 or older more likely to have done so than households younger than 50. Seventy percent of traditional IRA–owning households with a strategy took three or more steps in developing their strategy.
FIGURE 28Components of Strategy for Managing Income and Assets in RetirementPercentage of traditional IRA–owning households that indicated they have a strategy for managing income and assets in retirement, 2021
All
Age of head of household*
Younger than 35
35 to 49 50 to 64 65 or older
Review asset allocation 72 58 69 77 70
Develop a retirement income plan 69 56 69 73 69
Determine your retirement expenses 66 41 60 72 69
Set aside emergency funds 61 76 68 65 52
Determine when to take Social Security benefits 57 34 45 63 60
Review your insurance policies 49 45 54 53 45
Other 3 0 3 3 3
Number of respondents 1,708 128 309 645 626
* Age is based on the age of the sole or co-decisionmaker for household saving and investing.Note: Multiple responses are included; 70 percent of traditional IRA–owning households that indicated they have a strategy for managing income and assets in retirement took three or more steps in developing their strategy.
Source: Investment Company Institute IRA Owners Survey
32 ICI RESEARCH PERSPECTIVE, VOL. 28, NO. 1 // JANUARY 2022
Notes1 See Investment Company Institute 2021. For the rules
governing IRAs, see Internal Revenue Service 2021a and 2021b.
2 Households’ total financial assets were $114.1 trillion as of September 2021 and $34.7 trillion at year-end 2001. See US Federal Reserve Board 2021a.
3 Data in this ICI Research Perspective on the number and percentage of households owning IRAs are based on ICI’s Annual Mutual Fund Shareholder Tracking Survey, which was conducted from May to June 2021. This survey was based on a dual-frame random digit dial (RDD) telephone sample and included 3,001 representative US households. The standard error for the total sample is ± 1.8 percentage points at the 95 percent confidence level. For further discussion and additional results from this survey, see Holden, Schrass, and Bogdan 2021a and 2021b and Schrass and Bogdan 2021.
The demographic and financial characteristics of IRA owners are derived from a separate IRA Owners Survey of 3,257 representative US households owning traditional IRAs or Roth IRAs. The 2021 IRA Owners Survey was conducted using the KnowledgePanel®, a probability-based online panel designed to be representative of the US population. The KnowledgePanel® was designed and administered by Ipsos, an online consumer research company. The Federal Reserve has also used the KnowledgePanel®; see US Federal Reserve Board 2021b. The standard error for the total sample is ± 1.7 percentage points at the 95 percent confidence level. IRA ownership does not include ownership of employer-sponsored IRAs (SEP IRAs, SAR-SEP IRAs, and SIMPLE IRAs) or Coverdell education savings accounts (formerly called education IRAs).
The incidence of IRA ownership is calculated from the ICI Annual Mutual Fund Shareholder Tracking Survey, which collects information on retirement and other investment account ownership among US households headed by individuals aged 18 or older. Starting in 2013, the order of the account type choices in the question regarding ownership of retirement and other savings accounts was changed. This change was made to avoid confusion between individual accounts in 401(k) and other employer-sponsored DC plan accounts versus IRAs. Beginning in 2013, respondents were asked if they own a 401(k) and other employer-sponsored DC retirement plans, then if they own a traditional IRA or a Roth IRA, then if they own an employer-sponsored IRA, and, finally, if they own a 529 plan or Coverdell education savings account (ESA). In prior years, respondents were asked first if they own a traditional IRA or Roth IRA, then if they own a Coverdell ESA, then if they own an employer-sponsored IRA, and, finally, if they own a 401(k) or other employer-sponsored plan account (529 plan ownership was a separate question).
In 2014, 2015, 2016, 2017, 2018, 2019, 2020, and 2021, the incidence of IRA ownership is lower than in previous years, possibly due to the reordering of questions regarding retirement and other savings accounts in the questionnaire (introduced in 2013), as well as a sampling and weighting methodology change introduced in 2014. See Figure A1 in the appendix for the complete time series on IRA incidence (available at www.ici.org/files/per28-01_data.xls). See Holden, Schrass, and Bogdan 2021b for details on the changes to the ICI Annual Mutual Fund Shareholder Tracking Survey.
4 See note 3 for a discussion of changes in IRA incidence in ICI’s surveys. The ICI Annual Mutual Fund Shareholder Tracking Survey results in higher incidence of IRA ownership than the Federal Reserve Board’s Survey of Consumer Finances. For example, ICI tabulations of the 2019 Survey of Consumer Finances indicate that 19.0 percent of US households owned traditional IRAs and 11.9 percent of US households owned Roth IRAs. The ICI Annual Mutual Fund Shareholder Tracking Survey finds that 28.1 percent of US households in 2019, 28.6 percent in 2020, and 28.2 percent in 2021 owned traditional IRAs; in addition, 19.4 percent of US households in 2019, 20.5 percent in 2020, and 21.0 percent in 2021 owned Roth IRAs (see Figure A1 in the appendix, available at (www.ici.org/files/per28-01_data.xls). For a description of the Survey of Consumer Finances, see Bhutta et al. 2020.
5 See Figures 10–14 for additional information on rollover activities and Figure A14 in the appendix for additional information on traditional IRA–owning households with rollovers (available at www.ici.org/files/per28-01_data.xls).
6 The ability to contribute to Roth IRAs is restricted based on household income. Conversions also used to be limited based on household income, but in 2010, the income restrictions for Roth conversions were lifted. For additional detail, see Internal Revenue Service 2021a. It is possible that Roth IRA ownership is not more widespread because income limits restrict the ability of many US households to invest in Roth IRAs.
7 See Brady and Bass 2021 and Brady, Burham, and Holden 2012 for discussion of the life-cycle model and household survey results regarding savings goals.
8 See Sabelhaus and Schrass 2009.
9 For example, the first-year replacement rate (mean scheduled Social Security first-year benefits as a percentage of average inflation-indexed career earnings for retired workers in the 1960–1969 birth cohort [individuals aged 52 to 61 in 2021]) falls as income rises. The mean replacement rate for the lowest lifetime household earnings quintile was 78 percent; for the middle quintile, it was 49 percent; and for the highest quintile, it was 31 percent. See Congressional Budget Office 2021. For additional discussion, see Brady and Bass 2021 and Brady, Burham, and Holden 2012.
ICI RESEARCH PERSPECTIVE, VOL. 28, NO. 1 // JANUARY 2022 33
10 For discussion of retirement saving by different income groups, see Brady and Bass 2021; Schrass and Bogdan 2021; and Sabelhaus, Bogdan, and Schrass 2008.
11 See Holden et al. 2005 for a discussion of the relationship between demographic characteristics and the propensity to save. For additional discussion, see also Brady and Bass 2021; Brady, Burham, and Holden 2012; and Sabelhaus, Bogdan, and Schrass 2008.
12 For data from 1989 through 2007 (based on the Federal Reserve Board’s Survey of Consumer Finances), see Figures 8 and 10 in Holden and Schrass 2013. For data ranging from 2008 through 2021, see Figure A16 in the appendix (available at www.ici.org/files/per28-01_data.xls).
13 See Figure 11 in Holden, Schrass, and Bogdan 2021b.
14 For data ranging from 2008 through 2021 for all US households, see Figure A16 in the appendix (available at www.ici.org/files/per28-01_data.xls).
15 This is a pattern of risk tolerance observed in other types of investors. For example, see Sabelhaus, Bogdan, and Schrass 2008; Holden, Schrass, and Bogdan 2021b; and Schrass and Bogdan 2021.
16 Research finds that the asset allocation of traditional IRA investors varies over the life cycle. Older traditional IRA investors tended to have higher shares of their IRAs in fixed-income investments compared with younger traditional IRA investors. With the exception of the youngest traditional IRA investors (who tend to have small accounts), younger traditional IRA investors tended to have higher allocations to equity investments compared with older traditional IRA investors. See Holden and Bass 2011 and Holden, Schrass, and Bass 2021.
17 See Holden, VanDerhei, and Bass 2021 and Holden, VanDerhei, and Bass 2020.
18 For a brief history of IRAs and a discussion of the various features of different IRA types, see Holden et al. 2005. For a discussion of the evolving role of IRAs in US retirement planning, see Sabelhaus and Schrass 2009.
19 Before 2008, Roth IRAs generally were not eligible for direct rollovers from employer-sponsored retirement plan accounts. The Pension Protection Act of 2006 (PPA) allows direct rollovers from employer-sponsored plans to Roth IRAs starting in 2008. For a complete discussion of the specific rules, see Internal Revenue Service 2021a.
20 Rollovers are possible from both DC plans and DB plans. For research on DC plan participants’ distribution decisions at retirement, see Sabelhaus, Bogdan, and Holden 2008. For distribution activity from DC plans administered by the Vanguard Group, see Alling and Clark 2021.
21 See Internal Revenue Service, Statistics of Income Division 2021. For historical data, see Investment Company Institute 2021.
22 Tabulations of the Federal Reserve Board’s 2019 Survey of Consumer Finances data find that 52 percent of traditional IRA–owning households had rollovers in their IRAs in 2019, compared with 59 percent of traditional IRA–owning households in ICI’s 2019 IRA Owners Survey (see Holden and Schrass 2019). For a description of the Survey of Consumer Finances, see Bhutta et al. 2020.
23 In the case of a DC plan, this amount is the account balance. For DB plans, this amount is the lump-sum distribution based on accrued benefits. See Figure A14 in the appendix for additional information on traditional IRA owners with rollovers (available at www.ici.org/files/per28-01_data.xls).
24 The Internal Revenue Code sets out a comprehensive disclosure regime covering both plan sponsors and IRA providers with regard to information provided for distribution and rollover decisions. Plan sponsors must inform departing employees of information relevant to their distribution decision. IRA providers must disclose the relevant information to IRA owners at the outset and on an ongoing basis. In addition, financial planners, advisers, or brokers may have fiduciary obligations or be subject to other rules of practice with regard to advice to clients on distribution and rollover decisions. For additional discussion, see Holden 2009, Holden and Chism 2014, and Holden and Salinas 2018.
25 For more information on rollovers among traditional IRA investors, see Holden, Sabelhaus, and Bass 2010b and Holden, Schrass, and Bass 2021.
26 These results are from the 2018 and 2019 ICI IRA Owners Surveys; see Holden and Schrass 2019 and 2021a.
27 Although it is difficult to compare household-level data and individual-level data, the IRA Owners Survey finds higher rates of contribution activity than the IRA Investor Database finds among individual IRA investors. Analysis of 5.1 million traditional IRA investors aged 18 to 69 in 2018 finds that 10.9 percent of them contributed to their traditional IRAs in tax year 2018 (see Holden, Schrass, and Bass 2021). Contribution activity in Roth IRAs was also higher in the IRA Owners Survey. The IRA Investor Database finds that among 4.1 million Roth IRA investors aged 18 or older in 2018, 34.1 percent contributed to their Roth IRAs in tax year 2018 (see Holden and Schrass 2021b).
28 ICI’s 2013 IRA Owners Survey asked traditional IRA–owning households without contributions the reasons why they did not contribute. See Figure 19 in Holden and Schrass 2013 for those results.
29 For traditional IRA contribution eligibility rules, see Internal Revenue Service 2021a.
34 ICI RESEARCH PERSPECTIVE, VOL. 28, NO. 1 // JANUARY 2022
30 For ownership of DC accounts and access to DB plans among traditional IRA–owning households, see Figure A13 in the appendix (available at www.ici.org/files/per28-01_data.xls).
31 See Figure 21.
32 See Internal Revenue Service 2021a for the rules governing IRA contribution eligibility.
33 In 2019, the Setting Every Community Up for Retirement Enhancement Act (SECURE Act) removed the age restriction for traditional IRA contributions starting in tax year 2020.
34 Among traditional IRA–owning households in 2013 that did not make contributions to their traditional IRAs in tax year 2012, 37 percent indicated that they were able to save enough in their retirement plans at work. See Holden and Schrass 2013.
35 See Figure A11 in the appendix (available at www.ici.org/files/per28-01_data.xls).
36 Ibid.
37 For an analysis of the persistence of traditional IRA contribution activity, see Holden, Sabelhaus, and Bass 2010a and Holden, Schrass, and Bass 2021.
38 See Internal Revenue Service 2021a for details on income restrictions and other qualifications for contribution eligibility.
39 The Economic Growth and Tax Relief Reconciliation Act of 2001 (EGTRRA) created catch-up contributions, which permit individuals aged 50 or older to make additional contributions to qualified retirement plans and IRAs that exceed the annual deferral limits. Households may make catch-up contributions to Roth IRAs if their incomes are within the limits to contribute to a Roth IRA and if a household member is aged 50 or older. Households may make catch-up contributions to traditional IRAs if a household member is at least 50 years old by the end of the year but younger than 70½ years old by the end of the year. See Internal Revenue Service 2021a.
40 See Internal Revenue Service 2021a.
41 For discussion of the requirements for financial services firms providing IRAs, see Holden and Chism 2014.
42 Roth IRA–owning households similarly hold their Roth IRAs through a wide array of financial institutions; see Figure A15 in the appendix (available at www.ici.org/files/per28-01_data.xls).
43 See Figure A18 in the appendix (available at www.ici.org/files/per28-01_data.xls).
44 Ibid.
45 Over the years, Congress has created exceptions to the early withdrawal penalty, including qualified first-time home purchase, certain medical expenses, certain educational expenses, and withdrawals made as substantially equal periodic payments (SEPPs) based on a life expectancy calculation. For additional discussion of IRA withdrawal rules and activity, see Internal Revenue Service 2021b; Mortenson, Schramm, and Whitten 2016; Poterba, Venti, and Wise 2013; and Holden and Reid 2008.
46 In 2019, the SECURE Act increased the age for required minimum distributions from 70½ to 72 for individuals who did not reach age 70½ in 2019.
47 Ibid.
48 See Internal Revenue Service 2021b.
49 Data exclude households that closed and no longer owned traditional IRAs.
50 See Section 201 of the Worker, Retiree, and Employer Recovery Act of 2008. For additional information on the suspension of RMDs, see Internal Revenue Service 2010.
51 For analysis of withdrawal activity from 2011 through 2018 among a consistent group of 1.5 million traditional IRA investors (those with accounts between year-end 2010 and year-end 2018), see Holden, Schrass, and Bass 2021.
52 In 2020, the CARES Act suspended RMDs from traditional IRAs and other retirement accounts for tax year 2020; see Internal Revenue Service 2021b.
53 The withdrawal activity observed in ICI’s IRA Owners Survey shows similar results compared with data collected in the IRA Investor Database. In 2018, 7.0 percent of traditional IRA investors younger than 60 had withdrawals, 21.0 percent of traditional IRA investors aged 60 to 69 had withdrawals, and 82.2 percent of traditional IRA investors aged 70 or older had withdrawals (see Holden, Schrass, and Bass 2021).
54 In years before tax year 2020 (excluding tax year 2009), withdrawal activity among households with a head of household aged 70 or older is not 100 percent because the traditional IRA owner may be a younger spouse or partner who is not yet required to make withdrawals. The IRA Investor Database finds that among 1.2 million traditional IRA investors aged 70 or older in 2018, 82.2 percent took a withdrawal from their traditional IRAs in tax year 2018 (see Holden, Schrass, and Bass 2021). The older traditional IRA investors without withdrawals may have taken RMDs from IRAs held at financial services firms outside the IRA Investor Database. RMDs were suspended for tax year 2009 and tax year 2020; see Internal Revenue Service 2010 and 2021b.
ICI RESEARCH PERSPECTIVE, VOL. 28, NO. 1 // JANUARY 2022 35
55 Analysis of 1.0 million traditional IRA investors aged 70 or older who took withdrawals in 2018 in the IRA Investor Database finds that 57.2 percent took the RMD for the individual, 1.5 percent took a joint RMD, and 0.4 percent took the inherited RMD amount. See Holden, Schrass, and Bass 2021.
56 In 2019, the SECURE Act increased the age for RMDs from 70½ to 72 for individuals who did not reach age 70½ in 2019.
57 Among the 36 percent of retired households that reported reinvesting or saving at least some of the amount of the traditional IRA withdrawal into another account (see Figure 26), 81 percent reported withdrawing the amount based on the RMD.
58 See Figure A19 in the appendix (available at www.ici.org/files/per28-01_data.xls).
59 Ibid.
60 See Figure A20 in the appendix for sources of information used to create a retirement strategy among Roth IRA–owning households with a strategy for managing income and assets in retirement (available at www.ici.org/files/per28-01_data.xls).
61 See Figure A21 in the appendix for strategy components among Roth IRA–owning households with a strategy for managing income and assets in retirement (available at www.ici.org/files/per28-01_data.xls).
References
Alling, Brian T., and Jeffrey W. Clark. 2021. How America Saves 2021. Valley Forge, PA: The Vanguard Group, Vanguard Center for Retirement Research. Available at https://institutional.vanguard.com/content/dam/inst/vanguard-has/insights-pdfs/21_CIR_HAS21_HAS_FSreport.pdf.
Bhutta, Neil, Jesse Bricker, Andrew C. Chang, Lisa J. Dettling, Sarena Goodman, Joanne W. Hsu, Kevin B. Moore, Sarah Reber, Alice Henriques Volz, and Richard A. Windle. 2020. “Changes in US Family Finances from 2016 to 2019: Evidence from the Survey of Consumer Finances.” Federal Reserve Bulletin 106, no. 5 (September). Available at www.federalreserve.gov/publications/files/scf20.pdf.
Brady, Peter J., and Steven Bass. 2021. “Who Participates in Retirement Plans, 2018.” ICI Research Perspective 27, no. 8 (September). Available at www.ici.org/files/2021/per27-08.pdf.
Brady, Peter, Kimberly Burham, and Sarah Holden. 2012. The Success of the US Retirement System (December). Washington, DC: Investment Company Institute. Available at www.ici.org/pdf/ppr_12_success_retirement.pdf.
Congressional Budget Office. 2021. CBO’s 2021 Long Term Projections for Social Security: Additional Information. Washington, DC: Congressional Budget Office (July). Available at www.cbo.gov/system/files/2021-07/57342-Social-Security.xlsx.
Holden, Sarah. 2009. “Testimony for ERISA Advisory Council Working Group on Approaches for Retirement Security in the United States.” Statement of the Investment Company Institute: Sarah Holden, Senior Director, Retirement and Investor Research (September 17). Available at www.ici.org/pdf/23804b.pdf.
Holden, Sarah, and Steven Bass. 2011. “The IRA Investor Profile: Traditional IRA Investors’ Asset Allocation, 2007and 2008.” ICI Research Report (September). Available at www.ici.org/pdf/rpt_11_ira_asset.pdf.

36 ICI RESEARCH PERSPECTIVE, VOL. 28, NO. 1 // JANUARY 2022
Holden, Sarah, and Elena Barone Chism. 2014. “Testimony for 2014 ERISA Advisory Council: Issues and Considerations Around Facilitating Lifetime Plan Participation.” Statement of the Investment Company Institute: Sarah Holden, Senior Director, Retirement and Investor Research, and Elena Barone Chism, Associate Counsel, Pension Regulation (June 17). Available at www.dol.gov/sites/default/files/ebsa/about-ebsa/about-us/erisa-advisory-council/ACHolden061714.pdf.
Holden, Sarah, Kathy Ireland, Vicky Leonard-Chambers, and Michael Bogdan. 2005. “The Individual Retirement Account at Age 30: A Retrospective.” Investment Company Institute Perspective 11, no. 1 (February). Available at www.ici.org/pdf/per11-01.pdf.
Holden, Sarah, and Brian Reid. 2008. “The Role of Individual Retirement Accounts in US Retirement Planning.” In Recalibrating Retirement Spending and Saving, edited by John Ameriks and Olivia S. Mitchell: 81–111. Oxford: Oxford University Press for the Wharton School, University of Pennsylvania, Pension Research Council.
Holden, Sarah, John Sabelhaus, and Steven Bass. 2010a. “The IRA Investor Profile: Traditional IRA Investors’ Contribution Activity, 2007 and 2008.” ICI Research Report (July). Available at www.ici.org/pdf/rpt_10_ira_contributions.pdf.
Holden, Sarah, John Sabelhaus, and Steven Bass. 2010b. “The IRA Investor Profile: Traditional IRA Investors’ Rollover Activity, 2007 and 2008.” ICI Research Report (December). Available at www.ici.org/pdf/rpt_10_ira_rollovers.pdf.
Holden, Sarah, and Shannon Salinas. 2018. “Testimony for 2018 ERISA Advisory Council: Lifetime Income Solutions as a Qualified Default Investment Alternative (QDIA).” Statement of the Investment Company Institute: Sarah Holden, Senior Director, Retirement and Investor Research, and Shannon Salinas, Assistant General Counsel, Retirement Policy (August 15). Available at www.dol.gov/sites/dolgov/files/EBSA/about-ebsa/about-us/erisa-advisory-council/2018-lifetime-income-solutions-as-a-qdia-holden-writtenstatement-08-15.pdf.
Holden, Sarah, and Daniel Schrass. 2013. “The Role of IRAs in US Households’ Saving for Retirement, 2013.” ICI Research Perspective 19, no 11 (November). Available at www.ici.org/pdf/per19-11.pdf.
Holden, Sarah, and Daniel Schrass. 2019. “The Role of IRAs in US Households’ Saving for Retirement, 2019.” ICI Research Perspective 25, no. 10 (December). Available at www.ici.org/pdf/per25-10.pdf.
Holden, Sarah, and Daniel Schrass. 2021a. “The Role of IRAs in US Households’ Saving for Retirement, 2020.” ICI Research Perspective 27, no. 1 (January). Available at www.ici.org/pdf/per27-01.pdf.
Holden, Sarah, and Daniel Schrass. 2021b. “The IRA Investor Profile: Roth IRA Investors’ Activity, 2010–2018.” ICI Research Report (November). Available at www.ici.org/files/2021/21-rpt-ira-roth.pdf.
Holden, Sarah, Daniel Schrass, and Steven Bass. 2021. “The IRA Investor Profile: Traditional IRA Investors’ Activity, 2010–2018.” ICI Research Report (August). Available at www.ici.org/files/2021/21_rpt_ira_traditional.pdf.
Holden, Sarah, Daniel Schrass, and Michael Bogdan. 2021a. “Characteristics of Mutual Fund Investors, 2021.” ICI Research Perspective 27, no. 12 (October). Available at www.ici.org/files/2021/per27-12.pdf.
Holden, Sarah, Daniel Schrass, and Michael Bogdan. 2021b. “Ownership of Mutual Funds, Shareholder Sentiment, and Use of the Internet, 2021.” ICI Research Perspective 27, no. 11 (October). Available at www.ici.org/files/2021/per27-11.pdf.
Holden, Sarah, Jack VanDerhei, and Steven Bass. 2020. “What Does Consistent Participation in 401(k) Plans Generate? Changes in 401(k) Account Balances, 2010–2018.” ICI Research Perspective 26, no. 6, and EBRI Issue Brief, no. 514 (October). Available at www.ici.org/pdf/per26-06.pdf.
ICI RESEARCH PERSPECTIVE, VOL. 28, NO. 1 // JANUARY 2022 37
Holden, Sarah, Jack VanDerhei, and Steven Bass. 2021. “401(k) Plan Asset Allocation, Account Balances, and Loan Activity in 2018.” ICI Research Perspective 27, no. 2, and EBRI Issue Brief, no. 526 (March). Available at www.ici.org/pdf/per27-02.pdf.
Internal Revenue Service. 2010. Publication 590, Individual Retirement Arrangements (IRAs): For Use in Preparing 2009 Returns. Available at www.irs.gov/pub/irs-prior/p590--2010.pdf.
Internal Revenue Service. 2021a. Publication 590-A, Contributions to Individual Retirement Arrangements (IRAs) for Use in Preparing 2020 Returns. Available at www.irs.gov/pub/irs-pdf/p590a.pdf.
Internal Revenue Service. 2021b. Publication 590-B, Distributions from Individual Retirement Arrangements (IRAs) for Use in Preparing 2020 Returns. Available at www.irs.gov/pub/irs-pdf/p590b.pdf.
Internal Revenue Service, Statistics of Income Division. 2021. SOI Tax Stats: Accumulation and Distribution of Individual Retirement Arrangements (IRA). Available at www.irs.gov/statistics/soi-tax-stats-accumulation-and-distribution-of-individual-retirement-arrangements.
Investment Company Institute. 2021. “The US Retirement Market, Third Quarter 2021” (December). Available at www.ici.org/research/stats/retirement.
Mortenson, Jacob A., Heidi R. Schramm, and Andrew Whitten. 2016. “The Effects of Required Minimum Distribution Rules on Withdrawals from Traditional Individual Retirement Accounts.” SSRN Working Paper (October 25). Available at https://papers.ssrn.com/sol3/papers.cfm?abstract_id=2764435.
Poterba, James, Steven Venti, and David A. Wise. 2013. “The Drawdown of Personal Retirement Assets: Husbanding or Squandering?” Working Paper (January). Available at http://conference.nber.org/conf_papers/f67686.pdf.
Sabelhaus, John, Michael Bogdan, and Sarah Holden. 2008. Defined Contribution Plan Distribution Choices at Retirement: A Survey of Employees Retiring Between 2002 and 2007. Washington, DC: Investment Company Institute. Available at www.ici.org/pdf/rpt_08_dcdd.pdf.
Sabelhaus, John, Michael Bogdan, and Daniel Schrass. 2008. Equity and Bond Ownership in America, 2008. Washington, DC: Investment Company Institute and New York: Securities Industry and Financial Markets Association. Available at www.ici.org/pdf/rpt_08_equity_owners.pdf.
Sabelhaus, John, and Daniel Schrass. 2009. “The Evolving Role of IRAs in US Retirement Planning.” Investment Company Institute Perspective 15, no. 3 (November). Available at www.ici.org/pdf/per15-03.pdf.
Schrass, Daniel, and Michael Bogdan. 2021. “Profile of Mutual Fund Shareholders, 2020.” ICI Research Report. Available at www.ici.org/files/2021/21_rpt_profiles.pdf.
US Census Bureau. 2021. “Income and Poverty in the United States: 2020.” Current Population Reports, P60-273 (September). Washington, DC: US Government Printing Office. Available at www.census.gov/content/dam/Census/library/publications/2021/demo/p60-273.pdf.
US Federal Reserve Board. 2021a. Financial Accounts of the United States: Flow of Funds, Balance Sheets, and Integrated Macroeconomic Accounts, Third Quarter 2021, Z.1 Release (December). Washington, DC: Federal Reserve Board. Available at www.federalreserve.gov/releases/Z1/current.
US Federal Reserve Board. 2021b. Economic Well-Being of US Households in 2020. Washington, DC: Federal Reserve Board (May). Available at www.federalreserve.gov/publications/files/2020-report-economic-well-being-us-households-202105.pdf.
38 ICI RESEARCH PERSPECTIVE, VOL. 28, NO. 1 // JANUARY 2022
Glossary
catch-up contribution. Individuals aged 50 or older are permitted to make contributions to an IRA or employer-sponsored retirement savings plan in excess of the annual contribution limit. In 2021, the catch-up limit was $1,000 for IRAs, $3,000 for SIMPLE plans, and $6,500 for 401(k) plans.
contribution limit. Federal law establishes limits for the amount an individual may contribute to an IRA, 401(k), or other retirement savings plan in any given year. In 2021, the annual employee contribution limit for 401(k)s and similar employer-sponsored retirement plans was $19,500; the annual limit for traditional and Roth IRAs was $6,000; and the annual limit for SIMPLE IRAs was $13,500. The limit on the sum of employee and employer contributions for DC plans in 2021 was $58,000. Individuals aged 50 or older may make additional catch-up contributions.
conversion. The movement of assets in a traditional IRA to a Roth IRA, either through a transfer of assets from a traditional IRA to a Roth IRA or by redesignating a traditional IRA as a Roth IRA. Assets in a 401(k) or other tax-advantaged employer-sponsored retirement plan may also be converted to a Roth IRA. Generally, the assets converted are taxable in the year of the conversion to the Roth IRA.
defined benefit (DB) plan. An employer-sponsored pension plan in which the amount of future benefits an employee will receive from the plan is defined, typically by a formula based on salary history and years of service. The amount of contributions the employer is required to make will depend on the investment returns experienced by the plan and the benefits promised.
defined contribution (DC) plan. An employer-sponsored retirement plan, such as a 401(k) plan or a 403(b) plan, in which contributions are made to individual participant accounts. Depending on the type of DC plan, contributions may be made by the employee, the employer, or both. The employee’s benefits at retirement or termination of employment are based on the employee’s and employer’s contributions, as well as earnings and losses on those contributions.
distribution. Individuals may take distributions (that is, withdraw funds) from their IRAs before retirement, but distributions may be subject to federal income tax, a tax penalty, or both. Withdrawals from traditional IRAs before age 59½ are subject to income tax and may be subject to a 10 percent early withdrawal penalty. The earnings portion of withdrawals from Roth IRAs made within five years of contribution or made before age 59½ is generally subject to income tax and may be subject to the 10 percent penalty. For both traditional IRAs and Roth IRAs, the 10 percent penalty does not apply to withdrawals made in cases of death or disability, or if used for certain medical expenses, first-time homebuyer expenses, qualified higher education expenses, health insurance expenses of unemployed individuals, or as part of a series of substantially equal periodic payments (SEPPs) made for the life or over the life expectancy of the individual. In addition, provided the five-year holding period is satisfied, the earnings portion of early withdrawals from a Roth IRA made in cases of death, disability, or qualified first-time homebuyer expenses is not subject to income tax.
401(k) plan. A type of DC plan that allows employees to choose to contribute a portion of their salaries into the plan, which defers income taxes on the amounts contributed. Like a traditional IRA, no taxes are due until distributions are taken from the account. Starting in 2006, plans could choose to allow employees to make Roth contributions to a 401(k) plan. These contributions are claimed as taxable income in the year of the contribution, but no taxes are due on qualified distributions. Most 401(k) plans also allow employees to choose how to invest their accounts.
individual retirement account (IRA). A tax-deferred or tax-free retirement account that allows contributions of a limited yearly sum. Congress initially designed IRAs to have two roles: (1) to give individuals not covered by a retirement plan at work a tax-advantaged retirement savings plan, and (2) to complement the employer-sponsored retirement system by preserving rollover assets at job separation or retirement. The acronym IRA also refers to individual retirement annuities, which receive similar tax treatment.
ICI RESEARCH PERSPECTIVE, VOL. 28, NO. 1 // JANUARY 2022 39
required minimum distribution (RMD). Minimum distribution rules require that beginning at a certain age (70½ for individuals born before July 1, 1949, or 72 for individuals born on July 1, 1949, or later), the entire amount of a traditional IRA be distributed over the expected life of the individual (or the joint lives of the individual and designated beneficiary). Distributing less than the required amount will result in a tax penalty. Roth IRAs are not subject to required minimum distributions during the account holder’s lifetime.
rollover. The transfer of an investor’s assets from one qualified retirement plan or account (IRA, 401(k), or other tax-advantaged, employer-sponsored retirement plan) to another—due to changing jobs, for instance—without a tax penalty.
Roth IRA. First available in 1998, this type of individual retirement account permits only after-tax (nondeductible) contributions. Distributions of both principal and earnings are generally not subject to federal income tax if taken after age 59½ (provided the five-year holding period is met). Distributions of principal before age 59½ are not subject to tax, but investment earnings are generally subject to tax and a 10 percent penalty if taken before age 59½. Distributions are not required during the account holder’s lifetime.
SEP IRA (simplified employee pension). A retirement program in which an employer makes contributions to IRAs on behalf of employees. A salary reduction SEP (or SAR-SEP) IRA is a SEP IRA that allows employees to contribute their own compensation into an IRA. When Congress created the SIMPLE IRA in 1996, it provided that an employer could not establish a new SAR-SEP plan after 1996.
SIMPLE IRA (savings incentive match plan for employees). A tax-favored retirement plan that was created in 1996 and that small employers can set up for the benefit of their employees. Both employer and employee contributions are allowed in a SIMPLE IRA plan.
traditional IRA. The first type of IRA, which was created in 1974. Individuals may make tax-deductible and nondeductible contributions to these IRAs. Taxes on IRA investment earnings are deferred until they are distributed. Upon distribution, both deductible contributions and earnings are subject to federal income tax. Generally, distributions before age 59½ are subject to income tax and a 10 percent penalty.
WASHINGTON, DC // LONDON // BRUSSELS // HONG KONG // WWW.ICI.ORG
Copyright © 2022 by the Investment Company Institute. All rights reserved.
The Investment Company Institute (ICI) is the leading association of regulated funds globally, including mutual funds, exchange-traded funds (ETFs), closed-end funds, and unit investment trusts (UITs) in the United States, and similar funds offered to investors in jurisdictions worldwide. ICI seeks to encourage adherence to high ethical standards, promote public understanding, and otherwise advance the interests of funds, their shareholders, directors, and advisers.
ici.org @ICI ICIVideo Investment Company Institute
Sarah HoldenSarah Holden, ICI senior director of retirement and investor research, leads the Institute’s research efforts on investor demographics and behavior and retirement and tax policy. Holden, who joined ICI in 1999, heads efforts to track trends in household retirement saving activity and ownership of funds as well as other investments inside and outside retirement accounts. She is responsible for analysis of 401(k) plan participant activity using data collected in a collaborative effort with the Employee Benefit Research Institute (EBRI), known as the EBRI/ICI Participant-Directed Retirement Plan Data Collection Project. In addition, she oversees the IRA Investor Database™, which contains data on millions of IRA investors and allows analysis of IRA investors’ contribution, rollover, conversion, and withdrawal activity, and asset allocation. Before joining ICI, Holden served as an economist at the Federal Reserve Board of Governors. She has a PhD in economics from the University of Michigan and a BA in mathematics and economics, cum laude, from Smith College.
Daniel SchrassDaniel Schrass is an economist in the retirement and investor research division at ICI. He focuses on investor demographics and behavior, as well as trends in household retirement saving activity. His detailed research includes analysis of IRA-owning households and individual IRA investors in the IRA Investor DatabaseTM, which includes data on millions of IRA investors. He also conducts research with government surveys such as the Survey of Consumer Finances, the Current Population Survey, and the Survey of Household Economics and Decisionmaking. Before joining ICI in October 2007, he served as an economist at the US Bureau of Labor Statistics. He has an MA in applied economics from the Johns Hopkins University and a BS in economics from the Pennsylvania State University.
Related Documents