The Role of Governance in Determining Foreign Aid Flow Composition MATTHEW S. WINTERS and GINA MARTINEZ * University of Illinois at Urbana-Champaign, USA Summary. — We hypothesize that selective donors will use types of aid over which they have more control when providing assistance to poorly governed countries. We use an original classification of project purpose codes in the AidData dataset to categorize aid flows from the period 2004 to 2010. Results from fixed effect and compositional data models provide evidence of selectivity in terms of overall aid flows, a tradeoff between technical assistance and programmatic lending, and a tradeoff between social sector and infrastructure projects. Ó 2014 Elsevier Ltd. All rights reserved. Key words — foreign aid allocation, development aid modalities, governance, compositional data analysis 1. INTRODUCTION Over the course of the 1990s, a narrative emerged among major international development institutions about “good governance” being a necessary condition for economic growth. 1 At the beginning of the decade, the idea was prom- inently stated in the World Bank study Sub-Saharan Africa: From Crisis to Sustainable Growth (1989), and by the end of the decade, the World Bank’s Assessing Aid volume offered the logically persuasive – although soon empirically challenged – conclusion that aid works well in countries that have good policies or institutions in place (World Bank, 1998; see also Burnside & Dollar, 2000, 2004). The corollary conclusion was that foreign aid donors should take recipient country gov- ernance into consideration when making decisions about aid giving. Over the course of the 1990s, nearly all bilateral and multi- lateral international development agencies incorporated lan- guage about allocating aid selectively with regard to recipient-country governance into their mission statements. 2 For some donors, such as the World Bank, governance is directly built into the allocation formulas used for divvying up their budgets. The United States, in the mid-2000s, created a new aid agency, the Millennium Challenge Corporation, explicitly charged with disbursing aid to a group of countries that were deemed to have governance of sufficient quality. The Netherlands, in trying to identify a set of partner coun- tries in which to concentrate its aid giving, made governance quality a determinative criterion. 3 Replacing the ex post con- ditionality of structural adjustment programs from the 1980s and early 1990s in which aid flows could be suspended if coun- tries did not implement certain policies, the good governance era that has followed has ostensibly been defined by ex ante conditionality (i.e., selectivity) in which countries with poor policies and institutions are either not given aid in the first place or else are given smaller amounts of aid. 4 Much of the ensuing academic literature has confirmed that donors do respond to recipient-country governance when making aid allocation decisions (Bermeo, 2010; Claessens, Cassimon, & Van Campenhout 2009; de la Croix & Delavallade, 2013; Dietrich, 2013; Freytag & Pehnelt, 2009; Neumayer, 2003b; Schudel, 2008, ND), although some authors have raised questions about whether donors are responsive to corruption (Alesina & Weder, 2002; Easterly & Pfutze, 2008; Easterly & Williamson, 2011; Neumayer, 2003a, 2003b; Svensson, 2000). The most recent literature looks beyond aggregate aid flows, examining instead how donors may find ways of structuring aid projects such that they avoid working directly with corrupt or incompetent gov- ernments (Dietrich, 2013) or use certain types of “governance- robust” development assistance in more poorly governed states (Bermeo, 2010; Clist, Isopi, & Morrissey, 2012; Nordveit, 2014). We extend this recent literature on the relationship between governance and aid allocation by examining how governance predicts the distribution of aid across three modalities and four broad project sectors. We make use of the AidData data- set (Tierney et al., 2011) to create an original categorization of aid flows based on project-level purpose codes. For each of the modalities and sectors that we study, we discuss the way in which governance problems are likely to affect that type of aid. If donors are being selective, they should prefer to use governance-robust development assistance in poorly governed countries. We analyze the patterns in aid commitments over 2004–10 using statistical models appropriate for the analysis of compositional data. Looking at overall aid flows, we find that donors provide higher levels of aid to better governed countries and do so using a larger number of modalities and across a larger number of sectors. 5 Looking at aid modalities, we find evidence that bilateral donors substitute programmatic aid for technical assistance and project aid in well-governed countries. We also find evidence that bilateral donors * Thanks to Scott Morgenstern, Dan Nielson and Bernhard Reinsberg for comments on previous versions of the paper. Thanks to Sarah Bermeo, Stephen Chaudoin, Simone Dietrich, Burt Monroe, Brian O’Donnell, Brad Parks, and Martin Steinwand for useful conversations about using the AidData and OECD-DAC CRS datasets and about methodology. Previous versions of the paper were presented at the 2012 International Studies Association, Midwest Political Science Association and European Political Science Association Annual Meetings under the title “The Role of Corruption in Determining Foreign Aid Project Portfolios”; because of helpful feedback from the anonymous reviewers, we revised the focus of the manuscript to be about governance more generally. A version of the manuscript under the current title was presented at the 2014 American Political Science Association Annual Meeting. Final revision accepted: September 21, 2014. World Development Vol. 66, pp. 516–531, 2015 0305-750X/Ó 2014 Elsevier Ltd. All rights reserved. www.elsevier.com/locate/worlddev http://dx.doi.org/10.1016/j.worlddev.2014.09.020 516

Welcome message from author
This document is posted to help you gain knowledge. Please leave a comment to let me know what you think about it! Share it to your friends and learn new things together.
Transcript
World Development Vol. 66, pp. 516–531, 20150305-750X/� 2014 Elsevier Ltd. All rights reserved.
www.elsevier.com/locate/worlddevhttp://dx.doi.org/10.1016/j.worlddev.2014.09.020
The Role of Governance in Determining Foreign
Aid Flow Composition
MATTHEW S. WINTERS and GINA MARTINEZ*
University of Illinois at Urbana-Champaign, USA
Summary. — We hypothesize that selective donors will use types of aid over which they have more control when providing assistance topoorly governed countries. We use an original classification of project purpose codes in the AidData dataset to categorize aid flows fromthe period 2004 to 2010. Results from fixed effect and compositional data models provide evidence of selectivity in terms of overall aidflows, a tradeoff between technical assistance and programmatic lending, and a tradeoff between social sector and infrastructure projects.� 2014 Elsevier Ltd. All rights reserved.
Key words — foreign aid allocation, development aid modalities, governance, compositional data analysis
* Thanks to Scott Morgenstern, Dan Nielson and Bernhard Reinsberg for
comments on previous versions of the paper. Thanks to Sarah Bermeo,
Stephen Chaudoin, Simone Dietrich, Burt Monroe, Brian O’Donnell,
Brad Parks, and Martin Steinwand for useful conversations about using
the AidData and OECD-DAC CRS datasets and about methodology.
Previous versions of the paper were presented at the 2012 International
Studies Association, Midwest Political Science Association and European
Political Science Association Annual Meetings under the title “The Role
of Corruption in Determining Foreign Aid Project Portfolios”; because of
helpful feedback from the anonymous reviewers, we revised the focus of
the manuscript to be about governance more generally. A version of the
manuscript under the current title was presented at the 2014 American
Political Science Association Annual Meeting. Final revision accepted:September 21, 2014.
1. INTRODUCTION
Over the course of the 1990s, a narrative emerged amongmajor international development institutions about “goodgovernance” being a necessary condition for economicgrowth. 1 At the beginning of the decade, the idea was prom-inently stated in the World Bank study Sub-Saharan Africa:From Crisis to Sustainable Growth (1989), and by the end ofthe decade, the World Bank’s Assessing Aid volume offeredthe logically persuasive – although soon empirically challenged– conclusion that aid works well in countries that have goodpolicies or institutions in place (World Bank, 1998; see alsoBurnside & Dollar, 2000, 2004). The corollary conclusionwas that foreign aid donors should take recipient country gov-ernance into consideration when making decisions about aidgiving.
Over the course of the 1990s, nearly all bilateral and multi-lateral international development agencies incorporated lan-guage about allocating aid selectively with regard torecipient-country governance into their mission statements. 2
For some donors, such as the World Bank, governance isdirectly built into the allocation formulas used for divvyingup their budgets. The United States, in the mid-2000s, createda new aid agency, the Millennium Challenge Corporation,explicitly charged with disbursing aid to a group of countriesthat were deemed to have governance of sufficient quality.The Netherlands, in trying to identify a set of partner coun-tries in which to concentrate its aid giving, made governancequality a determinative criterion. 3 Replacing the ex post con-ditionality of structural adjustment programs from the 1980sand early 1990s in which aid flows could be suspended if coun-tries did not implement certain policies, the good governanceera that has followed has ostensibly been defined by ex anteconditionality (i.e., selectivity) in which countries with poorpolicies and institutions are either not given aid in the firstplace or else are given smaller amounts of aid. 4
Much of the ensuing academic literature has confirmed thatdonors do respond to recipient-country governance whenmaking aid allocation decisions (Bermeo, 2010; Claessens,Cassimon, & Van Campenhout 2009; de la Croix &Delavallade, 2013; Dietrich, 2013; Freytag & Pehnelt, 2009;Neumayer, 2003b; Schudel, 2008, ND), although someauthors have raised questions about whether donors areresponsive to corruption (Alesina & Weder, 2002; Easterly &
516
Pfutze, 2008; Easterly & Williamson, 2011; Neumayer,2003a, 2003b; Svensson, 2000). The most recent literaturelooks beyond aggregate aid flows, examining instead howdonors may find ways of structuring aid projects such thatthey avoid working directly with corrupt or incompetent gov-ernments (Dietrich, 2013) or use certain types of “governance-robust” development assistance in more poorly governedstates (Bermeo, 2010; Clist, Isopi, & Morrissey, 2012;Nordveit, 2014).
We extend this recent literature on the relationship betweengovernance and aid allocation by examining how governancepredicts the distribution of aid across three modalities andfour broad project sectors. We make use of the AidData data-set (Tierney et al., 2011) to create an original categorization ofaid flows based on project-level purpose codes. For each of themodalities and sectors that we study, we discuss the way inwhich governance problems are likely to affect that type ofaid. If donors are being selective, they should prefer to usegovernance-robust development assistance in poorly governedcountries. We analyze the patterns in aid commitments over2004–10 using statistical models appropriate for the analysisof compositional data. Looking at overall aid flows, we findthat donors provide higher levels of aid to better governedcountries and do so using a larger number of modalities andacross a larger number of sectors. 5 Looking at aid modalities,we find evidence that bilateral donors substitute programmaticaid for technical assistance and project aid in well-governedcountries. We also find evidence that bilateral donors
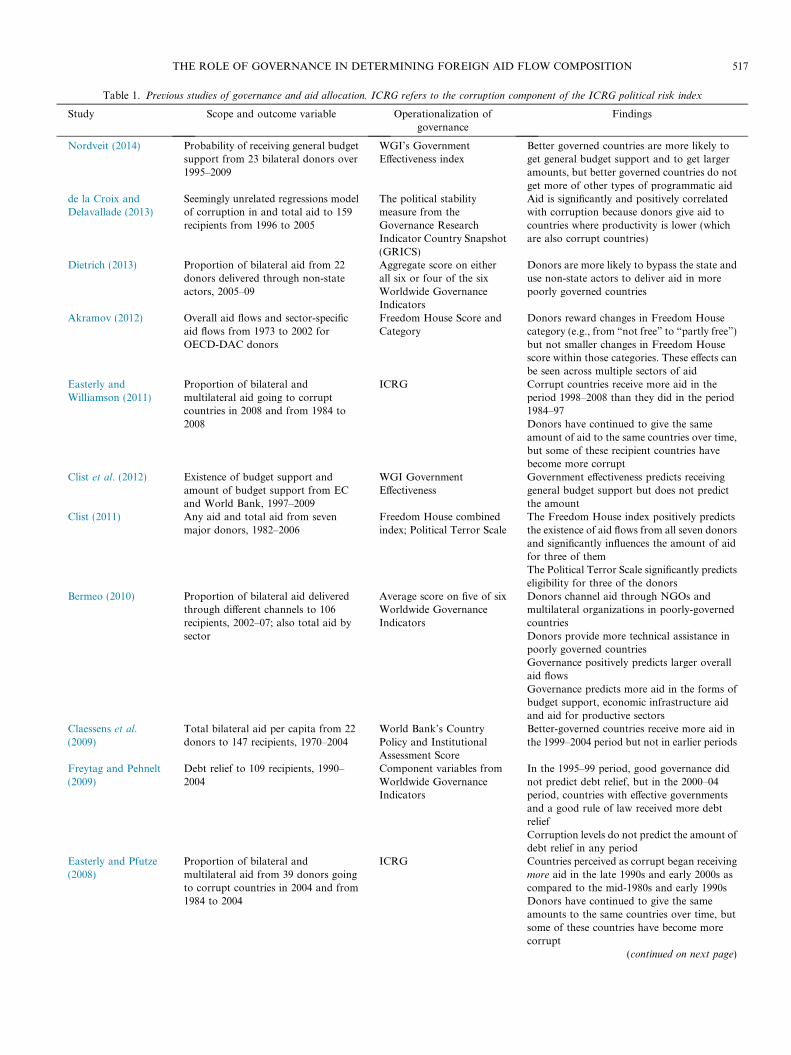
Table 1. Previous studies of governance and aid allocation. ICRG refers to the corruption component of the ICRG political risk index
Study Scope and outcome variable Operationalization ofgovernance
Findings
Nordveit (2014) Probability of receiving general budgetsupport from 23 bilateral donors over1995–2009
WGI’s GovernmentEffectiveness index
Better governed countries are more likely toget general budget support and to get largeramounts, but better governed countries do notget more of other types of programmatic aid
de la Croix andDelavallade (2013)
Seemingly unrelated regressions modelof corruption in and total aid to 159recipients from 1996 to 2005
The political stabilitymeasure from theGovernance ResearchIndicator Country Snapshot(GRICS)
Aid is significantly and positively correlatedwith corruption because donors give aid tocountries where productivity is lower (whichare also corrupt countries)
Dietrich (2013) Proportion of bilateral aid from 22donors delivered through non-stateactors, 2005–09
Aggregate score on eitherall six or four of the sixWorldwide GovernanceIndicators
Donors are more likely to bypass the state anduse non-state actors to deliver aid in morepoorly governed countries
Akramov (2012) Overall aid flows and sector-specificaid flows from 1973 to 2002 forOECD-DAC donors
Freedom House Score andCategory
Donors reward changes in Freedom Housecategory (e.g., from “not free” to “partly free”)but not smaller changes in Freedom Housescore within those categories. These effects canbe seen across multiple sectors of aid
Easterly andWilliamson (2011)
Proportion of bilateral andmultilateral aid going to corruptcountries in 2008 and from 1984 to2008
ICRG Corrupt countries receive more aid in theperiod 1998–2008 than they did in the period1984–97Donors have continued to give the sameamount of aid to the same countries over time,but some of these recipient countries havebecome more corrupt
Clist et al. (2012) Existence of budget support andamount of budget support from ECand World Bank, 1997–2009
WGI GovernmentEffectiveness
Government effectiveness predicts receivinggeneral budget support but does not predictthe amount
Clist (2011) Any aid and total aid from sevenmajor donors, 1982–2006
Freedom House combinedindex; Political Terror Scale
The Freedom House index positively predictsthe existence of aid flows from all seven donorsand significantly influences the amount of aidfor three of themThe Political Terror Scale significantly predictseligibility for three of the donors
Bermeo (2010) Proportion of bilateral aid deliveredthrough different channels to 106recipients, 2002–07; also total aid bysector
Average score on five of sixWorldwide GovernanceIndicators
Donors channel aid through NGOs andmultilateral organizations in poorly-governedcountriesDonors provide more technical assistance inpoorly governed countriesGovernance positively predicts larger overallaid flowsGovernance predicts more aid in the forms ofbudget support, economic infrastructure aidand aid for productive sectors
Claessens et al.(2009)
Total bilateral aid per capita from 22donors to 147 recipients, 1970–2004
World Bank’s CountryPolicy and InstitutionalAssessment Score
Better-governed countries receive more aid inthe 1999–2004 period but not in earlier periods
Freytag and Pehnelt(2009)
Debt relief to 109 recipients, 1990–2004
Component variables fromWorldwide GovernanceIndicators
In the 1995–99 period, good governance didnot predict debt relief, but in the 2000–04period, countries with effective governmentsand a good rule of law received more debtreliefCorruption levels do not predict the amount ofdebt relief in any period
Easterly and Pfutze(2008)
Proportion of bilateral andmultilateral aid from 39 donors goingto corrupt countries in 2004 and from1984 to 2004
ICRG Countries perceived as corrupt began receivingmore aid in the late 1990s and early 2000s ascompared to the mid-1980s and early 1990sDonors have continued to give the sameamounts to the same countries over time, butsome of these countries have become morecorrupt
(continued on next page)
THE ROLE OF GOVERNANCE IN DETERMINING FOREIGN AID FLOW COMPOSITION 517
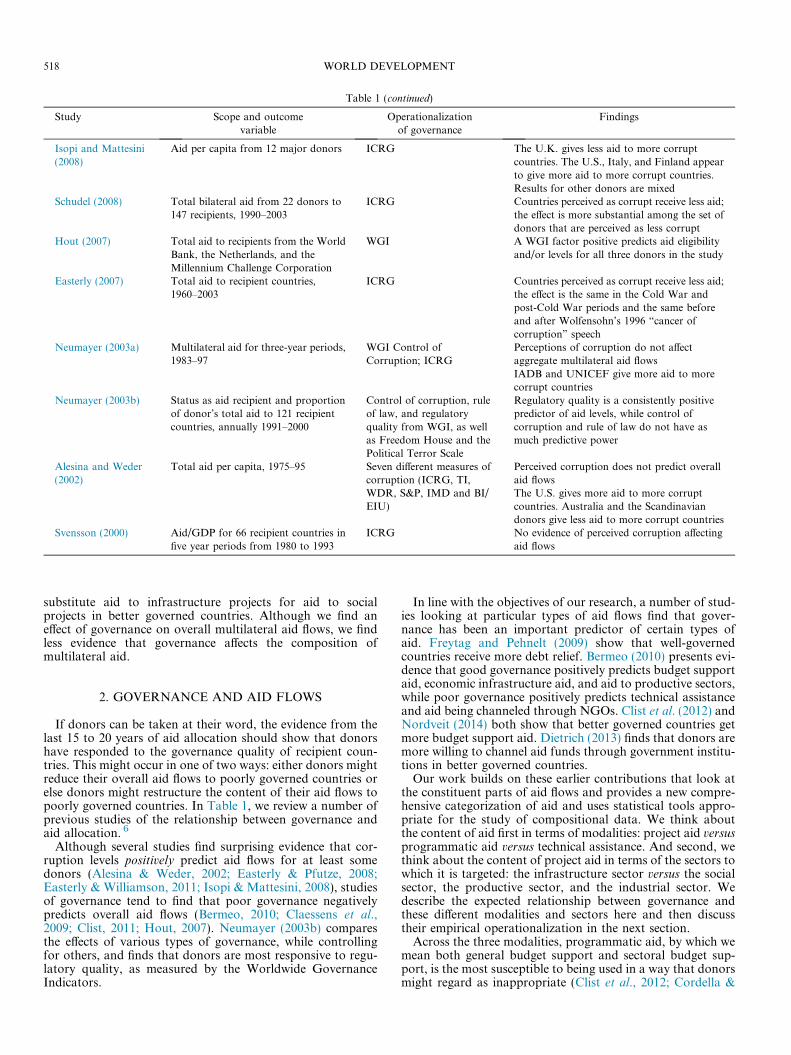
Table 1 (continued)
Study Scope and outcomevariable
Operationalizationof governance
Findings
Isopi and Mattesini(2008)
Aid per capita from 12 major donors ICRG The U.K. gives less aid to more corruptcountries. The U.S., Italy, and Finland appearto give more aid to more corrupt countries.Results for other donors are mixed
Schudel (2008) Total bilateral aid from 22 donors to147 recipients, 1990–2003
ICRG Countries perceived as corrupt receive less aid;the effect is more substantial among the set ofdonors that are perceived as less corrupt
Hout (2007) Total aid to recipients from the WorldBank, the Netherlands, and theMillennium Challenge Corporation
WGI A WGI factor positive predicts aid eligibilityand/or levels for all three donors in the study
Easterly (2007) Total aid to recipient countries,1960–2003
ICRG Countries perceived as corrupt receive less aid;the effect is the same in the Cold War andpost-Cold War periods and the same beforeand after Wolfensohn’s 1996 “cancer ofcorruption” speech
Neumayer (2003a) Multilateral aid for three-year periods,1983–97
WGI Control ofCorruption; ICRG
Perceptions of corruption do not affectaggregate multilateral aid flowsIADB and UNICEF give more aid to morecorrupt countries
Neumayer (2003b) Status as aid recipient and proportionof donor’s total aid to 121 recipientcountries, annually 1991–2000
Control of corruption, ruleof law, and regulatoryquality from WGI, as wellas Freedom House and thePolitical Terror Scale
Regulatory quality is a consistently positivepredictor of aid levels, while control ofcorruption and rule of law do not have asmuch predictive power
Alesina and Weder(2002)
Total aid per capita, 1975–95 Seven different measures ofcorruption (ICRG, TI,WDR, S&P, IMD and BI/EIU)
Perceived corruption does not predict overallaid flowsThe U.S. gives more aid to more corruptcountries. Australia and the Scandinaviandonors give less aid to more corrupt countries
Svensson (2000) Aid/GDP for 66 recipient countries infive year periods from 1980 to 1993
ICRG No evidence of perceived corruption affectingaid flows
518 WORLD DEVELOPMENT
substitute aid to infrastructure projects for aid to socialprojects in better governed countries. Although we find aneffect of governance on overall multilateral aid flows, we findless evidence that governance affects the composition ofmultilateral aid.
2. GOVERNANCE AND AID FLOWS
If donors can be taken at their word, the evidence from thelast 15 to 20 years of aid allocation should show that donorshave responded to the governance quality of recipient coun-tries. This might occur in one of two ways: either donors mightreduce their overall aid flows to poorly governed countries orelse donors might restructure the content of their aid flows topoorly governed countries. In Table 1, we review a number ofprevious studies of the relationship between governance andaid allocation. 6
Although several studies find surprising evidence that cor-ruption levels positively predict aid flows for at least somedonors (Alesina & Weder, 2002; Easterly & Pfutze, 2008;Easterly & Williamson, 2011; Isopi & Mattesini, 2008), studiesof governance tend to find that poor governance negativelypredicts overall aid flows (Bermeo, 2010; Claessens et al.,2009; Clist, 2011; Hout, 2007). Neumayer (2003b) comparesthe effects of various types of governance, while controllingfor others, and finds that donors are most responsive to regu-latory quality, as measured by the Worldwide GovernanceIndicators.
In line with the objectives of our research, a number of stud-ies looking at particular types of aid flows find that gover-nance has been an important predictor of certain types ofaid. Freytag and Pehnelt (2009) show that well-governedcountries receive more debt relief. Bermeo (2010) presents evi-dence that good governance positively predicts budget supportaid, economic infrastructure aid, and aid to productive sectors,while poor governance positively predicts technical assistanceand aid being channeled through NGOs. Clist et al. (2012) andNordveit (2014) both show that better governed countries getmore budget support aid. Dietrich (2013) finds that donors aremore willing to channel aid funds through government institu-tions in better governed countries.
Our work builds on these earlier contributions that look atthe constituent parts of aid flows and provides a new compre-hensive categorization of aid and uses statistical tools appro-priate for the study of compositional data. We think aboutthe content of aid first in terms of modalities: project aid versusprogrammatic aid versus technical assistance. And second, wethink about the content of project aid in terms of the sectors towhich it is targeted: the infrastructure sector versus the socialsector, the productive sector, and the industrial sector. Wedescribe the expected relationship between governance andthese different modalities and sectors here and then discusstheir empirical operationalization in the next section.
Across the three modalities, programmatic aid, by which wemean both general budget support and sectoral budget sup-port, is the most susceptible to being used in a way that donorsmight regard as inappropriate (Clist et al., 2012; Cordella &
THE ROLE OF GOVERNANCE IN DETERMINING FOREIGN AID FLOW COMPOSITION 519
Dell’Ariccia, 2007). 7 Although programmatic aid often comeswith a set of policy conditions attached to it, the limitationsput on the purposes for which the money can be used arefar less restrictive than for project aid or technical assistance,and the money may be provided without explicit monitoringand evaluation systems, making it harder to know whetherthe aid has been used for the purpose of development. At anextreme, various forms of budget support are susceptible togrand corruption in which government officials take directlyfrom the national budget in order to line their pockets(Berkman, 2008). In other cases, the use of weak countrysystems to implement development projects funded withprogrammatic aid may lead to waste and petty corruption. 8
As donors have the least control over how these types of trans-fers get spent by recipient governments, they should be lesslikely to use programmatic aid in poorly governed states.
Technical assistance projects – aid that is given to supportcapacity building and knowledge transfer – on the other hand,might be preferred in poorly governed countries for two rea-sons. First, donors have substantial control over technicalassistance, often directly contracting the firms that supplythe capacity building and thereby reducing implementationproblems linked to poor governance. 9 Second, the types ofcapacity building that are done under technical assistance pro-jects often aim at helping countries increase the quality of theirgovernance (Knack, 2001). 10 Both because these projects arethemselves less susceptible to problems originating in weakgovernance and because they are likely to assist in improvinggovernance overall, donors should be more likely to use themin poorly governed countries.
Project aid lies in between these two modalities. As com-pared to sectoral or general budget support, project aid morespecifically delineates the intended destination of the aid dol-lars and typically includes more donor control over the imple-mentation of the intervention financed by the aid and themonitoring and evaluation of that intervention. As comparedto technical assistance, the actual outputs of project aid areoften harder to observe and less likely to be directly contractedfrom the donor country, opening up the door to corruptionand other governance issues.
In addition to variation across modalities, we also hypothe-size that it will be possible to observe evidence of selectivitywith regard to donors’ choice of sectors for project aid. Whileprevious research has explored the ways in which donorsmight strategically use aid modalities vis-a-vis recipients atvarying levels of governance quality, our paper – along withBermeo (2010) – is one of the first to provide an explicit theoryof variation across sectors. 11 Large infrastructure projectsmay be particularly susceptible to governance problems, eitherto grand corruption (in which high-ranking officials who arenegotiating aid projects channel project funding to preferredcontractors and implementers) or to petty corruption (inwhich local-level project decisions are made with an eye toembezzlement or fraud). 12 These projects are also more diffi-cult to implement in countries lacking country systems capableof handling large-scale projects, meaning that there are greaterrisks of project failure in poorly governed recipient countries.Donors might attempt to address such problems through morerigorous negotiation of project design or through betterwithin-project anti-corruption monitoring, or as we proposehere, donors might adopt ex-ante, project-type selectivityand reduce the levels of infrastructure aid going to poorly gov-erned countries.
Large non-infrastructure projects (e.g., in the social sector)are also susceptible to both grand and petty corruption andto waste resulting from the poor oversight and monitoring
that is characteristic of poor-governance environments. How-ever, the opportunities for corruption and government wastein these types of projects are slightly reduced because pooroutcomes are more easily detectable. As compared to monitor-ing the costs and quality of inputs in a large infrastructure pro-ject, it is somewhat easier to monitor the delivery of medicinesor vaccines in a health sector project or the provision of teach-ers or textbooks in an education sector project. 13 While gov-ernance problems will still affect these projects, they are likelyto do so to a lesser extent than in infrastructure projects, sug-gesting that donors should be somewhat less reluctant to usesuch projects in poor-governance situations relative to infra-structure projects.
This will be the case to an even greater extent in those non-infrastructure projects that aim to stimulate specific economicactivity (which we call “productive sector” projects). Forinstance, funding for agricultural production or for the devel-opment of small- and medium-sized enterprises implies or cre-ates vested economic interests that want to protect theresources ostensibly being channeled in their direction(Winters, 2014). Certainly corruption and fraud do occur inforeign-funded development projects in these sectors, but theopportunities are less obvious and corrupt behavior is moreconstrained by the increased ease of monitoring outputs andoutcomes and the incentivizing of such monitoring by the cre-ation or identification of parties with a vested interest in pro-ject success.
Projects providing support to particular industries are evenless likely to suffer from corruption or governance-relatedimplementation problems for similar reasons: when foreignsupport is designed to benefit a particular set of business own-ers, a collective action problem that might otherwise preventbeneficiaries from monitoring a project or threatening sanc-tions can more easily be overcome improving the implementa-tion of these projects (Winters, 2014). Whereas the larger scaleprojects discussed above must be monitored by donors inorder to assure accurate use of funds, aid to the industrial sec-tor encourages monitoring by the recipient country businesseswho directly benefit from these projects. Therefore, we expectthese types of projects to be relatively immune from gover-nance problems, and we expect the propensity for donors tofund these types of projects therefore to be relatively lessaffected by the perceived governance quality of recipient coun-tries.
We summarize our expectations about the relationshipbetween recipient-country governance quality and donor pref-erences for using different types of development aid in Table 2.Note that we focus on development aid and therefore excludefrom our analysis humanitarian and emergency aid, whichemerge under special circumstances where donor decisionmaking may take on a different character, and also debt relief,which does not involve new aid flows and is therefore not sub-ject to governance-related implementation problems.
3. OPERATIONALIZING AID MODALITY ANDSECTOR
Our goal is to discover whether or not donors are selective interms of the types of aid that they provide to recipient coun-tries; we also look at selectivity in overall aid flows in the data-set that we construct. We use data on dyadic aid commitmentsduring 2004–10 as reported in AidData. We look at commit-ments data because we are interested in the decision-makingprocess within donor governments and aid agencies: we wantto see how they respond to perceived governance levels in
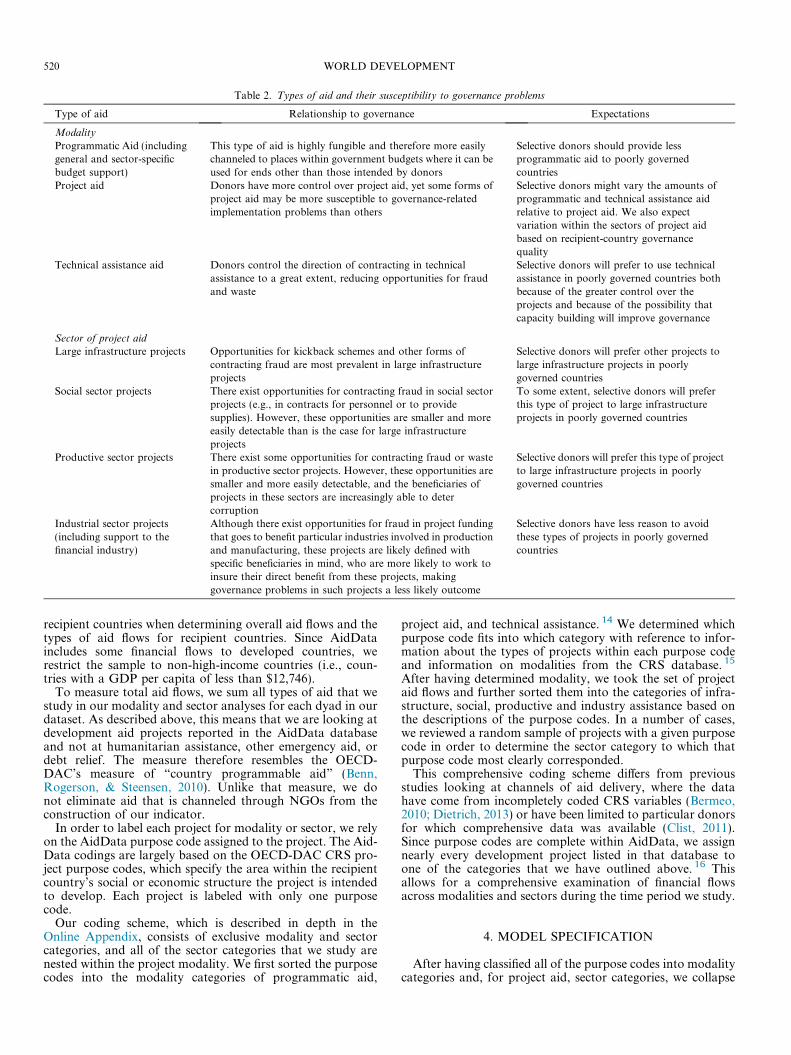
Table 2. Types of aid and their susceptibility to governance problems
Type of aid Relationship to governance Expectations
Modality
Programmatic Aid (includinggeneral and sector-specificbudget support)
This type of aid is highly fungible and therefore more easilychanneled to places within government budgets where it can beused for ends other than those intended by donors
Selective donors should provide lessprogrammatic aid to poorly governedcountries
Project aid Donors have more control over project aid, yet some forms ofproject aid may be more susceptible to governance-relatedimplementation problems than others
Selective donors might vary the amounts ofprogrammatic and technical assistance aidrelative to project aid. We also expectvariation within the sectors of project aidbased on recipient-country governancequality
Technical assistance aid Donors control the direction of contracting in technicalassistance to a great extent, reducing opportunities for fraudand waste
Selective donors will prefer to use technicalassistance in poorly governed countries bothbecause of the greater control over theprojects and because of the possibility thatcapacity building will improve governance
Sector of project aid
Large infrastructure projects Opportunities for kickback schemes and other forms ofcontracting fraud are most prevalent in large infrastructureprojects
Selective donors will prefer other projects tolarge infrastructure projects in poorlygoverned countries
Social sector projects There exist opportunities for contracting fraud in social sectorprojects (e.g., in contracts for personnel or to providesupplies). However, these opportunities are smaller and moreeasily detectable than is the case for large infrastructureprojects
To some extent, selective donors will preferthis type of project to large infrastructureprojects in poorly governed countries
Productive sector projects There exist some opportunities for contracting fraud or wastein productive sector projects. However, these opportunities aresmaller and more easily detectable, and the beneficiaries ofprojects in these sectors are increasingly able to detercorruption
Selective donors will prefer this type of projectto large infrastructure projects in poorlygoverned countries
Industrial sector projects(including support to thefinancial industry)
Although there exist opportunities for fraud in project fundingthat goes to benefit particular industries involved in productionand manufacturing, these projects are likely defined withspecific beneficiaries in mind, who are more likely to work toinsure their direct benefit from these projects, makinggovernance problems in such projects a less likely outcome
Selective donors have less reason to avoidthese types of projects in poorly governedcountries
520 WORLD DEVELOPMENT
recipient countries when determining overall aid flows and thetypes of aid flows for recipient countries. Since AidDataincludes some financial flows to developed countries, werestrict the sample to non-high-income countries (i.e., coun-tries with a GDP per capita of less than $12,746).
To measure total aid flows, we sum all types of aid that westudy in our modality and sector analyses for each dyad in ourdataset. As described above, this means that we are looking atdevelopment aid projects reported in the AidData databaseand not at humanitarian assistance, other emergency aid, ordebt relief. The measure therefore resembles the OECD-DAC’s measure of “country programmable aid” (Benn,Rogerson, & Steensen, 2010). Unlike that measure, we donot eliminate aid that is channeled through NGOs from theconstruction of our indicator.
In order to label each project for modality or sector, we relyon the AidData purpose code assigned to the project. The Aid-Data codings are largely based on the OECD-DAC CRS pro-ject purpose codes, which specify the area within the recipientcountry’s social or economic structure the project is intendedto develop. Each project is labeled with only one purposecode.
Our coding scheme, which is described in depth in theOnline Appendix, consists of exclusive modality and sectorcategories, and all of the sector categories that we study arenested within the project modality. We first sorted the purposecodes into the modality categories of programmatic aid,
project aid, and technical assistance. 14 We determined whichpurpose code fits into which category with reference to infor-mation about the types of projects within each purpose codeand information on modalities from the CRS database. 15
After having determined modality, we took the set of projectaid flows and further sorted them into the categories of infra-structure, social, productive and industry assistance based onthe descriptions of the purpose codes. In a number of cases,we reviewed a random sample of projects with a given purposecode in order to determine the sector category to which thatpurpose code most clearly corresponded.
This comprehensive coding scheme differs from previousstudies looking at channels of aid delivery, where the datahave come from incompletely coded CRS variables (Bermeo,2010; Dietrich, 2013) or have been limited to particular donorsfor which comprehensive data was available (Clist, 2011).Since purpose codes are complete within AidData, we assignnearly every development project listed in that database toone of the categories that we have outlined above. 16 Thisallows for a comprehensive examination of financial flowsacross modalities and sectors during the time period we study.
4. MODEL SPECIFICATION
After having classified all of the purpose codes into modalitycategories and, for project aid, sector categories, we collapse
THE ROLE OF GOVERNANCE IN DETERMINING FOREIGN AID FLOW COMPOSITION 521
the data to the donor-recipient-dyad level for the whole timeperiod, 2004–10. 17 Since our central concern is the composi-tion of aid flows, we restrict our analysis to dyads in whichpositive aid flows occur. 18 Like the outcome variables, theexplanatory variables are averaged over the seven-year periodfor each dyad. Given the long stretch of time represented byeach observation, we do not lag the explanatory variables.In all of our models, we include donor fixed effects, whichmeans that our coefficient estimates are based on within-donorcomparisons. The coefficients represent the average effect ofthe variables across all donors based on how recipient countrycharacteristics predict the relative aid flows that each donorgives to all recipient countries in its portfolio. 19 The fixedeffects are particularly important, since they account for indi-vidual donors’ heterogeneous propensity to give aid of onetype or another and also the variation in total aid providedby the different donors.
For the total aid analysis, we run a linear regression predict-ing the logarithm of the total aid amount. In the tradition ofprevious aid allocation studies, we log-transform the outcomevariable in order to address skewness in the distribution. Asdescribed above, we study only dyads where there are positiveaid transfers. Our results tell us how recipient-country gover-nance affects total aid amounts among the set of donor-recipi-ent dyads where a decision has been made to transfer aid. Ifdonors are selective in terms of overall aid allocation, thenpoor governance should reduce the amount of aid receivedby any given country. In the Online Appendix, we provideresults from the selection stage and show there that gover-nance is not one of the factors predicting whether a given reci-pient receives any aid at all from a donor.
Next, we model as a function of recipient-country governancethe number of modalities through which and the number of sec-tors to which each donor provides aid. The outcome variablehere is a count variable that varies from 1 to 3 for the modalitiesanalysis and 1 to 4 for the sectors analysis. We ideally wouldmodel the distribution of the outcome variable using an orderedlogistic regression. However, ordered logistic regression modelsare inconsistent in the presence of fixed effects, and we believethat controlling for donor heterogeneity using fixed effects isessential. Therefore, we again use linear regression models withdonor fixed effects to estimate the average effect of governanceacross all donors on the number of modalities through whichand the number of sectors to which a donor provides aid. Ifdonors are selective, they should give aid through all modalitiesand to all sectors in recipients with high-quality governance;therefore, we would consider a positive relationship betweengovernance and the number of modalities or sectors as evidenceof donor selectivity. 20
In this analysis, the outcomes are jointly determined withthe total amount of aid. That is, as the total amount of aidincreases, we expect the likelihood of observing a larger num-ber of types of aid to increase, and similarly, as the number oftypes of aid increase, we expect overall aid flows to be larger.This might suggest controlling for the total size of the donor-recipient aid portfolio in each dyad when looking at the diver-sity of modalities and sectors as outcomes. Doing so, however,introduces simultaneity bias into the estimation. We thereforeopt to estimate reduced form equations in which exogenousvariables predict each of the two related outcomes and tothink of the reduced-form parameter estimates as representinglong-run multiplier effects (see the discussion in Kennedy,2003, chap. 10). While our models do not let us say whichincreases first – the total amount of aid or the diversity ofaid flows – they provide evidence that both are responsive togovernance quality.
In our final analysis, we use compositional data analysis(Aitchison, 1986; Dietrich, 2013; Katz and King, 1999;Pawlowsky-Glahn & Buccianti, 2011) to model the impactof recipient-country governance on the relative amounts ofaid given across modalities and across sectors. Compositionaldata analysis has been used in the earth sciences to model thecomposition of rocks, in political science to model the distri-bution of voting returns in multiparty elections, and in eco-nomics to measure the distribution of householdexpenditures. Compositional data analysis explicitly takes intoaccount the fact that the observed proportions of differentcomponents of a whole must sum to unity and thereforerestricts the space that the related outcome variables canoccupy to the unit simplex. Since we are interested in the dis-tribution of an overall aid flow into a set of component parts,these models are particularly valuable for understanding thedata that we are studying, and the use of standard linearregression models predicting a total amount or an untrans-formed ratio might lead to biased inferences. 21
For the compositional data analysis, we create a set of log-ratio variables that describe the prevalence of all other types ofaid relative to one baseline type of aid. That is, for eachoutcome i except for one particular outcome j, the outcomevariable is specified as:
logyi
yj
!
The resulting vector of outcomes
y ¼ logy1
yj
!; log
y2
yj
!; . . . ; log
yj�1
yj
!( )
recognizes the joint determination of the distribution of sharesacross categories and ensures the possibility of mapping fromthe outcome space to the unit simplex. In our particular case,we recognize that the proportional composition of aid flows interms of the three modalities or four sectors is jointly deter-mined and must sum to one. Once the outcome variables havebeen defined in log-ratio terms, they can be analyzed usingstandard linear regression techniques, including fixed effects.Therefore, we run a series of models where for each categoryof aid i,
logyi
yj
!dr
¼ aþ X drbþ dd þ �dr
where b is a vector of coefficients associated with a matrix ofrecipient-specific or dyad-specific predictors Xdr, dd is a set ofdonor fixed effects, and edr is a normally-distributed errorterm.
If the outcome variables were specified as a fraction of thewhole, rather than relative to a base category, the predictedvalues for any given dyad might sum to more or less thanone. If an untransformed fraction was used as the outcomevariable, the predicted values for any given category mightbe outside the [0, 1] range. Therefore, the correct specificationfor compositional data analysis is with the logarithm of theratio of two of the components of a mixture as the outcomevariable.
For these compositional data models, we first limit the sam-ple to those dyads where either all modalities of aid or all typesof project aid are present. By doing this, we avoid having tomake any strong assumptions about the zero values thatotherwise would be undefined in the log-ratio outcome vari-ables. From these analyses, we can generalize about donor
522 WORLD DEVELOPMENT
behavior in the set of “comprehensive dyads” where all modal-ities or sectors of aid are present. We then extend the analysisto include dyads where some of the aid flows may be zero for agiven modality or sector. We substitute the smallest observedvalue for a given log-ratio for these zero values. 22 In this sec-ond set of models, although we move beyond comprehensivedyads, we still limit the sample to “comprehensive donors,”those donors who use all three modalities or who provide pro-ject aid in all four sectors, such that we can reasonably assumethat they might have provided aid using a given modality or toa given sector in any recipient in their portfolio but made adecision not to do so for the particular recipient where a zerovalue is observed.
We have structured our analysis to look at bilateral andmultilateral donors separately because we believe that decisionmaking across these two types of donors might be different(Girod, 2008; Maizels & Nissanke, 1984; Martens,Mummert, Murrell, & Seabright, 2002; Rodrik, 1995) andbecause some of the variables that are available for bilateraldonor-recipient dyads are not available for multilateraldonor-recipient dyads. In the Online Appendix, we present apreliminary disaggregation of the main results to the level ofindividual donors; we believe that exploring differences acrossdonors is an important direction for future research.
We use the same set of explanatory variables across all mod-els (with some differences across models for bilateral and mul-tilateral donors). Our key explanatory variable is the level ofperceived governance in the recipient countries. We operation-alize this variable using an average of the six Worldwide Gov-ernance Indicators. The variable measures “the traditions andinstitutions by which authority in a country is exercised”,which “includes the process by which governments areselected, monitored, and replaced; the capacity of the govern-ment to effectively formulate and implement sound policies;and the respect of citizens and the state for the institutions thatgovern economic and social interactions among them”(Kaufmann, Kraay, & Mastruzzi, 2009, p. 5). This measureshould capture how donors view recipient countries and thelikelihood of aid to those countries falling prey to mishandlingand poor implementation. It is worth noting that the World-wide Governance Indicators are explicitly used by donors,both in aid allocation formulas and also in discussions of reci-pient country deservingness (Hout, 2007).
We control for GDP per capita PPP, the most commonproxy for a country’s level of development, as a potential con-founder that might result in spurious correlation between gov-ernance and aid. Cross-country work on governance robustlyconcludes that poorer countries are more corrupt and morepoorly governed (e.g., Acemoglu, Johnson, & Robinson,2001; Montinola & Jackman, 2002; Svensson, 2005;Treisman, 2000, 2007). As poorer countries might also havedifferent developmental needs, it is crucial to include thiscovariate as a control. Similarly, we control for populationbecause of the possibility that perceptions of governancemight correlate with a country’s population and because ofthe likely fact that countries with large populations requiremore aid and different portfolios of aid than do countries withsmall populations. 23 For these variables, we take the loga-rithm of the original variables, as is common elsewhere inthe aid allocation literature (e.g., Akramov, 2012; Clist,2011; Neumayer, 2003b), in order to address skewness in thedistributions and because we believe that changes in the out-come variables will be proportional to changes in these keypredictors.
We also control for the investment rate and the level ofexternal debt for efficiency reasons. A low investment rate cer-
tainly indicates a general need for foreign assistance – as sug-gested in the classic “financing gap” models justifying foreignaid (e.g., Chenery & Strout, 1966) – and also may indicateneed for particular types of foreign assistance. We operation-alize this variable as the ratio of investment to GDP. 24 Simi-larly, a high external debt ratio should increase a country’sneed for foreign assistance and also might affect the composi-tion of a country’s foreign aid portfolio (by encouraging moreprogrammatic aid, in particular); therefore, we include theratio of total external debt to GDP in our main specifica-tion. 25
There may be some concern that investment and debt are“post-treatment” variables relative to governance. That is, ifpoor governance within a country causes either low rates ofinvestment (see Campos, Lien, & Pradhan, 1999, for example)or else high levels of external debt because of high governmentspending motivated by corruption or caused by waste, thenthese variables may be taking on the values that they dobecause of the quality of governance in the country. However,since we are estimating coefficients that reflect how donorcountries respond to observable characteristics of recipientcountries, we are not worried about this fact introducing biasinto our estimates. 26 Even if governance is affecting invest-ment and debt during the period that we study, donors none-theless are still observing the realized levels of all variables andmaking aid allocation and composition decisions based onthose observed country characteristics.
Much of the literature on aid allocation has emphasized thereasons why donors are not selective in choosing beneficiariesor the level of funding that is reaching them. As McKinlay andLittle (e.g., 1977, 1978, 1979) proposed, donors might either beresponsive to recipient needs (most commonly operationalizedas GDP per capita) or else their own strategic interests (i.e.,geopolitical, military, or commercial objectives). Papers con-sistently find that donor interest plays a substantial role indetermining overall aid flows (e.g., Alesina & Dollar, 2000;Bueno de Mesquita & Smith, 2007, 2009; Dreher et al.,2009; Fleck & Kilby, 2010). Donor strategic interests mightalso affect the composition of aid portfolios: for instance,donors might prefer channeling quick-disbursing, highly-fun-gible programmatic aid to allies, or they might prefer provid-ing commerce-facilitating infrastructure projects to tradepartners. For our analyses of bilateral donors, we includethree “strategic interest” variables that are prominent in theliterature: the logarithm of the average annual dollar amountof bilateral trade (as a measure of commercial ties), 27 an indi-cator for the existence of a formal military alliance (as a mea-sure of military ties), 28 and an indicator for whether or not therecipient was a colony of the donor (which has proved consis-tently statistically significant in past studies (e.g., Alesina &
Dollar, 2000)). 29 For our analysis of multilateral donors, weinclude one control variable representing whether or not theaid recipient was a colony of any of the Western powers.
5. RESULTS: EVIDENCE OF DONOR SELECTIVITY INCHOOSING THE AMOUNT AND TYPE OF AID
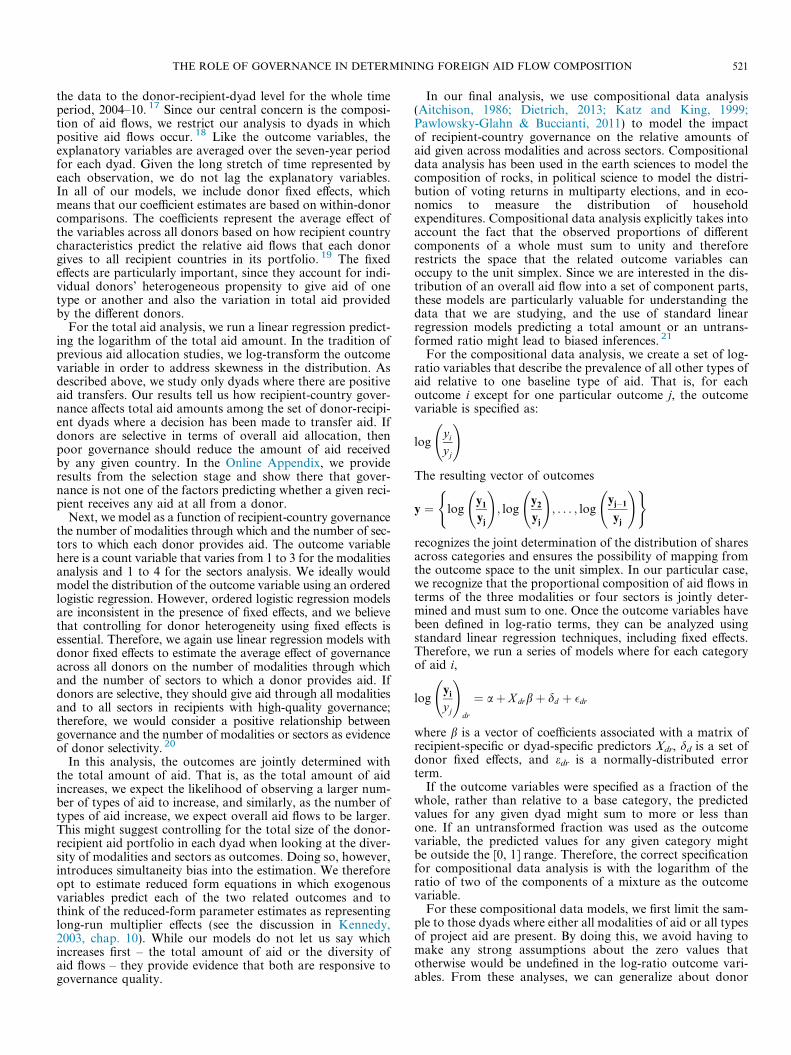
Table 3 presents our results with regard to overall aid flows.The coefficients are from linear regression models with donorfixed effects where the outcome variable is measured as the logof total aid committed over the entire 2004–10 period in agiven dyad. The first column shows the average effect of theexplanatory variables across 41 bilateral donors, and the sec-ond column across 39 multilateral donors. For both bilateraland multilateral donors, better governance significantly
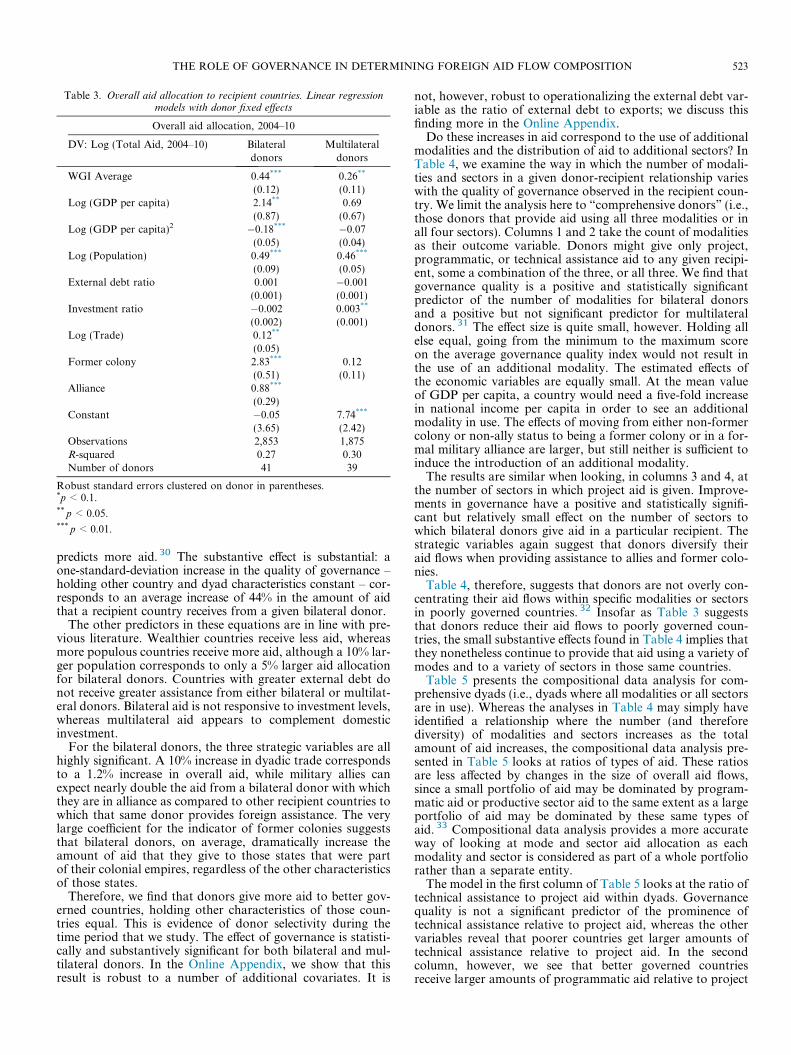
Table 3. Overall aid allocation to recipient countries. Linear regressionmodels with donor fixed effects
Overall aid allocation, 2004–10
DV: Log (Total Aid, 2004–10) Bilateraldonors
Multilateraldonors
WGI Average 0.44*** 0.26**
(0.12) (0.11)Log (GDP per capita) 2.14** 0.69
(0.87) (0.67)Log (GDP per capita)2 �0.18*** �0.07
(0.05) (0.04)Log (Population) 0.49*** 0.46***
(0.09) (0.05)External debt ratio 0.001 �0.001
(0.001) (0.001)Investment ratio �0.002 0.003**
(0.002) (0.001)Log (Trade) 0.12**
(0.05)Former colony 2.83*** 0.12
(0.51) (0.11)Alliance 0.88***
(0.29)Constant �0.05 7.74***
(3.65) (2.42)Observations 2,853 1,875R-squared 0.27 0.30Number of donors 41 39
Robust standard errors clustered on donor in parentheses.*p < 0.1.** p < 0.05.*** p < 0.01.
THE ROLE OF GOVERNANCE IN DETERMINING FOREIGN AID FLOW COMPOSITION 523
predicts more aid. 30 The substantive effect is substantial: aone-standard-deviation increase in the quality of governance –holding other country and dyad characteristics constant – cor-responds to an average increase of 44% in the amount of aidthat a recipient country receives from a given bilateral donor.
The other predictors in these equations are in line with pre-vious literature. Wealthier countries receive less aid, whereasmore populous countries receive more aid, although a 10% lar-ger population corresponds to only a 5% larger aid allocationfor bilateral donors. Countries with greater external debt donot receive greater assistance from either bilateral or multilat-eral donors. Bilateral aid is not responsive to investment levels,whereas multilateral aid appears to complement domesticinvestment.
For the bilateral donors, the three strategic variables are allhighly significant. A 10% increase in dyadic trade correspondsto a 1.2% increase in overall aid, while military allies canexpect nearly double the aid from a bilateral donor with whichthey are in alliance as compared to other recipient countries towhich that same donor provides foreign assistance. The verylarge coefficient for the indicator of former colonies suggeststhat bilateral donors, on average, dramatically increase theamount of aid that they give to those states that were partof their colonial empires, regardless of the other characteristicsof those states.
Therefore, we find that donors give more aid to better gov-erned countries, holding other characteristics of those coun-tries equal. This is evidence of donor selectivity during thetime period that we study. The effect of governance is statisti-cally and substantively significant for both bilateral and mul-tilateral donors. In the Online Appendix, we show that thisresult is robust to a number of additional covariates. It is
not, however, robust to operationalizing the external debt var-iable as the ratio of external debt to exports; we discuss thisfinding more in the Online Appendix.
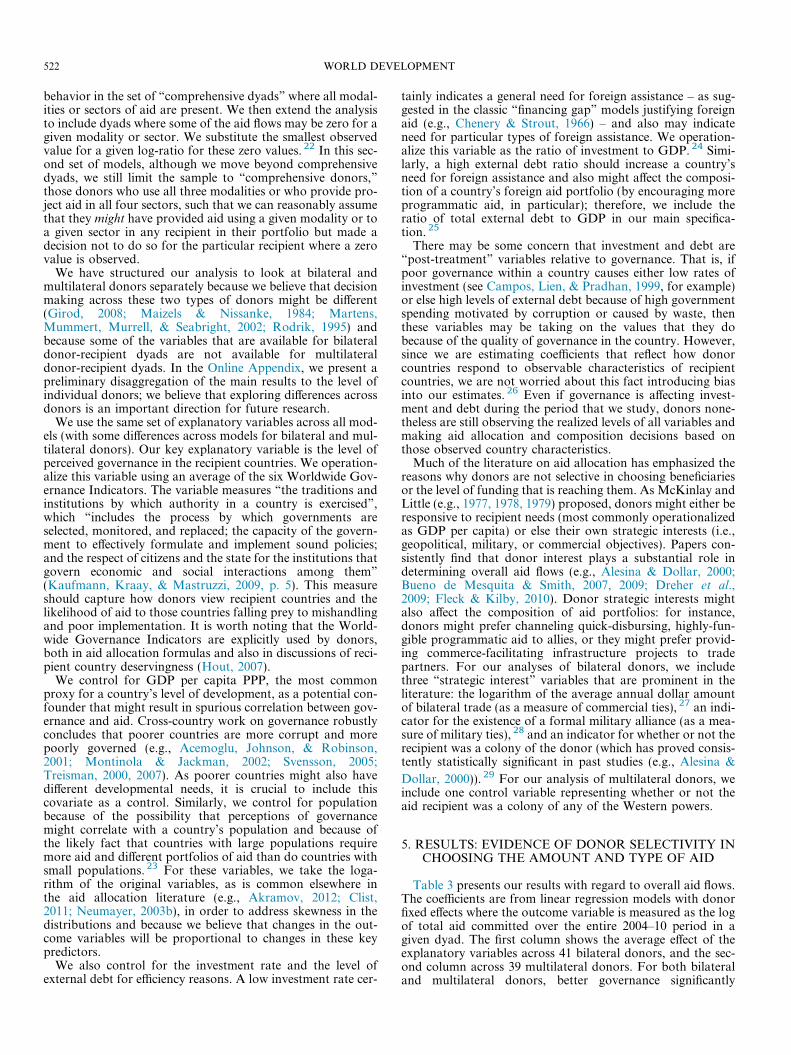
Do these increases in aid correspond to the use of additionalmodalities and the distribution of aid to additional sectors? InTable 4, we examine the way in which the number of modali-ties and sectors in a given donor-recipient relationship varieswith the quality of governance observed in the recipient coun-try. We limit the analysis here to “comprehensive donors” (i.e.,those donors that provide aid using all three modalities or inall four sectors). Columns 1 and 2 take the count of modalitiesas their outcome variable. Donors might give only project,programmatic, or technical assistance aid to any given recipi-ent, some a combination of the three, or all three. We find thatgovernance quality is a positive and statistically significantpredictor of the number of modalities for bilateral donorsand a positive but not significant predictor for multilateraldonors. 31 The effect size is quite small, however. Holding allelse equal, going from the minimum to the maximum scoreon the average governance quality index would not result inthe use of an additional modality. The estimated effects ofthe economic variables are equally small. At the mean valueof GDP per capita, a country would need a five-fold increasein national income per capita in order to see an additionalmodality in use. The effects of moving from either non-formercolony or non-ally status to being a former colony or in a for-mal military alliance are larger, but still neither is sufficient toinduce the introduction of an additional modality.
The results are similar when looking, in columns 3 and 4, atthe number of sectors in which project aid is given. Improve-ments in governance have a positive and statistically signifi-cant but relatively small effect on the number of sectors towhich bilateral donors give aid in a particular recipient. Thestrategic variables again suggest that donors diversify theiraid flows when providing assistance to allies and former colo-nies.
Table 4, therefore, suggests that donors are not overly con-centrating their aid flows within specific modalities or sectorsin poorly governed countries. 32 Insofar as Table 3 suggeststhat donors reduce their aid flows to poorly governed coun-tries, the small substantive effects found in Table 4 implies thatthey nonetheless continue to provide that aid using a variety ofmodes and to a variety of sectors in those same countries.
Table 5 presents the compositional data analysis for com-prehensive dyads (i.e., dyads where all modalities or all sectorsare in use). Whereas the analyses in Table 4 may simply haveidentified a relationship where the number (and thereforediversity) of modalities and sectors increases as the totalamount of aid increases, the compositional data analysis pre-sented in Table 5 looks at ratios of types of aid. These ratiosare less affected by changes in the size of overall aid flows,since a small portfolio of aid may be dominated by program-matic aid or productive sector aid to the same extent as a largeportfolio of aid may be dominated by these same types ofaid. 33 Compositional data analysis provides a more accurateway of looking at mode and sector aid allocation as eachmodality and sector is considered as part of a whole portfoliorather than a separate entity.
The model in the first column of Table 5 looks at the ratio oftechnical assistance to project aid within dyads. Governancequality is not a significant predictor of the prominence oftechnical assistance relative to project aid, whereas the othervariables reveal that poorer countries get larger amounts oftechnical assistance relative to project aid. In the secondcolumn, however, we see that better governed countriesreceive larger amounts of programmatic aid relative to project
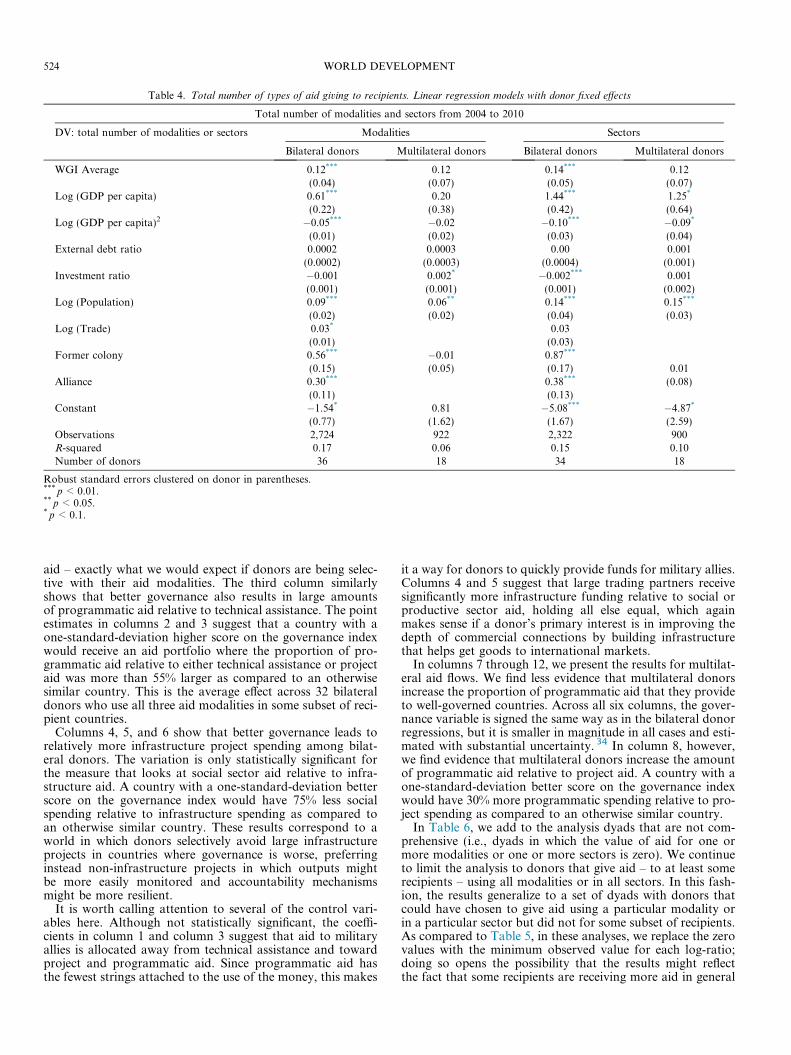
Table 4. Total number of types of aid giving to recipients. Linear regression models with donor fixed effects
Total number of modalities and sectors from 2004 to 2010
DV: total number of modalities or sectors Modalities Sectors
Bilateral donors Multilateral donors Bilateral donors Multilateral donors
WGI Average 0.12*** 0.12 0.14*** 0.12(0.04) (0.07) (0.05) (0.07)
Log (GDP per capita) 0.61*** 0.20 1.44*** 1.25*
(0.22) (0.38) (0.42) (0.64)Log (GDP per capita)2 �0.05*** �0.02 �0.10*** �0.09*
(0.01) (0.02) (0.03) (0.04)External debt ratio 0.0002 0.0003 0.00 0.001
(0.0002) (0.0003) (0.0004) (0.001)Investment ratio �0.001 0.002* �0.002*** 0.001
(0.001) (0.001) (0.001) (0.002)Log (Population) 0.09*** 0.06** 0.14*** 0.15***
(0.02) (0.02) (0.04) (0.03)Log (Trade) 0.03* 0.03
(0.01) (0.03)Former colony 0.56*** �0.01 0.87***
(0.15) (0.05) (0.17) 0.01Alliance 0.30*** 0.38*** (0.08)
(0.11) (0.13)Constant �1.54* 0.81 �5.08*** �4.87*
(0.77) (1.62) (1.67) (2.59)Observations 2,724 922 2,322 900R-squared 0.17 0.06 0.15 0.10Number of donors 36 18 34 18
Robust standard errors clustered on donor in parentheses.*** p < 0.01.** p < 0.05.* p < 0.1.
524 WORLD DEVELOPMENT
aid – exactly what we would expect if donors are being selec-tive with their aid modalities. The third column similarlyshows that better governance also results in large amountsof programmatic aid relative to technical assistance. The pointestimates in columns 2 and 3 suggest that a country with aone-standard-deviation higher score on the governance indexwould receive an aid portfolio where the proportion of pro-grammatic aid relative to either technical assistance or projectaid was more than 55% larger as compared to an otherwisesimilar country. This is the average effect across 32 bilateraldonors who use all three aid modalities in some subset of reci-pient countries.
Columns 4, 5, and 6 show that better governance leads torelatively more infrastructure project spending among bilat-eral donors. The variation is only statistically significant forthe measure that looks at social sector aid relative to infra-structure aid. A country with a one-standard-deviation betterscore on the governance index would have 75% less socialspending relative to infrastructure spending as compared toan otherwise similar country. These results correspond to aworld in which donors selectively avoid large infrastructureprojects in countries where governance is worse, preferringinstead non-infrastructure projects in which outputs mightbe more easily monitored and accountability mechanismsmight be more resilient.
It is worth calling attention to several of the control vari-ables here. Although not statistically significant, the coeffi-cients in column 1 and column 3 suggest that aid to militaryallies is allocated away from technical assistance and towardproject and programmatic aid. Since programmatic aid hasthe fewest strings attached to the use of the money, this makes
it a way for donors to quickly provide funds for military allies.Columns 4 and 5 suggest that large trading partners receivesignificantly more infrastructure funding relative to social orproductive sector aid, holding all else equal, which againmakes sense if a donor’s primary interest is in improving thedepth of commercial connections by building infrastructurethat helps get goods to international markets.
In columns 7 through 12, we present the results for multilat-eral aid flows. We find less evidence that multilateral donorsincrease the proportion of programmatic aid that they provideto well-governed countries. Across all six columns, the gover-nance variable is signed the same way as in the bilateral donorregressions, but it is smaller in magnitude in all cases and esti-mated with substantial uncertainty. 34 In column 8, however,we find evidence that multilateral donors increase the amountof programmatic aid relative to project aid. A country with aone-standard-deviation better score on the governance indexwould have 30% more programmatic spending relative to pro-ject spending as compared to an otherwise similar country.
In Table 6, we add to the analysis dyads that are not com-prehensive (i.e., dyads in which the value of aid for one ormore modalities or one or more sectors is zero). We continueto limit the analysis to donors that give aid – to at least somerecipients – using all modalities or in all sectors. In this fash-ion, the results generalize to a set of dyads with donors thatcould have chosen to give aid using a particular modality orin a particular sector but did not for some subset of recipients.As compared to Table 5, in these analyses, we replace the zerovalues with the minimum observed value for each log-ratio;doing so opens the possibility that the results might reflectthe fact that some recipients are receiving more aid in general
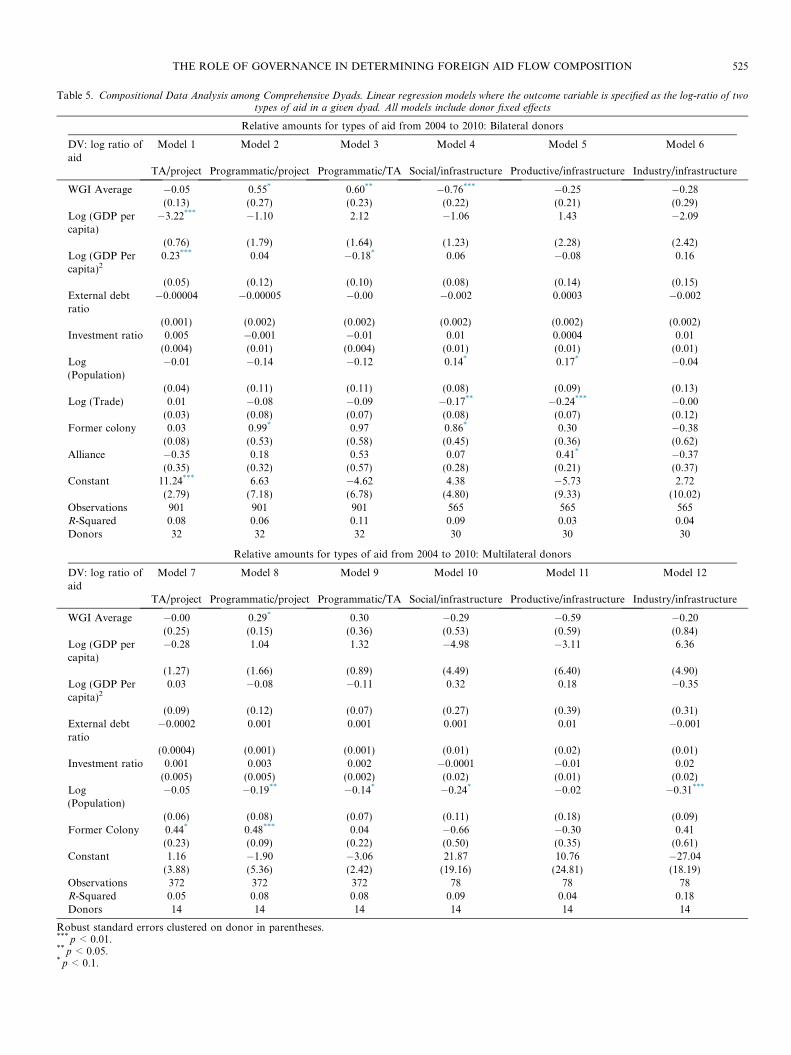
Table 5. Compositional Data Analysis among Comprehensive Dyads. Linear regression models where the outcome variable is specified as the log-ratio of twotypes of aid in a given dyad. All models include donor fixed effects
Relative amounts for types of aid from 2004 to 2010: Bilateral donors
DV: log ratio ofaid
Model 1 Model 2 Model 3 Model 4 Model 5 Model 6
TA/project Programmatic/project Programmatic/TA Social/infrastructure Productive/infrastructure Industry/infrastructure
WGI Average �0.05 0.55* 0.60** �0.76*** �0.25 �0.28(0.13) (0.27) (0.23) (0.22) (0.21) (0.29)
Log (GDP percapita)
�3.22*** �1.10 2.12 �1.06 1.43 �2.09
(0.76) (1.79) (1.64) (1.23) (2.28) (2.42)Log (GDP Percapita)2
0.23*** 0.04 �0.18* 0.06 �0.08 0.16
(0.05) (0.12) (0.10) (0.08) (0.14) (0.15)External debtratio
�0.00004 �0.00005 �0.00 �0.002 0.0003 �0.002
(0.001) (0.002) (0.002) (0.002) (0.002) (0.002)Investment ratio 0.005 �0.001 �0.01 0.01 0.0004 0.01
(0.004) (0.01) (0.004) (0.01) (0.01) (0.01)Log(Population)
�0.01 �0.14 �0.12 0.14* 0.17* �0.04
(0.04) (0.11) (0.11) (0.08) (0.09) (0.13)Log (Trade) 0.01 �0.08 �0.09 �0.17** �0.24*** �0.00
(0.03) (0.08) (0.07) (0.08) (0.07) (0.12)Former colony 0.03 0.99* 0.97 0.86* 0.30 �0.38
(0.08) (0.53) (0.58) (0.45) (0.36) (0.62)Alliance �0.35 0.18 0.53 0.07 0.41* �0.37
(0.35) (0.32) (0.57) (0.28) (0.21) (0.37)Constant 11.24*** 6.63 �4.62 4.38 �5.73 2.72
(2.79) (7.18) (6.78) (4.80) (9.33) (10.02)Observations 901 901 901 565 565 565R-Squared 0.08 0.06 0.11 0.09 0.03 0.04Donors 32 32 32 30 30 30
Relative amounts for types of aid from 2004 to 2010: Multilateral donors
DV: log ratio ofaid
Model 7 Model 8 Model 9 Model 10 Model 11 Model 12
TA/project Programmatic/project Programmatic/TA Social/infrastructure Productive/infrastructure Industry/infrastructure
WGI Average �0.00 0.29* 0.30 �0.29 �0.59 �0.20(0.25) (0.15) (0.36) (0.53) (0.59) (0.84)
Log (GDP percapita)
�0.28 1.04 1.32 �4.98 �3.11 6.36
(1.27) (1.66) (0.89) (4.49) (6.40) (4.90)Log (GDP Percapita)2
0.03 �0.08 �0.11 0.32 0.18 �0.35
(0.09) (0.12) (0.07) (0.27) (0.39) (0.31)External debtratio
�0.0002 0.001 0.001 0.001 0.01 �0.001
(0.0004) (0.001) (0.001) (0.01) (0.02) (0.01)Investment ratio 0.001 0.003 0.002 �0.0001 �0.01 0.02
(0.005) (0.005) (0.002) (0.02) (0.01) (0.02)Log(Population)
�0.05 �0.19** �0.14* �0.24* �0.02 �0.31***
(0.06) (0.08) (0.07) (0.11) (0.18) (0.09)Former Colony 0.44* 0.48*** 0.04 �0.66 �0.30 0.41
(0.23) (0.09) (0.22) (0.50) (0.35) (0.61)Constant 1.16 �1.90 �3.06 21.87 10.76 �27.04
(3.88) (5.36) (2.42) (19.16) (24.81) (18.19)Observations 372 372 372 78 78 78R-Squared 0.05 0.08 0.08 0.09 0.04 0.18Donors 14 14 14 14 14 14
Robust standard errors clustered on donor in parentheses.*** p < 0.01.** p < 0.05.* p < 0.1.
THE ROLE OF GOVERNANCE IN DETERMINING FOREIGN AID FLOW COMPOSITION 525
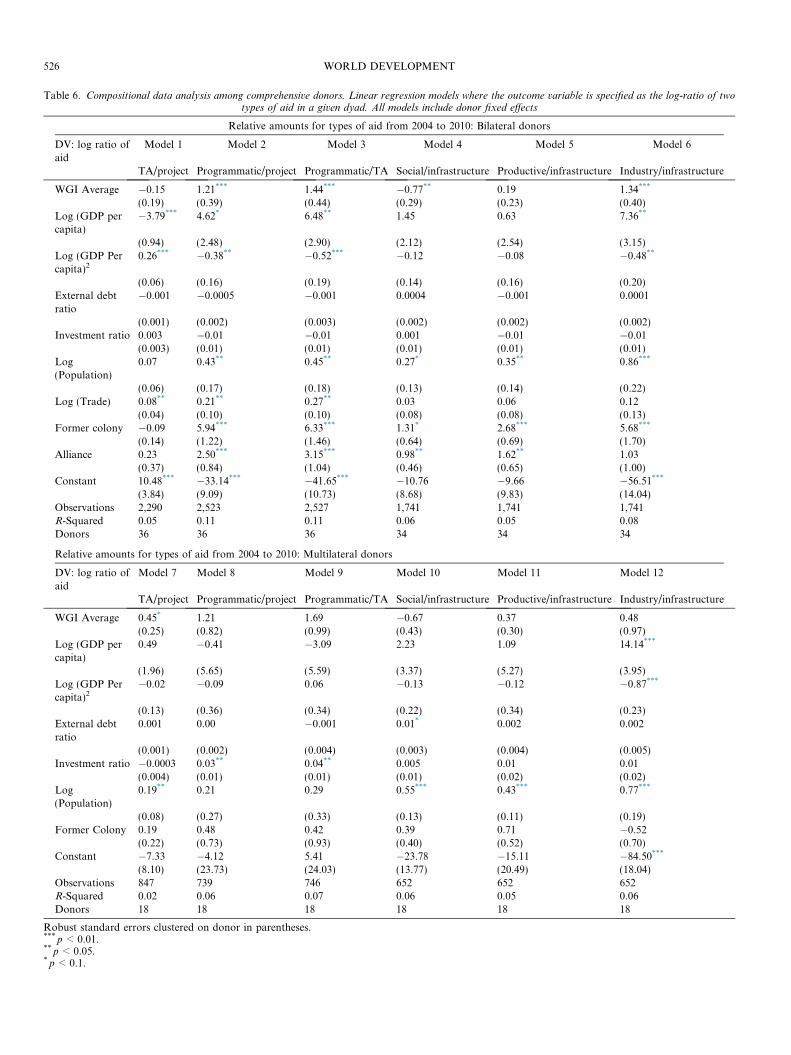
Table 6. Compositional data analysis among comprehensive donors. Linear regression models where the outcome variable is specified as the log-ratio of twotypes of aid in a given dyad. All models include donor fixed effects
Relative amounts for types of aid from 2004 to 2010: Bilateral donors
DV: log ratio ofaid
Model 1 Model 2 Model 3 Model 4 Model 5 Model 6
TA/project Programmatic/project Programmatic/TA Social/infrastructure Productive/infrastructure Industry/infrastructure
WGI Average �0.15 1.21*** 1.44*** �0.77** 0.19 1.34***
(0.19) (0.39) (0.44) (0.29) (0.23) (0.40)Log (GDP percapita)
�3.79*** 4.62* 6.48** 1.45 0.63 7.36**
(0.94) (2.48) (2.90) (2.12) (2.54) (3.15)Log (GDP Percapita)2
0.26*** �0.38** �0.52*** �0.12 �0.08 �0.48**
(0.06) (0.16) (0.19) (0.14) (0.16) (0.20)External debtratio
�0.001 �0.0005 �0.001 0.0004 �0.001 0.0001
(0.001) (0.002) (0.003) (0.002) (0.002) (0.002)Investment ratio 0.003 �0.01 �0.01 0.001 �0.01 �0.01
(0.003) (0.01) (0.01) (0.01) (0.01) (0.01)Log(Population)
0.07 0.43** 0.45** 0.27* 0.35** 0.86***
(0.06) (0.17) (0.18) (0.13) (0.14) (0.22)Log (Trade) 0.08** 0.21** 0.27** 0.03 0.06 0.12
(0.04) (0.10) (0.10) (0.08) (0.08) (0.13)Former colony �0.09 5.94*** 6.33*** 1.31* 2.68*** 5.68***
(0.14) (1.22) (1.46) (0.64) (0.69) (1.70)Alliance 0.23 2.50*** 3.15*** 0.98** 1.62** 1.03
(0.37) (0.84) (1.04) (0.46) (0.65) (1.00)Constant 10.48*** �33.14*** �41.65*** �10.76 �9.66 �56.51***
(3.84) (9.09) (10.73) (8.68) (9.83) (14.04)Observations 2,290 2,523 2,527 1,741 1,741 1,741R-Squared 0.05 0.11 0.11 0.06 0.05 0.08Donors 36 36 36 34 34 34
Relative amounts for types of aid from 2004 to 2010: Multilateral donors
DV: log ratio ofaid
Model 7 Model 8 Model 9 Model 10 Model 11 Model 12
TA/project Programmatic/project Programmatic/TA Social/infrastructure Productive/infrastructure Industry/infrastructure
WGI Average 0.45* 1.21 1.69 �0.67 0.37 0.48(0.25) (0.82) (0.99) (0.43) (0.30) (0.97)
Log (GDP percapita)
0.49 �0.41 �3.09 2.23 1.09 14.14***
(1.96) (5.65) (5.59) (3.37) (5.27) (3.95)Log (GDP Percapita)2
�0.02 �0.09 0.06 �0.13 �0.12 �0.87***
(0.13) (0.36) (0.34) (0.22) (0.34) (0.23)External debtratio
0.001 0.00 �0.001 0.01* 0.002 0.002
(0.001) (0.002) (0.004) (0.003) (0.004) (0.005)Investment ratio �0.0003 0.03** 0.04** 0.005 0.01 0.01
(0.004) (0.01) (0.01) (0.01) (0.02) (0.02)Log(Population)
0.19** 0.21 0.29 0.55*** 0.43*** 0.77***
(0.08) (0.27) (0.33) (0.13) (0.11) (0.19)Former Colony 0.19 0.48 0.42 0.39 0.71 �0.52
(0.22) (0.73) (0.93) (0.40) (0.52) (0.70)Constant �7.33 �4.12 5.41 �23.78 �15.11 �84.50***
(8.10) (23.73) (24.03) (13.77) (20.49) (18.04)Observations 847 739 746 652 652 652R-Squared 0.02 0.06 0.07 0.06 0.05 0.06Donors 18 18 18 18 18 18
Robust standard errors clustered on donor in parentheses.*** p < 0.01.** p < 0.05.* p < 0.1.
526 WORLD DEVELOPMENT
THE ROLE OF GOVERNANCE IN DETERMINING FOREIGN AID FLOW COMPOSITION 527
rather than reflecting specific decision making about modali-ties and sectors. 35
The results with regard to governance are quite consistentwith those revealed in the previous table. Among bilateraldonors, we find evidence that programmatic aid is larger rela-tive to both project aid and technical assistance for countriesthat score high on the governance measure. We also see addi-tional evidence that bilateral donors substitute more easilymonitored social sector projects for infrastructure projects inpoorly governed countries. Two of these three associationsare estimated with less statistical uncertainty in this table ascompared to Table 5. Here we also find new evidence that bet-ter governed countries are more likely to receive industry aidrelative to infrastructure aid from bilateral donors. For multi-lateral donors, we continue to see coefficients that are similarto those from the regressions for the bilateral donors but thatare estimated with much more uncertainty. The exception is incolumn 7, which provides evidence that multilateral donorsallocate more technical assistance aid relative to project aidfor donors with higher scores on the governance measure.
Given that total aid flows and the components of aid flowsare jointly determined, it is a challenge to observe the extent towhich donors are altering the composition of their aid flowsseparately from changing the overall total levels of aid. Havingfirst provided some evidence that overall aid flows are increas-ing to better governed countries, we then showed that bettergoverned countries also receive more diverse aid (i.e., aid thatarrives using a larger variety of modalities and in a largernumber of sectors). Then we used a series of compositionaldata analysis models to show that aid increases more in partic-ular categories in better governed recipient countries. Analysisof bilateral donors with and without zero values provides evi-dence that programmatic aid increases relative to project aidand technical assistance in better governed countries and thatrising levels of infrastructure aid may come at the expense ofsocial aid (as the selectivity hypothesis would predict) in thosesame countries. These compositional models more accuratelyreflect the data-generating process as compared to models thattake amounts or shares as their outcome variable.
It is interesting that multilateral donors, while selective intheir overall aid flows, do not appear to be selective in the typeof aid given to a recipient country. While many scholars haveargued that multilateral donors are more selective when allo-cating funds to recipients, it appears that bilateral donorsare more selective when choosing the type of aid to allocateto a particular recipient. This result deserves further investiga-tion.
6. ADDITIONAL ROBUSTNESS CHECKS
In the Online Appendix, we provide a number of robustnesschecks and additional analyses. With one important exception,our results are robust to alternative operationalizations of keyvariables and the addition of other potential confoundingcovariates. In a number of the additional analyses, governancebecomes a significant positive predictor of either the program-matic-to-project or programmatic-to-technical-assistancelog-ratios for multilateral donors. 36
First, we show that the coefficient on the governance vari-able changes if the basic controls for GDP per capita and pop-ulation are not included; once these variables are included, thecoefficient estimate is relatively consistent when the remainingcore control variables are added. Beyond operationalizinglevel of development as GDP per capita, we test the robustnessof the results to including additional proxies for development.
There is some slight attenuation of the governance variablewhen we control for infant mortality rate, school enrollment,or those variables in combination. The governance variableretains its sign across all replicated regressions and remainssignificant except for two cases when we include all of thealternative indicators at the same time. For multilateraldonors, the inclusion of the poverty rate increases efficiencyin such a way that governance becomes a significant predictorof the log-ratio of programmatic-to-project aid.
We explore alternative operationalizations of external debtand commercial ties. In the former case, operationalizingexternal debt as the ratio of bilateral debt to total exportscauses the governance variable to attenuate and drop in signif-icance to just below the 90% confidence level (p < 0.12) for theanalysis of overall aid only; the changes to the compositionaldata analysis results from the inclusion of this variable areminor. All of the original results are robust to operationalizingtrade as exports rather than combined imports and exports.
When we test the robustness of the results to the presence offour additional potentially confounding variables – democ-racy, an index of economic freedom, an indicator for the reci-pient country’s status as a fuel exporter, and an indicator forthe existence of civil war within the recipient country duringthe time period that we study – we retain all of our originalresults and find new evidence in several specifications thatmultilateral donors increase the amount of programmaticaid relative to either project aid or technical assistance.
Although we believe that the Worldwide Governance Indi-cators are the most appropriate operationalization of gover-nance – since donors have stated the fact that they areattuned to these measures – we replicate our analyses usingother governance variables. Using three alternative indices,we show that the overall aid flow results are the same as pre-sented above for both bilateral and multilateral donors. Ourresults for allocation across modalities are also quite similarfor bilateral donors and become newly significant for multilat-eral donors when using one of the alternative measures. In ouranalysis of allocation across sectors, there are some differenceswhen alternative governance indices are used: rather thanidentifying a substitution of social sector assistance for infra-structure assistance in poorly governed countries, we are morelikely to identify a substitution of productive assistance forinfrastructure assistance.
We also disaggregate the combined governance index toshow that, in most cases, it predicts as well as any of its indi-vidual components. We also examine what happens when eachcomponent is included alongside an aggregate measure of theother five components. The results seem to generally reinforcethe idea that there is significant overlap among the WorldwideGovernance Indicators, and no clear preference for one indica-tor over another is suggested.
Finally, we show that our results are robust to eliminatingsmall emerging donors from the analysis and studying onlythe largest donors included in the dataset, and we show thatthe governance effects are mostly found among OECD-DACdonors and are not present for non-DAC donors.
7. CONCLUSIONS: WEAK GOVERNANCE BREEDSSEVERAL FORMS OF DONOR SELECTIVITY
Hout (2002, p. 511) described a “volte-face” in the late 1990sin the development policy world with regard to good gover-nance being a prerequisite for development assistance. Study-ing the Dutch case, however, he noted that the implementationof selectivity might not live up to the rhetoric. Overall, while a
528 WORLD DEVELOPMENT
number of studies have found donor responsiveness to goodgovernance in terms of their overall aid flows, others havefound signs that donors’ actions do not match their words,particularly when it comes to corruption. Studies that disag-gregate aid into certain constituent parts have more consis-tently found a correspondence between recipient governanceand certain types of aid flows. We look at overall aid flows,the choice of modalities, and the choice of project sectorsusing the comprehensive AidData database and find severalindications of donor selectivity in the data. Looking at multi-ple levels of aid allocation allows for an examination of themany ways in which recipient-country governance might affectdonors’ allocation decisions.
In the period 2004–10, we find some evidence that overallaid flows are responsive to the extent of perceived quality ofgovernance in recipient countries. Among the set of aid-receiv-ing countries, our results generally indicate that those coun-tries that are perceived as better governed obtainsignificantly more aid from both bilateral and multilateraldonors during this period than otherwise similar countries thatare perceived as poorly governed. An alternative operational-ization of one of our key control variables does cause the esti-mate on this relationship to attenuate to an extent that thecoefficient fails to achieve conventional levels of statistical sig-nificance. We also find some evidence that better governedcountries receive aid through a greater number of modalitiesand in a greater number of sectors. The effect sizes for thesedifferences, however, are small, and the increasing diversitymay simply result from the increased aid flows that well-gov-erned countries receive.
Using compositional data analysis techniques to look at therelative proportions of different types of aid that countriesreceive, we find evidence that bilateral donors give increasingproportions of programmatic aid to better governed countries,relative to both project aid and technical assistance. In
addition, we find that bilateral donors give a larger proportionof infrastructure aid, relative to social aid, in better governedcountries. Both of these results support the donor selectivityhypothesis: bilateral donors are giving less total aid and lessfungible types of aid to poorly governed recipients. Perhaps sur-prisingly, we find more evidence of donor selectivity amongbilateral donors than among multilateral donors, although inthe additional analyses provided in the Online Appendix, thereare a number of occasions on which governance becomes astatistically significant predictor of the log-ratios with program-matic aid in the numerator for multilateral donors as well.
Beyond selectivity with regard to governance, we find otherpatterns in the data that follow logical assumptions and resultsfrom previous scholarship. We find that donors provide largerand more diverse aid flows to military allies and former colo-nies, and in particular, we find some evidence that donors givemore of their aid to military allies in the form of programmaticassistance, which is quick-disbursing and fewer-strings-attached money that allies can make ready use of.
The post-Washington Consensus era in development thathas followed the end of the structural adjustment era has beendefined by an emphasis on good governance. When lookingfor evidence that donors selectively provide aid in responseto good governance, some scholars have suggested that thisdoes not seem to be happening among international donors.However, we find evidence that it is and that it is happeningat multiple levels, both in terms of overall aid flows and alsoin terms of the composition of those aid flows. Based on theevidence that we present here, criticisms that donors are notselective when it comes to governance appear to be overstated.Further work using appropriate statistical techniques forexamining aid composition will continue to give us a betterunderstanding of the ways in which aid allocation varies inrelation to the recipient-country characteristics often cited inthe best practices literature.
NOTES
1. For varying accounts of the development of the good governanceagenda among major development institutions, see, among others,Neumayer, 2003b; Nanda, 2006; Grindle, 2007; Hout, 2007; Weaver,2008; Diarra & Plane, 2011; and Gisselquist, 2012.
2. Gisselquist (2012) provides a summary of the different governancedefinitions that donors have used.
3. See the discussion of these three cases in Hout (2002, 2007)).
4. Not all voices in the aid community are in favor of this shift. Pronk(2001) describes a preference for an enlightened version of traditionalconditionality over blanket selectivity.
5. This result is not robust to one modification in the operationalizationof one of our core covariates. See the discussion in the Online Appendix.
6. Neumayer (2003b) provides a comprehensive review of literature fromthe 1990s.
7. With the term “programmatic aid,” we seek to identify those types ofaid flows that give significant amounts of implementing discretion to thehost government. We view general budget support as the most extremeform of programmatic aid, where the government has almost total
discretion over where and how the foreign assistance will be spent. Formore information about how these terms are used, see the OECD-DAC“Coding Rules” spreadsheet available at http://www.oecd.org/dac/stats/dacstatisticsanewclassificationbytypeofaid.htm (accessed 15 June 2014).
8. See Koeberle and Stavreski (2006), however, for the argument thatgeneral budget support will lead to improvements in the quality of countrysystems. Koada and Samreth (2012) argue that foreign aid flows, ingeneral, reduce corruption levels.
9. This fact causes some to doubt the extent to which technical assistanceshould be considered as a transfer to recipient countries at all. The actualaid often flows back to the donor country through consulting contracts(see the discussion in Easterly & Williamson, 2011, p. 1939).
10. A reviewer referred to this type of allocation of technical assistance topoor-governance recipients as “positive selectivity.”
11. Akramov (2012) studies variation in aid allocation to different sectorsbut does not offer an explicit theory of the likely variation across thosesectors.
12. Corruption in foreign-funded infrastructure projects has beendiscussed in previous work (e.g., Berkman, 2008; Cremer, 2008; Olken,2007).
THE ROLE OF GOVERNANCE IN DETERMINING FOREIGN AID FLOW COMPOSITION 529
13. For examples of how social sector projects suffer from corruption, seeIndonesian Corruption Watch (2005) and Wall Street Journal (2008).
14. Investment projects might include technical assistance components,and programmatic aid might be used to fund technical assistance activities.The types of aid that we include in our technical assistance category arethose that are most likely to be stand-alone technical assistance.
15. We resort to using purpose codes because of the incomplete nature ofthe modality coding in the OECD-DAC data and also because of changesover time in the modality coding that we observed and that are describedin the Online Appendix.
16. For the 2004–10 period that we study, there are 826 projects (out of685,461) in AidData Research Release 2.1 for which no purpose code isavailable. We drop these projects from the analysis. We also drop 119projects for which the commitment amounts were recorded as negative; allof these projects were reported by Australia in 2009 and most likely are theresult of adjustments that Australia was making to its CRS data (authors’correspondence with AidData staff).
17. The chosen time period reflects a moment in time after the goodgovernance agenda had become instantiated in donor discourse andtherefore likely in donor policies as well and also starts shortly after therise in aid and the changes in aid allocation associated with the beginningof the Global War on Terror (Fleck & Kilby, 2010). We were limited bythe fact that the current AidData research release (2.1) only goes throughFebruary 2012 and by the limited availability of the OECD-DAC CRSmodality variables that we use to craft our coding scheme.
18. In the Online Appendix, we provide the results of first-stage modelsthat examine the decision to allocate any aid at all. The governancevariable is not a significant predictor in these models.
19. In the Online Appendix, we present some preliminary donor-by-donor results.
20. In the Online Appendix, we show the results for an analysis ofwhether or not better governance leads to the use of each individual typeof aid. Nearly all of the coefficient estimates are positive, which suggeststhat the analysis is mostly revealing that donors use more types of aid asthey give more aid.
21. In the Online Appendix, we present models in which the outcome is ashare variable that ranges from 0 to 1.
22. We also considered substituting for zero values with 65% of thesmallest observed value for each log-ratio, but this value variessignificantly across the different categories of aid. Given that the log-ratios follow normal distributions, such that the minimum values are inthe tails of the distributions with few neighboring values, we prefer toinstead duplicate the minimum observed value for the values that areobserved as true zeros.
23. Both variables come from the World Development Indicators asrecorded in the Quality of Government dataset (Teorell et al., 2013).
24. As measured in the Penn World Tables as recorded in the Quality ofGovernment dataset.
25. From the World Development Indicators. The external debt variablehas been found particularly influential in studies of IMF and World Banklending (Dreher, Sturm, & Vreeland, 2009; Sturm, Berger, & de Haan, 2005).
26. In the Online Appendix, we show that the substantive effects of thegovernance variable are only slightly changed in specifications excludingthese variables.
27. From the IMF’s Direction of Trade Statistics.
28. From the Correlates of War database.
29. From Wahman, Teorell, and Hadenius’s (2013) AuthoritarianRegime Dataset as recorded in the Quality of Government dataset.
30. The estimated coefficients for bilateral and multilateral donors arenot statistically distinguishable from each other; the 95% confidenceinterval for 10,000 simulated differences overlaps zero.
31. The coefficients, however, are very similar in size and are notstatistically distinguishable from one another.
32. These results hold when we use a series of logistic regression modelsto look at the presence/absence of each type of aid within each dyad. Wereport these results in the Online Appendix.
33. The way in which this is not true is that technical assistance projectsare generally smaller than investment projects and programmatic aid.Therefore, if a donor is scaling up aid to a particular recipient country, aidmay disproportionately increase to the project and programmatic modal-ities relative to technical assistance.
34. Because of this high level of uncertainty, it is again impossible to saythat the coefficient for multilateral donors is statistically distinguishablefrom that for bilateral donors.
35. Note the way in which the coefficients on the population variablehave changed in this table versus the previous one. When looking atcomprehensive dyads, population was not a statistically significantpredictor for any of the bilateral models and was a negative andstatistically significant predictor for three of the multilateral models; here,it is always positively signed and often statistically significant. Thesecoefficients may be estimated off of differences between the large numberof observations at the zero value mark and other observations.
36. In the Online Appendix, we report robustness checks for Table 6; wefind very similar results when replicating Table 5.
REFERENCES
Acemoglu, D., Johnson, S., & Robinson, J. (2001). The colonial origins ofcomparative development. American Economics Review, 91(5), 1369–1401.
Aitchison, J. (1986). The statistical analysis of compositional data. NewYork: Chapman and Hall.
Akramov, K. (2012). Foreign aid allocation, governance, and economicgrowth. Philadelphia: University of Pennsylvania Press/InternationalFood Policy Research Institute.
Alesina, A., & Dollar, D. (2000). Who gives foreign aid to whom andwhy? Journal of Economic Growth, 5(1), 33–63.
Alesina, A., & Weder, B. (2002). Do corrupt governments receive lessforeign aid? American Economic Review, 92(4), 1126–1137.
Benn, J., Rogerson, A., & Steensen, S. (2010). Getting close to the core –Measuring country programmable aid. OECD-DAC DevelopmentBrief, 1.
Berkman, S. (2008). The World Bank and the gods of lending. Sterling, VA:Kumarian Press.
Bermeo, S. (2010). Development and strategy: Aid allocation in aninterdependent world. Duke University.
530 WORLD DEVELOPMENT
Bueno de Mesquita, B., & Smith, A. (2007). Foreign aid and policyconcessions. Journal of Conflict Resolution, 51(2), 251–284.
Bueno de Mesquita, B., & Smith, A. (2009). A political economy of aid.International Organization, 63, 309–340.
Burnside, C., & Dollar, D. (2004). Aid, policies and growth: Revisiting theevidence. World Bank Policy Research Working Paper No. 3251,Washington, DC.
Burnside, C., & Dollar, D. (2000). Aid, policies and growth. AmericanEconomic Review, 90(4), 847–868.
Campos, J. E., Lien, D., & Pradhan, S. (1999). The impact of corruptionon investment: Predictability matters. World Development, 27(6),1059–1067.
Chenery, H., & Strout, A. (1966). Foreign assistance and economicdevelopment. American Economic Review, 56(4–1), 679–733.
Claessens, S., Cassimon, D., & Van Campenhout, B. (2009). Evidence onchanges in aid allocation criteria. World Bank Economic Review, 23(2),185–208.
Clist, P. (2011). 25 years of aid allocation practice: Whither selectivity?World Development, 39(10), 1724–1734.
Clist, P., Isopi, A., & Morrissey, O. (2012). Selectivity on aid modality:Determinants of budget support from multilateral donors. Review ofInternational Organizations, 7(3), 267–284.
Cordella, T., & Dell’Ariccia, G. (2007). Budget support versus projectaid: A theoretical appraisal. The Economics Journal, 117(523),1260–1279.
Cremer, G. (2008). Corruption & development aid: Confronting thechallenges. Boulder, CO: Lynn Rienner.
de la Croix, D., & Delavallade, C. (2013). Why corrupt governments mayreceive more foreign aid. Oxford Economic Papers, 66(1), 51–66.
Diarra, G., & Plane, P. (2011). Assessing the World Bank’s influence onthe good governance paradigm. CERDI Etudes et Documents E2010.38, January, Clermont Ferrand, France.
Dietrich, S. (2013). Bypass or engage? Explaining donor delivery tactics inforeign aid allocation. International Studies Quarterly, 57(4), 698–712.
Dreher, A., Sturm, J.-E., & Vreeland, J. R. (2009). Development aid andinternational politics: Does membership on the U.N. Security Councilinfluence World Bank decisions? Journal of Development Economics,88, 1–18.
Easterly, W. (2007). Are aid agencies improving? Economic Policy, 22(52),633–678.
Easterly, W., & Pfutze, T. (2008). Where does the money go? Best andworst practices in foreign aid. Journal of Economic Perspectives, 22(2),29–52.
Easterly, W., & Williamson, C. (2011). Rhetoric versus reality: The bestand worst of aid agency practices. World Development, 39(11),1930–1949.
Fleck, R., & Kilby, C. (2010). Changing aid regimes? U.S. foreign aidfrom the Cold War to the War on Terror. Journal of DevelopmentEconomics, 91(2), 185–197.
Freytag, A., & Pehnelt, G. (2009). Debt relief and governance quality indeveloping countries. World Development, 37(1), 62–80.
Girod, D. (2008). Cut from the same cloth? Bilateral vs. multilateral aid.Paper presented at the Annual Meeting of the International PoliticalEconomy Society, Philadelphia, November.
Gisselquist, R. (2012). Good governance as a concept, and why thismatters for development policy. UNU-Wider Working Paper No. 2012/30, March, Helsinki.
Grindle, M. S. (2007). Good enough governance revisited. DevelopmentPolicy Review, 25(5), 533–574.
Hout, W. (2002). Good governance and aid: Selectivity criteria indevelopment assistance. Development and Change, 33(3), 511–527.
Hout, W. (2007). The politics of aid selectivity: Good governance criteria inWorld Bank, U.S. and Dutch development assistance. New York:Routledge.
Indonesian Corruption Watch. (2005). Press conference on ‘textbookprocurement’. 9 August, Jakarta. <http://a2knetwork.org/sites/default/files/press_releases/summarypressconference090805.pdf> Accessed 24June 2014.
Isopi, A. & Mattesini, F. (2008). Aid and corruption: Do donors usedevelopment assistance to provide the ‘right’ incentives? Centre forEconomic and International Studies Tor Vergata Working Paper No. 6/6/121, April, Rome.
Katz, J. N., & King, G. (1999). A statistical model for multiparty electoraldata. American Political Science Review, 93(1), 15–32.
Kaufmann, D., Kraay, A., & Mastruzzi, M. (2009). Governance mattersVIII: Aggregate and individual governance indicators for 1996–2008.World Bank Policy Research Paper No. 4978, Washington, DC,June.
Kennedy, P. (2003). A guide to econometrics (5th ed.). Cambridge, MA:The MIT Press.
Knack, S. (2001). Aid dependence and the quality of governance:Cross-country empirical tests. Southern Economic Journal, 68(2),310–329.
Koada, K., & Samreth, S. (2012). The effect of foreign aid oncorruption: A quantile regression approach. Economics Letters,115(2), 240–243.
Koeberle, S., & Stavreski, Z. (2006). Budget support: Concept and issues.In S. Koeberle, Z. Stavreski, & J. Walliser (Eds.), Budget support asmore effective aid? Recent experiences and emerging lessons (pp. 3–23).Washington, DC: The World Bank.
Maizels, A., & Nissanke, M. (1984). Motivations for aid to developingcountries. World Development, 12(9), 879–900.
Martens, B., Mummert, U., Murrell, P., & Seabright, P. (2002). Theinstitutional economics of foreign aid. New York: Cambridge UniversityPress.
McKinlay, R. D., & Little, R. (1977). A foreign policy model of U.S.bilateral aid allocation. World Politics, 30, 58–86.
McKinlay, R. D., & Little, R. (1978). The German aid relationship: A testof the recipient need and the donor interest models of the distributionof German bilateral aid 1961–70. European Journal of PoliticalResearch, 6, 235–257.
McKinlay, R. D., & Little, R. (1979). The U.S. aid relationship: A test ofthe recipient need and the donor interest models. Political Studies,27(2), 236–250.
Montinola, G. R., & Jackman, R. W. (2002). Sources of corruption: Across-country study. British Journal of Political Science, 32(1),147–170.
Nanda, V. P. (2006). The ‘good governance’ concept revisited. Annalsof the American Academy of Political and Social Science, 603(1),269–283.
Neumayer, E. (2003a). The determinants of aid allocation by regionalmultilateral development banks and United Nations agencies. Inter-national Studies Quarterly, 47, 101–122.
Neumayer, E. (2003b). The patterns of aid giving: The impact of goodgovernance on development assistance. New York: Routledge.
Nordveit, I. (2014). Partner country ownership: Does better governanceand commitment to development attract general budget support?University of Bergen Working Papers in Economics No. 2/14,Bergen.
Olken, B. (2007). Monitoring corruption: Evidence from a fieldexperiment in Indonesia. Journal of Political Economy, 115(2),200–249.
Pawlowsky-Glahn, V., & Buccianti, A. (Eds.) (2011). Compositional dataanalysis: theory and applications. West Sussex, U.K.: John Wiley &Sons.
Pronk, J. (2001). Aid as a catalyst. Development and Change, 32,611–629.
Rodrik, D. (1995). Why is there multilateral lending? NBER WorkingPaper No. 5160. Cambridge, MA.
Schudel, C. J. W. (2008). Corruption and bilateral aid: A dyadic approach.Journal of Conflict Resolution, 52(4), 507–526.
Schudel, C. J. W. (ND). Corruption and aid from multilateral developmentbanks. University of Amsterdam.
Sturm, J.-E., Berger, H., & de Haan, J. (2005). Which variables explaindecisions on IMF credit? An extreme bounds analysis. Economics andPolitics, 17(2), 177–213.
Svensson, J. (2000). Foreign aid and rent-seeking. Journal of InternationalEconomics, 51, 437–461.
Svensson, J. (2005). Eight questions about corruption. Journal ofEconomic Perspectives, 19(3), 19–42.
Teorell, J., Charron, N., Dahlberg, S., Holmberg, S., Rothstein, B.,Sundin, P., et al. (2013). The quality of government dataset, version15May13. University of Gothenburg: The Quality of GovernmentInstitute, <http://www.qog.pol.gu.se>.
Tierney, M. J., Nielson, D. L., Hawkins, D. G., Roberts, J. T., Findley,M. G., Powers, R. M., et al. (2011). More dollars than sense: Refiningour knowledge of development finance using AidData. World Devel-opment, 39(11), 1891–1906.
THE ROLE OF GOVERNANCE IN DETERMINING FOREIGN AID FLOW COMPOSITION 531
Treisman, D. (2000). The causes of corruption: A cross-national study.Journal of Public Economics, 76(3), 399–457.
Treisman, D. (2007). What have we learned about the causes of corruptionfrom ten years of cross-national empirical research? Annual Review ofPolitical Science, 10, 211–244.
Wall Street Journal. (2008). World Bank uncovers corruption in healthprojects it funds in India. Wall Street Journal, 12 January.
Wahman, M., Teorell, J., & Hadenius, A. (2013). Authoritarian regimetypes revisited: Updated data in comparative perspective. Contempo-rary Politics, 19(1), 19–34.
Weaver, C. (2008). Hypocrisy trap: The World Bank and the poverty ofreform. Princeton: Princeton University Press.
Winters, M. (2014). Targeting, accountability and capture in developmentprojects. International Studies Quarterly, 58(2), 31–42.
World Bank. (1989). Sub-Saharan Africa: From crisis to sustainablegrowth, a long-term perspective study. Washington, DC: The WorldBank.
World Bank. (1998). Assessing aid: What works, what doesn’t, and why.New York: Oxford University Press.
APPENDIX A. SUPPLEMENTARY DATA
Supplementary data associated with this article can befound, in the online version, at http://dx.doi.org/10.1016/j.worlddev.2014.09.020.
.sciencedirect.com
ScienceDirectAvailable online at www
Related Documents