The role of forest structure, fragment size and corridors in maintaining small mammal abundance and diversity in an Atlantic forest landscape Renata Pardini a, * , Sergio Marques de Souza a , Ricardo Braga-Neto a , Jean Paul Metzger b a Departamento de Zoologia, Instituto de Biocie ˆncias, Universidade de Sa ˜ o Paulo, Rua do Mata ˜ o, Travessa 14, 101, CEP 05508-900, Sa ˜ o Paulo, SP, Brazil b Departamento de Ecologia, Instituto de Biocie ˆncias, Universidade de Sa ˜ o Paulo, Rua do Mata ˜ o, Travessa 14, 321, Cidade Universita ´ ria, CEP- 05508-900, Sa ˜ o Paulo, SP, Brazil Received 13 October 2004 Abstract Using the abundance and distribution of small mammals at 26 sites in an Atlantic forest landscape, we investigated how species abundance and alpha and beta diversity are affected by fragment size and the presence of corridors. To account for the variability in forest structure among fragments, we described and minimized the influence of foliage density and stratification on small mammal data. Sites were distributed among three categories of fragment size and in continuous forest. For small and medium-sized catego- ries, we considered isolated fragments and fragments connected by corridors to larger remnants. Small mammal abundance and alpha and beta diversity were regressed against site scores from the first axis of a Principal Component Analysis on forest structure variables. Residuals were used in analyses of variance to compare fragment size and connectivity categories. Forest structure influ- enced total abundance and abundance of some species individually, but not the diversity of small mammal communities. Total abundance and alpha diversity were lower in small and medium-sized fragments than in large fragments and continuous forest, and in isolated compared to connected fragments. Three species were less common, but none was more abundant in smaller frag- ments. At least one species was more abundant in connected compared to isolated fragments. Beta diversity showed an opposite relationship to fragment size and corridors, increasing in small and isolated fragments. Results highlight the importance of second- ary forest for the conservation of tropical fauna, the hyper-dynamism of small isolated fragments and the potential of corridors to buffer habitat fragmentation effects in tropical landscapes. Ó 2005 Elsevier Ltd. All rights reserved. Keywords: Habitat loss and fragmentation; Corridors; Connectivity; Alpha and beta diversity; Forest structure; Hyper-dynamism 1. Introduction The negative consequences of habitat loss and frag- mentation to different aspects of biodiversity have been shown by a large number of theoretical and empirical studies, in different environments, and for a large array of taxa (Fahrig, 2003). By decreasing population size and thus increasing the influence of stochastic processes, habitat loss and fragmentation should increase extinc- tion rates, leading to a decrease in alpha diversity in remnants (Wilcox and Murphy, 1985) and an increase in beta diversity among them (Harrison, 1997; Loreau, 2000; Chase, 2003). Although species loss has been observed for different taxa in fragmented tropical 0006-3207/$ - see front matter. Ó 2005 Elsevier Ltd. All rights reserved. doi:10.1016/j.biocon.2005.01.033 * Corresponding author. Tel.: +55 11 30917511; fax: +55 11 30917513. E-mail address: [email protected] (R. Pardini). www.elsevier.com/locate/biocon Biological Conservation 124 (2005) 253–266 BIOLOGICAL CONSERVATION

Welcome message from author
This document is posted to help you gain knowledge. Please leave a comment to let me know what you think about it! Share it to your friends and learn new things together.
Transcript

www.elsevier.com/locate/biocon
Biological Conservation 124 (2005) 253–266
BIOLOGICAL
CONSERVATION
The role of forest structure, fragment size and corridorsin maintaining small mammal abundance and diversity in an
Atlantic forest landscape
Renata Pardini a,*, Sergio Marques de Souza a,Ricardo Braga-Neto a, Jean Paul Metzger b
a Departamento de Zoologia, Instituto de Biociencias, Universidade de Sao Paulo, Rua do Matao, Travessa 14, 101,
CEP 05508-900, Sao Paulo, SP, Brazilb Departamento de Ecologia, Instituto de Biociencias, Universidade de Sao Paulo, Rua do Matao, Travessa 14, 321,
Cidade Universitaria, CEP- 05508-900, Sao Paulo, SP, Brazil
Received 13 October 2004
Abstract
Using the abundance and distribution of small mammals at 26 sites in an Atlantic forest landscape, we investigated how species
abundance and alpha and beta diversity are affected by fragment size and the presence of corridors. To account for the variability in
forest structure among fragments, we described and minimized the influence of foliage density and stratification on small mammal
data. Sites were distributed among three categories of fragment size and in continuous forest. For small and medium-sized catego-
ries, we considered isolated fragments and fragments connected by corridors to larger remnants. Small mammal abundance and
alpha and beta diversity were regressed against site scores from the first axis of a Principal Component Analysis on forest structure
variables. Residuals were used in analyses of variance to compare fragment size and connectivity categories. Forest structure influ-
enced total abundance and abundance of some species individually, but not the diversity of small mammal communities. Total
abundance and alpha diversity were lower in small and medium-sized fragments than in large fragments and continuous forest,
and in isolated compared to connected fragments. Three species were less common, but none was more abundant in smaller frag-
ments. At least one species was more abundant in connected compared to isolated fragments. Beta diversity showed an opposite
relationship to fragment size and corridors, increasing in small and isolated fragments. Results highlight the importance of second-
ary forest for the conservation of tropical fauna, the hyper-dynamism of small isolated fragments and the potential of corridors to
buffer habitat fragmentation effects in tropical landscapes.
� 2005 Elsevier Ltd. All rights reserved.
Keywords: Habitat loss and fragmentation; Corridors; Connectivity; Alpha and beta diversity; Forest structure; Hyper-dynamism
1. Introduction
The negative consequences of habitat loss and frag-
mentation to different aspects of biodiversity have been
shown by a large number of theoretical and empirical
0006-3207/$ - see front matter. � 2005 Elsevier Ltd. All rights reserved.
doi:10.1016/j.biocon.2005.01.033
* Corresponding author. Tel.: +55 11 30917511; fax: +55 11
30917513.
E-mail address: [email protected] (R. Pardini).
studies, in different environments, and for a large arrayof taxa (Fahrig, 2003). By decreasing population size
and thus increasing the influence of stochastic processes,
habitat loss and fragmentation should increase extinc-
tion rates, leading to a decrease in alpha diversity in
remnants (Wilcox and Murphy, 1985) and an increase
in beta diversity among them (Harrison, 1997; Loreau,
2000; Chase, 2003). Although species loss has been
observed for different taxa in fragmented tropical
254 R. Pardini et al. / Biological Conservation 124 (2005) 253–266
landscapes (Laurance and Bierregaard, 1997), few
studies focused on the increase in spatial variability in
community composition among fragments (Harrison,
1997; Gilbert et al., 1998).
Moreover, recent studies have brought to light the
synergism between habitat fragmentation and a seriesof impacts induced by human activities in altered land-
scapes (Laurance and Cochrane, 2001). In tropical for-
ests in particular, forest structure, an important factor
determining the occurrence of species and the structure
of animal communities (Tews et al., 2004), is drastically
altered in human landscapes by edge effects, selective
logging, fire and the regeneration process (Malcolm,
1994; Malcolm and Ray, 2000; Cochrane, 2001; DeWaltet al., 2003).
On the other hand, landscape elements that enhance
functional connectivity among fragments, i.e., which in-
crease the flow of individuals or genes, should favor
recolonization or immigration rates and decrease local
extinctions through the rescue effect (Brown and Kod-
ric-Brown, 1977). Corridors are an evident aspect of
the degree of structural connectivity among fragments,representing a clear and attainable strategy for the man-
agement of fragmented landscapes. For this reason, a
number of studies have tested the effectiveness of corri-
dors (Simberloff et al., 1992; Beier and Noss, 1998). Cor-
ridors may increase movement of individuals (Gonzalez
et al., 1998; Haddad, 1999; Mech and Hallett, 2001),
gene flow (Aars and Ims, 1999; Hale et al., 2001; Mech
and Hallett, 2001) and population size (Dunning et al.,1995; Haddad and Baum, 1999; Uezu et al., in press),
and may facilitate animal–plant interactions (Tewks-
bury et al., 2002; Orrock et al., 2003). Few studies, how-
ever, focused on the effects of corridors on the
composition, richness (alpha diversity) and spatial vari-
ability (beta diversity) of communities (Beier and Noss,
1998).
The Brazilian Atlantic forest is one of the richestbut also most endangered tropical forests in the world
(Myers et al., 2000). Covering less than 8% of its ori-
ginal distribution, conservation strategies for the
Atlantic forest depend on information on how biodi-
versity is maintained and affected in the remaining
small and altered patches, and on information to help
establish restoration plans. Small mammals, rodents
and marsupials, may be considered a good group tohelp answer this type of question. They play an
important ecological role in the Atlantic forest, influ-
encing forest regeneration through the differential pre-
dation on seeds and seedlings (Pizo, 1997; Vieira et al.,
2003a) and the dispersal of seeds (Grelle and Garcia,
1999; Vieira and Izar, 1999; Pimentel and Tabarelli,
2004). They also represent the most diverse ecological
group of mammals in the Atlantic forest, where morethan 90 species are found, of which around 43 are ende-
mic (Fonseca et al., 1996).
Despite the reduced number of studies that focused
on the effects of the long-standing fragmentation on
Atlantic forest small mammals (Fonseca and Robinson,
1990; Pires et al., 2002; Castro and Fernandez, 2004;
Pardini, 2004), there are good indications that these ani-
mals clearly respond to habitat and landscape altera-tions. Atlantic and Amazonian small mammals occupy
a series of habitats that retain a forest structure, includ-
ing secondary forest (Stallings, 1989; Fonseca and Rob-
inson, 1990; Pardini, 2004), shade cocoa plantations
(Pardini, 2004), linear corridors (Lima and Gascon,
1999) and forest edges (Malcolm, 1997a; Pardini,
2004). The abundance of several species, however, is af-
fected by foliage density and stratification (Malcolm,1995; Gentile and Fernandez, 1999; Pardini, 2001;
Grelle, 2003). Some of the species that are found mainly
on the canopy as well as some of those that occupy the
ground level decrease in abundance, while those found
predominantly on the understory increase in abundance,
in more disturbed or younger forest, where the under-
story is denser and the canopy is more open (Malcolm,
1995; Pardini, 2001, 2004; Vieira et al., 2003b). With fewexceptions, however, the great majority of Atlantic for-
est small mammals do not occur in natural or anthropo-
genic open habitats (Stallings, 1989; Stevens and
Husband, 1998; Feliciano et al., 2002), and the rates of
movement of individuals among Atlantic forest frag-
ments surrounded by open fields are low (Pires et al.,
2002), leading to extinctions in small fragments (Castro
and Fernandez, 2004).Using the abundance and distribution of small mam-
mals in 26 sites of an Atlantic forest landscape, we inves-
tigated how species abundance and alpha and beta
diversity are affected by fragment size and the presence
of corridors. To account for the variability in forest
structure among fragments, we described and minimized
the influence of foliage density and stratification on
small mammal data.
2. Methods
2.1. Study area
Our study was carried out in Caucaia do Alto, lo-
cated in the Cotia and Ibiuna municipalities, State ofSao Paulo, Brazil, in a continuous forest and in a frag-
mented landscape (Fig. 1). The altitude in the region
varies from 850 to 1100 m and the relief is characterized
by denudation, convex hills and inclinations of more
than 15% (Ross and Moroz, 1997). Mean maximum
temperature is 27 �C and mean minimum temperature
is 11 �C. Rainfall is around 1300–1400 mm/year and it
is seasonally variable, with the driest and coldest monthsbetween April and August. The vegetation in the region
is a transition between the coastal Atlantic rain forest

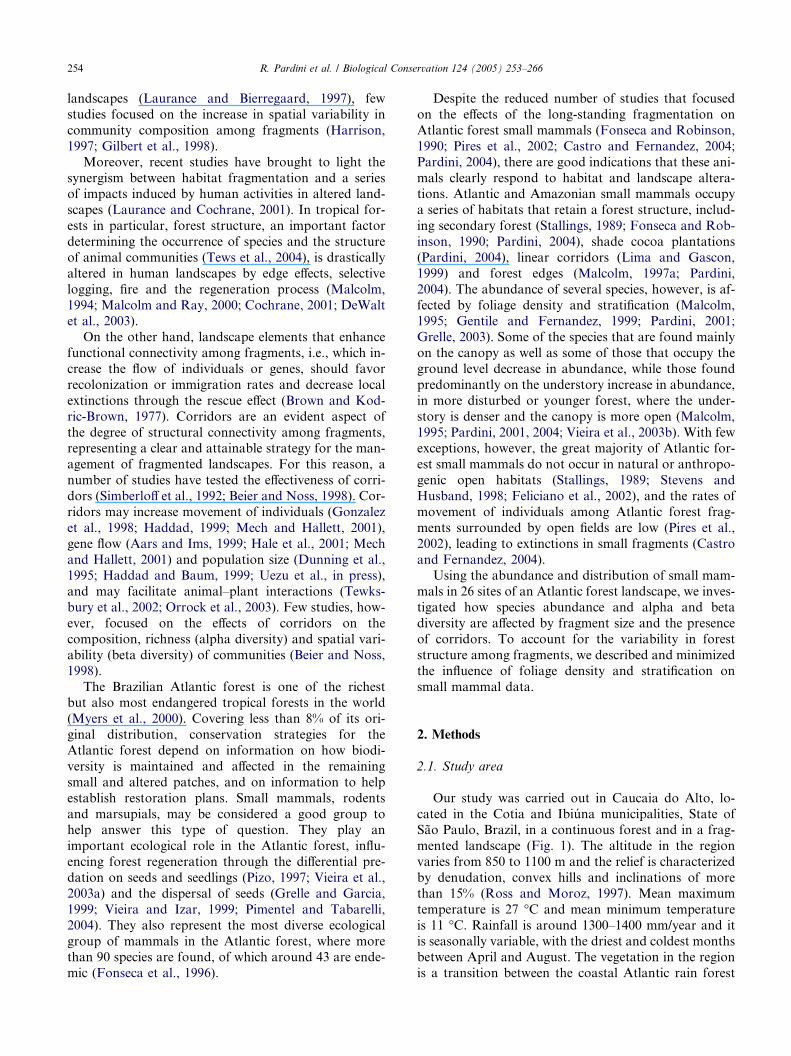
Fig. 1. (a) Map of the State of Sao Paulo, Brazil, showing the distribution of current remnants of Atlantic Forest and the location of the Caucaia do
Alto region; (b) distribution of forest remnants in Caucaia do Alto and the position of the 26 study sites: C, control sites; L, large fragments; arrow,
medium-sized fragments; and dashed arrow, small fragments; (c) Aerial photograph showing one large fragment (L), one medium-sized isolated
fragment (MI) and one medium-sized fragment connected by a corridor to the large one (MC).
R. Pardini et al. / Biological Conservation 124 (2005) 253–266 255
and the Atlantic semi-deciduous forest, being classifiedas ‘‘Lower Montane Atlantic Rain Forest’’ (Oliveira-
Filho and Fontes, 2000).
The continuous forest is the Morro Grande Reserve,
which comprises 9400 ha of secondary and mature for-
est. In its southern limits, the reserve is connected to
other large forested areas (Fig. 1). The fragmented land-
scape extends southwestwards from the reserve and is
dominated by open habitats, which cover 58% of thelandscape (agricultural fields – 33%, areas with rural
buildings or urban areas �15%, and native vegetationin early stages of regeneration �10%). Native forests
(e.g., secondary vegetation) cover 31% of the landscape,
and pine and eucalyptus plantations, 7%. The study re-
gion was chosen because of its homogeneity in terms of
type of forest, relief, altitude and climate, the existence
of a continuous area composed mainly of secondary for-
est comparable to that of fragments and the relative low
amount of remaining forest and of forested matrix hab-itats in the fragmented landscape.
256 R. Pardini et al. / Biological Conservation 124 (2005) 253–266
2.2. Study sites
All sites were located in secondary forest from 50 to
80 years old, except three sites in the reserve located in
mature forest. Selection of study sites was performed
as follows. To assure a large range of fragment size,we selected the five largest patches in the fragmented
landscape (>50 ha). Among smaller fragments, we sys-
tematically selected sites based on the presence/absence
of corridors to large fragments (corridors were of native
vegetation, in most cases mainly of secondary forest,
and varied from 25 to 100 m in width), fragment size
considering two categories (small – <5 ha, and med-
ium-sized – 10–50 ha), and distance to large fragments(corridor length varied from 37 to 1071 m and isolated
fragments covered approximately the same range of dis-
tance to large fragments, i.e., 125–1955 m between the
limits of the secondary forests of the two fragments,
Fig. 1). In continuous forest, we randomly selected six
sites at least 2.2 km apart to avoid differences in the dis-
tance between sites among different fragment categories.
Mean distance between one site and the nearest sur-veyed neighbor was 1398 m (SD = 769, range = 491 to
3217) and was not significantly different among frag-
ment categories (ANOVA, F5, 20 = 0.786, p = 0.572).
Thus, in order to avoid a strong spatial segregation
among sites from different categories (Fig. 1) and pre-
vent initial or inherent variability among samples to
invalidate results (Hurlbert, 1984), we systematically se-
lected sites in fragments and randomly spaced out sitesin the continuous landscape.
Because landowners� permission was not always ob-
tained and highly disturbed fragments were avoided,
we chose to maximize the number of replicates when
possible at the expense of a complete even distribution
of replicates among categories. In total, we studied 26
sites: six continuous forest sites, five large fragments,
four medium-sized connected fragments, four medium-sized isolated fragments, four small connected fragments
and three small isolated fragments (Fig. 1).
2.3. Data collection
We used a standardized sampling protocol in each of
the 26 sites, using the same type, number and arrange-
ment of traps and sampling the same area for the samenumber of days, regardless of the size of the fragment.
Unlike protocols in which an equivalent proportion of
the area of the fragments is sampled, this approach al-
lows for direct comparison of results and minimizes
the chance that differences in habitat heterogeneity affect
comparisons among fragments. At each site, we set a
100-m sequence of 11 pitfall traps (60 L) 10 m from each
other and connected by a 500-mm high plastic fence. Se-quences of large pitfall traps are effective in capturing
not only terrestrial, but also scansorial and arboreal
small mammal species (Lyra-Jorge and Pivello, 2001;
Hice and Schmidly, 2002; Pardini and Umetsu, in press),
capturing a larger number of species (Pardini and Ume-
tsu, in press) and individuals (Lyra-Jorge and Pivello,
2001; Pardini and Umetsu, in press) than conventional
live traps in Neotropical habitats. Because our mainobjective was to investigate spatial and not temporal
patterns, we concentrated a large sampling effort during
summer (wet season), the time of the year when capture
success is higher for pitfall traps (capture rates are very
low during the dry season, Hice and Schmidly, 2002).
Adding different sampling periods could obscure spatial
patterns of diversity, since small isolated fragments are
probably hyper-dynamic (Laurance, 2002) and maypresent a high turnover of species (Hinsley et al., 1995;
Schmiegelow et al., 1997; Terborgh et al., 1997). Two
capture sessions of eight days each were conducted dur-
ing January and February 2002, totaling sixteen days of
sampling for each of the 26 sites. Thirteen sites were
sampled at the same time to prevent temporal fluctua-
tions from influencing the comparison among sites. Ani-
mals were marked with numbered tags at first capture(Fish and small animal tag-size 1 – National Band and
Tag Co., Newport, Kentucky).
Forest structure was described by measuring foliage
density and stratification, important features determin-
ing forest quality for rain forest small mammals. Foliage
density and stratification are good indicators of forest
regeneration stage (DeWalt et al., 2003) and of level of
forest disturbance, such as edge effect intensity (Mal-colm, 1994) and selective logging (Malcolm and Ray,
2000). They are correlated with arthropod biomass
(Malcolm, 1997b), understory fruit availability (DeWalt
et al., 2003) and the abundance of several Neotropical
small mammal species (Malcolm, 1995; Gentile and Fer-
nandez, 1999; Pardini, 2001; Vieira et al., 2003b). At
each site, 12 stations spaced every 15 m were set in each
of two parallel lines of 165 m in length and 20 m apartfrom each other, which overlay the pitfall sequence. At
each station, we used a 4-meter pole to help establish
an imaginary vertical column of 150 mm in diameter.
The height of the inferior and superior limits of all foli-
age which stretched along the imaginary column was
measured in the field and afterwards used to calculate
the length in meters occupied by foliage in five strata
(0–1, 1–5, 5–10, 10–15, >15 m). For each site, we calcu-lated the mean of foliage length in each stratum consid-
ering the 24 sampling stations. This is a modification of
the method described in Malcolm (1995).
2.4. Data analysis
Since the sampled area and capture protocol were the
same for all sites, the number of captured individualswas used as an index of relative abundance (Slade and
Blair, 2000). For each site, we calculated abundance

R. Pardini et al. / Biological Conservation 124 (2005) 253–266 257
(number of individuals), alpha diversity (number of spe-
cies) and beta diversity. We calculated beta diversity for
pairs of sites, considering each site in relation to all oth-
ers from the same category of size and connectivity. To
obtain one value for each site, we calculated the mean of
the paired beta values. This approach is better thancomparing the composition of the focal site with that
of the entire set of sites of the same category of size
and connectivity, which results in the comparison of
areas of different size. This is undesirable especially
when the number of sites per category is unequal (Koleff
et al., 2003). We used two metrics, Beta w calculated as
a + b + c/[(2a + b + c)/2] (Whittaker, 1960) and Beta sim
calculated as min(b, c)/[min(b, c) + a] (Lennon et al.,2001), where a is the total number of species which are
found in both sites, b is the number of species which
are present in the other site but not in the focal site,
while c is the number present in the focal site but not
in the other site. Beta w is considered a �broad sense�beta diversity metric which incorporates differences in
composition attributable to species richness gradients,
and Beta sim is considered a �narrow sense� metric thatfocuses on compositional differences independent of
such gradients (Koleff et al., 2003). For each fragment
category, we also calculated gamma diversity (total
number of species considering all spatial replicates). Be-
cause the number of replicates was unequal among frag-
ment categories, gamma diversity was calculated using
the non-parametric estimator Jacknife 2.
A Principal Component Analysis was performedusing the foliage density for five forest strata in the
26 sites in a correlation matrix (centered and stan-
dardized per species) using the package CANOCO
for Windows 4.0 (ter Braak and Smilauer, 1998).
Small mammal total abundance, species abundance
and alpha diversity were regressed against the 26 sites
scores of the first axis of the Principal Component
Analysis. Beta diversity, which is a measure of com-munity composition variability among sites, was re-
gressed against a measure of forest structure
dissimilarity calculated as the linear distance between
site scores on the first axis of the Principal Compo-
nent Analysis. After translating the scale (the smallest
score was set to zero), we calculated the mean of the
modular differences between the score of each site and
the scores of all other sites in the same category ofsize and connectivity.
We used one-way analysis of variance (one-way AN-
OVA) to compare total abundance, species abundance
and alpha and beta diversity among the four categories
of size (continuous forest and large, medium-sized iso-
lated and small isolated fragments, totaling 18 sites). Tu-
key�s pairwise comparisons were run a posteriori when
significant variations were found. To test the effects ofcorridors, we used two-way analysis of variance (two-
way ANOVA), considering fragment size (medium-sized
and small) and presence/absence of corridors (connected
and isolated) as factors (15 sites).
To minimize the influence of forest structure differ-
ences among sites, analyses of variance were run using
the residuals from the regressions of small mammal vari-
ables against the first axis of the Principal ComponentAnalysis described above. Homogeneity of variance
among categories was tested using Bartlett�s test and,
when necessary, data were rank-transformed. Variation
in species abundance was analyzed statistically only for
species captured in more than 20% of the sites and for
which more than 10 individuals were captured in the
group of sites considered in each of the analysis de-
scribed above. All analyses were run in the package SY-STAT 5.03 for Windows (SYSTAT, 1993).
3. Results
As a result of the total sampling effort, 915 individu-
als belonging to 21 species (7 marsupials and 14 rodents)
were captured in Caucaia. No individual was capturedin more than one site. The most common species were
the terrestrial rodents Oligoryzomys nigripes (172 indi-
viduals, 25 sites), Akodon montensis (102, 21), Delomys
sublineatus (75, 22), Oryzomys russatus (35, 9), Brucep-
attersonius aff. iheringi (29, 14) and Thaptomys nigrita
(22, 6); the terrestrial marsupial Monodelphis americana
(43, 16); the scansorial rodent Oryzomys angouya (72,
18); the scansorial marsupials Marmosops incanus (165,25) and Didelphis aurita (64, 21); and the arboreal mar-
supial Gracilinanus microtarsus (18, 9). Fewer than 20
individuals were captured of the terrestrial rodents Oxy-
mycterus cf. dasitrychus, Calomys tener, Cavia aperea,
Bibimys labiosus and Nectomys squamipes; the terrestrial
marsupial Monodelphis macae; the scansorial marsupials
Philander frenata and Marmosops paulensis; and the
arboreal rodents Juliomys pictipes and Phillomys
nigrispinus.
With the exception of the rodents C. tener, C. aperea,
B. labiosus and N. squamipes, all species were captured
in control sites and are considered Atlantic forest species
(Fonseca et al., 1996). While C. tener and C. aperea are
more characteristic of open habitats, B. labiosus is a rare
species whose habitat preference is not known and N.
squamipes is a common Atlantic forest species whichwas not frequently captured because of its semi-aquatic
habit.
3.1. Forest structure
The first axis of the Principal Component Analysis
explained 43.5% of the total variation in forest structure
among the 26 sites. It represented a gradient of increas-ing foliage density in the lower stratum (descriptor
score0�1 m = 0.850) and decreasing foliage density in

258 R. Pardini et al. / Biological Conservation 124 (2005) 253–266
the higher strata (descriptor score10�15 m = �0.775,
descriptor score>15m = �0.680), with forests in earlier
stages of regeneration or subjected to higher levels of
disturbance (lower canopy and denser understory) lo-
cated on the right side of the axis.
Small mammal alpha diversity was not significantlyrelated to the main gradient of vegetation variation
among the 26 sites in Caucaia (R2 = 0.000, p = 0.522,
Fig. 2). Small mammal beta diversity between one site
and all others from the same category of size and con-
nectivity was also not significantly influenced by vegeta-
tion structure dissimilarity between the same sites (Beta
w – R2 = 0.000, p = 0.972, Beta sim – R2 = 0.000,
p = 0.586, Fig. 2). On the other hand, small mammal to-tal abundance was significantly related to the first axis of
the Principal Component Analysis, increasing towards
the forests in earlier stages of regeneration or subjected
to higher levels of disturbance (R2 = 0.159, p = 0.025,
Fig. 2).
Eleven species had more than 10 individuals captured
and occurred in more than 20% of the 26 sites (Fig. 3).
Among those, three rodents (A. montensis, D. sublinea-
tus and O. angouya) were significantly more common,
and one marsupial (M. incanus) tended to be more com-
mon, in forests in earlier stages of regeneration or sub-
jected to higher levels of disturbance (R2 = 0.300,
p = 0.002; R2 = 0.340, p = 0.001; R2 = 0.304, p = 0.002,
R2 = 0.112, p = 0.053, respectively). Alternatively, the
-2 -1 0 1 20
5
10
15
alph
a di
vers
ity
-2 -1 0 1 2
abun
danc
e
0
20
40
60
increase foliage density (0-1 m) decrease foliage density (> 10 m)
PCA 1
PCA 1
mature continuous forest secondary continuous forest large fragments
(a) (
Fig. 2. Relationship of: (a) small mammal total abundance and alpha diversi
Principal Component Analysis (PCA) on foliage density in five forest strata a
between one site and all others from the same category, considering the 26
rodent T. nigrita was significantly more common in
more preserved and mature forests (R2 = 0.179, p =
0.018). The other six analyzed species did not present
significant relationships with the variation in forest
structure.
3.2. Fragment size and corridors
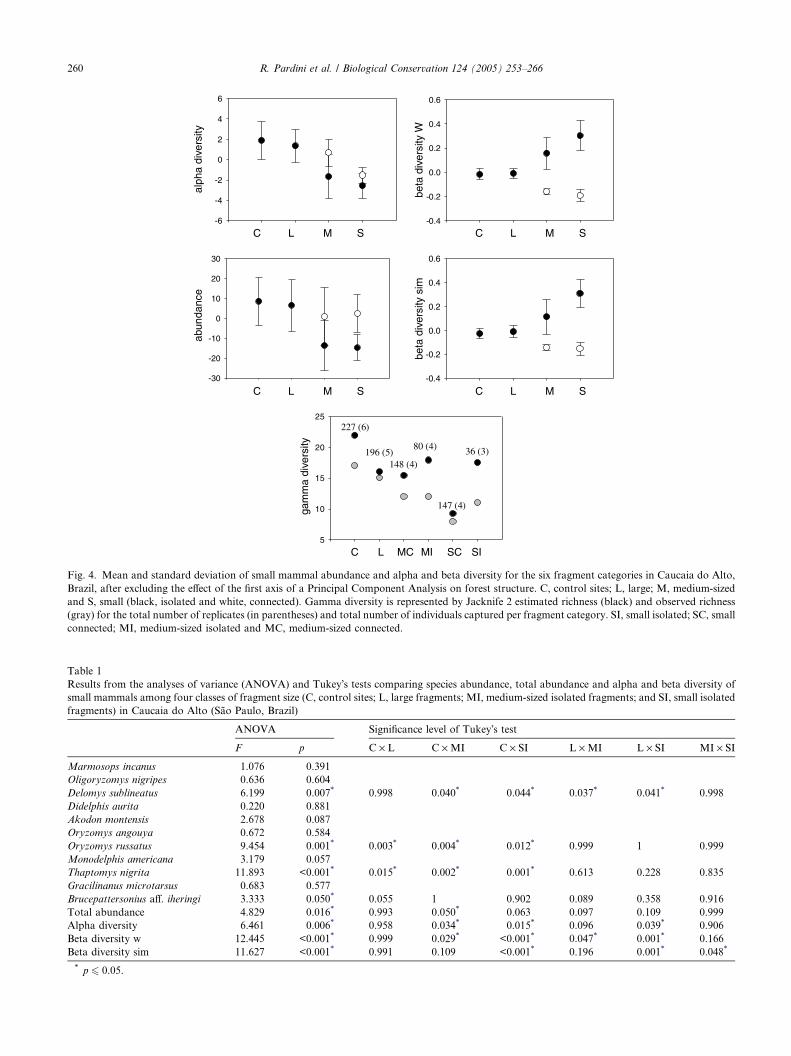
Small mammal total abundance and alpha diversity
decreased with decreasing fragment size. Total abun-
dance was significantly lower in medium-sized isolated
fragments – and tended to be lower in small isolated frag-
ments, compared to control sites (Fig. 4 and Table 1).
Alpha diversity was significantly lower in medium-sizedisolated fragments than in control sites and in small iso-
lated fragments in comparison to large fragments and
control sites (Fig. 4 and Table 1).
On the contrary, the two measures of beta diversity
were higher in smaller fragments. Beta w was signifi-
cantly higher in medium-sized and small isolated frag-
ments than in large fragments and control sites and
Beta sim was significantly higher in small isolated frag-ments than in medium-sized isolated fragments, large
fragments and control sites (Fig. 4 and Table 1).
Eleven species had more than 10 individuals captured
and occurred in more than 20% of the 18 sites located in
continuous forest, large fragments and smaller isolated
fragments (Fig. 5 and Table 1). Two of those (O. russatus
0 1 2 3 4
beta
div
ersi
ty W
beta
div
ersi
ty s
im
1.0
1.2
1.4
1.6
1.8
0 1 2 3 40.0
0.2
0.4
0.6
0.8
dissimilarity in forest structure
dissimilarity in forest structure
b)
medium-sized connected fragments medium-sized isolated fragments small connected fragments small isolated fragments
ty with forest structure, summarized by site scores on the first axis of a
nd (b) small mammal beta diversity and dissimilarity in forest structure
sites of Caucaia do Alto, Brazil.

Thaptomys nigrita
-2 -1 0 1 20
2
4
6
8
Monodelphis americana
-2 -1 0 1 20
1
2
3
4
5
6
7Didelphis aurita
-2 -1 0 1 20
2
4
6
8
10
Gracilinanus microtarsus
-2 -1 0 1 20
1
2
3
4
5Oryzomys russatus
-2 -1 0 1 20
2
4
6
8
10
12
Brucepattersonius aff. iheringi
-2 -1 0 1 20
2
4
6
8
10
12
Oligoryzomys nigripes
-2 -1 0 1 20
5
10
15
20
25
Marmosops incanus
-2 -1 0 1 20
5
10
15
20
Akodon montensis
-2 -1 0 1 20
2
4
6
8
10
12
Oryzomys angouya
-2 -1 0 1 20
2
4
6
8
10
Delomys sublineatus
-2 -1 0 1 20
2
4
6
8
10
12
PCA PCA PCA
PCA PCA PCA
PCA PCA PCA
PCA PCA
increase foliage density (0-1 m) and decrease foliage density (> 10 m)
mature continuous forest secondary continuous forest large fragments medium connected fragments medium isolated fragments small connected fragments small isolated fragments
ecnadnubaecnadnuba
ecnadnubaecnadnuba
Fig. 3. Relationship of the abundance of small mammal species and forest structure, summarized by site scores on the first axis of a Principal
Component Analysis (PCA) on foliage density in five forest strata, considering the 26 sites of Caucaia do Alto, Brazil.
R. Pardini et al. / Biological Conservation 124 (2005) 253–266 259
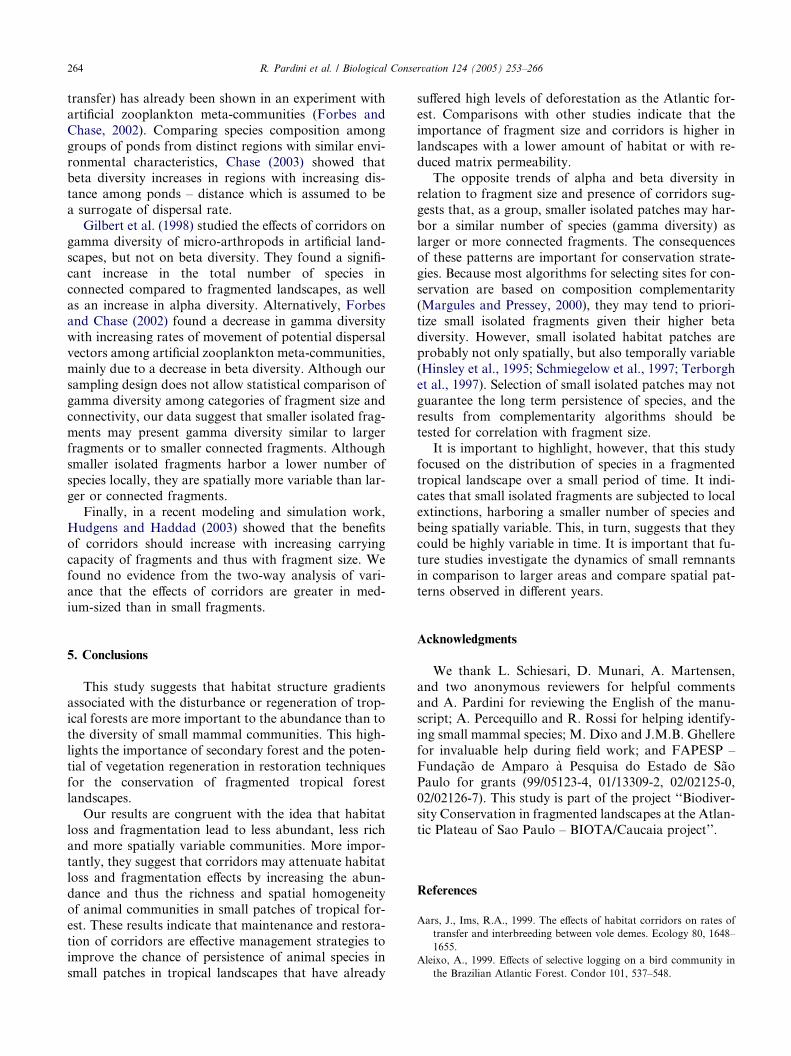
and T. nigrita) were significantly less common in large,medium-sized and small fragments compared to control
sites and D. sublineatus was significantly less common in
medium-sized and small isolated fragments than in large
fragments and control sites (Fig. 5 and Table 1). The
abundance of Brucepattersonius aff. iheringi varied signif-
icantly among fragment size categories, but Tukey a pos-
teriori pairwise comparisons revealed only marginal
significant differences between control sites and largefragments (Fig. 5 and Table 1). The abundance of none
of the analyzed species significantly increased with
decreasing fragment size (Fig. 5 and Table 1).
Small mammal total abundance and alpha diversity
were significantly higher in connected compared to iso-
lated fragments (Fig. 4 and Table 2). Again, beta diver-
sity showed an opposite relationship to that observed
for alpha diversity: it was significantly lower in con-nected than in isolated fragments (Fig. 4 and Table 2).
For none of these four variables, there were significant
differences between small and medium-sized fragmentsor significant interactions between size and connectivity
(Fig. 4 and Table 2).
Eight species had more than 10 individuals captured
and occurred in more than 20% of the 15 sites located
in smaller isolated and connected fragments (Table 2).
One of those (A. montensis) was significantly more com-
mon in connected than in isolated fragments (Fig. 5, Ta-
ble 2). For Brucepattersonius aff. iheringi, there was asignificant interaction between fragment size and the ef-
fect of corridors (Table 2). The abundance of this species
was higher in connected compared to isolated fragments
just when considering medium-sized fragments (Fig. 5).
On the other hand, the abundance of M. americana did
not vary significantly among connected and isolated
fragments, but was significantly higher in medium-sized
than in small fragments (Fig. 5 and Table 2). None ofthe analyzed species was more common in isolated than
in connected fragments (Fig. 5 and Table 2).
-30
-20
-10
0
10
20
30
-6
-4
-2
0
2
4
6
-0.4
-0.2
0.0
0.2
0.4
0.6
C L M SC L M S
C L MC MI SC SI
C L M SC L M S
-0.4
-0.2
0.0
0.2
0.4
0.6
5
10
15
20
25227 (6)
196 (5)148 (4)
80 (4)
147 (4)
36 (3)
beta
div
ersi
ty W
alph
a di
vers
ity
gam
ma
dive
rsity
beta
div
ersi
ty s
im
abun
danc
e
Fig. 4. Mean and standard deviation of small mammal abundance and alpha and beta diversity for the six fragment categories in Caucaia do Alto,
Brazil, after excluding the effect of the first axis of a Principal Component Analysis on forest structure. C, control sites; L, large; M, medium-sized
and S, small (black, isolated and white, connected). Gamma diversity is represented by Jacknife 2 estimated richness (black) and observed richness
(gray) for the total number of replicates (in parentheses) and total number of individuals captured per fragment category. SI, small isolated; SC, small
connected; MI, medium-sized isolated and MC, medium-sized connected.
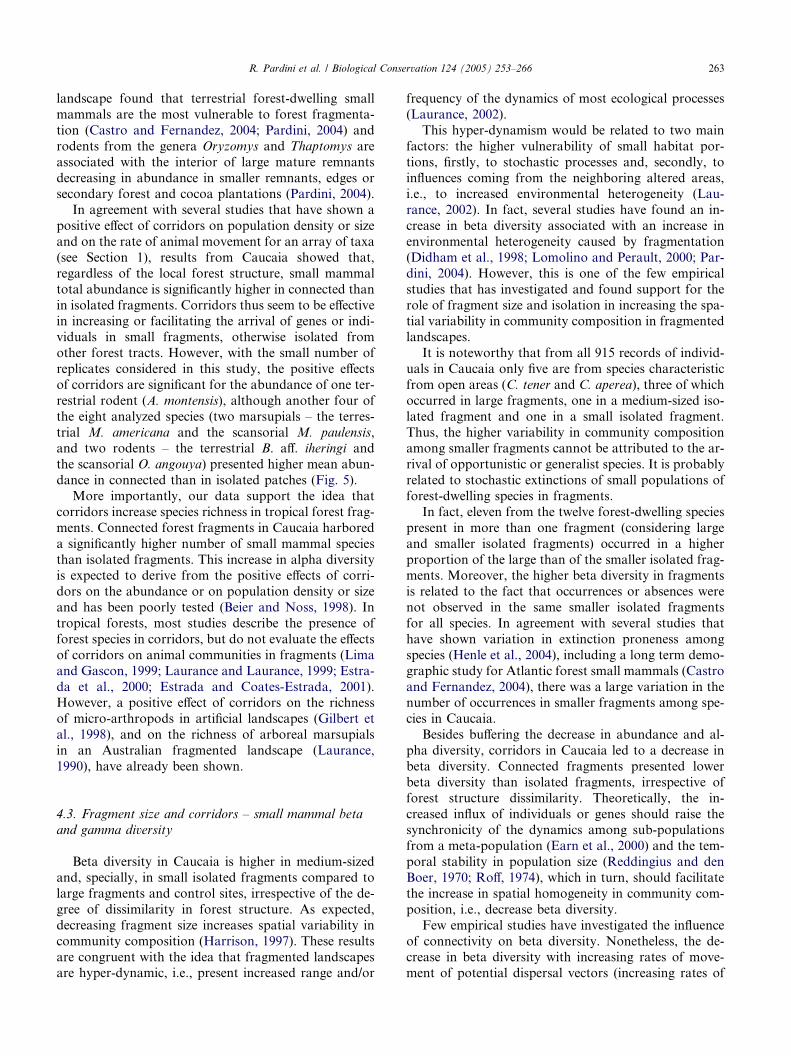
Table 1
Results from the analyses of variance (ANOVA) and Tukey�s tests comparing species abundance, total abundance and alpha and beta diversity of
small mammals among four classes of fragment size (C, control sites; L, large fragments; MI, medium-sized isolated fragments; and SI, small isolated
fragments) in Caucaia do Alto (Sao Paulo, Brazil)
ANOVA Significance level of Tukey�s test
F p C · L C ·MI C · SI L · MI L · SI MI · SI
Marmosops incanus 1.076 0.391
Oligoryzomys nigripes 0.636 0.604
Delomys sublineatus 6.199 0.007* 0.998 0.040* 0.044* 0.037* 0.041* 0.998
Didelphis aurita 0.220 0.881
Akodon montensis 2.678 0.087
Oryzomys angouya 0.672 0.584
Oryzomys russatus 9.454 0.001* 0.003* 0.004* 0.012* 0.999 1 0.999
Monodelphis americana 3.179 0.057
Thaptomys nigrita 11.893 <0.001* 0.015* 0.002* 0.001* 0.613 0.228 0.835
Gracilinanus microtarsus 0.683 0.577
Brucepattersonius aff. iheringi 3.333 0.050* 0.055 1 0.902 0.089 0.358 0.916
Total abundance 4.829 0.016* 0.993 0.050* 0.063 0.097 0.109 0.999
Alpha diversity 6.461 0.006* 0.958 0.034* 0.015* 0.096 0.039* 0.906
Beta diversity w 12.445 <0.001* 0.999 0.029* <0.001* 0.047* 0.001* 0.166
Beta diversity sim 11.627 <0.001* 0.991 0.109 <0.001* 0.196 0.001* 0.048*
* p 6 0.05.
260 R. Pardini et al. / Biological Conservation 124 (2005) 253–266

Oryzomys russatus
C L M S
-2
0
2
4
6
8
10Thaptomys nigrita
C L M S
-2
0
2
4
6Delomys sublineatus
C L M S-4
-2
0
2
4
6
Monodelphis americana
C L M S
-2
0
2
4
Marmosops incanus
C L M S
-6
-3
0
3
6
9
Brucepattersonius aff. iheringi
C L M S
-2
0
2
4
Akodon montensis
C L M S
-4
-2
0
2
4
6Oryzomys angouya
C L M S-4
-2
0
2
4
6 Didelphis aurita
C L M S-4
-2
0
2
4
6
Gracilinanus microtarsus
C L M S-2
-1
0
1
2
3Oligoryzomys nigripes
C L M S-10
-5
0
5
10
15
20
abun
danc
eab
unda
nce
abun
danc
e
abun
danc
e
Fig. 5. Mean and standard deviation of the abundance of small mammal species for the six fragment categories in Caucaia do Alto, Brazil, after
excluding the effect of the first axis of a Principal Component Analysis on forest structure. C, control sites; L, large fragments; M, medium-sized
fragments and S, small fragments (black, isolated and white, connected).
Table 2
Results from the two-way analyses of variance considering the presence/absence of corridors and fragment size (small and medium-sized) for species
abundance, total abundance and alpha and beta diversity of small mammals in Caucaia do Alto (Sao Paulo, Brazil)
Corridors Size Interaction
F p F p F p
Marmosops incanus 1.614 0.230 1.606 0.231 0.026 0.874
Oligoryzomys nigripes 1.676 0.222 1.645 0.226 2.120 0.173
Delomys sublineatus 0.364 0.558 0.566 0.468 1.339 0.272
Didelphis aurita 0.004 0.953 0.010 0.922 0.005 0.944
Akodon montensis 10.254 0.008* 0.863 0.373 0.066 0.802
Oryzomys angouya 1.621 0.229 0.552 0.473 0.281 0.606
Monodelphis americana 0.364 0.558 14.374 0.003* 0.099 0.759
Brucepattersonius aff. iheringi 3.840 0.076 1.987 0.186 5.243 0.043*
Total abundance 6.999 0.023* 0.002 0.965 0.058 0.814
Alpha diversity 4.835 0.050* 4.054 0.069 0.699 0.421
Beta diversity w 72.260 <0.001* 1.267 0.284 3.547 0.086
Beta diversity sim 51.817 <0.001* 3.447 0.090 4.360 0.061
* p 6 0.05.
R. Pardini et al. / Biological Conservation 124 (2005) 253–266 261

262 R. Pardini et al. / Biological Conservation 124 (2005) 253–266
Gamma diversity estimated by Jacknife 2 was higher
for continuous forest, followed by medium-sized and
small isolated fragments, despite the low number of indi-
viduals captured in these fragments (Fig. 4).
4. Discussion
4.1. Forest structure
Fragments in Caucaia presented a large variation in
forest structure, which was associated with an increase
in foliage density in the lower stratum and a decrease
in foliage density in the higher strata of the forest. Thisgradient in the vertical stratification is observed not only
among tropical forest cronosequences (Guariguata and
Ostertag, 2001; Pardini, 2001; DeWalt et al., 2003),
but also among tropical forests that have suffered differ-
ent intensities of edge effects (Malcolm, 1994; Pardini,
2001) and of human disturbances such as selective log-
ging (Malcolm and Ray, 2000).
For small mammals, this structural gradient may rep-resent a gradient of forest quality. In general, earlier
regeneration stages present higher productivity and
higher proportion of biomass on leaves than on wood
(Guariguata and Ostertag, 2001), probably offering
higher food availability to small mammals, which feed
mainly on fruits and arthropods. In fact, foliage density
is positively related to arthropod biomass (Malcolm,
1997b) and the availability of fleshy fruits is higher inearlier regeneration stages (DeWalt et al., 2003). The in-
creased abundance of small mammals in forests in ear-
lier stages of regeneration or subjected to higher levels
of disturbance in Caucaia is probably due to an increase
in the productivity and availability of food to species not
restricted by specific resources. The same relationship
between the abundance of Neotropical small mammals
and changes in the vertical structure of the forest wasobserved in the Amazon forest (Malcolm, 1995) and in
the Atlantic forest (Vieira et al., 2003b).
Because of this, Neotropical small mammal species
were considered to be adapted to secondary habitats,
or to be highly resilient to changes in habitat structure
(Malcolm, 1997a). As observed for other groups such
as birds (Aleixo, 1999), however, the results from Cau-
caia suggest that there are some small mammal speciesclearly associated with mature Atlantic forest. This is
the case for relatively common species such as T. nigrita
and, possibly, M. americana, which increase in abun-
dance in mature forest sites.
4.2. Fragment size and corridors – small mammal
abundance and alpha diversity
Regardless of the variation in forest structure, frag-
ment size influenced not only small mammal total abun-
dance, but also small mammal diversity. Fragments
smaller than 50 ha (small and medium-sized) structur-
ally isolated from other forest tracts presented a small
mammal community with fewer individuals and species
than would be expected from their local forest structure,
indicating that these fragments are below their carryingcapacity.
On the contrary, previous studies in Neotropical for-
ests found an increase in small mammal richness and/or
total abundance with decreasing fragment size in Man-
aus, Amazonia (Malcolm, 1995) and in Una, South Ba-
hia (Pardini, 2004). These increases were related to edge-
induced vegetation changes in smaller fragments, which
in both landscapes were of mature forest. Increasedmortality rate of large trees due to an increased wind im-
pact is the main cause of the altered vertical structure at
edges in tropical remnants of mature forest (Malcolm,
1994; Laurance et al., 1998). Because of the small num-
ber of large trees characteristic of secondary forest, edge
effects on forest structure are probably less intense in
secondary remnants, like those sampled in Caucaia.
Moreover, in Una and Manaus, the proportion ofremaining habitat in the landscape is well above the the-
oretical threshold at which the importance of spatial
configuration of remnants to species maintenance dras-
tically increases (fragmentation threshold – Andren,
1994; Fahrig, 1997; Develey and Metzger, in press),
while this proportion in Caucaia (31%) is close to the
threshold. The permeability of the matrix in both land-
scapes was also probably higher than in Caucaia, con-taining a larger proportion of altered habitats with a
forested structure. Thus, the low proportion of forested
habitats (both forest and forested habitats of the matrix)
in Caucaia could explain the increase in the relative
importance of fragment size in determining animal com-
munities in comparison to previously studied
landscapes.
Among species, the effect of fragment size reductionin Caucaia seems to be especially important to three ter-
restrial rodents (O. russatus, T. nigrita and D. sublinea-
tus), which are the dominant rodent species in
continuous forest sites representing 31% of the individu-
als captured there. The idea that these common terres-
trial rodents are the small mammals most vulnerable
to Atlantic forest fragmentation is supported by the
sparse information in the literature. Community studiesconducted in large forest tracts indicate that one of the
most common small mammal species in continuous
Atlantic forest is a terrestrial rodent from the genus Ory-
zomys (Bergallo, 1994; Bergallo and Magnusson, 1999;
Vieira and Monteiro-Filho, 2003; Pardini, 2004). In
small or altered Atlantic forest remnants, however, Ory-
zomys is not the dominant species or is not present (Stal-
lings, 1989; Paglia et al., 1995; Stevens and Husband,1998; Pires et al., 2002; Pardini, 2004). The few studies
considering several Atlantic forest fragments in the same
R. Pardini et al. / Biological Conservation 124 (2005) 253–266 263
landscape found that terrestrial forest-dwelling small
mammals are the most vulnerable to forest fragmenta-
tion (Castro and Fernandez, 2004; Pardini, 2004) and
rodents from the genera Oryzomys and Thaptomys are
associated with the interior of large mature remnants
decreasing in abundance in smaller remnants, edges orsecondary forest and cocoa plantations (Pardini, 2004).
In agreement with several studies that have shown a
positive effect of corridors on population density or size
and on the rate of animal movement for an array of taxa
(see Section 1), results from Caucaia showed that,
regardless of the local forest structure, small mammal
total abundance is significantly higher in connected than
in isolated fragments. Corridors thus seem to be effectivein increasing or facilitating the arrival of genes or indi-
viduals in small fragments, otherwise isolated from
other forest tracts. However, with the small number of
replicates considered in this study, the positive effects
of corridors are significant for the abundance of one ter-
restrial rodent (A. montensis), although another four of
the eight analyzed species (two marsupials – the terres-
trial M. americana and the scansorial M. paulensis,and two rodents – the terrestrial B. aff. iheringi and
the scansorial O. angouya) presented higher mean abun-
dance in connected than in isolated patches (Fig. 5).
More importantly, our data support the idea that
corridors increase species richness in tropical forest frag-
ments. Connected forest fragments in Caucaia harbored
a significantly higher number of small mammal species
than isolated fragments. This increase in alpha diversityis expected to derive from the positive effects of corri-
dors on the abundance or on population density or size
and has been poorly tested (Beier and Noss, 1998). In
tropical forests, most studies describe the presence of
forest species in corridors, but do not evaluate the effects
of corridors on animal communities in fragments (Lima
and Gascon, 1999; Laurance and Laurance, 1999; Estra-
da et al., 2000; Estrada and Coates-Estrada, 2001).However, a positive effect of corridors on the richness
of micro-arthropods in artificial landscapes (Gilbert et
al., 1998), and on the richness of arboreal marsupials
in an Australian fragmented landscape (Laurance,
1990), have already been shown.
4.3. Fragment size and corridors – small mammal beta
and gamma diversity
Beta diversity in Caucaia is higher in medium-sized
and, specially, in small isolated fragments compared to
large fragments and control sites, irrespective of the de-
gree of dissimilarity in forest structure. As expected,
decreasing fragment size increases spatial variability in
community composition (Harrison, 1997). These results
are congruent with the idea that fragmented landscapesare hyper-dynamic, i.e., present increased range and/or
frequency of the dynamics of most ecological processes
(Laurance, 2002).
This hyper-dynamism would be related to two main
factors: the higher vulnerability of small habitat por-
tions, firstly, to stochastic processes and, secondly, to
influences coming from the neighboring altered areas,i.e., to increased environmental heterogeneity (Lau-
rance, 2002). In fact, several studies have found an in-
crease in beta diversity associated with an increase in
environmental heterogeneity caused by fragmentation
(Didham et al., 1998; Lomolino and Perault, 2000; Par-
dini, 2004). However, this is one of the few empirical
studies that has investigated and found support for the
role of fragment size and isolation in increasing the spa-tial variability in community composition in fragmented
landscapes.
It is noteworthy that from all 915 records of individ-
uals in Caucaia only five are from species characteristic
from open areas (C. tener and C. aperea), three of which
occurred in large fragments, one in a medium-sized iso-
lated fragment and one in a small isolated fragment.
Thus, the higher variability in community compositionamong smaller fragments cannot be attributed to the ar-
rival of opportunistic or generalist species. It is probably
related to stochastic extinctions of small populations of
forest-dwelling species in fragments.
In fact, eleven from the twelve forest-dwelling species
present in more than one fragment (considering large
and smaller isolated fragments) occurred in a higher
proportion of the large than of the smaller isolated frag-ments. Moreover, the higher beta diversity in fragments
is related to the fact that occurrences or absences were
not observed in the same smaller isolated fragments
for all species. In agreement with several studies that
have shown variation in extinction proneness among
species (Henle et al., 2004), including a long term demo-
graphic study for Atlantic forest small mammals (Castro
and Fernandez, 2004), there was a large variation in thenumber of occurrences in smaller fragments among spe-
cies in Caucaia.
Besides buffering the decrease in abundance and al-
pha diversity, corridors in Caucaia led to a decrease in
beta diversity. Connected fragments presented lower
beta diversity than isolated fragments, irrespective of
forest structure dissimilarity. Theoretically, the in-
creased influx of individuals or genes should raise thesynchronicity of the dynamics among sub-populations
from a meta-population (Earn et al., 2000) and the tem-
poral stability in population size (Reddingius and den
Boer, 1970; Roff, 1974), which in turn, should facilitate
the increase in spatial homogeneity in community com-
position, i.e., decrease beta diversity.
Few empirical studies have investigated the influence
of connectivity on beta diversity. Nonetheless, the de-crease in beta diversity with increasing rates of move-
ment of potential dispersal vectors (increasing rates of
264 R. Pardini et al. / Biological Conservation 124 (2005) 253–266
transfer) has already been shown in an experiment with
artificial zooplankton meta-communities (Forbes and
Chase, 2002). Comparing species composition among
groups of ponds from distinct regions with similar envi-
ronmental characteristics, Chase (2003) showed that
beta diversity increases in regions with increasing dis-tance among ponds – distance which is assumed to be
a surrogate of dispersal rate.
Gilbert et al. (1998) studied the effects of corridors on
gamma diversity of micro-arthropods in artificial land-
scapes, but not on beta diversity. They found a signifi-
cant increase in the total number of species in
connected compared to fragmented landscapes, as well
as an increase in alpha diversity. Alternatively, Forbesand Chase (2002) found a decrease in gamma diversity
with increasing rates of movement of potential dispersal
vectors among artificial zooplankton meta-communities,
mainly due to a decrease in beta diversity. Although our
sampling design does not allow statistical comparison of
gamma diversity among categories of fragment size and
connectivity, our data suggest that smaller isolated frag-
ments may present gamma diversity similar to largerfragments or to smaller connected fragments. Although
smaller isolated fragments harbor a lower number of
species locally, they are spatially more variable than lar-
ger or connected fragments.
Finally, in a recent modeling and simulation work,
Hudgens and Haddad (2003) showed that the benefits
of corridors should increase with increasing carrying
capacity of fragments and thus with fragment size. Wefound no evidence from the two-way analysis of vari-
ance that the effects of corridors are greater in med-
ium-sized than in small fragments.
5. Conclusions
This study suggests that habitat structure gradientsassociated with the disturbance or regeneration of trop-
ical forests are more important to the abundance than to
the diversity of small mammal communities. This high-
lights the importance of secondary forest and the poten-
tial of vegetation regeneration in restoration techniques
for the conservation of fragmented tropical forest
landscapes.
Our results are congruent with the idea that habitatloss and fragmentation lead to less abundant, less rich
and more spatially variable communities. More impor-
tantly, they suggest that corridors may attenuate habitat
loss and fragmentation effects by increasing the abun-
dance and thus the richness and spatial homogeneity
of animal communities in small patches of tropical for-
est. These results indicate that maintenance and restora-
tion of corridors are effective management strategies toimprove the chance of persistence of animal species in
small patches in tropical landscapes that have already
suffered high levels of deforestation as the Atlantic for-
est. Comparisons with other studies indicate that the
importance of fragment size and corridors is higher in
landscapes with a lower amount of habitat or with re-
duced matrix permeability.
The opposite trends of alpha and beta diversity inrelation to fragment size and presence of corridors sug-
gests that, as a group, smaller isolated patches may har-
bor a similar number of species (gamma diversity) as
larger or more connected fragments. The consequences
of these patterns are important for conservation strate-
gies. Because most algorithms for selecting sites for con-
servation are based on composition complementarity
(Margules and Pressey, 2000), they may tend to priori-tize small isolated fragments given their higher beta
diversity. However, small isolated habitat patches are
probably not only spatially, but also temporally variable
(Hinsley et al., 1995; Schmiegelow et al., 1997; Terborgh
et al., 1997). Selection of small isolated patches may not
guarantee the long term persistence of species, and the
results from complementarity algorithms should be
tested for correlation with fragment size.It is important to highlight, however, that this study
focused on the distribution of species in a fragmented
tropical landscape over a small period of time. It indi-
cates that small isolated fragments are subjected to local
extinctions, harboring a smaller number of species and
being spatially variable. This, in turn, suggests that they
could be highly variable in time. It is important that fu-
ture studies investigate the dynamics of small remnantsin comparison to larger areas and compare spatial pat-
terns observed in different years.
Acknowledgments
We thank L. Schiesari, D. Munari, A. Martensen,
and two anonymous reviewers for helpful commentsand A. Pardini for reviewing the English of the manu-
script; A. Percequillo and R. Rossi for helping identify-
ing small mammal species; M. Dixo and J.M.B. Ghellere
for invaluable help during field work; and FAPESP –
Fundacao de Amparo a Pesquisa do Estado de Sao
Paulo for grants (99/05123-4, 01/13309-2, 02/02125-0,
02/02126-7). This study is part of the project ‘‘Biodiver-
sity Conservation in fragmented landscapes at the Atlan-tic Plateau of Sao Paulo – BIOTA/Caucaia project’’.
References
Aars, J., Ims, R.A., 1999. The effects of habitat corridors on rates of
transfer and interbreeding between vole demes. Ecology 80, 1648–
1655.
Aleixo, A., 1999. Effects of selective logging on a bird community in
the Brazilian Atlantic Forest. Condor 101, 537–548.

R. Pardini et al. / Biological Conservation 124 (2005) 253–266 265
Andren, H., 1994. Effects of habitat fragmentation on birds and
mammals in landscapes with different proportions of suitable
habitat: a review. Oikos 71, 355–364.
Beier, P., Noss, R.F., 1998. Do habitat corridors provide connectivity?
Conservation Biology 12, 1241–1251.
Bergallo, H.G., 1994. Ecology of small mammal community in an
Atlantic Forest area in southeastern Brazil. Studies on Neotropical
Fauna and Environment 29, 197–217.
Bergallo, H.G., Magnusson, W.E., 1999. Effects of climate and food
availability on four rodent species in southeastern Brazil. Journal
of Mammalogy 80, 472–486.
Brown, J.H., Kodric-Brown, A., 1977. Turnover rates in insular
biogeography: effect of immigration on extinction. Ecology 58,
445–449.
Castro, E.B.V., Fernandez, F.A.S., 2004. Determinants of differential
extinction vulnerabilities of small mammals in Atlantic forest
fragments in Brazil. Biological Conservation 119, 73–80.
Chase, J.M., 2003. Community assembly: when should history matter?
Oecologia 136, 489–498.
Cochrane, M.A., 2001. Synergetic interactions between habitat frag-
mentation and fire in evergreen tropical forests. Conservation
Biology 15, 1515–1521.
Develey, P.F., Metzger, J.P., in press. Birds in Atlantic forest
landscapes: effects of forest cover and configuration. In: Laurance,
W.F., Peres, C.A. (Eds.), Emerging Threats to Tropical Forests.
University of Chicago Press, Chicago.
DeWalt, S.J., Maliakal, S.K., Denslow, J.S., 2003. Changes in
vegetation structure and composition along a tropical forest
chronosequence: implications for wildlife. Forest Ecology and
Management 182, 139–151.
Didham, R.K., Hammond, P.M., Lawton, J.H., Eggleton, P., Stork,
N.E., 1998. Beetle species response to tropical forest fragmentation.
Ecological Monographs 68, 295–323.
Dunning, J.B., Borgella, J.R., Clements, K., Meffe, G.K., 1995. Patch
isolation, corridor effects, and colonization by a resident sparrow in
a managed pine woodland. Conservation Biology 9, 542–550.
Earn, D.J.D., Levin, S.A., Rohani, P., 2000. Coherence and conser-
vation. Science 290, 1360–1364.
Estrada, A., Cammarano, P., Coates-Estrada, R., 2000. Bird species
richness in vegetation fences and in strips of residual rain forest
vegetation at Los Tuxtlas, Mexico. Biodiversity and Conservation
9, 1399–1416.
Estrada, A., Coates-Estrada, R., 2001. Bat species richness in live
fences and in corridors of residual rain forest vegetation at Los
Tuxtlas, Mexico. Ecography 24, 94–102.
Fahrig, L., 1997. Relative effects of habitat loss and fragmentation on
population extinction. Journal of Wildlife Management 61, 603–
610.
Fahrig, L., 2003. Effects of habitat fragmentation on biodiversity.
Annual Reviews in Ecology, Evolution and Systematics 34, 487–
515.
Feliciano, B.R., Fernandez, F.A.S., Freitas, D., de Figueiredo, M.S.L.,
2002. Population dynamics of small rodents in a grassland between
fragments of Atlantic Forest in southeastern Brazil. Mammalian
Biology 67, 304–314.
Fonseca, G.A.B., Herrmann, G., Leite, Y.L.R., Mittermeier, R.A.,
Rylands, A.B., Patton, J.L., 1996. Lista anotada dos mamı´ feros do
Brasil. Occasional Papers in Conservation Biology 4, 1–38.
Fonseca, G.A.B., Robinson, J.G., 1990. Forest size and structure:
competitive and predatory effects on small mammal communities.
Biological Conservation 53, 265–294.
Forbes, A.E., Chase, J.M., 2002. The role of habitat connectivity and
landscape geometry in experimental zooplankton metacommuni-
ties. Oikos 96, 433–440.
Gentile, R., Fernandez, F.A.S., 1999. Influence of habitat structure on
a streamside small mammal community in a Brazilian rural area.
Mammalia 63, 29–40.
Gilbert, F., Gonzalez, A., Evans-Freke, I., 1998. Corridors maintain
species richness in the fragmented landscapes of a microecosystem.
Proceedings of the Royal Society of London, Series B, Biological
Sciences 265, 577–582.
Gonzalez, A., Lawton, J.H., Gilbert, F.S., Blackburn, T.M., Evans-
Freke, I., 1998. Metapopulation dynamics, abundance, and distri-
bution in a microecosystem. Science 281, 2045–2047.
Grelle, C.E.V., 2003. Forest structure and vertical stratification of
small mammals in a secondary Atlantic forest, southeastern Brazil.
Studies on Neotropical Fauna and Environment 38, 81–85.
Grelle, C.E.V., Garcia, Q.S., 1999. Potential dispersal of Cecropia
hololeuca by the common opossum (Didelphis aurita) in Atlantic
forest, southeastern Brazil. Revue D�Ecologie – La Terre et La Vie
54, 327–332.
Guariguata, M.R., Ostertag, R., 2001. Neotropical secondary forest
succession: changes in structural and functional characteristics.
Forest Ecology and Management 148, 185–206.
Haddad, N.M., 1999. Corridor use predicted from behaviors at habitat
boundaries. The American Naturalist 153, 215–227.
Haddad, N.M., Baum, K.A., 1999. An experimental test of corridors
on butterfly densities. Ecological Applications 9, 623–633.
Hale, M.L., Lurz, P.W.W., Shirley, M.D.F., Rushton, S., Fuller,
R.M., Wolff, K., 2001. Impact of landscape management on the
genetic structure of red squirrel population. Science 293, 2246–
2248.
Harrison, S., 1997. How natural habitat patchiness affects the
distribution of diversity in Californian Serpentine Chaparral.
Ecology 78, 1898–1906.
Henle, K., Davies, K.F., Kleyer, M., Margules, C., Settele, J., 2004.
Predictors of species sensitivities to fragmentation. Biodiversity and
Conservation 13, 207–251.
Hice, C.L., Schmidly, D., 2002. The effectiveness of pitfall traps for
sampling small mammals in the Amazon basin. Mastozoologia
Neotropical/Journal of Neotropical Mammalogy 9, 85–89.
Hinsley, S.A., Bellamy, P.E., Newton, I., 1995. Bird species turnover
and stochastic extinction in woodland fragments. Ecography 18,
41–50.
Hudgens, B.R., Haddad, N.M., 2003. Predicting which species will
benefit from corridors in fragmented landscapes from population
growth models. The American Naturalist 161, 808–820.
Hurlbert, S.H., 1984. Pseudoreplication and the design of ecological
field experiments. Ecological Monographs 54, 184–201.
Koleff, P., Gaston, K.J., Lennon, J.J., 2003. Measuring beta diversity
for presence–absence data. Journal of Animal Ecology 72, 367–382.
Laurance, W.F., 1990. Comparative responses of five arboreal
marsupials to tropical forest fragmentation. Journal of Mammal-
ogy 71, 641–653.
Laurance, W.F., 2002. Hyperdynamism in fragmented habitats.
Journal of Vegetation Science 13, 595–602.
Laurance, W.F., Bierregaard, R.O., 1997. Tropical Forest Remnants –
Ecology, Management, and Conservation of Fragmented Commu-
nities. University of Chicago Press, Chicago.
Laurance, S.G., Laurance, W.F., 1999. Tropical forest corridors: use
of linear rainforest remnants by arboreal mammals. Biological
Conservation 91, 231–239.
Laurance, W.F., Cochrane, M.A., 2001. Synergetic effects in frag-
mented landscapes. Conservation Biology 15, 1488–1489.
Laurance, W.F., Ferreira, L.V., Rankin-de Merona, J.M.,
Laurance, S.G., 1998. Rain forest fragmentation and the
dynamics of Amazonian tree communities. Ecology 79, 2032–
2040.
Lennon, J.J., Koleff, P., Greenwood, J.J.D., Gaston, K.J., 2001. The
geographical structure of British bird distributions: diversity,
spatial turnover and scale. Journal of Animal Ecology 70, 966–979.
Lima, M.G., Gascon, C., 1999. The conservation value of linear forest
remnants in Central Amazonia. Biological Conservation 91, 241–
247.

266 R. Pardini et al. / Biological Conservation 124 (2005) 253–266
Lomolino, M.V., Perault, D.R., 2000. Assembly and disassembly of
mammal communities in a fragmented temperate rain forest.
Ecology 81, 1517–1532.
Loreau, M., 2000. Are communities saturated? On the relationship of
alpha, beta and gamma diversity. Ecological Letters 3, 73–76.
Lyra-Jorge, M.C., Pivello, V.R., 2001. Combining live trap and pitfall
to survey terrestrial small mammals in savanna and forest habitats,
in Brazil. Mammalia 65, 524–530.
Malcolm, J.R., 1994. Edge effects in central Amazonian forest
fragments. Ecology 75, 2438–2445.
Malcolm, J.R., 1995. Forest structure and the abundance and diversity
ofNeotropical smallmammals. In: Lowman,M.D.,Nadkarni,N.M.
(Eds.), Forest Canopies. Academic Press, San Diego, pp. 179–197.
Malcolm, J.R., 1997a. Biomass and diversity of small mammals in
Amazonian forest fragments. In: Laurance, W.F., Bierregaard,
R.O. (Eds.), Tropical Forest Remnants. University of Chicago
Press, Chicago, pp. 207–221.
Malcolm, J.R., 1997b. Insect biomass in Amazonian forest fragments.
In: Stork, N.E., Adis, J., Didham, R.K. (Eds.), Canopy Arthro-
pods. Chapman & Hall, London, pp. 510–533.
Malcolm, J.R., Ray, J.C., 2000. Influence of timber extraction routes
on Central African small-mammal communities, forest structure,
and tree diversity. Conservation Biology 14, 1623–1638.
Margules, C.R., Pressey, R.L., 2000. Systematic conservation plan-
ning. Nature 405, 243–253.
Mech, S.G., Hallett, J.G., 2001. Evaluating the effectiveness of
corridors: a genetic approach. Conservation Biology 15, 467–474.
Myers, N., Mittermeier, R.A., Mittermeier, C.G., Fonseca, G.A.B.,
Kent, J., 2000. Biodiversity hotspots for conservation priorities.
Nature 403, 853–858.
Oliveira-Filho, A.T., Fontes, M.A.L., 2000. Patterns of floristic
differentiation among Atlantic Forests in Southeastern Brazil and
the influence of climate. Biotropica 32, 793–810.
Orrock, J.L., Danielson, B.J., Burns, M.J., Levey, D.J., 2003. Spatial
ecology of predator–prey interactions: corridors and patch shape
influence seed predation. Ecology 84, 2589–2599.
Paglia, A.P., Marco, P., de Costa, F.M., Pereira, R.F., Lessa, G., 1995.
Heterogeneidade estrutural e diversidade de pequenos mamı´ feros
em um fragmento de mata secundaria de Minas Gerais, Brasil.
Revista Brasileira de Zoologia 12, 67–79.
Pardini, R., 2001. Pequenos Mamı´ feros e a Fragmentacao da Mata
Atlantica de Una, Sul da Bahia – Processos e Conservacao. PhD
Thesis, Universidade de Sao Paulo, Sao Paulo.
Pardini, R., 2004. Effects of forest fragmentation on small mammals in
an Atlantic Forest landscape. Biodiversity and Conservation 13,
2567–2586.
Pardini, R., Umetsu, F., in press. Small mammals from the Morro
Grande Reserve – distribution of species and diversity in an
Atlantic Forest area. Biota Neotropica.
Pimentel, D.S., Tabarelli, M., 2004. Seed dispersal of the palm Attalea
oleifera in a remnant of the Brazilian Atlantic Forest. Biotropica
36, 74–84.
Pires, A.S., Lira, P.K., Fernandez, F.A.S., Schittini, G.M., Oliveira,
L.C., 2002. Frequency of movements of small mammals among
Atlantic Coastal Forest fragments in Brazil. Biological Conserva-
tion 108, 229–237.
Pizo, M.A., 1997. Seed dispersal and predation in two populations of
Cabralea canjerana (Meliaceae) in the Atlantic Forest of south-
eastern Brazil. Journal of Tropical Ecology 13, 559–578.
Reddingius, J., den Boer, P., 1970. Simulation experiments illustrating
stabilization of animal numbers by spreading of risk. Oecologia 5,
240–284.
Roff, D., 1974. The analysis of a population model demonstrating the
importance of dispersal in a heterogeneous environment. Oecologia
15, 259–275.
Ross, J.L.S., Moroz, I.C., 1997. Mapa Geomorfologico do Estado de
Sao Paulo: escala 1:500.000. FFLCH-USP, IPT and FAPESP, Sao
Paulo.
Schmiegelow, F.K.A., Machtans, C.S., Hannon, S.J., 1997. Are
boreal birds resilient to forest fragmentation? An experimental
study of short-term community responses. Ecology 78, 1914–
1932.
Simberloff, D., Farr, J.A., Cox, J., Mehlman, D.W., 1992. Movement
corridors: conservation bargains or poor investments? Conserva-
tion Biology 6, 493–504.
Slade, N.A., Blair, S.M., 2000. An empirical test of using counts of
individuals as indices of population size. Journal of Mammalogy
81, 1035–1045.
Stallings, J.R., 1989. Small mammal inventories in an eastern Brazilian
park. Bulletin Florida State Museum 34, 153–200.
Stevens, S.M., Husband, T.P., 1998. The influence of edge on small
mammals: evidence from Brazilian Atlantic Forest fragments.
Biological Conservation 85, 1–8.
SYSTAT, Inc. 1993. Systat 5.03 for Windows.
ter Braak, C.J.F., Smilauer, P., 1998. CANOCO for windows version
4.0. Center for biometry Wageningen CPRO-DLO, Wageningen,
The Netherlands.
Terborgh, J., Lopez, L., Tello, J., 1997. Bird communities in transition:
the lago Guri islands. Ecology 78, 1494–1501.
Tewksbury, J.J., Levey, D.J., Haddad, N.M., Sargent, S., Orrock, J.L.,
Weldon, A., Danielson, B.J., Brinkerhoff, J., Damschen, E.I.,
Townsend, P., 2002. Corridors affect plants, animals, and their
interactions in fragmented landscapes. Proceedings of the National
Academy of Sciences of the United States of America 99, 12923–
12926.
Tews, J., Brose, U., Grimm, V., Tielborger, K., Wichmann, M.C.,
Schwager, M., Jeltsch, F., 2004. Animal species diversity driven by
habitat heterogeneity/diversity: the importance of keystone struc-
tures. Journal of Biogeography 31, 79–92.
Uezu, A., Metzger, J.P., Vielliard, J.M.E., in press. Effects of
structural and functional connectivity and patch size on the
abundance of seven Atlantic Forest bird species. Biological
Conservation.
Vieira, E.M., Izar, P., 1999. Interactions between aroids and arboreal
mammals in the Brazilian Atlantic rainforest. Plant ecology 145,
75–82.
Vieira, E.M., Monteiro-Filho, E.L.A., 2003. Vertical stratification of
small mammals in the Atlantic rain forest of south-eastern Brazil.
Journal of Tropical Ecology 19, 501–507.
Vieira, E.M., Pizo, M.A., Izar, P., 2003a. Fruit and seed exploitation
by small rodents of the Brazilian Atlantic forest. Mammalia 67,
533–539.
Vieira, M.V., Faria, D., Fernandez, F., Ferrari, S., Freitas, S., Gaspar,
D.A., Moura, R., Olifiers, N., de Oliveira, P.P., Pardini, R., Pires,
A., Ravetta, A., de Mello, M.A.R., Ruiz, C., Setz, E., 2003b.
Mamı´ feros. In: Rambaldi, D.M., Oliveira, D.A.S. (Eds.), Frag-
mentacao de Ecossistemas: Causas, Efeitos sobre a Biodiversidade
e Recomendacoes de Polıticas Publicas. MMA/SBF, Brasılia, pp.
125–151.
Wilcox, B.A., Murphy, D.D., 1985. Conservation strategy: effects of
fragmentation on extinction. The American Naturalist 125, 879–
887.
Whittaker, R.H., 1960. Vegetation of the Siskiyou Mountains, Oregon
and California. Ecological Monographs 30, 279–338.
Related Documents