1 The Role of Child Skills and Behaviors in the Intergenerational Transmission of Inequality: A Cross-National Study Greg J. Duncan, Lars Bergman, Kathryn Duckworth, Katja Kokko, Anna-Liisa Lyyra, Molly Metzger, Lea Pulkkinen, Sharon Simonton I. Introduction The degree to which grown children mimic the socioeconomic accomplishments of their parents differs markedly from one country to another. Using parent/child correlations in completed schooling as a measure of intergenerational persistence of socioeconomic status, Hertz et al. (2007) find that correlations range from an average of .39 in Western Europe and the United States to .60 in Latin America. Correlations differ even within region: equality-oriented Nordic countries in the Hertz et al. (2007) study posted correlations that averaged .34, while the non-Nordic average was .41. In a structurally rigid society, parents may be able to play a direct role in securing their children’s careers, while schools may reinforce parent actions through, for example, “legacy” admissions to elite colleges (Karabel, 2005). In a more competitive society, the process is likely to be indirect, where higher status parents attempt to ensure that their children acquire the kinds of skills and behaviors that boost their chances of gaining access to good schools and securing jobs similar in status to those of their parents. Under what conditions can parents succeed in passing their socioeconomic advantages on to their children by boosting their children’s job-related skills and behaviors? In equal opportunity societies, institutions and other policies boost the skills and behaviors of low socioeconomic status (SES) children in ways that fully offset the skill and behavioral advantages imparted by parent efforts. Unequal opportunity societies – those allowing school and neighborhood quality to reinforce family advantage and disadvantage – should see growing skill

Welcome message from author
This document is posted to help you gain knowledge. Please leave a comment to let me know what you think about it! Share it to your friends and learn new things together.
Transcript

1
The Role of Child Skills and Behaviors in the Intergenerational Transmission of Inequality: A Cross-National Study
Greg J. Duncan, Lars Bergman, Kathryn Duckworth, Katja Kokko, Anna-Liisa Lyyra, Molly
Metzger, Lea Pulkkinen, Sharon Simonton
I. Introduction
The degree to which grown children mimic the socioeconomic accomplishments of their
parents differs markedly from one country to another. Using parent/child correlations in
completed schooling as a measure of intergenerational persistence of socioeconomic status,
Hertz et al. (2007) find that correlations range from an average of .39 in Western Europe and the
United States to .60 in Latin America. Correlations differ even within region: equality-oriented
Nordic countries in the Hertz et al. (2007) study posted correlations that averaged .34, while the
non-Nordic average was .41.
In a structurally rigid society, parents may be able to play a direct role in securing their
children’s careers, while schools may reinforce parent actions through, for example, “legacy”
admissions to elite colleges (Karabel, 2005). In a more competitive society, the process is likely
to be indirect, where higher status parents attempt to ensure that their children acquire the kinds
of skills and behaviors that boost their chances of gaining access to good schools and securing
jobs similar in status to those of their parents.
Under what conditions can parents succeed in passing their socioeconomic advantages on
to their children by boosting their children’s job-related skills and behaviors? In equal
opportunity societies, institutions and other policies boost the skills and behaviors of low
socioeconomic status (SES) children in ways that fully offset the skill and behavioral advantages
imparted by parent efforts. Unequal opportunity societies – those allowing school and
neighborhood quality to reinforce family advantage and disadvantage – should see growing skill

2
and behavior gaps between high- and low-SES children across childhood, adolescence and early
adulthood – and substantial intergenerational inequality.
Our chapter focuses on the indirect, skill- and behavior-based process of intergenerational
inequality using five data sets from four countries: the U.K., the United States, Sweden and
Finland. All of our data sets provide representative samples of children drawn from national or
large community populations; measure the completed schooling of parents and children; and,
most importantly, measure an assortment of important skills and behaviors in both middle
childhood (ages 7 and 10) and adolescence (age 13-16).
Our key objective is to estimate cross-country differences in the extent to which child
skills and behaviors account for intergenerational correlations in the completed schooling of
parents and their grown children. The mediational role of children’s skills and behaviors is, in
turn, a product of two factors: i) how strongly parent SES determines children’s skills and
behaviors and ii) the importance of children’s skills and behaviors for their adult attainments.
Both of these factors need to be at work if skills and behaviors are to play an important
mediational role.
With regard to the path running from parent SES to child skills and behaviors, we are
most interested in whether links are reinforced or weakened as children get older. Past work
focused on child health has shown that family SES becomes increasingly predictive of a child’s
overall health status with age (Case, Lubotsky and Paxson, 2002). The steepening SES health
gradient appears to be caused by low-SES parents’ inability to prevent conditions such as asthma
from translating into poor general health later in childhood.
Turning from health to child skills and behaviors, we might expect that school systems
that reinforce family SES advantages or disadvantages would cause parent SES to explain more

3
and more of the variation in children’s skills and behaviors as the children move through their
school years. Accordingly, in a relatively stratified society such as the one into which the 1958
British cohort was born, we might expect that the links between parent background and child
skills and behavior would indeed become stronger as children grow older. In contrast, because
they provide more material supports to disadvantaged families, the more egalitarian societies in
Sweden and Finland might be expected to show weakening links as children grow older. Since
our studies provide measures of skills and behaviors in both middle childhood and adolescence,
we are able to estimate whether SES “gradients” increase or decrease with age.
We begin with an overview of our conceptual model and a brief review of the literature
that supports it. We then describe our five data sets. Our empirical work begins by showing how
the intergenerational schooling correlations in our data sets compare with those estimated in
often larger nationally representative data sets. We then describe the nature of SES gradients for
our skill and behavior measures in middle childhood and adolescence. Estimates of the relative
importance of skills and behaviors in predicting eventual completed schooling are next
presented. Our final empirical section combines these elements into estimates of the ability of
skills and behaviors in middle childhood and adolescence to account for intergenerational
inequality in our five data sets.
II. Background
Conceptual Framework
Our descriptive model of the role of child skills and behaviors in transmitting SES across
generations is shown in Figure 1. SES in both generations is measured by years of completed
schooling. We expect children’s eventual completed schooling to be a product of both skills and
behaviors developed in middle childhood (between ages 7 and 10 in our empirical work) and

4
adolescence (ages 13-16). Although the ages of subjects do vary within these two stages across
our data sets, the heterogeneity of developmental processes within each of these two stages is
dwarfed by heterogeneity of development between middle childhood and adolescence.
Instead of using the “cognitive” and “noncognitive” dichotomy found in much of the
social science literature, we find “achievement,” “attention,” “anti-/pro-social behavior” and
“mental health” to be a productive way of categorizing the general domains of children’s school-
related functioning (Duncan and Magnuson, forthcoming). By “achievement” we mean concrete
academic skills. “Attention” refers to the ability to control impulses and focus on tasks. Chief
among the possible list of problem behaviors are anti-social behavior and aggression.
[Insert Figure 1 about here]
Middle-childhood skills and behaviors are themselves a product of genetic endowments
affecting early cognition, temperament and health, plus the positive and negative early
environmental experiences associated with socioeconomic status and parental actions and
choices. None of these influences is depicted in Figure 1, since to accomplish our descriptive
purposes, we do not attempt to model these complex processes and instead use parent schooling
as our sole measure of socioeconomic status.
Figure 1 draws many of its elements from the Wisconsin Model of status attainment that
links a child’s eventual socioeconomic status to the educational and occupational attainments of
his or her parents (e.g., Sewell, Haller and Portes, 1970). The child’s academic performance and,
in some formulations of the model, motivation and effort play important mediational roles, but so
do aspirations, expectations and socialization by parents, teachers and peers.
The role of middle childhood skills and behaviors for adult attainment1
1 This discussion closely parallels that presented in Duncan and Magnuson (forthcoming).

5
Reading and math achievement. Research on how children acquire reading and math
skills indicates that specific early academic skills serve as the foundation for later learning. But it
also suggests that more general cognitive skills, particularly oral language and conceptual ability,
may be increasingly important for later mastery of more complex reading and mathematical tasks
(NICHD Early Child Care Research Network, 2005; Snow, Burns, & Griffin, 1998; Whitehurst
& Lonigan, 1998; Baroody, 2003). The relative stability of children’s academic achievement
throughout childhood and adolescence (Pungello et al., 1996) suggests that early academic skills
may be strong predictors of later educational attainment.
Direct evidence on the association between early skills and later educational attainment is
rare. Entwisle, Alexander, and Olson (2005) examined the Baltimore Beginning School Study
data – one of the data sets used in our empirical work. Their analysis found that, after controls
for family characteristics and student’s first grade marks, a composite of first-grade reading and
math test scores did not significantly predict educational attainment at age 20 or 21.
Currie and Thomas (1999) used data from the British National Child Development
Survey – another of our data sets – to relate scores on reading and math tests administered at age
seven to wages and employment at age 33. Even in the presence of extensive family background
controls, their models show 10%-20% earnings differentials when comparing both males and
females in the top and bottom quartiles of the two test score distributions. An important omission
in the Currie and Thomas (1999) analysis are controls for other domains of child functioning at
age seven. If, for example, children with higher test scores were more socially adept or better
able to control their behaviors and focus their attention, then the apparent links between test
scores and later labor market success might be spurious.
Attention problems. Since they increase the time children are engaged and participating

6
in academic endeavors, attention-related skills such as task persistence and self-regulation should
predict children’s achievement and school outcomes. Consistent evidence suggests that the
ability to control and sustain attention as well as participate in classroom activities predicts
achievement test scores and grades during preschool and elementary school, even when
children’s academic ability is held constant (Currie and Stabile, 2007; Duncan et al., 2007;
Raver, Smith-Donald, Hayes, & Jones, 2005).
Whether attention problems are also linked with lower levels of eventual educational
attainment is a question that has received less scrutiny. Vitaro and colleagues (2005) found that
attention problems at age 6 predicted later high school non-completion among a Quebec
community-based sample. These analyses held constant children’s aggression, but could not
control for differences in early academic skills. Currie and Stabile (2007) take a more
comprehensive look at links between hyperactivity and later schooling success, using nationally
representative data on 4- to 11-year-olds from both the U.S. and Canada as well as both OLS and
sibling fixed-effects models. Although they find consistent linkages to achievement scores, grade
retention, and special-education placement, they fail to find associations between early
hyperactivity and a measure of completed schooling (being in school between ages 16 and 19).
Anti-social behavior problems. Children’s problem behaviors, particularly externalizing
or antisocial behavior, are expected to affect both individual learning and later attainment.
Problem behavior may lead to child-teacher conflict, disciplinary actions, and social exclusion
(Newcomb, Bukowski, & Pattee, 1993), and as a result may adversely affect achievement (Pianta
& Stuhlman, 2004). The Finnish JYLS, a third data set used in this chapter, shows that early
aggression precedes adolescent school maladjustment which further precede labor market
problems (Kokko and Pulkkinen, 2000).

7
Despite these theoretical justifications, empirical evidence linking problem behaviors to
school outcomes is mixed. Among young children, examining externalizing problems separately
from attention issues has clarified the role of each in achievement, suggesting that attention is
more predictive of later achievement than more general problem behaviors (Hinshaw, 1992;
Duncan et al. 2007). On the other hand, several studies have found that early behavior problems
are linked to subsequent educational attainment, although these studies tend to involve selective
samples and few covariates to control for possible confounding factors (Ensminger & Slusarick,
1992; McLeod & Kaiser, 2004). For example, based on their analysis of a New Zealand sample,
Ferguson and Horwood (1998) find that third grade conduct problems were predictive of high
school dropout. Other studies yield less conclusive support for links between early behavior
problems and later attainment. Currie and Stabile (2007) find mixed evidence for links between
antisocial behaviors between ages 4 and 11 and school enrollment between ages 16 and 19.
Internalizing behavior problems. Children’s emotional negativity and inability to control
expressions sadness, joy and emotions can lead to social withdrawal, anxiety and other behaviors
commonly termed internalizing behavior problems (Eisenberg et al., 2005; Posner and Rothbart,
2000). These depressive behaviors are often measured by questions that ask how frequently
children appear to be in a sad or irritable mood, and whether they demonstrate low self-esteem or
low energy. Anxiety captures a set of factors including children’s fears of separation from
caregivers, obsessive/compulsive behavior and social reticence. Socially withdrawn behavior
refers to a child’s social anxiety and avoidance of social interactions.
Depressive symptoms and anxiety may reduce children’s engagement in classroom group
learning activities (Fantuzzo et al., 2003). Evidence of this negative effect of problem behavior
on achievement, however, is mixed, with correlational evidence pointing to a detrimental effect,

8
but more controlled models yielding smaller associations or none at all (Brock et al., 2009), at
least for males (Pulkkinen et al., 1999).
Few studies estimate intergenerational models with all or even most of the elements of
Figure 1. One exception is Carneiro et al. (2007), who used data on a wide variety of
achievement and behavioral measures assessed when the sample children, from the British
NCDS, were 11 years old. The diversity of these latter measures is reflected in their names:
“anxiety for acceptance,” “hostility toward adults,” “withdrawal,” and “restlessness.” When
summed into a single index, a standard deviation increase in this collection of social skills and
behaviors is found to be associated (net of parental background) with a 3.8 percentage point
increase in the likelihood of continuing education past age 16 and a 2.3 percentage point increase
in the likelihood of completing a higher education qualification. These effect sizes were less than
one-fifth of the estimated impact of a standard-deviation increase in achievement test scores.
Ironically, when attention was focused on whether young people remained in school
beyond age 16, an examination of the social and behavioral subscales found the greatest
explanatory power for “inconsequential behavior” – a heterogeneous mixture of items related to
inattention (“too restless to remember for long”), anti-social behavior (“in informal play, starts
off with others in scrapping and rough play”) and inconsistency (“sometimes eager, sometimes
doesn’t bother”). In the case of completing higher education credentials, the two most powerful
behavioral components came from our mental health domain – “unforthcomingness” and
depression, although several other mental health components were not significant predictors.
Feinstein (2000) used data from the British Cohort Study (BCS) – the fourth of our five
data sets – to investigate the relationship between abilities developed by age 10 and economic
and educational outcomes in adulthood (measured at age 26). As is the case with much of the UK

9
literature, educational attainment was measured in terms of highest qualifications gained and
relevant “completed schooling” outcomes. The analysis included age 10 measures of school
achievement, attention, anti-social and pro-social behaviours, internalizing problem behaviour as
well as locus of control and self esteem in addition to the measures we adopt in our chapter.
Feinstein’s results highlight the particular role of attentiveness in the production of human
capital outcomes in adulthood.
Blanden et al. (2006) estimate models of the intergenerational correlation in income
rather than education based on both the BCS and NCDS data sets. In the case of the BCS, they
find that, taken alone, a collection of “noncognitive” measures taken at ages 5, 10 and 16 account
for about 20 percent of the intergenerational correlation, while a collection of cognitive test
scores account taken at age 5 and 10 accounts for 30 percent of that correlation. When both are
included in the same regression, their respective shares of variance are 11 percent and 21
percent. Among the individual measures in their combined regression, an age-10 math test was
best able to account for the intergenerational correlation, followed by an age 5 figure copying
test of motor control and an age 10 of “application” (concentration and perseverance). The
collection of noncognitive skills in the NCDS is much less strongly associated with parent SES
than in the BCS.
The role of adolescent skills and behaviors
Turning from middle childhood to adolescence, most work linking adolescent skills and
behaviors to later attainment has concentrated on cognitive skills. Murnane et al. (1995), for
example, show links between the mathematics tests scores of two cohorts of high school seniors
and their wages at age 24. Looking at NLSY participants who were 15-18 year olds when they
took an Armed Forces Qualifying Test, Neal and Johnson (1996) found strong links between test

10
scores and earnings measured a decade later.
Secondary school measurement of pre-adult skills is also a common feature of attempts to
relate labor market outcomes to combinations of cognitive and so-called “noncognitive” skills.
Heckman and Rubinstein (2001) establish the importance of adolescent behavioral profiles in
understanding why GED holders earn so much less than high school graduates despite having
virtually identical distributions of cognitive test scores. Heckman et al. (2006) show the
remarkable power of a scale combining adolescent self-esteem and sense of personal
effectiveness for explaining later earnings in NLSY data.
Despite the findings of these adolescent-based skill studies, they beg a vital question: To
what extent is the apparent predictive power of adolescent skills and behaviors a mere reflection
of fundamental skills determined much earlier in life? If skill trajectories are relatively rigid
products of genetic factors, children’s self-selection into classroom behavior, study habits and
peer-group interactions, or school structures such as tracking, then interventions during
adolescence may be too late to produce lasting improvement.
In most developmental theories, notions of developmental continuity have rightly taken
center stage (Schulenberg et al., 2003). In general, problems may accumulate, with difficulties in
childhood leading to difficulties in adolescence and adulthood (Masten et al., 2005). Likewise,
doing well can set the stage for continuing to do well. In short, continuity of adaptation tends to
prevail across the life course. Cunha et al. (2005) provide a production-function interpretation in
which early development of positive skills increases the payoff to subsequent investments such
as K-12 education. Magnusson’s (1998) developmental model of this process emphasizes how
individuals can transform their environmental experiences by differentially selecting,
interpreting, and attaching meaning to their experiences.

11
The idea that early skills matter the most is the foundation of social policies such as
enriched preschool experiences (Knudsen et al., 2006). Getting it right by middle childhood is
presumed to maximize the benefit to the individual and society as the individual matures.
According to this view, adolescence, by itself, may not matter all that much; childhood
functioning contributes directly to adolescent functioning which in turn contributes directly to
adulthood functioning, so that adolescent functioning is simply an intermediate step between
childhood and adulthood functioning. We are able to test explicitly for the relative importance of
middle childhood vs. adolescent skills and behaviors in all five of our data sets.
Skill levels and gradients across countries. Although cross-national student achievement
studies such as Program of International Student Assessment (PISA) began well after the
children in our data sets secured their schooling, they provide some useful national benchmarks
for skill levels and gradients and school inequalities. We draw our data from the first PISA
study, which sampled 15 year old students in 2000 (OECD, 2001). Since their 1985 births were a
decade or more after the births of the children in the data sets, the school conditions and
relationships they paint may have been quite different from school conditions and relationships
for the children in our cohorts.
The first column of Table 1 show country average scores on the reading literacy test
(patterns for mathematics literacy are quite similar). On average, Finnish student outscored U.S.
students by close to half a standard deviation, with students from the U.K. and Sweden in
between. The dispersion of test scores is considerably greater in the U.S. than in other countries
– U.S. students at the 5th percentile of the test score distribution are .7 standard deviations below
their Finnish counterparts, while high achieving (at the 95th percentile) U.S. students are only .2
standard deviations below their Finnish counterparts. As before, students from the U.K. and

12
Sweden are in between the U.S. and Finland.
[Insert Table 1 about here]
One of our interests is in estimating associations between the socioeconomic
circumstances of children and their school performance. PISA measures SES with a collection of
indicators of economic, social and cultural status.2
What role might schools play in ameliorating or reinforcing these SES differences? The
fourth column in Table 1 shows that, in the U.S., 35 percent of the variation in student test score
arises between schools. This is higher than in the U.K. (22 percent) and much higher than in
either Sweden (9 percent) or Finland (11 percent).
The third column of Table 1 presents the
slopes of the SES gradients for children’s reading literacy achievement scores. The “48” entry
for the U.S. means that a one standard deviation in parent SES is associated with a 48-point
(roughly one-half standard deviation) gain in the reading test score. Gradient slopes are virtually
identical in the U.K. as in the U.S. but considerably lower in Sweden and, especially, Finland,
where a one standard deviation increase in SES is associated with a 30-point increase in test
score.
Across our four countries, then, Finland and the U.S. stake out the extremes in the level
and dispersion of achievement skills of 15 year olds, and in the slopes of SES gradients. SES
skills gradients are as large in the U.K. as in the U.S., but U.K. student outcomes are better.
Sweden nearly matches Finland in the flatness of its SES/test score gradients, but not in the
2 This is described in (OECD, 2001, p. 221) as follows: “the PISA Index of economic, social and cultural status was created on the basis of the following variables: the International Socio-Economic Index of Occupational Status …; the highest level of education of the student’s parents, converted into years of schooling…; the PISA index of family wealth, the index of home educational resources and the index of possessions related to the “Classical” culture in the family home…The ISEI represents the first principle component of the factors described above. The index has been constructed such that its mean is 0 and its standard deviation is 1.”

13
achievement levels of its students.
III. Data and Procedures
The five data sets we use are: the U.S. Baltimore Beginning School Study (BSS), the
Finnish Jyväskylä Longitudinal Study of Personality and Social Development (JYLS), the
Swedish Study of Individual Development and Adaptation (IDA), the British National Child
Development Survey (NCDS; 1958 birth cohort) and the British Cohort Study (BCS; 1970 birth
cohort).
Table 2 summarizes key characteristics of these data sets. All are drawn from either
national populations or diverse communities. The Beginning School Study (BSS) sampling
universe is the population of students in Baltimore public schools. The city of Jyväskylä is
located in central Finland, some 170 miles north of Helsinki. Its population was 128,245 in 2009.
Its large university has generated many cutting-edge educational initiatives. The Swedish IDA
sample is drawn from students in Örebro, which is located in central Sweden, roughly equidistant
from Stockholm, Gothenburg and Oslo. Its 2005 population was 98,237, making it the seventh
largest city in Sweden. The two British cohort studies are full national samples of their respective
birth cohorts.
A potential worry is of bias owing to the limited variability in our three community data
sets. Our choices were dictated by the fact that there are no nationally representative data sets in
the United States, Sweden and Finland with measures of skills and behaviors in middle
childhood and adolescence as well as measures of completed schooling taken in adulthood.
Comparisons conducted by study staff show that the demographic characteristics of the Finnish
sample at ages 42 and 50 compare favorably with national statistics compiled by Statistics
Finland. Although children living in Baltimore are hardly representative of U.S. children, it is

14
important to note that children living in the city of Baltimore at a time (1982) when Baltimore
public schools were more racially diverse than they are now; 45% of the first graders in the
sample are white.
[Insert Table 2 about here]
Begun in a halcyon era of public and school cooperation with survey researchers, all of
the initial wave response rates are in excess of 95%, although response rates in subsequent waves
are lower and raise some concerns of potential nonresponse bias. The response rates of “other
relevant waves” listed in Table 2 use the 1st wave sample as a base.
Completed schooling of child. All studies provide measures of the child’s eventual
completed schooling that are drawn from interviews taken at age 28 or later. Although the
structure of primary, secondary and tertiary schooling differs across countries, conversion tables
enable us to code years of completed schooling from the ISCED codes for the various education
levels across our countries (UNESCO, 2006) Our key dependent variable, then, is years of
formal schooling that the child had completed by well into adulthood. As shown in Appendix
Table 1, children averaged between 12 and 14 years of completing schooling, with higher
averages in the English speaking than the Nordic countries.3
Age 7-10 skill and behavior measures. Comparability of age 7-10 and 13-16 skill and
behavior measures varies somewhat by domain (Appendix Table 2). In our empirical work, all of
these skills and behavior measures are standardized using whole-sample means and standard
deviations.
Four of the five studies provide both reading and math achievement test scores; the
3 In the case of levels of schooling such as a university degree that may take varying numbers of years to complete, we took the normal completion time. See the note about schooling for the Finnish data in the appendix.

15
Finnish study contains only a teacher report of a general achievement composite. All five studies
include teacher reports of items that reflect attention problems. With regard to anti-social
behavior/aggression, four provide teacher reports and one provides parent reports. Only three
studies provide middle childhood measures of pro-social behavior. The four studies with
measures of anxiety or internalizing behavior problems draw their measures from teacher
reports.
Age 13-16 skill and behavior measures. For the most part, age 13-16 measures parallel
those drawn from ages 7-10 (Appendix Table 3). In the case of anti-social behavior, all five
studies draw measures from teacher reports. All five studies provide measures of social skills.
Parental schooling and other controls. We use parental schooling as our sole measure of
parent SES. All studies provide measures of years of completed schooling for the parent as
reported by the parent in the BSS and British studies and the grown children in the Swedish and
Finnish studies. As with children’s eventual completed schooling, we use ISCED conversion
tables to code equivalent years of schooling from reports of type of completed education. As
shown in Appendix Table 1, parent schooling averages were higher in the U.S. and U.K. than in
the two Nordic countries.
We employ a minimal set of additional background measures: child’s sex, number of
siblings and, where available, age when outcome was measured, race/ethnicity and birth weight.
Since we do not control for other dimensions of socioeconomic status (e.g., income, family
structure), the associations we estimate between parent and child education and between parent
education and child skills are just that – associations rather than causal effects.
IV. Results
Intergenerational schooling correlations and coefficients

16
We begin by presenting estimates of simple correlations and regression coefficients
relating children’s and parents’ completed schooling. (These are labeled “study” correlations and
coefficients in Figure 2). Coefficients come from simple regressions of child schooling on parent
schooling and can be interpreted as the fraction of a year by which a child’s eventual completed
schooling increases with every one-year increase in parental schooling.4 Correlations provide a
complementary measure of intergenerational associations by showing the fraction of a standard
deviation increase in child schooling associated with a one-standard-deviation increase in
parental schooling.5
[Insert Figure 2 about here]
Figure 2 also shows estimates of correlations and coefficients taken from Hertz et al.
(2006), which are based on nationally representative sources of data. Since the Hertz et al. (2006)
data spans a number of birth cohorts, we drew data as closely as possible to the birth years
represented by our five study samples.
Looking first at correlations (the triangle markers in Figure 1), Hertz et al. find higher
correlations (i.e., less intergenerational mobility) in the United States relative to both the United
Kingdom and our two Nordic countries. This is also true for correlations estimated from our five
studies, although the differences are not as large as in Hertz et al. (2006).
In contrast, the Hertz et al. (2006) coefficient estimates of immobility are much higher in
the U.K. than in any of the other countries. Despite being drawn from community rather than
national samples, the Swedish and Finnish study estimates are remarkably close to their Hertz et
4 The regressions also control for child sex, age, number of siblings and, if available, race/ethnicity and birth weight. These controls had little effect on the estimated schooling coefficients. 5 Ignoring the small adjustments for background controls, the correlation equals the coefficient multiplied by the ratio of the standard deviations of child to parent completed schooling.

17
al. (2006) counterparts, while the estimates from the two British cohort studies are much lower.
We have no ready explanation for the U.K. differences but do note that our two nationally-
representative birth cohort studies are based on considerably larger sample sizes than Hertz et
al.’s (2006) estimates.
Skill and behavior gradients
How different are the SES skill and behavior gradients across countries and do the
gradients weaken or strengthen with age? As explained earlier, weakening associations are
consistent with the hypothesis that school, peer and neighborhood influences provide equalizing
opportunities for children from different SES backgrounds, while increasing associations suggest
increasing social stratification.
Our estimates of SES gradients come from a series of regressions in which each age 7-10
and 13-16 skill and behavior measure is regressed on parent schooling, child gender, age,
number of siblings and, if available, child race/ethnicity and birth weight.6
Coefficient estimates are plotted in Figure 3. The first column of lines is based on the
Baltimore BSS. The left-hand point on the first line segment (labeled “Age 7-10”) has a value of
.13 and shows the slope of the SES gradient for BSS 7 and 8 year olds: additional years of parent
education are associated with about one-eighth of a standard deviation higher math scores.
Since we standardize
all of our skill and behavior measures to have unitary standard deviations, the resulting
coefficients on parent education can be interpreted as the fraction of a standard deviation
increase in a given skill or behavior associated with a one-year increase in parent schooling.
7
6 As with the parent/child coefficients, results were quite similar when these regressions included only the parent schooling measure.
(The
7 The standard error for this coefficient is .01, so the .13 is highly significant in a statistical sense. For the entire set of BSS coefficients, standard errors ranged from .01 to .02. For the two British

18
coefficient on parent education in the child reading skill regression is also .13 and has an
analogous interpretation.) A .13 coefficient is far from trivial. Having parents with college as
opposed to high school degrees is associated with more than half of a standard deviation in test
scores – a gap that is two-thirds as large as the black-white math gap in U.S. elementary schools
(Duncan and Magnuson, forthcoming).
[Insert Figure 3 about here]
The top line in the BSS column shows that the coefficient on parent schooling in
predicting child math scores increased from .13 to .16 between middle childhood and
adolescence, suggesting a steeper gradient and perhaps greater stratification in adolescence than
middle childhood. The increase for reading scores (from .13 to .14) was smaller, while the
behaviors showed a mixed pattern, with SES/anti-social coefficients becoming more negative
(from -.05 to -.07) but with the coefficients for both pro-social behavior and attention problems
falling in absolute value. So while achievement skill gradients appear to increase slightly with
age in the Baltimore data, behavior gradients show a mixed pattern of small changes.
Ignoring slopes for the moment, a look at the general height of the test score data across
the data sets suggests that almost all gradient values fall into the .10 to .20 range across the three
countries where test scores are available.8
Turning to the changes in gradient slopes between middle childhood and adolescence, it
appears that the British NCDS patterns are quite consistent with increasing stratification with age
There is little indication that Swedish gradients are
flatter than gradients in the U.S. or U.K.
studies, the standard errors are around .01, while all of the IDA and JLYS standard errors are in the .02-.03 range. 8 Finnish data provide a teacher-reported measure of general achievement at age 8 and a school-records-based GPA at age 14. Slopes of these measures by parent education are .10 and .06, respectively, but their obvious differences from reading and math achievement led us to not include them in Figure 3.

19
(all of the coefficients increase in absolute value). In the case of the NCDS achievement skills,
the gradient slope increases are quite large – from .12 to .20 between ages 10 and 16 in math and
from .12 to .15 in reading. Achievement gradients also increase in the U.S. Beginning School
Study data, although not as much as with the NCDS. Swedish data show essentially constant
coefficients across time, while gradient changes in the 1970 British cohort are inconsistent,
although data collection problems associated with the adolescent gradients in the BCS make
comparisons difficult. Although the Finnish JYLS did not provide measures of reading and math
achievement, it did measure all of the behaviors of interest. Figure 3 shows small and falling SES
gradient slopes for all of these behaviors.
Which skills and behaviors predict children’s eventual school attainment?
The top panel of Table 3 (labeled “Regression 1”) shows the power of age 7-10 skills and
behaviors to predict children’s years of completed schooling. Each column comes from a single
regression in which completed schooling is regressed on the full set of listed skills and behaviors,
plus parent education and child gender, age, number of siblings and, where available, child
race/ethnicity and birth weight. The bottom panel repeats these regressions using skill and
behavior variables measured when the children were between ages 13 and 16. The rightmost
column presents a simple average of the coefficients in a given row.
[Table 3 about here]
Looking first at the averages in the top panel, it appears that middle childhood reading
and, especially, math scores are most predictive of completed schooling. The “.47” entry for
math indicates that standard deviation increases in age 7-10 math scores are associated, when
averaged across the studies, with about one-half year of additional schooling. Looking across the
“Math” and “Reading” rows, we see that the math and reading coefficients are positive and

20
statistically significant in all four of the studies in which math and reading achievement was
measured.
Average coefficients are smaller and patterns of individual coefficients less consistent in
the case of the various attention and behavior measures. The negative associations for attention
and anti-social behaviors are most consistent, both averaging -.11. Pro-social behavior is
measured in three studies and has a substantial coefficient in two of the four.
The bottom panel shows that the patterns are generally repeated when the skills and
behavior measures are measured between ages 13 and 16. The math coefficients now average .83
and are uniformly much larger than coefficients on reading and the behavior measures. As with
middle childhood, the adolescent measures of anti-social behavior generally have negative
coefficients while measures of prosocial behaviors all have positive coefficients. One anomalous
result is the positive coefficients for adolescent attention problems in the Baltimore BSS.9
To gauge the relative predictive power of the middle childhood and adolescent skills and
behaviors, we included both sets of measures, plus parent education and other background
controls, in the same regression. Results, reported in Table 4, show that adolescent skills are
generally more powerful predictors of educational attainment than middle childhood skills. (One
way of thinking about this is that adolescent skills and behaviors account for much of the
association between middle childhood skills and behaviors and completed schooling observed in
the top panel of Table 3.) As in the bottom panel of Table 3, adolescent math skills dominate,
with an average coefficient of .74.
[Insert Table 4 about here]
9 The BSS results proved somewhat sensitive to which measures were included in the regression models. The simple correlation between adolescent attention problems and adolescent reading scores was -.22. The math correlation was -.25.

21
Accounting for intergenerational inequality with skills and behaviors
Turning to one of the key questions of this chapter – whether child skills and behavior
account for intergenerational SES correlations – Figure 4 shows what fraction of the parent-child
schooling correlation can be accounted for by middle childhood and adolescent skills and
behaviors. The first bar (e.g., with a height of 25% in the Baltimore BSS) shows that the
intergenerational correlation between parent and child schooling is reduced by 25% when our
collection of middle childhood skills and behaviors is added to the model.10
[Insert Figure 4 about here]
The second bar
(40% in the BSS) shows that the intergenerational correlation between parent and child
schooling is reduced by 40% when that study’s collection of adolescent skills and behaviors is
added to the model. And the third bar (also 40% in the BSS) show the percentage of correlation
accounted for by both sets of middle childhood and adolescent skill and behavior measures.
The patterns are broadly similar across the five data sets. Middle childhood skills account
for 21% to 32% of the intergenerational correlations. Adolescent skills account for significantly
more than that in four of the five data sets. And the combination of middle childhood and
adolescent skills usually adds relatively little to the set of adolescent measures taken alone.11
Extensions
If
anything, skills and behaviors appear to account for somewhat less of the intergenerational
schooling correlations in the Nordic than English-speaking countries in our study.
Does IQ account for the math achievement effect? The strong relative predictive power of
10 These regressions also include child gender, age, number of siblings and, when available, race/ethnicity and birth weight. 11 One point of comparison is with the BCS, for which both sets of predictors account for 44 percent of the intergenerational schooling correlation. Blandon et al. (2006) find that their larger collection of cognitive and noncognitive skills up to age 16 accounts for only 32 percent of the intergeneration income correlation.

22
math achievement in both middle childhood and adolescence raises the question of whether the
math achievement effect is really just a more general effect of cognitive ability. In the case of
adolescent math skills, the regressions presented in Table 4 are most revealing, as they show that
adolescent math skills strongly predict completed schooling even when prior math test scores are
included in the regression.
With the two British data sets, it is possible to include measures of cognitive ability in the
regression analyses reported in Tables 3. In the case of the NCDS, the coefficients on age 7
reading and math scores in the top panel of Table 3 are .48 and .42, respectively. The addition of
scores from an age-7 copying test and a Draw-A-Man test reduces these two coefficients
modestly – to .43 and .36. Adding an age-11 measure of non-verbal IQ lowers the coefficients of
these two age-7 measures to .29 and .25 (in all cases, standard errors are in the .02-.03 range).
Thus, even with the addition of cognitive scores taken four years after the measurement of math
achievement, the math scores retain more than half of their explanatory power.12
In the case of the BCS, the coefficients on age 7 reading and math scores in the top panel
of Table 3 are .31 and .51, respectively. The addition of scores from an age-5 human figure
drawing, a copying test and a vocabulary assessment reduces these two coefficients to .27 and
.46. In the case of age 16 reading and math, controls for all of these ability measures plus age 10
IQ, plus age-7 reading and math scores produce reading and math coefficients of .35 and .58,
respectively. As with the NCDS, the additional of ability controls still leaves quite substantial
reading and, especially, math coefficients.
In the case of
age 16 reading and math, controls for all of these ability measures plus age-7 reading and math
scores produce reading and math coefficients of .35 and .61, respectively.
12 The coefficients on aggression and attention problems fall from -.24 and -.11 to -.20 and -.07, with standard errors of .03.

23
In the case of the Swedish IDA data, the coefficients on age 10 reading and math in the
top panel of Table 3 are .33 and .39, respectively. The addition of an IQ composite score—the
mean across two tests each of verbal, inductive, and spatial reasoning at age 10 (α=.80 across all
six tests) —reduces the reading and math coefficients to .12 and .29. In the case of age 13
reading and math, controlling for the age 10 IQ test score decreases reading and math
associations from .23 and .55 to .20 and .52, respectively. So again, reading and math scores
provide robust predictors of educational attainment.
V. Summary
Our analyses have focused on the role of child skills and behaviors in intergenerational
inequality in four countries: the U.K., the United States, Sweden and Finland. Across our five
data sets and four countries, similarities were more striking than differences and what differences
we did find did not conform readily to “Nordic vs. English-speaking” or any other country
classification.
In the case of skill and behavior “gradients” – essentially correlations between parent
schooling levels and children’s skill levels and behaviors – we generally found steeper gradients
favoring higher SES children in the case of reading and math test scores than with behavior
problems involving inattention, anti-social behavior or mental health. And while achievement
test gradients grew as children transitioned from middle childhood to adolescence in two cases
from our English-speaking countries (the Baltimore BSS and the UK NCDS), they held constant
or fell in the case of our second UK study (the BCS). Gradients were fairly constant in Sweden.
Finnish data did not include math and reading achievement; gradients for attention and behavior
measures were small and falling with age. Whether the homogenous Finnish population and
egalitarian-minded school system accounts for its unique status is an important unanswered

24
question.
In the case of associations between children’s skills and behaviors and their eventual
completed schooling, virtually all of the studies showed that concrete reading and, especially,
math achievement skills were consistently stronger predictors of attainment than were any of the
problem behaviors we measured. This was true both in the case of skills and behaviors measured
in middle childhood and in adolescence.
Worries by adolescence researchers that the apparent predictive power of adolescent-
based measures of skills and behaviors are mere reflections of more fundamental, earlier skills
and behavior appear unwarranted. Adolescent skills and behaviors add a great deal to the
explanation of variation in completed schooling over and above middle childhood skills in all
five of the data sets we used.
The key descriptive question driving our inquiry concerned the importance of childhood
and adolescent skills and behaviors in accounting for intergenerational inequality. Across all of
our data, we find that childhood and adolescent skills and behaviors account for between one-
third and one-half of the intergenerational correlations in the completed schooling of parents and
children.
Looking across countries, Finland conformed more closely than Sweden did to the
Nordic ideal of promoting equality of opportunity. Finnish parent and child schooling levels
were only weakly correlated, and children’s SES-based skills and behavior gradients were
modest and, if anything, decreased in slope as children advanced through school. Skills still
mattered for children’s completed schooling in Finland, but the fact that they differed relatively
little by SES appeared to weaken links between the accomplishments of parents and children.

25
References
Baroody, A. J. (2003). The development of adaptive expertise and flexibility: The integration of
conceptual and procedural knowledge. In A. J. Baroody & A. Dowker (Eds.), The
Development of Arithmetic Concepts and Skills: Constructing Adaptive Expertise Studies.
Mahwah, N.J. : Lawrence Erlbaum Associates, Inc.
Blanden, J., Gregg, P. and MacMillan, L. (2006) “Accounting for intergenerational income
persistence: Non-cognitive skills, ability and education” London: Centre for the
Economics of Education, London School of Economics.
Brock, L. Rimm-Kaufman, S. E., Nathanson, L. & Grimm, K. J. (2009). The contributions of
hot and cool executive functionto children’s academic achievement, learning-related
behaviors, and engagement in kindergarten. Early Childhood Research Quarterly, 24,
337-349.
Carneiro, P., Crawford, C., & Goodman, A. (2007). The Impact of early cognitive and non-
cognitive skills on later outcomes. Centre for the Economics of Education, London
School of Economics.
Case, A., Lubotsky, D., & Paxson, C. (2002). “Economic Status and Health in Childhood:
Origins of the Gradient.” American Economic Review, 92(5): 1308 – 1334.
Cunha, F. & Heckman, J. J. (2009). The economics and psychology of inequality and human
development," Journal of the European Economic Association, 7(2-3), 320-364.
Cunha, F., Heckman, J., Lochner, L., & Masterov, D. (2005) Interpreting the evidence on life
cycle skill formation. In E. Hanushek & F. Welch (Eds.) Handbook of the Economics of
Education, North Holland.

26
Currie, J. & Stabile, M. (2007). Child mental health and human capital accumulation: The case
of ADHD. Journal of Health Economics, 25, 1094-1118
Currie, J., & Thomas, D. (1999). Early test scores, socioeconomic status and future outcomes.
NBER Working Paper No. 6943.
Duncan, G., Dowsett, C., Classens, A., Magnuson, K., Huston, A., Klebanov, P., Pagani, L.,
Feinstein, L., Engel, Brooks-Gunn, J., Sexton, H., Duckworth, K and Japel, C. (2007).
School Readiness and Later Achievement. Developmental Psychology, 43, 1428-1446.
Duncan, G. & Magnuson, K. (forthcoming) “The Nature and Impact of Early Achievement
Skills, Attention and Behavior Problems” Paper presented at the conference, “Rethinking
the Role of Neighborhoods and Families on Schools and School Outcomes for American
Children,” Washington, D.C..
Eisenberg, N., Sadovsky, A. & Spinrad, T. L. (2005) Associations of emotion-related regulation
with language skills, emotion knowledge, and academic outcomes. New directions for
child and adolescent development, 109, 109-18.
Ensminger, M.& Slusarcick,A. (1992). Paths to High School Graduation or Dropout: A
Longitudinal Study of A First-Grade Cohort. Sociology of Education, 65, 95-113.
Entwisle, D. R., Alexander, K. L., & Olson, L. S. (2005). Early schooling: The handicap of being
poor and male. Sociology of Education, 80, 114–138.
Fantuzzo, J. , Bulotsky, R., McDermott, P., Mosca, S., & Lutz, M. N. (2003). A multivariate
analysis of emotional and behavioral adjustment and preschool educational outcomes.
School Psychology Review, 32, 185-203.

27
Feinstein, L. (2000). The relative economic importance of academic, psychological and
behavioural attributes developed in childhood (Discussion Paper). Centre for Economic
Performance, London School of Economics.
Fergusson, D. M., Horwood, L. J. (1998) Early Conduct Problems and Later Life Opportunities.
The Journal of Child Psychology and Psychiatry and Allied Disciplines 39: 1097-1108.
Heckman J., & Rubinstein, Y., (2001). The importance of noncognitive skills: Lessons from the
GED testing program. The American Economic Review, 91(2), 145-149.
Heckman, J., Urzua, S., & Stixtud, J. (2006). The effects of cognitive and noncognitive abilities
on labor market outcomes and social behavior. Journal of Labor Economics, 24(3), 411-
482.
Hertz, T., Jayasundera, T., Piraino, P., Selcuk, S., Smith, N., & Verashchagina, A., (2007) “The
Inheritance of Educational Inequality: International Comparisons and Fifty-Year Trends,”
The B.E. Journal of Economic Analysis & Policy: 7(2).
Hiebert, J., & Wearne, D. (1996). Instruction, understanding, and skill in multidigit addition and
subtraction. Cognition and Instruction, 14, 251-283.
Hinshaw, S.P. (1992). Externalizing behavior problems and academic underachievement in
childhood and adolescence: Causal relationships and underlying mechanisms.
Psychological Bulletin, 111, 127-155.
Karabel, J. (2005) The Chosen: The Hidden History of Admission and Exclusion at Harvard,
Yale and Princeton, New York: Houghton Mifflin.
Knudsen E., Heckman, J., Cameron, J., & Shonkoff, J. (2006). Economic, neurobiological, and
behavioral perspectives on building America’s future workforce. Proceedings of the
National Academy of Science, 103, 10155 - 10162.

28
Kokko, K. & Pulkkinen, L. (2000) Aggression in Childhood and Long-Term Unemployment in
Adulthood: A Cycle of Maladaptation and Some Protective Factors, Developmental
Psychology, 36(4): 463-472.
Magnusson, D. (1998). Back to the phenomena: Theory, methods, and statistics in psychological
research, European Journal of Personality, 6(1), 1-14.
Masten, A., Roisman, G., Long, J., Burt, K., Obradovic, J., Riley, J., Boelcke-Stennes, K.,
&Tellegen, A. (2005) Developmental Cascades: Linking Academic Achievement and
Externalizing and Internalizing Symptoms Over 20 Years. Developmental Psychology.
41(5): 733-746.
McLeod, J. & Kaiser, K. (2004). Childhood emotional and behavioural problems in educational
attainment. American Sociological Review, 69, 636-658.
Murnane, R., Willett, J. & Levy, F. (1995) The Growing Importance of Cognitive Skills in
Wage Determination, The Review of Economics and Statistics, 77(2): 251-266 .
OECD (2001). Knowledge and skills for life: First results from the OECD Program of
International Student Assessment (PISA) 2000. Paris: OECD.
Neal, D., & Johnson, W. (1996). The Role of premarket factors in black-white wage differences.
The Journal of Political Economy, 104(5), 869-895.
Newcomb, A. F., Bukowski, W. M., & Pattee, L. (1993). Children's peer relations: A meta-
analytical review of popular, rejected, neglected, controversial, and average sociometric
status. Psychological Bulletin, 113, 99-128.
NICHD Early Child Care Research Network (2005). Pathways to reading: The role of oral
language in the transition to reading. Developmental Psychology, 41, 428-442.

29
Pianta, R., & Stuhlman, M. (2004). Teacher-child relationships and children’s success in the
first years of school. School Psychology Review, 33, 444-458.
Posner, M. & Rothbart, M. K. (2007). Educating the human mind. Washington, D.C.: The
American Psychological Association.
Posner, M. & Rothbart, M. K. (2000). Developing mechanisms of self-regulation. Development
and Psychopathology, 12, 427-441.
Pulkkinen, L., Ohranen, M. & Tolvanen, A. (1999). Personality Antecedents of Career
Orientation and Stability among Women Compared to Men, Journal of Vocational
Behavior 54: 37–58
Pungello, E. P., Kupersmidt, J. B., Burchinal, M. R., & Patterson, C. (1996). Environmental
risk factors and children’s achievement from middle childhood to adolescence.
Developmental Psychology, 32, 755-767.
Raver, C. C., Smith-Donald, R., Hayes, T., & Jones, S. M. (2005, April). Self-regulation across
differing risk and sociocultural contexts: Preliminary findings from the Chicago School
Readiness Project. Paper presented at the biennial meeting of the Society for Research in
Child Development, Atlanta, GA.
Schulenberg, J. E., Maggs, J. M., & O’Malley, P. M. (2003). How and why the understanding of
developmental continuity and discontinuity is important: The sample case of long-term
consequences of adolescent substance use. In J. T. Mortimer, & M. J. Shanahan (Eds.).
Handbook of the life course (pp. 413-436). New York: Plenum Publishers.
Schulenberg J. E., & Zarrett N. R. (2006). Mental health during emerging adulthood: Continuity
in courses, causes, and functions. In J. J. Arnett, & J. L. Tanner (Eds.), Emerging

30
adulthood in America: Coming of age in the 21st century (pp. 135-172). Washington,
DC: American Psychological Association.
Sewell, W., Haller, A. & Portes (1969) The Educational and Early Occupational Attainment
Process, American Sociological Review, 34(1): 82-92.
Snow, C. E., Burns, M. S., & Griffin, P. (Eds). (1998). Preventing reading difficulties in young
children. Washington D.C.: National Research Council, National Academy Press.
Vitaro, F., Brendengen, M., Larose, S., & Tremblay, R. E. (2005). Kindergarten disruptive
behaviors, protective factors, and educational achievement by early adulthood. Journal of
Educational Psychology, 97, 617-629.
Whitehurst, G. J., & Lonigan, C. J. (1998). Child development and emergent literacy. Child
Development, 69, 848-872.
UNESCO (2006) International Standard Classification of Education, 2006 Re-edition of 1997
report.

31
Data Appendix
The U.S. Beginning School Study (BSS)
The Beginning School Study (BSS) has followed a group of 838 individuals from their
first grade year in 1982. Sampling began with a stratified random sample of 20 Baltimore,
Maryland (U.S.) public schools. From there, roughly 12 first graders were randomly sampled
from each first grade classroom, with a participation rate of 97% among those selected.
Interviews were conducted recurrently between first grade and ages 28/29. For adult
outcomes, the BSS’s “Mature Adult” survey consists of 660 (79%) of the original participants at
the age of 28/29. Many children attending Baltimore public schools in the early 1980s came
from disadvantaged families, although these children were not as uniformly disadvantaged as the
children in many urban school districts today. Of the respondents in the age 28/29 interviews,
56% are African-American, with virtually all of the remainder Caucasian. Only about a third of
the analytic sample lived with a single parent at the baseline year, but over two-thirds were
eligible for a free or reduced price lunch at some point during their elementary school years.
Interviewing rules limited the sample size in some years. In the Grade 2 and 3 follow-
ups, the study followed only children attending the originally sampled schools. In the Grade 4, 5,
& 6 follow-ups, the researchers attempted to follow all children still attending any Baltimore
public school. Beginning with the Grade 7 follow-up, they attempted to contact the entire
original sample.
For more on sampling methods and sample description, see: Entwisle, D. R., Alexander,
K. L., & Olson, L. S. (2007). Early schooling: The handicap of being poor and male. Sociology
of Education, 80, 114–138.

32
The Swedish Individual Development and Adaptation (IDA)
The longitudinal research program Individual Development and Adaptation (IDA) was
initiated by David Magnusson in the early 1960s; and he directed it until 1996, when Lars
Bergman became the principal investigator. General descriptions of the IDA data base are
provided in Bergman (2000), Daukantaite (2007), Magnusson (1988) and Trost and Bergman
(2004). The data base consists of three whole school grade cohorts, but the present study uses
only data from the cohort born in 1955. The sample characteristics of this cohort are described
below.
In the present study, data were used from the first data collection in 1965 for the
complete school grade cohort of children in grade 3 from the town of Örebro, who were then
about 10 years of age. This cohort constituted our target sample and included 517 boys and 510
girls. Basic data from grade 3 were available for 958 of these children or 93 percent of the target
sample. It is fairly representative of a Swedish urban population, except that the socioeconomic
level of the children´s families was slightly above average (Bergman, 1973). Two extensive data
collections were performed when the individuals in question were middle-aged, one for females
in 1998 when they were 43 and one for males in 2002 when they were 47. Four hundred and
thirty females and 390 males took part (84 percent and 75 percent of the target sample,
respectively). With regard to school achievement and the parents´ education in grade 3, there
were no significant differences between those who took part in the data collections in middle age
and those who did not.
33
The Finnish Jyväskylä Longitudinal Study of Personality and Social
Development (JYLS)
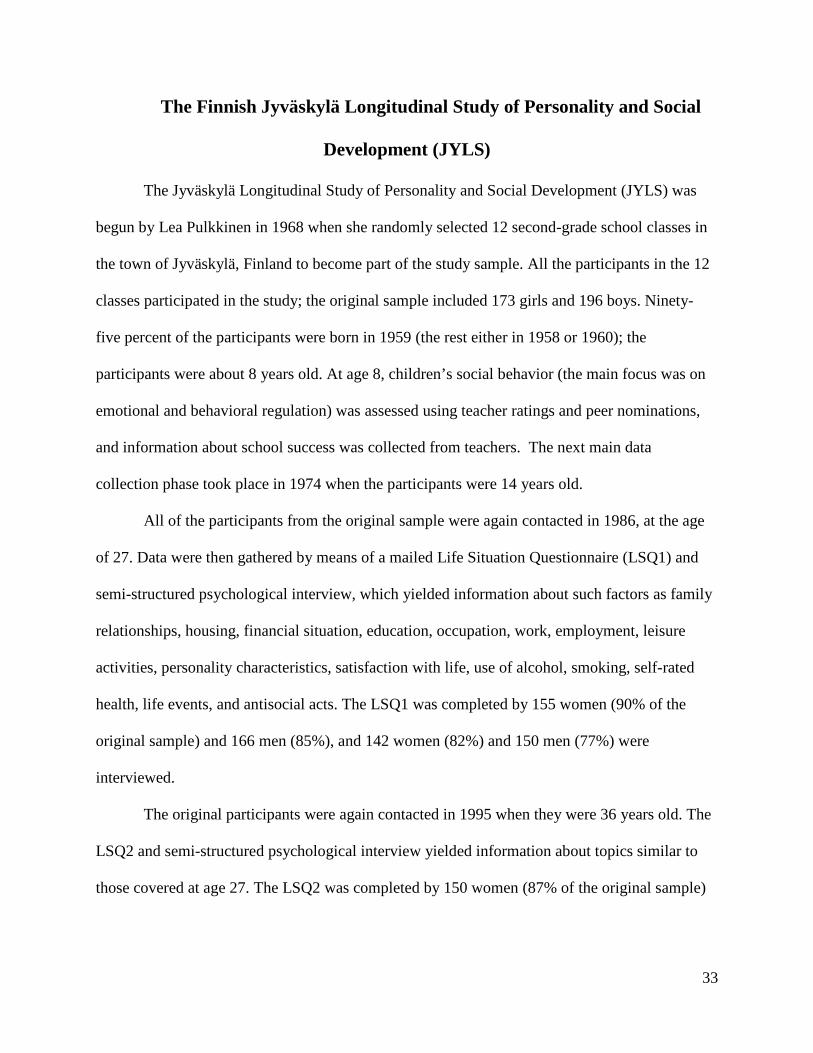
The Jyväskylä Longitudinal Study of Personality and Social Development (JYLS) was
begun by Lea Pulkkinen in 1968 when she randomly selected 12 second-grade school classes in
the town of Jyväskylä, Finland to become part of the study sample. All the participants in the 12
classes participated in the study; the original sample included 173 girls and 196 boys. Ninety-
five percent of the participants were born in 1959 (the rest either in 1958 or 1960); the
participants were about 8 years old. At age 8, children’s social behavior (the main focus was on
emotional and behavioral regulation) was assessed using teacher ratings and peer nominations,
and information about school success was collected from teachers. The next main data
collection phase took place in 1974 when the participants were 14 years old.
All of the participants from the original sample were again contacted in 1986, at the age
of 27. Data were then gathered by means of a mailed Life Situation Questionnaire (LSQ1) and
semi-structured psychological interview, which yielded information about such factors as family
relationships, housing, financial situation, education, occupation, work, employment, leisure
activities, personality characteristics, satisfaction with life, use of alcohol, smoking, self-rated
health, life events, and antisocial acts. The LSQ1 was completed by 155 women (90% of the
original sample) and 166 men (85%), and 142 women (82%) and 150 men (77%) were
interviewed.
The original participants were again contacted in 1995 when they were 36 years old. The
LSQ2 and semi-structured psychological interview yielded information about topics similar to
those covered at age 27. The LSQ2 was completed by 150 women (87% of the original sample)

34
and 161 men (82%); 137 women (79%) and 146 men (76% of the available sample – two men
had died) were interviewed.
The next main data collection phase took place in 2001 when the participants were 42
years old. The mailed LSQ3 and semi-structured psychological interview covered topics similar
to those addressed at ages 36 and 42; some new topics and methods were added. For the first
time, the data collection included a medical examination with laboratory tests. By age 42, the
available sample was reduced to 158 women and 186 men: one woman and five men had died
and 14 women (8% of the original sample) and five men (3%) had refused to take part in the
study. Of this available sample, 134 women (85%) and 151 men (81%) participated in a follow-
up study. The LSQ3 was completed by 132 women (84%) and 147 men (79%); 120 women
(76%) and 123 men (66%) were interviewed; and 120 women (76%) and 121 men (65%)
participated in the medical examination. The most recent data collection was completed in 2009
with 50-years-old participants. The data collection methods were similar to those at age 42. By
age 50, the available sample was reduced to 149 women and 174 men: Four women and eight
men had died and 20 women (12% of the original sample) and 14 men (7%) had refused to take
part in the study. Of this available sample, 127 women (85%) and 141 men (81%) participated in
a follow-up study. The LSQ4 was completed by 127 women (85%) and 140 men (80%); 111
women (74%) and 113 men (65%) were interviewed; and 114 women (77%) and 110 men (63%)
participated in the medical examination.
At ages 42 and 50, the participants provide a good representation of the original random
sample, indicating that there has been no selective attrition. When compared on characteristics
such as marital status, number of children and employment gathered by Statistics Finland, the
age-42 sample also appears representative of the Finnish age-cohort group born in 1959.

35
The Finnish measure of completed schooling represents highest level of education rather
than actual years spent in school. Since university schooling is state-supported (but the support is
time-limited), there is less pressure to graduate quickly than in those countries where there are
tuition fees. Individuals can spend seven to eight years at the university or three years in
vocational school and then another three years in vocational college. Consequently, all the
university graduates were assigned the same number of study years. The same logic applies to all
the other educational institutions. The ISCED years refer to the years assumed to be used to
obtain the highest level of completed education. This may have underestimated the schooling
years of those who have first graduated from, let’s say vocational school and then from the
vocational college.
For more information about the JYLS data collection phases (only the main data
collection phases are described above), methods, and theoretical background, see e.g.:
http://www.jyu.fi/ytk/laitokset/psykologia/en/research/jyls and Pulkkinen, L. (2009). Personality
– a resource or risk for successful development. Scandinavian Journal of Psychology, 50, 602–
610.
The National Child Development Study 1958 Birth Cohort (NCDS)
The 1958 National Child Development Study is a longitudinal study of British children
who were born during the week of March 3 through 9, 1958. A total of 17,414 mothers,
representing 98% of all births that week, were interviewed (Shepherd, 1985). Follow-up
interviews were conducted when the children were age 7 (1965; n = 15,468), 11 (1969; n =
15,503), and 16 years (1974; n = 14,761). These three ages were selected since they were
important transition points in the children’s educational progress through the British school

36
system. Adult follow-up survey interviews were conducted when the participants were 23 (1981;
n = 12,537), 33 (1991; n = 11, 469), 42 (2000; n = 11, 419) and 46 (2004; n = 9,534) years of
age.
For more on sampling methods and sample description, see: Shepherd, P.M. (1985). The
National Child Development Study: An introduction to the background of the study and the
methods of data collection (Working Paper No. 1, Social Statistics Research Unit, City
University, London).
The 1970 British Cohort Study (UK)
The UK 1970 British Birth Cohort (BCS) is a nationally representative longitudinal study
which has followed into adulthood a cohort of children born in England, Scotland, Wales and
Northern Ireland during one week in April 1970. The birth sample of 17,287 infants was
approximately 97% of the target birth population. Since the birth survey there have been six
other major data collection sweeps aimed at monitoring these children’s health, education, social
and economic circumstances. These were carried out in 1975 (age 5), 1980 (age 10), 1986 (age
16), 1996 (age 26), 2000 (age 30) and 2004 (age 34).
Data for the BCS70 have been collected from a variety of sources including
questionnaires completed by mothers, midwives present at birth and other healthcare
professionals, head and class teachers, school health service personnel and the cohort member
themselves. These data have also been collected through a number of means including paper and
electronic questionnaires, clinical records, medical examinations, tests of ability, educational
assessments and diaries.

37
A teacher strike in 1986 in England and Wales meant that much of the educational data
for age 16 is totally missing for a big swathe of the cohort. Moreover, the age 16 maths data was
only recently (and only partially) made available. There are only N=3677 maths test scores
available to analyse while there are N=6003 spelling and vocabulary assessments. Add to this the
fact that those schools who did administer the tests (i.e. those not on strike) are likely to the more
advantaged schools, the data available are unlikely to be as representative of the full cohort as in
the NCDS sample.
Attrition reduced the achieved sample to 10,833 in the age-30 (2000) sweep of the survey
(Ferri, Bynner and Wadsworth, 2003) and to 9,665 in the age-34 survey (Dodgeon et al., 2006).
Representativeness of the original birth cohort has been maintained with only slight biases in the
currently participating sample towards women and towards the more educated (Ferri et al., op
cit). However, missing data at the item response level (again maintaining broadly the
representativeness of the original cohort) reduces the effective data set for most analyses to
between 9,000 and 10,000 cases for the age-30 adult outcomes and further still if using age-34
adult outcomes.

38
Figure 1: Model of Skills and Behaviors in the Transmission of Socioeconomic Status
Reading Achievement
Middle childhood(age 7-10)
Adolescence(age 13-16)
Math Achievement
Aggression/Anti-social behavior
Attention
Mental health
Children’s Completed
School
Adulthood(age 27+)
Parent Schooling
Controls-# siblingsgender
Reading Achievement
Math Achievement
Attention
Aggression/Anti-social behavior
Mental health
Pro-social behavior Pro-social behavior

.00
.10
.20
.30
.40
.50
.60
.70
.80
0 1 2 3 4 5 6
Pare
nt/c
hild
ed
corr
elat
ions
and
regr
essi
on c
oeff
icie
nts
Data set and country
Figure 2: Parent-child education correlations and coefficients in chapter studies and in Hertz et al. (2007)
Study coefficientHertz et al. country cohort coefficientStudy correlationHertz et al. country cohort correlation
U.S. Beginning School Study
Finnish JYLSSwedish IDA
Study
British NCDS British BCS

.13
.14.13
.12
.15
.11
.08
.16
.14.14
.12
.20
.11
-.06
-.05-.04
.00
-.09 -.09
-.02
-.05 -.06
-.04
-.05
-.07
-.01
-.05 -.05
-.02
-.04
-.02-.03
.07 .05.05
.04 .03 .03
-.06
-.02
-.07-.06
-.03 -.03
.02
-.20
-.10
.00
.10
.20
.30
U.S. BSS Finnish JLYS Swedish IDA British NCDS British BCS
Coef
ficie
nt o
f chi
ld sk
ill o
r beh
avio
r on
pare
nt e
duca
tion
Figure 3: Child skill and behavior associations with parent education in middle childhood and adolescence
Reading Math Inattention Anti-social Prosocial Internalizing
U.S. BSS FInnish JYLS Swedish IDA British NCDS British BCS BSS
Age 7-10
Age 13-16

2528 29
21
32
40
25
37
46
384036
39
4844
0
20
40
60
80
100
U.S. Beginning School Study
Finnish JYLS Swedish IDA study British NCDS British BCS
Perc
ent o
f edu
catio
n co
rrel
atio
ns a
ccou
nted
for
Figure 4: Percent of intergenerational correlation in education accounted for by skills and behaviors
Age 7-10 skills and behaviorsAge 13-16 skills and behaviorsBoth ages 7-10 & 13-16 skills and behaviors

Mean reading literacy scores
5th/95th percentile reading literacy
scores
Slope of SES gradient for
reading literacy
Between-school variation in age 15
reading literacyUnited States 504 320/660 48 .35United Kingdom 523 352/682 49 .22Sweden 516 354/658 36 .09Finland 546 390/681 30 .11
Slope is the score difference on the test associated with a one standard deviation change in the PISA SES scale
Source for all data: OECD (2000).Between-school variation is expressed as a fraction of average variation across all OECD countries
Table 1: Cross-country differences in reading literacy among 15-year olds (from the 2000 PISA Study)
Notes: The standard deviation of reading literacy scores are 100.

Study Population Sample
1st wave Other relevant wavesAge 7/8: 545-667 (65-80%)
Age 14/15: 412-668 (49-80%)Age 27/28: 660 (79%)
Age 14: 356 (96%)Age 27: 321 (87%)Age 36: 311 (85%)Age 42: 285 (79%)Age 50: 268 (75%)
Age 13: 90%Age 15: 87% Age 16: 83%
Age 43 for females (84%); Age 48 for males (75%)Age 7: 15,051 (86%) Age 16: 13,917 (80%) Age 33: 10,986 (63%)Age 42: 10,979 (63%)Age 46: 9,175 (53%) Age 10: 14,350 (83%)Age 16: 11,206 (65%)Age 30: 10,833 (63%)Age 34: 9,316 (54%)
Age 38: Release April/May 2010Note: JYLS response rate excludes deceased study participants from the demoninators.
Table 2: Study Characteristics
Sample size and response rate
U.S. Beginning
School Study
First graders in Baltimore public schools in 1982
12 students selected at random from each
classroom1st grade: 838 (97%)
Finnish JYLS Second grade classrooms in Jyväskylä, Finland in 1968
All students in 12 randomly-selected
classroomsAge 8: 369 (100%)
British BCS British births in one April, 1970 week 100% sampling rate Birth: 17,287 (97%)
Swedish IDA study
All third grade students in Örebro, Sweden in 1965 100% sampling rate 3rd grade (age 10):
958 (93%)
British NCDS British births in one March, 1958 week 100% sampling rate Birth: 17,416 (98%)

U.S. Beginning
Finnish JYLS
Swedish IDA
British NCDS
British BCS
Simple average
Reading .33 .33* .48* .31* .36(.18) (.09) (.02) (.07)
Math .57* - .39* .42* .51* .47(.16) (.10) (.03) (.07)
School success - .74* - -(.16)
Attention problems -.08 .00 -.09 -.11* -.27* -.11(.15) (.16) (.09) (.03) (.08)
Anti-social .07 -.21* -.13 -.24* -.06 -.11(.14) (.15) (.08) (.03) (.05)
Prosocial .29 .28 .06 - -.10 .13(.16) (.17) (.07) (.06)
Anxiety/Internalizing .23 -.10 -.14* - .02 .00(.15) (.16) (.06) (.06)
Reading -.00 - .23 .46* .43* .28(.16) (.12) (.03) (.06)
Math 1.18* - .55* .81* .78* .83(.16) (.12) (.03) (.05)
School success - 1.64* - -(.14)
Attention problems .36* .10 -.30* -.11* -.17* -.02(.18) (.16) (.11) (.03) (.07)
Anti-social -.48* .19 -.02 -.14* -.09 -.11(.19) (.14) (.11) (.03) (.07)
Prosocial .28* .06 .09 .10* - .13(.12) (.13) (.06) (.03)
Anxiety/Internalizing -.11 .15 -.15* -.04 -.01 -.03(.13) (.13) (.07) (.03) (.05)
Observations 888 356 1026 11979 3677/3629
Regression 1: Completed schooling on middle childhood (age 7-10) skills/behaviors and background controls
Regression 2: Completed schooling on adolescent (age 13-16) skills/behaviors and background controls
Table 3: Coefficients and standard errors from separate regressions of child's completed schooling on child skill and behaviors in: i) middle childhood and in: ii) adolescence
Notes: * denotes p<.05. Control variables in all regressions include child child’s sex, number of siblings and, where available, age when outcome was measured race/ethnicity and birth weight.

U.S. BSS Finnish JYLS
Swedish IDA
British NCDS British BCS Simple average
Reading .09 - -.08 .17* .12 .08(.21) (.11) (.02) (.07)
Math .01 - .01 .18* .26* .12(.16) (.15) (.02) (.06)
School success - .19* - -(.15)
Attention problems -.11 -.01 .09 -.01 -.14 -.04(.14) (.15 (.10) (.02) (.08)
Anti-social .11 -.02 -.08 -.12* -.02 -.03(.143 (.14) (.08) (.03) (.05)
Prosocial .17 .34* -.04 - -.07 .10(.13) (.15) (.07) (.06)
Anxiety/Internalizing .20 -.07 -.08 - .00 .01(.15) (.14) (.08) (.06)
Adolescent (age 13- Reading -.07 - .29* .39* .35* .24
(.22) (.13) (.03) (.06)
Math 1.11* - .56* .70* .58* .74(.17) (.16) (.03) (.05)
School success - 1.52* - -(.14)
Attention problems .33* .05 -.32* -.11* -.15* -.05(.17) (.16) (.11) (.03) (.08)
Anti-social -.44* .19 .00 -.14* -.09 -.10(.22) (.14) (.11) (.03) (.06)
Prosocial .28* -.03 .11 .09* - .11(.12) (.13) (.07) (.03)
Anxiety/Internalizing -.14 .23* -.13 -.03 -.02 -.02(.15) (.13) (.08) (.03) (.05)
Observations 888 356 1026 11979 3629
Middle childhood (age 7-10) skills/behaviors
Table 4: Coefficients and standard errors from regressions of child's completed schooling on both middle childhood (age 7-10) and adolescent (age 13-16) skills/behaviors and background controls
Notes: * denotes p<.05. Control variables in all regressions include child child’s sex, number of siblings, age when outcome was measured and, where available, race/ethnicity and birth weight.

U.S. BSS Finnish JYLS Swedish IDA study
British NCDS British BCS
Child education (years)Mean 13.6 12.4 12.1 13.4 13.7
SD 3.1 2.8 2.3 2.5 2.5
Parent education (years)Mean 12.3 9.7 9.3 12.1 12.5
SD 2.6 3.0 2.3 1.5 2.5
Age 7-10 Skills and behaviorsAge 13-16 Skills and beahviors
Background controlsFraction Male 0.50 0.53 0.50 0.50 0.5
Fraction Ethnic minority 0.55 - - 0.02 0.01Number of siblings
Mean 1.5 2.5 1.3 2.1 1.5SD 1.4 1.5 1.2 1.6 1.0
Birth weight (lbs)Mean - - - 7.4 7.3
SD - - - 1.2 1.2
Appendix Table 1: Descriptive statistics
All standardized with study means and sdsAll standardized with study means and sds

U.S. Beginning School Study Finnish JYLS Swedish IDA study British NCDS British BCS
Age 7/8 Age 8 Age 10 Age 7 Age 10
Math California Achievement Test (CAT) math score mean
Math and reading tests are not available; however, teacher-rated information about school achievement is available
Standardized achievement test in Mathematics; school grade in Mathematics
Southgate Reading Test Edinburgh Reading Test (α=.96)
Reading CAT reading score mean Standardized achievement test in Swedish; school grade in Swedish
Problem Arithmetic Test University of Bristol Math Test; (α=.93)
Attention
Attention problems Teacher report of, e.g., Is awfully restless, fidgets all the time, can’t sit still; Can’t concentrate, can’t pay attention. 2 items, alpha=.79
Teacher-rating of, Which pupils are unsteady and lack concentration in their work and attentiveness?
Teacher reports of motor restlessness and concentration difficulties
Teacher report of, e.g., often running or jumping about; squirmy, fidgety (α=.76) Parent report of, e.g., difficulty settling to anything; squirmy, fidgety (α=.60)
Teacher reports of concentration difficulties, whether prone to day dreaming, shows perseverance, degree of distractibility etc. (α=.93)
Aggression/ Anti-social behavior problems
Teacher report of, e.g., Fights too much, teases, picks on, or bullies other children; Has a strong temper. 4 items, α =.77
Teacher-rated aggression, e.g., Does the pupil hurt another child when angry, e.g. by hitting,...? 8 items, α= 91.
Teacher report of aggressiveness
Parent report of, e.g., irritable, quick to fly off handle, has temper tantrums, fights other children (α=.63)
Teacher reports of child being irritable, quick to fly off the handle, quarrels or bullies other children, destroys others' belongings (α=.91)
Social Skills Teacher report of, e.g., Enthusiastic, interested in different things, expresses ideas; Is polite, helpful, considerate of others. 4 items, α =.81.
Teacher-rated social activity, e.g., Is the pupil in question always busy and plays eagerly with other children during breaks and after school hours? 3 items, α=.77.
Peer rank-ordering of popularity, completed by same-sex classmates (2.5-month test-retest r = .84).
Not available Teacher reports of popularity with peers, number of friends, is cooperative with peers, and levels of solitary behaviors (α=.82)
Internalizing behavior problems
Teacher reports of, e.g., Keeps to him/herself, tends to withdraw. 2 items, α=.77.
Teacher-reported anxiety, e.g., Is the pupil afraid of other children? 3 items, alpha=.71.
Teacher report of timidity, e. g., bashful, shy, inhibited, low self-esteem
Teacher reports of whether child is fearful or afraid of new things or situations, behaves nervously, is over-fussy, is worried and anxious (α=.85).
Appendix Table 2: Study Measures of Age 7-10 Skills and Behaviors
Achievement
Socioemotional Behaviors

U.S. Beginning School Study Finnish JYLS Swedish IDA study British NCDS British BCS
Age 14-16 Age 14 Age 13 Age 16 Age 16
Reading CAT reading score mean Standardized achievement test in Swedish; school grade in Swedish
Arithmetic/Mathematics Test [Not published. Constructed by the National Foundation for Educational Research in England and Wales (NFER) specificially for the NCDS.
University of Bristol Math Test; (α=.93)
Attention
Attention problems Teacher report of, e.g., Is awfully restless, fidgets all the time, can’t sit still; Can’t concentrate, can’t pay attention. 2 items, alpha=.79
Teacher ratings and peer nominations of: is impulsive, lacks concentration, changes moods
Teacher reports of motor restlessness and concentration difficulties
Teacher reports of, e.g., Cannot settle more than a few moments; restless, difficulty staying seated; squirmy, fidgety (3 items, α=.84)
Teacher reports of concentration difficulties, whether prone to day dreaming, shows perseverance, degree of distractibility etc. (α=.93)
Social Skills Teacher report of, e.g., Enthusiastic, interested in different things, expresses ideas; Is polite, helpful, considerate of others. 4 items, alpha=.81.
Teacher ratings and peer nominations of: is energetic, always on the go, often has contact with others, α=.84.
Peer rank-ordering of popularity, completed by same-sex classmates (2.5-month test-retest r = .84).
Teacher report of popularity with peers and social skills, e.g., Not much liked by other children; sociable vs. withdrawn; flexible vs. rigid (3 items, α=.59).
Teacher report of timidity, e. g., bashful, shy, inhibited, low self-esteem
Teacher report of, e.g., Is withdrawn, tends to be on own-rather solitary, fearful of new situations and things, often worries about many things (4 items, α= .66).
Teacher reports of whether child is fearful or afraid of new things or situations, behaves nervously, is over-fussy, is worried and anxious (α=.85).
Internalizing behavior problems
Teacher reports of, e.g., Keeps to him/herself, tends to withdraw. 2 items, α=.77.
Teacher ratings and peer nominations of: is fearful, helpless in others' company, target of teasing, unable to defend self
Teacher report of aggressiveness
Teacher report of, e.g., Detroys/damages own and others' property; bullies other children; is often disobedient (5 items, α= .87).
Teacher reports of child being irritable, quick to fly off the handle, quarrels or bullies other children, destroys others' belongings (α=.91)
Socioemotional Behaviors
Aggression/ Anti-social behavior problems
Teacher report of, e.g., Fights too much, teases, picks on, or bullies other children; Has a strong temper. 4 items, alpha=.77
Teacher ratings and peer nominations of: attacks without reason, teases others, says naughty things
Achievement
Appendix Table 3: Study Measures of Age 13-16 Skills and Behaviors
Reading Comprehension Test [Not published. Constructed by the National Foundation for Educational Research in England and Wales (NFER) specificially for the NCDS.
Edinburgh Reading Test (α=.96)Math California Achievement Test (CAT) math score mean
Math and reading tests are not available; however, information about grade-point average, collected from school archives, is available
Standardized achievement test in Mathematics; school grade in Mathematics
Related Documents