THE ROLE OF BUSINESS TRAVEL IN THE U.S. ECONOMIC RECOVERY

Welcome message from author
This document is posted to help you gain knowledge. Please leave a comment to let me know what you think about it! Share it to your friends and learn new things together.
Transcript

THE ROLE OF BUSINESS TRAVEL
IN THE U.S. ECONOMIC RECOVERY

TABLE OF CONTENTS
1 | Executive Summary 4
2 | The Economic Importance of Business Travel 5
3 | Business Travel Trends 7
4 | Business Travel and Industry Performance 9
4.1 | Industry Performance and Business Travel: Correlation Analysis 9
4.2 | The Return on Investment of Business Travel: Causation Analysis 14
5 | The Role of Business Travel at the Company Level 19
5.1 | Overall Impacts of Business Travel 19
5.2 | Keeping Customers 21
5.3 | Winning New Business 22
5.4 | Building Teams 23
6 | About Oxford Economics and Tourism Economics 24
7 | Methodology and Data Sources 25
7.1 | Business Travel Trends and Economic Impact 25
7.2 | Correlation Analysis 26
7.3 | Causation Analysis 27
7.4 | Business Traveler Survey 31
2 THE ROLE OF BUSINESS TRAVEL IN THE U.S. ECONOMY U.S. TRAVEL ASSOCIATION
Despite the size aand positive impact of the U.S. travel industry, the act of traveling has yet to be seen as an essential part of our lives, businesses and economy. The Travel Effect campaign reverses that thinking and proves that the travel experience and the travel industry as a whole actually have a measurable and purposeful impact. The Travel Effect proves through research the economic, societal, business and personal benefits of travel, demonstrating the real truth behind the “hidden” impacts of travel.
The U.S. Travel Association, the voice for the U.S. travel industry, will support its mission to increase travel to and within the United States through the Travel Effect campaign and leverage the collective strength of its industry partners to help grow travel’s voice, advance pro-travel policies and communicate travel’s widespread impact. Visit www.traveleffect.com.
The U.S. Travel Association is the national, non-profit organization representing all components of the travel industry that generates $2 trillion in economic output and supports 14.6 million American jobs. U.S. Travel’s mission is to increase travel to and within the United States. Visit www.ustravel.org.
© 2013 U.S. Travel Association
3 THE ROLE OF BUSINESS TRAVEL IN THE U.S. ECONOMY U.S. TRAVEL ASSOCIATION
4 THE ROLE OF BUSINESS TRAVEL IN THE U.S. ECONOMY U.S. TRAVEL ASSOCIATION
1 | EXECUTIVE SUMMARY
Business travel has been a subject of much debate over the past five years. As the U.S. economy turned downward in 2008, many businesses cut back on travel spending raising the question of how this might affect these businesses as the economy recovered.
This study builds on an analysis of the return on investment of business travel conducted in 2009. A similar review of current data, statistical analysis, and a survey of business travelers has provided a longer time frame to evaluate the role, if any, that business travel plays in the company performance and the U.S. economy.
In summary, our research concludes the following:
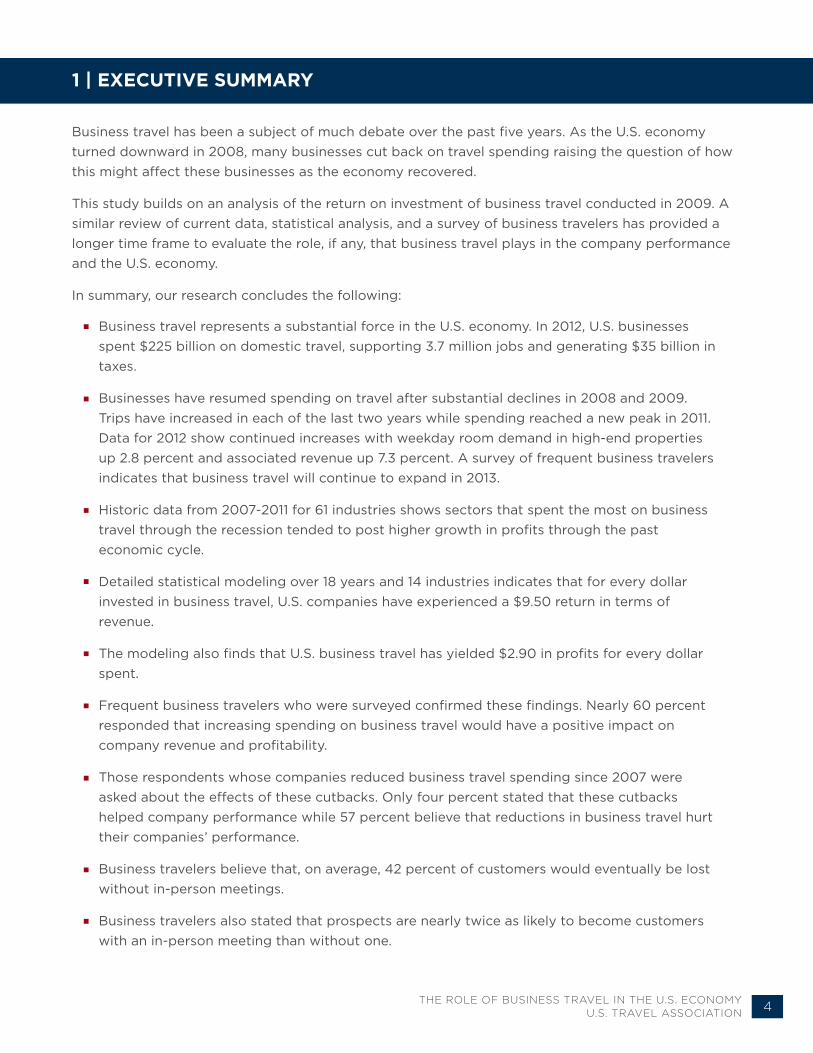
Business travel represents a substantial force in the U.S. economy. In 2012, U.S. businesses spent $225 billion on domestic travel, supporting 3.7 million jobs and generating $35 billion in taxes.
Businesses have resumed spending on travel after substantial declines in 2008 and 2009. Trips have increased in each of the last two years while spending reached a new peak in 2011. Data for 2012 show continued increases with weekday room demand in high-end properties up 2.8 percent and associated revenue up 7.3 percent. A survey of frequent business travelers indicates that business travel will continue to expand in 2013.
Historic data from 2007-2011 for 61 industries shows sectors that spent the most on business travel through the recession tended to post higher growth in profits through the past economic cycle.
Detailed statistical modeling over 18 years and 14 industries indicates that for every dollar invested in business travel, U.S. companies have experienced a $9.50 return in terms of revenue.
The modeling also finds that U.S. business travel has yielded $2.90 in profits for every dollar spent.
Frequent business travelers who were surveyed confirmed these findings. Nearly 60 percent responded that increasing spending on business travel would have a positive impact on company revenue and profitability.
Those respondents whose companies reduced business travel spending since 2007 were asked about the effects of these cutbacks. Only four percent stated that these cutbacks helped company performance while 57 percent believe that reductions in business travel hurt their companies’ performance.
Business travelers believe that, on average, 42 percent of customers would eventually be lost without in-person meetings.
Business travelers also stated that prospects are nearly twice as likely to become customers with an in-person meeting than without one.

5 THE ROLE OF BUSINESS TRAVEL IN THE U.S. ECONOMY U.S. TRAVEL ASSOCIATION
Business travel represents a substantial force in the U.S. economy. The impact of business travel broadly takes two forms. The first is the business activity directly generated by travel. This includes corporate spending across a host of sectors, including air transport, car rentals, train transport, taxis, hotels, restaurants, and meeting planning.
The second is the effect of business travel on company performance and the broader economy through improved productivity. Productivity gains may take various forms including new sales, customer retention, collaboration, employee satisfaction, networking, industry knowledge and idea sharing.
This section focuses on the first channel of impact—the direct economic value of business travel expenditures.
In 2011, U.S. businesses spent $214 billion on domestic travel1, just surpassing a historic peak from 2007. Oxford Economics estimates that in 2012, businesses spent $225 billion on U.S. domestic travel with growth of five percent.
The majority of this spending (57%) was for general business travel while 43 percent was for meetings and conventions.
These business travel expenditures generated substantial economic impacts including:
$-
$50
$100
$150
$200
$250
2007 2008 2009 2010 2011 2012
Meetings / Convention
General Business
$213 bn $225 bn
U.S. Domestic Business Travel Expenditures
$ B
illio
n
$19.1
$9.7
$5.8
0
5
10
15
20
25
30
35
Local
State
Federal
U.S. Domestic Business Travel Tax Impact
$ B
illio
n
1 Another $35 billion and $34 billion was spent by U.S. companies on international business travel in 2011 and 2012, respectively.
2 | THE ECONOMIC IMPORTANCE OF BUSINESS TRAVEL
Meetings/Conventions
Federal
General Business
State Local
Source: U.S. Travel Association
Source: U.S. Travel Association
1.9 million jobs directly sustained by business travel expenditures
$59 billion in personal income
$34.5 billion in taxes, including $19.1 billion in federal, $9.7 billion in state, and $5.8 billion in local taxes.
6 THE ROLE OF BUSINESS TRAVEL IN THE U.S. ECONOMY U.S. TRAVEL ASSOCIATION
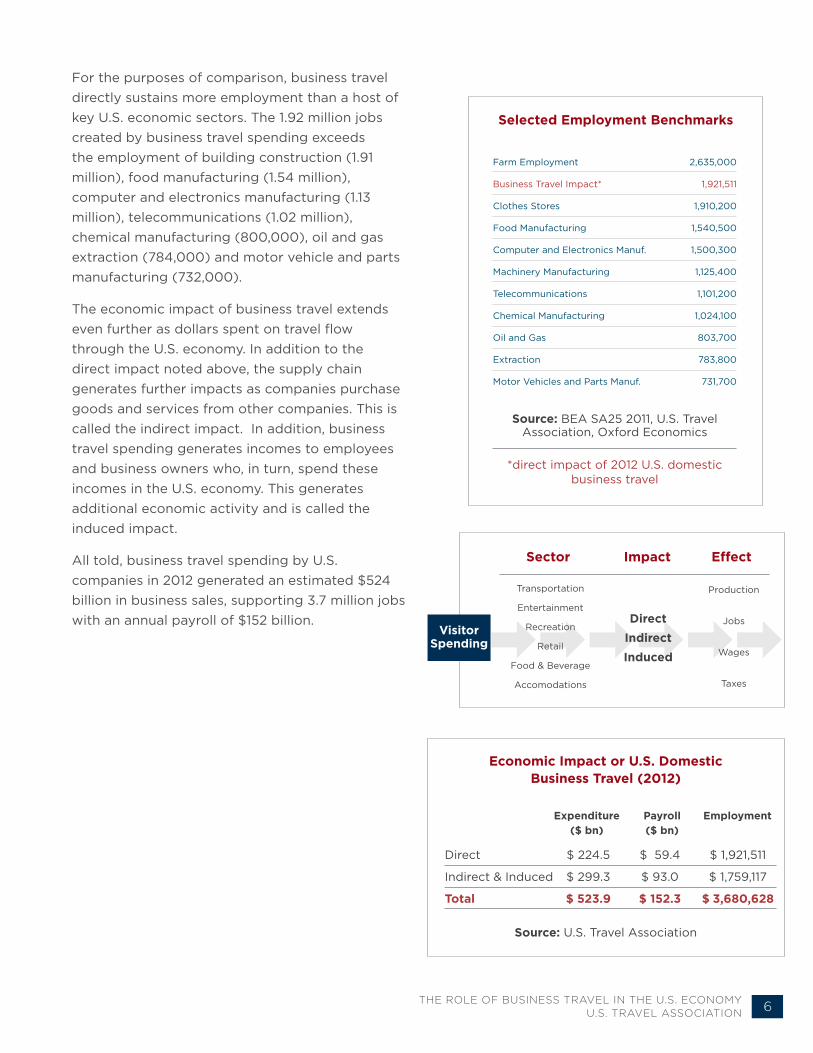
For the purposes of comparison, business travel directly sustains more employment than a host of key U.S. economic sectors. The 1.92 million jobs created by business travel spending exceeds the employment of building construction (1.91 million), food manufacturing (1.54 million), computer and electronics manufacturing (1.13 million), telecommunications (1.02 million), chemical manufacturing (800,000), oil and gas extraction (784,000) and motor vehicle and parts manufacturing (732,000).
The economic impact of business travel extends even further as dollars spent on travel flow through the U.S. economy. In addition to the direct impact noted above, the supply chain generates further impacts as companies purchase goods and services from other companies. This is called the indirect impact. In addition, business travel spending generates incomes to employees and business owners who, in turn, spend these incomes in the U.S. economy. This generates additional economic activity and is called the induced impact.
All told, business travel spending by U.S. companies in 2012 generated an estimated $524 billion in business sales, supporting 3.7 million jobs with an annual payroll of $152 billion.
Transportation
Entertainment
Recreation
Retail
Food & Beverage
Accomodations
DirectIndirectInduced
Sector Impact Effect
Production
Jobs
Wages
Taxes
Visitor Spending
Farm Employment
Business Travel Impact*
Clothes Stores
Food Manufacturing
Computer and Electronics Manuf.
Machinery Manufacturing
Telecommunications
Chemical Manufacturing
Oil and Gas
Extraction
Motor Vehicles and Parts Manuf.
2,635,000
1,921,511
1,910,200
1,540,500
1,500,300
1,125,400
1,101,200
1,024,100
803,700
783,800
731,700
Selected Employment Benchmarks
Source: BEA SA25 2011, U.S. Travel Association, Oxford Economics
*direct impact of 2012 U.S. domestic business travel
Direct
Indirect & Induced
Total
$ 224.5
$ 299.3
$ 523.9
Economic Impact or U.S. Domestic Business Travel (2012)
$ 59.4
$ 93.0
$ 152.3
$ 1,921,511
$ 1,759,117
$ 3,680,628
Source: U.S. Travel Association
Expenditure ($ bn)
Payroll ($ bn)
Employment

7 THE ROLE OF BUSINESS TRAVEL IN THE U.S. ECONOMY U.S. TRAVEL ASSOCIATION
3 | BUSINESS TRAVEL TRENDS
Business travel has come under various pressures over the past five years. The onset of recession in 2008 caused businesses to make drastic cuts in spending, affecting the labor market, investment, and business travel alike.
In 2008, business travel spending declined 1.0 percent while companies cut 0.5 percent of their workforce. Companies also began to pull back on investment, amounting to a 3.6 percent drop.
The situation accelerated in 2009. Business travel spending fell an additional 11 percent and corporate investment contracted another 16 percent. Cost cutting hit the labor market hard as well with a four percent drop in total U.S. employment.
The economic recovery began in 2010. And with the recovery, business travel turned upward with a three percent increase in trips taken and a six percent increase in spending. Investment and employment, however, merely stabilized, posting modest declines for the year. On a quarterly basis, employment began to grow modestly in the fourth while investment turned positive in the third.
Estimates through the end of 2012 show a mixed picture of recovery relative to prerecession business operations. Employment remains 2.4 percent below the 2007 peak, while investment stands 9.5 percent short of prerecession levels. Business travel spending has exceeded 2007 levels by 5.6 percent. However, on a volume basis (i.e. trips taken) business travel remains 5.5 percent below 2007 levels. So while spending has recovered, this is a function of higher prices affecting spend per trip — especially for transportation. When factoring in inflation using the Travel Price Index, business travel spending remains seven percent below 2007 levels in real (inflation adjusted) terms.
70
80
90
100
110
2007 2008 2009 2010 2011 2012
Business travel spend
Employment
Investment
Business trips
A Mixed Recovery
Source: U.S. Travel Association, BEA, BLS
200
7 =
10
0
-20%
-15%
-10%
-5%
0%
5%
10%
Business travel spend ($)
Investment ($)
Employment (persons)
2007 2008 2009
2010 2011 2012
Companies Respond to Recession with Cuts
Source: U.S. Travel Association, BEA, BLS
% c
hang
eBusiness Travel Spending ($)
Investment ($)Employment (persons)
8 THE ROLE OF BUSINESS TRAVEL IN THE U.S. ECONOMY U.S. TRAVEL ASSOCIATION
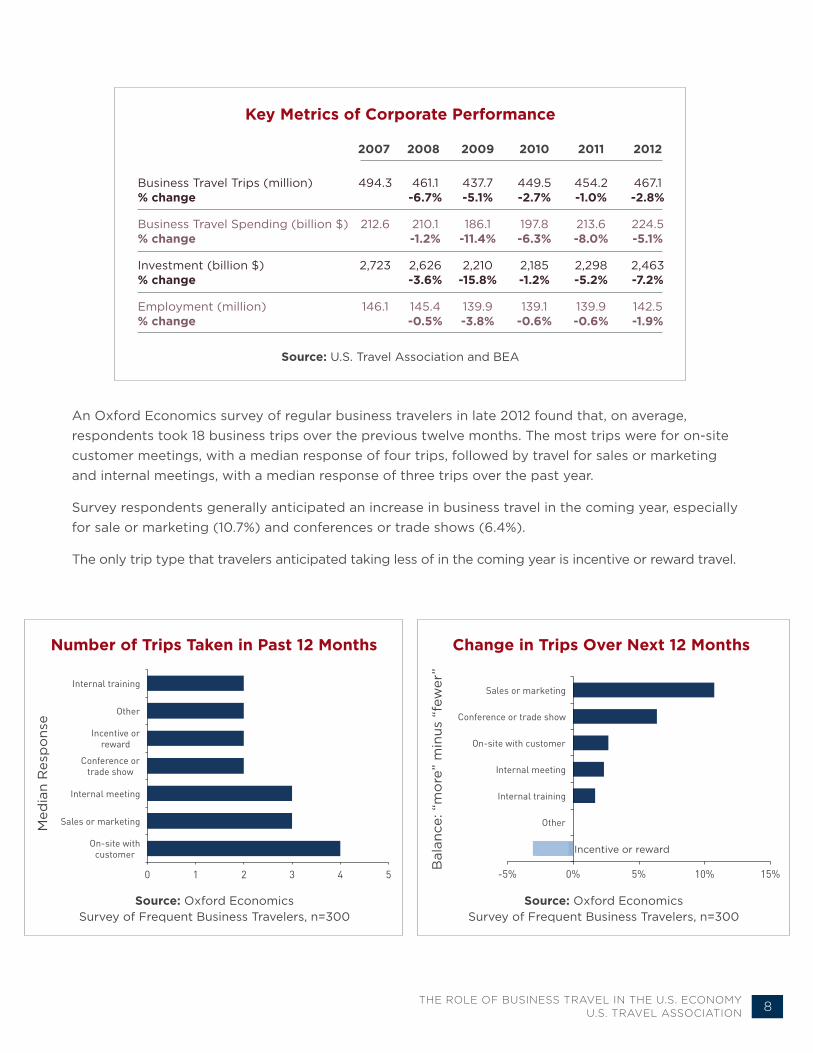
An Oxford Economics survey of regular business travelers in late 2012 found that, on average, respondents took 18 business trips over the previous twelve months. The most trips were for on-site customer meetings, with a median response of four trips, followed by travel for sales or marketing and internal meetings, with a median response of three trips over the past year.
Survey respondents generally anticipated an increase in business travel in the coming year, especially for sale or marketing (10.7%) and conferences or trade shows (6.4%).
The only trip type that travelers anticipated taking less of in the coming year is incentive or reward travel.
0 1 2 3 4 5
On-site with customer
Sales or marketing
Internal meeting
Conference or trade show
Incentive or reward
Other
Internal training
Number of Trips Taken in Past 12 Months
Med
ian
Res
po
nse
Source: Oxford Economics Survey of Frequent Business Travelers, n=300
Source: Oxford Economics Survey of Frequent Business Travelers, n=300
-5% 0% 5% 10% 15%
Incentive or reward
Other
Internal training
Internal meeting
On-site with customer
Conference or trade show
Sales or marketing
Change in Trips Over Next 12 Months
Bal
ance
: “m
ore
” m
inus
“fe
wer
”
Business Travel Trips (million) % change
Business Travel Spending (billion $) % change
Investment (billion $) % change
Employment (million) % change
494.3
212.6
2,723
146.1
2007
461.1 -6.7%
210.1 -1.2%
2,626 -3.6%
145.4 -0.5%
2008
437.7 -5.1%
186.1 -11.4%
2,210 -15.8%
139.9 -3.8%
2009
449.5 -2.7%
197.8 -6.3%
2,185 -1.2%
139.1 -0.6%
2010
454.2 -1.0%
213.6 -8.0%
2,298 -5.2%
139.9 -0.6%
2011
467.1 -2.8%
224.5 -5.1%
2,463 -7.2%
142.5 -1.9%
2012
Key Metrics of Corporate Performance
Source: U.S. Travel Association and BEA
Incentive or reward

9 THE ROLE OF BUSINESS TRAVEL IN THE U.S. ECONOMY U.S. TRAVEL ASSOCIATION
4 | BUSINESS TRAVEL AND INDUSTRY PERFORMANCE
Recent trend data show how the economic cycle has affected business behavior, including expenditures on business travel. A crucial question remains: has business travel played a role in the economic recovery to date? That is, does the importance of business travel extend beyond its direct, indirect, and induced economic impacts?
To answer this question, three tiers of analysis were undertaken. The first is a correlation analysis between business travel by industry and that industry’s performance over the past five years. The second is an econometric analysis, updated from 2009, that determines the degree to which there is any causal relationship between business travel and industry performance. The third is a survey of frequent business travelers regarding the role that business travel has played in their individual and company’s performance.
4.1 | INDUSTRY PERFORMANCE AND BUSINESS TRAVEL: CORRELATION ANALYSIS
Our first step was to determine if any correlation exists at an industry level between historic levels and trends of an industry’s spending on business travel and that industry’s performance over time. Business travel spending for 61 separate industries was calculated using the Bureau of Economic Analysis (BEA) Supply-Use tables, which provide detailed data on the purchases of goods and services by industry.
Statistical analysis for the 2007-2011 period reveals a positive correlation between the level of business travel spending and an industry’s performance; i.e. those industries that spend more on business travel have generally posted stronger profits through the recession and recovery.
For example, those sectors that spent more on business travel as a share of industry output (called “business travel intensity”) demonstrated greater growth in profits over the 2007-2011 period. The upward slope of the line illustrates this positive, though modest, correlation.
-40%
-30%
-20%
-10%
0%
10%
20%
30%
40%
50%
60%
0.0% 0.5% 1.0% 1.5% 2.0% 2.5% 3.0%
Business Travel Intensity
(avg 2007-2011)
Cumulative Profit Growth 2011/2007
Business Travel Intensity versus Profit Growth
Source: BEA

10 THE ROLE OF BUSINESS TRAVEL IN THE U.S. ECONOMY U.S. TRAVEL ASSOCIATION
This correlation is also evident in terms of the change in business travel intensity and industry performance; i.e. those industries that maintained or increased their spending on business travel through the recession and recovery have tended to perform better than average as measured by cumulative profit growth from 2007-2011.
Notably, out of 61 industries, only six reduced business travel as a share of output and also experienced a decline in profits over this four-year period.
When the set of industries is narrowed to those that spend at least one percent of output on business travel, the relationship is stronger. This is a helpful refinement since some industries spend very little on business travel due to the nature of their business — thus any relationship between travel and profits would naturally be small.
Across these 13 industries, a strong positive relationship is evident between the change in business travel intensity and the change in profits from 2007-2011.
Only three industries increased business travel intensity and experienced a contraction in profits while ten industries maintained or increased their business travel intensity and also experienced profit growth.
y = 0.1471x + 0.0957
-60%
-40%
-20%
0%
20%
40%
60%
-60% -40% -20% 0% 20% 40% 60%
Change in Business Travel Intensity 2011/2007
Cumulative Profit Growth 2011/2007
Change in Business Travel Intensity versus Profits
Source: BEA
Printing Air transport
Publishing industries
Audio, video recording
Telecommunications
Information processing
Banking
Legal services
Computer systems
Professional services
Admin. services
Accommodation
Food services
y = 7.3172x - 0.0513
-30%
-20%
-10%
0%
10%
20%
30%
40%
0.0% 0.5% 1.0% 1.5% 2.0% 2.5% 3.0%
Business Travel Intensity (avg 2007- 2011)
Cumulative Profit Growth 2011/2007
Business Travel Intensity versus Profit Growth
Source: BEA
11 THE ROLE OF BUSINESS TRAVEL IN THE U.S. ECONOMY U.S. TRAVEL ASSOCIATION
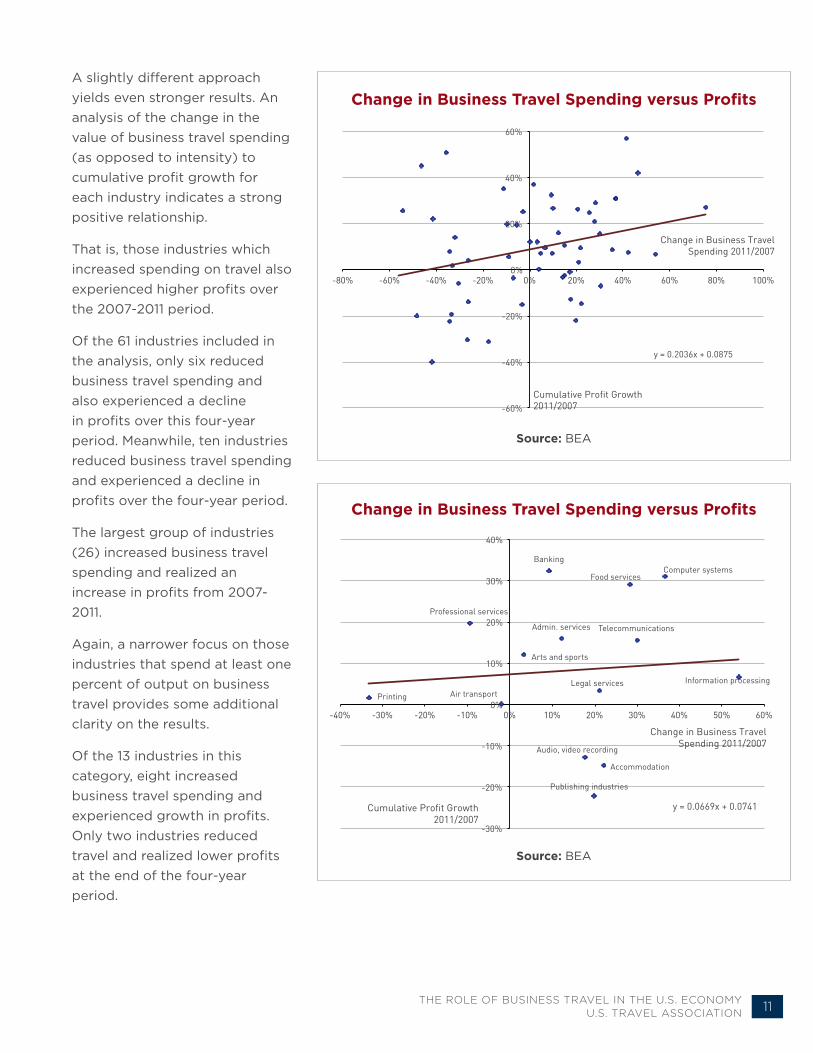
A slightly different approach yields even stronger results. An analysis of the change in the value of business travel spending (as opposed to intensity) to cumulative profit growth for each industry indicates a strong positive relationship.
That is, those industries which increased spending on travel also experienced higher profits over the 2007-2011 period.
Of the 61 industries included in the analysis, only six reduced business travel spending and also experienced a decline in profits over this four-year period. Meanwhile, ten industries reduced business travel spending and experienced a decline in profits over the four-year period.
The largest group of industries (26) increased business travel spending and realized an increase in profits from 2007-2011.
Again, a narrower focus on those industries that spend at least one percent of output on business travel provides some additional clarity on the results.
Of the 13 industries in this category, eight increased business travel spending and experienced growth in profits. Only two industries reduced travel and realized lower profits at the end of the four-year period.
y = 0.2036x + 0.0875
-60%
-40%
-20%
0%
20%
40%
60%
-80% -60% -40% -20% 0% 20% 40% 60% 80% 100%
Change in Business Travel Spending 2011/2007
Cumulative Profit Growth 2011/2007
Change in Business Travel Spending versus Profits
Source: BEA
Printing Air transport
Publishing industries
Audio, video recording
Telecommunications
Information processing
Banking
Legal services
Computer systems
Professional services
Admin. services
Arts and sports
Accommodation
Food services
y = 0.0669x + 0.0741
-30%
-20%
-10%
0%
10%
20%
30%
40%
-40% -30% -20% -10% 0% 10% 20% 30% 40% 50% 60%
Change in Business Travel Spending 2011/2007
Cumulative Profit Growth 2011/2007
Change in Business Travel Spending versus Profits
Source: BEA
12 THE ROLE OF BUSINESS TRAVEL IN THE U.S. ECONOMY U.S. TRAVEL ASSOCIATION
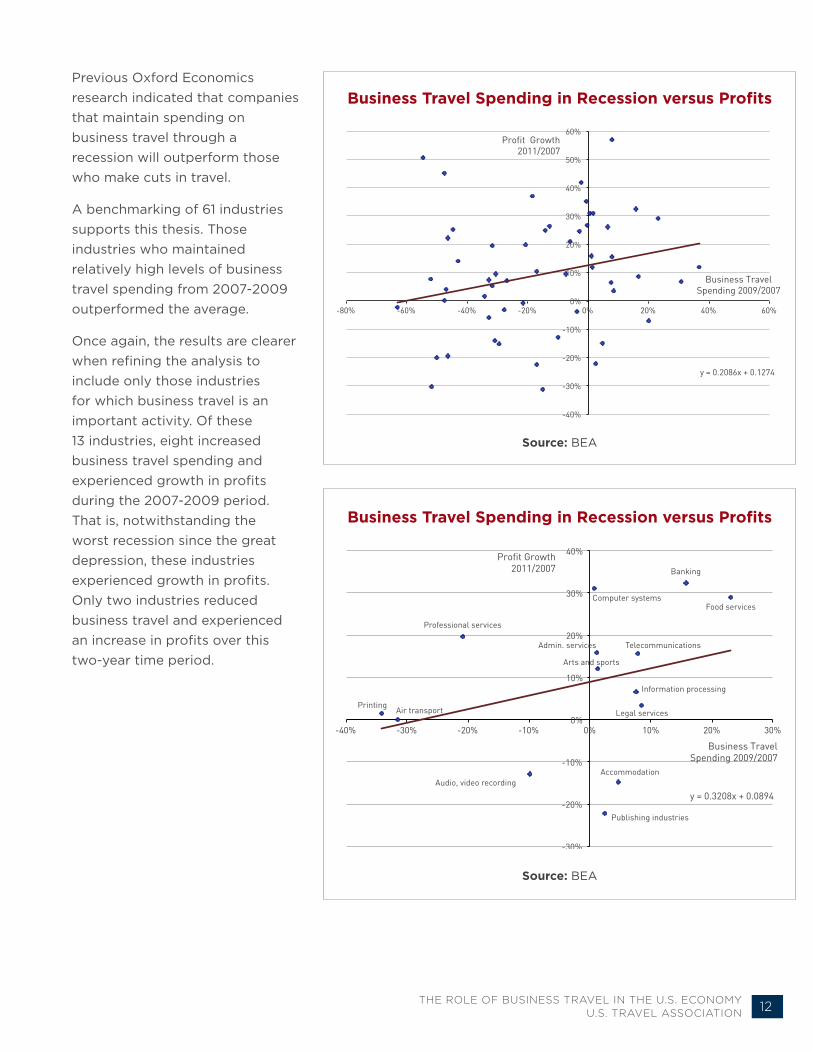
Previous Oxford Economics research indicated that companies that maintain spending on business travel through a recession will outperform those who make cuts in travel.
A benchmarking of 61 industries supports this thesis. Those industries who maintained relatively high levels of business travel spending from 2007-2009 outperformed the average.
Once again, the results are clearer when refining the analysis to include only those industries for which business travel is an important activity. Of these 13 industries, eight increased business travel spending and experienced growth in profits during the 2007-2009 period. That is, notwithstanding the worst recession since the great depression, these industries experienced growth in profits. Only two industries reduced business travel and experienced an increase in profits over this two-year time period.
y = 0.2086x + 0.1274
-40%
-30%
-20%
-10%
0%
10%
20%
30%
40%
50%
60%
-80% -60% -40% -20% 0% 20% 40% 60%
Profit Growth 2011/2007
Business Travel Spending 2009/2007
Business Travel Spending in Recession versus Profits
Source: BEA
Printing Air transport
Publishing industries
Audio, video recording
Telecommunications
Information processing
Banking
Legal services
Computer systems
Professional services
Admin. services
Arts and sports
Accommodation
Food services
y = 0.3208x + 0.0894
-30%
-20%
-10%
0%
10%
20%
30%
40%
-40% -30% -20% -10% 0% 10% 20% 30%
Profit Growth 2011/2007
Business Travel Spending 2009/2007
Business Travel Spending in Recession versus Profits
Source: BEA
13 THE ROLE OF BUSINESS TRAVEL IN THE U.S. ECONOMY U.S. TRAVEL ASSOCIATION
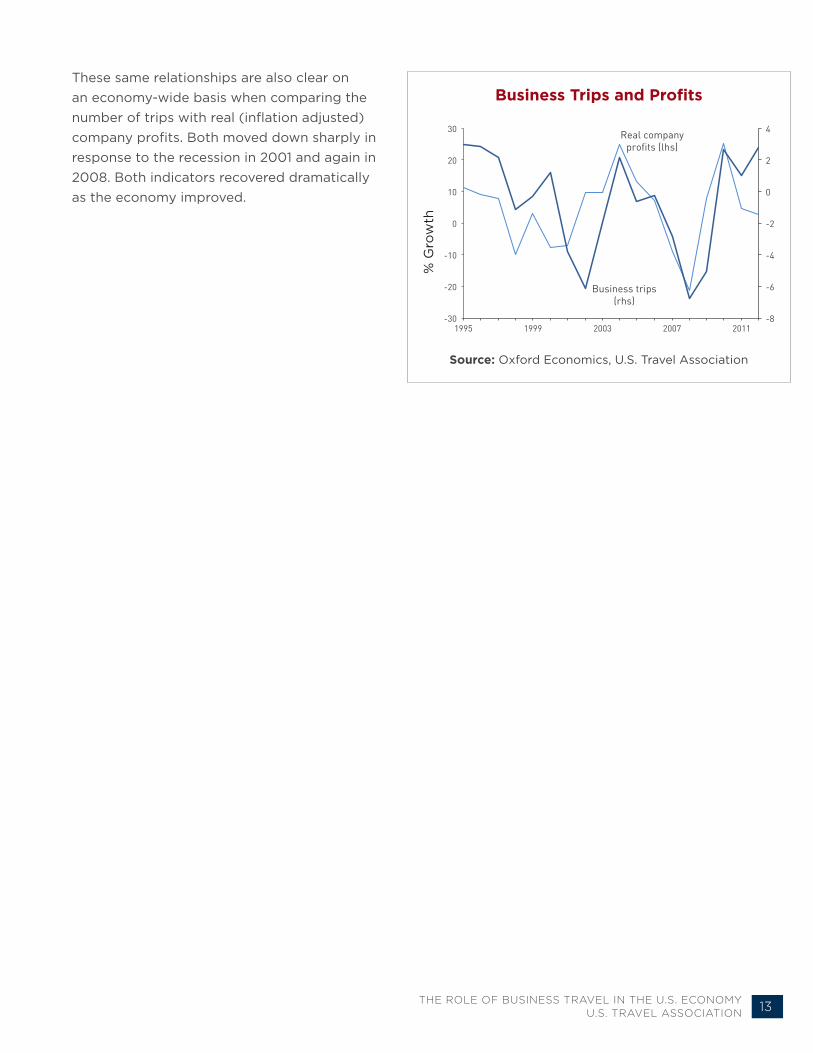
These same relationships are also clear on an economy-wide basis when comparing the number of trips with real (inflation adjusted) company profits. Both moved down sharply in response to the recession in 2001 and again in 2008. Both indicators recovered dramatically as the economy improved.
-8
-6
-4
-2
0
2
4
-30
-20
-10
0
10
20
30
1995 1999 2003 2007 2011
Business trips (rhs)
Real company profits (lhs)
Business Trips and Profits
Source: Oxford Economics, U.S. Travel Association
% G
row
th
14 THE ROLE OF BUSINESS TRAVEL IN THE U.S. ECONOMY U.S. TRAVEL ASSOCIATION
4.2 | THE RETURN ON INVESTMENT OF BUSINESS TRAVEL: CAUSATION ANALYSIS
The previous analysis shows a consistent correlation between business travel and profitability. However, it does not necessarily follow that higher business travel generates profits. It may be that industries that are performing better tend to travel more. In order to determine the direction of the relationship causation must be determined.
Oxford Economics developed an econometric model to determine both the strength and direction of the relationship between business travel and industry performance over time. The original model was built in 2009 and was updated for this analysis based on the latest data through 2011. The new model has the advantage of three additional years of data, providing detail on business travel and performance across 14 industries over an 18-year period. The model is structured to determine both correlation and causation. So if business travel generally leads to changes in profits, the model is able to identify a degree of causation.
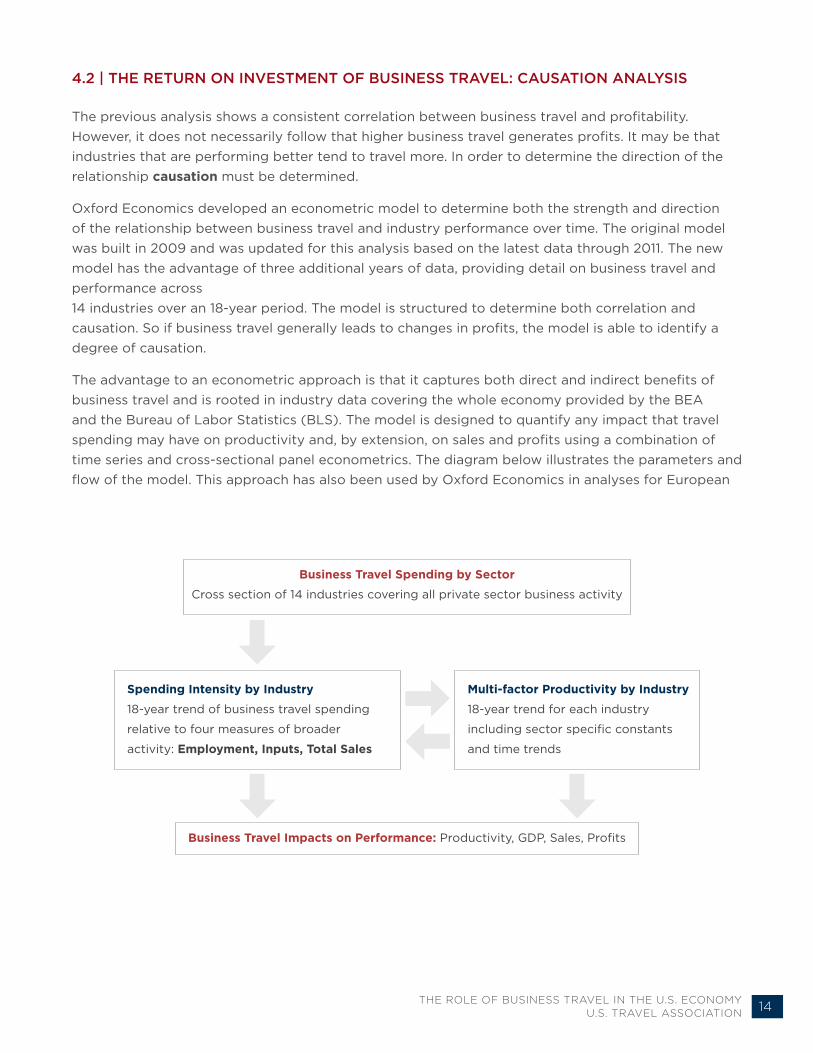
The advantage to an econometric approach is that it captures both direct and indirect benefits of business travel and is rooted in industry data covering the whole economy provided by the BEA and the Bureau of Labor Statistics (BLS). The model is designed to quantify any impact that travel spending may have on productivity and, by extension, on sales and profits using a combination of time series and cross-sectional panel econometrics. The diagram below illustrates the parameters and flow of the model. This approach has also been used by Oxford Economics in analyses for European
Business Travel Spending by Sector
Cross section of 14 industries covering all private sector business activity
Business Travel Impacts on Performance: Productivity, GDP, Sales, Profits
Spending Intensity by Industry
18-year trend of business travel spending
relative to four measures of broader
activity: Employment, Inputs, Total Sales
Multi-factor Productivity by Industry
18-year trend for each industry
including sector specific constants
and time trends

15 THE ROLE OF BUSINESS TRAVEL IN THE U.S. ECONOMY U.S. TRAVEL ASSOCIATION
travel, in particular detail for business travel in the UK, and has been documented in academic literature.
Performance is initially measured in terms of multi-factor productivity (MFP). This is the most complete measure of productivity and is defined as output per combined units of labor and capital inputs. According to the BLS, “a change in multi-factor productivity reflects the change in output that cannot be accounted for by the change in combined inputs of labor and capital.” By using this measure we are able to control for any increases in per-employee productivity that may arise from investment in new, more efficient technology. This measure also accounts for changes in the composition of the labor force, for example a shift towards fewer highly skilled (and highly compensated) workers rather than more low-skilled workers.
Even at the aggregate U.S. economy level, a strong correlation can be observed between business travel spending and MFP. Both dropped in each of the past two recessions and have turned upward over the past two years.
The inclusion of industry detail in the model substantially increases the number of observations in the estimation and improves confidence that the estimated results for causation are valid. Travel spending is analyzed relative to economic activity by sector to assess how changes in business travel intensity affect relative performance.
The effect that business travel has had on productivity over an 18-year period (for each industry) was calculated using regression analysis. Productivity is defined as a function of business travel intensity using panel estimation techniques over time and across industries. The impact of business travel on revenue and profits can then be calculated as a function of changes in productivity.
80
90
100
110
90
110
130
150
170
190
210
1995 1999 2003 2007 2011
Business travel spending ($bn)
MFP index (with trendline)
Business Travel Spending and MFP
Source: U.S. Travel Association, BLS, Oxford Economics
$ B
n
75
80
85
90
95
100
105
110
-4%
-3%
-2%
-1%
0%
1%
2%
3%
4%
1995 1999 2003 2007 2011
MFP relative to trend
Business travel relative to employment
Business travel relative to GDP
Business Travel Spending and MFP
Source: U.S. Travel Association, BLS, Oxford Economics
16 THE ROLE OF BUSINESS TRAVEL IN THE U.S. ECONOMY U.S. TRAVEL ASSOCIATION
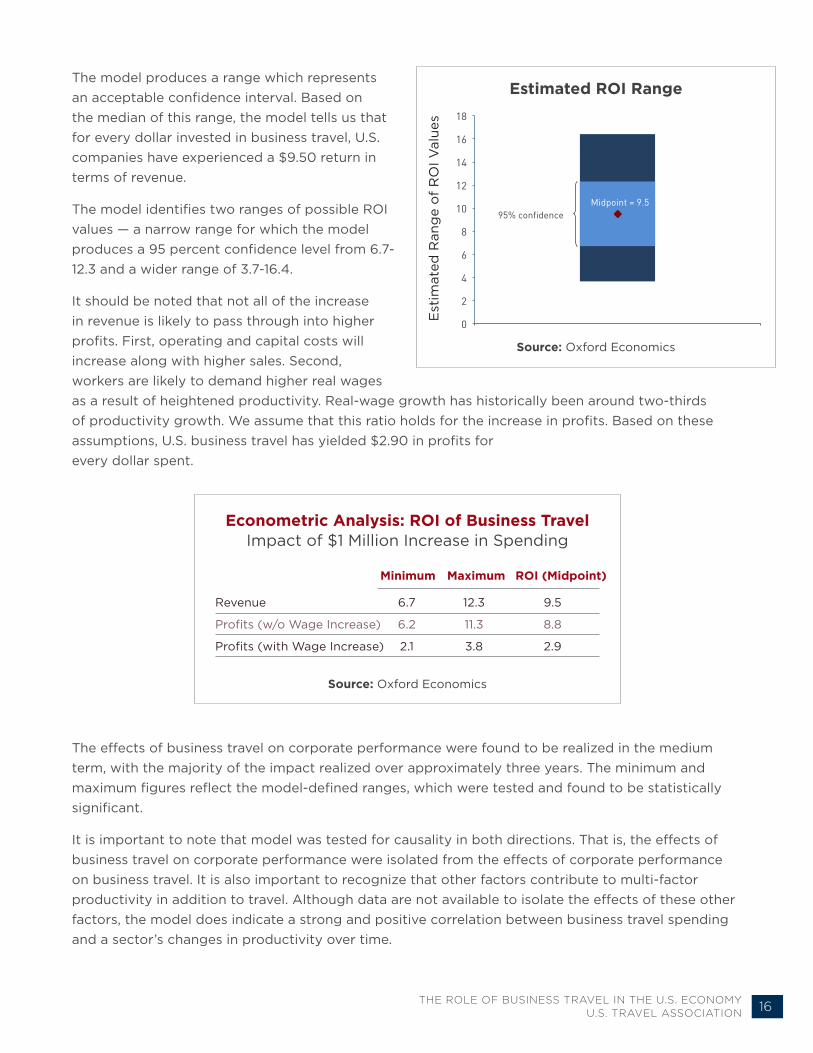
The model produces a range which represents an acceptable confidence interval. Based on the median of this range, the model tells us that for every dollar invested in business travel, U.S. companies have experienced a $9.50 return in terms of revenue.
The model identifies two ranges of possible ROI values — a narrow range for which the model produces a 95 percent confidence level from 6.7-12.3 and a wider range of 3.7-16.4.
It should be noted that not all of the increase in revenue is likely to pass through into higher profits. First, operating and capital costs will increase along with higher sales. Second, workers are likely to demand higher real wages as a result of heightened productivity. Real-wage growth has historically been around two-thirds of productivity growth. We assume that this ratio holds for the increase in profits. Based on these assumptions, U.S. business travel has yielded $2.90 in profits for every dollar spent.
The effects of business travel on corporate performance were found to be realized in the medium term, with the majority of the impact realized over approximately three years. The minimum and maximum figures reflect the model-defined ranges, which were tested and found to be statistically significant.
It is important to note that model was tested for causality in both directions. That is, the effects of business travel on corporate performance were isolated from the effects of corporate performance on business travel. It is also important to recognize that other factors contribute to multi-factor productivity in addition to travel. Although data are not available to isolate the effects of these other factors, the model does indicate a strong and positive correlation between business travel spending and a sector’s changes in productivity over time.
Estimated ROI Range
0
2
4
6
8
10
12
14
16
18
95% confidence Midpoint = 9.5
Source: Oxford Economics
Est
imat
ed R
ang
e o
f R
OI V
alue
s
Revenue
Profits (w/o Wage Increase)
Profits (with Wage Increase)
6.7
6.2
2.1
Minimum
Econometric Analysis: ROI of Business Travel Impact of $1 Million Increase in Spending
12.3
11.3
3.8
Maximum
9.5
8.8
2.9
ROI (Midpoint)
Source: Oxford Economics

17 THE ROLE OF BUSINESS TRAVEL IN THE U.S. ECONOMY U.S. TRAVEL ASSOCIATION
The impact is stronger in sectors, which have the greatest travel intensity. These sectors have also been shown to have the strongest correlation between performance and travel. Uncertainty surrounding impacts is greater for some individual sectors than for the whole economy. The estimated range of impacts according to different intensity measures is displayed below. The midpoint of each range is generally higher for sectors, which have a higher intensity. For example, the four industries with the lowest business travel intensity also exhibit the least response to changes in business travel in terms of sales performance. Likewise, the top five sectors in terms of business travel intensity are among the highest responders to increases in business travel. The implication is that business travel plays a more integral role in some companies’ performance than in others.
Sectoral Impacts (Range of Impacts) Sales Response to 10% Increase in Travel
0.0% 0.5% 1.0% 1.5% 2.0% 2.5% 3.0% 3.5%
Utilities Mining
Agriculture Construction
Retail Transportation Manufacturing
FIRE Wholesale
Leisure Ed & Health
Other Services Professional Information
Average
Business Travel IntensityBusiness Travel Spending as a Share of Industry GDP
Source: Oxford Economics
0 20 40 60 80 100
Agriculture
Mining
Utilities
Construction
Manufacturing
Wholesale
Retail
Transportation
Information
FIRE
Professional
Ed & Health
Leisure
Other Services
Source: Oxford Economics
US Dollars ($)
Finance, Insurance & Real Estate
Finance, Insurance & Real Estate
Education & Health
Education & Health

18 THE ROLE OF BUSINESS TRAVEL IN THE U.S. ECONOMY U.S. TRAVEL ASSOCIATION
It is noteworthy that ROI results of the updated model are somewhat lower than those estimated in 2009. The original model was based on all available data through 2007 while the updated model includes an additional four years of data extending through 2011.
The data through 2007 indicated a response of 12.5 to 1 for revenue compared with 9.5 to 1 when including data through 2011. In terms of profitability, the original model yielded an ROI of 3.8 to 1 compared with 2.9 to 1 in the latest model.
Two conclusions may be made from these differences. First, the latest model includes the recessionary period of 2008 and 2009 when companies struggled to grow. Thus it is not surprising that these additional years of data would reflect a lower ROI on business travel. Second, the latest model confirms the overall order of magnitude of the original analysis. By adding an additional four years of data across 14 industries, the econometrics benefit from a 29 percent increase in underlying data, adding further confidence to the results.
0
2
4
6
8
10
12
14
16
18
9.5
12.5
3.8 2.9
Revenue Profits
2013 model
2009 model
2013 model
2009 model
ROI of Business TravelEstimated range of modeled values
Source: Oxford Economics
19 THE ROLE OF BUSINESS TRAVEL IN THE U.S. ECONOMY U.S. TRAVEL ASSOCIATION
5 | THE ROLE OF BUSINESS TRAVEL AT THE COMPANY LEVEL
The statistical analysis presented in the previous section provides clear evidence that changes in business travel spending results in real shifts in industry performance. In parallel to the statistical analysis, a survey of frequent business travelers (who took at least four trips per year) was conducted online during the ten-day period from November 20-29, 2012. The questions centered on the role that business travel plays in their individual and corporate performance. Many of the questions were repeated from a similar survey of business travelers and executives conducted in 2009.
5.1 | OVERALL IMPACTS OF BUSINESS TRAVEL
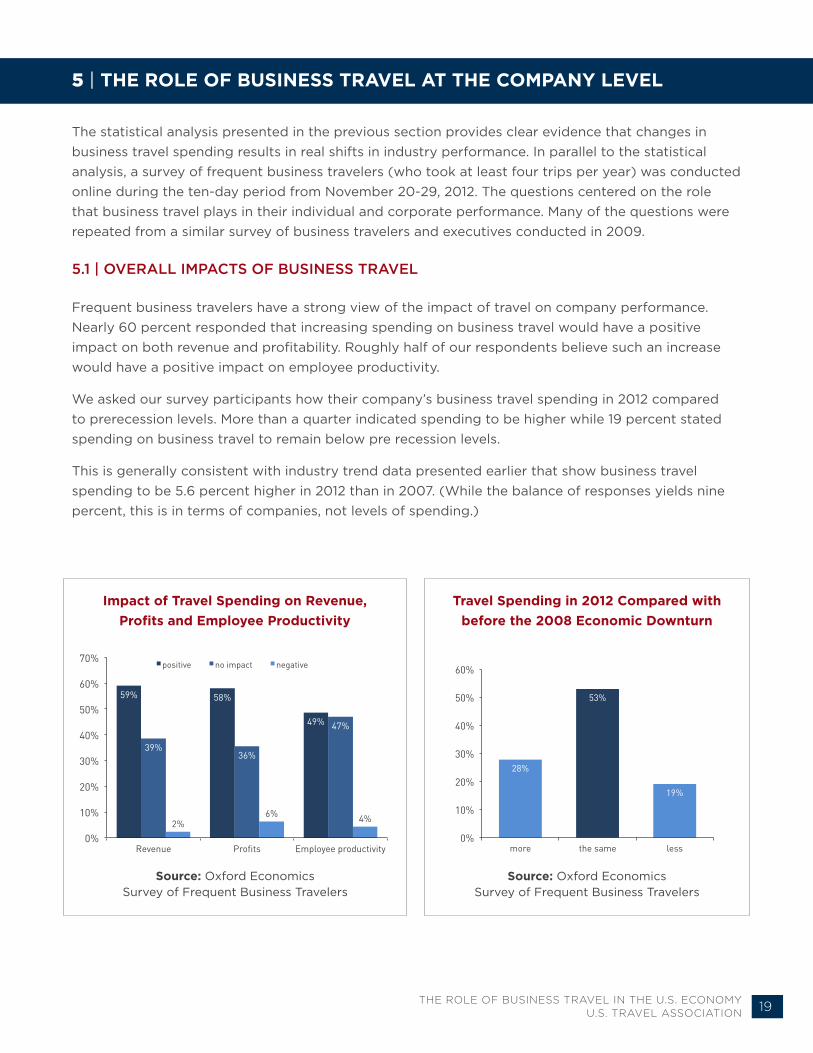
Frequent business travelers have a strong view of the impact of travel on company performance. Nearly 60 percent responded that increasing spending on business travel would have a positive impact on both revenue and profitability. Roughly half of our respondents believe such an increase would have a positive impact on employee productivity.
We asked our survey participants how their company’s business travel spending in 2012 compared to prerecession levels. More than a quarter indicated spending to be higher while 19 percent stated spending on business travel to remain below pre recession levels.
This is generally consistent with industry trend data presented earlier that show business travel spending to be 5.6 percent higher in 2012 than in 2007. (While the balance of responses yields nine percent, this is in terms of companies, not levels of spending.)
59% 58%
49%
39% 36%
47%
2% 6% 4%
0%
10%
20%
30%
40%
50%
60%
70%
Revenue Profits Employee productivity
positive no impact negative
Impact of Travel Spending on Revenue, Profits and Employee Productivity
Source: Oxford Economics Survey of Frequent Business Travelers
28%
53%
19%
0%
10%
20%
30%
40%
50%
60%
more the same less
Travel Spending in 2012 Compared with before the 2008 Economic Downturn
Source: Oxford Economics Survey of Frequent Business Travelers

20 THE ROLE OF BUSINESS TRAVEL IN THE U.S. ECONOMY U.S. TRAVEL ASSOCIATION
Among those respondents indicating an increase in business travel spending, 47 percent stated that these expenditures have had a positive effect on their company performance. About one-third believe these investments had no effect and 19 percent said extra business travel had a negative effect.
The weighting of responses toward positive impacts supports the earlier statistical analysis that determined causality between business travel and company performance.
Those respondents whose companies reduced business travel spending since 2007 were asked about the effects of these cutbacks. Only four percent stated that these cutbacks helped company performance while 57 percent believe that reductions in business travel hurt their companies’ performance.
19%
34%
47%
0%
5%
10%
15%
20%
25%
30%
35%
40%
45%
50%
negative none positive
57%
38%
4%
0%
10%
20%
30%
40%
50%
60%
70%
negative no positive
Effect of Increases in Travel on Company Performance as the Economy Has Recovered
Effect of Cutbacks in Travel on Company Performance as Economy Has Recovered
Source: Oxford Economics Survey of Frequent Business Travelers
Source: Oxford Economics Survey of Frequent Business Travelers

21 THE ROLE OF BUSINESS TRAVEL IN THE U.S. ECONOMY U.S. TRAVEL ASSOCIATION
5.2 | KEEPING CUSTOMERS
Maintaining strong customer relationships is fundamental to any successful business. Nearly three-in-four (74%) of survey respondents stated that meetings with clients have high impact2 on customer retention.
According to business travelers, not meeting with customers would have dramatic effects. Respondents believe that, on average, 42 percent of customers would eventually be lost without in-person meetings.
Conferences and conventions provide a concentrated opportunity to interact with customers. “Seeing customers” was cited most frequently (62%) as a benefit of attending these events.
Percentage of Existing Customers That Would Be Lost Without In-Person Meetings
% (weighted average of responses)
Source: Oxford Economics Survey of Frequent Business Travelers
0% 30% 60%
Hosting an Exhibit
Competitor Insights
Vendor networking
Industry education
Networking with prospects
Seeing Customers
Purpose of Attending Conferences and Conventions% of respondents
Source: Oxford Economics Survey of Frequent Business Travelers
2 Respondents who selected 4 or 5 on a 1 to 5 scale
Share of customer lost,
42%
Seeing customers
Competitor insights
Hosting an exhibit

22 THE ROLE OF BUSINESS TRAVEL IN THE U.S. ECONOMY U.S. TRAVEL ASSOCIATION
5.3 | WINNING NEW BUSINESS
Travel and sales success are inextricably linked. Business travelers from our 2012 survey stated that prospects are nearly twice as likely to become customers with an in-person meeting than without one.
This same question was asked of business travelers in 2009. The average conversion rate for prospects when an in-person meeting takes place was nearly the same in both surveys: 42 percent in the 2012 survey compared to 40 percent three years earlier.
However, the 2012 survey returned a notably higher average for converting prospects without an in-person meeting (23% vs. 16%). Two explanations for the evolution may be offered. First, the 2009 survey was in the midst of the recession when sales were likely harder to generate. To the extent this is a factor, we are offered a compelling case to travel more during a recession when in-person meetings provide a much-needed competitive advantage. Second, the adoption of virtual meeting technology has increased since 2009, making remote sales more attainable.
Virtual meetings do lack the effectiveness of in-person meetings. A majority (60%) of survey respondents stated that virtual meetings are less effective for meetings with prospects, while 29 percent said they are equally effective and only 10 percent suggested they are more effective.
It is clear, however, the virtual meetings are gaining in acceptance. Our survey in 2009 yielded even more concerns about virtual meetings’ effectiveness, where 85 percent indicated they were less effective for new business opportunities.
42%
23%
40%
16%
0%
5%
10%
15%
20%
25%
30%
35%
40%
45%
with in person meetings without in-person meetings
2012 Survey
2009 Survey
0%
10%
20%
30%
40%
50%
60%
70%
Current Prospective
less equally more
Conversion Rate of Prospects to Customers With and Without In-Person Meeting
% (weighted average of responses)
Effectiveness of Virtual versus In-Person Meetings
% of respondents
Source: Oxford Economics Survey of Frequent Business Travelers, n=300
Source: Oxford Economics Survey of Frequent Business Travelers, n=300
Less
2012 Survey
Equally More
2009 Survey

23 THE ROLE OF BUSINESS TRAVEL IN THE U.S. ECONOMY U.S. TRAVEL ASSOCIATION
5.4 | BUILDING TEAMS
The returns of all types of business travel in terms of customers and prospects tend to be directly evident on a balance sheet. However, business travel yields a range of indirect benefits to company performance, which are realized over a longer period of time. Many of these benefits fall within the category of building and strengthening teams — both internal and external.
Internal meetings are considered to have a high impact among business travelers as a means of sharing ideas (76%), staff communication (74%) and job performance (70%).
Along these same lines, conferences and conventions scored highest among business travelers in providing industry insights (78%) and developing industry partnerships (76%).
0% 20% 40% 60% 80% 100%
Sharing of ideas
Staff communication
My job performance
My career development
My morale
Retention of key staff
Productivity of staff
Lowering duplication
4 5
0% 40% 80%
Industry insights
Industry partnerships
Customer retention
New leads
Morale
New sales
4 5
Impact Of Internal Meetings On...Percentage of Respondents Answering 4 or 5 on a 1-5 Scale
Impact of conferences and conventionsPercentage of Respondents
Indicating High Impact on 1 to 5 Scale
Source: Oxford Economics Survey of Frequent Business Travelers, n=300
Source: Oxford Economics Survey of Frequent Business Travelers, n=300
4
4
5
5

24 THE ROLE OF BUSINESS TRAVEL IN THE U.S. ECONOMY U.S. TRAVEL ASSOCIATION
6 | ABOUT OXFORD ECONOMICS AND TOURISM ECONOMICS
Tourism Economics is an Oxford Economics company with a singular objective: combine an understanding of tourism dynamics with rigorous economics in order to answer the most important questions facing destinations, developers and strategic planners. By combining quantitative methods with industry knowledge, Tourism Economics designs custom market strategies, destination recovery plans, tourism forecasting models, tourism policy analysis, and economic impact studies.
With more than four decades of experience of our principal consultants, it is our passion to work as partners with our clients to achieve a destination’s full potential.
Oxford Economics is one of the world’s leading providers of economic analysis, forecasts and consulting advice. Founded in 1981 as a joint venture with Oxford University’s business college, Oxford Economics enjoys a reputation for high quality, quantitative analysis and evidence-based advice. For this, its draws on its own staff of 30 highly-experienced professional economists; a dedicated data analysis team; global modeling tools, and a range of partner institutions in Europe, the U.S. and in the United Nations Project Link. Oxford Economics has offices in London, Oxford, Dubai, Philadelphia and Belfast.

25 THE ROLE OF BUSINESS TRAVEL IN THE U.S. ECONOMY U.S. TRAVEL ASSOCIATION
7 | METHODOLOGY AND DATA SOURCES
This paper includes four distinct streams of analysis. The methodology for each, along with a listing of data sources, is described below.
7.1 | BUSINESS TRAVEL TRENDS AND ECONOMIC IMPACT
Data sources:
Longwoods International’s Travel USA survey. This a representative survey of U.S. households that includes projections for business travel by type (total, convention, trade show)
Center for Exhibition Industry Research (CEIR). CEIR conducts an annual survey of meeting planners to project the number of exhibition attendees by industry.
Smith Travel Research (STR). STR data on room demand and revenue was analyzed for weekday vs. weekend and group vs. non-group for upscale properties. This allowed for the observation of room demand trends that broadly align with business travel.
Bureau of Economic Analysis (BEA). Travel & Tourism Satellite Account data were compiled for business travel expenditures by year from 1998-2010.
Bureau of Economic Analysis (BEA). Supply-Use tables were analyzed to isolate industry-by-industry purchases of key travel-related services, including: accommodation, recreation, restaurant, and air transport services by year from 1998-2011.
U.S. Travel Association survey and industry analysis were referenced for U.S. domestic business trips and expenditures and compared to the above sources to confirm validity of levels and trends.
Total U.S. employment and investment figures are taken from the Bureau of Labor Statistics (BLS) and Bureau of Economic Analysis (BEA).
Economic impact of business travel on expenditures, payroll, employment and taxes is based on the U.S. Travel TEIM (Travel Economic Impact Model), which uses BEA-based input-output analysis to calculate direct, indirect, and induced impacts.

26 THE ROLE OF BUSINESS TRAVEL IN THE U.S. ECONOMY U.S. TRAVEL ASSOCIATION
7.2 | CORRELATION ANALYSIS
Section four begins with an industry-by-industry correlation analysis to illustrate any connections between an industry’s performance (in terms of profits) and its expenditures on business travel. BEA supply-use tables for each year from 2007 to 2011 are the primary data source for the analysis.
Profits reference “gross operating surplus” for each industry and each year within the I-O tables. Business travel expenditures use the same approach described in 7.1; industry-by-industry purchases of key travel-related services, including: accommodation, recreation, restaurant and air transport services by year from 1998-2011.
Business travel intensity is calculated as estimated business travel expenditures as a share of total industry output. The analysis covers the industries in the adjacent table.
32. Truck transportation 0.5%
33. Transit and ground passenger transportation 0.0%
34. Pipeline transportation 0.0%
35. Other transportation and support activities 0.7%
36. Warehousing and storage 0.4%
37. Publishing industries (includes software) 2.0%
38. Motion picture and sound recording industries 1.7%
39. Broadcasting and telecommunications 1.9%
40. Information and data processing services 3.0%
41. Federal Reserve banks, credit intermediation, and related activities 2.6%
42. Securities, commodity contracts, and investments 0.9%
43. Insurance carriers and related activities 0.2%
44. Funds, trusts, and other financial vehicles 0.3%
45. Real estate 0.3%
46. Rental and leasing services and lessors of intangible assets 0.9%
47. Legal services 1.1%
48. Computer systems design and related services 3.0%
49. Miscellaneous professional, scientific, and technical services 1.5%
50. Management of companies and enterprises 0.8%
51. Administrative and support services 2.1%
52. Waste management and remediation services 1.9%
53. Educational services 0.7%
54. Ambulatory health care services 0.9%
55. Hospitals and nursing and residential care facilities 0.4%
56. Social assistance 0.9%
57. Performing arts, spectator sports, museums, and related activities 5.8%
58. Amusements, gambling, and recreation industries 0.8%
59. Accommodation 2.0%
60. Food services and drinking places 1.0%
61. Other services, except government 0.8%
1. Farms 0.1%
2. Forestry, fishing, and related activities 0.0%
3. Oil and gas extraction 0.0%
4. Mining, except oil and gas 0.0%
5. Support activities for mining 0.5%
6. Utilities 0.1%
7. Construction 0.3%
8. Wood products 0.7%
9. Nonmetallic mineral products 0.7%
10. Primary metals 0.2%
11. Fabricated metal products 0.6%
12. Machinery 0.4%
13. Computer and electronic products 0.2%
14. Electrical equipment, appliances, and components 0.2%
15. Motor vehicles, bodies and trailers, and parts 0.2%
16. Other transportation equipment 0.5%
17. Furniture and related products 0.6%
18. Miscellaneous manufacturing 0.6%
19. Food and beverage and tobacco products 0.3%
20. Textile mills and textile product mills 0.4%
21. Apparel and leather and allied products 0.4%
22. Paper products 0.5%
23. Printing and related support activities 1.7%
24. Petroleum and coal products 0.0%
25. Chemical products 0.2%
26. Plastics and rubber products 0.6%
27. Wholesale trade 0.6%
28. Retail trade 0.4%
29. Air transportation 1.5%
30. Rail transportation 0.4%
31. Water transportation 0.2%
Industry IndustryBusiness Travel %
Business Travel %
Key Metrics of Corporate Performance
27 THE ROLE OF BUSINESS TRAVEL IN THE U.S. ECONOMY U.S. TRAVEL ASSOCIATION
7.3 | CAUSATION ANALYSIS
To estimate the impact of business travel on performance we compare trends in data for business travel and multi-factor productivity across different sectors. Multi-factor productivity is the best indicator of performance with regard to the expected impact of business travel. It measures improvement in the level of output due to an improvement in employee performance — independent of increased investment in technology, or changes in the labor composition. If business travel does improve performance, then a strong relationship should be identifiable between travel and productivity.
Background Research
This approach has been successfully used by Oxford Economics in previous analysis for European travel, in particular detail for business travel in the UK, and is consistent with other similar studies. In an initial review of the academic literature it was found that a 10 percent increase in transport services would raise productivity by between 0.5-four percent. Oxford Economics’ results for Europe and the UK are towards the lower end of this range. Results for the U.S. are slightly higher than for Europe but are also within the lower half of that range.
A clear relationship was identified between business air usage and productivity for 24 EU countries over a 10-year period. Countries that spent most on travel as a share of GDP also experienced the highest productivity. Robust econometric techniques confirmed a long-run relationship between business air travel and productivity. A 10 percent increase in transport raises productivity by roughly one percent.
In more detailed analysis for the UK, a similar long-run relationship was found between business travel relative to economic activity and productivity taking sectoral differences into consideration. Pooled estimation was carried out across sectors covering the entire economy. This helped account for different trends and travel intensity across sectors and added to confidence in results by relying on a richer sample of information. This study also found that a 10 percent increase in business travel raises productivity by roughly one percent in the long run.
Importantly, estimation results for the UK found a relationship between the level of travel and the level of productivity rather than just growth rates. This raised confidence that the estimated long-run relationships are valid.
Applying the Methodology to the U.S.
A similar approach can be applied to U.S. data, and pooled estimation has been carried out across 14 sectors and 18 years. The primary benefit of this approach is that a greater number of observations can be used to generate more robust estimates of common factors, giving greater confidence in results. Changes in aggregate productivity arising from differences in sectoral composition are also controlled for while sector specific trends are also incorporated. Sectors are defined at the NAICS 2-digit level of aggregation covering all private sector business activities.
28 THE ROLE OF BUSINESS TRAVEL IN THE U.S. ECONOMY U.S. TRAVEL ASSOCIATION
In estimating the impact of business travel, intensity (i.e. the proportion of expenses represented by travel) is more relevant than the level of business travel. Business travel spending has increased for all sectors over time, partly due to higher costs/prices but also as growth in real output generates greater demand for inputs. An increase in business travel spending proportional to an increase in staff numbers is unlikely to add to employee performance other than any scale effects. Improved performance is more likely to arise from an increase in travel relative to other measures of economic activity. Estimating productivity relative to business travel spending may also generate spurious results as productivity has also trended upwards over time.
Four measures of business travel intensity have been tested as well as spending for comparison; the most statistically valid test results are used. Different econometric statistics for the four measures have been compared to increased confidence that identified relationships are not spurious. Travel intensity has been calculated as business travel spending relative to GDP, Gross Output, Intermediate Purchases and Employment. For the first three ratios both numerator and denominator are current price dollar concepts and are directly comparable. U.S. Travel’s Travel Price Index has been used to deflate spending in comparison to employment for the final measure of intensity.
To identify movement through business cycles and hence a causal relationship, we look at travel intensity measured as business travel spending relative to economic activity. We initially considered four different measures of intensity: travel relative to Gross Output, GDP, Intermediate Purchases, and Employment. The focus in results is on the latter two measures which best fit theory developed in previous sections as well as delivering the best statistical results and clearly follow a similar cycle to multifactor productivity (adjusted for trend) in the above charts. In line with previous sections it follows that travel per employee offers strong returns to performance. It also follows that travel spending relative to other intermediate inputs to the production process would improve performance. Results are given for both of these intensity measures to give a range of plausible results. Results for the other two measures also lie within this range, slightly closer to results for the employment ratio.
By comparing productivity with business travel intensity we are also able to find a robust relationship between levels rather than just growth rates. This increases confidence that the relationships are valid.
Correlation between travel intensity and productivity is stronger at a sectoral level than for the whole economy. Key sectors which have a high business travel intensity display a strong correlation between intensity and MFP. Service sectors such as information and professional services have significantly higher travel intensity than other sectors. Very strong correlations between productivity and travel intensity can be observed for these sectors.
Panel estimation techniques have been applied to sectoral data covering all private sector business activity to estimate the impact of business travel on economic performance. Estimation at the whole economy level is less certain due to the lack of time series data for both business travel and productivity.
29 THE ROLE OF BUSINESS TRAVEL IN THE U.S. ECONOMY U.S. TRAVEL ASSOCIATION
Sectoral data has been drawn from Input-Output tables and scaled to be consistent with business spending by category according to the BEA TTSA tables. Multi-factor productivity data is taken from the BLS, which already calculates some sectoral detail. Further calculation to derive a consistent sectoral data set was required and consistent productivity calculation was applied drawing on previous Oxford Economics calculation as well as existing research by both the UN and the Groningen Growth and Development Centre.
By using panel estimation across sectors, the effect of changing sectoral composition on productivity is controlled. This technique also allows a greater number of observations to be included to increase confidence in the validity of results. Business travel as a share of GDP is included as an explanatory variable in equations for productivity with a common coefficient. Differences in demand for air services across sectors are controlled by weighting the coefficients according to travel spending intensity. Further sectoral differences are included for by the inclusion of separate constant and time trend coefficients for each sector.
Before estimation of the equations, formal econometric tests have been performed to ensure the statistical validity of the assumptions and hence the results and conclusions. These tests have proven that the estimation is statistically valid and business travel does lead to improved performance.
1. First unit root and cointegration tests are carried out to confirm that productivity and business travel follow a consistent linear trend. This is essential for valid relationships to be identified.
2. Causality has been tested to ensure that observed correlations are not spurious and that the assumed causal relationship does exist. We find that causality works both ways as expected. An improvement in economic performance can result in almost immediate increase in travel intensity whilst in economic downturns we have observed some cuts in intensity. However, tests also indicate that there is a lagged response between travel and performance. An increase in travel intensity has performance benefits, which are realized in the medium term, which we next quantify.
Econometric Tests
Before estimating relationships we need to establish whether the identified time series have the necessary statistical properties for estimation and whether there is evidence that the assumed relationships exist.
Unit Root tests
Unit root tests suggest that travel intensity and productivity share the same order of integration. It is essential that this is the case for dependent and explanatory variables in order for estimation of levels to be valid and suggests that they are cointegrated. Augmented Dickey-Fuller (ADF) and Phillips-Perron (PP) tests show that for whole economy productivity and all four measures of intensity have a single unit root. On this basis all four measures of intensity are valid for estimation. This test also suggests that there is a unit root for business travel spending and is also valid for estimation.
Since estimation will rely on panel estimation techniques we have also tested the equivalent statistics in panel data across sectors. Panel tests on productivity and business intensity across sectors also suggest that all time series have a single unit root. Since panel tests involve more observations, this increases confidence in statistical properties.

30 THE ROLE OF BUSINESS TRAVEL IN THE U.S. ECONOMY U.S. TRAVEL ASSOCIATION
Further cointegration tests on the validity of the estimated relationships have been carried out for productivity and travel intensity by sector. These are an extension of unit root tests to jointly determine whether dependent and explanatory variables follow a consistent trend over time. Unit root tests have been performed on equation residuals and indicate they are stable over time. Formal cointegration tests also confirm that estimation is valid. Differences between trend growth rates in dependent and explanatory variables have remained constant.
Causality tests
Having determined that identified time series are correlated and cointegrated, the assumed causality must be tested. Even though time series properties imply that valid estimation is being carried out it does not necessarily follow that assumed causal relationships are true.
Granger causality tests are used to check the validity of the assumption that business travel intensity influences productivity at a sectoral level. The alternative is that correlation is coincident or both series being influenced by a common third factor. The Granger causality test compares the performance of indicators over time and establishes precedence. The extent to which past values of both the explanatory and dependent variable influence current values is assessed in a series of regressions involving different lag structures. If the inclusion of lagged values of business travel intensity makes a statistically significant contribution to predictions of productivity then business travel can be said to Granger cause productivity. Tests are run for the null hypothesis that there is no causal relationship between indicators and the regression F-statistic is used to reject or accept this.
Regression
Having established that estimation is valid both in terms of correct statistical properties and that there is a statistical basis for the assumed causal relationship, we estimate productivity as a function of business intensity.
Regressions have been run to include different lags on both dependent and explanatory variables since impacts are not immediate and causality tests implied lags may be present. In the first instance, simple equations have been run for productivity as a function of travel intensity. All four measures of intensity give similar robust results with high R-squared statistics for key sectors and t-statistics imply that estimated coefficients are valid.
In general, the inclusion of additional lagged explanatory variables does not significantly improve test statistics for the equations or specific coefficient values: equation R-squared statistics are little changed while coefficient t-statistics are worse and in some cases are not statistically valid.
By including a lagged value of the dependent variable, equations statistics are significantly improved. Equation R-squared values are improved as are Durban Watson statistics. This improves confidence that autocorrelation is not present in the estimated equations. This equation structure implies different time series properties to previously estimated equations without lags. But for the preferred two intensity
31 THE ROLE OF BUSINESS TRAVEL IN THE U.S. ECONOMY U.S. TRAVEL ASSOCIATION
measures (travel relative to employment and to other inputs) very similar medium term impacts can be derived compared with the previously estimated effects including no lags.
Measuring intensity as travel relative to employment or to other inputs (our preferred measures) t-statistics for common coefficients suggest that we can have at least 95 percent confidence that estimated elasticities are true. These t-statistics are slightly lower than for equations estimated with zero lags. But since other equation statistics are stronger and estimation is valid, on balance we prefer to use the equations with lags.
7.4 | BUSINESS TRAVELER SURVEY
In parallel to the above statistical analysis, a survey of frequent business travelers (at least four trips per year) was conducted in November 2012. The survey of 300 respondents was fielded through Global Market InSite (GMI) of Bellevue, WA.

PHONE FAX
(202) 408-8422 (202) 408-1255 [email protected]
1100 New York Avenue, NW, Suite 450 Washington, DC 20005-3934 www.TravelEffect.com
Related Documents