1 The Role Of Brain Natriuretic Peptide And Tissue Doppler Echocardiography in the Management of Transfusion Dependent Thalassaemia Patients MD (Res) Thesis University Of London Sunil Viswanathan Nair

Welcome message from author
This document is posted to help you gain knowledge. Please leave a comment to let me know what you think about it! Share it to your friends and learn new things together.
Transcript
1
The Role Of Brain Natriuretic Peptide And Tissue
Doppler Echocardiography in the Management of
Transfusion Dependent Thalassaemia Patients
MD (Res) Thesis
University Of London
Sunil Viswanathan Nair

2
SIGNED DECLARATION
I confirm that the work presented within this thesis is my own work. Signature: Name: Date:
3
ABSTRACT
Background: Iron induced heart failure is the commonest cause of death in thalssaemia major.
The cardiomyopathy is reversible when treated early, but once symptomatic heart failure occurs,
the outlook is poor. A recent technique using magnetic resonance myocardial T2* (T2 star) has
been validated for the assessment of early myocardial iron deposition. Worldwide however,
transthoracic echocardiography is the mainstay of assessment for these patients. Conventional
echo parameters are poor at identifying those with cardiac iron loading who are at risk of cardiac
failure, only becoming abnormal once significant iron loading has occurred. Newer techniques
involving tissue Doppler imaging (TDI) have been promising. Our aim was to explore the role
of these techniques and that of brain natriuretic peptide (BNP), a biomarker released in heart
failure, in the management of Thalassaemia major patients.
Methods/Results: 167 patients with thalassaemia major were screened with cardiac T2* MRI to
quantify iron loading. Those with severe cardiac iron, T2* <8ms, (n=15) were treated with both
desferrioxamine and deferiprone chelation. Those with mild to moderate cardiac iron, T2* 8-
20ms, (n=65) were randomised to desferrioxamine plus either deferiprone or placebo. Both
groups were treated for 12 months. At baseline, 6 and 12 months all those in the combination
therapy trial and in the severe group were assessed with T2*, full transthoracic
echocardiography including TDI and BNP levels. BNP only became abnormal in those with
obvious clinical heart failure. TDI systolic velocities in the septum and RV were significantly
lower in those with severe cardiac iron and improved over 12 months, correlating with an
improvement in T2*.
Conclusion: In thalassaemia patients, BNP is unhelpful in assessing cardiac iron status. Systolic
tissue velocities can give an indication as to an individuals cardiac iron status and could help to
monitor their progress during chelation therapy.
4
CONTENTS
CHAPTER 1 SUMMARY AND OBJECTIVES 9
INTRODUCTION
CHAPTER 2 THALASSAEMIA MAJOR 10 2.1 HISTORY, DISTRIBUTION AND PREVALENCE 10
2.2 NATURAL HISTORY OF THALASSAEMIA 11
2.3 IRON INDUCED DAMAGE AND CARDIOMYOPATHY 13
2.4 CURRENT TREATMENTS OF THALASSAEMIA MAJOR 15
2.5 ALTERNATIVE IRON CHELATORS 17
2.6 REVERSIBILITY OF TISSUE IRON OVERLOAD 20
2.7 METHODS FOR ASSESSMENT OF TISSUE IRON LOAD 21
2.8 DIRECT ESTIMATION OF CARDIAC IRON LOAD 22
2.9 ECHO MEASURES OF CARDIAC IRON OVERLOAD 23
2.10 CARDIAC MRI ASSESSMENT OF IRON LOAD 24
2.11 CARDIAC TREATMENTS IN THALASSAEMIA MAJOR AND CARDIAC SIDEROSIS 27
CHAPTER 3 TISSUE DOPPLER TECHNIQUES 28
3.1 TISSUE DOPPLER TECHNIQUES 28
3.2 STRAIN AND STRAIN RATE IMAGING 31
3.3 VALIDATION OF TDI AND STRAIN TECHNIQUES 32
3.4 2D STRAIN (SPECKLE TRACKING) 32
3.5 THE ROLE OF TDI AND STRAIN TECHNIQUES IN OTHER CARDIAC PATHOLOGIES 33
3.5.1 Global Systolic Function 33
3.5.2 Cardiomyopathy 34
5
3.5.3 Dysynchrony Analysis 34
3.5.4 Diastolic Function 37
3.5.5 Right Ventricular Function 37
3.6 TDI TECHNIQUES IN THALASSAEMIA PATIENTS 38
CHAPTER 4 BRAIN NATRIURETIC PEPTIDE 39
4.1 BRAIN NATRIURETIC PEPTIDE 39
4.2 BNP MEASUREMENT IN THE ASSESSMENT AND MANAGEMENT OF HEART 40
FAILURE
4.3 THE ROLE OF NATRIURETIC PEPTIDES IN THE ASSESSMENT AND
MANAGEMENT OF THALASSAEMIA PATIENTS 42
4.4 BNP OR PRO BNP 42
4.5 WHAT LEVEL OF BNP IS SIGNIFICANT 43
4.6 THE TRIAGE BNP TEST 43
4.7 PRINCIPLES OF THE BNP TEST 44
4.8 TRIAGE METER QUALITY CONTROL 45
4.8.1 Built In Controls 45 4.8.2 External Quality Controls 46 4.8.3 Triage BNP Controls 46
4.9 BNP TEST DEVICE STABILITY 46
4.10 PURPOSE OF STUDY 46
METHODS
CHAPTER 5 METHODS 48
5.1 OVERALL STUDY POPULATION 48
5.1.1 Overall Study Population 48
6
5.1.2 Severe Cardiac Iron Loading Cohort 48
5.1.3 Mild to Moderate Cardiac Iron Loading Cohort 49
5.2 TRANSTHORACIC ECHOCARDIOGRAPHY PROTOCOL 50
5.2.1 Echo Dataset 50
5.2.2 Tissue Doppler Imaging Techniques (TDI) 52
5.2.3 Limitations of measurements obtained 56
5.2.4 Reproducibility Studies 57
5.3 BRAIN NATRIURETIC PEPTIDE (BNP) PROTOCOL 58
5.3.1 BNP Sampling And Analysis 58
5.3.2 Calibration & Validation Tests 58
5.3.3 BNP Levels Before And After Blood Transfusion 58
5.4 CARDIAC MAGNETIC RESONANCE IMAGING PROTOCOL 59
5.5 STATISTICS & ANALYSIS 59
RESULTS
CHAPTER 6 RESULTS 61
6.1 OVERALL STUDY POPULATION 61
6.2 BNP RESULTS AT BASELINE 64
6.3 STANDARD ECHO MARKERS AND CORRELATION WITH CARDIAC T2* 66
6.4 COMPARISON BETWEEN EJECTION FRACTION CALCULATED FROM TRANS 69
THORACIC ECHOCARDIOGRAPHY & FROM CARDIAC MRI
6.5 ADVANCED ECHO MARKERS AND CORRELATION WITH CARDIAC T2* 71
6.5.1 Systolic Tissue Doppler Velocities 71
6.5.1.1 In The Baseline Cohort 71
6.5.1.2 Baseline Cohort With EF of >55% On TTE 76
7
6.5.2 Diastolic Tissue Doppler Velocities 78
6.5.3 Strain 81
6.5.4 Strain Rate 87
6.5.5 Tissue Tracking 90
6.5.6 Reproducibility Studies 91
6.6 GROUP WITH CARDIAC IRON PRESENT (T2* <20MS) 93
6.7 SEVERE IRON LOADING COHORT 98
6.7.1. Severe Group Characteristics 98
6.7.2. Standard Echo Data 99
6.7.3 Systolic Tissue Doppler Velocities 100
6.7.4 Diastolic Tissue Doppler Velocities 103
6.7.5 Strain 105
6.7.6 Tissue Tracking 107
6.8 TWELVE MONTH RESULTS FOR RANDOMISED COHORT 108
6.8.1. Cohort Characteristics at baseline 108
6.8.2. Standard Echo Data 109
6.8.3. Tissue Doppler Data 110
6.8.3.1 In The Treatment Arm 110
6.8.3.2 In The Placebo Arm 110
CONCLUSIONS AND DISCUSSIONS
CHAPTER 7 CONCLUSIONS AND DISCUSSIONS 112
7.1 OVERALL STUDY POPULATION 112
8
7.2 BRAIN NATRIURETIC PEPTIDE 113
7.3 STANDARD ECHO DATA 115
7.4 COMPARISON BETWEEN EJECTION FRACTION FROM TTE & FROM CARDIAC 116
MRI
7.5 DIASTOLIC ECHO DATA 118
7.6 SYSTOLIC FUNCTION FROM MYOCARDIAL TISSUE DOPPLER VELOCITIES 118
7.7 DIASTOLIC FUNCTION FROM TISSUE DOPPLER MEASURES 120
7.8 STRAIN 121
7.9 STRAIN RATE 122
7.10 TISSUE TRACKING / LONGITUDINAL MOTION 123
7.11 TISSUE DOPPLER ECHOCARDIOGRAPHY IN LONGITUDINAL STUDIES 123
7.12 RANDOMISED COHORT 124
7.13 WHY ECHO IS IDEAL TOOL FOR ASSESSMENT 124
7.14 LIMITATIONS OF THE STUDY 126
REFERENCES
CHAPTER 8 REFERENCES 127
APPENDICES
9.1 PUBLICATIONS ARISING FROM THIS WORK 150
9.2 PERSONAL CONTRIBUTION TO THIS RESEARCH 151
9.3 SUPERVISION 151
9.4 FUNDING 152
9.5 ADDITIONAL DOCUMENTATION ON ENCLOSED CD 152
9
CHAPTER 1 SUMMARY AND OBJECTIVES
Thalassaemia major is an inherited anaemia and is fatal without recurrent blood transfusions
which are required to allow normal development. Although a necessity, blood transfusions cause
cardiac iron loading and result in cardiac failure, the major cause of death in this patient group.
Iron-induced heart failure is a potentially reversible condition provided it is detected early and
appropriate intensification of iron-chelation treatment is instituted in time. The recent
development of T2* cardiac MRI allows quantification of iron status and assessment of
significant cardiac iron at an early stage. This has been a major advance, allowing management
of myocardial iron deposition in a way which has not previously been possible. Worldwide, due
to cost and availability limitations, transthoracic echo (TTE) is the mainstay of cardiac
monitoring in this patient group. Early work with newer echo techniques such as tissue Doppler
imaging (TDI) has been promising. This thesis explores the role of these newer techniques
including strain, strain rate and longitudinal motion (tissue tracking) to examine if they can be
used to identify patients with significant cardiac iron loading and therefore at risk of cardiac
decompensation. The role of these parameters for monitoring progression of disease or effects of
intensive chelation treatment will be investigated. The thesis also explores the role of brain
natriuretic peptide to see if this biomarker may have a role in assessment and monitoring of
patients with transfusion dependant thalassaemia major.
The relationship between a number of conventional and tissue Doppler derived echo parameters
and cardiac T2* are defined. The change in these echo parameters following intensive treatment
is defined in groups with both severe cardiac iron and mild to moderate cardiac iron. The use of
BNP estimates is explored and defined in this group of patients. The role of BNP pre and post
blood transfusion is also explored.
10
CHAPTER 2: THALASSAEMIA MAJOR
2.1 HISTORY, DISTRIBUTION AND PREVALENCE
The thalassaemias are the single most common monogenic disorders worldwide. Initially
described in a series of infants by Thomas Cooley in 1925. In 1936 Whipple and Bradford
introduced the term thalassaemia as the patients seemed to be predominantly of Mediterranean
origin. Thalassaemia occurs in a wide geographic area from the Mediterranean, parts of north
and west Africa, through the middle east and Indian subcontinent to south east Asia (Figure 2.1).
Inheritance is an autosomal recessive pattern, asymptomatic heterozygotes having a 25% chance
of an affected child. The heterozygote carrier frequency varies from 3 to 30%. Although the
thalassaemia gene is absent in Northern Europeans, it is now present in every industrialised
nation in the world due to migration from high prevalence areas. In the UK in 1999 there were
1049 patients on the Thalassaemia Register (1) and by 2003 the number was 1089 of which 856
were alive (2) and approximately half resident in north London attending the Whittington
Hospital, a national thalassaemia referral centre. A study of Asian children in northwest London
showed 4% were heterozygous carriers for beta thalassaemia (3). Worldwide, there are some 94
million people heterozygote for thalassaemia and up to 60,000 homozygote births per year (4).
Beta thalassaemia can also occur sporadically in every racial group (5;6). Improving social
conditions and medical interventions worldwide have allowed children with thalassaemia to
survive long enough to require treatment for longer term complications. This makes the
management of the disease increasingly important, both where the disease is particularly
common, and for any country which has an immigrant population from these regions.
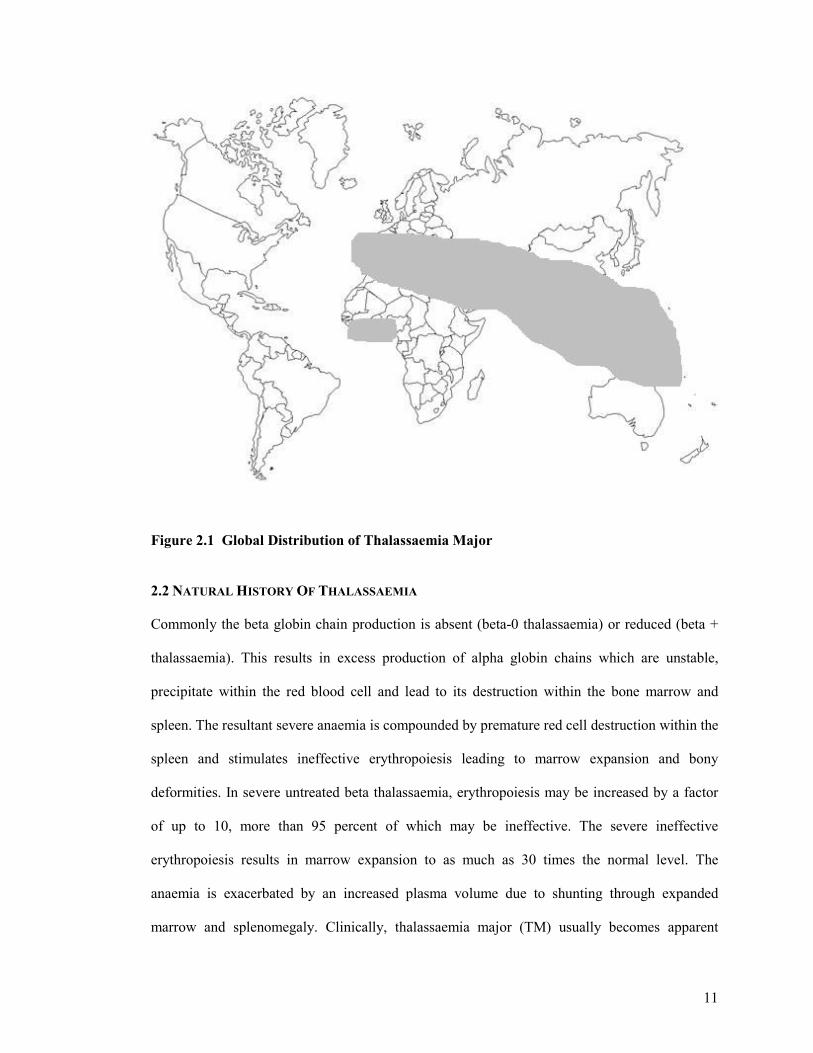
11
Figure 2.1 Global Distribution of Thalassaemia Major 2.2 NATURAL HISTORY OF THALASSAEMIA
Commonly the beta globin chain production is absent (beta-0 thalassaemia) or reduced (beta +
thalassaemia). This results in excess production of alpha globin chains which are unstable,
precipitate within the red blood cell and lead to its destruction within the bone marrow and
spleen. The resultant severe anaemia is compounded by premature red cell destruction within the
spleen and stimulates ineffective erythropoiesis leading to marrow expansion and bony
deformities. In severe untreated beta thalassaemia, erythropoiesis may be increased by a factor
of up to 10, more than 95 percent of which may be ineffective. The severe ineffective
erythropoiesis results in marrow expansion to as much as 30 times the normal level. The
anaemia is exacerbated by an increased plasma volume due to shunting through expanded
marrow and splenomegaly. Clinically, thalassaemia major (TM) usually becomes apparent
12
during the first year of life as the switch from foetal haemoglobin (α2γ2) to adult haemoglobin
(α2β2) occurs, and the anaemia progressively worsens. TM is at the severe end of the spectrum of
homozygous β-thalassaemia and requires regular blood transfusions to prevent death in infancy
due to anaemia (7). Regular blood transfusions switch off the erythropoietic drive, allowing
thalassaemic children to grow and develop normally and are required to prolong life, ensure
normal growth and development and avoid complications of chronic anaemia (7;8). However, in
treated patients the combination of transfusional iron (200-250mg per unit of blood), and an
inappropriate increase in intestinal absorption (9), leads to an inexorable accumulation of iron in
the body tissues (10). Eventually, extensive iron-induced injury develops in the heart (10-12),
liver (10;12;13), pancreas (10;14) and endocrine organs(10;12;15).
Regular transfusion to maintain a mean haemoglobin in the normal range became standard
treatment in the 1960s (16). This results in good quality of life in the short term, but leads to
death from transfusional iron overload between 12 and 24 years of age (2;16). With or without
blood transfusion, patients require treatment to prevent iron overload, the consequences of
which are fatal. Long term survival is determined by the degree of cardiac iron loading (17;18).
If transfusions are not received the increased iron absorption amounts to an iron burden of 2-5g
per year (19;20). Regular blood transfusions may double the rate of iron accumulation. Although
the clinical manifestations of iron overload do not usually appear until the second decade of life,
evidence from liver biopsies indicate that the damaging effects of iron accumulate much earlier
than this. After approximately one year of transfusions, iron begins to be deposited in
parenchymal tissues and may cause toxicity (13). The effects of untreated progressive cardiac
iron overload have been previously documented by Engle (21). Around the age of 10 years, the
heart size increases and left ventricular hypertrophy develops on the ECG(21) Clinically
apparent, although symptomatically silent the cardiac effects of iron overload begin with the
13
accumulation of 20 g of iron, usually after the age of 10 years, in a regularly transfused child
maintained with a pre-transfusion haemoglobin of 9 to 10 g/dl, unless adequate chelation has
been prescribed and taken (22). Within 10 years of regular transfusions without chelation
therapy cardiac symptoms are reported (23) and may be aggravated by myocarditis (24) or
pulmonary hypertension (25;26). At 10 years, one third of patients have 1st degree heart block,
progressing to either 3rd degree heart block or left or right bundle branch block as heart failure
develops. Pericarditis commonly occurs over the age of 11. Congestive cardiac failure secondary
to an iron induced cardiomyopathy develops at a mean age of 16 years, with survival over the
age of 20 years being rare(21). Atrial arrhythmias occur in over half the patients as do frequent
ventricular ectopics. Arrhythmias correlate with the extent of iron deposition in the atrial tissue
(11). Sustained runs of ventricular tachycardia occur in a minority(21). Once overt clinical heart
failure develops mean survival is 3 months (21) and presentation in NYHA class 4 heart failure
has a 50% acute mortality (JMW observations, unpublished data).
2.3 IRON INDUCED DAMAGE AND CARDIOMYOPATHY
The human body has no mechanism for excreting excess iron, which is stored as crystalline iron
oxide within ferritin and haemosiderin in the body. At normal body iron levels, plasma iron is
bound to transferrin, preventing catalytic activity and free radical production (27-29). The
combination of increased gastrointestinal iron absorption and iron from red cell breakdown in
the reticuloendothelial system saturates this iron binding capacity and this results in the
emergence of non-transferrin bound iron (NTBI) (30). NTBI is more toxic than bound iron and
promotes hydroxyl free radical formation (31) resulting in damage to membrane lipids and
proteins. NTBI is taken up more readily by cardiac myocytes than transferrin bound iron (32).
Whereas transferrin bound iron uptake is reduced by the down regulation of transferrin
receptors, NTBI uptake is increased in the presence of high levels of tissue iron (33). In the
heart, free intracellular iron results in impaired Na-K-ATPase activity (34), increased lysosomal
14
fragility (35) and impaired mitochondrial respiratory chain activity (36), and is manifest
clinically as heart failure(37). Desferrioxamine (Desferal, Deferoxamine) binds iron, making it
inactive metabolically and preventing the effects of free radical formation (32;38), (39), as does
Deferiprone (L1).
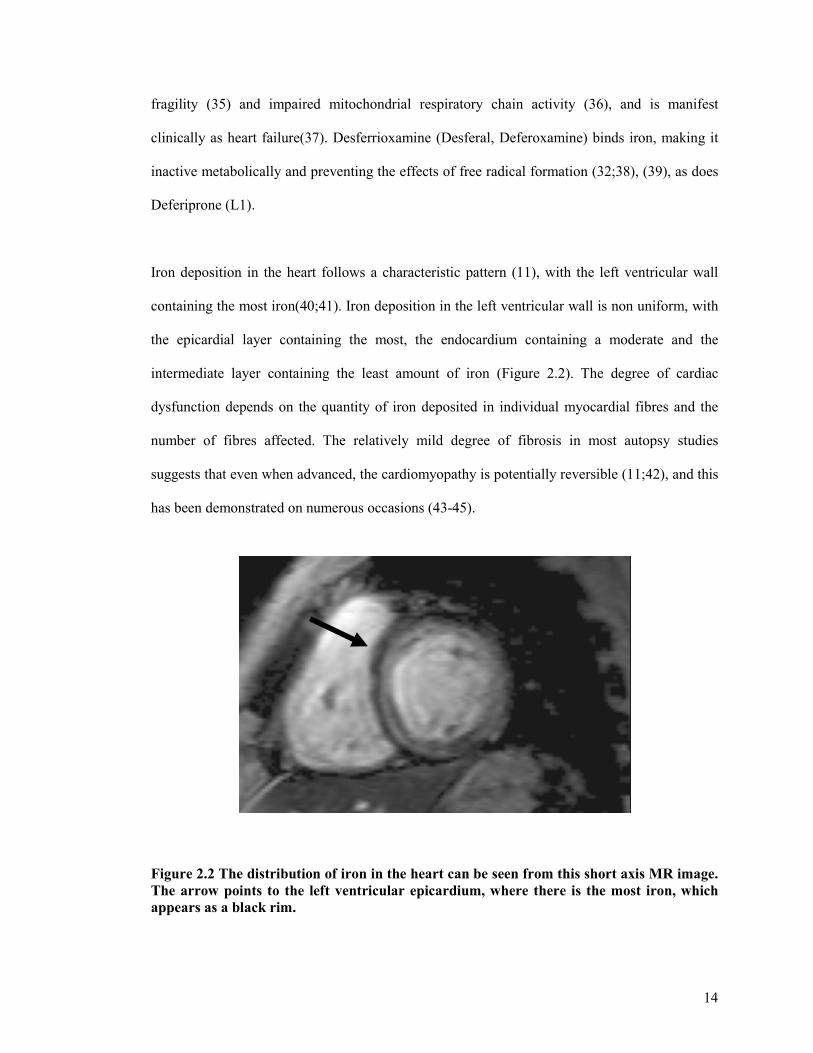
Iron deposition in the heart follows a characteristic pattern (11), with the left ventricular wall
containing the most iron(40;41). Iron deposition in the left ventricular wall is non uniform, with
the epicardial layer containing the most, the endocardium containing a moderate and the
intermediate layer containing the least amount of iron (Figure 2.2). The degree of cardiac
dysfunction depends on the quantity of iron deposited in individual myocardial fibres and the
number of fibres affected. The relatively mild degree of fibrosis in most autopsy studies
suggests that even when advanced, the cardiomyopathy is potentially reversible (11;42), and this
has been demonstrated on numerous occasions (43-45).
Figure 2.2 The distribution of iron in the heart can be seen from this short axis MR image. The arrow points to the left ventricular epicardium, where there is the most iron, which appears as a black rim.
15
2.4 CURRENT TREATMENTS OF THALASSAEMIA MAJOR
The current treatment of Thalassaemia major patients consists of regular blood transfusions, in
the order of 2 units every 2-4 weeks, and iron chelation therapy. The decision to initiate regular
transfusions may be a difficult one and is based on the severity of the signs of anaemia e.g.
growth failure. The aims of transfusion are to correct anaemia, suppress erythropoiesis, allowing
normal growth and development and inhibiting increased gut iron absorption (46). The first iron
chelator Desferal (Desferrioxamine, Deferoxamine) was introduced more than 40 years ago (47)
and has been available in the UK since1964 (48).
Daily intramuscular injection of 20–25 mg/kg/day stabilised body iron load at around 0.65
mg/kg body weight (49), and improved survival (50). Initial studies were encouraging and a
trial of daily long term intramuscular Desferal significantly reduced hepatic iron accumulation
and slowed the progression of hepatic fibrosis (51). In 1976 it was shown that subcutaneous
infusion of a higher dose using a portable syringe driver could stabilise body iron load at around
0.3 mg/kg body weight (52), and by 1980 subcutaneous infusion of an average daily dose of 40–
45 mg/kg/day (usually over 8 to 12 hours on five nights per week) had become standard care in
the UK. It was hoped that iron chelation with Desferrioxamine would be able to prevent the
complications and premature mortality as a result of iron overload. The first data on improved
survival in thalassaemic patients on long-term chelation therapy followed in the 1980s (53). A
study in the early 90’s demonstrated that treatment with desferioxamine when used in amounts
proportional to iron burden, delayed cardiac complications and improved longevity (54).
Brittenham’s group performed similar work, again demonstrating the early use of
desferrioxamine in an amount proportional to the transfusional iron load reduces the body iron
burden. This helped protect against diabetes mellitus, cardiac disease, and early death in patients
with thalassemia major (18). If instituted in time, intensive chelation therapy with Desferal can
prevent cardiac complications (23;55;56), and reverse the deleterious effects of severe iron
overload (45;57-59). Further studies have demonstrated survival extension with long term
16
desferioxamine therapy (18;60;61). Desferal revolutionised the treatment of iron overload in
thalassaemia, but it soon became clear that open ended life expectancy was not occurring. As
recently as the year 2000 life expectancy was still severely reduced with only 50% of
thalassaemia major patients surviving beyond the age of 35 years (50), and with inadequate
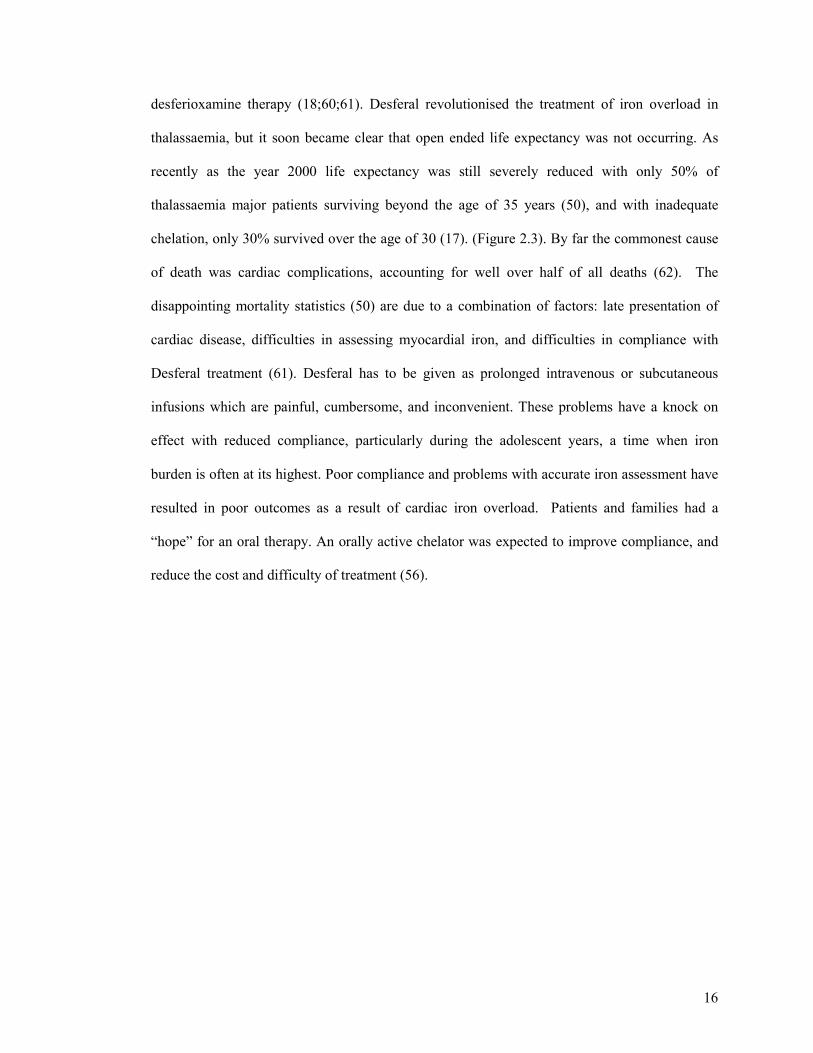
chelation, only 30% survived over the age of 30 (17). (Figure 2.3). By far the commonest cause
of death was cardiac complications, accounting for well over half of all deaths (62). The
disappointing mortality statistics (50) are due to a combination of factors: late presentation of
cardiac disease, difficulties in assessing myocardial iron, and difficulties in compliance with
Desferal treatment (61). Desferal has to be given as prolonged intravenous or subcutaneous
infusions which are painful, cumbersome, and inconvenient. These problems have a knock on
effect with reduced compliance, particularly during the adolescent years, a time when iron
burden is often at its highest. Poor compliance and problems with accurate iron assessment have
resulted in poor outcomes as a result of cardiac iron overload. Patients and families had a
“hope” for an oral therapy. An orally active chelator was expected to improve compliance, and
reduce the cost and difficulty of treatment (56).
17
Figure 2.3 From Modell et al, Lancet 2000: 355: 2051-2. Thalassaemia survival curves in the UK. Prior to transfusion therapy patients died in early childhood. Following the introduction of chelation therapy, patients died in their teens from iron-induced heart failure. The cohort born between 1945-54 died from iron overload until the introduction of Desferal. The cohort born 1965-74 should demonstrate the results of chelation therapy. Initial survival was promising but there has been 25% mortality in the last 5 years: survival for this cohort is only 50% to age 30.
2.5 ALTERNATIVE IRON CHELATORS
The orally active chelating agent Deferiprone (1,2-dimethyl-3-hydroxyyrid-4-one) has been
available since the late 1980’s and has undergone evaluation in a number of countries including
UK, Canada & India (63-66). Formal dose response studies have shown that iron excretion with
Deferiprone is inferior to that with desferrioxamine, but intermediate term clinical trials have
demonstrated its effectiveness (66-69), equivalent urinary iron excretion compared to
desferioxamine (65;67) and urine iron excretion greater than 25mg iron daily (the mean daily
intake of iron from transfusion) (64). A meta-analysis of deferiprone trials found that overall,
Deferiprone had clinical efficacy in achieving negative iron balance and reducing body iron
burden in highly iron overloaded patients (70). In addition after an average of 16 months of
deferiprone in doses > or = 75 mg/kg/day, most patients had a decrease in ferritin concentration
18
(71). However a longer term trial of 18 patients over 4.6 years (72), showed that 8 patients had
hepatic iron concentrations above 80µmol/g liver wet weight, a value previously believed to be
associated with an increased risk of cardiac disease (18). However the mean liver iron fell from
a mean of 88.7±12.1 to a mean of 65.5±7.9µmol/g liver wet weight. Therefore, although the
number of patients with high liver iron levels was disappointing, treatment with Deferiprone
appeared to be effective in reducing mean liver iron concentrations. Deferiprone has been
licensed in Europe as a second line agent since 1999, although its use has been hampered by
initial concern regarding hepatic fibrosis (72). These initial fears have been unfounded (73).
Deferiprone has now been available in all European countries since 1999 as second line
treatment for those who can not tolerate or have an unsatisfactory response to desferioxamine.
The commonest cause of death in thalassaemia is cardiac, the primary aim of chelation therapy
therefore is to reduce the cardiac iron burden and hence prevent premature death as a result of
cardiac siderosis. Historically risk of cardiac siderosis was assessed by means of high ferritin
levels >2500 ucg/l and high liver iron measures from liver biopsy >15gm/100gm dry weight.
Telfer’s group followed a cohort of thalassaemia patients whom had previously undergone liver
biopsy. They monitored their trend in serum ferritin over a median follow up of 13.6 years and
compared it with their mean serum ferritin and their liver iron concentration. The clinical end
point of death or cardiac failure was significantly associated with increasing iron load using all 3
measures (74). Their data show that iron quantification from a single liver iron biopsy had little
value in the long term monitoring of iron stores (74). Their data did support the concept that
keeping a low ferritin is beneficial, most complications being avoided if ferritin was kept
<1500mcg/l (74). We now know that although some assessment of risk can be extrapolated from
these measures of iron exposure they are both imprecise surrogate estimates for cardiac iron
load. In fact evidence from cardiac MRI studies has elegantly demonstrated the discordance
between iron load in the heart and liver (75). Tissue iron evaluation can be dependant on when
19
the assessment is made. Iron metabolism, storage and overload are dynamic processes which
vary with time and treatment. Depending on when in the cycle the assessment is made (Figure
2.4), iron loading may be predominantly in the liver, heart or in both organs.
Liver – iron loadedHeart – no iron
Liver – no ironHeart – no iron
Liver – iron loadedHeart – iron loaded
Liver – no ironHeart – iron loaded
Fe
FeFe
Fe
Fe
Fe
Fe
FeFe
Fe
Fe
Figure 2.4 Schematic demonstrating variable tissue iron burden depending on timing of
assessment.
Wonke et al published the first trial data of combination therapy demonstrating increased iron
excretion compared with desferioxamine monotherapy. Their work suggested an additive,
synergistic iron chelation effect when added to desferioxamine (76). Subsequent work suggests
that long-term chelation with Deferiprone may be better at reducing myocardial iron burden
(77;78). Anderson et al showed, despite significantly higher liver iron levels, a long term
Deferiprone treated group had lower myocardial iron concentrations and corresponding better
left ventricular ejection fractions (77). This reinforces the notion that myocardial iron and
ventricular function should be the prime determinants of assessing the effectiveness of chelating
20
agents. Similar findings were documented in a study by Piga et al with significantly less cardiac
disease in patients managed with long term Deferiprone (78). In this study, the 2 patients with
the worst NYHA class for heart failure were on Desferal. None of the Deferiprone treated
patients died during the study period, whereas 3 patients in the Desferal arm died of worsening
cardiac disease. Moreover, compliance was 85% for Desferal treated patients and only 4%
higher with Deferiprone, suggesting Desferal compliance is unlikely to be the prime explanation
of this effect. A study by Telfer et al has suggested that Deferipone may be responsible for the
increased survival seen in a cohort of thalassaemia patients from Cyprus (79).
Deferiprone is a smaller molecule with a lower molecular weight and lipophilicity (80;81). It is
proposed that these features enable the molecule to penetrate cell membranes more easily than
desferioxamine. This may explain its greater cardiac protection as the molecule enters the
myocardial cells where iron is stored in lysosomes as ferritin and haemosiderin(82). Conversely,
in the liver, desferrioxamine has the advantage of facilitated transport into cells via an active
uptake mechanism.
2.6 REVERSIBILITY OF TISSUE IRON OVERLOAD
The potential reversibility of iron induced cardiomyopathy was first documented in case reports
of patients with hereditary haemochromatosis treated with recurrent venesection (83) (84;85).
Subsequently, improvement of ventricular dysfunction with chelation therapy have been
reported in a patient with megaloblastic anaemia (86), in thalassaemia major (87) and in three
patients with transfusional iron overload (88). Freeman et al reported that high doses of
subcutaneous desferioxamine reversed subtle exercise induced dysfunction (57) detected in
those with normal resting function. The use of subcutaneous Desferal has also been shown to
reverse moderate left ventricular dysfunction (57;59;89), and advanced, NYHA grade 4, heart
failure (86). More recently, improvements in patients presenting with rapidly progressive heart
21
failure complicated by arrhythmias have been reported on conversion from subcutaneous
Desferal to high dose intravenous Desferal (87;90).
At a cellular level, studies of cardiac myocytes have shown that Desferal can remove iron from
the cardiac myocytes, reverse lipid peroxidation (32;38), and reverse the iron-induced
abnormalities of cellular contractility and rhythmicity (91). However, the reversibility of iron-
induced cardiac failure has not been universally accepted, partly due to the high mortality of
patients presenting with advanced cardiac failure despite chelation treatment (88) and more
recently by those questioning the role of iron in thalassaemic cardiomyopathy (24;92). Despite
some uncertainty and failure of a universally agreed consensus, there is overwhelming evidence
that iron is the culprit and clinically the important problem that needs to be dealt with.
2.7 METHODS FOR ASSESSMENT OF TISSUE IRON LOAD
Different organs have different susceptibility to iron deposition. With this in mind it is no
surprise that there remains no single ideal method for evaluating tissue iron burden (93;94). Iron
deposition varies both between and within different organs. Given the variation between organs,
assessment of iron in one organ, usually the liver may not accurately reflect the state of other
organ systems (Figure 2.4).
Previously body iron stores were estimated by ferritin measurement as an indirect marker. A
level of >2500 ucg/l was considered to represent high total body iron and risk for cardiac events.
However, although in normals, serum ferritin correlates with iron stores (95), and with liver iron
measured directly by liver biopsy (96), there are several factors that distort this relationship in
thalassaemia major. First, liver fibrosis and transfusion transmitted viral hepatitis reduce the
effect of iron status on serum ferritin by about 50% (97); Second, ferritin is an acute phase
protein and subject to elevation during periods of infection or inflammation (98), leading to false
assessment of high body iron stores. Third, vitamin C deficiency is common in these patients
and leads to falsely low elevations in serum ferritin despite extensive iron loading (99). It is
22
increasingly recognized that reliance on this test may lead to errors in management; changes in
body iron account for little more than half the variation in serum ferritin concentrations (97).
Serum ferritin has more recently been shown not to correlate with myocardial iron load (75). In
groups, long term averages of ferritin can differentiate high risk from intermediate and low risk
groups (74). However, more recently it has been shown that individual measurements of ferritin
do not correlate well with myocardial iron load, determined by cardiac magnetic resonance
T2*(75).
The current gold standard for determining hepatic iron is by direct measurement from a liver
biopsy (100), an invasive technique with a low but recognised complication rate. A level of
>15mg/kg dry weight was considered to suggest those at risk of cardiac complications. Iron is
unevenly distributed even in the non-cirrhotic stage (101-103). This non uniform distribution of
iron (104) means a single biopsy may not reliably reflect mean hepatic iron concentrations (105)
and the result should be interpreted with caution when monitoring the efficacy of chelation
therapy (106). Furthermore, measurement of liver iron can only be an effective indicator of
cardiac iron stores if iron is assumed to be stored predictably and homogeneously throughout the
body. Initial reports suggested such a correlation between myocardial and hepatic iron burden
(107;108), but it now seems that this is not the case (Figure 2.5), (65;75;109;110). Equally, those
with a low ferritin and liver biopsy result were felt to be at low risk for cardiac involvement,
again, this has now been shown to be incorrect (111).
2.8 DIRECT ESTIMATION OF CARDIAC IRON LOAD
Endomyocardial biopsy can be used to evaluate iron deposition in the heart in thalassaemia
(112;113). However, as a technique, it is less than ideal, being invasive and having associated
complication risks. As discussed, iron is deposited in a non uniform manner and therefore the
risk of sampling error is high, a negative biopsy does not exclude significant cardiac iron. In
addition the biopsy is of the endocardium giving rise to a potential sampling error, as iron is
23
preferentially deposited in the epicardium (114). Biopsies are taken from the right ventricle
which is relatively spared from iron infiltration (11;115;116) and may not represent true risk.
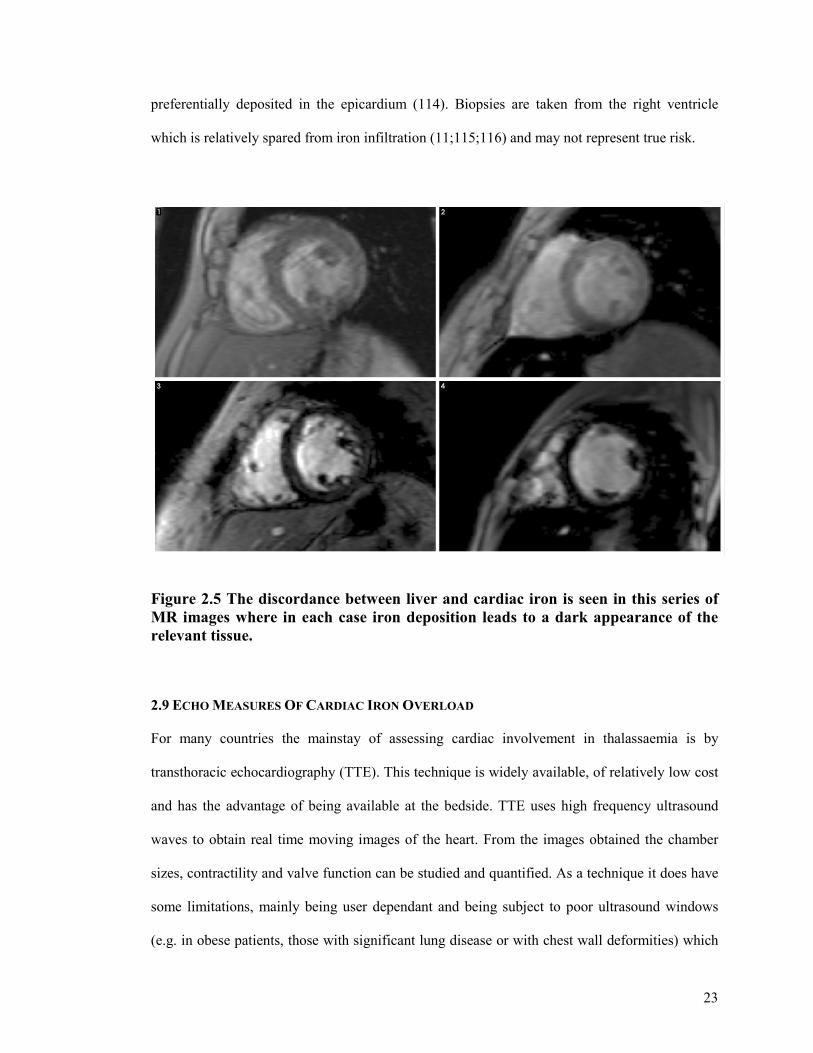
Figure 2.5 The discordance between liver and cardiac iron is seen in this series of MR images where in each case iron deposition leads to a dark appearance of the relevant tissue.
2.9 ECHO MEASURES OF CARDIAC IRON OVERLOAD
For many countries the mainstay of assessing cardiac involvement in thalassaemia is by
transthoracic echocardiography (TTE). This technique is widely available, of relatively low cost
and has the advantage of being available at the bedside. TTE uses high frequency ultrasound
waves to obtain real time moving images of the heart. From the images obtained the chamber
sizes, contractility and valve function can be studied and quantified. As a technique it does have
some limitations, mainly being user dependant and being subject to poor ultrasound windows
(e.g. in obese patients, those with significant lung disease or with chest wall deformities) which
Liver
Liver Liver
Liver
Heart
Heart Heart
Heart
24
may limit image acquisition and quality. However, whilst TTE is an excellent modality for
assessing cardiac function, the main question of interest is in identifying those with cardiac iron
loading who are at risk of abnormal cardiac function and cardiac decompensation.
Conventional echocardiograpic markers of left ventricular (LV) function have traditionally been
used as a surrogate marker to predict the degree of cardiac iron loading. On the whole they have
been unhelpful. M mode techniques for evaluating LV systolic function have remained normal
(117;118), and have failed to identify thalassaemia patients with iron overload from normal
controls. Once abnormalities in LV systolic function become detectable, significant iron
deposition has occurred and survival is reduced, suggesting that this occurs at a late stage in the
disease process (119-122). Measures of diastolic function, ventricular relaxation, may occur
earlier (123-125), and detailed analysis of digitised M mode tracings have detected
abnormalities in contraction and relaxation in thalassaemia major children (126). Other echo
techniques involving dynamic studies have highlighted abnormalities of function not apparent at
rest (127;128). Newer techniques for assessing ventricular function include tissue Doppler
imaging (TDI). TDI involves obtaining regional information regarding wall motion and velocity.
A previous study by our group (Vogel et al (129)) involving a sample of 52 thalassaemia
patients attending our specialist clinic found that TDI detected regional abnormalities despite
normal global LV function in a high proportion of patients with iron overload. This suggests that
TDI may be able to identify abnormalities in asymptomatic patients with iron overload. It is
known that if cardiac dysfunction is identified and intensive iron chelation instituted, that the
cardiomyopathy associated with iron overload is reversible and cardiac function can improve
(45), but it is a slow process (45). Recent MRI studies have examined the relationship between
iron and right heart function. In the absence of significant cardiac iron, T2* >20ms, right
ventricular (RV) function was normal in 98% of the study group (130). When RV function in a
thalassaemia population was compared with an age matched group, the function and volumes
25
were found to be higher (131). Little is known regarding echo assessment of right heart function
in this group of patients.
2.10 CARDIAC MRI ASSESSMENT OF IRON LOAD
Magnetic resonance (MR) scanning is currently the only method shown to be reliable and
accurate to assess both hepatic and myocardial iron loading as iron is not predictably distributed
between the tissues (75;132-135). It has been available in the United Kingdom since 1999 and
has rapidly become the gold standard for assessing cardiac iron status. Cardiac MRI assessment
has played a major role in driving changes in the intensification and guiding individualisation of
iron chelator therapy. This is likely to be the most significant contributor to the improved
survival seen in thalassaemia since 1999 with a reduction in deaths from cardiac iron overload
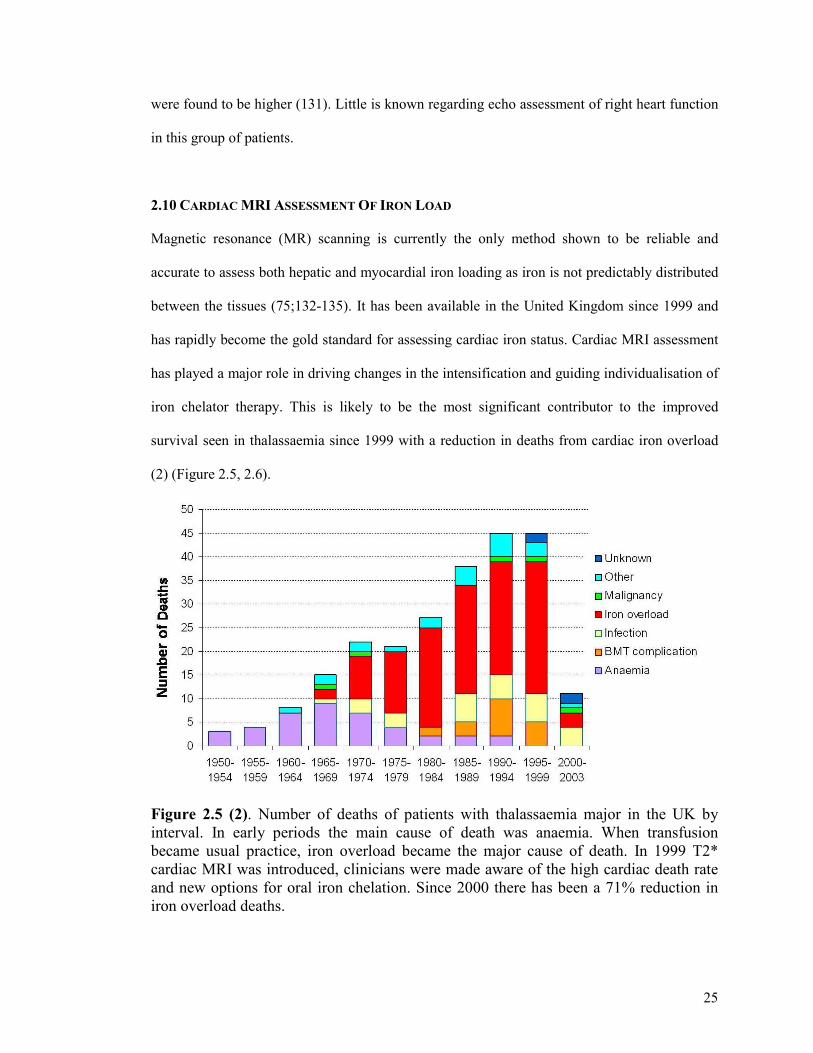
(2) (Figure 2.5, 2.6).
Figure 2.5 (2). Number of deaths of patients with thalassaemia major in the UK by interval. In early periods the main cause of death was anaemia. When transfusion became usual practice, iron overload became the major cause of death. In 1999 T2* cardiac MRI was introduced, clinicians were made aware of the high cardiac death rate and new options for oral iron chelation. Since 2000 there has been a 71% reduction in iron overload deaths.
26
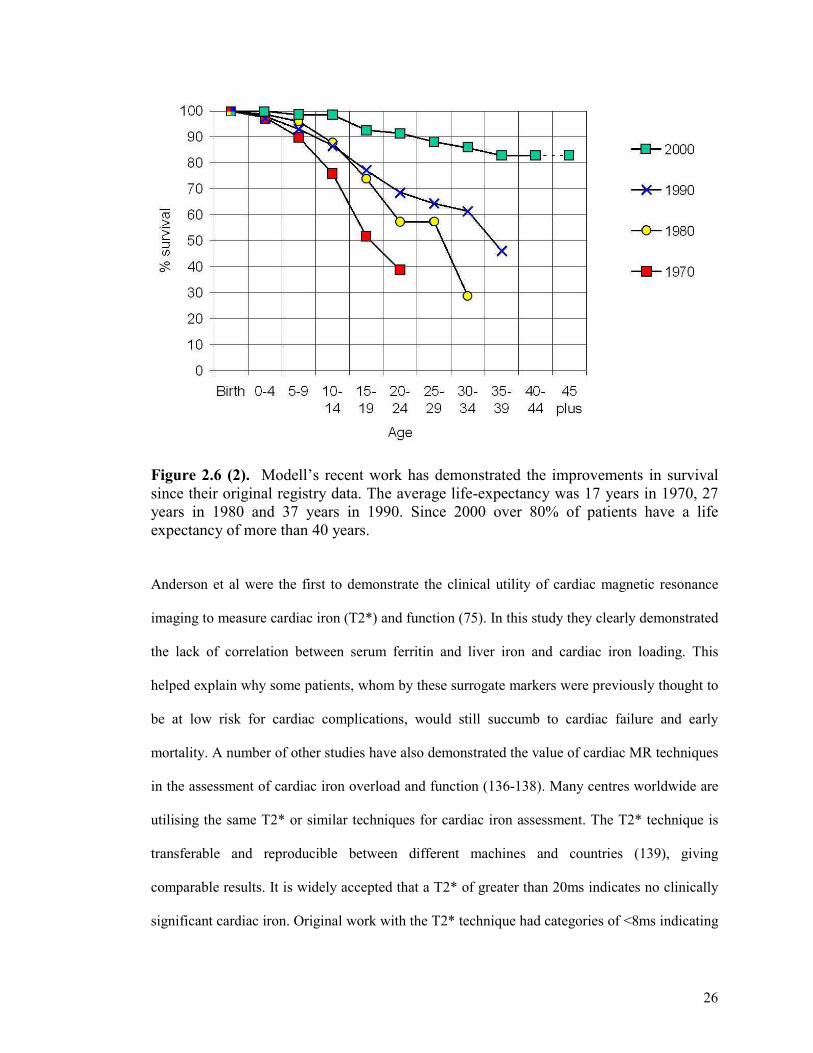
Figure 2.6 (2). Modell’s recent work has demonstrated the improvements in survival since their original registry data. The average life-expectancy was 17 years in 1970, 27 years in 1980 and 37 years in 1990. Since 2000 over 80% of patients have a life expectancy of more than 40 years. Anderson et al were the first to demonstrate the clinical utility of cardiac magnetic resonance
imaging to measure cardiac iron (T2*) and function (75). In this study they clearly demonstrated
the lack of correlation between serum ferritin and liver iron and cardiac iron loading. This
helped explain why some patients, whom by these surrogate markers were previously thought to
be at low risk for cardiac complications, would still succumb to cardiac failure and early
mortality. A number of other studies have also demonstrated the value of cardiac MR techniques
in the assessment of cardiac iron overload and function (136-138). Many centres worldwide are
utilising the same T2* or similar techniques for cardiac iron assessment. The T2* technique is
transferable and reproducible between different machines and countries (139), giving
comparable results. It is widely accepted that a T2* of greater than 20ms indicates no clinically
significant cardiac iron. Original work with the T2* technique had categories of <8ms indicating
27
severe cardiac iron, 8-12ms indicating moderate cardiac iron and 12-20ms indicating mild
cardiac iron. For our study we used the same classification. The categories have now been
adjusted and a T2* of <10ms is accepted to indicate severe cardiac iron with 10-20ms being a
mild to moderate load. Cardiac MRI has many advantages as a technique. It is non invasive,
robust, accurate & reproducible. It also allows the comparison of iron load and heart function.
As the gold standard it can be used in trials and studies as the comparison arm to determine the
predictive ability of other measures, the compliance of patients and the impact of red cell
consumption. It is also used to guide chelation therapy that is individualised according to risk
and may be employed to monitor the impact of treatment.
2.11 CARDIAC TREATMENTS IN THALASSAEMIA MAJOR AND CARDIAC SIDEROSIS
There is only a limited evidence base for specific cardiac medications in iron overload or its
resultant cardiac failure. Standard heart failure medications are utilised. Recommended
treatment is with diuretics, angiotensin converting enzyme inhibitors, beta blockers, digoxin &
spironolactone, the hallmark therapies for other causes of heart failure. Karnouvis et al studied
the use of enalapril in asymptomatic or minimally symptomatic patients with LV dysfunction
from thalassaemia. They found enalapril to be well tolerated and demonstrated significant
improvements in systolic function (140). Whether this translated into improved survival requires
further evaluation (141). Animal work has proposed the role of L type calcium channels in the
development of cardiac siderosis (142) and a group from Canada has demonstrated that
amlodipine, a calcium channel blocker, can limit cardiac iron uptake in mice (143).
28
CHAPTER 3: TISSUE DOPPLER TECHNIQUES
3.1 TISSUE DOPPLER TECHNIQUES
Tissue Doppler techniques include Tissue Doppler imaging (TDI), Strain, Strain Rate and
Longitudinal Deformation (TT). Over the past decade there have been numerous studies
published addressing the feasibility and potential clinical applications of TDI and its derived
techniques of strain and strain rate. Despite this promising expanse of research and publications
(144-147) the parallel clinical uptake of these methods never really took place and they remain
largely confined to high technology research oriented echo laboratories. TDI allows the analysis
of velocities with high amplitude and low frequency which originate from the myocardial tissue.
The method depicts myocardial motion, measured as myocardial velocity, at specific locations
in the heart. Tissue velocities indicate the rate at which a point in the myocardium moves toward
or away from the transducer. These signals are not detected in the traditional Doppler
examination. TDI is achieved by gain adjustment and elimination of the high pass filter and
requires modifications of the software and hardware of the ultrasound platform. Integration of
velocity over time yields displacement or the absolute distance moved by that point. Tissue
Doppler derived velocities can be obtained by many methods, the commonest being pulsed
Doppler (a sample volume placed at a particular point) and colour Doppler. If colour Doppler is
used tissue velocity information is acquired from the whole sector and therefore multiple
locations can be interrogated simultaneously. Both these methods give the same mechanical
information but differences exist in the peak values obtained. Pulsed Doppler techniques
measure peak velocity approximately 20-30% higher than the mean velocity obtained with
colour Doppler. This difference must be considered when for example estimating left ventricular
filling pressure using the E/E’ ratio (148). It is also of importance when comparing velocities
obtained in 1 study with those from another study where an alternative method may have been
29
used to derive the velocity information. For our study we have used the colour Doppler
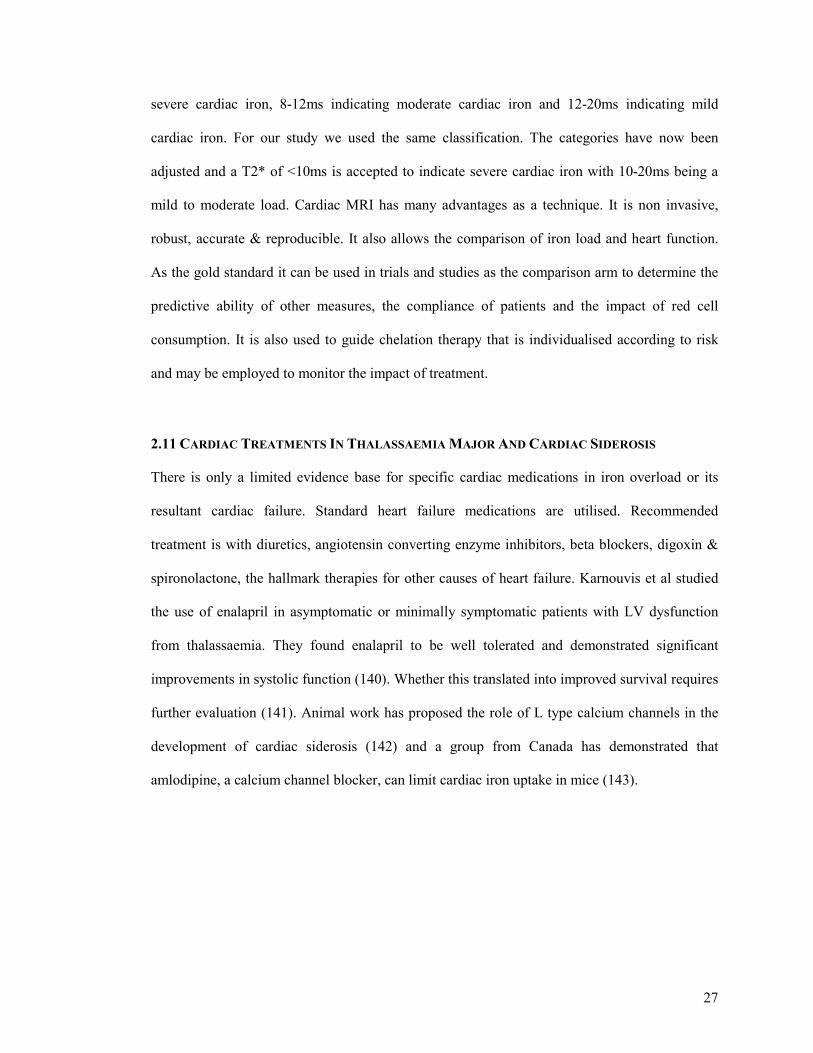
technique with subsequent offline analysis (Figure 3.1).
Figure 3.1 A – Pulsed wave Doppler TDI, B – Colour Doppler TDI, C – Tissue Velocities (S’ – Systolic Velocity, E’ – Early Diastolic Velocity, A’ – Late Diastolic Velocity, D – Maximum Tissue Displacement Tissue Doppler has been validated extensively and examined in a variety of settings (149;150).
Most recent work has almost exclusively interrogated tissue velocities in the longitudinal
direction (from the apical projections). From apical projections the apex is relatively fixed and
30
immobile, whereas the base moves towards the apex in systole and away in diastole. The
differential movement between base and apex results in a velocity gradient with the highest
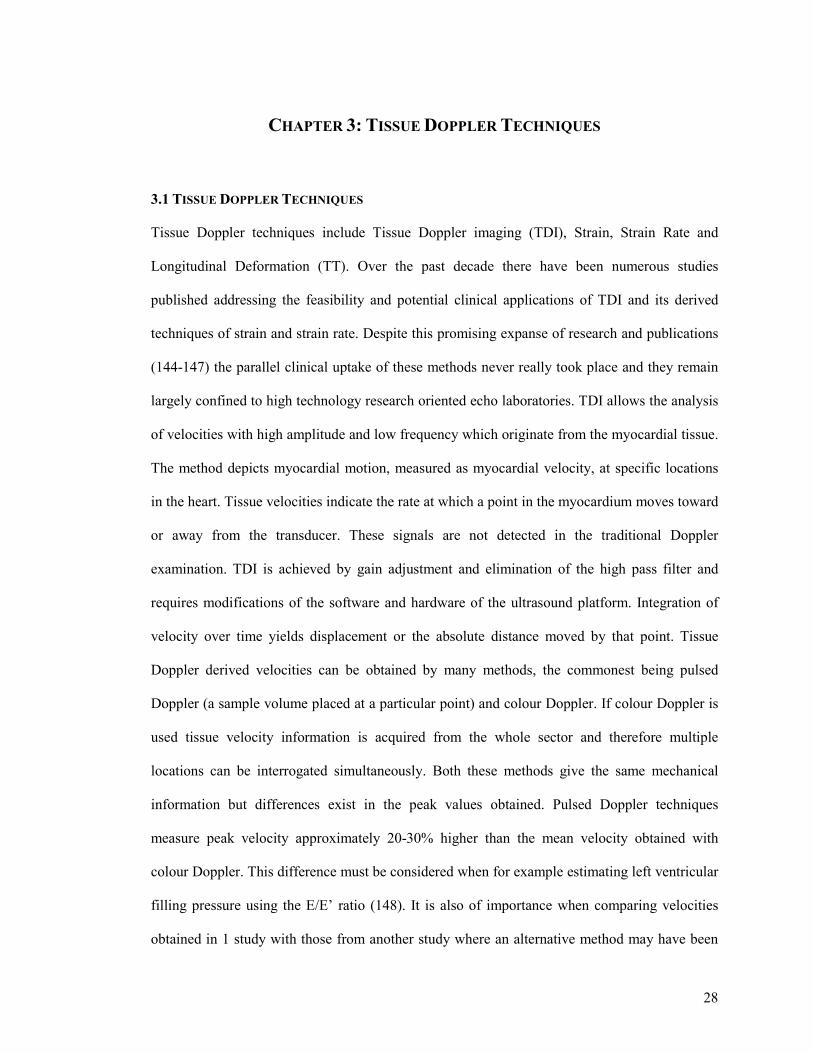
velocity at the base and low or zero velocity at the apex (Figure 3.2).
Figure 3.2– Demonstrating the myocardial velocity gradient with higher velocities at the base and lower velocities at the apex. Strain rate SR is calculated as the difference between 2 tissue velocities normalised to the distance between the 2 velocities (151). One of the main reasons for scepticism towards TDI lie in its physical principles. Doppler is the
ideal method for examining intracardiac and vascular flow that obeys the laws of fluid
dynamics. Myocardial motion is different, occurring in multiple planes and directions. It is
influenced by motion of other organs and structures within the thoracic cage and follows
complex mechanical phenomena for which there exists no reference method (152). TDI
interrogates motion at a single point with reference to the transducer (outside the chest wall). It
is influenced by translation forces and tethering (the motion of an abnormal basal segment is
influenced by the pull of a normal apical segment towards the apex) (146). TDI has however
31
refocused attention on some regional contraction phenomena such as delayed systolic
contraction or late systolic contraction.
3.2 STRAIN AND STRAIN RATE IMAGING
The limitations of TDI in respect of tethering from collateral segments can be overcome by
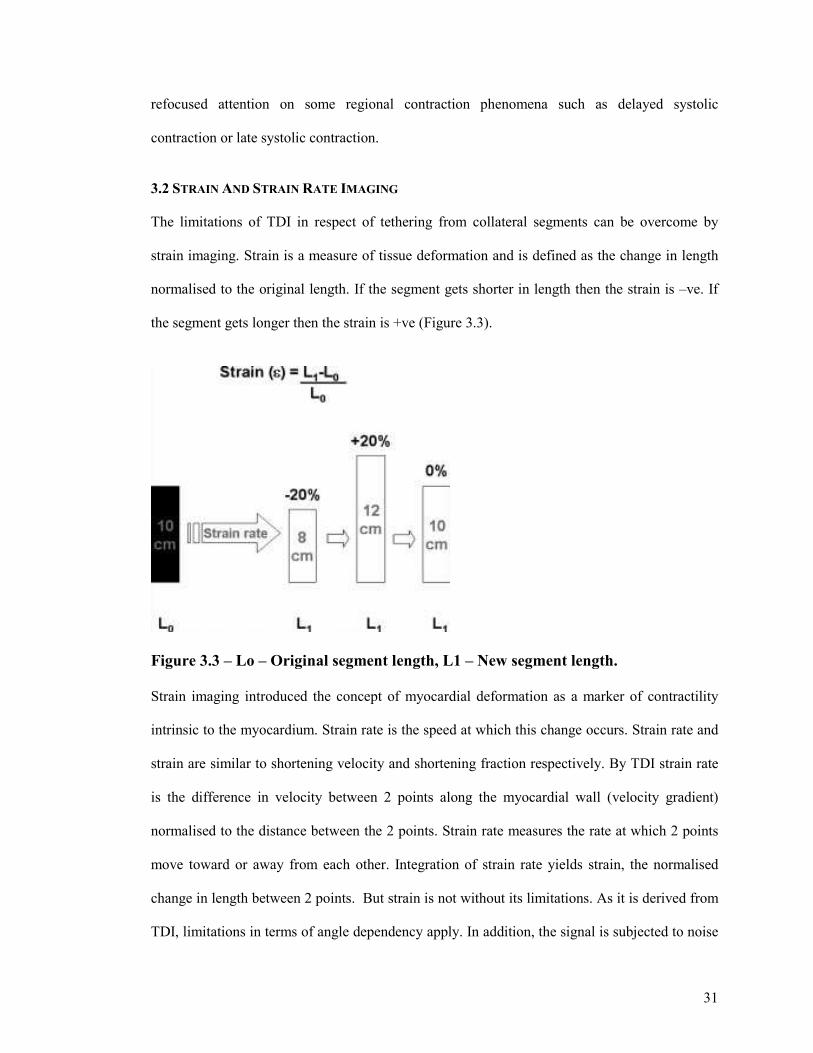
strain imaging. Strain is a measure of tissue deformation and is defined as the change in length
normalised to the original length. If the segment gets shorter in length then the strain is –ve. If
the segment gets longer then the strain is +ve (Figure 3.3).
Figure 3.3 – Lo – Original segment length, L1 – New segment length. Strain imaging introduced the concept of myocardial deformation as a marker of contractility
intrinsic to the myocardium. Strain rate is the speed at which this change occurs. Strain rate and
strain are similar to shortening velocity and shortening fraction respectively. By TDI strain rate
is the difference in velocity between 2 points along the myocardial wall (velocity gradient)
normalised to the distance between the 2 points. Strain rate measures the rate at which 2 points
move toward or away from each other. Integration of strain rate yields strain, the normalised
change in length between 2 points. But strain is not without its limitations. As it is derived from
TDI, limitations in terms of angle dependency apply. In addition, the signal is subjected to noise
32
problems especially in the apical views. This affects the profile of the spectral curve and can
make interpretation difficult and reproducibility very challenging. Strain rate and strain are
theoretically less susceptible to translational motion and tethering artifacts and thus may be
superior to tissue velocity in depicting regional or global myocardial function. In general peak
systolic strain rate comes closest to measuring local contractile function. It is relatively volume
independent and less pressure dependent than strain. In contrast peak systolic strain is volume
dependent (151).
3.3 VALIDATION OF TDI AND STRAIN TECHNIQUES
TDI and its derived methods have very high temporal resolution. They can analyse events that
happen in such a short period of time that they are missed by the human eye (146;147;147)
These phenomena inherent to myocardial contractility have been addressed with methods used
in experimental studies such as sonomicrometric techniques (153) , which are not reproducible
in a clinical setting and therefore cannot be defined as reference methods. The real problem
consists in the lack of a definition of myocardial contractility and of a gold standard that
identifies it. Tissue Doppler– derived strain variables have been validated with gel phantoms
(154) isolated muscle preparations (155), and tagged CMR imaging (156) Normal strain and
strain-rate values have been published (157).
3.4 2D STRAIN (SPECKLE TRACKING)
This is the latest technique proposed for obtaining velocity and deformation information. The
method rather than analysing the long component along the line of the image estimates vectorial
velocities. The algorithm tracks data from radiofrequency and black/white signals. For every
pixel of the image an angle independent velocity is estimated and follows in the various frames.
This could enable 2D strain to overcome the sampling and angle dependency errors of strain
obtained by Doppler.
33
3.5 THE ROLE OF TDI AND STRAIN TECHNIQUES IN OTHER CARDIAC PATHOLOGIES
Tissue Doppler and strain techniques have an expanding evidence base for their use in other
areas.
3.5.1 Global Systolic Function. The current gold standard for systolic function remains the ejection fraction although this is
subject to many limitations. Peak annular mitral velocity correlates well with dP/dTmax by
micromanometer catheters in the LV cavity and with ejection fraction from angiography and
radionuclide imaging (158;159). Normal values for tissue Doppler derived velocities have been
established (160;161). A peak mitral annular velocity of >5.4cm/s averaged from 6 annular sites
predicts an EF > 50% (158). Strain rate closely correlates with invasively determined parameters
of global function (162), thus either of these techniques could potentially be used instead of
ejection fraction to quantify global function. Visual assessment of wall motion abnormalities
suggestive of myocardial ischaemia are variable and have poor reproducibility (163). Both TDI
and strain can quantify wall motion. Low systolic tissues velocities correlate with angiographic
and echocardiographic wall motion abnormality (164). Tissue velocities decrease with reduced
regional perfusion, recover on reperfusion, and differentiate between transmural and
nontransmural infarction (165-167). Regional strain rates and strain are reduced in ischemia and
infarction (168;169). Strain and strain rate identify infarcted segments and correlate with extent
of transmural infarction (170). Strain and strain rate are less susceptible to cardiac translational
motion and tethering. The term “tethering” is used to describe the dragging of an akinetic basal
segment toward the apex by normally functioning mid or apical segments. This theoretical
advantage of strain/strain rate was confirmed in the clinical setting (171).
34
3.5.2 Cardiomyopathy There has been considerable interest in the role of tissue Doppler techniques in the assessment
and management of cardiomyopathies. Tissue velocities, strain rates and strain are reduced in
cardiomyopathies and could potentially be used for preclinical detection of inherited
cardiomyopathies. In rabbit models of hypertrophic cardiomyopathy systolic and diastolic
velocities were significantly reduced (172). In patients with known mutations associated with
hypertrophic cardiomyopathy, but without ventricular hypertrophy reduced systolic and diastolic
velocities (173) or reduced early diastolic velocities have been found (174). Early diastolic strain
rates were significantly lower in asymptomatic gene positive patients with Friederichs ataxia
(175), are lower in hypertrophic cardiomyopathy patients compared with athletes or normal
subjects (176) and are lower in restrictive than in normal or constrictive cardiomyopathy (177).
In Fabry’s disease abnormal systolic and diastolic velocities are reported (178) and systolic
strain and strain rate improve after enzyme replacement therapy (179). In primary amyloidosis
tissue velocities and strain rates are reduced with or without evidence of cardiac involvement
(180-182). A previous study by our group (183) involving a sample of 52 thalassaemia patients
attending our specialist clinic found that TDI detected regional abnormalities despite normal
global LV function in a high proportion of patients with iron overload. This suggests that TDI
may be able to identify abnormalities in asymptomatic patients with iron overload.
3.5.3 Dysynchrony Analysis There have been a number of studies demonstrating benefit from cardiac resynchronisation
therapy in patients with symptomatic heart failure despite optimum medical therapy, low
ejection fraction and conduction abnormality (184;185). A prolonged QRS duration from
electrocardiogram is used to identify electrical dysynchrony. However there are a proportion of
patients who do not derive symptomatic improvement, so called “non responders”. It is widely
accepted that electrical dysynchrony does not necessarily correlate with mechanical
35
dysynchrony, which is ultimately what resynchronisation therapy is aimed at improving. Several
reports suggest a low concordance between electrical and mechanical synchrony (186;187)
Mechanical dysynchrony identified by echocardiography and in particular by tissue Doppler
techniques may be superior to electrocardiography in identifying responders and non responders
to this important beneficial therapy (188;189). Tissue Doppler imaging allows the operator to
analyse mechanical activity and measure for example the time to onset of peak systolic motion
at various locations in the heart. In the normal synchronous heart, the time to peak velocity
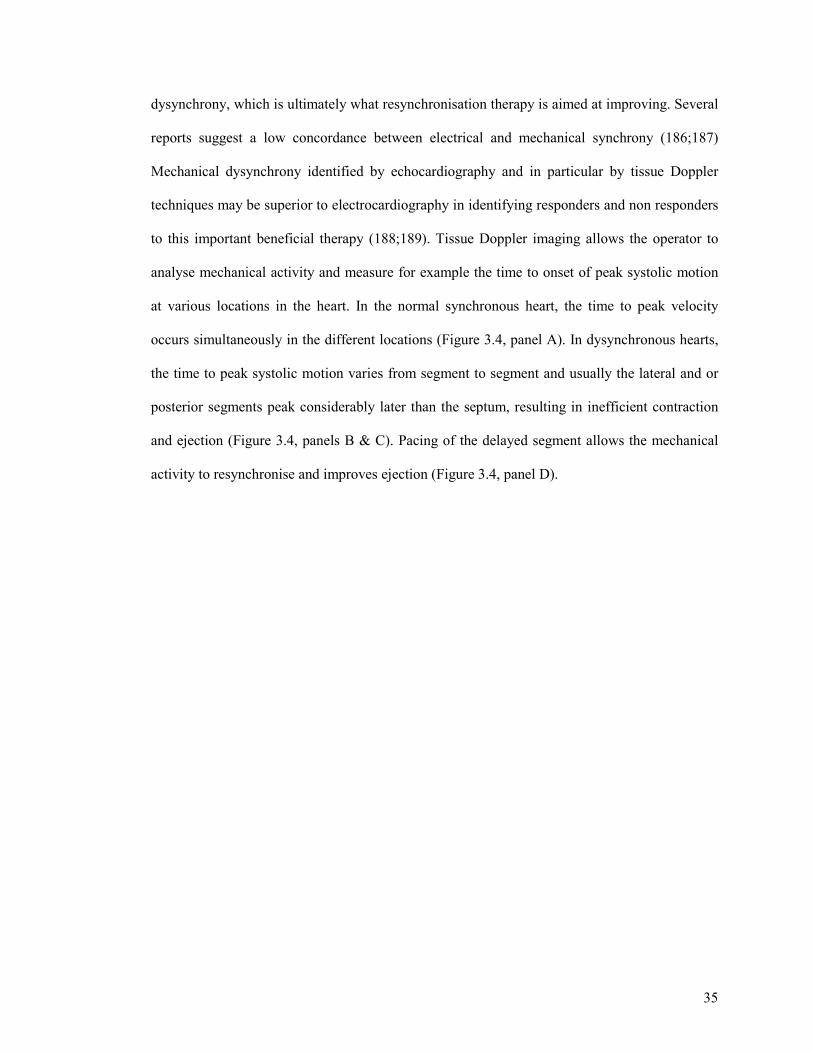
occurs simultaneously in the different locations (Figure 3.4, panel A). In dysynchronous hearts,
the time to peak systolic motion varies from segment to segment and usually the lateral and or
posterior segments peak considerably later than the septum, resulting in inefficient contraction
and ejection (Figure 3.4, panels B & C). Pacing of the delayed segment allows the mechanical
activity to resynchronise and improves ejection (Figure 3.4, panel D).
36
Figure 3.4 – A = Normal Subject, B = Subject with heart failure, C = Subject prior to biventricular pacing, D = Patient C after biventricular pacing (151).
Severe mechanical dysynchrony may be seen visually but milder forms are not detected by eye
and cannot be quantified by eye. The mechanical delay between early and late contracting
segments predicts response to resynchronisation therapy (190). There have been a number of
proposed indices of mechanical dysynchrony, the criteria commonly used in clinical practice are
the septal to lateral wall delay of >65ms (189) and the standard deviation of time to peak of
systolic velocities in either a 12 (191) or 16 segment model (192). It is not clear whether TDI or
37
strain/strain rate are superior in predicting response to cardiac resynchronisation therapy
(193;194).
3.5.4 Diastolic Function Early diastolic velocities (E’) correlate with invasive measures of diastolic function (195-198).
However, although initially thought to be load independent this is not the case (196;199). Low
Ee’ of < 3.5cm/sec in the hypertensive population and <3.0cm/s in patients with low ejection
fraction predicts mortality and is incremental to clinical and echocardiography data (200;201).
The ratio of mitral inflow E to E’ velocity ratio (E/Ee’) correlates closely with left ventricular
filling pressure (195;202), predicts heart failure events and is incremental to clinical factors and
ejection fraction (203). The higher temporal resolution of strain imaging allows interrogation of
short diastolic mechanical events. A ratio of early to late diastolic strain rates can be calculated
for different ventricular segments. In global diastolic dysfunction the number of segments with
abnormal ratios is increased and as the diastolic function worsens the number of abnormal
segments increases (204).
3.5.5 Right Ventricular Function Estimation of right ventricular function by echocardiography is an area which is challenging and
often overlooked in clinical practice. Tricuspid annular planar systolic velocity (TAPSE)
correlates with right ventricular ejection fraction (205;206). TAPSE reflected RV function and
predicted 2 year survival in patients with pulmonary hypertension (207). More recent data
suggest a relationship between isovolumic acceleration and regional contractility (208). Tissue
Doppler derived RV displacement and strain closely correlate with RV stroke volume and can
track changes in RV function during vasodilator infusion (209).
38
3.6 TDI TECHNIQUES IN THALASSAEMIA PATIENTS
These techniques are evolving and have been demonstrated to have a role in a number of
conditions (172;173;175;176;178;180;181). Previous work has demonstrated that TDI detected
regional abnormalities despite normal LV function in a cohort of thalassaemia patients. These
techniques are less dependent on image quality to assess ventricular function, as the signal is of
a high amplitude and low velocity, being generated by myocardial wall motion. These
techniques are relatively straightforward to apply even for those learning the techniques. As
thalassaemia leads to tissue iron accumulation, it may be expected to cause abnormalities in
tissue Doppler signals at an early stage. Most thalassaemia patients are monitored on a periodic
basis with up to date transthoracic imaging. These techniques take little time to acquire the data
which can be subsequently analysed off line, thereby adding little extra scanning time to gather
the information. These methods therefore lend themselves very well for application in the
thalassaemia population.
39
CHAPTER 4: BRAIN NATRIURETIC PEPTIDE
4.1 BRAIN NATRIURETIC PEPTIDE
Brain natriuretic peptide (B-type natriuretic peptide, BNP), is predominantly a cardiac hormone
released in response to increased wall tension, stretch and ventricular volume expansion. Brain
natriuretic peptide, in the active form is a 32 amino acid polypeptide containing a 17-amino acid
ring structure common to all natriuretic peptides (210).
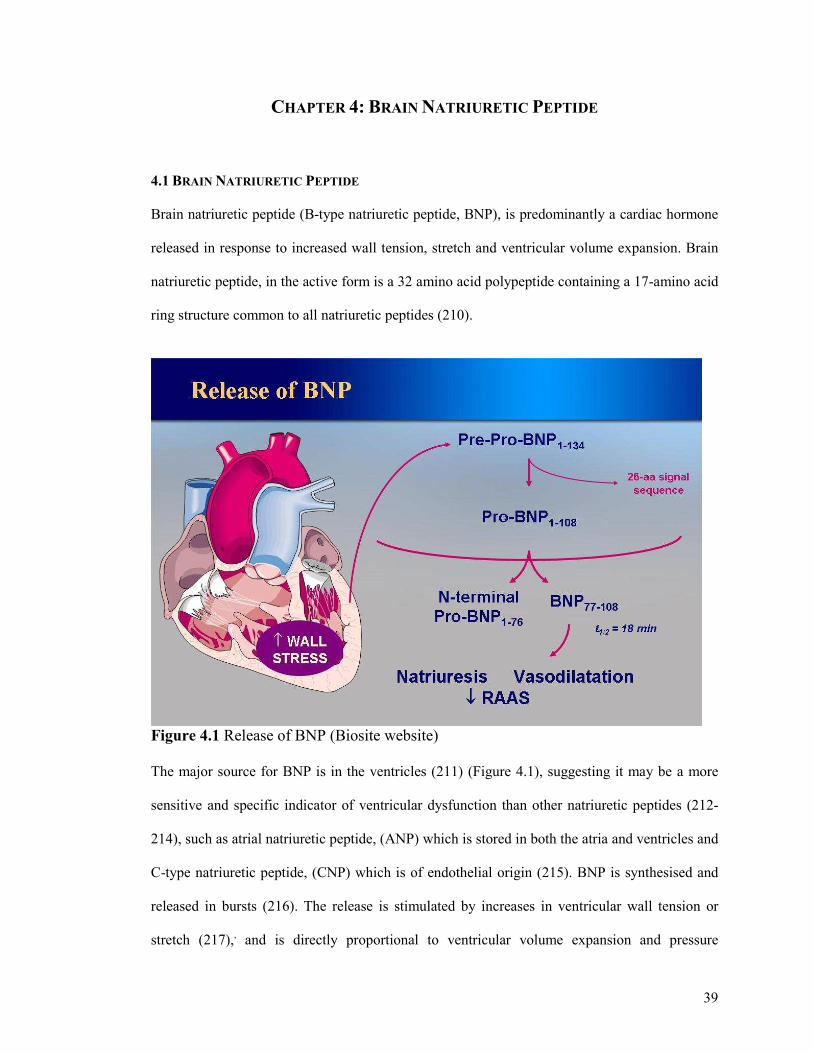
Figure 4.1 Release of BNP (Biosite website) The major source for BNP is in the ventricles (211) (Figure 4.1), suggesting it may be a more
sensitive and specific indicator of ventricular dysfunction than other natriuretic peptides (212-
214), such as atrial natriuretic peptide, (ANP) which is stored in both the atria and ventricles and
C-type natriuretic peptide, (CNP) which is of endothelial origin (215). BNP is synthesised and
released in bursts (216). The release is stimulated by increases in ventricular wall tension or
stretch (217),, and is directly proportional to ventricular volume expansion and pressure
40
overload (213;218-220). The level of gene expression & tissue concentration of BNP increases
in all cardiac regions but predominantly in the left ventricle in animal models (221). Taking
atrial and ventricular weight into account, the total amount of BNP mRNA (messenger
ribonucleic acid) in the ventricle represents 77% of that in the whole heart (222). On secretion,
proBNP is cleaved into the inactive N-terminal-proBNP of 76 amino acids and the
endocrinologically active BNP-32 (223).
BNP opposes the adaptations to congestive cardiac failure (CCF) by promoting diuresis,
natriuresis, and vasodilatation, inhibiting the sympathetic and renin-angiotensin axis and
inhibiting the synthesis of vasoconstrictor molecules (224), thereby attempting to restore
haemodynamic and circulatory balance. Attempts have been made to utilise hormones to
diagnose and monitor the progress of heart failure and the neurohormonal natriuretic peptide
group appear to be appropriate candidates for neurohormonal profiling (213;225), and thus far,
show great promise. In addition, there is increasing evidence for the role of BNP in assessment
of prognosis following acute myocardial infarction (226).
4.2 BNP MEASUREMENT IN THE ASSESSMENT AND MANAGEMENT OF HEART FAILURE
Several studies have shown BNP to be a marker of changes in LV function & BNP levels
correlate with symptoms of heart failure (227;228). In addition BNP shows an inverse
correlation with LV ejection fraction as measured by echocardiography. In a large study of A&E
attendances with breathlessness, BNP levels were able to accurately distinguish between
breathlessness of cardiac and non cardiac origin (227). By means of receiver operator curves for
various BNP cut off values, 100pg/ml was found to be the most accurate for differentiating
dyspnoea due to congestive cardiac failure and dyspnoea due to other causes (227). Maisel et al
found that BNP levels alone were more accurate than any historical or physical findings with an
odds ratio of 29 and a level of >100pg/ml giving a diagnostic accuracy of 83.4% (227). Knudsen
et al subsequently looked at signs, symptoms and risk factors for heart failure in patients
41
presenting with acute dyspnoea to A& E departments. They found that a BNP of >100pg/ml had
the highest odds ratio of 12.3 for a diagnosis of heart failure as the cause of dyspnoea (229),
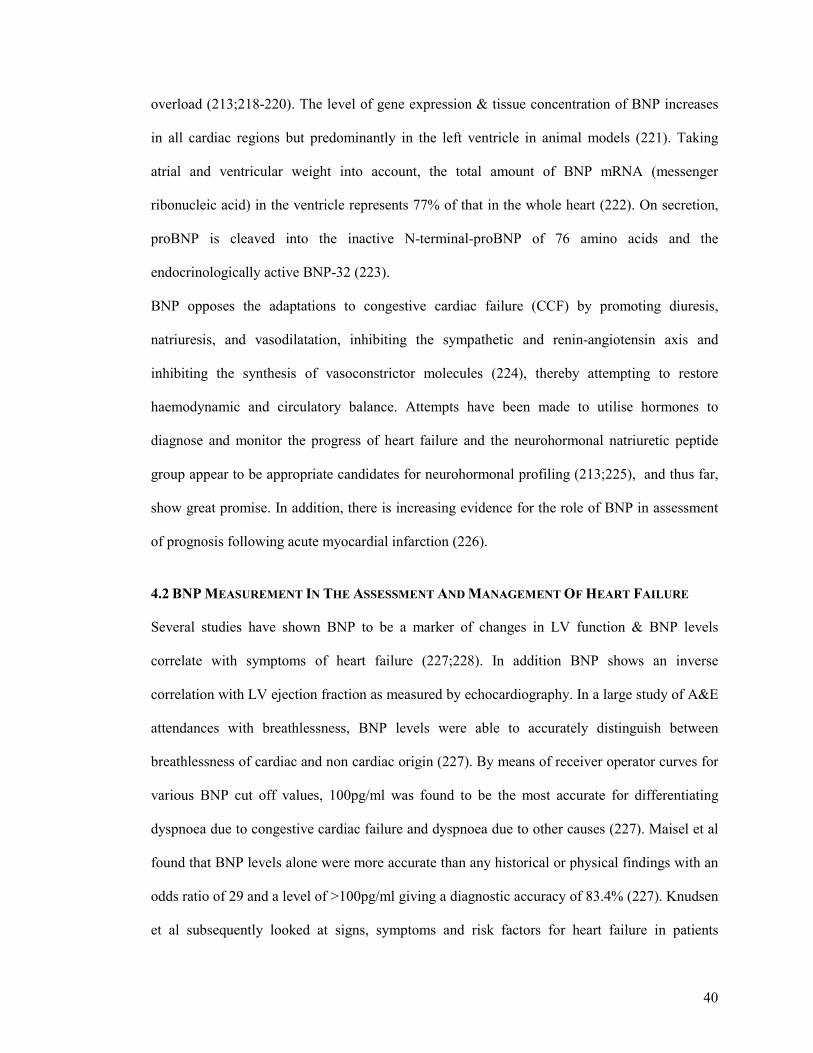
supporting Maisel’s earlier findings (Figure 4.2).
Figure 4.2 Multivariate Predictors Of Heart Failure As A Cause Of Acute Dyspnoea (229). Other work has shown BNP levels to be an independent marker of prognosis in patients
admitted with exacerbations of heart failure (230), and high levels of BNP are associated with
sudden cardiac death in patients with chronic heart failure (231). BNP levels can be monitored
to reflect response to treatment, patients with symptomatic improvement but with persistent
elevation of BNP were at higher risk of adverse cardiac events (232-234). In a prospective
study with symptom guided therapy versus BNP guided therapy the later group had lower rates
of cardiac events over the follow up period (235).
42
4.3 THE ROLE OF NATRIURETIC PEPTIDES IN THE ASSESSMENT AND MANAGEMENT OF
THALASSAEMIA PATIENTS
There are relatively few studies investigating the role of natriuretic peptides in the assessment of
thalassaemia patients. A group from Italy studied levels of atrial natriuretic peptide (ANP) in
asymptomatic thalassaemia major patients and compared them with age matched controls. They
found significantly higher levels of ANP in the thalassaemia major groups compared with
controls (236). Blood transfusion was associated with a significant increase in ANP value (236).
An ANP value greater than 2 standard deviations above the mean value of the control group
correlated with the presence of diastolic dysfunction on Doppler echocardiography(236). This
was the first suggestion that natriuretic peptides may have some utility in assessing patients with
myocardial involvement. At the time of our study there had been no previous work exploring the
utility of BNP in thalassaemia patients.
4.4 BNP OR PRO BNP
On secretion Pro BNP is cleaved into the inactive pro BNP (N Terminal Pro BNP) a 76 amino
acid polypeptide and the endocrinologically active BNP, a 32 amino acid polypeptide. Although
BNP and NT pro BNP are two different peptides they show high correlation in patients with
acute dyspnoea (237-240). The Biosite point of care BNP assay was available 3 years earlier
than the first clinical assay for NT –Pro BNP, therefore it comes as no surprise that the majority
of available evidence and experience is with the BNP assay. Over recent years several studies
have directly compared BNP & NT Pro BNP in patients with acute dyspnoea (237-240). In one
study BNP was superior to NT Pro BNP, the other 3 studies gave similar accuracy. In the one
study favouring BNP, the patients recruited were above the age of 65 (240). The importance of
the clinical experience in an individual institution with one specific marker cannot be
overemphasised. There is no fixed equation to convert from BNP to NT Pro BNP therefore it is
difficult to compare the measures and changing from one marker to the other should be
43
discouraged. Over time 3 other manufacturers have produced systems for BNP evaluation and
one other for NT Pro BNP evaluation. All except the BNP triage meter which is point of care,
are laboratory based systems. Debate continues as to whether to measure BNP or NT pro BNP
and whether to use a point of care or laboratory based system. At the time of designing the study
there was a greater evidence base for BNP assays, and the Biosite Triage meter gave us the
portability that our study required given that it would take place in Cagliari, Sardinia, Italy.
4.5 WHAT LEVEL OF BNP IS SIGNIFICANT
The higher the level of BNP or NT Pro BNP, the higher the probability that the patients
symptoms are caused by heat failure. It has become common place to use 2 cut off values. The
lower value has a high negative predictive value and is used to rule out heart failure. The upper
cut off has a high predictive value to rule in heart failure. For BNP the accepted lower cut off is
100pg/ml with a higher cut off of 400pg/ml. 100 pg/ml has been selected for the lower cut off
given the high accuracy demonstrated in previous studies. These cut offs apply regardless of
patient age or sex (241-243), with the exception of renal impairment with GFR of < 60mls/min
and severe obesity with a BMI of >35 when a lower cut off of 60pg/ml is used (244) to rule out
heart failure and >200pg/ml to rule in heart failure (245;246).
4.6 THE TRIAGE BNP TEST
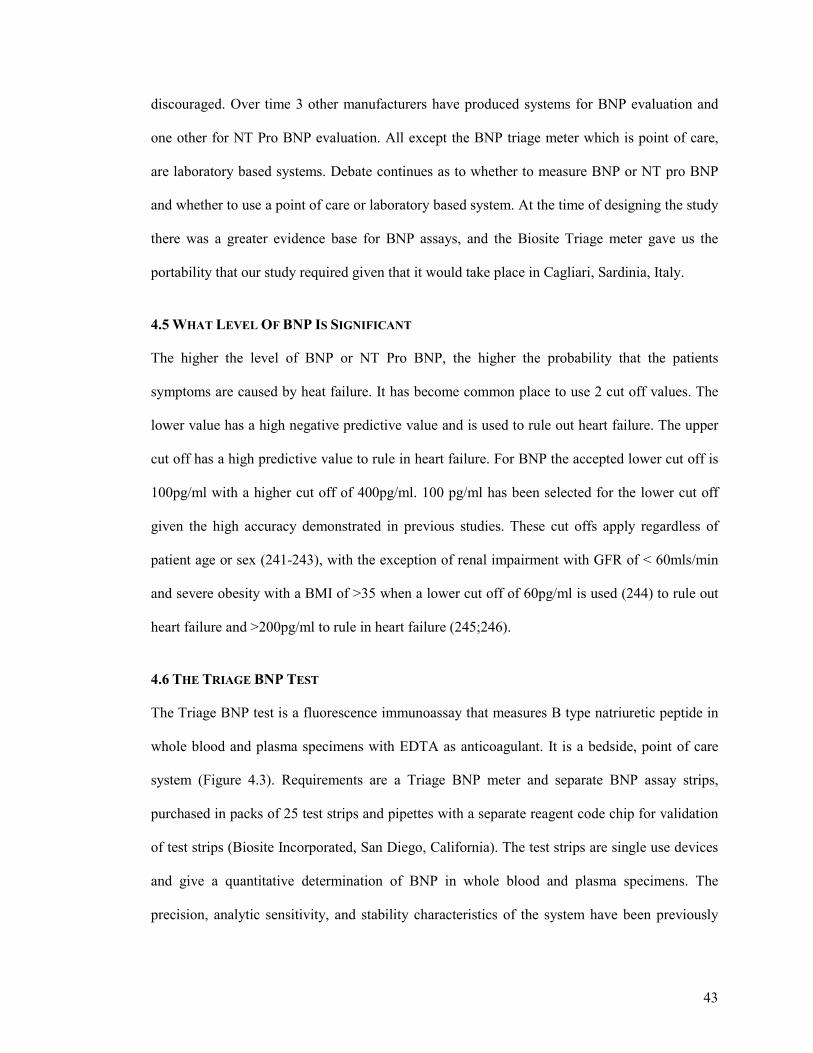
The Triage BNP test is a fluorescence immunoassay that measures B type natriuretic peptide in
whole blood and plasma specimens with EDTA as anticoagulant. It is a bedside, point of care
system (Figure 4.3). Requirements are a Triage BNP meter and separate BNP assay strips,
purchased in packs of 25 test strips and pipettes with a separate reagent code chip for validation
of test strips (Biosite Incorporated, San Diego, California). The test strips are single use devices
and give a quantitative determination of BNP in whole blood and plasma specimens. The
precision, analytic sensitivity, and stability characteristics of the system have been previously
44
described (247;248). The test is used as an aid in diagnosing heart failure in patients age 55 or
older.
Figure 4.3 BNP Triage Meter and Assay Strip
4.7 PRINCIPLES OF THE BNP TEST
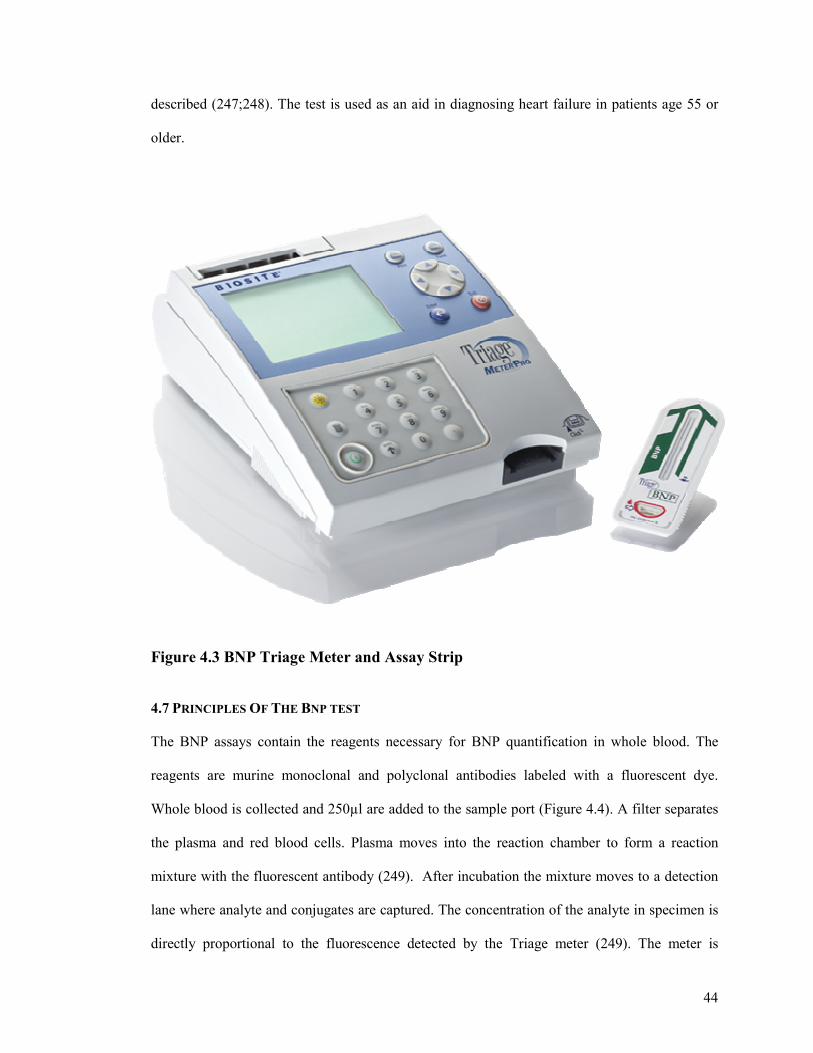
The BNP assays contain the reagents necessary for BNP quantification in whole blood. The
reagents are murine monoclonal and polyclonal antibodies labeled with a fluorescent dye.
Whole blood is collected and 250µl are added to the sample port (Figure 4.4). A filter separates
the plasma and red blood cells. Plasma moves into the reaction chamber to form a reaction
mixture with the fluorescent antibody (249). After incubation the mixture moves to a detection
lane where analyte and conjugates are captured. The concentration of the analyte in specimen is
directly proportional to the fluorescence detected by the Triage meter (249). The meter is
45
programmed to automatically perform the BNP analysis after the sample has reacted with the
reagents. The reaction analysis time is around 15 minutes. The BNP value is displayed on the
LCD screen and printed out.
Figure 4.4 BNP Assay Strip 4.8 TRIAGE METER QUALITY CONTROL
4.8.1 Built In Controls – Each BNP test device contains 2 internal controls that satisfy routine
quality control requirements. These controls check for sufficient sample, fluorescent label in the
detection area, device insertion and device reading by the Triage meter. An invalid result from
either control gives a warning message for the test to be repeated. These controls are performed
with each patient sample.
Use Pipette Provided To Add 250µl Of Blood Here
46
4.8.2 External Quality Controls – The triage meter is supplied with a quality control simulator
device. It is recommended to perform a simulator test daily to ensure correct function of the
Triage meter. In addition it is recommended to perform after moving the meter, upon initial
setup and if any uncertainty over performance.
4.8.3 Triage BNP Controls – This comes as 2 control solutions, one with a low BNP level, the
other a high BNP level. These controls check the performance of the BNP test device. It is
recommended to perform these with each new shipment of BNP device test strips, every 30 days
or to test the performance of the user or device.
4.9 BNP TEST DEVICE STABILITY
BNP assays should be stored refrigerated between 2-8°c. If refrigerated, the test device remains
stable whilst in the sealed pouch until the expiry date printed. On removing from refrigeration,
15 minutes minimum should be allowed for the device to reach room temperature prior to use. If
not refrigerated, unopened pouches can be stored for up to 14 days. Once the device is opened
the blood sample should be added within 15 minutes to avoid too long a period of light
exposure. It is recommended not to open the device until ready for use. The BNP test device
should be inserted into the Triage meter within 3 minutes of the sample being added.
4.10 PURPOSE OF STUDY
With the emergence of the T2* technique there is now an accurate means of assessing cardiac
iron burden and of monitoring the response to intensive iron chelation. However, given the cost
implications and limited availability of this technique there remains a requirement for other
more widely available methods of assessment that are capable of giving a bed-side indication of
early myocardial involvement.
47
Our aim is to investigate the role of BNP and tissue Doppler echocardiography in the
management of transfusion dependent thalassaemia patients. We hypothesise that BNP levels
will increase as the degree of iron loading on cardiac MR increases (corresponding to a decrease
in the T2* score). In addition, for a given degree of myocardial iron overload, changes in BNP
level will correlate with changes in myocardial function, and might therefore be used as a
marker of deteriorating cardiac function and as a marker of response to iron chelation and heart
failure therapies. There are now many assays for evaluation of BNP including the bedside point
of care system used in this study. This makes BNP an ideal choice of biomarker to be
investigated. If a useful relationship is found for BNP, then this could be tremendously useful in
guiding clinicians as to the likelihood of cardiac iron or of cardiac decompensation in those with
known cardiac iron loading.
Tissue Doppler imaging is a new echo modality being increasingly used to assess both systolic
and diastolic function. Data from other cardiac conditions supports its role in the assessment of
cardiac function. TDI can be incorporated into a standard transthoracic echo evaluation, which
many of these patients undergo as part of their standard care. In its simplest form, the
measurement of systolic velocities, the additional time required per study is very small and the
velocities obtained are easy to understand. It therefore seems to be an ideal parameter to look
into. We hypothesise that tissue Doppler velocities may decrease as the level of cardiac iron
increases and that these values may increase again following treatment optimisation and
enhanced iron chelation.
Brain natriuretic peptide estimation and tissue Doppler echocardiography may fulfil this role
enabling the early identification of patients at risk of suffering the cardiac consequences of iron
overload, who may then benefit from aggressive individualised treatment regimes designed to
prevent the development of heart failure.
48
CHAPTER 5: METHODS
5.1 OVERALL STUDY POPULATION
5.1.1 Overall Study Population
This study was performed in collaboration between London, UK and Cagliari, Sardinia as part
of a larger study (250). Patient recruitment was from 12 thalassaemia centers on the island of
Sardinia, with patients undergoing local hematology management but travelling to Cagliari for
the screening and CMR scans. A London-based mobile 1.5-T CMR scanner (Sonata, Siemens,
Erlangen, Germany) with specialized cardiovascular capability was transported 3 times to
Cagliari, Italy, for this research. 167 patients underwent a screening CMR to calculate cardiac
T2*. In addition all screened patients underwent BNP sampling (Biosite Incorporated, San
Diego, California) and a full transthoracic echocardiogram (GE Vivid 7 Pro, GE, Vingmed,
Norway) including tissue Doppler techniques. The study protocol was approved by the ethics
committees in London and Cagliari. Patient information and consent forms were in Italian and
all participants gave written informed consent obtained with the help of local health care
professionals.
5.1.2 Severe Cardiac Iron Loading Cohort
Following screening CMR scans patients were divided into groups on the basis of myocardial
T2*. Those with T2*>20ms (no cardiac iron loading) were excluded from the trial (n=59).
Subjects with severe cardiac siderosis, T2*<8ms (n=22) were also excluded from the
randomization process and were offered best medical treatment, including dual chelation therapy
based on current best clinical practice and at the discretion of their haematologist. This group
with T2*<8ms underwent cardiac MRI assessments at baseline, 6 and 12 months to assess
myocardial and hepatic iron loading (T2*), left ventricular (LV) volumes, and ejection fraction
49
(EF). In addition at baseline, 6 months and 12 months they underwent BNP measurement and
full transthoracic echocardiography including tissue Doppler imaging.
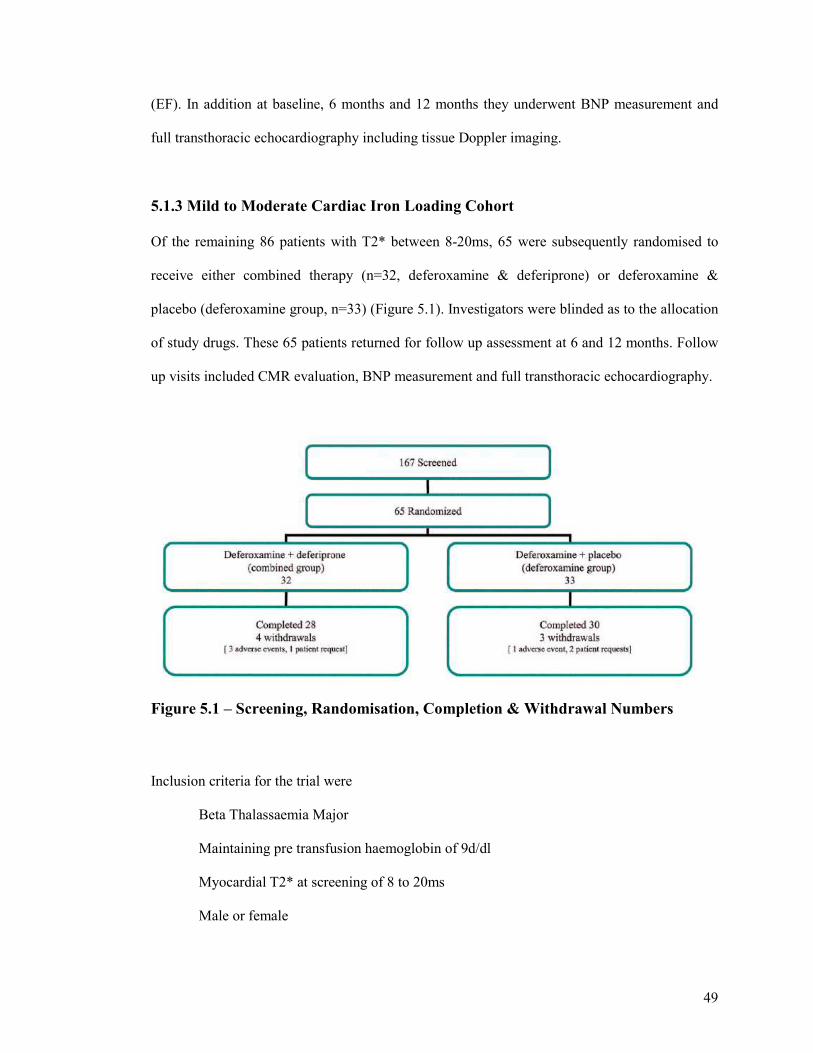
5.1.3 Mild to Moderate Cardiac Iron Loading Cohort
Of the remaining 86 patients with T2* between 8-20ms, 65 were subsequently randomised to
receive either combined therapy (n=32, deferoxamine & deferiprone) or deferoxamine &
placebo (deferoxamine group, n=33) (Figure 5.1). Investigators were blinded as to the allocation
of study drugs. These 65 patients returned for follow up assessment at 6 and 12 months. Follow
up visits included CMR evaluation, BNP measurement and full transthoracic echocardiography.
Figure 5.1 – Screening, Randomisation, Completion & Withdrawal Numbers
Inclusion criteria for the trial were
Beta Thalassaemia Major
Maintaining pre transfusion haemoglobin of 9d/dl
Myocardial T2* at screening of 8 to 20ms
Male or female
50
Age > 18years
Any ejection fraction
Confirmation of effective contraception throughout the trial (both men and women)
Exclusion criteria were as follows
Patients who had previously received deferiprone for a total of more than 6 months over
the last 5 years
Patients with previous reaction to deferiprone
Neutropenia (ANC <1.5 x10⁹/L) at screening
Thrombocytopenia (<50 x109/L) at screening
Liver enzymes > 3 times upper limit of normal
Implant incompatible with MR (such as pacemaker)
Claustrophobia, or other condition making CMR impossible or inadvisable;
Inability to consent
5.2 TRANSTHORACIC ECHOCARDIOGRAPHY PROTOCOL
5.2.1 Echo Dataset
All 167 of the screened patients underwent a full transthoracic echocardiographic examination.
As a large number of patients were scanned over a short time period we had to be selective over
the views, images and measurements obtained. Left ventricular (LV) dimensions were obtained
as global parameters of function. Systolic function was quantified by ejection fraction (EF) from
both M mode (Teicholtz formula) of the parasternal long axis (PLAX) and from modified
Simpsons technique from the apical 4 chamber (4Ch) view. Diastolic function was assessed
from the E:A ratio of the transmitral flow. All imaging was undertaken by Dr Nair & Dr Walker
on a GE Vivid 7 Echo machine (GE Vivid 7 Pro, GE, Vingmed, Norway). Patients were
51
maneuvered into the left lateral position, at a 45 degree angle. Images were acquired during
quiet respiration and patients were requested to breath hold during unforced mid respiration.
This was to minimize variations in image acquisition but was not always possible in view of the
language barrier. For follow up visits at 6 and 12 months all echo studies were performed by Dr
Nair. A standard echo protocol was followed including the following views; PLAX, parasternal
short axis (PSAX) & apical 4Ch. 3 cardiac cycles were recorded from each view. All measures
were made from each of the 3 cardiac cycles and an average taken. From the PLAX view LV
dimensions and M mode EF were calculated. Anatomical M mode was utilized to ensure a
perpendicular cut of the basal LV through the tips of the mitral valve and through the aortic root
and left atrium (LA) in line with standard methodology. Left ventricular diastolic dimension
(LVdD), left ventricular systolic dimension (LVsD) and LA size were measured form leading
edge to leading edge. The maximum LA dimension was obtained at end systole. By Teicholtzs
formula the M mode EF was calculated. From the apical 4 chamber view, where possible, the
following measures were made. Ejection fraction was calculated by uniplane Simpsons method
of summation of discs. LA area was estimated by manual tracing of peak size at end systole in
the apical 4 chamber view. A pulsed wave Doppler sample was placed at the tips of the mitral
valve to quantify the velocity of transmitral blood flow during passive ventricular filling (E
wave, early diastole, passive atrial emptying) and active ventricular filling (A wave, late
diastole, atrial systole). The ratio of E:A gives an indication of diastolic function. Valves were
assessed visually, by Doppler and colour flow imaging. Severity of regurgitant jets were crudely
quantified by visual appearance and size of the jets on colour flow imaging. Right ventricular
(RV) diastolic dimension was measured from the apical 4 Ch view with an internal dimension
from the interventricular septum to the right ventricular free wall, measured at the basal region
just to the ventricular side of the tricuspid valve. The RV free wall function was estimated by
eye. When tricuspid regurgitation was present, continuous wave Doppler was used to determine
the peak velocity of the jet. This value when applied to the modified Bernoulli equation gives
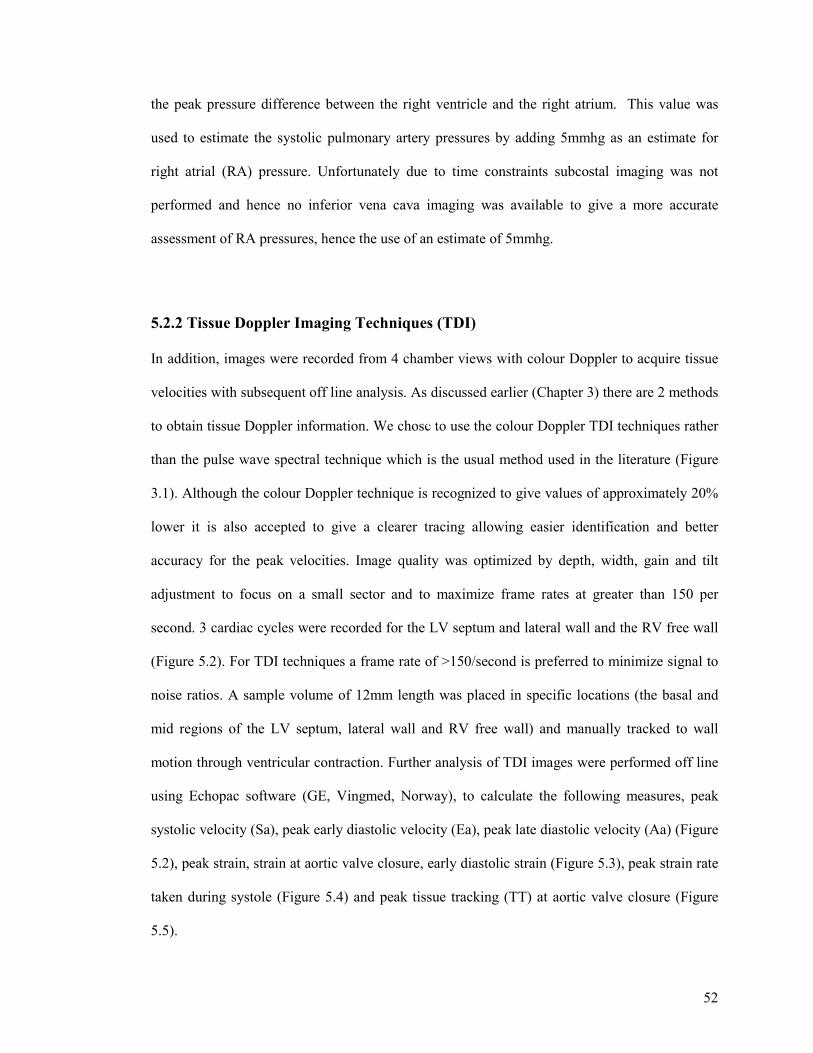
52
the peak pressure difference between the right ventricle and the right atrium. This value was
used to estimate the systolic pulmonary artery pressures by adding 5mmhg as an estimate for
right atrial (RA) pressure. Unfortunately due to time constraints subcostal imaging was not
performed and hence no inferior vena cava imaging was available to give a more accurate
assessment of RA pressures, hence the use of an estimate of 5mmhg.
5.2.2 Tissue Doppler Imaging Techniques (TDI)
In addition, images were recorded from 4 chamber views with colour Doppler to acquire tissue
velocities with subsequent off line analysis. As discussed earlier (Chapter 3) there are 2 methods
to obtain tissue Doppler information. We chose to use the colour Doppler TDI techniques rather
than the pulse wave spectral technique which is the usual method used in the literature (Figure
3.1). Although the colour Doppler technique is recognized to give values of approximately 20%
lower it is also accepted to give a clearer tracing allowing easier identification and better
accuracy for the peak velocities. Image quality was optimized by depth, width, gain and tilt
adjustment to focus on a small sector and to maximize frame rates at greater than 150 per
second. 3 cardiac cycles were recorded for the LV septum and lateral wall and the RV free wall
(Figure 5.2). For TDI techniques a frame rate of >150/second is preferred to minimize signal to
noise ratios. A sample volume of 12mm length was placed in specific locations (the basal and
mid regions of the LV septum, lateral wall and RV free wall) and manually tracked to wall
motion through ventricular contraction. Further analysis of TDI images were performed off line
using Echopac software (GE, Vingmed, Norway), to calculate the following measures, peak
systolic velocity (Sa), peak early diastolic velocity (Ea), peak late diastolic velocity (Aa) (Figure
5.2), peak strain, strain at aortic valve closure, early diastolic strain (Figure 5.3), peak strain rate
taken during systole (Figure 5.4) and peak tissue tracking (TT) at aortic valve closure (Figure
5.5).
TT
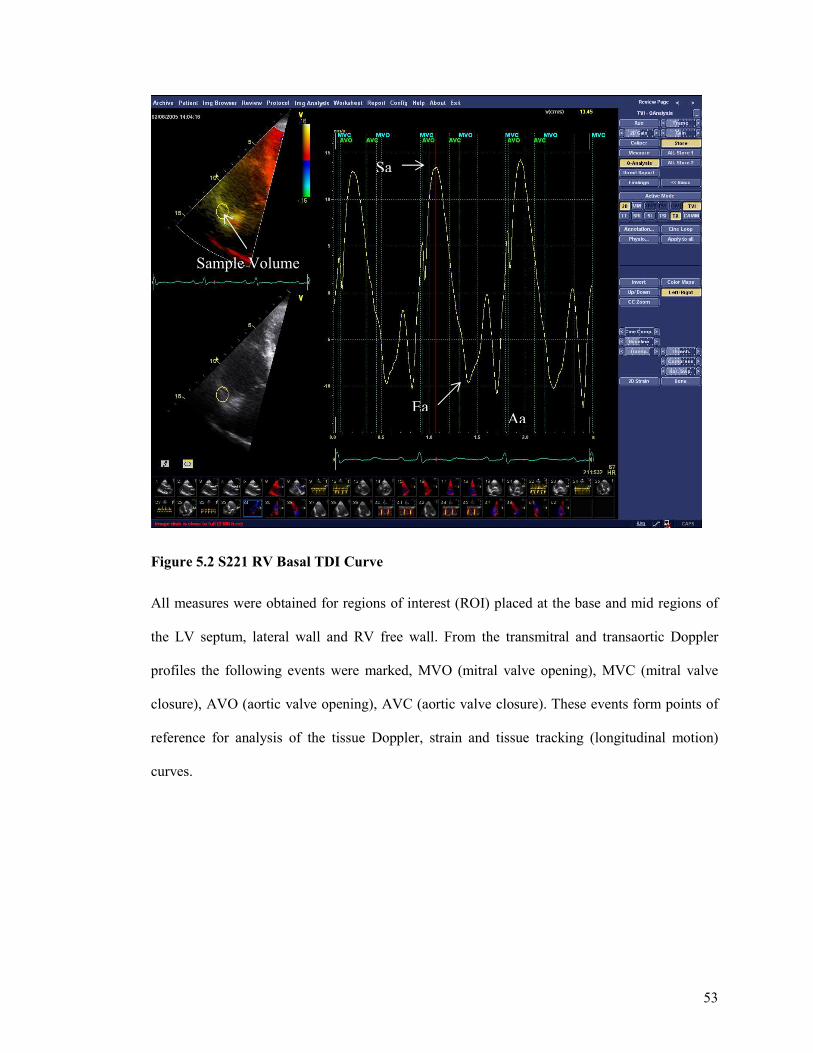
53
Figure 5.2 S221 RV Basal TDI Curve
All measures were obtained for regions of interest (ROI) placed at the base and mid regions of
the LV septum, lateral wall and RV free wall. From the transmitral and transaortic Doppler
profiles the following events were marked, MVO (mitral valve opening), MVC (mitral valve
closure), AVO (aortic valve opening), AVC (aortic valve closure). These events form points of
reference for analysis of the tissue Doppler, strain and tissue tracking (longitudinal motion)
curves.
Sa
Ea Aa
Strain at AV closure
Early Diastolic Strain
Sample Volume
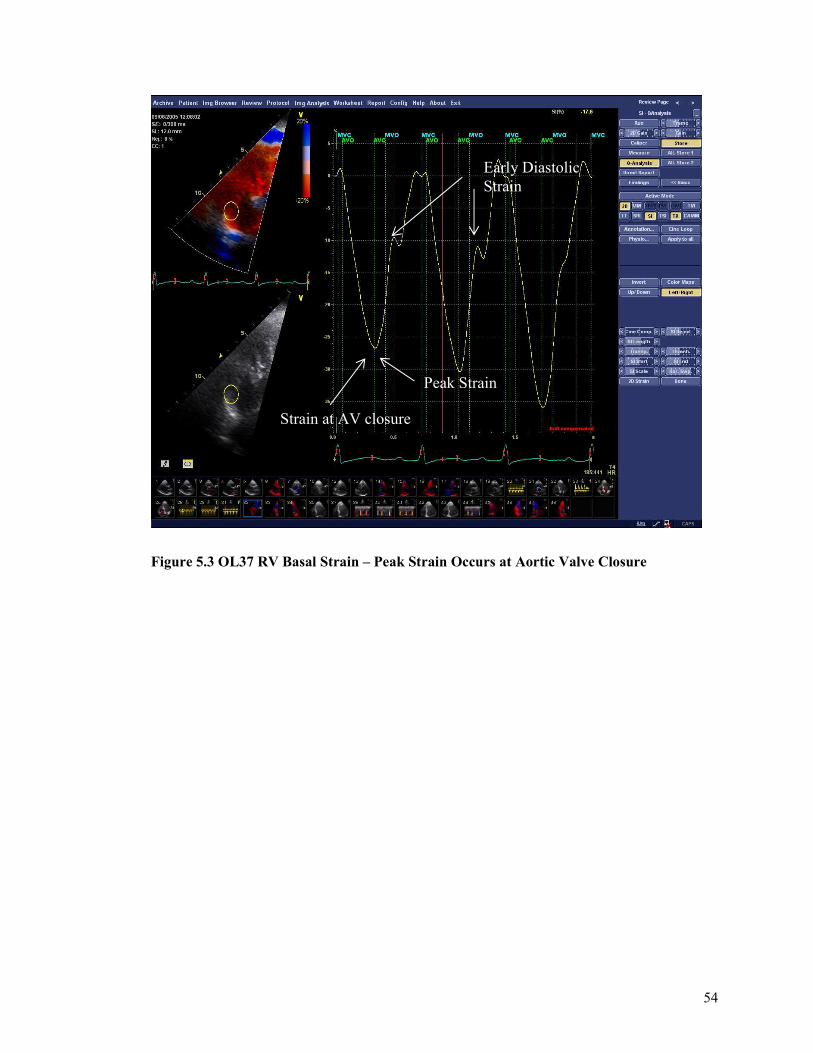
54
Figure 5.3 OL37 RV Basal Strain – Peak Strain Occurs at Aortic Valve Closure
Early Diastolic Strain
Strain at AV closure
Peak Strain
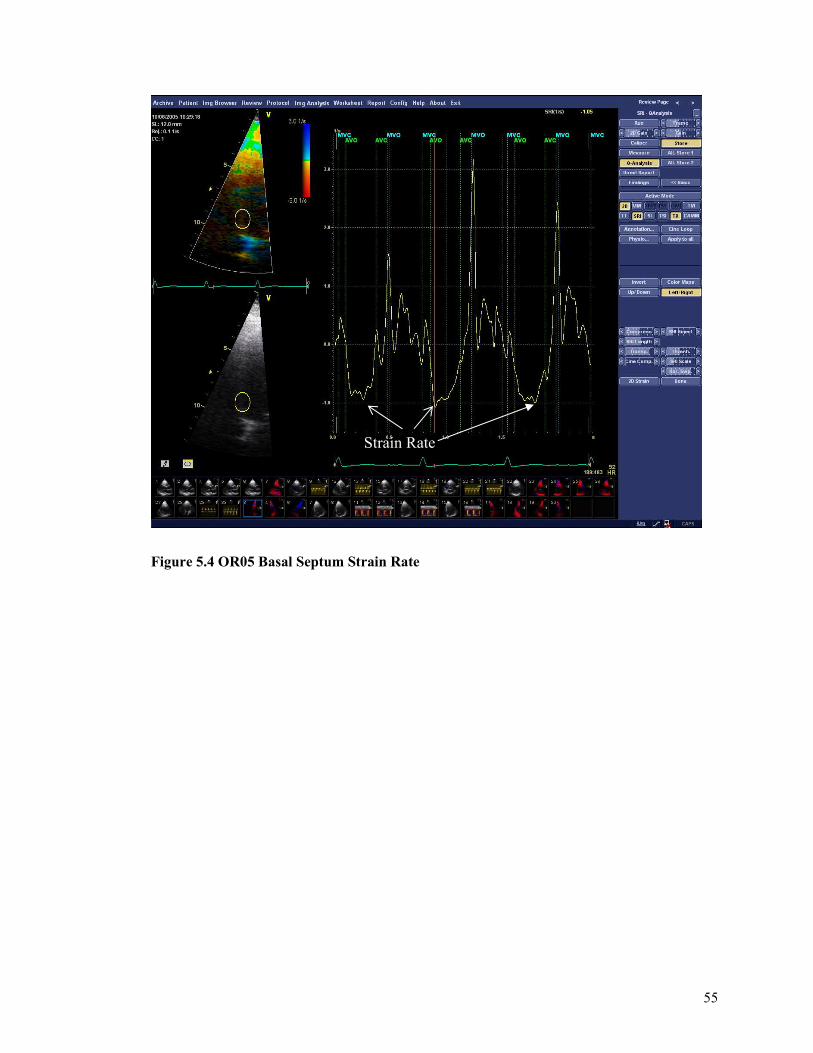
55
Figure 5.4 OR05 Basal Septum Strain Rate
Strain Rate
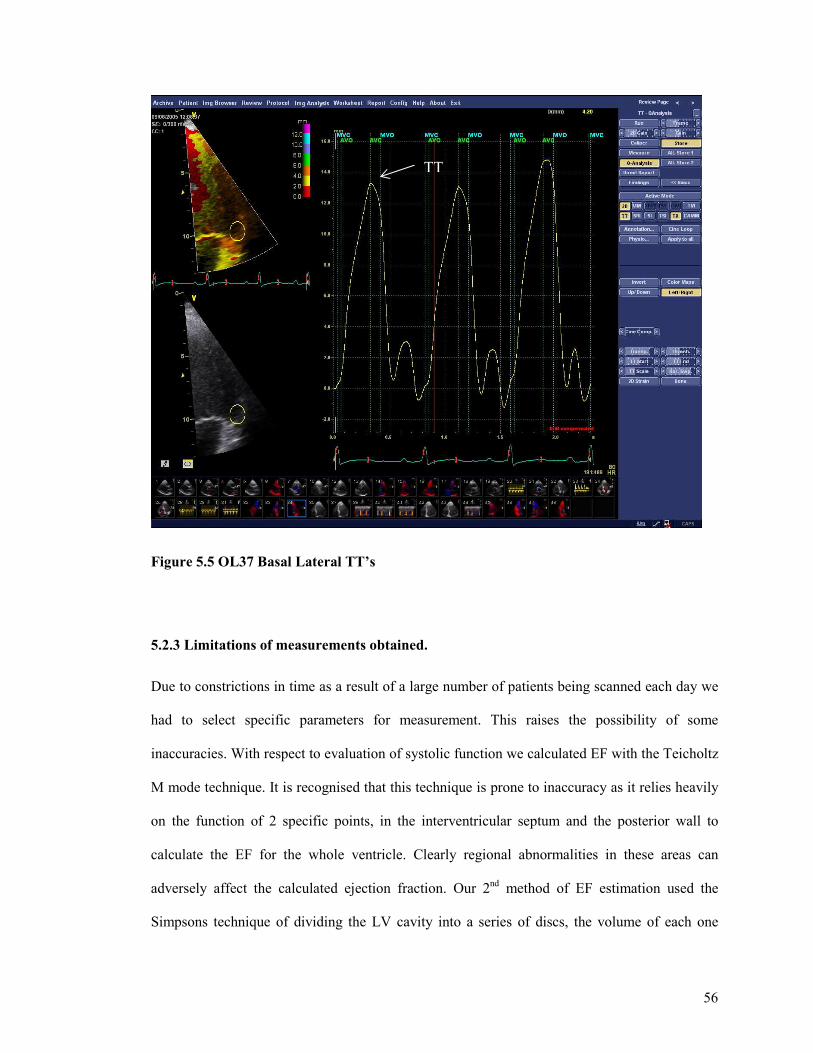
56
Figure 5.5 OL37 Basal Lateral TT’s
5.2.3 Limitations of measurements obtained.
Due to constrictions in time as a result of a large number of patients being scanned each day we
had to select specific parameters for measurement. This raises the possibility of some
inaccuracies. With respect to evaluation of systolic function we calculated EF with the Teicholtz
M mode technique. It is recognised that this technique is prone to inaccuracy as it relies heavily
on the function of 2 specific points, in the interventricular septum and the posterior wall to
calculate the EF for the whole ventricle. Clearly regional abnormalities in these areas can
adversely affect the calculated ejection fraction. Our 2nd method of EF estimation used the
Simpsons technique of dividing the LV cavity into a series of discs, the volume of each one
TT
57
being calculated then summated together. This process is performed in both diastole and systole
and the difference in cavity volumes is used to generate the ejection fraction. Simpsons
estimation is considered much more accurate than the M mode technique and uses a similar
methodology to that used for volume and function assessment with cardiac MRI (the gold
standard for volume and EF calculation). However, the preferred technique uses a biplane
method with apical 4 chamber and 2 chamber volume calculations to maintain accuracy. Again,
with time constraints we were limited to apical 4 chamber images only. When assessing left
ventricular diastolic function we chose not to use some of the accepted measures of diastolic
impairment in favour of others. There remains a great deal of uncertainty regarding the optimal
measures of diastolic function and a number of the measures are unreliable as they depend of
preload. We used transmitral E:A ratio which although dependant on preload is perhaps the most
commonly used measure and widely understood in terms of both what is being measured and its
limitations. We chose to use tissue Doppler techniques to measure the diastolic velocities (Ea &
Aa) and to calculate the E/E’ (E/Ea) ratio rather than pulmonary vein Doppler techniques. We
felt this was an acceptable compromise as the tissue Doppler diastolic measures can be obtained
in virtually all subjects whereas pulmonary vein Dopplers are subject to good quality imaging of
the pulmonary veins, which may be suboptimal in a proportion of patients.
5.2.4 Reproducibility Studies
A number of patients were selected for reproducibility studies. Tissue Doppler velocities, strain,
strain rate and longitudinal displacemt were calculated, then recalculated by the same operator,
blinded to the first set of results for intraobsever variability. The data was then reanalyzed by a
second operator, again blinded to the first set of results for interobserver variability. The results
were compared to calculate the observer variability.
58
5.3 BRAIN NATRIURETIC PEPTIDE (BNP) PROTOCOL
5.3.1 BNP Sampling And Analysis
BNP levels were obtained from whole blood for each patient at each of the assessment visits.
Patients were rested for at least 30 minutes prior to blood sampling. An EDTA specimen tube
was used in accordance with the manufacturer instructions. Blood was analysed within 4 hours
of being taken. Using the pipette provided, 250ul of whole blood is added to the sample port of
the BNP assay strip. The whole blood reacts with the fluorescent labelled antibody over a short
period. After the period of incubation and reaction which takes 15 minutes, the assay strip is
inserted into the Triage meter and read. The BNP value is displayed on the screen. We
transported 2 BNP Triage meters from London to Cagliari, Sardinia for each of the 3 visits. The
BNP assay strips were obtained from the UK Biosite headquarters in Belfast. The assay strips
were flown out on dry ice (to maintain optimum temperature) to the Ospendale Micocittemi
where the study took place. Upon arrival they were refrigerated and kept between 2 to 8 degrees
celsius
5.3.2 Calibration & Validation Tests
Control assays were performed on both triage meters prior to each Cagliari visit and with each
new batch of BNP test devices. Daily quality control tests were performed with the simulator.
Some samples were analysed twice in the same triage meter, others samples were analysed twice
in different triage meters for consistency of results.
5.3.3 BNP Levels Before And After Blood Transfusion
We planned to look at the effect of blood transfusion on levels of BNP. We proposed that
although in some cases cardiac iron infiltration may not have affected the BNP level at rest it
59
would cause some subtle cardiac dysfunction. A volume challenge, such as with planned blood
transfusions may cause a transient elevation in BNP levels, therefore unmasking evidence of
cardiac dysfunction. The half life of BNP is 18 minutes. We took blood for BNP assays
immediately at the end of the blood transfusion, then after 18 minutes and each 18 minutes
thereafter for 5 half lives. A further assay was taken at 24 hours.
5.4 CARDIAC MAGNETIC RESONANCE IMAGING PROTOCOL
CMR was performed at baseline and after 6 and 12 months of treatment. Myocardial T2* was
assessed with the use of a single breath-hold multiecho technique that can be completed in 5
minutes, as previously described (251). In brief, a single 10-mm-thick short-axis midventricular
slice of the LV was acquired at 8 echo times (2.6 to 16.7 ms, with 2.02-ms increments) with
standard shimming in a single breath-hold. For analysis, a full-thickness region of interest was
chosen in the LV septum. The signal intensity of this region was measured for each image with
the use of in-house designed software (CMR tools, Cardiovascular Imaging Solutions, London,
UK). Ventricular volumes were determined with the use of steady state free precession cines,
with contiguous short-axis slices from base to apex, as previously described (252). Ventricular
volumes were also analyzed with the use of CMR tools.
5.5 STATISTICS & ANALYSIS
SPSS v 14 was used for all statistical analysis. A P value of <0.05 was deemed statistically
significant. We used Spearmans rank correlation, unpaired T test for comparisons between
groups and paired T test for comparisons across time. The baseline cohort data was analysed to
determine which standard parameters correlated well with the cardiac T2* from MRI. The
baseline cohort were divided into groups according to the cardiac T2* score as detailed in
60
sections 2.11 and 5.1.2. Echo parameters were compared across groups to establish which
parameters could help differentiate the severity of cardiac iron loading. At the end of 12 months
the patients codes were unlocked to reveal treatment allocations. The treatment groups were
compared across the study duration to establish which echo measures improve with
improvement in cardiac T2*. These measures could be useful for risk stratification in countries
where cardiac T2* MRI is not widely available. All echo measures were made with the
observers blinded to which therapies each patient received. Only at the stage when comparisons
were made for the trial group across the 12 month treatment period were the codes unlocked and
the observers able to identify which patients received the combination therapy and which
received desferioxamine plus placebo.
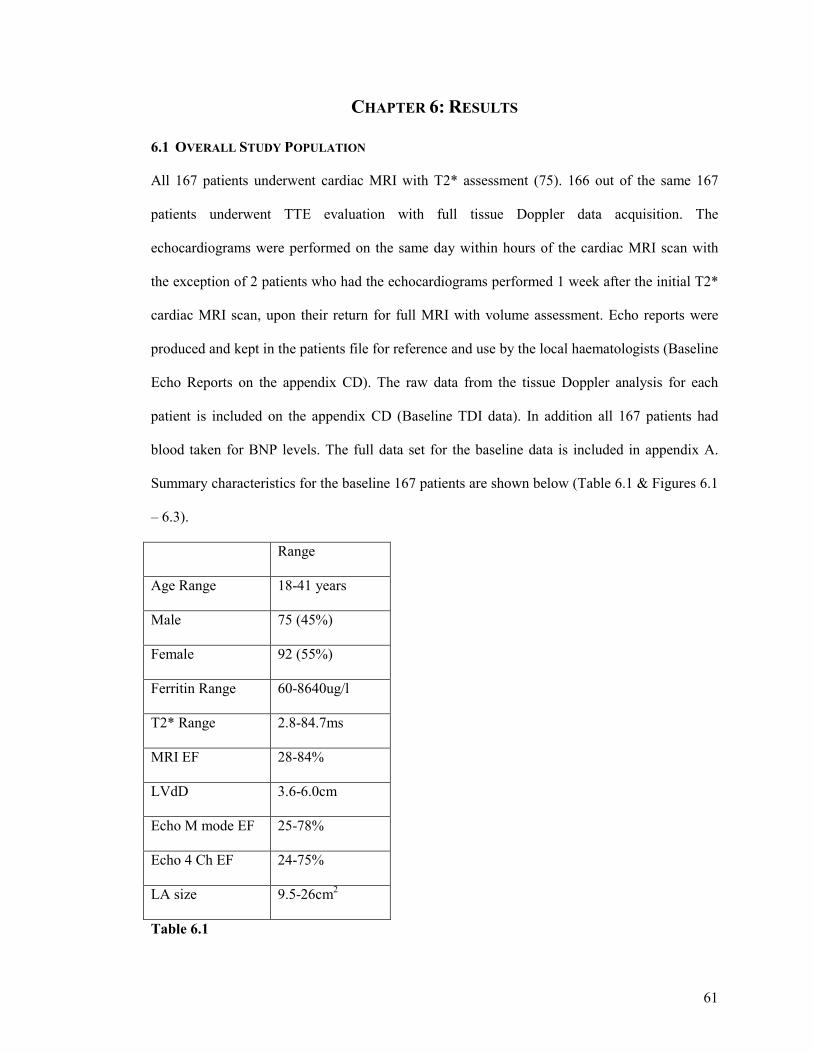
61
CHAPTER 6: RESULTS
6.1 OVERALL STUDY POPULATION
All 167 patients underwent cardiac MRI with T2* assessment (75). 166 out of the same 167
patients underwent TTE evaluation with full tissue Doppler data acquisition. The
echocardiograms were performed on the same day within hours of the cardiac MRI scan with
the exception of 2 patients who had the echocardiograms performed 1 week after the initial T2*
cardiac MRI scan, upon their return for full MRI with volume assessment. Echo reports were
produced and kept in the patients file for reference and use by the local haematologists (Baseline
Echo Reports on the appendix CD). The raw data from the tissue Doppler analysis for each
patient is included on the appendix CD (Baseline TDI data). In addition all 167 patients had
blood taken for BNP levels. The full data set for the baseline data is included in appendix A.
Summary characteristics for the baseline 167 patients are shown below (Table 6.1 & Figures 6.1
– 6.3).
Range
Age Range 18-41 years
Male 75 (45%)
Female 92 (55%)
Ferritin Range 60-8640ug/l
T2* Range 2.8-84.7ms
MRI EF 28-84%
LVdD 3.6-6.0cm
Echo M mode EF 25-78%
Echo 4 Ch EF 24-75%
LA size 9.5-26cm2
Table 6.1
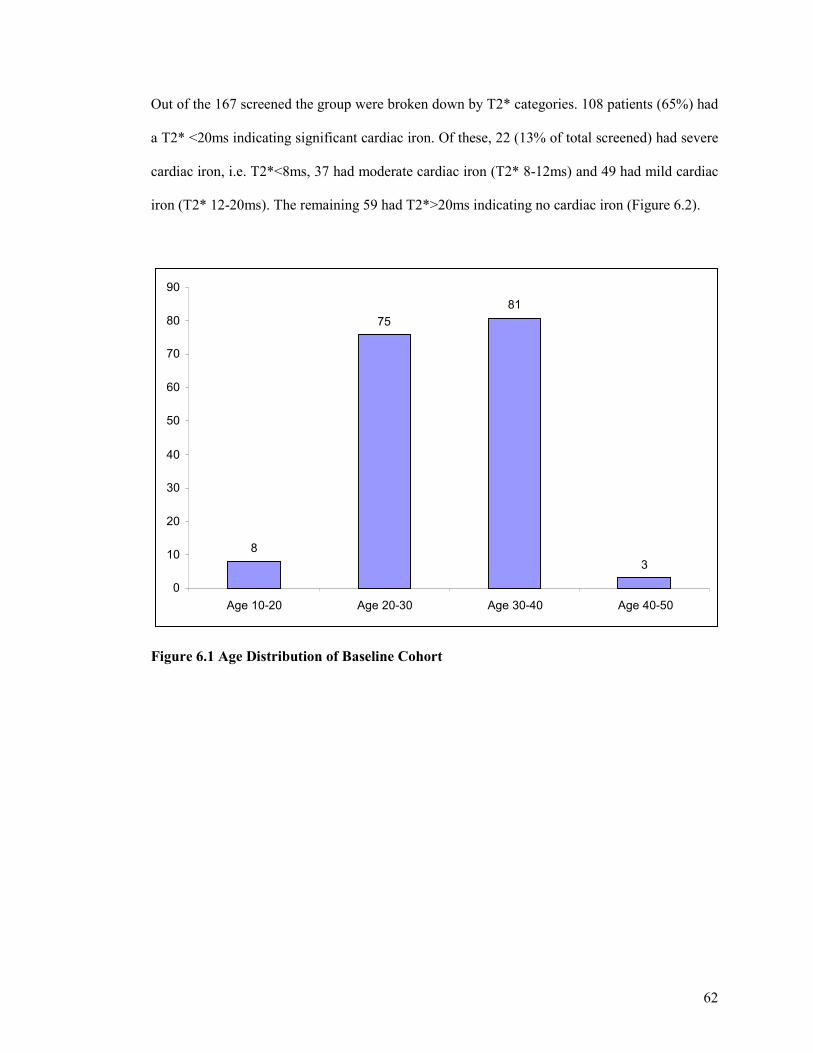
62
Out of the 167 screened the group were broken down by T2* categories. 108 patients (65%) had
a T2* <20ms indicating significant cardiac iron. Of these, 22 (13% of total screened) had severe
cardiac iron, i.e. T2*<8ms, 37 had moderate cardiac iron (T2* 8-12ms) and 49 had mild cardiac
iron (T2* 12-20ms). The remaining 59 had T2*>20ms indicating no cardiac iron (Figure 6.2).
Figure 6.1 Age Distribution of Baseline Cohort
8
75 81
3
0
10
20
30
40
50
60
70
80
90
Age 10-20 Age 20-30 Age 30-40 Age 40-50
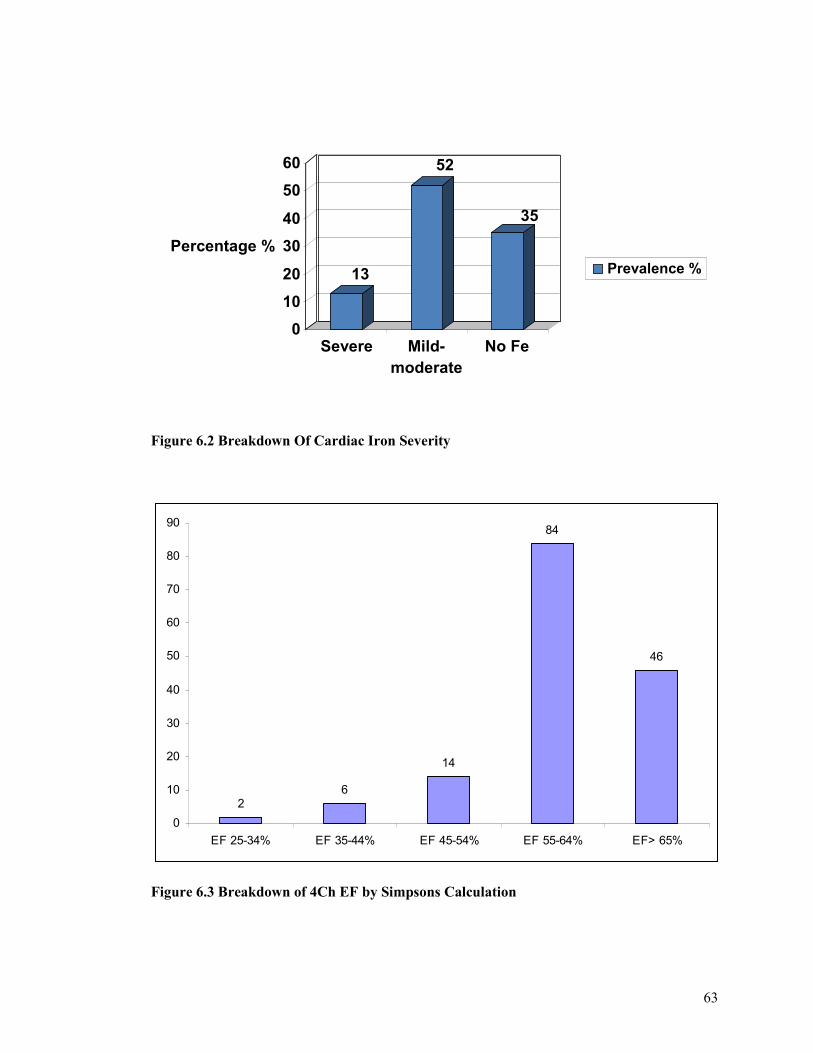
63
Figure 6.2 Breakdown Of Cardiac Iron Severity
26
14
84
46
0
10
20
30
40
50
60
70
80
90
EF 25-34% EF 35-44% EF 45-54% EF 55-64% EF> 65%
Figure 6.3 Breakdown of 4Ch EF by Simpsons Calculation
13
52
35
0
10
20
30
40
50
60
Percentage %
Severe Mild-moderate
No Fe
Prevalence %
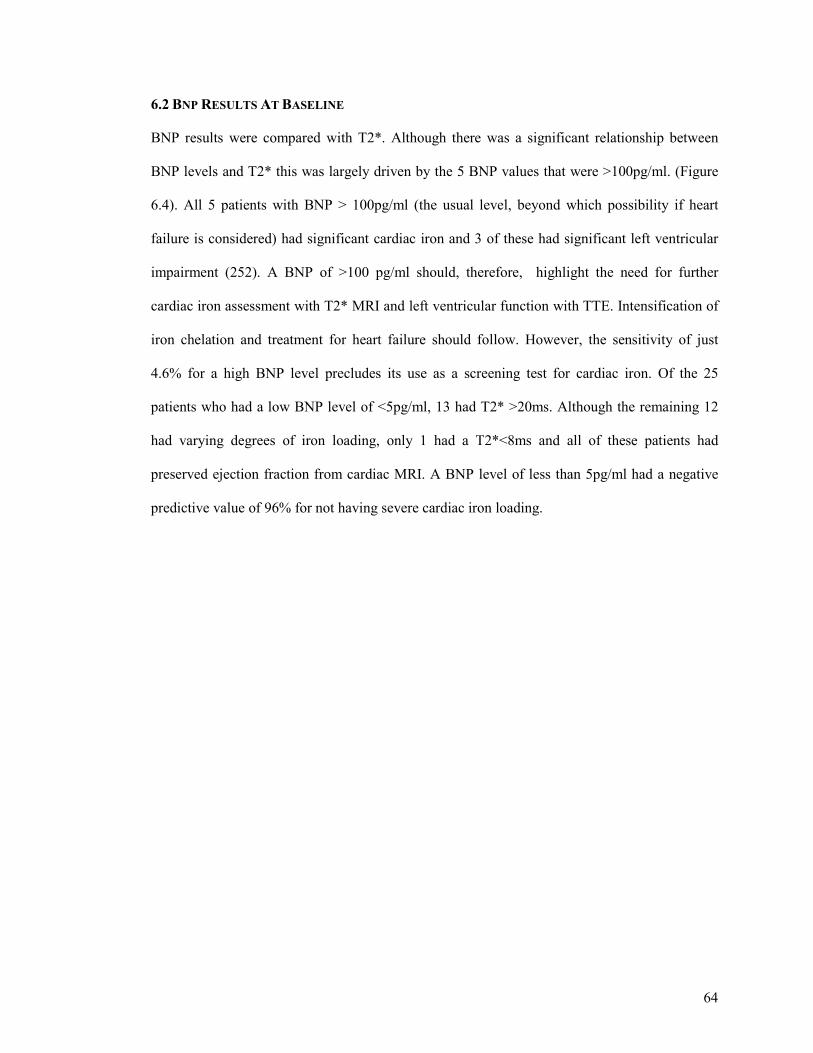
64
6.2 BNP RESULTS AT BASELINE
BNP results were compared with T2*. Although there was a significant relationship between
BNP levels and T2* this was largely driven by the 5 BNP values that were >100pg/ml. (Figure
6.4). All 5 patients with BNP > 100pg/ml (the usual level, beyond which possibility if heart
failure is considered) had significant cardiac iron and 3 of these had significant left ventricular
impairment (252). A BNP of >100 pg/ml should, therefore, highlight the need for further
cardiac iron assessment with T2* MRI and left ventricular function with TTE. Intensification of
iron chelation and treatment for heart failure should follow. However, the sensitivity of just
4.6% for a high BNP level precludes its use as a screening test for cardiac iron. Of the 25
patients who had a low BNP level of <5pg/ml, 13 had T2* >20ms. Although the remaining 12
had varying degrees of iron loading, only 1 had a T2*<8ms and all of these patients had
preserved ejection fraction from cardiac MRI. A BNP level of less than 5pg/ml had a negative
predictive value of 96% for not having severe cardiac iron loading.
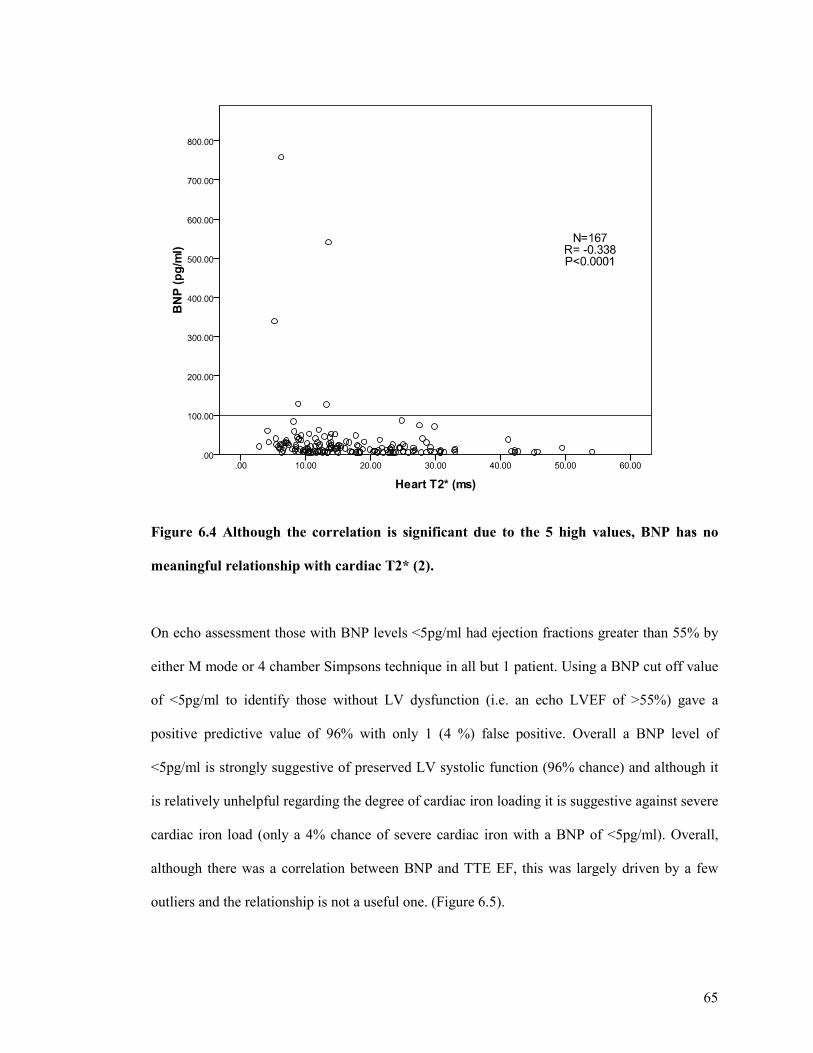
65
Figure 6.4 Although the correlation is significant due to the 5 high values, BNP has no
meaningful relationship with cardiac T2* (2).
On echo assessment those with BNP levels <5pg/ml had ejection fractions greater than 55% by
either M mode or 4 chamber Simpsons technique in all but 1 patient. Using a BNP cut off value
of <5pg/ml to identify those without LV dysfunction (i.e. an echo LVEF of >55%) gave a
positive predictive value of 96% with only 1 (4 %) false positive. Overall a BNP level of
<5pg/ml is strongly suggestive of preserved LV systolic function (96% chance) and although it
is relatively unhelpful regarding the degree of cardiac iron loading it is suggestive against severe
cardiac iron load (only a 4% chance of severe cardiac iron with a BNP of <5pg/ml). Overall,
although there was a correlation between BNP and TTE EF, this was largely driven by a few
outliers and the relationship is not a useful one. (Figure 6.5).
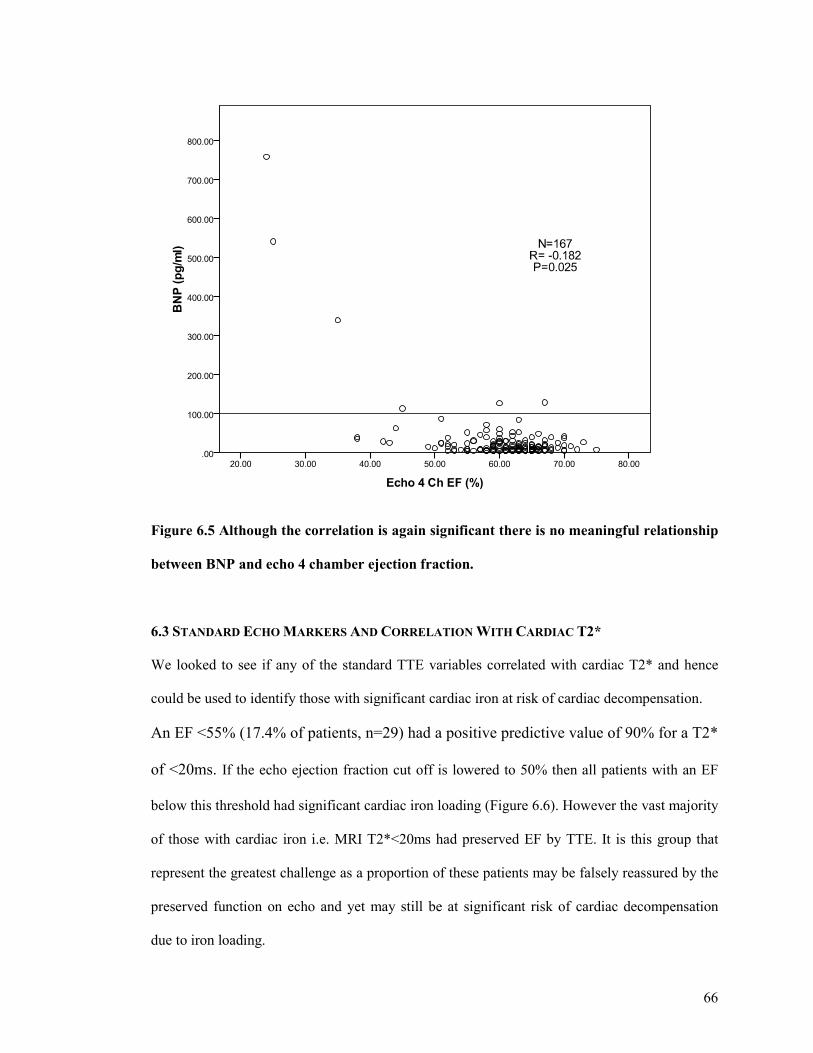
66
Figure 6.5 Although the correlation is again significant there is no meaningful relationship
between BNP and echo 4 chamber ejection fraction.
6.3 STANDARD ECHO MARKERS AND CORRELATION WITH CARDIAC T2*
We looked to see if any of the standard TTE variables correlated with cardiac T2* and hence
could be used to identify those with significant cardiac iron at risk of cardiac decompensation.
An EF <55% (17.4% of patients, n=29) had a positive predictive value of 90% for a T2*
of <20ms. If the echo ejection fraction cut off is lowered to 50% then all patients with an EF
below this threshold had significant cardiac iron loading (Figure 6.6). However the vast majority
of those with cardiac iron i.e. MRI T2*<20ms had preserved EF by TTE. It is this group that
represent the greatest challenge as a proportion of these patients may be falsely reassured by the
preserved function on echo and yet may still be at significant risk of cardiac decompensation
due to iron loading.
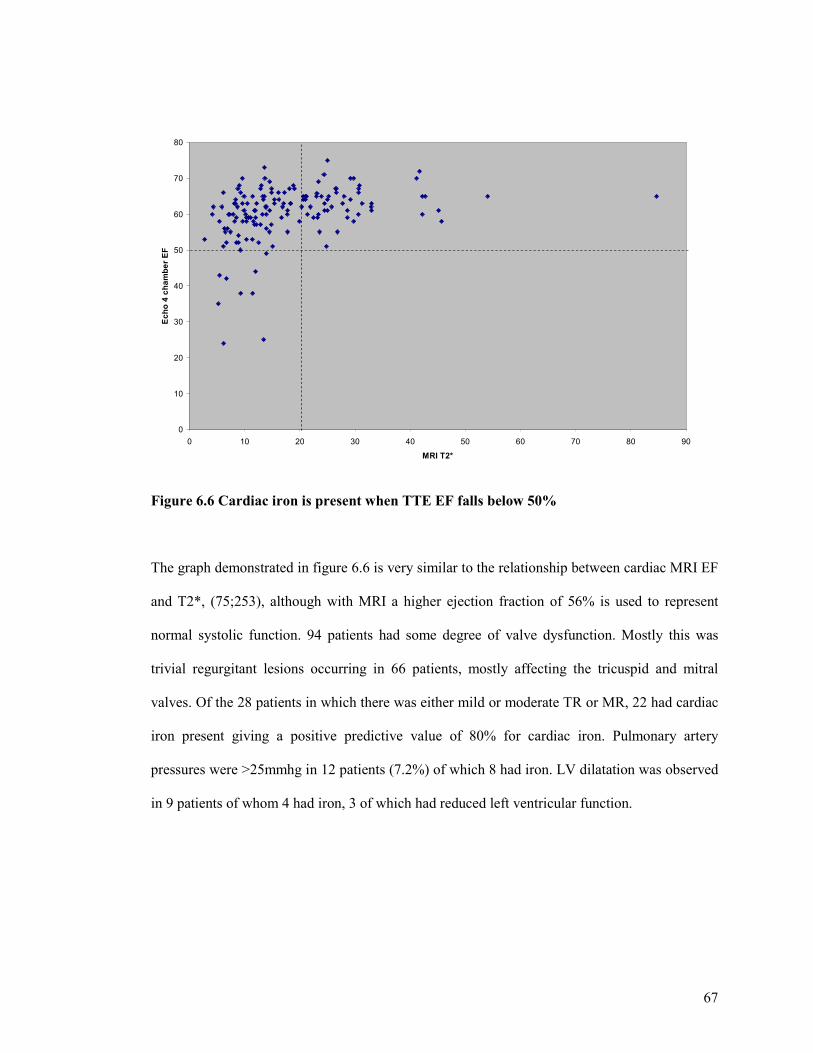
67
0
10
20
30
40
50
60
70
80
0 10 20 30 40 50 60 70 80 90
MRI T2*
Ech
o 4
ch
amb
er E
F
Figure 6.6 Cardiac iron is present when TTE EF falls below 50%
The graph demonstrated in figure 6.6 is very similar to the relationship between cardiac MRI EF
and T2*, (75;253), although with MRI a higher ejection fraction of 56% is used to represent
normal systolic function. 94 patients had some degree of valve dysfunction. Mostly this was
trivial regurgitant lesions occurring in 66 patients, mostly affecting the tricuspid and mitral
valves. Of the 28 patients in which there was either mild or moderate TR or MR, 22 had cardiac
iron present giving a positive predictive value of 80% for cardiac iron. Pulmonary artery
pressures were >25mmhg in 12 patients (7.2%) of which 8 had iron. LV dilatation was observed
in 9 patients of whom 4 had iron, 3 of which had reduced left ventricular function.
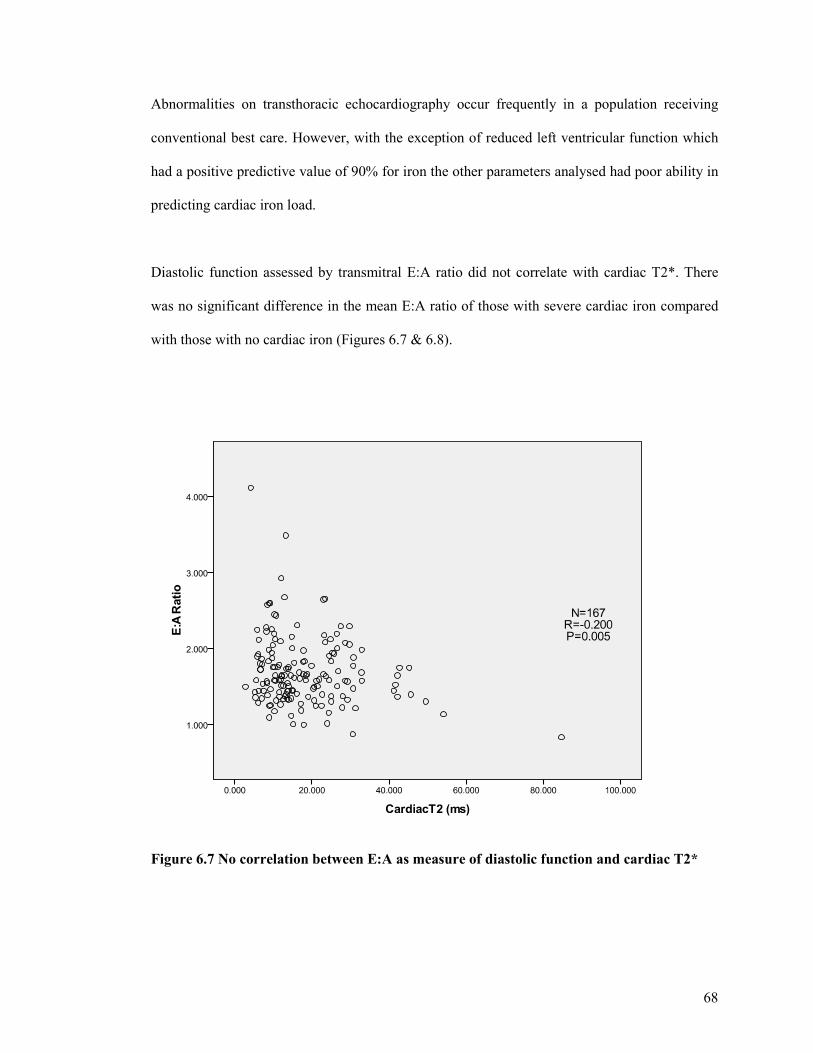
68
Abnormalities on transthoracic echocardiography occur frequently in a population receiving
conventional best care. However, with the exception of reduced left ventricular function which
had a positive predictive value of 90% for iron the other parameters analysed had poor ability in
predicting cardiac iron load.
Diastolic function assessed by transmitral E:A ratio did not correlate with cardiac T2*. There
was no significant difference in the mean E:A ratio of those with severe cardiac iron compared
with those with no cardiac iron (Figures 6.7 & 6.8).
Figure 6.7 No correlation between E:A as measure of diastolic function and cardiac T2*
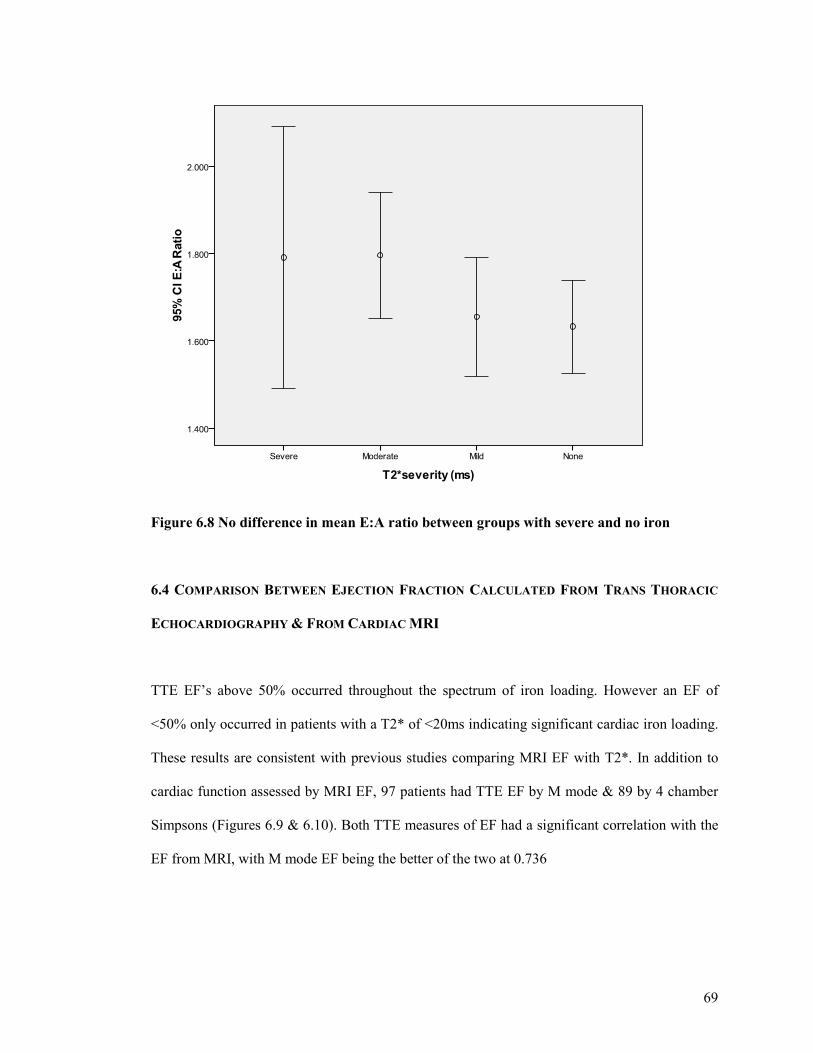
69
Figure 6.8 No difference in mean E:A ratio between groups with severe and no iron
6.4 COMPARISON BETWEEN EJECTION FRACTION CALCULATED FROM TRANS THORACIC
ECHOCARDIOGRAPHY & FROM CARDIAC MRI
TTE EF’s above 50% occurred throughout the spectrum of iron loading. However an EF of
<50% only occurred in patients with a T2* of <20ms indicating significant cardiac iron loading.
These results are consistent with previous studies comparing MRI EF with T2*. In addition to
cardiac function assessed by MRI EF, 97 patients had TTE EF by M mode & 89 by 4 chamber
Simpsons (Figures 6.9 & 6.10). Both TTE measures of EF had a significant correlation with the
EF from MRI, with M mode EF being the better of the two at 0.736
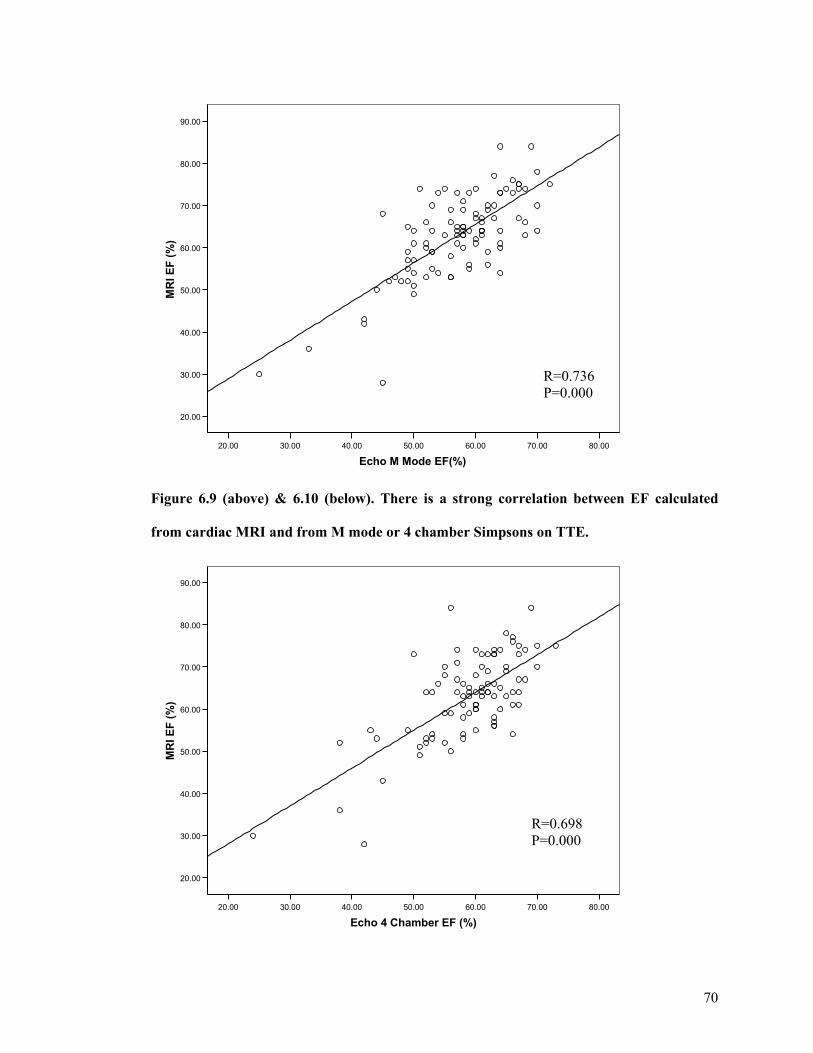
70
80.0070.0060.0050.0040.0030.0020.00
Echo M Mode EF(%)
90.00
80.00
70.00
60.00
50.00
40.00
30.00
20.00
MR
I EF
(%
)
Figure 6.9 (above) & 6.10 (below). There is a strong correlation between EF calculated
from cardiac MRI and from M mode or 4 chamber Simpsons on TTE.
80.0070.0060.0050.0040.0030.0020.00
Echo 4 Chamber EF (%)
90.00
80.00
70.00
60.00
50.00
40.00
30.00
20.00
MR
I EF
(%
)
R=0.736 P=0.000
R=0.698 P=0.000
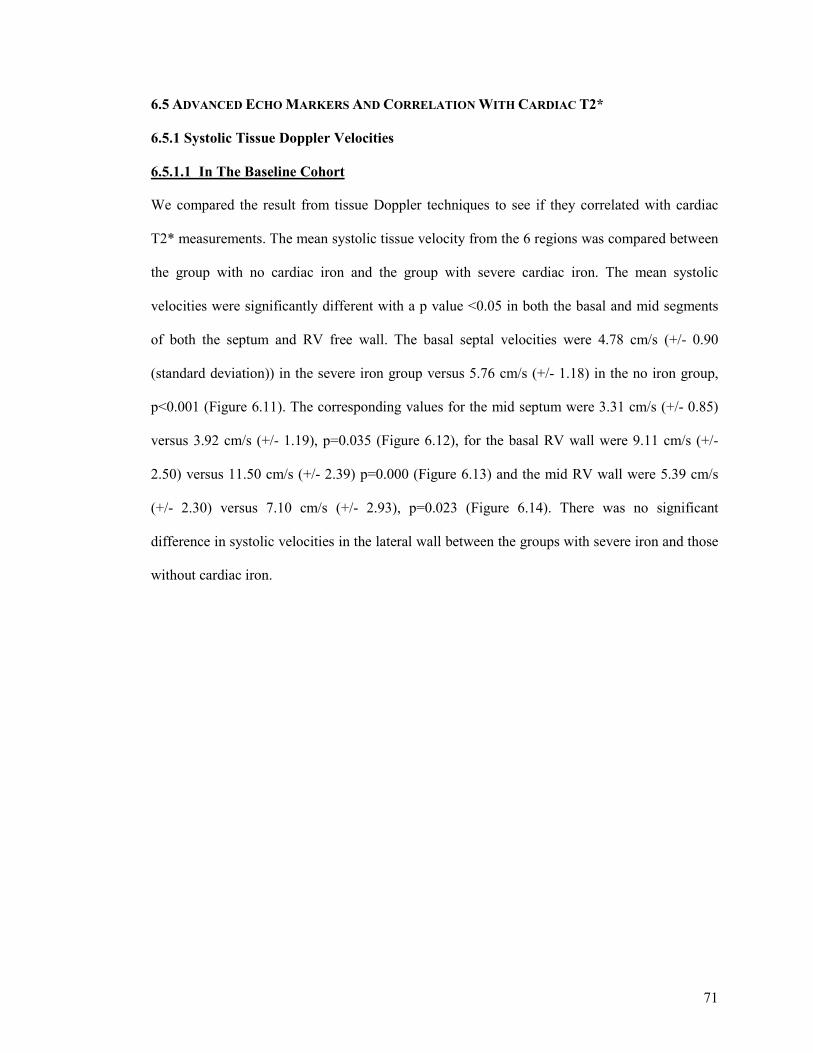
71
6.5 ADVANCED ECHO MARKERS AND CORRELATION WITH CARDIAC T2*
6.5.1 Systolic Tissue Doppler Velocities
6.5.1.1 In The Baseline Cohort
We compared the result from tissue Doppler techniques to see if they correlated with cardiac
T2* measurements. The mean systolic tissue velocity from the 6 regions was compared between
the group with no cardiac iron and the group with severe cardiac iron. The mean systolic
velocities were significantly different with a p value <0.05 in both the basal and mid segments
of both the septum and RV free wall. The basal septal velocities were 4.78 cm/s (+/- 0.90
(standard deviation)) in the severe iron group versus 5.76 cm/s (+/- 1.18) in the no iron group,
p<0.001 (Figure 6.11). The corresponding values for the mid septum were 3.31 cm/s (+/- 0.85)
versus 3.92 cm/s (+/- 1.19), p=0.035 (Figure 6.12), for the basal RV wall were 9.11 cm/s (+/-
2.50) versus 11.50 cm/s (+/- 2.39) p=0.000 (Figure 6.13) and the mid RV wall were 5.39 cm/s
(+/- 2.30) versus 7.10 cm/s (+/- 2.93), p=0.023 (Figure 6.14). There was no significant
difference in systolic velocities in the lateral wall between the groups with severe iron and those
without cardiac iron.
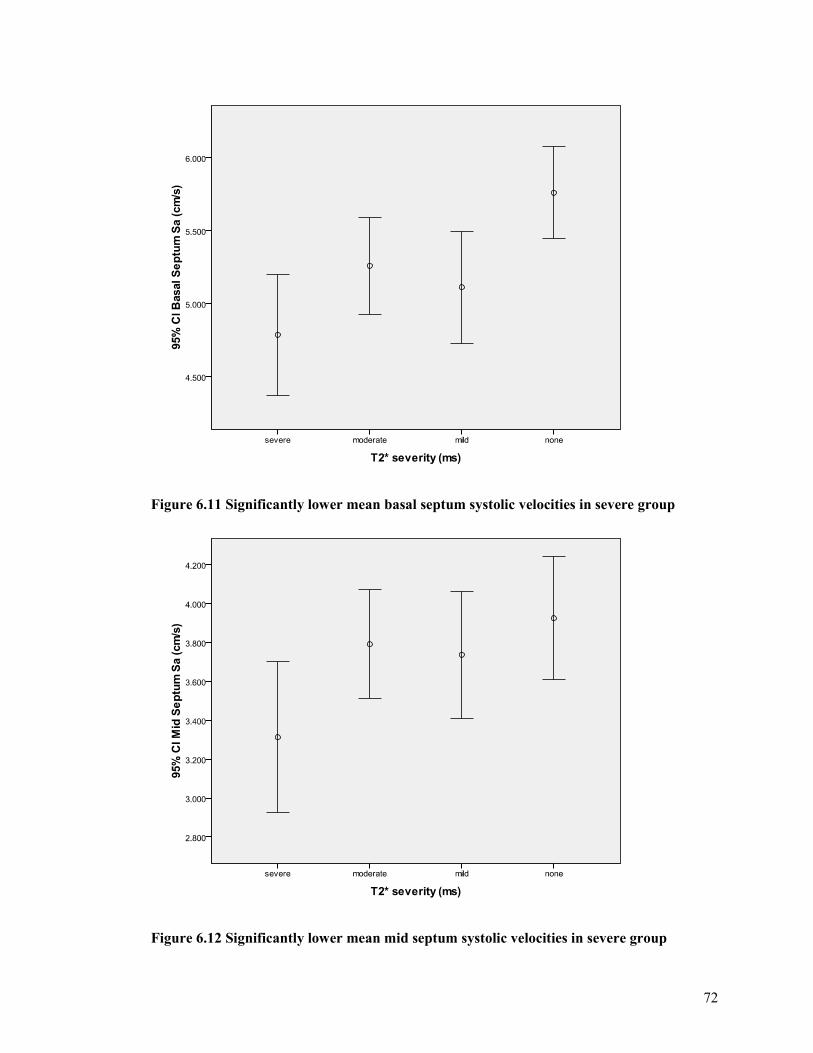
72
Figure 6.11 Significantly lower mean basal septum systolic velocities in severe group
Figure 6.12 Significantly lower mean mid septum systolic velocities in severe group
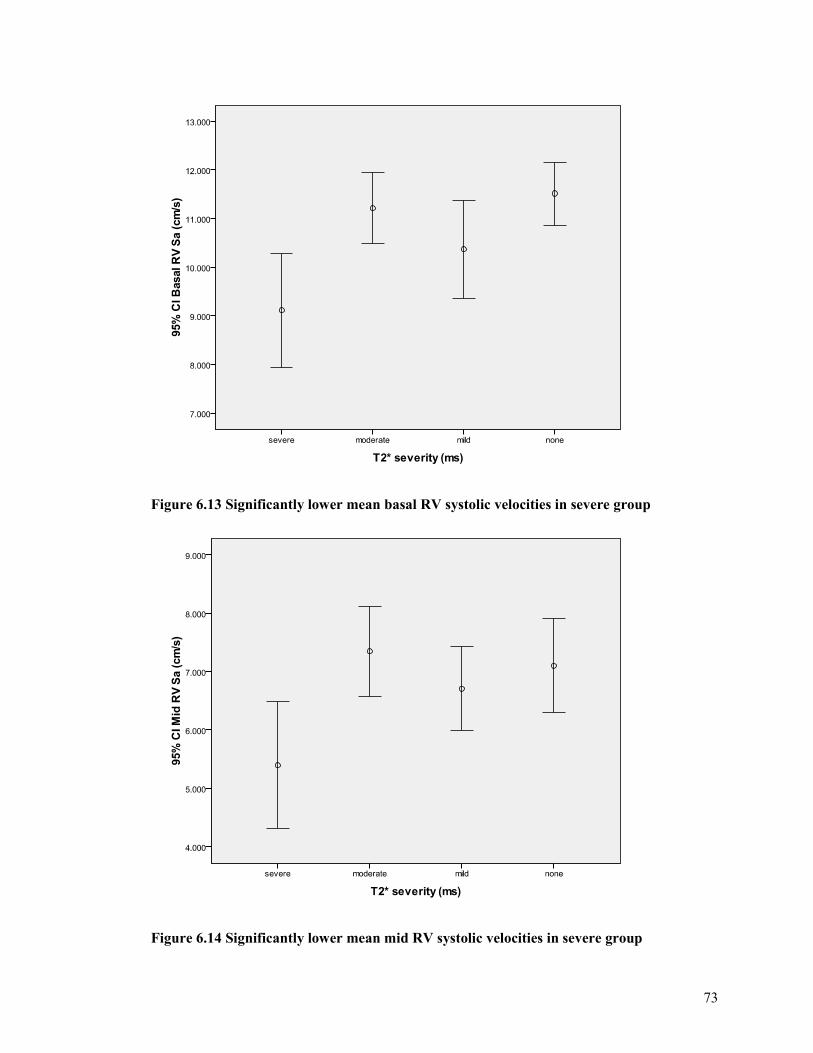
73
Figure 6.13 Significantly lower mean basal RV systolic velocities in severe group
Figure 6.14 Significantly lower mean mid RV systolic velocities in severe group
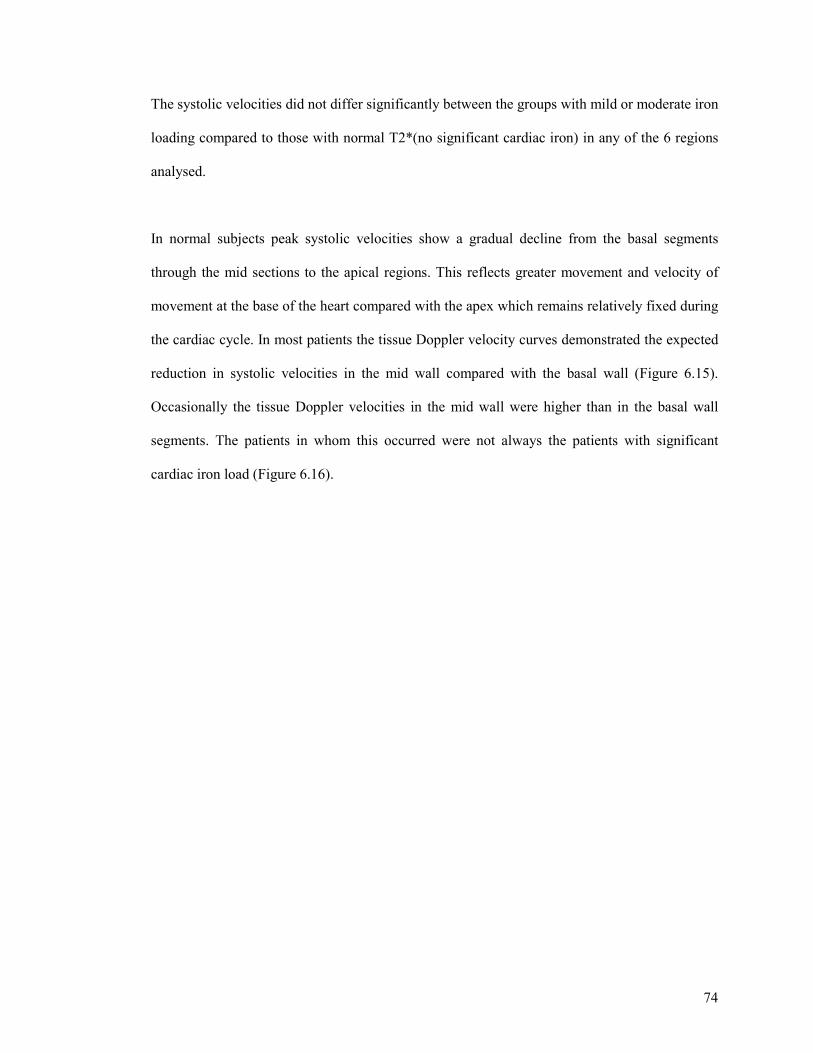
74
The systolic velocities did not differ significantly between the groups with mild or moderate iron
loading compared to those with normal T2*(no significant cardiac iron) in any of the 6 regions
analysed.
In normal subjects peak systolic velocities show a gradual decline from the basal segments
through the mid sections to the apical regions. This reflects greater movement and velocity of
movement at the base of the heart compared with the apex which remains relatively fixed during
the cardiac cycle. In most patients the tissue Doppler velocity curves demonstrated the expected
reduction in systolic velocities in the mid wall compared with the basal wall (Figure 6.15).
Occasionally the tissue Doppler velocities in the mid wall were higher than in the basal wall
segments. The patients in whom this occurred were not always the patients with significant
cardiac iron load (Figure 6.16).
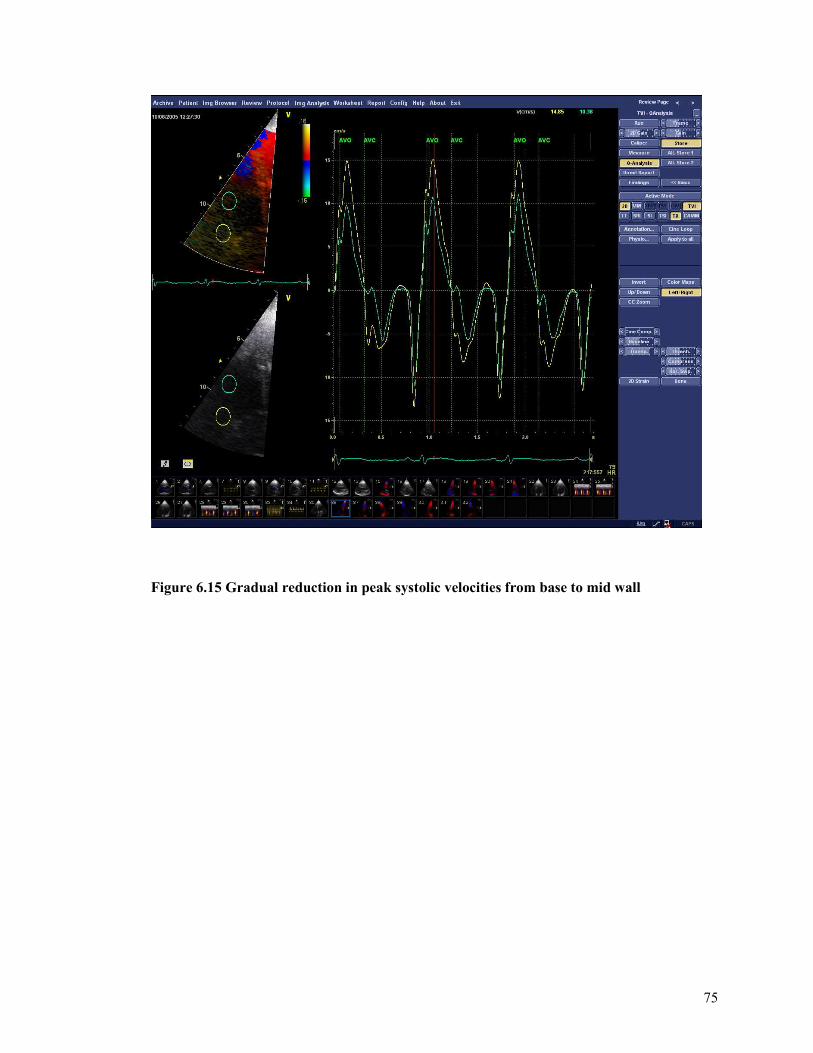
75
Figure 6.15 Gradual reduction in peak systolic velocities from base to mid wall
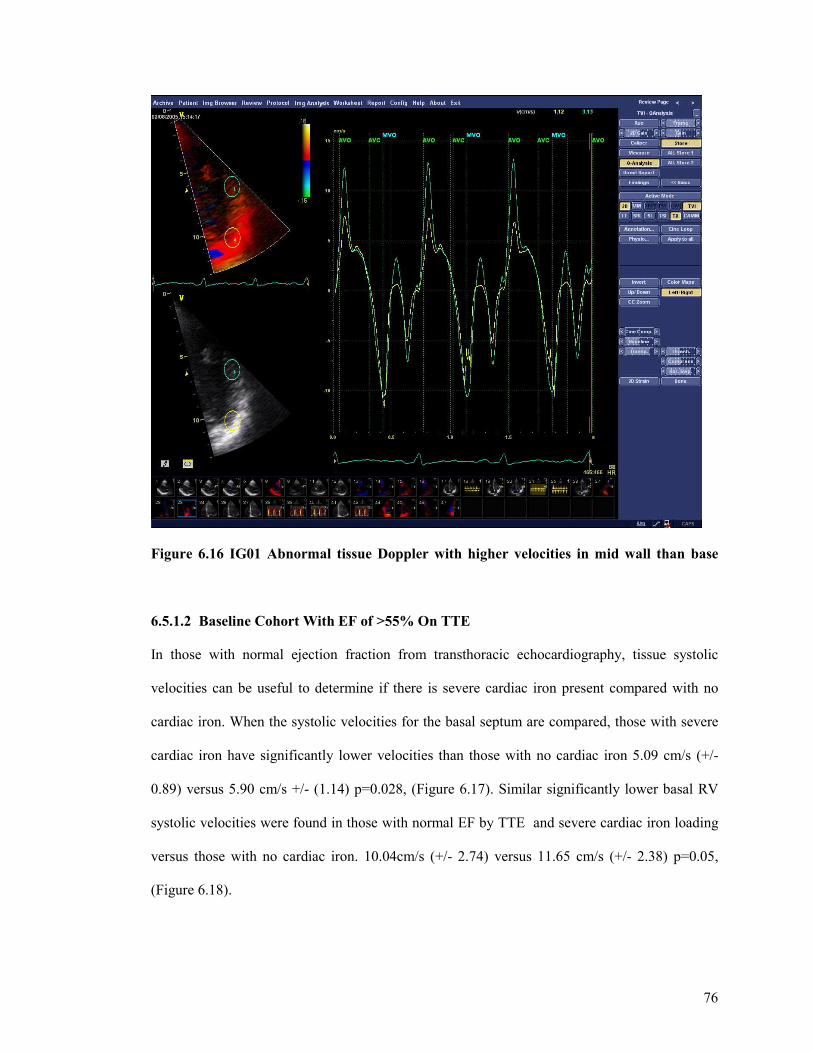
76
Figure 6.16 IG01 Abnormal tissue Doppler with higher velocities in mid wall than base
6.5.1.2 Baseline Cohort With EF of >55% On TTE
In those with normal ejection fraction from transthoracic echocardiography, tissue systolic
velocities can be useful to determine if there is severe cardiac iron present compared with no
cardiac iron. When the systolic velocities for the basal septum are compared, those with severe
cardiac iron have significantly lower velocities than those with no cardiac iron 5.09 cm/s (+/-
0.89) versus 5.90 cm/s +/- (1.14) p=0.028, (Figure 6.17). Similar significantly lower basal RV
systolic velocities were found in those with normal EF by TTE and severe cardiac iron loading
versus those with no cardiac iron. 10.04cm/s (+/- 2.74) versus 11.65 cm/s (+/- 2.38) p=0.05,
(Figure 6.18).
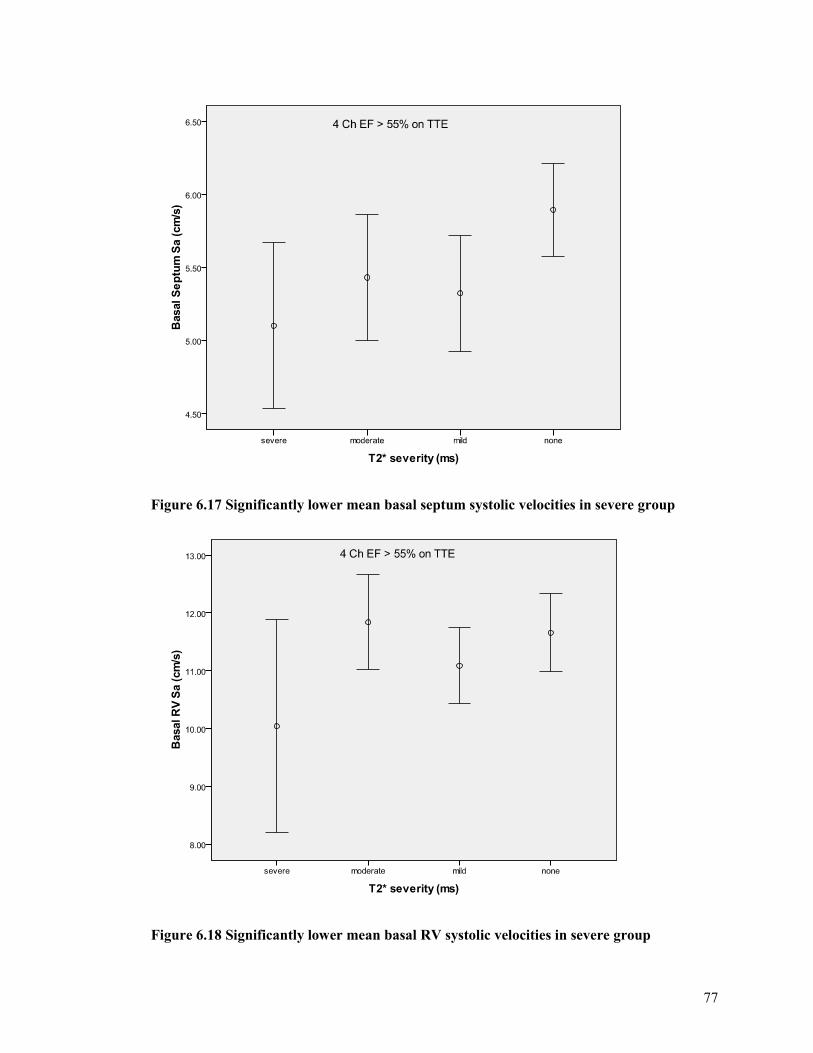
77
Figure 6.17 Significantly lower mean basal septum systolic velocities in severe group
Figure 6.18 Significantly lower mean basal RV systolic velocities in severe group
78
6.5.2 Diastolic Tissue Doppler Velocities
Similar results were obtained for diastolic tissue Doppler velocities, Ea (early diastolic filling)
and Aa (atrial systole). The mean early diastolic velocities were significantly lower in the group
with severe cardiac iron compared to those with no cardiac iron in the basal septum -7.07cm/s
(+/- 1.71) versus -8.43 cm/s (+/-1.71), p=0.002 (Figure 6.19), mid septum -6.54cm/s (+/- 1.90)
versus -7.68cm/s (+/-2.21), p=0.04 and the basal RV wall -9.61cm/s (+/- 2.86) versus -
11.92cm/s (+/- 2.45), p=0.001. The mean early diastolic velocities in the lateral wall were not
significantly different in those with severe iron compared to those with no cardiac iron.
Interestingly the mean diastolic velocities during atrial systole (Aa) were significantly lower in
those with severe iron compared to those with no cardiac iron. This significant difference was
observed in both the basal and mid sections of all 3 walls analysed (Figures 6.20, 6.21 & 6.22).
The mean diastolic velocities did not show any significant differences when compared across
groups with different degrees of iron loading i.e. mild versus moderate versus severe.
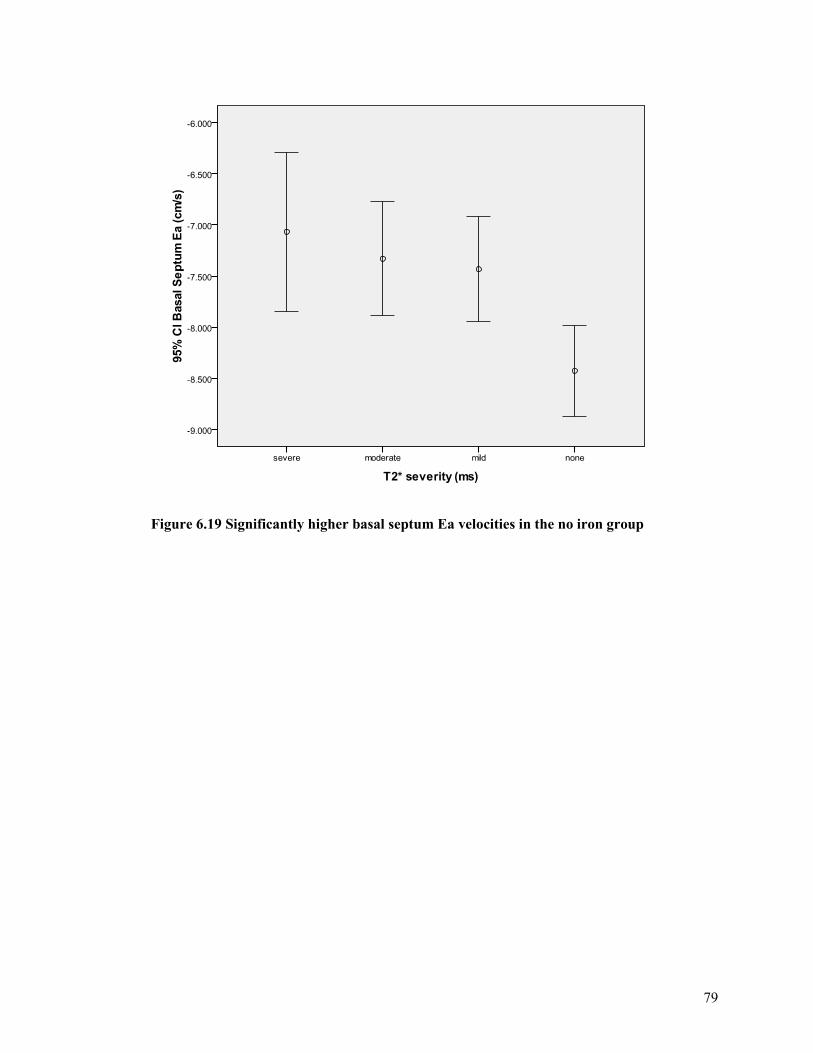
79
Figure 6.19 Significantly higher basal septum Ea velocities in the no iron group
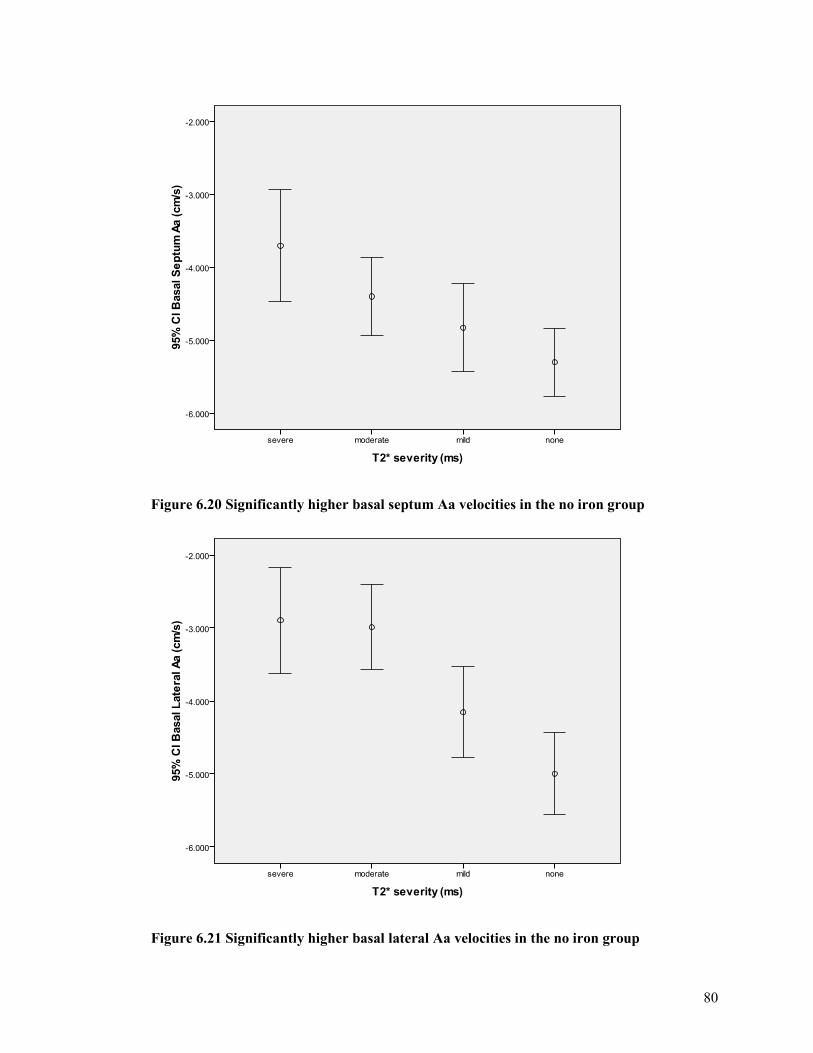
80
Figure 6.20 Significantly higher basal septum Aa velocities in the no iron group
Figure 6.21 Significantly higher basal lateral Aa velocities in the no iron group
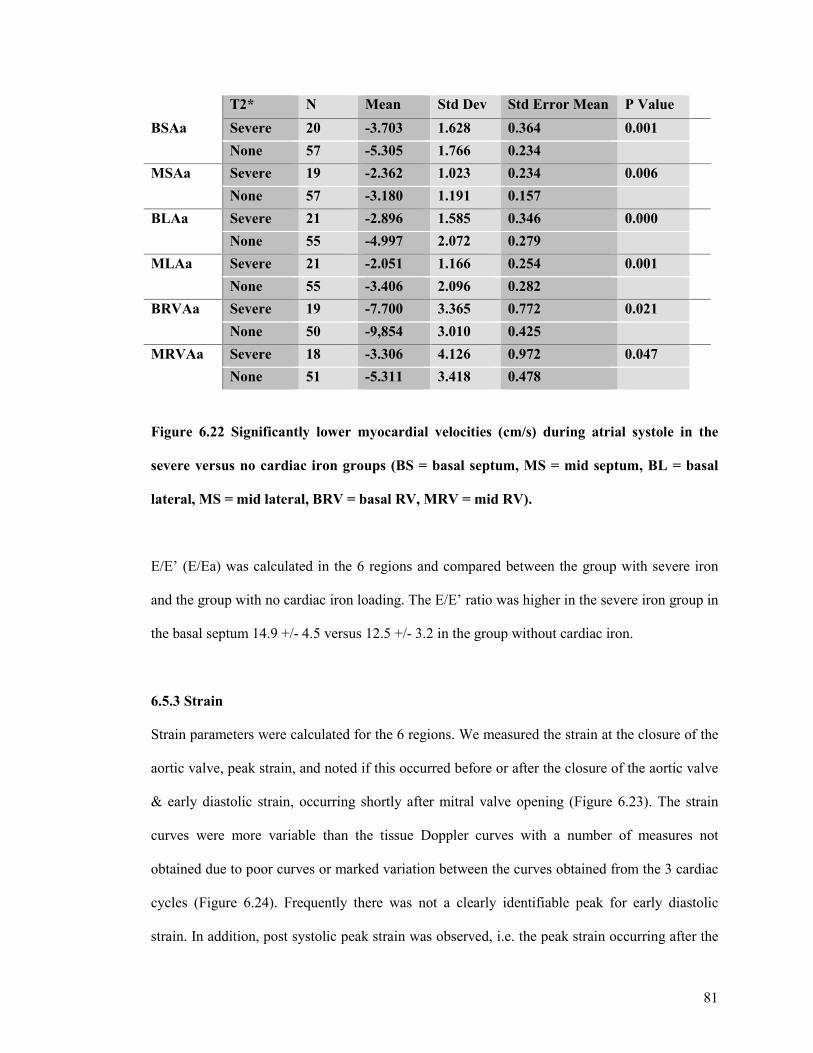
81
T2* N Mean Std Dev Std Error Mean P Value
BSAa Severe 20 -3.703 1.628 0.364 0.001
None 57 -5.305 1.766 0.234
MSAa Severe 19 -2.362 1.023 0.234 0.006
None 57 -3.180 1.191 0.157
BLAa Severe 21 -2.896 1.585 0.346 0.000
None 55 -4.997 2.072 0.279
MLAa Severe 21 -2.051 1.166 0.254 0.001
None 55 -3.406 2.096 0.282
BRVAa Severe 19 -7.700 3.365 0.772 0.021
None 50 -9,854 3.010 0.425
MRVAa Severe 18 -3.306 4.126 0.972 0.047
None 51 -5.311 3.418 0.478
Figure 6.22 Significantly lower myocardial velocities (cm/s) during atrial systole in the
severe versus no cardiac iron groups (BS = basal septum, MS = mid septum, BL = basal
lateral, MS = mid lateral, BRV = basal RV, MRV = mid RV).
E/E’ (E/Ea) was calculated in the 6 regions and compared between the group with severe iron
and the group with no cardiac iron loading. The E/E’ ratio was higher in the severe iron group in
the basal septum 14.9 +/- 4.5 versus 12.5 +/- 3.2 in the group without cardiac iron.
6.5.3 Strain
Strain parameters were calculated for the 6 regions. We measured the strain at the closure of the
aortic valve, peak strain, and noted if this occurred before or after the closure of the aortic valve
& early diastolic strain, occurring shortly after mitral valve opening (Figure 6.23). The strain
curves were more variable than the tissue Doppler curves with a number of measures not
obtained due to poor curves or marked variation between the curves obtained from the 3 cardiac
cycles (Figure 6.24). Frequently there was not a clearly identifiable peak for early diastolic
strain. In addition, post systolic peak strain was observed, i.e. the peak strain occurring after the
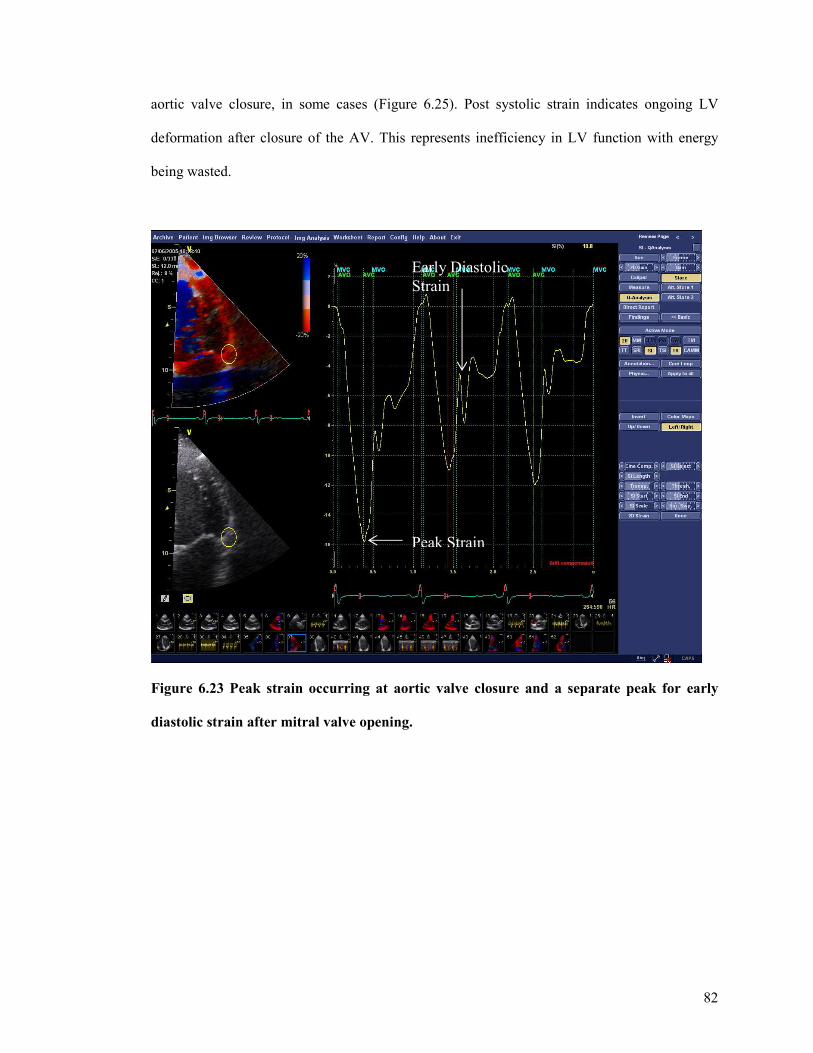
82
aortic valve closure, in some cases (Figure 6.25). Post systolic strain indicates ongoing LV
deformation after closure of the AV. This represents inefficiency in LV function with energy
being wasted.
Figure 6.23 Peak strain occurring at aortic valve closure and a separate peak for early
diastolic strain after mitral valve opening.
Peak Strain
Early Diastolic Strain
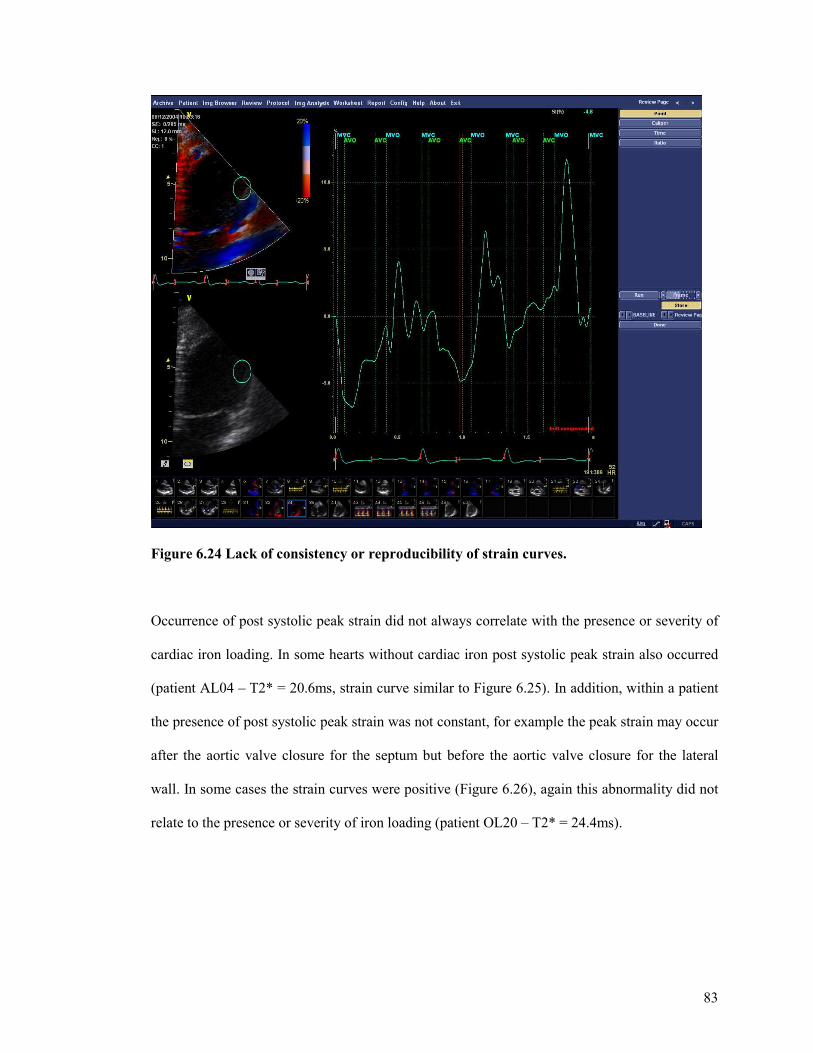
83
Figure 6.24 Lack of consistency or reproducibility of strain curves.
Occurrence of post systolic peak strain did not always correlate with the presence or severity of
cardiac iron loading. In some hearts without cardiac iron post systolic peak strain also occurred
(patient AL04 – T2* = 20.6ms, strain curve similar to Figure 6.25). In addition, within a patient
the presence of post systolic peak strain was not constant, for example the peak strain may occur
after the aortic valve closure for the septum but before the aortic valve closure for the lateral
wall. In some cases the strain curves were positive (Figure 6.26), again this abnormality did not
relate to the presence or severity of iron loading (patient OL20 – T2* = 24.4ms).
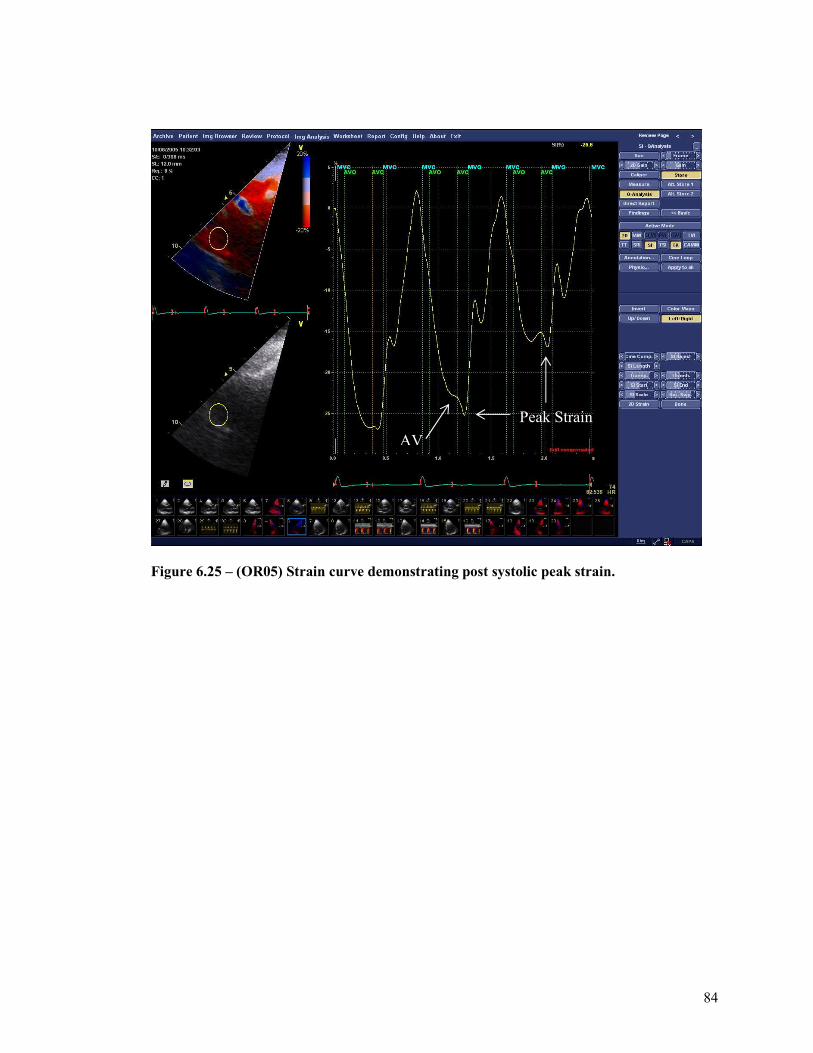
84
Figure 6.25 – (OR05) Strain curve demonstrating post systolic peak strain.
Peak Strain AV
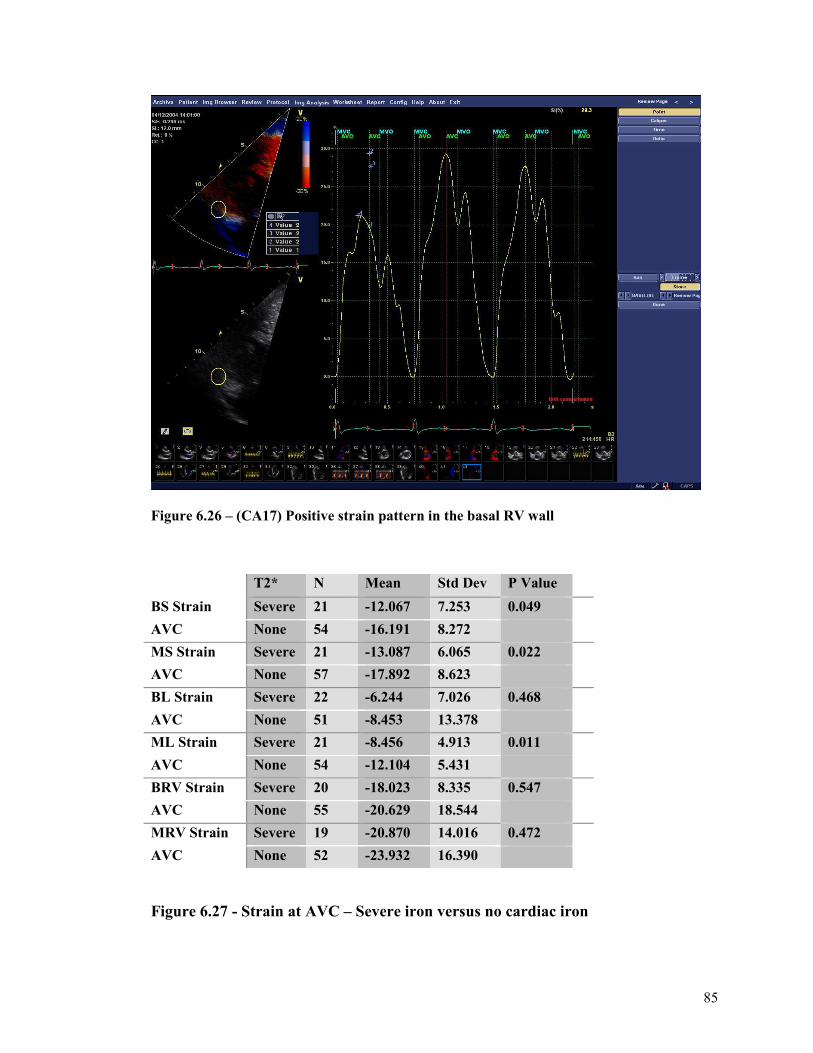
85
Figure 6.26 – (CA17) Positive strain pattern in the basal RV wall
T2* N Mean Std Dev P Value
BS Strain Severe 21 -12.067 7.253 0.049
AVC None 54 -16.191 8.272
MS Strain Severe 21 -13.087 6.065 0.022
AVC None 57 -17.892 8.623
BL Strain Severe 22 -6.244 7.026 0.468
AVC None 51 -8.453 13.378
ML Strain Severe 21 -8.456 4.913 0.011
AVC None 54 -12.104 5.431
BRV Strain Severe 20 -18.023 8.335 0.547
AVC None 55 -20.629 18.544
MRV Strain Severe 19 -20.870 14.016 0.472
AVC None 52 -23.932 16.390
Figure 6.27 - Strain at AVC – Severe iron versus no cardiac iron
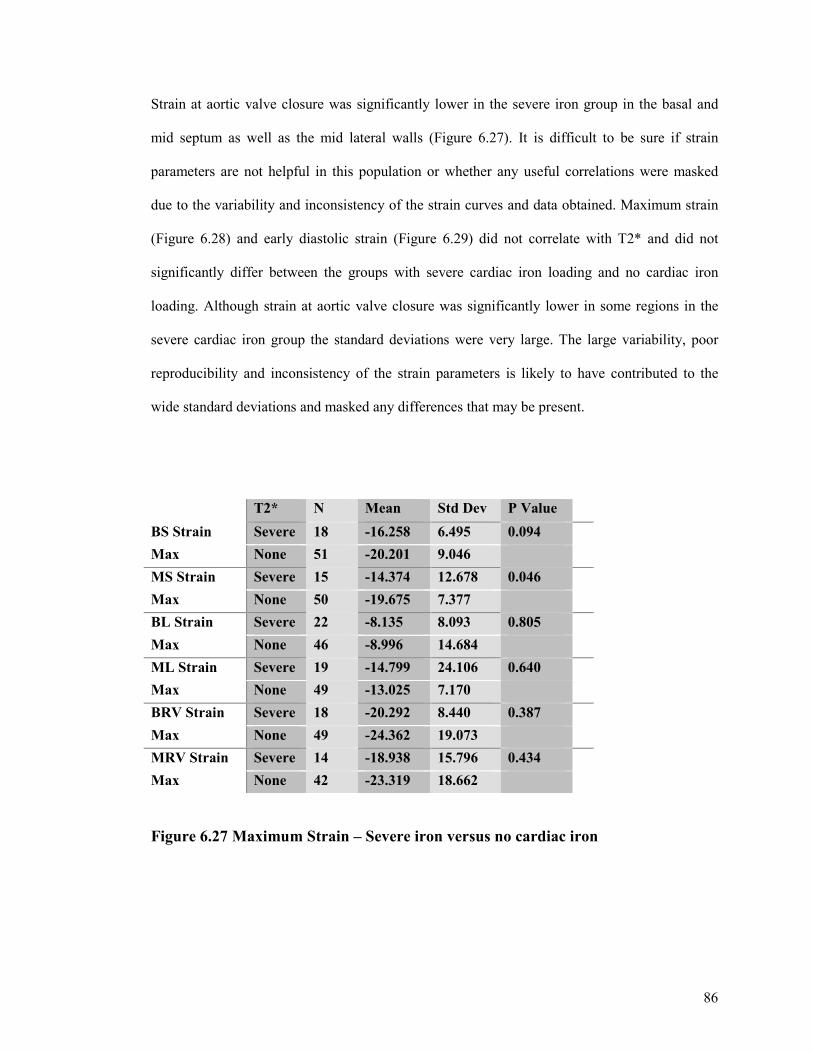
86
Strain at aortic valve closure was significantly lower in the severe iron group in the basal and
mid septum as well as the mid lateral walls (Figure 6.27). It is difficult to be sure if strain
parameters are not helpful in this population or whether any useful correlations were masked
due to the variability and inconsistency of the strain curves and data obtained. Maximum strain
(Figure 6.28) and early diastolic strain (Figure 6.29) did not correlate with T2* and did not
significantly differ between the groups with severe cardiac iron loading and no cardiac iron
loading. Although strain at aortic valve closure was significantly lower in some regions in the
severe cardiac iron group the standard deviations were very large. The large variability, poor
reproducibility and inconsistency of the strain parameters is likely to have contributed to the
wide standard deviations and masked any differences that may be present.
T2* N Mean Std Dev P Value
BS Strain Severe 18 -16.258 6.495 0.094
Max None 51 -20.201 9.046
MS Strain Severe 15 -14.374 12.678 0.046
Max None 50 -19.675 7.377
BL Strain Severe 22 -8.135 8.093 0.805
Max None 46 -8.996 14.684
ML Strain Severe 19 -14.799 24.106 0.640
Max None 49 -13.025 7.170
BRV Strain Severe 18 -20.292 8.440 0.387
Max None 49 -24.362 19.073
MRV Strain Severe 14 -18.938 15.796 0.434
Max None 42 -23.319 18.662
Figure 6.27 Maximum Strain – Severe iron versus no cardiac iron
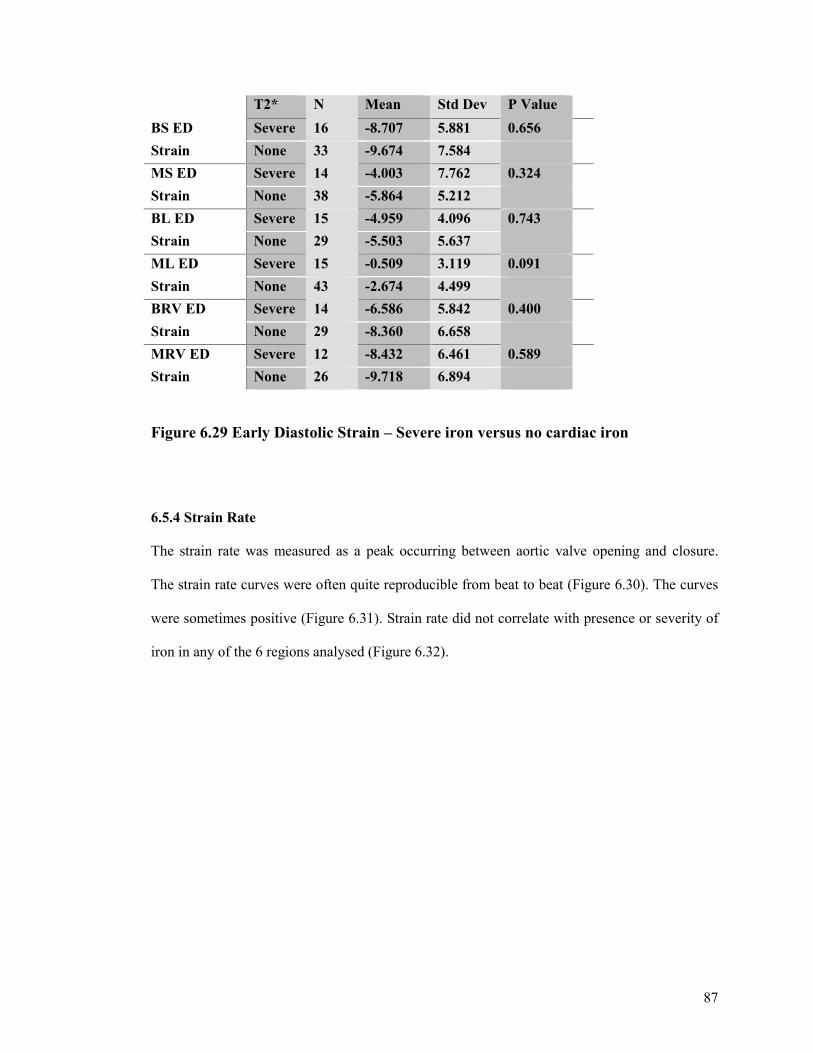
87
T2* N Mean Std Dev P Value
BS ED Severe 16 -8.707 5.881 0.656
Strain None 33 -9.674 7.584
MS ED Severe 14 -4.003 7.762 0.324
Strain None 38 -5.864 5.212
BL ED Severe 15 -4.959 4.096 0.743
Strain None 29 -5.503 5.637
ML ED Severe 15 -0.509 3.119 0.091
Strain None 43 -2.674 4.499
BRV ED Severe 14 -6.586 5.842 0.400
Strain None 29 -8.360 6.658
MRV ED Severe 12 -8.432 6.461 0.589
Strain None 26 -9.718 6.894
Figure 6.29 Early Diastolic Strain – Severe iron versus no cardiac iron
6.5.4 Strain Rate
The strain rate was measured as a peak occurring between aortic valve opening and closure.
The strain rate curves were often quite reproducible from beat to beat (Figure 6.30). The curves
were sometimes positive (Figure 6.31). Strain rate did not correlate with presence or severity of
iron in any of the 6 regions analysed (Figure 6.32).
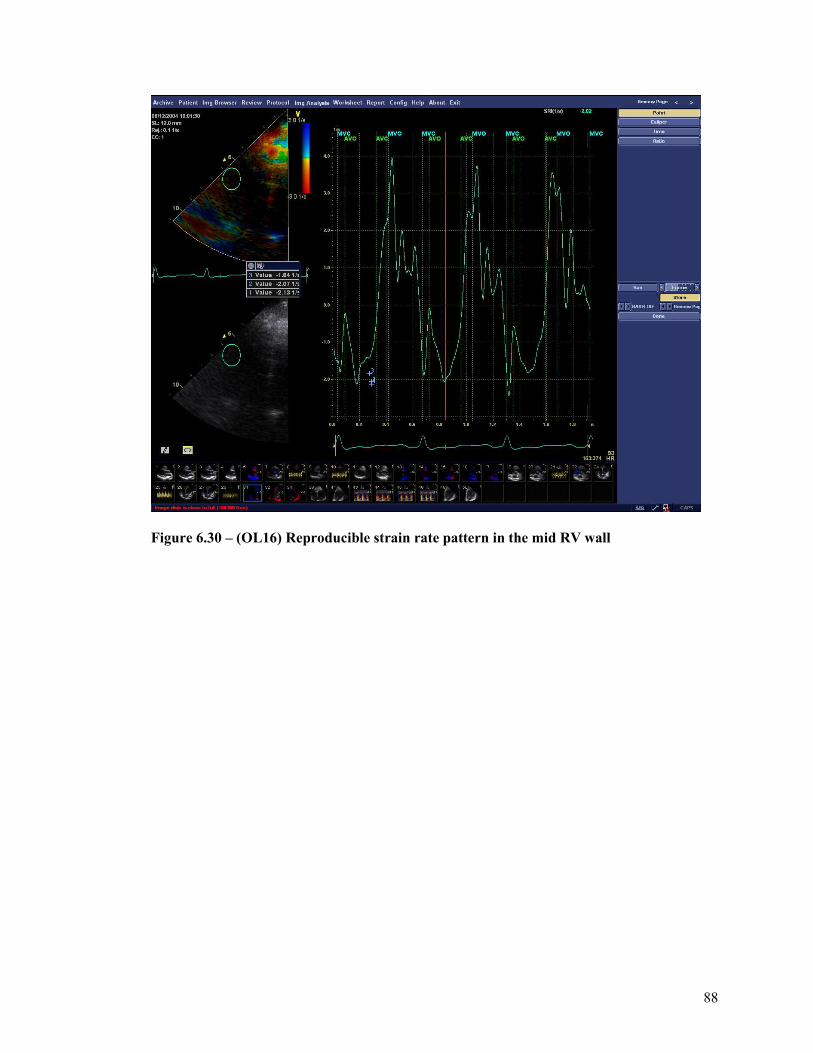
88
Figure 6.30 – (OL16) Reproducible strain rate pattern in the mid RV wall
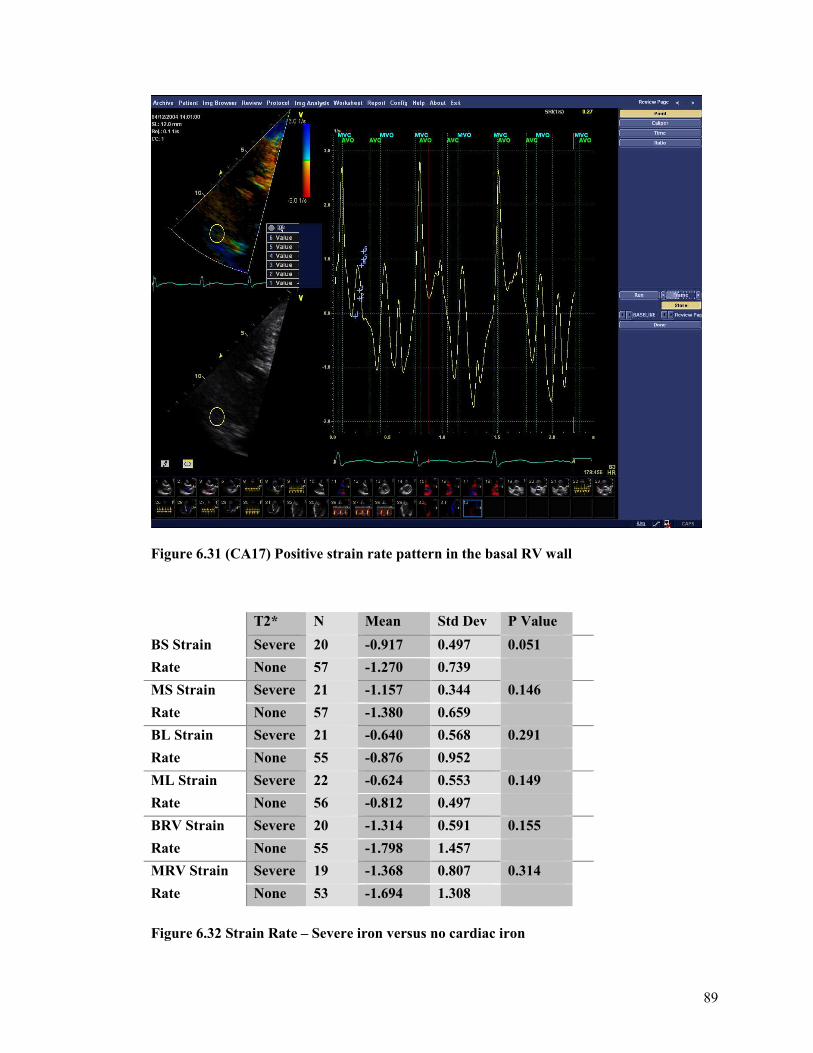
89
Figure 6.31 (CA17) Positive strain rate pattern in the basal RV wall
T2* N Mean Std Dev P Value
BS Strain Severe 20 -0.917 0.497 0.051
Rate None 57 -1.270 0.739
MS Strain Severe 21 -1.157 0.344 0.146
Rate None 57 -1.380 0.659
BL Strain Severe 21 -0.640 0.568 0.291
Rate None 55 -0.876 0.952
ML Strain Severe 22 -0.624 0.553 0.149
Rate None 56 -0.812 0.497
BRV Strain Severe 20 -1.314 0.591 0.155
Rate None 55 -1.798 1.457
MRV Strain Severe 19 -1.368 0.807 0.314
Rate None 53 -1.694 1.308
Figure 6.32 Strain Rate – Severe iron versus no cardiac iron
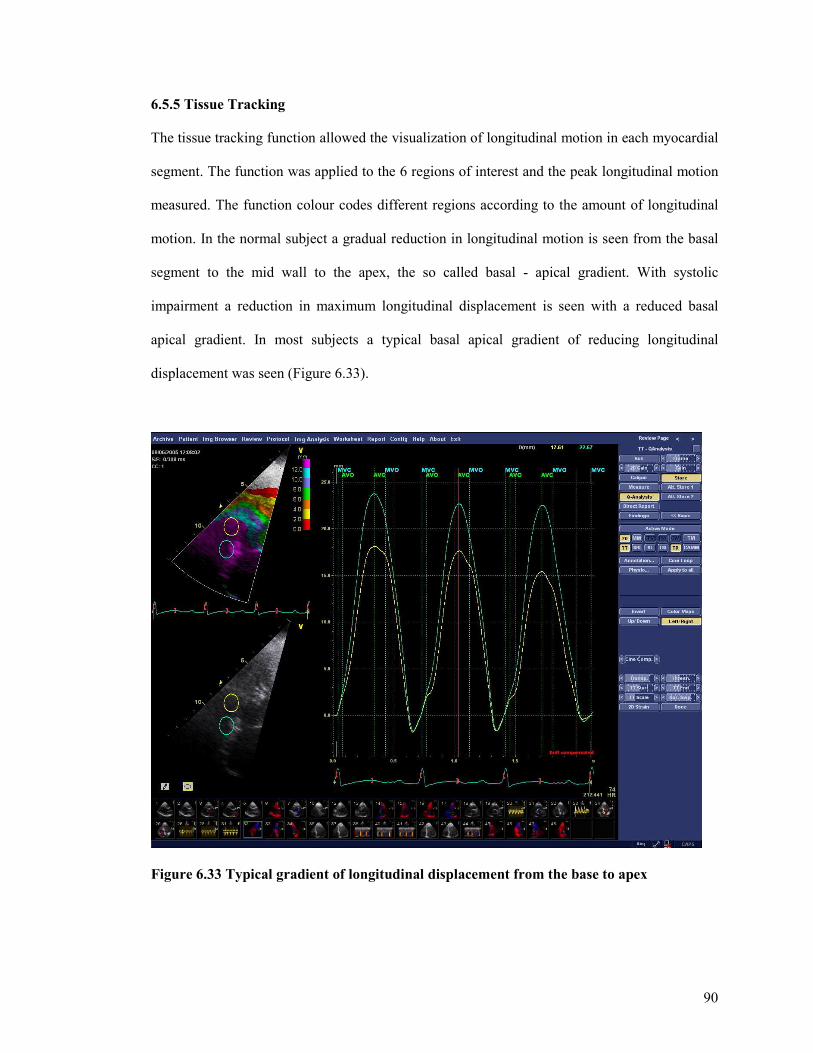
90
6.5.5 Tissue Tracking
The tissue tracking function allowed the visualization of longitudinal motion in each myocardial
segment. The function was applied to the 6 regions of interest and the peak longitudinal motion
measured. The function colour codes different regions according to the amount of longitudinal
motion. In the normal subject a gradual reduction in longitudinal motion is seen from the basal
segment to the mid wall to the apex, the so called basal - apical gradient. With systolic
impairment a reduction in maximum longitudinal displacement is seen with a reduced basal
apical gradient. In most subjects a typical basal apical gradient of reducing longitudinal
displacement was seen (Figure 6.33).
Figure 6.33 Typical gradient of longitudinal displacement from the base to apex
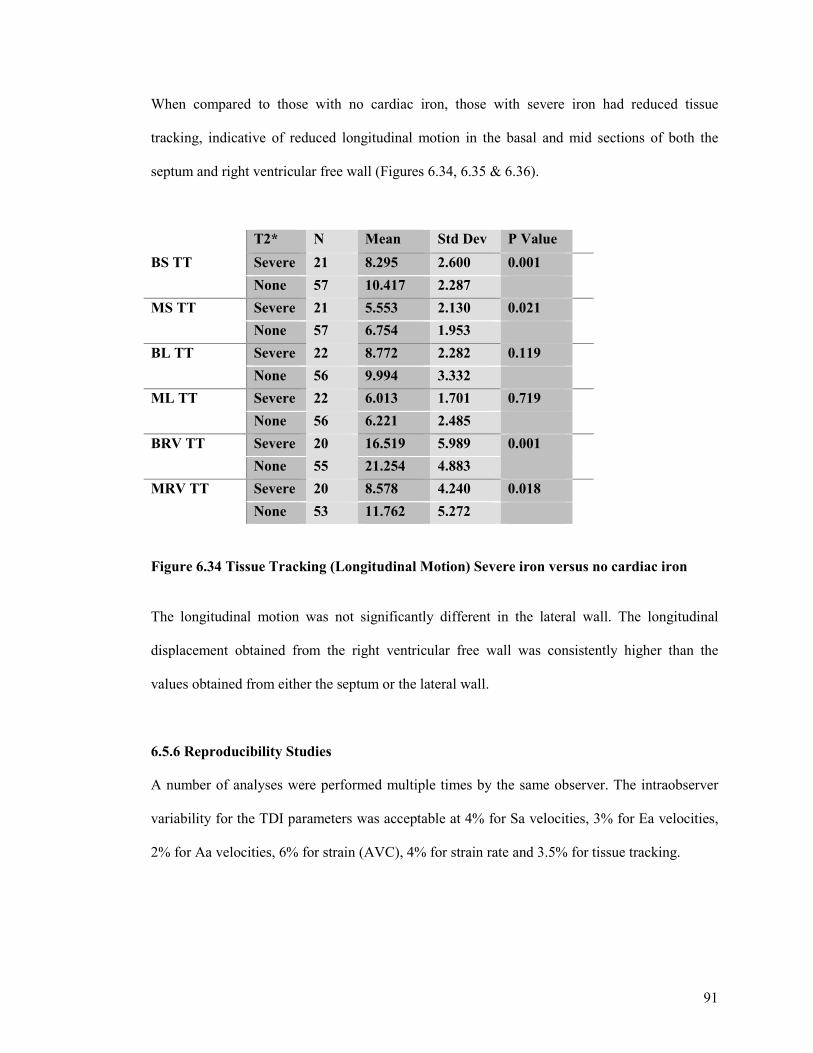
91
When compared to those with no cardiac iron, those with severe iron had reduced tissue
tracking, indicative of reduced longitudinal motion in the basal and mid sections of both the
septum and right ventricular free wall (Figures 6.34, 6.35 & 6.36).
T2* N Mean Std Dev P Value
BS TT Severe 21 8.295 2.600 0.001
None 57 10.417 2.287
MS TT Severe 21 5.553 2.130 0.021
None 57 6.754 1.953
BL TT Severe 22 8.772 2.282 0.119
None 56 9.994 3.332
ML TT Severe 22 6.013 1.701 0.719
None 56 6.221 2.485
BRV TT Severe 20 16.519 5.989 0.001
None 55 21.254 4.883
MRV TT Severe 20 8.578 4.240 0.018
None 53 11.762 5.272
Figure 6.34 Tissue Tracking (Longitudinal Motion) Severe iron versus no cardiac iron
The longitudinal motion was not significantly different in the lateral wall. The longitudinal
displacement obtained from the right ventricular free wall was consistently higher than the
values obtained from either the septum or the lateral wall.
6.5.6 Reproducibility Studies
A number of analyses were performed multiple times by the same observer. The intraobserver
variability for the TDI parameters was acceptable at 4% for Sa velocities, 3% for Ea velocities,
2% for Aa velocities, 6% for strain (AVC), 4% for strain rate and 3.5% for tissue tracking.
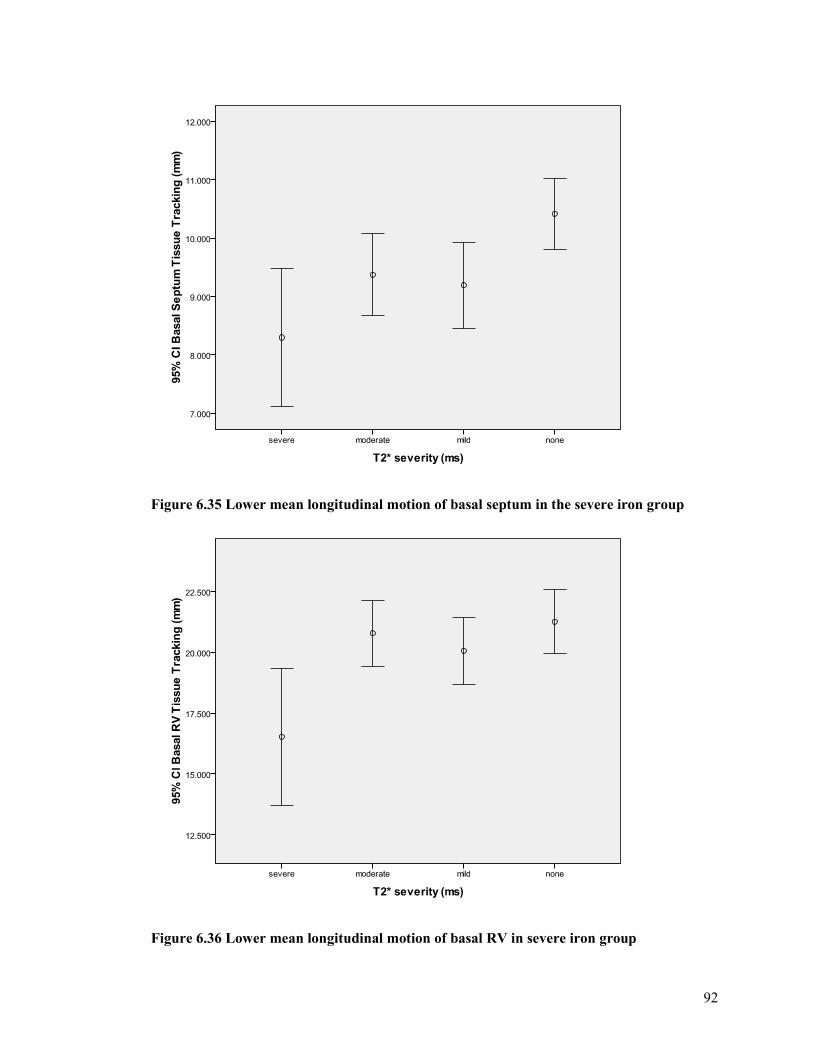
92
Figure 6.35 Lower mean longitudinal motion of basal septum in the severe iron group
Figure 6.36 Lower mean longitudinal motion of basal RV in severe iron group
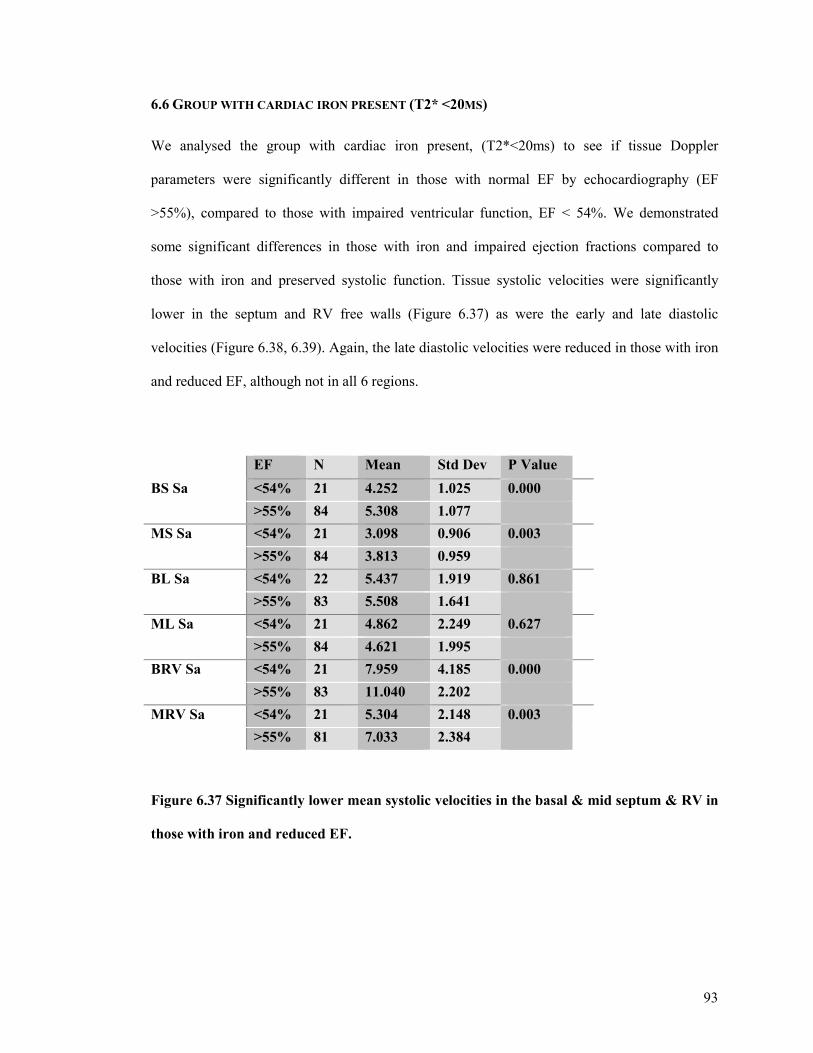
93
6.6 GROUP WITH CARDIAC IRON PRESENT (T2* <20MS)
We analysed the group with cardiac iron present, (T2*<20ms) to see if tissue Doppler
parameters were significantly different in those with normal EF by echocardiography (EF
>55%), compared to those with impaired ventricular function, EF < 54%. We demonstrated
some significant differences in those with iron and impaired ejection fractions compared to
those with iron and preserved systolic function. Tissue systolic velocities were significantly
lower in the septum and RV free walls (Figure 6.37) as were the early and late diastolic
velocities (Figure 6.38, 6.39). Again, the late diastolic velocities were reduced in those with iron
and reduced EF, although not in all 6 regions.
EF N Mean Std Dev P Value
BS Sa <54% 21 4.252 1.025 0.000
>55% 84 5.308 1.077
MS Sa <54% 21 3.098 0.906 0.003
>55% 84 3.813 0.959
BL Sa <54% 22 5.437 1.919 0.861
>55% 83 5.508 1.641
ML Sa <54% 21 4.862 2.249 0.627
>55% 84 4.621 1.995
BRV Sa <54% 21 7.959 4.185 0.000
>55% 83 11.040 2.202
MRV Sa <54% 21 5.304 2.148 0.003
>55% 81 7.033 2.384
Figure 6.37 Significantly lower mean systolic velocities in the basal & mid septum & RV in
those with iron and reduced EF.
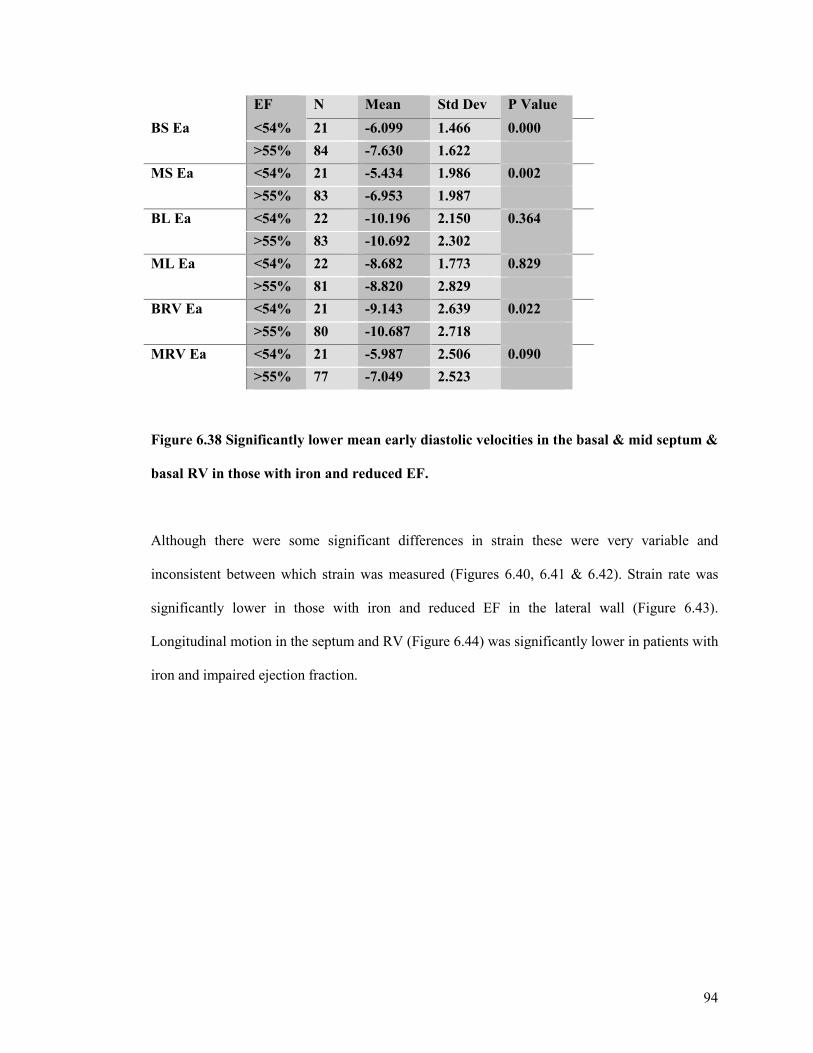
94
EF N Mean Std Dev P Value
BS Ea <54% 21 -6.099 1.466 0.000
>55% 84 -7.630 1.622
MS Ea <54% 21 -5.434 1.986 0.002
>55% 83 -6.953 1.987
BL Ea <54% 22 -10.196 2.150 0.364
>55% 83 -10.692 2.302
ML Ea <54% 22 -8.682 1.773 0.829
>55% 81 -8.820 2.829
BRV Ea <54% 21 -9.143 2.639 0.022
>55% 80 -10.687 2.718
MRV Ea <54% 21 -5.987 2.506 0.090
>55% 77 -7.049 2.523
Figure 6.38 Significantly lower mean early diastolic velocities in the basal & mid septum &
basal RV in those with iron and reduced EF.
Although there were some significant differences in strain these were very variable and
inconsistent between which strain was measured (Figures 6.40, 6.41 & 6.42). Strain rate was
significantly lower in those with iron and reduced EF in the lateral wall (Figure 6.43).
Longitudinal motion in the septum and RV (Figure 6.44) was significantly lower in patients with
iron and impaired ejection fraction.
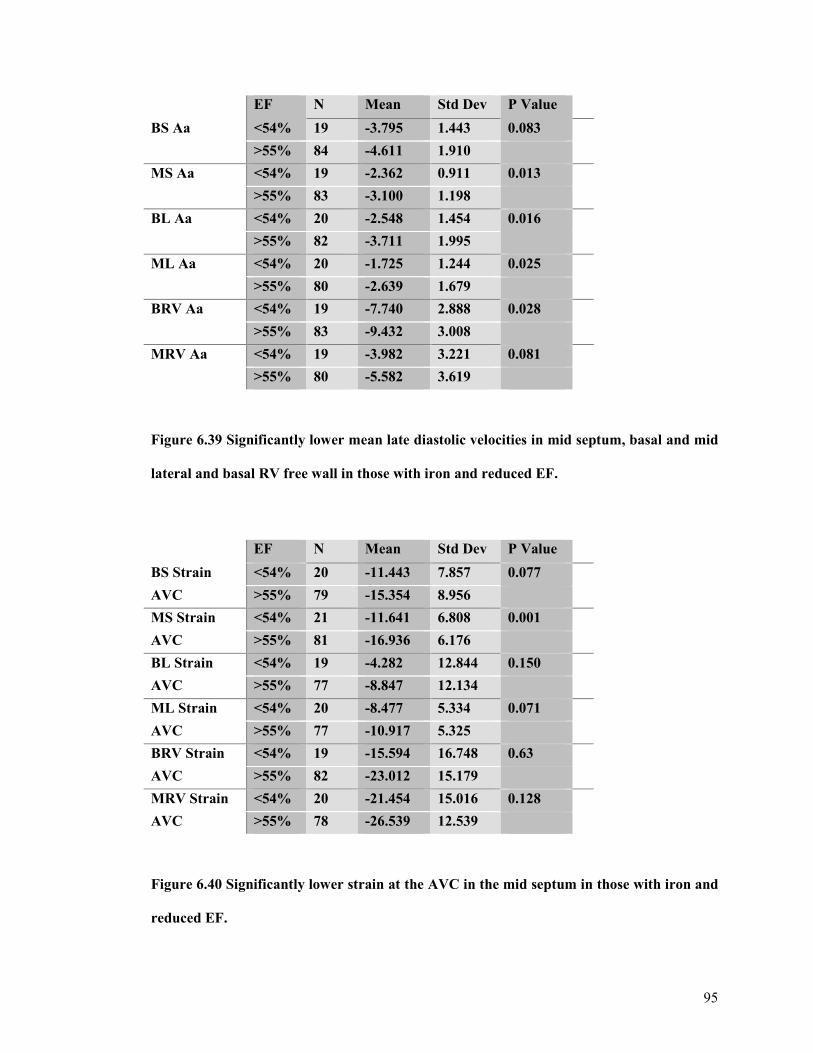
95
EF N Mean Std Dev P Value
BS Aa <54% 19 -3.795 1.443 0.083
>55% 84 -4.611 1.910
MS Aa <54% 19 -2.362 0.911 0.013
>55% 83 -3.100 1.198
BL Aa <54% 20 -2.548 1.454 0.016
>55% 82 -3.711 1.995
ML Aa <54% 20 -1.725 1.244 0.025
>55% 80 -2.639 1.679
BRV Aa <54% 19 -7.740 2.888 0.028
>55% 83 -9.432 3.008
MRV Aa <54% 19 -3.982 3.221 0.081
>55% 80 -5.582 3.619
Figure 6.39 Significantly lower mean late diastolic velocities in mid septum, basal and mid
lateral and basal RV free wall in those with iron and reduced EF.
EF N Mean Std Dev P Value
BS Strain <54% 20 -11.443 7.857 0.077
AVC >55% 79 -15.354 8.956
MS Strain <54% 21 -11.641 6.808 0.001
AVC >55% 81 -16.936 6.176
BL Strain <54% 19 -4.282 12.844 0.150
AVC >55% 77 -8.847 12.134
ML Strain <54% 20 -8.477 5.334 0.071
AVC >55% 77 -10.917 5.325
BRV Strain <54% 19 -15.594 16.748 0.63
AVC >55% 82 -23.012 15.179
MRV Strain <54% 20 -21.454 15.016 0.128
AVC >55% 78 -26.539 12.539
Figure 6.40 Significantly lower strain at the AVC in the mid septum in those with iron and
reduced EF.
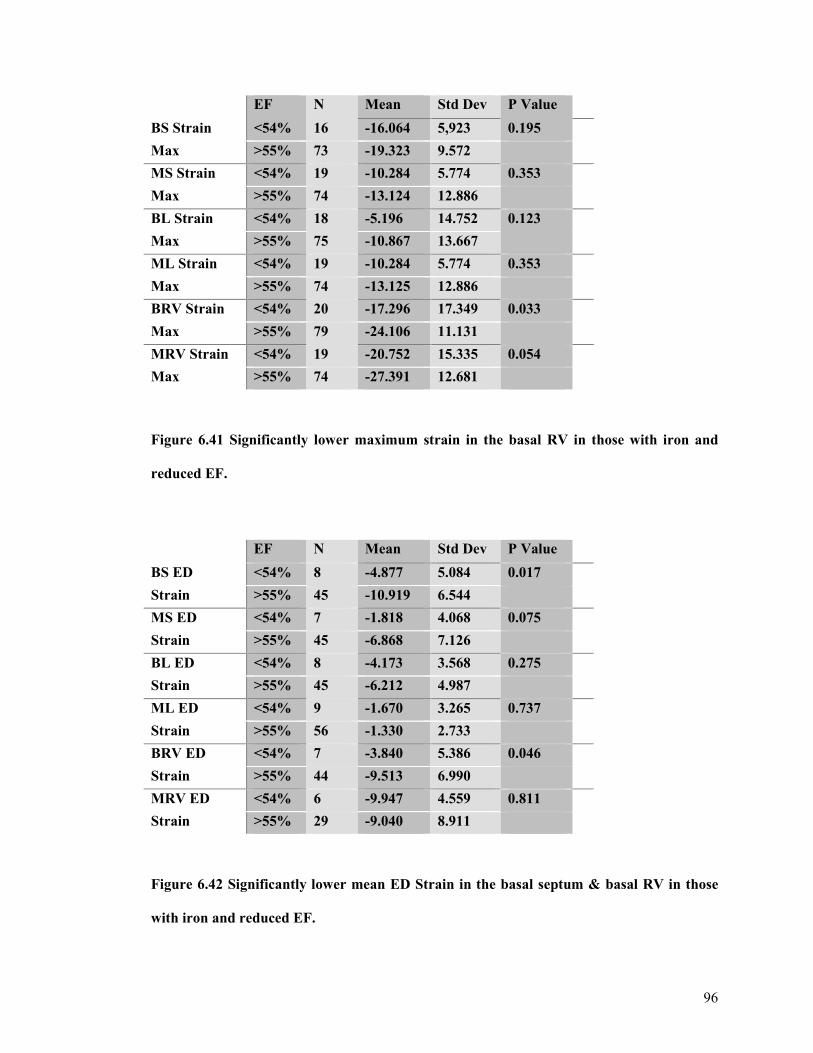
96
EF N Mean Std Dev P Value
BS Strain <54% 16 -16.064 5,923 0.195
Max >55% 73 -19.323 9.572
MS Strain <54% 19 -10.284 5.774 0.353
Max >55% 74 -13.124 12.886
BL Strain <54% 18 -5.196 14.752 0.123
Max >55% 75 -10.867 13.667
ML Strain <54% 19 -10.284 5.774 0.353
Max >55% 74 -13.125 12.886
BRV Strain <54% 20 -17.296 17.349 0.033
Max >55% 79 -24.106 11.131
MRV Strain <54% 19 -20.752 15.335 0.054
Max >55% 74 -27.391 12.681
Figure 6.41 Significantly lower maximum strain in the basal RV in those with iron and
reduced EF.
EF N Mean Std Dev P Value
BS ED <54% 8 -4.877 5.084 0.017
Strain >55% 45 -10.919 6.544
MS ED <54% 7 -1.818 4.068 0.075
Strain >55% 45 -6.868 7.126
BL ED <54% 8 -4.173 3.568 0.275
Strain >55% 45 -6.212 4.987
ML ED <54% 9 -1.670 3.265 0.737
Strain >55% 56 -1.330 2.733
BRV ED <54% 7 -3.840 5.386 0.046
Strain >55% 44 -9.513 6.990
MRV ED <54% 6 -9.947 4.559 0.811
Strain >55% 29 -9.040 8.911
Figure 6.42 Significantly lower mean ED Strain in the basal septum & basal RV in those
with iron and reduced EF.
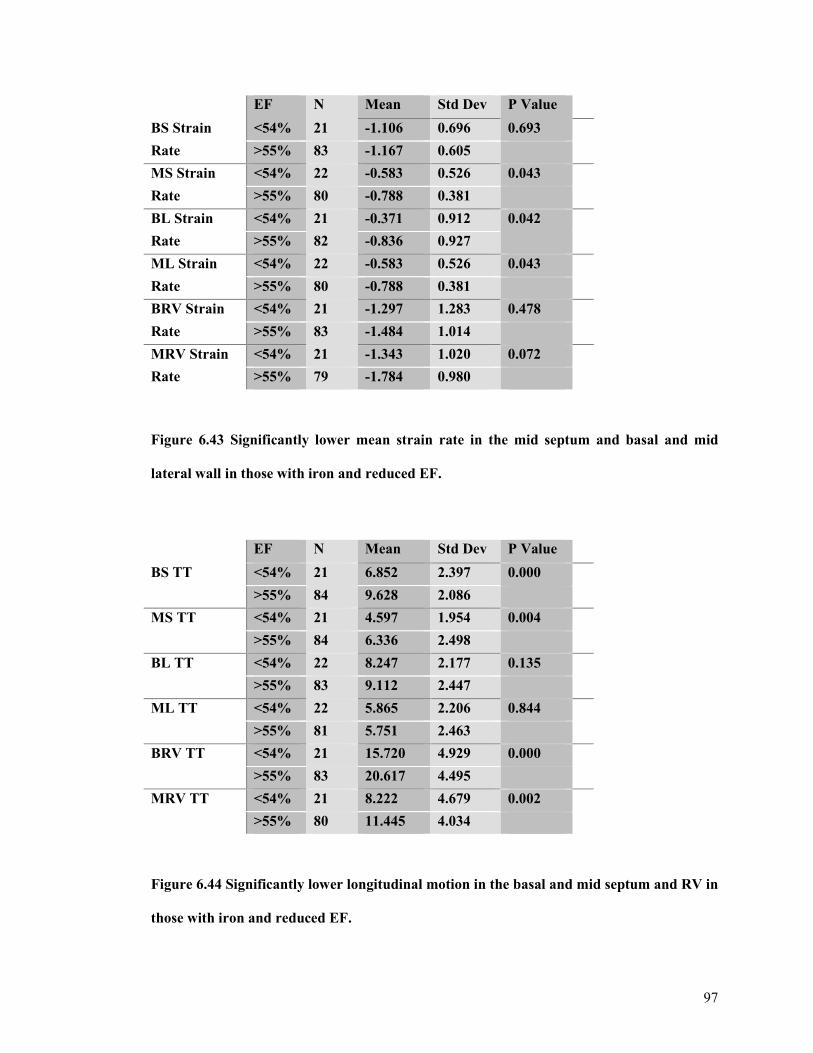
97
EF N Mean Std Dev P Value
BS Strain <54% 21 -1.106 0.696 0.693
Rate >55% 83 -1.167 0.605
MS Strain <54% 22 -0.583 0.526 0.043
Rate >55% 80 -0.788 0.381
BL Strain <54% 21 -0.371 0.912 0.042
Rate >55% 82 -0.836 0.927
ML Strain <54% 22 -0.583 0.526 0.043
Rate >55% 80 -0.788 0.381
BRV Strain <54% 21 -1.297 1.283 0.478
Rate >55% 83 -1.484 1.014
MRV Strain <54% 21 -1.343 1.020 0.072
Rate >55% 79 -1.784 0.980
Figure 6.43 Significantly lower mean strain rate in the mid septum and basal and mid
lateral wall in those with iron and reduced EF.
EF N Mean Std Dev P Value
BS TT <54% 21 6.852 2.397 0.000
>55% 84 9.628 2.086
MS TT <54% 21 4.597 1.954 0.004
>55% 84 6.336 2.498
BL TT <54% 22 8.247 2.177 0.135
>55% 83 9.112 2.447
ML TT <54% 22 5.865 2.206 0.844
>55% 81 5.751 2.463
BRV TT <54% 21 15.720 4.929 0.000
>55% 83 20.617 4.495
MRV TT <54% 21 8.222 4.679 0.002
>55% 80 11.445 4.034
Figure 6.44 Significantly lower longitudinal motion in the basal and mid septum and RV in
those with iron and reduced EF.
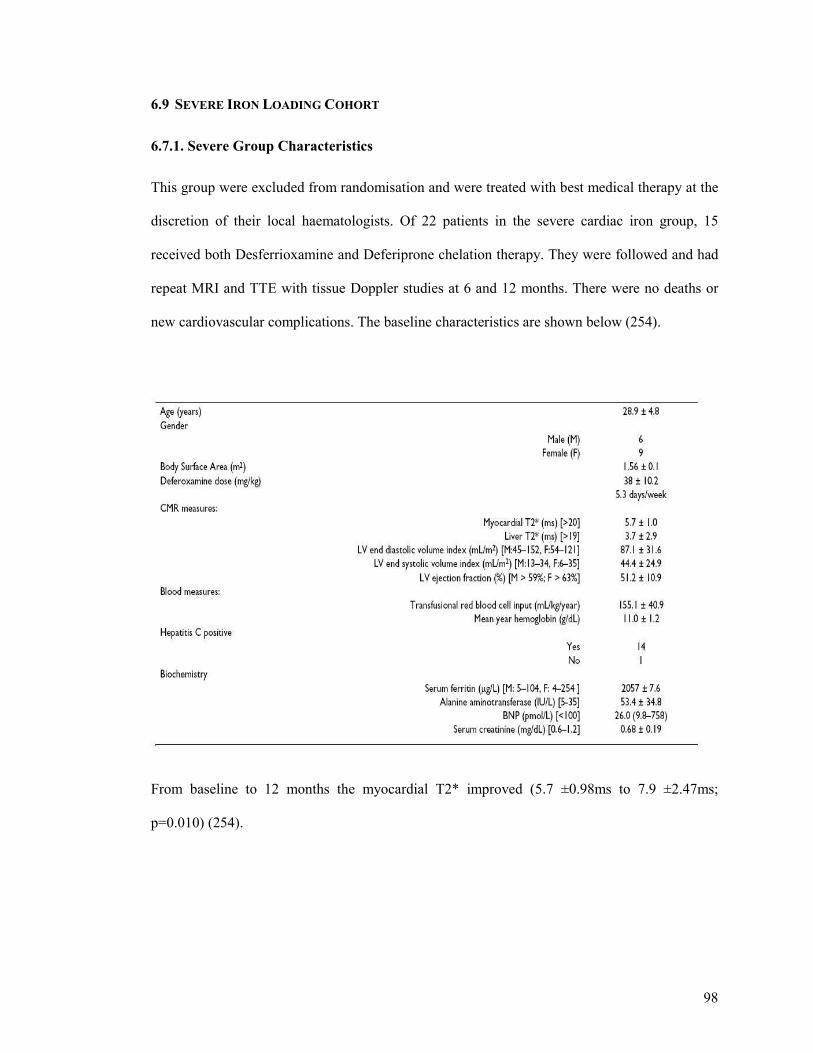
98
6.9 SEVERE IRON LOADING COHORT
6.7.1. Severe Group Characteristics
This group were excluded from randomisation and were treated with best medical therapy at the
discretion of their local haematologists. Of 22 patients in the severe cardiac iron group, 15
received both Desferrioxamine and Deferiprone chelation therapy. They were followed and had
repeat MRI and TTE with tissue Doppler studies at 6 and 12 months. There were no deaths or
new cardiovascular complications. The baseline characteristics are shown below (254).
From baseline to 12 months the myocardial T2* improved (5.7 ±0.98ms to 7.9 ±2.47ms;
p=0.010) (254).
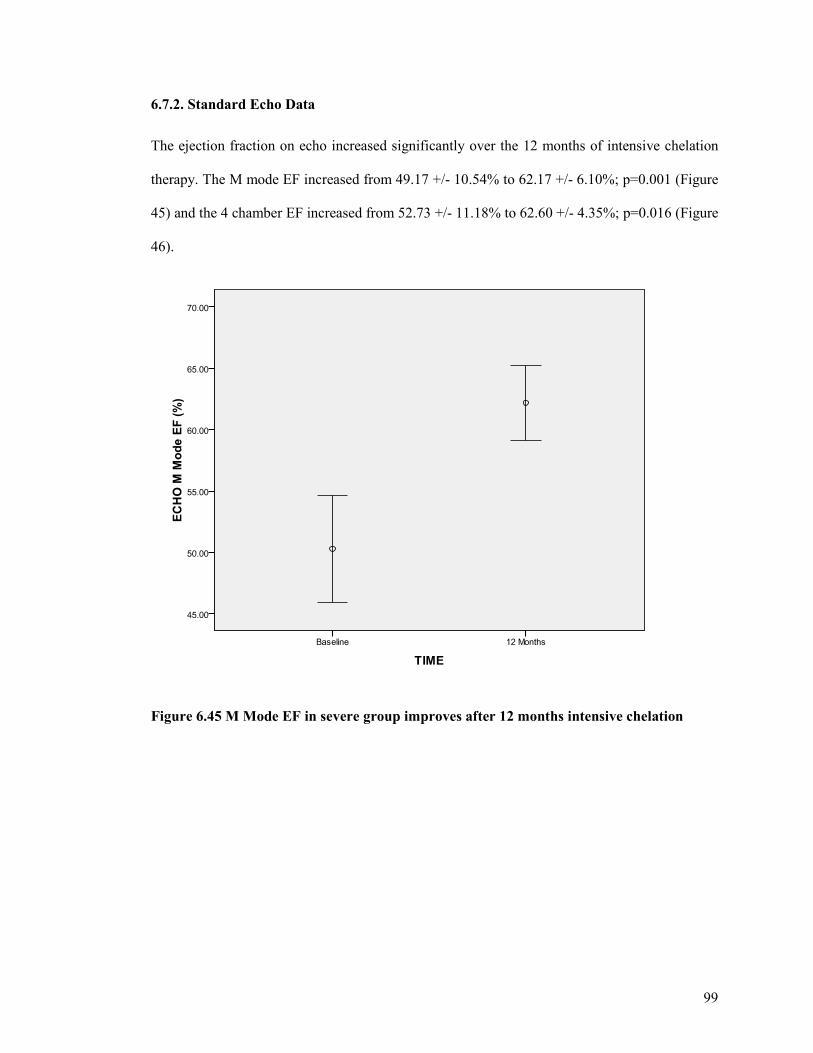
99
6.7.2. Standard Echo Data
The ejection fraction on echo increased significantly over the 12 months of intensive chelation
therapy. The M mode EF increased from 49.17 +/- 10.54% to 62.17 +/- 6.10%; p=0.001 (Figure
45) and the 4 chamber EF increased from 52.73 +/- 11.18% to 62.60 +/- 4.35%; p=0.016 (Figure
46).
Figure 6.45 M Mode EF in severe group improves after 12 months intensive chelation
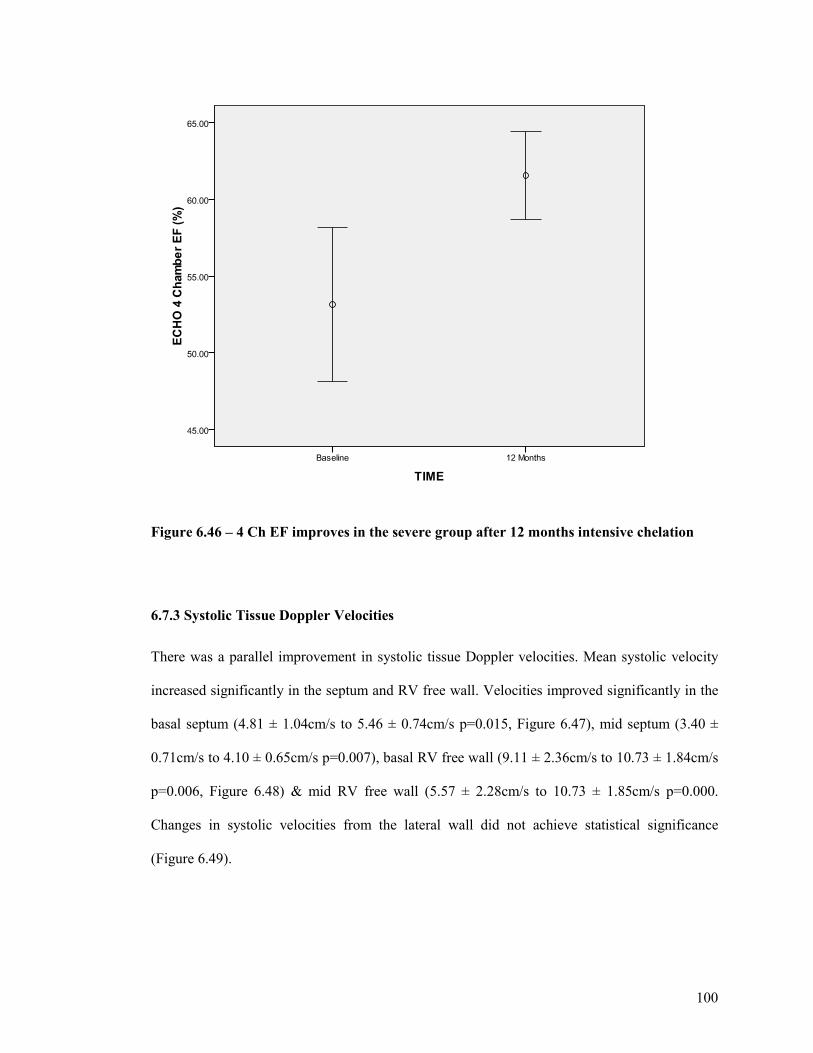
100
Figure 6.46 – 4 Ch EF improves in the severe group after 12 months intensive chelation
6.7.3 Systolic Tissue Doppler Velocities
There was a parallel improvement in systolic tissue Doppler velocities. Mean systolic velocity
increased significantly in the septum and RV free wall. Velocities improved significantly in the
basal septum (4.81 ± 1.04cm/s to 5.46 ± 0.74cm/s p=0.015, Figure 6.47), mid septum (3.40 ±
0.71cm/s to 4.10 ± 0.65cm/s p=0.007), basal RV free wall (9.11 ± 2.36cm/s to 10.73 ± 1.84cm/s
p=0.006, Figure 6.48) & mid RV free wall (5.57 ± 2.28cm/s to 10.73 ± 1.85cm/s p=0.000.
Changes in systolic velocities from the lateral wall did not achieve statistical significance
(Figure 6.49).
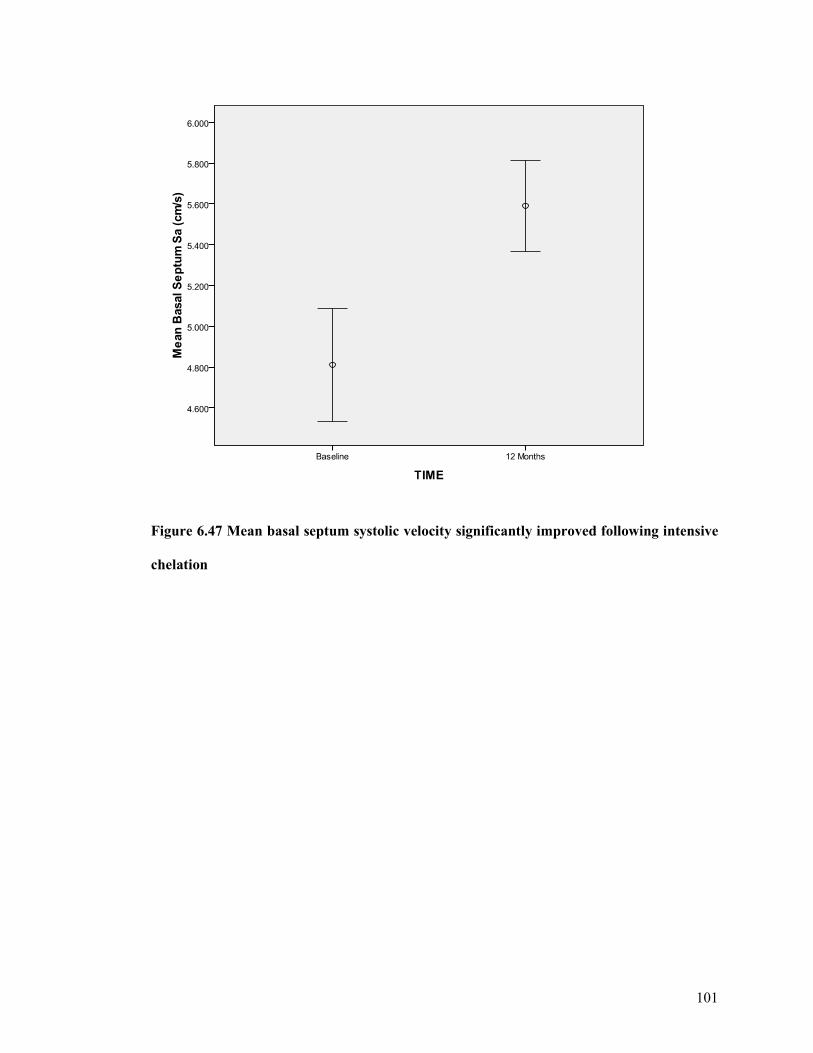
101
Figure 6.47 Mean basal septum systolic velocity significantly improved following intensive
chelation
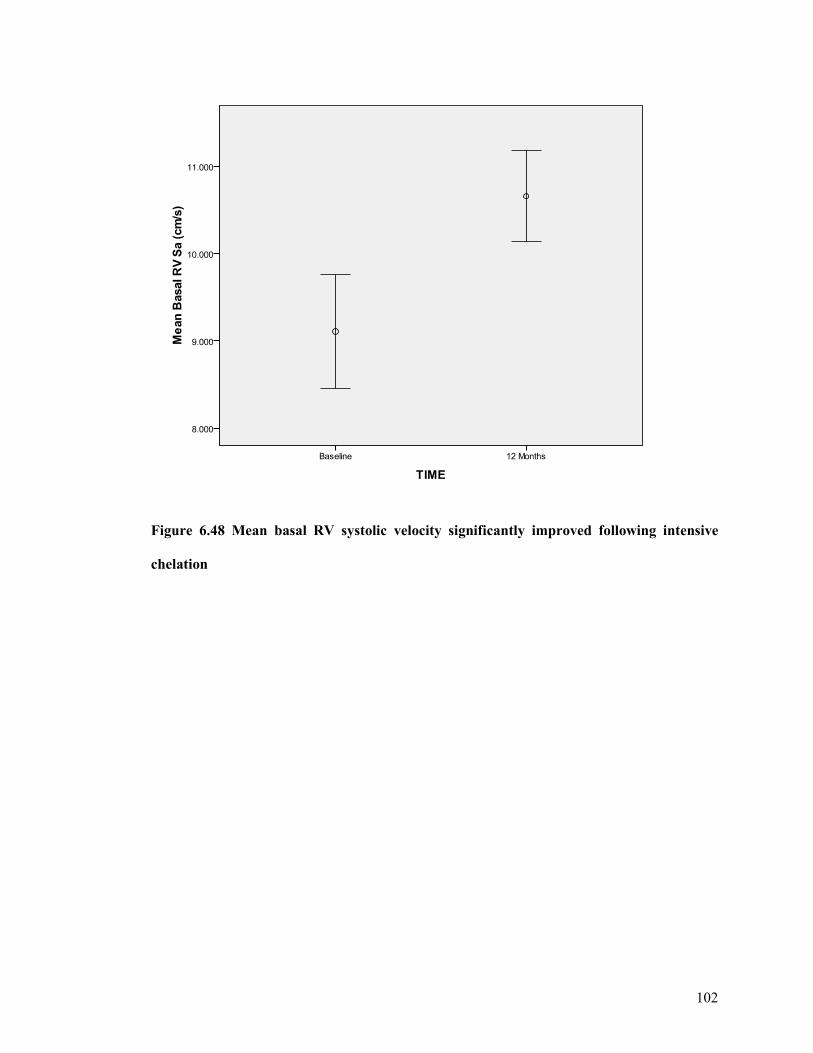
102
Figure 6.48 Mean basal RV systolic velocity significantly improved following intensive
chelation
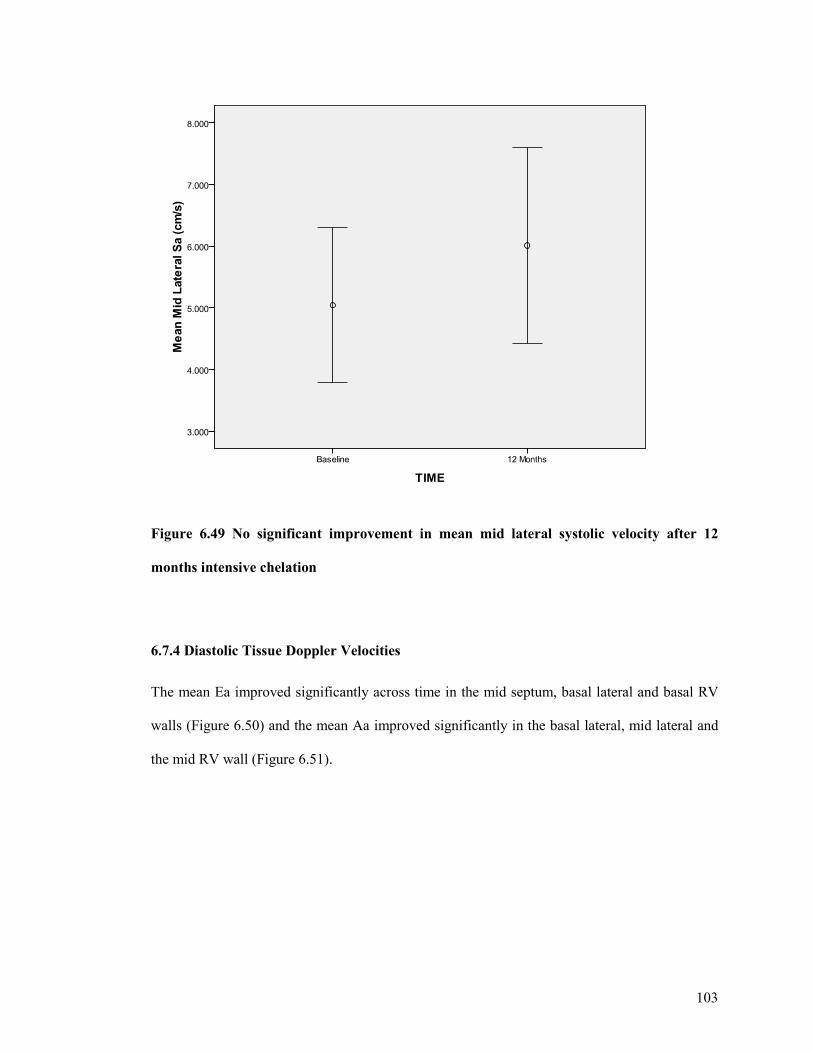
103
Figure 6.49 No significant improvement in mean mid lateral systolic velocity after 12
months intensive chelation
6.7.4 Diastolic Tissue Doppler Velocities
The mean Ea improved significantly across time in the mid septum, basal lateral and basal RV
walls (Figure 6.50) and the mean Aa improved significantly in the basal lateral, mid lateral and
the mid RV wall (Figure 6.51).
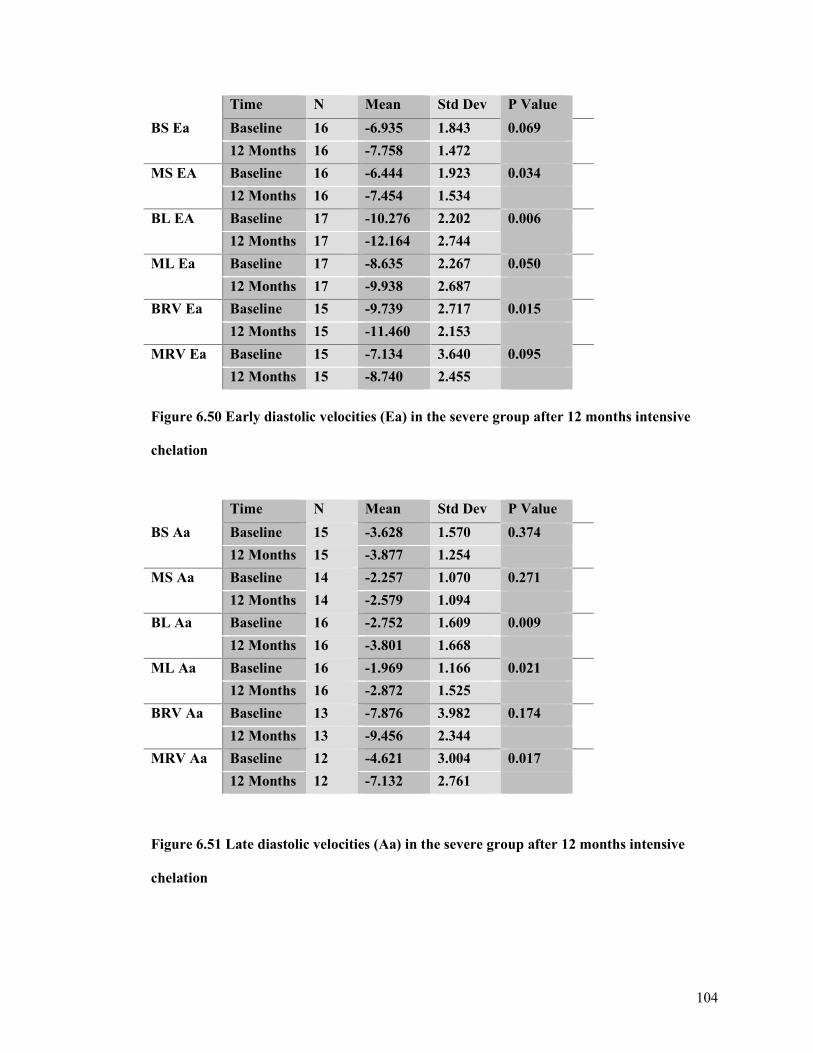
104
Time N Mean Std Dev P Value
BS Ea Baseline 16 -6.935 1.843 0.069
12 Months 16 -7.758 1.472
MS EA Baseline 16 -6.444 1.923 0.034
12 Months 16 -7.454 1.534
BL EA Baseline 17 -10.276 2.202 0.006
12 Months 17 -12.164 2.744
ML Ea Baseline 17 -8.635 2.267 0.050
12 Months 17 -9.938 2.687
BRV Ea Baseline 15 -9.739 2.717 0.015
12 Months 15 -11.460 2.153
MRV Ea Baseline 15 -7.134 3.640 0.095
12 Months 15 -8.740 2.455
Figure 6.50 Early diastolic velocities (Ea) in the severe group after 12 months intensive chelation
Time N Mean Std Dev P Value
BS Aa Baseline 15 -3.628 1.570 0.374
12 Months 15 -3.877 1.254
MS Aa Baseline 14 -2.257 1.070 0.271
12 Months 14 -2.579 1.094
BL Aa Baseline 16 -2.752 1.609 0.009
12 Months 16 -3.801 1.668
ML Aa Baseline 16 -1.969 1.166 0.021
12 Months 16 -2.872 1.525
BRV Aa Baseline 13 -7.876 3.982 0.174
12 Months 13 -9.456 2.344
MRV Aa Baseline 12 -4.621 3.004 0.017
12 Months 12 -7.132 2.761
Figure 6.51 Late diastolic velocities (Aa) in the severe group after 12 months intensive chelation
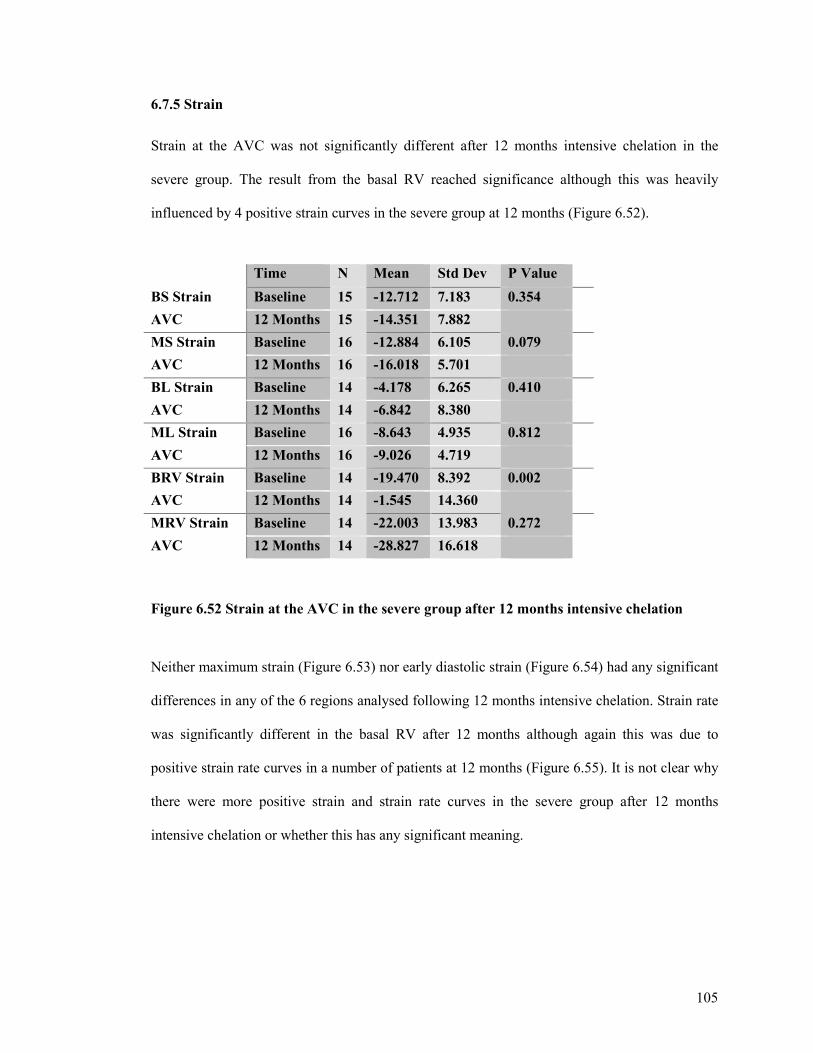
105
6.7.5 Strain
Strain at the AVC was not significantly different after 12 months intensive chelation in the
severe group. The result from the basal RV reached significance although this was heavily
influenced by 4 positive strain curves in the severe group at 12 months (Figure 6.52).
Time N Mean Std Dev P Value
BS Strain Baseline 15 -12.712 7.183 0.354
AVC 12 Months 15 -14.351 7.882
MS Strain Baseline 16 -12.884 6.105 0.079
AVC 12 Months 16 -16.018 5.701
BL Strain Baseline 14 -4.178 6.265 0.410
AVC 12 Months 14 -6.842 8.380
ML Strain Baseline 16 -8.643 4.935 0.812
AVC 12 Months 16 -9.026 4.719
BRV Strain Baseline 14 -19.470 8.392 0.002
AVC 12 Months 14 -1.545 14.360
MRV Strain Baseline 14 -22.003 13.983 0.272
AVC 12 Months 14 -28.827 16.618
Figure 6.52 Strain at the AVC in the severe group after 12 months intensive chelation
Neither maximum strain (Figure 6.53) nor early diastolic strain (Figure 6.54) had any significant
differences in any of the 6 regions analysed following 12 months intensive chelation. Strain rate
was significantly different in the basal RV after 12 months although again this was due to
positive strain rate curves in a number of patients at 12 months (Figure 6.55). It is not clear why
there were more positive strain and strain rate curves in the severe group after 12 months
intensive chelation or whether this has any significant meaning.
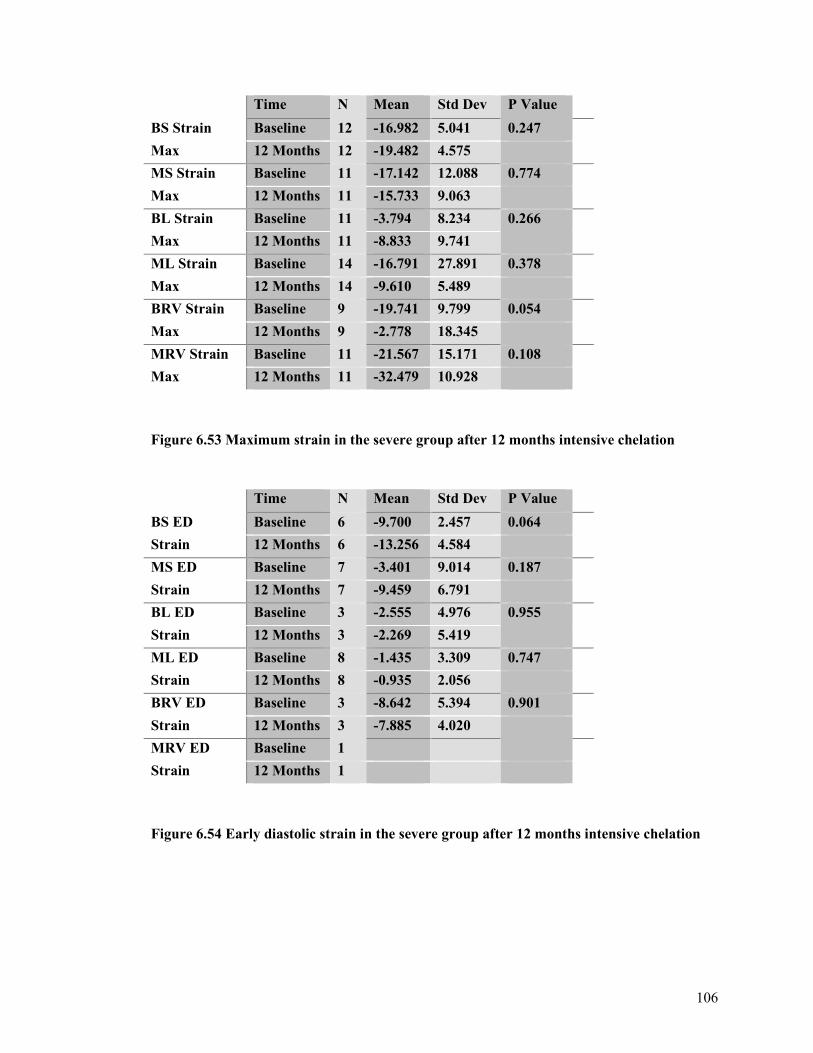
106
Time N Mean Std Dev P Value
BS Strain Baseline 12 -16.982 5.041 0.247
Max 12 Months 12 -19.482 4.575
MS Strain Baseline 11 -17.142 12.088 0.774
Max 12 Months 11 -15.733 9.063
BL Strain Baseline 11 -3.794 8.234 0.266
Max 12 Months 11 -8.833 9.741
ML Strain Baseline 14 -16.791 27.891 0.378
Max 12 Months 14 -9.610 5.489
BRV Strain Baseline 9 -19.741 9.799 0.054
Max 12 Months 9 -2.778 18.345
MRV Strain Baseline 11 -21.567 15.171 0.108
Max 12 Months 11 -32.479 10.928
Figure 6.53 Maximum strain in the severe group after 12 months intensive chelation
Time N Mean Std Dev P Value
BS ED Baseline 6 -9.700 2.457 0.064
Strain 12 Months 6 -13.256 4.584
MS ED Baseline 7 -3.401 9.014 0.187
Strain 12 Months 7 -9.459 6.791
BL ED Baseline 3 -2.555 4.976 0.955
Strain 12 Months 3 -2.269 5.419
ML ED Baseline 8 -1.435 3.309 0.747
Strain 12 Months 8 -0.935 2.056
BRV ED Baseline 3 -8.642 5.394 0.901
Strain 12 Months 3 -7.885 4.020
MRV ED Baseline 1
Strain 12 Months 1
Figure 6.54 Early diastolic strain in the severe group after 12 months intensive chelation
107
Time N Mean Std Dev P Value
BS SR Baseline 15 -1.028 0.371 0.228
12 Months 15 -1.185 0.519
MS SR Baseline 16 -1.134 0.339 0.543
12 Months 16 -1.217 0.426
BL SR Baseline 14 -0.581 0.570 0.308
12 Months 14 -0.793 0.395
ML SR Baseline 16 -0.560 0.592 0.373
12 Months 16 -0.733 0.490
BRV SR Baseline 12 -1.387 0.679 0.021
12 Months 12 -0.514 1.072
MRV SR Baseline 15 -1.522 0.704 0.083
12 Months 15 -2.104 1.100 Figure 6.55 Strain rate in the severe group after 12 months intensive chelation 6.7.6 Tissue Tracking
The mean tissue tracking increased from baseline to 12 months (Figure 6.56) in all segments
although the increases were significant only in the mid walls and not the basal segments.
Time N Mean Std Dev P Value
BS TT Baseline 16 8.152 2.870 0.901
12 Months 16 8.365 5.757
MS TT Baseline 15 5.247 2.182 0.013
12 Months 15 6.821 1.950
BL TT Baseline 17 8.666 2.565 0.956
12 Months 17 8.757 6.268
ML TT Baseline 17 5.912 1.822 0.007
12 Months 17 7.290 2.134
BRV TT Baseline 15 16.130 6.406 0.059
12 Months 15 19.764 4.441
MRV TT Baseline 15 8.556 4.664 0.008
12 Months 15 13.030 4.078
Figure 6.56 Tissue tracking in the severe group after 12 months intensive chelation
108
6.10 TWELVE MONTH RESULTS FOR RANDOMISED COHORT
6.8.1. Cohort Characteristics at baseline
Combined Deferoxamine P value
Number randomized 32 (49%) 33 (51%) na
Age (years) 28.8 ±4.2 28.7 ±5.3 0.9
Gender Male
Female
14 (44%)
18 (56%)
13 (39%)
20 (61%)
0.5
Body Surface Area (m2) 1.53 ±0.15 1.56 ±0.16 0.5
Deferoxamine dose (mg/kg/day) 40.6 ±13.2
(5days/wk)
40.5±14.0
(5days/wk)
1.0
CMR measures:
Myocardial T2* (ms) [normal >20]
Liver T2* (ms) [normal >19]
LV end diastolic volume (mL) [M:77-195, F:52-141]
LV end systolic volume (mL) [M:19-72, F:13-51]
LV ejection fraction (%) [>56%]
11.7 (0.08)
4.9 (0.52)
125 ±30.5
43.3 ±16.1
65.8 ±6.2
12.4 (0.11)
4.2 (0.62)
128 ±37.4
45.9 ±18.7
64.7 ±6.5
0.3
0.5
0.3
0.4
0.5
Blood measures:
Transfusional red blood cell input (mL/kg/year)
Hemoglobin (g/L)
Total white blood cell count (x109/L)
Absolute neutrophil count (x109/L)
Platelets (x109/L)
133.4 ±34.9
106 ±9.6
7.7 ±3.26
4.1 ±1.8
277 ±124
130.2 ±38.6
102 ±9.5
8.0 ±3.67
4.4 ±1.5
296 ±148
0.7
0.1
0.8
0.5
0.7
Hepatitis C positive
Yes
No
23 (72%)
9 (28%)
26 (79%)
7 (21%)
0.4
Biochemistry
Serum ferritin (µg/L) [M: 5-104, F: 4-254 ]
Alanine transaminase (IU/L) [5-35 ]
BNP (pmol/L) [<100 ]
Creatinine (mg/dL) [0.6-1.2]
Zinc (µg/dL) [70-130 ]
1574 (11%)
54 ±48
23.4 ±25.3
0.77 ±0.21
94.5 ±16.6
1379 (10%)
66 ±43
24.17 ±26.3
0.74 ±0.23
98.5 ±17.2
0.5
0.3
0.9
0.6
0.4
109
The groups were well matched at baseline for all characteristics (255). As previously reported
(255) the T2* improved in both the combined therapy groups (desferioxamine and deferiprone)
and the desferioxamine and placebo group (placebo group). The T2* increased significantly
more in the combined therapy group 11.7ms at baseline to 17.7ms at 12 months (P<0.001)
versus 12.4 ms at baseline to 15.7ms at 12 months (P=0.001) in the placebo group. The between
group difference was significantly in favour of the combined treatment group with an estimate
of a 10% increase in the combined group compared with the desferioxamine only group (95%
CI 2 to 19%, P=0.02).
6.8.2. Standard Echo Data
Looking at the echo parameters in the combined therapy (desferioxamine and deferiprone) group
there were some significant improvements in the mean values across the 12 month treatment
period. The following improvements were found.
1.) The 4 chamber EF increased from 60% to 63.9% at 12months, P=0.006
2.) The M mode EF increased from 59.2% to 65.2% at 12 months, P=0.000
3.) LV systolic diameter reduced from 3.3 cm to 3.1 cm at 12 months, P=0.007.
There was no significant improvement in the mean left ventricular diastolic dimension or in the
mean BNP levels which were 23.4 at baseline and 25.3 at 12 months P=0.602.
When the corresponding parameters were analysed in the placebo group at 12 months, compared
with baseline, the changes weren’t so marked. The mean M mode EF improved significantly
from 59.2% to 61.6% but there was no significant improvement in the 4 chamber EF. The left
ventricular diastolic dimension changed significantly but in an adverse direction, the LV getting
bigger following 12 months of treatment. The left ventricular systolic dimension also increased
although the difference was non significant. Again, the mean BNP values did not significantly
change over the 12 months of treatment.
110
6.8.3. Tissue Doppler Data
6.8.3.1 In The Treatment Arm
When the tissue Doppler data was compared for the group receiving combined therapy at 12
months compared with baseline, only the following significant changes were seen.
1.) Basal Septum Aa increased from -4.5 to -5.1 cm/s, P=0.021.
2.) Mid Septum Aa increased from -2.9 to -3.4 cm/s, P=0.005.
3.) Basal Lateral wall Sa increased from 5.6 to 6.8 cm/s, P=0.032.
Basal Lateral wall Aa increased from -3.8 to -4.9 cm/s, P=0.021.
4.) Mid Lateral wall Sa increased from 4.6 to 5.8cm/s, P=0.008.
Mid Lateral wall Aa from -2.6 to -4.6 cm/s, P=0.030.
Mid Lateral wall TT increased from 5.5 to 7.1cm/s, P=0.016.
5.) Basal RV wall Aa increased from -9.6 -10.6 cm/s, P=0.043.
6.) Mid RV wall Sa increased from 7.3 to 8.3 cm/s, P=0.05.
Mid RV wall Aa increased from -5.2 to -8.1 cm/s, P=0.000.
Mid RV wall TT increased from 12.2 to 14.8 mm, P=0.04.
The remaining parameters showed no significant improvement after 12 months of combined
chelation therapy.
6.8.3.2 In The Placebo Arm
In the trial placebo group the following significant improvements were seen when comparing
baseline to 12 months therapy.
111
1.) Basal Septum Sa increased from 5.0 to 5.5 cm/s, P=0.010
Basal Septum TT increased from 8.9 to 9.9 mm, P=0.011.
2.) Mid Septum TT increased from 5.6 to 7.1 mm, P=0.028.
3.) Basal Lateral wall Sa increased from 5.4 to 6.1 cm/s, P=0.042.
Basal Lateral wall Ea increased from -10.3 to -11.7 cm/s, P=0.005
Basal Lateral wall Aa increased from -3.5 to -4.3 cm/s, P=0.006.
Basal Lateral wall TT increased from 8.6 to 10.3 mm, P=0.000
4.) Mid Lateral wall Aa increased from -2.4 to -3.3 cm/s, P=0.008.
5.) Basal RV wall Sa increased from 10.7 to 11.6 cm/s, P=0.013.
Basal RV wall TT increased from 19.5 to 21.9 mm, P=0.016
6.) Mid RV wall Sa increased from 6.7 to 8.3 cm/s, P=0.001.
Mid RV wall Ea increased from -6.6 to -7.6 cm/s, P=0.031.
Mid RV wall Aa increased from -5.7 to -7.0 cm/s, P=0.036.
Mid RV wall TT increased from 10.5 to 13.6 mm, P=0.001.
The remaining parameters showed no significant improvement after 12 months of treatment.
Although there were a number of parameters that improved significantly after 12 months
combination therapy only late diastolic velocity (Aa) improved in all regions analysed. In the
placebo group there were also a number of significant improvements, frequently in the
longitudinal displacement measure (TT), but also in the Aa in the basal and mid lateral walls.
112
CHAPTER 7: CONCLUSIONS & DISCUSSIONS
7.1 OVERALL STUDY POPULATION
The 167 patients screened were divided by T2* categories. 108 patients (65%) had a T2* <20ms
indicating significant cardiac iron. Of these 22 (13% of total screened) had severe cardiac iron,
i.e. T2*<8ms. The remaining 59 had T2*>20ms indicating no clinically significant cardiac iron.
The proportion of the screened group with cardiac iron, i.e. a T2* <20ms was higher than
expected compared with other reported series. The predicted number screened of 167 was
calculated to identify the required number of patients with mild to moderate cardiac iron
loading. This was based on an anticipated 40% of screened patients who were maintained on
desferioxamine having mild to moderate cardiac iron loading (T2* 8-20ms) and therefore being
eligible for the trial. Other studies have found varying degrees of cardiac iron involvement in
those at risk, 16% in a retrospective study looking at costs of care (256) & 10% in a study by
Cunningham (257). A study from Pakistan found 59% of patients had one or more cardiac
abnormality including 23% with systolic dysfunction and 29% with diastolic dysfunction (258).
Vichinsky found a 20% rate of cardiac disease in thalassaemia (259) patients undertaking
regular blood transfusions and an epidemiological study from Germany published in 2000 found
a rate of 13 % for cardiac siderosis and complications (260) in treated thalassaemics between the
ages of 9 and 15. Overall in our group there was a high ratio of significant cardiac iron loading.
It is unclear why such high rates were found. These patients were all cared for by haematologists
and were receiving the best available therapy. Many possibilities could account for why such
high proportions of cardiac iron were found. These include poor uptake of chelation treatment,
inadequate desferioxamine dosing, poor compliance with chelation therapy, poor access to
specialists with an interest in assessing cardiac status, poor availability of techniques for
imaging cardiac status, lack of availability / cost of Deferiprone. Ultimately, in our study group,
113
it is not clear which of these factors have contributed to the relatively high proportion of patients
with significant cardiac iron overload, although the causes are likely to be multifactorial.
7.2 BRAIN NATRIURETIC PEPTIDE
Overall measuring brain natriuretic peptide values did not help us to stratify an individual
patients risk for cardiac iron overload or of developing cardiac failure. Those with BNP levels
greater than 100 all had significant cardiac iron and therefore levels above this threshold should
indicate the need for urgent cardiac evaluation with MRI and TTE and optimisation of chelation
therapy. However, of those with severe cardiac iron (T2*<8ms), only 2 patients had a BNP of
>100pg/ml. Indeed, of the 22 patients with T2* <8ms, 6 had a BNP level of <20 pg/ml and 1
patient had a BNP level of <5pg/ml. These findings are consistent with other groups who have
looked into the role of BNP in assessing cardiac iron. A group from Turkey found that BNP
levels were normal in a group of patients with abnormal myocardial performance index
calculated using pulsed tissue Doppler imaging (261). A group from Athens looked at the
relationship between BNP and the evaluation and management of thalassaemia heart disease.
They divided the group into those with NYHA class 3/4 symptoms (group A) those with class 2
symptoms and EF <55% (group B) and those with normal systolic function, group C. They
found that those in group A had significantly higher BNP levels than those in group B & C.
However there were no significant differences in BNP levels between those in groups B & C
(262). They conclude that BNP may have limited clinical usefulness in the thalassaemia
population. Our results reach a similar conclusion (253). In our study those with severe cardiac
iron loading, T2* of < 8ms had a trend towards higher mean BNP levels (72.6 +/- 35.7 pg/ml)
than those with no cardiac iron, T2*>20ms (BNP 15.1 +/- 2.2 pg/ml). However the mean BNP
levels were not statistically different and in the severe iron group the mean value was heavily
influenced by a few outliers. Again we found no significant difference in mean BNP levels
between those with mild – moderate cardiac iron levels (29.0 +/- 6.6 pg/ml) and those with no
114
iron. Overall, the BNP measurement in this cohort was redundant as it was only significantly
elevated in those who had clinically evident heart failure and as such added nothing additional.
In a study evaluating the role of N terminal pro BNP, a Greek group compared NT pro BNP
levels and E/E’ (a marker of diastolic function) in 52 patients with transfusion dependent
thalassaemia major with normal LV systolic function and 52 age matched controls. They found
that NT BNP and E/E’ were increased in thalassaemia patients and were well correlated. They
concluded that NT pro BNP increases in thalassaemia patients and is related to age and diastolic
function (263). A Turkish group studied the relationship between NT pro BNP and ventricular
function assessed by tissue Doppler velocities in thalassaemia patients compared to age matched
healthy individuals. They found that NT pro BNP had an inverse correlation with LV and RV
systolic velocities which were reduced compared with the healthy controls (264).
We had aimed to explore whether changes from baseline BNP following scheduled blood
transfusion could help to stratify which patients had significant cardiac iron loading and were at
risk for cardiac failure. Our provisional results were encouraging, in a patient with no cardiac
iron and BNP levels pre transfusion of 19.4pg/ml the BNP level immediately post blood
transfusion remained static at 18.1 pg/ml. The BNP level was checked for 5 half lives and
remained fairly constant at 25.3 pg/ml, 20.5 pg/ml, 20.6 pg/ml, 24.7 pg/ml and 21.1pg/ml. In
contrast, in another patient with significant cardiac iron loading and a pre transfusion BNP of
438 pg/ml, the BNP level increased by over 25% to a post transfusion level of 585 pg/ml. This
level decreased to 394 pg/ml after 24 hours, comparable to the pre transfusion level. A high
proportion of our patient cohort had travelled long distances across Sardinia to attend for the
study in Cagliari and their routine transfusions were conducted at their local haematology
clinics. For those who were local, chance dictated whether their transfusion happened to occur
on the day when they were attending for study follow up. For those with transfusions scheduled
during our visits some were reluctant to have yet more additional blood tests over a 2 hour
115
period and the following day. These factors meant we were unable to recruit many patients for
this section of the study and in particular, unfortunately we were unable to assess any of the
patients with cardiac iron present but normal BNP levels at rest to see how their BNP level
responded with the challenge of blood transfusion. If despite the normal BNP level at rest, there
was subtle LV dysfunction secondary to cardiac iron loading then it may be possible to detect an
increase in BNP levels following a blood transfusion compared to those with no cardiac iron and
normal BNP levels which remained fairly static as described above. This line of investigation
with BNP may prove useful at identifying those with cardiac iron who are at risk of
decompensation, although further work is required
7.3 STANDARD ECHO DATA
Worldwide, echocardiography forms the mainstay of evaluation for cardiac involvement in
thalassaemia patients. However, it has long been recognised that ejection fraction calculated
from transthoracic echocardiography is a poor indicator of cardiac iron loading and that
reduction in ejection fraction occurs late in the disease process and conveys a poor prognosis.
With the advent of cardiac MRI and T2* assessment we now have a means of quantifying iron
load in different organs and importantly now have an accurate way of assessing cardiac iron
load, a parameter that previously eluded us. Previously serum ferritin of >2500 ucg/l and liver
iron from biopsy of >15mg/gm dry weight were used as surrogate markers to identify those at
high risk of cardiac complications, cardiac MRI has firmly established these techniques to be
inaccurate (75). The frequency of abnormalities detected on TTE is not well studied and little is
known about their relationship with cardiac iron load. As early as 1978 a study demonstrated a
high proportion of echo abnormalities in those at risk of myocardial iron deposition (121). They
identified normal ejection fraction in all but 4 of the patients studied, all four however died
within a six month period, suggesting that deterioration in systolic function occurs too late to be
a useful means for risk stratification (121). We demonstrated a high frequency of abnormalities
116
on TTE evaluation. However, with the exception of reduced left ventricular function (EF<55%)
which had a positive predictive value of 90% for cardiac iron and mild or moderate MR or TR
with a positive predictive value of 80% the other parameters analysed had poor ability in
predicting cardiac iron load. There have not been any previous studies documenting the
frequency of valve lesions and its predictive value in identifying cardiac iron. In this study valve
lesions were graded by visual assessment which is subject to observer variation and error.
Further investigation in this area with more quantitative valve assessment including measuring
PISA (proximal isovelocity surface area), vena contracta, regurgitant volume, regurgitant
fraction and regurgitant jet area may prove useful.
7.4 COMPARISON BETWEEN EJECTION FRACTION FROM TTE & FROM CARDIAC MRI
The present study has demonstrated a good correlation between ejection fraction calculated from
TTE and cardiac MRI. The strongest correlation between echo EF and MRI EF was obtained
from the M mode measurements with a significant correlation of 0.736 with P=0.000. This is the
first study comparing different methods for calculating ejection fraction in a thalassaemia
population. There have been a number of studies comparing the ejection fraction calculated from
echo and cardiac magnetic resonance imaging in other populations. There have been conflicting
results. Some studies have demonstrated poor correlation and propose cardiac MRI to be the
superior technique given its 3D volume assessment for ejection fraction calculation with
superior image quality (265). Cardiac MRI is not subject to some of the limitations of TTE such
as poor echo windows & suboptimal image quality, that often precludes the use of Simpsons
biplane volume and ejection fraction assessment and the use of regional estimates to calculate
global function (M mode EF calculation) are known to be limited. In a study of heart failure
patients, ejection fraction from TTE, cardiac MRI and radionuclide ventriculography were
compared. There was poor correlation between the techniques. The strongest relationship was
117
between cardiac MRI and 2d echo Simpson’s biplane assessment. This is unsurprising given that
both methods calculate ejection fraction using a similar principle (summation of slice areas).
However in the TTE group 30% had image quality that was too poor to use the Simpson
technique (265). Further work by the same group evaluated the use of different techniques for
assessing cardiac function in a 1 stop clinic for heart failure patients. It is important to note that
this was not performed in thalassaemia patients who by merit of their slim builds tend to be
more echogenic than in the general adult population. They found only a limited correlation
between CMR and echo with a correlation coefficient of 0.6, which is lower than the values we
obtained (266). Cardiac MR was acceptable to patients but the scanning time was almost twice
as much as for echo (266). However the good reproducibility lends itself to longitudinal studies
of progression and treatment in patients with heart failure (266). Other studies have
demonstrated a good correlation particularly when intravenous contrast is used to enhance echo
endocardial border definition (267). In their study, Skjaerpe et al found 23 patients had a
difference in EF of > or = to 10% between non contrast echo and cardiac MRI calculation and
this figure decreased to 0 after the addition of intravenous contrast to reassess echo EF. The
same group have demonstrated further improvements in correlation by using apical long axis
rather than apical 2 chamber in addition to the 4 chamber view for Simpson’s calculation (268).
Ultimately what limits the reliability of EF from TTE is related to the inherent limitations of
echo as a technique, mainly poor endocardial definition, which can to a degree be overcome
with the use of intravenous contrast agents to opacity the left ventricular cavity and poor echo
windows, inherent to the individual patient that are more difficult to overcome.
In our study the correlation demonstrated was much better; likely because of a small number of
operators and that generally thalassaemia patients are good subjects for transthoracic
echocardiography. For practical purposes EF from TTE gives a good indication of cardiac
function and an EF of < 50% gives a high likelihood of significant cardiac iron loading.
118
7.5 DIASTOLIC ECHO DATA
We did not find a significant relationship between transmitral E:A ratio and cardiac iron from
T2*. It is recognised that the transmitral E:A ratio is a poor measure of diastolic function as it is
heavily influenced by loading conditions. Thalassaemia patients will have different loading
conditions dependent on where they are in their transfusion cycle, so it is perhaps not surprising
that we did not observe a relationship. We also looked at e wave deceleration times and again
this did not correlate with the severity of cardiac iron loading, the mean times being similar in
the group with no cardiac iron compared to the group with severe cardiac iron. We did not
assess some of the other conventional markers of diastolic function such as pulmonary vein flow
profile and isovolumetric relaxation period. It is well recognised that these assessments of
diastolic function are influenced by loading conditions and therefore may not be as useful in
thalassaemia patients where the loading conditions are highly variable from day to day and are
influenced by blood transfusions. Overall, the standard Doppler measures of diastolic function
were not useful.
7.6 SYSTOLIC FUNCTION FROM MYOCARDIAL TISSUE DOPPLER VELOCITIES
There is a fairly limited evidence base for the use of tissue Doppler techniques to assess patients
with thalassaemia. Our group in 2003 published the first work indicating the role of tissue
Doppler velocities (183). Vogel’s study identified 38 patients with abnormal iron loading of the
myocardium and 33 of these had regional wall motion abnormalities identified by abnormal
myocardial systolic velocities. In 29 out of 33 patients the abnormalities were in the septum. In
this study we demonstrated significantly lower mean systolic velocities in the group with severe
cardiac iron load than those with no cardiac iron in the basal and mid sections of both the
septum and RV free wall. The systolic velocities in the lateral wall were not significantly
different across the cardiac iron severity groups. The septum is the main location for iron
deposition and can help explain the impaired systolic velocities. It is of note that the RV wall
119
had significant reduction in systolic velocities suggesting that iron deposition in the right
ventricle may be more substantial than previously thought. Lateral wall function and velocities
appeared least affected by cardiac iron. In a study of normal subjects the systolic velocities in
the basal septum were 6.7 +/- 1.4cm/s and in the basal lateral wall 6.7 +/- 1.5cm/s (269). This
compares with our group without cardiac iron where the mean basal septum values were lower
at 5.7 +/- 1.18cm/s and similar in the basal lateral wall at 6.4 +/- 1.7cm/s. A group from Turkey
showed significant decreases in the peak systolic velocity in both the LV and RV in patients
with thalassaemia compared with controls (264). An Italian group looked at tissue Doppler
velocities in an asymptomatic group of patients with thalassaemia and compared them with
controls. They found significantly lower myocardial systolic tissue Doppler velocities in the
basal LV, septum and RV walls (270). Hamdy’s group found lower myocardial systolic
velocities in the basal lateral wall but not the basal septum or basal RV wall in thalassaemia
patients compared to controls (271).
Our findings are in keeping with those from other studies, indicating reduced systolic velocities
in those with thalassaemia compared to the values obtained from normal subjects. In our study
the thalassaemia group without iron can be thought of as the control group and we demonstrated
significantly lower systolic velocities in the septum and RV walls in the group with significant
cardiac iron. Further work will be required to determine the best region to analyse, although in
studies to date the septum appears to be consistently involved, which given the septum is the
main location for iron deposition, is perhaps no surprise. Obtaining TDI data for systolic
velocities is less user and image dependent than conventional EF estimation, making this
technique a very promising measure to determine the likelihood of significant cardiac iron
loading.
120
7.7 DIASTOLIC FUNCTION FROM TISSUE DOPPLER MEASURES
Studies have correlated the E/Ea ratio with PCWP (pulmonary capillary wedge pressure) and
found that a PCWP of greater than 15mmhg can be predicted from an E/Ea ratio of greater than
11 in patients with preserved LVEF and of greater than 15 in patients with impaired LV systolic
function (272). Other groups have also demonstrated good correlation between E/Ea ratio and
LVEDP and PCWP (273). In a review article by Dokainish, it is concluded that an E/Ea of <10
indicates normal left ventricular filling pressures, while an E/Ea of >15 indicates elevated left
ventricular pressures. A ratio of between 11-14 is in a grey zone where other variables such as
left atrial volume, pulmonary venous flow profile and brain natriuretic peptide levels should be
taken into consideration (274;275). A group in India studied thalassaemia patients with normal
systolic function and compared them with matched healthy controls. They found that the E/A
ratio was the same between the groups but that in the thalassaemia group the E/Ea ratio,
calculated from tissue Doppler velocities at the lateral mitral annulus, was higher than in the
control group, although the mean values for the group were still <10 (9.46+/- 1.5) (276). They
concluded that diastolic dysfunction preceded systolic dysfunction.
Of interest in our study, the group with significant cardiac iron loading had significantly higher
E/Ea ratios in the basal septum (14.9 +/- 4.5) than the group with no significant cardiac iron.
This would suggest higher left ventricular filling pressures in the group with severe cardiac iron.
This may be logical as the myocardium may become stiffer as the level of iron infiltration
increases. However, also worth noting is that in the group with no cardiac iron where the mean
EF from 4 chamber echo was normal at 63% the mean E/Ea ratio was 12.5 in the basal septum.
This suggests that even in the group with no cardiac iron and normal ventricular function the
diastolic function is abnormal with evidence of borderline elevated left ventricular filling
pressures. While anaemia may contribute to some diastolic dysfunction the use of E/Ea ratio,
which forms an index of volume load corrected to myocardial relaxation, attempts to account for
differences in loading conditions. However it is also recognised that E/Ea ratio has a better
121
correlation with LV filling pressures in patients with depressed EF than in those with preserved
EF (277). Also of note we demonstrated that in our study population the mean Aa velocity
(myocardial velocity during atrial systole) was significantly lower in the group with severe
cardiac iron loading than in group with T2*>20 ms. This finding was present in all regions
except the mid RV. Hamdy’s group had also looked at Aa velocities and interestingly found
significantly higher values in the basal septum and basal RV wall in thalassaemia patients
compared to controls (271). This is in contrast to our findings as although we did not have a
control group one could consider those with no cardiac iron and T2* greater than 20ms to
represent our control group. A study in Greece by Aessopos’s group had identified patients
whom developed systolic dysfunction and looked at earlier echocardiograms for predictive
factors. They identified low values of diastolic A wave as a predictor for deteriorating LV
function over 10 years (278). These diastolic changes are intriguing and it would be interesting
to follow patients with abnormal E/Ea ratios across a period of time to see if they can predict
patients whom are at risk of cardiac decompensation or perhaps atrial arrhythmias such as atrial
fibrillation.
7.8 STRAIN
An Italian group looked at strain imaging in an asymptomatic group of patients with
thalassaemia and compared them with controls. They found significantly lower strain measures
in the basal LV, septum and RV walls (270). Hamdy’s group found that their strain results
matched their results for systolic velocities with a lower value of strain in the basal lateral LV
wall compared to controls (271). In our study we were unable to find any clear relationships
between strain measured at any of the 3 time points and cardiac iron loading from T2*. Our
strain curves were highly variable and this may have influenced the lack of clear relationships.
Strain is influenced by pressure and volume and this may account for some of the variability
(151). In some subjects we identified post systolic strain; a finding previously described in
122
studies looking at cardiac ischaemia and felt to be an early sign that represents the late
asynchronous contraction that falls within the period of isovolumetric relaxation. Also called
post systolic shortening, post systolic thickening or post systolic motion it has been associated
with the presence of ischaemia and myocardial viability (279;280). Other studies have suggested
a role for post systolic motion in identifying different substrates of infarction (transmural versus
subendocardial) and different models of viability (stunned or hibernating) (281-283). It is not
clear what post systolic strain represents in this population but in our study it did not relate to
cardiac iron load severity. Studies of normal subjects vary in the values quoted for strain. These
differences likely relate to different methodologies (PW versus colour TDI), different frame
rates, placement of sample volumes in different regions and different values for different walls.
Normal longitudinal strain is quoted from -10 to -15% (151) to -9 to -30% (269). In our baseline
cohort the strain values were consistent with those published for normals except from the basal
lateral wall which had low strain values even in the group without significant iron.
The studies examining strain, including our own, have yielded mixed results so far and without
any clear relationship at this stage, strain does not appear to have a role in the assessment of
patients with transfusion dependent thalassaemia.
7.9 STRAIN RATE
Ours is the first study to date to examine strain rate in thalassaemia patients. Strain is a measure
of tissue deformation and is defined as the change in length normalized to the original length.
The rate or speed at which this change occurs is called strain rate. In general, peak systolic strain
rate is the parameter that comes closest to measuring local contractile function in clinical
cardiology. It is relatively volume independent and is less pressure dependent than strain (151).
Although the strain rate curves were less variable we did not demonstrate any relationship
between strain rate and cardiac T2*. Normal values for strain rate are between -1 to -1.5 (151).
The strain rate values in our cohort were consistent with those from a normal population except
123
for the lateral walls where the SR with severe iron was -0.64 +/- .5, no iron -0.87 +/- .9 and the
mid lateral wall severe iron -0.62 +/- .5, no iron -0.81 +/- .5. It is not clear why the SR values
were notably lower in the lateral wall especially given that the lateral wall systolic velocities
were least affected by cardiac iron loading However, in another cardiomyopathy, that of Fabry’s
disease, peak systolic strain and strain rate have shown improvement following enzymatic
substitution therapy (179). In its current form strain rate does not appear to have a role in the
management of transfusion dependent thalassaemia patients.
7.10 TISSUE TRACKING / LONGITUDINAL MOTION
There are no other studies looking at longitudinal displacement as a measure of cardiac iron load
or cardiac function in patients with transfusion dependent thalassaemia major. We found that the
longitudinal motion was less in those with severe cardiac iron as compared to those with no
cardiac iron in the basal and mid septum and RV walls. In the severe cohort who were treated at
the discretion of the supervising haematologist the TT (longitudinal displacement) increased
significantly across the 12 month treatment period in the mid walls of the septum, lateral and
RV free walls.
7.11 TISSUE DOPPLER ECHOCARDIOGRAPHY IN LONGITUDINAL STUDIES
The cohort with severe cardiac iron were excluded from randomisation and received best
medical care at the discretion of their local haematologists. The myocardial T2* score improved
significantly corresponding with significant de-ironing of the heart. The corresponding ejection
fraction from echo also improved significantly. The systolic velocities in the septum and RV
free wall improved significantly with de-ironing of the heart. In countries where cardiac T2*
assessment is limited, systolic velocities in the septum and RV may prove very useful to risk
stratify patients according to severity of cardiac iron loading and to track de-ironing of the heart
following a period of intensive iron chelation therapy. Ea in the mid septum and basal lateral
124
walls, Aa in the basal lateral, mid lateral and mid RV walls and TT in the mid septum and mid
RV walls are significantly reduced in those with severe cardiac iron compared to those with no
cardiac iron and the values increase significantly after a period of intensive chelation. These
parameters may be helpful in identifying those with severe cardiac iron and monitoring their
improvement following intensive iron chelation therapy.
7.12 RANDOMISED COHORT
The combined group had a significantly greater improvement in cardiac T2* score following 12
months combined treatment. There was a corresponding increase in the echo M mode and 4
chamber EF in addition to significant improvements in the LV systolic dimensions. This is in
contrast to the placebo group where the mean M mode EF did show some improvement but was
not significant and there was no real change in 4chamber EF. The LV diastolic dimensions
increased over the 12 months of treatment. When comparing the tissue Doppler data only the
late diastolic Aa velocity significantly improved over the 12 month period. This improvement
was seen in all the 6 different regions. It is not clear why the Aa velocities improved in our
cohort as the heart is deironed. It is perhaps suggestive of iron in the atrial walls causing reduced
atrial systolic force and contraction and hence a reduced Aa velocity. As the iron is removed
from the atrial walls the atrial function can improve and the atrial systolic velocities increase.
7.13 WHY ECHO IS AN IDEAL TOOL FOR ASSESSMENT
Whilst our study has not demonstrated a clear role for these new echo techniques in the
management of transfusion dependent thalassaemia patients it has demonstrated some useful
conclusions. Particularly with respect to assessing the likelihood of severe versus no cardiac
iron, some of the tissue Doppler systolic indices, diastolic indices and tissue tracking /
longitudinal motion values can be very useful. Echocardiography itself remains a hugely useful
tool for these patients, it is portable, easily available and clinicians are familiar with the
125
information it gives. Whilst none of the traditional or newer echo techniques can be used to
ultimately determine an individuals cardiac iron load (for which cardiac T2* MRI would be
required), a number of the newer parameters can give a very useful likelihood of significant
cardiac iron loading and be useful to assess which patients should be referred for cardiac MRI
T2* evaluation. Sequential changes in some of these newer echo techniques can also be used as
surrogate markers to determine which of those on intensive chelation regimens are responding
well and which may need more urgent repeat T2* assessment. This may prove essential in areas
where the availability of cardiac MRI is very limited and costly.
Echocardiography remains an essential tool for assessing function and sequential change in
function in this group of patients. We have demonstrated an excellent correlation between
function derived by echo and that generated from the gold standard, cardiac MRI assessment. In
the thalassaemia population some of the limitations of echo LV functional assessment are
reduced by the inherent characteristics of the population, young, slim and usually no respiratory
disease. This leads to improved endocardial definition and more accurate biplane Simpson’s
ejection fraction estimation, whilst global rather than regional LV abnormalities improve the
accuracy and reliability of M mode EF estimation.
Whilst cardiac MRI remains the definitive technique for determining cardiac iron involvement
in thalassaemia patients, transthoracic echocardiography will continue to provide the structural
and functional information on a day to day basis and can provide immediate information for the
clinician to help select which patients require T2* MRI assessment. It will remain essential for
monitoring changes in cardiac status, function and treatments, in addition to being an essential
practical tool for screening for pulmonary hypertension and RV abnormalities.
126
7.14 LIMITATIONS OF THE STUDY
The main limitation of this study is that we have not accounted for differences in preload related
to different haemoglobin levels at the time of assessment and differences related to timing of the
most recent blood transfusion. While this may appear to be an obvious source for error when
comparing BNP and tissue Doppler values between patients, many studies in the literature make
no mention of controlling for these differences (271;284;285). A few studies have attempted to
mimimise these variations, for example by taking patient blood samples and performing
echocardiography at the end of the week prior to blood transfusion (286). However, this still
allows for a variation of between 3 and 7 days before the next transfusion. Another group
sampled NT pro BNP on the 3rd day following blood transfusion (287). This is perhaps a better
method for standardisation, but, as with all the above studies, there is no mention of adjustment
for different pre-transfusion haemoglobin levels. What is clear from the literature is that there
are no clearly accepted methods to account for these important sources for variation in results.
Having not controlled for different haemoglobin levels and timimgs of transfuions may in part
explain why we failed to document significant differences in some of the measured parameters
between those with and without cardiac iron.
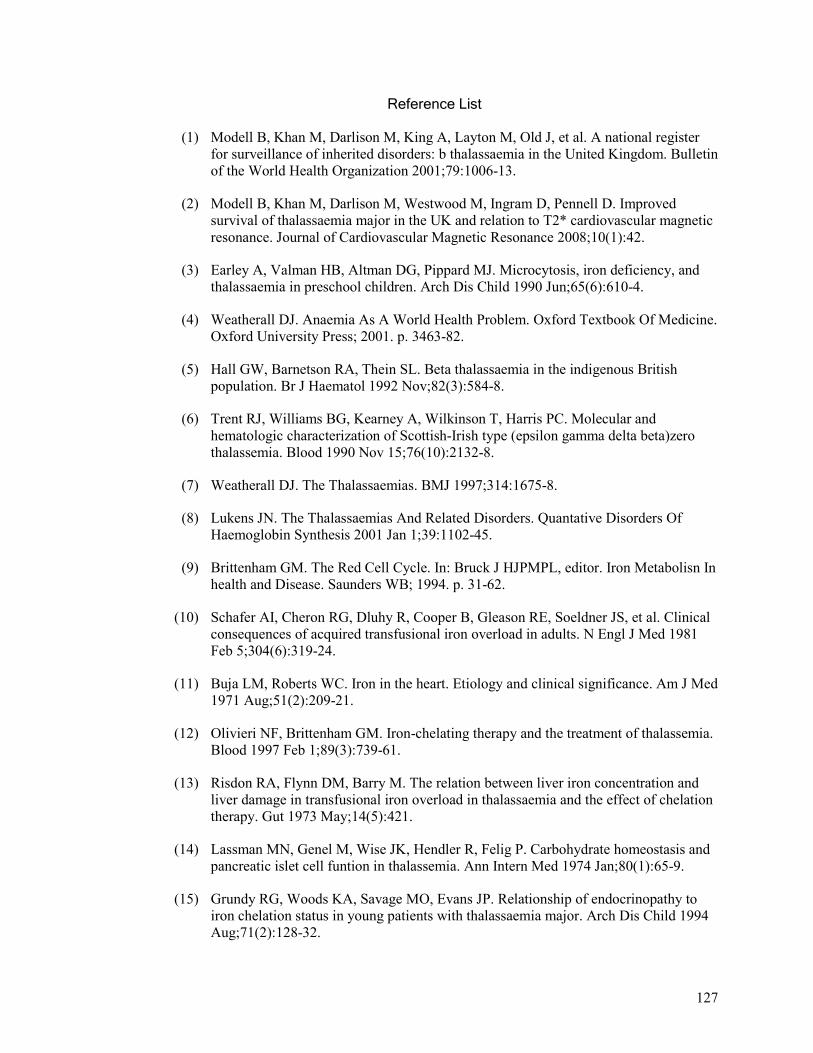
127
Reference List
(1) Modell B, Khan M, Darlison M, King A, Layton M, Old J, et al. A national register for surveillance of inherited disorders: b thalassaemia in the United Kingdom. Bulletin of the World Health Organization 2001;79:1006-13.
(2) Modell B, Khan M, Darlison M, Westwood M, Ingram D, Pennell D. Improved survival of thalassaemia major in the UK and relation to T2* cardiovascular magnetic resonance. Journal of Cardiovascular Magnetic Resonance 2008;10(1):42.
(3) Earley A, Valman HB, Altman DG, Pippard MJ. Microcytosis, iron deficiency, and thalassaemia in preschool children. Arch Dis Child 1990 Jun;65(6):610-4.
(4) Weatherall DJ. Anaemia As A World Health Problem. Oxford Textbook Of Medicine. Oxford University Press; 2001. p. 3463-82.
(5) Hall GW, Barnetson RA, Thein SL. Beta thalassaemia in the indigenous British population. Br J Haematol 1992 Nov;82(3):584-8.
(6) Trent RJ, Williams BG, Kearney A, Wilkinson T, Harris PC. Molecular and hematologic characterization of Scottish-Irish type (epsilon gamma delta beta)zero thalassemia. Blood 1990 Nov 15;76(10):2132-8.
(7) Weatherall DJ. The Thalassaemias. BMJ 1997;314:1675-8.
(8) Lukens JN. The Thalassaemias And Related Disorders. Quantative Disorders Of Haemoglobin Synthesis 2001 Jan 1;39:1102-45.
(9) Brittenham GM. The Red Cell Cycle. In: Bruck J HJPMPL, editor. Iron Metabolisn In health and Disease. Saunders WB; 1994. p. 31-62.
(10) Schafer AI, Cheron RG, Dluhy R, Cooper B, Gleason RE, Soeldner JS, et al. Clinical consequences of acquired transfusional iron overload in adults. N Engl J Med 1981 Feb 5;304(6):319-24.
(11) Buja LM, Roberts WC. Iron in the heart. Etiology and clinical significance. Am J Med 1971 Aug;51(2):209-21.
(12) Olivieri NF, Brittenham GM. Iron-chelating therapy and the treatment of thalassemia. Blood 1997 Feb 1;89(3):739-61.
(13) Risdon RA, Flynn DM, Barry M. The relation between liver iron concentration and liver damage in transfusional iron overload in thalassaemia and the effect of chelation therapy. Gut 1973 May;14(5):421.
(14) Lassman MN, Genel M, Wise JK, Hendler R, Felig P. Carbohydrate homeostasis and pancreatic islet cell funtion in thalassemia. Ann Intern Med 1974 Jan;80(1):65-9.
(15) Grundy RG, Woods KA, Savage MO, Evans JP. Relationship of endocrinopathy to iron chelation status in young patients with thalassaemia major. Arch Dis Child 1994 Aug;71(2):128-32.
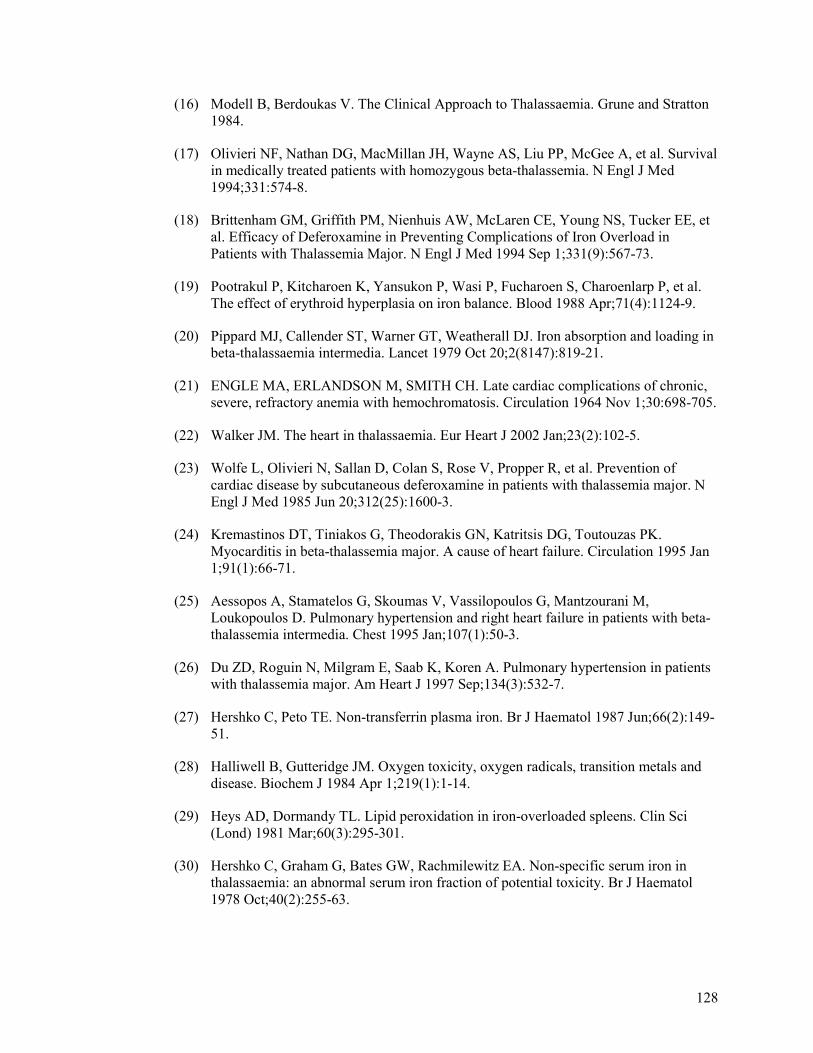
128
(16) Modell B, Berdoukas V. The Clinical Approach to Thalassaemia. Grune and Stratton 1984.
(17) Olivieri NF, Nathan DG, MacMillan JH, Wayne AS, Liu PP, McGee A, et al. Survival in medically treated patients with homozygous beta-thalassemia. N Engl J Med 1994;331:574-8.
(18) Brittenham GM, Griffith PM, Nienhuis AW, McLaren CE, Young NS, Tucker EE, et al. Efficacy of Deferoxamine in Preventing Complications of Iron Overload in Patients with Thalassemia Major. N Engl J Med 1994 Sep 1;331(9):567-73.
(19) Pootrakul P, Kitcharoen K, Yansukon P, Wasi P, Fucharoen S, Charoenlarp P, et al. The effect of erythroid hyperplasia on iron balance. Blood 1988 Apr;71(4):1124-9.
(20) Pippard MJ, Callender ST, Warner GT, Weatherall DJ. Iron absorption and loading in beta-thalassaemia intermedia. Lancet 1979 Oct 20;2(8147):819-21.
(21) ENGLE MA, ERLANDSON M, SMITH CH. Late cardiac complications of chronic, severe, refractory anemia with hemochromatosis. Circulation 1964 Nov 1;30:698-705.
(22) Walker JM. The heart in thalassaemia. Eur Heart J 2002 Jan;23(2):102-5.
(23) Wolfe L, Olivieri N, Sallan D, Colan S, Rose V, Propper R, et al. Prevention of cardiac disease by subcutaneous deferoxamine in patients with thalassemia major. N Engl J Med 1985 Jun 20;312(25):1600-3.
(24) Kremastinos DT, Tiniakos G, Theodorakis GN, Katritsis DG, Toutouzas PK. Myocarditis in beta-thalassemia major. A cause of heart failure. Circulation 1995 Jan 1;91(1):66-71.
(25) Aessopos A, Stamatelos G, Skoumas V, Vassilopoulos G, Mantzourani M, Loukopoulos D. Pulmonary hypertension and right heart failure in patients with beta-thalassemia intermedia. Chest 1995 Jan;107(1):50-3.
(26) Du ZD, Roguin N, Milgram E, Saab K, Koren A. Pulmonary hypertension in patients with thalassemia major. Am Heart J 1997 Sep;134(3):532-7.
(27) Hershko C, Peto TE. Non-transferrin plasma iron. Br J Haematol 1987 Jun;66(2):149-51.
(28) Halliwell B, Gutteridge JM. Oxygen toxicity, oxygen radicals, transition metals and disease. Biochem J 1984 Apr 1;219(1):1-14.
(29) Heys AD, Dormandy TL. Lipid peroxidation in iron-overloaded spleens. Clin Sci (Lond) 1981 Mar;60(3):295-301.
(30) Hershko C, Graham G, Bates GW, Rachmilewitz EA. Non-specific serum iron in thalassaemia: an abnormal serum iron fraction of potential toxicity. Br J Haematol 1978 Oct;40(2):255-63.
129
(31) Gutteridge JM, Rowley DA, Griffiths E, Halliwell B. Low-molecular-weight iron complexes and oxygen radical reactions in idiopathic haemochromatosis. Clin Sci (Lond) 1985 Apr;68(4):463-7.
(32) Link G, Pinson A, Hershko C. Heart cells in culture: a model of myocardial iron overload and chelation. J Lab Clin Med 1985 Aug;106(2):147-53.
(33) Parkes JG, Hussain RA, Olivieri NF, Templeton DM. Effects of iron loading on uptake, speciation, and chelation of iron in cultured myocardial cells. J Lab Clin Med 1993 Jul;122(1):36-47.
(34) Link G, Pinson A, Hershko C. Ability of the orally effective iron chelators dimethyl- and diethyl-hydroxypyrid-4-one and of deferoxamine to restore sarcolemmal thiolic enzyme activity in iron-loaded heart cells. Blood 1994 May 1;83(9):2692-7.
(35) Link G, Pinson A, Hershko C. Iron loading of cultured cardiac myocytes modifies sarcolemmal structure and increases lysosomal fragility. J Lab Clin Med 1993 Jan;121(1):127-34.
(36) Link G, Tirosh R, Pinson A, Hershko C. Role of iron in the potentiation of anthracycline cardiotoxicity: identification of heart cell mitochondria as a major site of iron-anthracycline interaction. J Lab Clin Med 1996 Mar;127(3):272-8.
(37) Hershko C, Link G, Cabantchik I. Pathophysiology of iron overload. Ann N Y Acad Sci 1998 Jun 30;850:191-201.
(38) Hershko C, Link G, Pinson A. Modification of iron uptake and lipid peroxidation by hypoxia, ascorbic acid, and alpha-tocopherol in iron-loaded rat myocardial cell cultures. J Lab Clin Med 1987 Sep;110(3):355-61.
(39) Wills ED. Lipid peroxide formation in microsomes. The role of non-haem iron. Biochem J 1969 Jun;113(2):325-32.
(40) JAMES TN. Pathology of the cardiac conduction system in hemochromatosis. N Engl J Med 1964 Jul 9;271:92-4.
(41) Schellhammer PF, ENGLE MA, Hagstrom JW. Histochemical studies of the myocardium and conduction system in acquired iron-storage disease. Circulation 1967 Apr;35(4):631-7.
(42) LEVIN EB, GOLUM A. The heart in hemochromatosis. Am Heart J 1953 Feb;45(2):277-88.
(43) Politi A, Sticca M, Galli M. Reversal of haemochromatotic cardiomyopathy in beta thalassaemia by chelation therapy. Br Heart J 1995 May 1;73(5):486-7.
(44) Miskin H, Yaniv I, Berant M, Hershko C, Tamary H. Reversal of cardiac complications in thalassemia major by long-term intermittent daily intensive iron chelation. Eur J Haematol 2003 Jun;70(6):398-403.
130
(45) Anderson LJ, Westwood MA, Holden S, Davis B, Prescott E, Wonke B, et al. Myocardial iron clearance during reversal of siderotic cardiomyopathy with intravenous desferrioxamine: a prospective study using T2* cardiovascular magnetic resonance. Br J Haematol 2004 Nov;127(3):348-55.
(46) Olivieri NF. The beta-thalassemias. N Engl J Med 1999 Jul 8;341(2):99-109.
(47) ROMANO C, MASSIMO L, TORTOROLO G. Preliminary Note On The Therapeutic Use Of Desferrioxamine In Cooley's Disease. Minerva Pediatr 1964 Jun 30;16:711-3.
(48) Keberle H. The biochemistry of desferrioxamine and its relation to iron metabolism. Annals of the New York Academy of Sciences 1964;119:758-68.
(49) Modell B, Beck J. Long-term desferrioxamine therapy in thalassaemia. Ann N Y Acad Sci 1974;232:202.
(50) Modell B, Khan M, Darlison M. Survival in beta thalassaemia major in the UK: Data from the UK Thalassaemia Register. Lancet 2000;355:2051-2.
(51) Barry M, Flynn DM, Letsky EA, Risdon RA. Long-term chelation therapy in thalassaemia major: effect on liver iron concentration, liver histology, and clinical progress. Br Med J 1974 Apr 6;2(5909):16-20.
(52) Hussain MAM, Flynn DM, Green N, Hussein S, Hoffbrand AV. Subcutaneous infusion and intramuscular injection of desferrioxamine in patients with transfusional iron overload. Lancet 1976;ii:1278.
(53) Modell B, Letsky EA, Flynn DM, Peto R, Weatherall DJ. Survival and desferrioxamine in thalassaemia major. Br Med J (Clin Res Ed) 1982 Apr 10;284(6322):1081-4.
(54) Ehlers KH, Giardina PJ, Lesser ML, ENGLE MA, Hilgartner MW. Prolonged survival in patients with beta-thalassemia major treated with deferoxamine. J Pediatr 1991 Apr;118(4 ( Pt 1)):540-5.
(55) Anderson LJ, Holden S, Davies B, Prescott E, Charrier C, Bunce NH, et al. Cardiovascular T2* (T2 star) magnetic resonance for the early diagnosis of myocardial iron overload. Eur Heart J 2001;22:2171-9.
(56) Weatherall DJ, Pippard MJ, Callender ST. Editorial retrospective. Iron loading in thalassemia--five years with the pump. N Engl J Med 1983 Feb 24;308(8):456-8.
(57) Freeman AP, Giles RW, Berdoukas VA, Walsh WF, Choy D, Murray PC. Early left ventricular dysfunction and chelation therapy in thalassemia major. Ann Intern Med 1983 Oct;99(4):450-4.
(58) Freeman AP, Giles RW, Berdoukas VA, Talley PA, Murray IP. Sustained normalization of cardiac function by chelation therapy in thalassaemia major. Clin Lab Haematol 1989;11(4):299-307.
131
(59) Grisaru D, Goldfarb AW, Gotsman MS, Rachmilewitz EA, Hasin Y. Deferoxamine improves left ventricular function in beta-thalassemia. Arch Intern Med 1986 Dec;146(12):2344-9.
(60) Gabutti V, Piga A. Results of long-term iron-chelating therapy. Acta Haematol 1996;95(1):26-36.
(61) Borgna-Pignatti C, Rugolotto S, De Stefano P, Zhao H, Cappellini MD, Del Vecchio GC, et al. Survival and complications in patients with thalassemia major treated with transfusion and deferoxamine. Haematologica 2004;89:1187-93.
(62) Borgna-Pignatti C, Rugolotto S, De SP, Piga A, Di GF, Gamberini MR, et al. Survival and disease complications in thalassemia major. Ann N Y Acad Sci 1998 Jun 30;850:227-31.
(63) Kontoghiorghes GJ, Aldouri MA, Sheppard L, Hoffbrand AV. 1,2-Dimethyl-3-hydroxypyrid-4-one, an orally active chelator for treatment of iron overload. Lancet 1987 Jun 6;1(8545):1294-5.
(64) Kontoghiorghes GJ, Bartlett AN, Hoffbrand AV, Goddard JG, Sheppard L, Barr J, et al. Long-term trial with the oral iron chelator 1,2-dimethyl-3-hydroxypyrid-4-one (L1). I. Iron chelation and metabolic studies. Br J Haematol 1990 Oct;76(2):295-300.
(65) Olivieri NF, Koren G, Hermann C, Bentur Y, Chung D, Klein J, et al. Comparison of oral iron chelator L1 and desferrioxamine in iron-loaded patients. Lancet 1990 Nov 24;336(8726):1275-9.
(66) Agarwal MB, Gupte SS, Viswanathan C, Vasandani D, Ramanathan J, Desai N, et al. Long-term assessment of efficacy and safety of L1, an oral iron chelator, in transfusion dependent thalassaemia: Indian trial. Br J Haematol 1992 Oct;82(2):460-6.
(67) Tondury P, Kontoghiorghes GJ, Ridolfi-Luthy A, Hirt A, Hoffbrand AV, Lottenbach AM, et al. L1 (1,2-dimethyl-3-hydroxypyrid-4-one) for oral iron chelation in patients with beta-thalassaemia major. Br J Haematol 1990 Dec;76(4):550-3.
(68) Olivieri NF, Brittenham GM, Matsui D, Berkovitch M, Blendis LM, Cameron RG, et al. Iron-chelation therapy with oral deferipronein patients with thalassemia major. N Engl J Med 1995 Apr 6;332(14):918-22.
(69) al-Refaie FN, Wonke B, Hoffbrand AV, Wickens DG, Nortey P, Kontoghiorghes GJ. Efficacy and possible adverse effects of the oral iron chelator 1,2-dimethyl-3-hydroxypyrid-4-one (L1) in thalassemia major. Blood 1992 Aug 1;80(3):593-9.
(70) Addis A, Loebstein R, Koren G, Einarson TR. Meta-analytic review of the clinical effectiveness of oral deferiprone (L1). Eur J Clin Pharmacol 1999 Mar;55(1):1-6.
(71) Addis A, Loebstein R, Koren G, Einarson TR. Meta-analytic review of the clinical effectiveness of oral deferiprone (L1). Eur J Clin Pharmacol 1999 Mar;55(1):1-6.
132
(72) Olivieri NF, Brittenham GM, McLaren CE, Templeton DM, Cameron RG, McClelland RA, et al. Long-term safety and effectiveness of iron-chelation therapy with deferiprone for thalassemia major. N Engl J Med 1998 Aug 13;339(7):417-23.
(73) Wanless IR, Sweeney G, Dhillon AP, Guido M, Piga A, Galanello R, et al. Lack of progressive hepatic fibrosis during long-term therapy with deferiprone in subjects with transfusion-dependent beta-thalassemia. Blood 2002 Sep 1;100(5):1566-9.
(74) Telfer PT, Prestcott E, Holden S, Walker M, Hoffbrand AV, Wonke B. Hepatic iron concentration combined with long-term monitoring of serum ferritin to predict complications of iron overload in thalassaemia major. Br J Haematol 2000 Sep;110(4):971-7.
(75) Anderson LJ, Holden S, Davis B, Prescott E, Charrier CC, Bunce NH, et al. Cardiovascular T2-star (T2*) magnetic resonance for the early diagnosis of myocardial iron overload. Eur Heart J 2001 Dec 1;22(23):2171-9.
(76) Wonke B, Wright C, Hoffbrand AV. Combined therapy with deferiprone and desferrioxamine. Br J Haematol 1998;103:361-4.
(77) Anderson LJ, Wonke B, Prescott E, Holden S, Walker JM, Pennell DJ. Comparison of effects of oral deferiprone and subcutaneous deferoxamine on myocardial iron concentrations and ventricular function in beta-thalassemia. Lancet 2002;360:516-20.
(78) Piga A, Gaglioti C, Fogliacco E, Tricta F. Comparative effects of deferiprone and deferoxamine on survival and cardiac disease in patients with thalassemia major: a retrospective analysis. Haematologica 2003;88:489-96.
(79) Telfer P, Coen PG, Christou S, Hadjigavriel M, Kolnakou A, Pangalou E, et al. Survival of medically treated thalassemia patients in Cyprus. Trends and risk factors over the period 1980-2004. Haematologica 2006 Sep 1;91(9):1187-92.
(80) Shalev O, Repka T, Goldfarb A, Grinberg L, Abrahamov A, Olivieri NF, et al. Deferiprone (L1) chelates pathologic iron deposits from membranes of intact thalassemic and sickle red blood cells both in vitro and in vivo. Blood 1995 Sep 1;86(5):2008-13.
(81) de FL, Shalev O, Piga A, Collell M, Olivieri O, Corrocher R, et al. Deferiprone therapy in homozygous human beta-thalassemia removes erythrocyte membrane free iron and reduces KCl cotransport activity. J Lab Clin Med 1999 Jan;133(1):64-9.
(82) Galanello R. Deferiprone in the treatment of transfusion dependent thalassaemia: a review and perspective. Therapeutics and Clinical Risk Management 2007;3(5):795-805.
(83) Easley RM, Jr., Schreiner BF, Jr., Yu PN. Reversible cardiomyopathy associated with hemochromatosis. N Engl J Med 1972 Oct 26;287(17):866-7.
(84) Short EM, Winkle RA, Billingham ME. Myocardial involvement in idiopathic hemochromatosis. Morphologic and clinical improvement following venesection. Am J Med 1981 Jun;70(6):1275-9.
133
(85) Rivers J, Garrahy P, Robinson W, Murphy A. Reversible cardiac dysfunction in hemochromatosis. Am Heart J 1987 Jan;113(1):216-7.
(86) Rahko PS, Salerni R, Uretsky BF. Successful reversal by chelation therapy of congestive cardiomyopathy due to iron overload. J Am Coll Cardiol 1986 Aug;8(2):436-40.
(87) Wacker P, Halperin DS, Balmer-Ruedin D, Oberhansli I, Wyss M. Regression of cardiac insufficiency after ambulatory intravenous deferoxamine in thalassemia major. Chest 1993 Apr;103(4):1276-8.
(88) Marcus RE, Davies SC, Bantock HM, Underwood SR, Walton S, Huehns ER. Desferrioxamine to improve cardiac function in iron-overloaded patients with thalassemia major. Lancet 1984 Feb 18;1(8373):392-3.
(89) Aldouri MA, Wonke B, Hoffbrand AV, Flynn DM, Ward SE, Agnew JE, et al. High incidence of cardiomyopathy in beta-thalassaemia patients receiving regular transfusion and iron chelation: reversal by intensified chelation. Acta Haematol 1990;84(3):113-7.
(90) Cohen AR, Mizanin J, Schwartz E. Rapid removal of excessive iron with daily, high-dose intravenous chelation therapy. J Pediatr 1989 Jul;115(1):151-5.
(91) Link G, Athias P, Grynberg A, Pinson A, Hershko C. Effect of iron loading on transmembrane potential, contraction, and automaticity of rat ventricular muscle cells in culture. J Lab Clin Med 1989 Jan;113(1):103-11.
(92) Kremastinos DT, Flevari P, Spyropoulou M, Vrettou H, Tsiapras D, Stavropoulos-Giokas CG. Association of heart failure in homozygous beta-thalassemia with the major histocompatibility complex. Circulation 1999 Nov 16;100(20):2074-8.
(93) Finch CA, Bellotti V, Stray S, Lipschitz DA, Cook JD, Pippard MJ, et al. Plasma ferritin determination as a diagnostic tool. West J Med 1986 Nov;145(5):657-63.
(94) Pippard MJ. Measurement of iron status. Prog Clin Biol Res 1989;309:85-92.
(95) Addison GM, Beamish MR, Hales CN, Hodgkins M, Jacobs A, Llewellin P. An immunoradiometric assay for ferritin in the serum of normal subjects and patients with iron deficiency and iron overload. J Clin Pathol 1972 Apr;25(4):326-9.
(96) Cazzola M, Borgna-Pignatti C, De SP, Bergamaschi G, Bongo IG, Dezza L, et al. Internal distribution of excess iron and sources of serum ferritin in patients with thalassemia. Scand J Haematol 1983 Apr;30(4):289-96.
(97) Brittenham GM, Cohen AR, McLaren CE, Martin MB, Griffith PM, Nienhuis AW, et al. Hepatic iron stores and plasma ferritin concentration in patients with sickle cell anemia and thalassemia major. Am J Hematol 1993 Jan;42(1):81-5.
(98) Baynes R, Bezwoda W, Bothwell T, Khan Q, Mansoor N. The non-immune inflammatory response: serial changes in plasma iron, iron-binding capacity,
134
lactoferrin, ferritin and C-reactive protein. Scand J Clin Lab Invest 1986 Nov;46(7):695-704.
(99) Chapman RW, Hussain MA, Gorman A, Laulicht M, Politis D, Flynn DM, et al. Effect of ascorbic acid deficiency on serum ferritin concentration in patients with beta-thalassaemia major and iron overload. J Clin Pathol 1982 May;35(5):487-91.
(100) Overmoyer BA, McLaren CE, Brittenham GM. Uniformity of liver density and nonheme (storage) iron distribution. Arch Pathol Lab Med 1987 Jun;111(6):549-54.
(101) Villeneuve JP, Bilodeau M, Lepage R, Cote J, Lefebvre M. Variability in hepatic iron concentration measurement from needle-biopsy specimens. J Hepatol 1996 Aug;25(2):172-7.
(102) Emond MJ, Bronner MP, Carlson TH, Lin M, Labbe RF, Kowdley KV. Quantitative study of the variability of hepatic iron concentrations. Clin Chem 1999 Mar;45(3):340-6.
(103) Bonkovsky HL, Rubin RB, Cable EE, Davidoff A, Rijcken TH, Stark DD. Hepatic iron concentration: noninvasive estimation by means of MR imaging techniques. Radiology 1999 Jul;212(1):227-34.
(104) Bonkovsky HL, Rubin RB, Cable EE, Davidoff A, Rijcken TH, Stark DD. Hepatic iron concentration: noninvasive estimation by means of MR imaging techniques. Radiology 1999 Jul;212(1):227-34.
(105) Ambu R, Crisponi G, Sciot R, Van EP, Parodo G, Iannelli S, et al. Uneven hepatic iron and phosphorus distribution in beta-thalassemia. J Hepatol 1995 Nov;23(5):544-9.
(106) Ambu R, Crisponi G, Sciot R, Van EP, Parodo G, Iannelli S, et al. Uneven hepatic iron and phosphorus distribution in beta-thalassemia. J Hepatol 1995 Nov;23(5):544-9.
(107) Maggio A. 10th International Conference on Oral Chelators in The Treatment of Thalassemia and Other Diseases and Biomed Meeting.: Limassol, Cyprus; 2000.
(108) Mavrogeni SI, Maris T, Gouliamos A, Vlahos L, Kremastinos DT. Myocardial iron deposition in beta-thalassemia studied by magnetic resonance imaging. Int J Card Imaging 1998 Apr;14(2):117-22.
(109) Johnston DL, Rice L, Vick GW, III, Hedrick TD, Rokey R. Assessment of tissue iron overload by nuclear magnetic resonance imaging. Am J Med 1989 Jul;87(1):40-7.
(110) Ooi GC, Chen FE, Chan KN, Tsang KW, Wong YH, Liang R, et al. Qualitative and quantitative magnetic resonance imaging in haemoglobin H disease: screening for iron overload. Clin Radiol 1999 Feb;54(2):98-102.
(111) Anderson LJ, Westwood MA, Prescott E, Walker JM, Pennell DJ, Wonke B. Development of thalassaemic iron overload cardiomyopathy despite low liver iron
135
levels and meticulous compliance to desferrioxamine. Acta Haematol 2006;115:106-8.
(112) Barosi G, Arbustini E, Gavazzi A, Grasso M, Pucci A. Myocardial iron grading by endomyocardial biopsy. A clinico-pathologic study on iron overloaded patients. Eur J Haematol 1989 Apr;42(4):382-8.
(113) Lombardo T, Tamburino C, Bartoloni G, Morrone ML, Frontini V, Italia F, et al. Cardiac iron overload in thalassemic patients: an endomyocardial biopsy study. Ann Hematol 1995 Sep;71(3):135-41.
(114) Blankenberg F, Eisenberg S, Scheinman MN, Higgins CB. Use of cine gradient echo (GRE) MR in the imaging of cardiac hemochromatosis. J Comput Assist Tomogr 1994 Jan;18(1):136-8.
(115) Olson LJ, Edwards WD, McCall JT, Ilstrup DM, Gersh BJ. Cardiac iron deposition in idiopathic hemochromatosis: histologic and analytic assessment of 14 hearts from autopsy. J Am Coll Cardiol 1987 Dec;10(6):1239-43.
(116) Fitchett DH, Coltart DJ, Littler WA, Leyland MJ, Trueman T, Gozzard DI, et al. Cardiac involvement in secondary haemochromatosis: a catheter biopsy study and analysis of myocardium. Cardiovasc Res 1980 Dec;14(12):719-24.
(117) Hoffbrand AV. Diagnosing myocardial iron overload. Eur Heart J 2001 Dec;22(23):2140-1.
(118) Brili SV, Tzonou AI, Castelanos SS, Aggeli CJ, Tentolouris CA, Pitsavos CE, et al. The effect of iron overload in the hearts of patients with beta-thalassemia. Clin Cardiol 1997 Jun;20(6):541-6.
(119) Olson LJ, Baldus WP, Tajik AJ. Echocardiographic features of idiopathic hemochromatosis. Am J Cardiol 1987 Oct 1;60(10):885-9.
(120) Cecchetti G, Binda A, Piperno A, Nador F, Fargion S, Fiorelli G. Cardiac alterations in 36 consecutive patients with idiopathic haemochromatosis: polygraphic and echocardiographic evaluation. Eur Heart J 1991 Feb;12(2):224-30.
(121) Henry WL, Nienhuis AW, Wiener M, Miller DR, Canale VC, Piomelli S. Echocardiographic abnormalities in patients with transfusion-dependent anemia and secondary myocardial iron deposition. Am J Med 1978 Apr;64(4):547-55.
(122) Nienhuis AW, Griffith P, Strawczynski H, Henry W, Borer J, Leon M, et al. Evaluation of cardiac function in patients with thalassemia major. Ann N Y Acad Sci 1980;344:384-96.
(123) Spirito P, Lupi G, Melevendi C, Vecchio C. Restrictive diastolic abnormalities identified by Doppler echocardiography in patients with thalassemia major. Circulation 1990 Jul;82(1):88-94.
136
(124) Hou JW, Wu MH, Lin KH, Lue HC. Prognostic significance of left ventricular diastolic indexes in beta-thalassemia major. Arch Pediatr Adolesc Med 1994 Aug;148(8):862-6.
(125) Kremastinos DT, Tsiapras DP, Tsetsos GA, Rentoukas EI, Vretou HP, Toutouzas PK. Left ventricular diastolic Doppler characteristics in beta-thalassemia major. Circulation 1993 Sep;88(3):1127-35.
(126) Valdes-Cruz LM, Reinecke C, Rutkowski M, Dudell GG, Goldberg SJ, Allen HD, et al. Preclinical abnormal segmental cardiac manifestations of thalassemia major in children on transfusion-chelation therapy: echographic alterations of left ventricular posterior wall contraction and relaxation patterns. Am Heart J 1982 Apr;103(4 Pt 1):505-11.
(127) Mariotti E, Agostini A, Angelucci E, Cesaroni P, Lucarelli G, Sgarbi E. Cardiac study by dobutamine stress echocardiography in thalassemic patients. Bone Marrow Transplant 1993;12 Suppl 1:14-5.
(128) Suarez WA, Snyder SA, Berman BB, Brittenham GM, Patel CR. Preclinical cardiac dysfunction in transfusion-dependent children and young adults detected with low-dose dobutamine stress echocardiography. J Am Soc Echocardiogr 1998 Oct;11(10):948-56.
(129) Vogel M, Anderson LJ, Holden S, Deanfield JE, Pennell DJ, Walker JM. Tissue Doppler echocardiography in patients with thalassaemia detects early myocardial dysfunction related to myocardial iron overload. Eur Heart J 2003 Jan;24(1):113-9.
(130) Alpendurada F. Relationship of myocardial T2* to RV function in Thalassaemia Major. Eur Heart J 2010.
(131) Carpenter JP. Thalassaemia and RV volumes. JCMR 2010.
(132) Brasch RC, Wesbey GE, Gooding CA, Koerper MA. Magnetic resonance imaging of transfusional hemosiderosis complicating thalassemia major. Radiology 1984 Mar;150(3):767-71.
(133) Gandon Y, Guyader D, Heautot JF, Reda MI, Yaouanq J, Buhe T, et al. Hemochromatosis: diagnosis and quantification of liver iron with gradient-echo MR imaging. Radiology 1994 Nov;193(2):533-8.
(134) Kaltwasser JP, Gottschalk R, Schalk KP, Hartl W. Non-invasive quantitation of liver iron-overload by magnetic resonance imaging. Br J Haematol 1990 Mar;74(3):360-3.
(135) Papakonstantinou OG, Maris TG, Kostaridou V, Gouliamos AD, Koutoulas GK, Kalovidouris AE, et al. Assessment of liver iron overload by T2-quantitative magnetic resonance imaging: correlation of T2-QMRI measurements with serum ferritin concentration and histologic grading of siderosis. Magn Reson Imaging 1995;13(7):967-77.
(136) Wood JC, Enriquez C, Ghugre N, Tyzka JM, Carson S, Nelson MD, et al. MRI R2 and R2* mapping accurately estimates hepatic iron concentration in transfusion-
137
dependent thalassemia and sickle cell disease patients. Blood 2005 Aug 15;106(4):1460-5.
(137) Voskaridou E, Douskou M, Terpos E, Papassotiriou I, Stamoulakatou A, Ourailidis A, et al. Magnetic resonance imaging in the evaluation of iron overload in patients with beta thalassaemia and sickle cell disease. Br J Haematol 2004 Sep;126(5):736-42.
(138) Ooi GC, Khong PL, Chan GC, Chan KN, Chan KL, Lam W, et al. Magnetic resonance screening of iron status in transfusion-dependent beta-thalassaemia patients. Br J Haematol 2004 Feb;124(3):385-90.
(139) Westwood MA, Firmin DN, Gildo M, Renzo G, Stathis G, Markissia K, et al. Intercentre reproducibility of magnetic resonance T2* measurements of myocardial iron in thalassaemia. Int J Cardiovasc Imaging 2005 Oct;21(5):531-8.
(140) Karvounis HI, Zaglavara TA, Parharidis GE, Nouskas IG, Hassapopoulou EP, Gemitzis KD, et al. An angiotensin-converting enzyme inhibitor improves left ventricular systolic and diastolic function in transfusion-dependent patients with beta-thalassemia major. Am Heart J 2001 Feb;141(2):281.
(141) Karvounis HI, Zaglavara TA, Parharidis GE, Nouskas IG, Hassapopoulou EP, Gemitzis KD, et al. An angiotensin-converting enzyme inhibitor improves left ventricular systolic and diastolic function in transfusion-dependent patients with beta-thalassemia major. Am Heart J 2001 Feb;141(2):281.
(142) Oudit GY, Sun H, Trivieri MG, Koch SE, Dawood F, Ackerley C, et al. L-type Ca2+ channels provide a major pathway for iron entry into cardiomyocytes in iron-overload cardiomyopathy. Nat Med 2003;9:1187-94.
(143) Crowe S, Bartfay WJ. Amlodipine decreases iron uptake and oxygen free radical production in the heart of chronically iron overloaded mice. Biol Res Nurs 2002 Apr;3(4):189-97.
(144) Isaaz K, Thompson A, Ethevenot G, Cloez JL, Brembilla B, Pernot C. Doppler echocardiographic measurement of low velocity motion of the left ventricular posterior wall. Am J Cardiol 1989 Jul 1;64(1):66-75.
(145) Sutherland GR, Stewart MJ, Groundstroem KW, Moran CM, Fleming A, Guell-Peris FJ, et al. Color Doppler myocardial imaging: a new technique for the assessment of myocardial function. J Am Soc Echocardiogr 1994 Sep;7(5):441-58.
(146) Hatle L, Sutherland GR. Regional myocardial function--a new approach. Eur Heart J 2000 Aug;21(16):1337-57.
(147) Sutherland GR, Di SG, Claus P, D'hooge J, Bijnens B. Strain and strain rate imaging: a new clinical approach to quantifying regional myocardial function. J Am Soc Echocardiogr 2004 Jul;17(7):788-802.
(148) McCulloch M, Zoghbi WA, Davis R, Thomas C, Dokainish H. Color tissue Doppler myocardial velocities consistently underestimate spectral tissue Doppler velocities:
138
impact on calculation peak transmitral pulsed Doppler velocity/early diastolic tissue Doppler velocity (E/Ea). J Am Soc Echocardiogr 2006 Jun;19(6):744-8.
(149) Fleming AD, McDicken WN, Sutherland GR, Hoskins PR. Assessment of colour Doppler tissue imaging using test-phantoms. Ultrasound Med Biol 1994;20(9):937-51.
(150) Miyatake K, Yamagishi M, Tanaka N, Uematsu M, Yamazaki N, Mine Y, et al. New method for evaluating left ventricular wall motion by color-coded tissue Doppler imaging: in vitro and in vivo studies. J Am Coll Cardiol 1995 Mar 1;25(3):717-24.
(151) Abraham TP, Dimaano VL, Liang HY. Role of tissue Doppler and strain echocardiography in current clinical practice. Circulation 2007 Nov 27;116(22):2597-609.
(152) Thomas G. Tissue Doppler echocardiography - a case of right tool, wrong use. Cardiovasc Ultrasound 2004;2:12.
(153) Urheim S, Edvardsen T, Torp H, Angelsen B, Smiseth OA. Myocardial strain by Doppler echocardiography. Validation of a new method to quantify regional myocardial function. Circulation 2000 Sep 5;102(10):1158-64.
(154) Belohlavek M, Bartleson VB, Zobitz ME. Real-time strain rate imaging: validation of peak compression and expansion rates by a tissue-mimicking phantom. Echocardiography 2001 Oct;18(7):565-71.
(155) Abraham TP, Laskowski C, Zhan WZ, Belohlavek M, Martin EA, Greenleaf JF, et al. Myocardial contractility by strain echocardiography: comparison with physiological measurements in an in vitro model. Am J Physiol Heart Circ Physiol 2003 Dec;285(6):H2599-H2604.
(156) Edvardsen T, Gerber BL, Garot J, Bluemke DA, Lima JA, Smiseth OA. Quantitative assessment of intrinsic regional myocardial deformation by Doppler strain rate echocardiography in humans: validation against three-dimensional tagged magnetic resonance imaging. Circulation 2002 Jul 2;106(1):50-6.
(157) Kowalski M, Kukulski T, Jamal F, D'hooge J, Weidemann F, Rademakers F, et al. Can natural strain and strain rate quantify regional myocardial deformation? A study in healthy subjects. Ultrasound Med Biol 2001 Aug;27(8):1087-97.
(158) Gulati VK, Katz WE, Follansbee WP, Gorcsan J, III. Mitral annular descent velocity by tissue Doppler echocardiography as an index of global left ventricular function. Am J Cardiol 1996 May 1;77(11):979-84.
(159) Gorcsan J, III, Strum DP, Mandarino WA, Gulati VK, Pinsky MR. Quantitative assessment of alterations in regional left ventricular contractility with color-coded tissue Doppler echocardiography. Comparison with sonomicrometry and pressure-volume relations. Circulation 1997 May 20;95(10):2423-33.
(160) Donovan CL, Armstrong WF, Bach DS. Quantitative Doppler tissue imaging of the left ventricular myocardium: validation in normal subjects. Am Heart J 1995 Jul;130(1):100-4.
139
(161) Palka P, Lange A, Fleming AD, Fenn LN, Bouki KP, Shaw TR, et al. Age-related transmural peak mean velocities and peak velocity gradients by Doppler myocardial imaging in normal subjects. Eur Heart J 1996 Jun;17(6):940-50.
(162) Greenberg NL, Firstenberg MS, Castro PL, Main M, Travaglini A, Odabashian JA, et al. Doppler-derived myocardial systolic strain rate is a strong index of left ventricular contractility. Circulation 2002 Jan 1;105(1):99-105.
(163) Hoffmann R, Lethen H, Marwick T, Arnese M, Fioretti P, Pingitore A, et al. Analysis of interinstitutional observer agreement in interpretation of dobutamine stress echocardiograms. J Am Coll Cardiol 1996 Feb;27(2):330-6.
(164) Gorcsan J, III, Gulati VK, Mandarino WA, Katz WE. Color-coded measures of myocardial velocity throughout the cardiac cycle by tissue Doppler imaging to quantify regional left ventricular function. Am Heart J 1996 Jun;131(6):1203-13.
(165) Derumeaux G, Ovize M, Loufoua J, ndre-Fouet X, Minaire Y, Cribier A, et al. Doppler tissue imaging quantitates regional wall motion during myocardial ischemia and reperfusion. Circulation 1998 May 19;97(19):1970-7.
(166) Derumeaux G, Ovize M, Loufoua J, Pontier G, ndre-Fouet X, Cribier A. Assessment of nonuniformity of transmural myocardial velocities by color-coded tissue Doppler imaging: characterization of normal, ischemic, and stunned myocardium. Circulation 2000 Mar 28;101(12):1390-5.
(167) Derumeaux G, Loufoua J, Pontier G, Cribier A, Ovize M. Tissue Doppler imaging differentiates transmural from nontransmural acute myocardial infarction after reperfusion therapy. Circulation 2001 Jan 30;103(4):589-96.
(168) Voigt JU, Arnold MF, Karlsson M, Hubbert L, Kukulski T, Hatle L, et al. Assessment of regional longitudinal myocardial strain rate derived from doppler myocardial imaging indexes in normal and infarcted myocardium. J Am Soc Echocardiogr 2000 Jun;13(6):588-98.
(169) Heimdal A, Stoylen A, Torp H, Skjaerpe T. Real-time strain rate imaging of the left ventricle by ultrasound. J Am Soc Echocardiogr 1998 Nov;11(11):1013-9.
(170) Weidemann F, Wacker C, Rauch A, Bauer WR, Bijnens B, Sutherland GR, et al. Sequential changes of myocardial function during acute myocardial infarction, in the early and chronic phase after coronary intervention described by ultrasonic strain rate imaging. J Am Soc Echocardiogr 2006 Jul;19(7):839-47.
(171) Abraham TP, Nishimura RA, Holmes DR, Jr., Belohlavek M, Seward JB. Strain rate imaging for assessment of regional myocardial function: results from a clinical model of septal ablation. Circulation 2002 Mar 26;105(12):1403-6.
(172) Nagueh SF, Kopelen HA, Lim DS, Zoghbi WA, Quinones MA, Roberts R, et al. Tissue Doppler imaging consistently detects myocardial contraction and relaxation abnormalities, irrespective of cardiac hypertrophy, in a transgenic rabbit model of human hypertrophic cardiomyopathy. Circulation 2000 Sep 19;102(12):1346-50.
140
(173) Nagueh SF, Bachinski LL, Meyer D, Hill R, Zoghbi WA, Tam JW, et al. Tissue Doppler imaging consistently detects myocardial abnormalities in patients with hypertrophic cardiomyopathy and provides a novel means for an early diagnosis before and independently of hypertrophy. Circulation 2001 Jul 10;104(2):128-30.
(174) Ho CY, Sweitzer NK, McDonough B, Maron BJ, Casey SA, Seidman JG, et al. Assessment of diastolic function with Doppler tissue imaging to predict genotype in preclinical hypertrophic cardiomyopathy. Circulation 2002 Jun 25;105(25):2992-7.
(175) Dutka DP, Donnelly JE, Palka P, Lange A, Nunez DJ, Nihoyannopoulos P. Echocardiographic characterization of cardiomyopathy in Friedreich's ataxia with tissue Doppler echocardiographically derived myocardial velocity gradients. Circulation 2000 Sep 12;102(11):1276-82.
(176) Palka P, Lange A, Fleming AD, Donnelly JE, Dutka DP, Starkey IR, et al. Differences in myocardial velocity gradient measured throughout the cardiac cycle in patients with hypertrophic cardiomyopathy, athletes and patients with left ventricular hypertrophy due to hypertension. J Am Coll Cardiol 1997 Sep;30(3):760-8.
(177) Palka P, Lange A, Donnelly JE, Nihoyannopoulos P. Differentiation between restrictive cardiomyopathy and constrictive pericarditis by early diastolic doppler myocardial velocity gradient at the posterior wall. Circulation 2000 Aug 8;102(6):655-62.
(178) Pieroni M, Chimenti C, Ricci R, Sale P, Russo MA, Frustaci A. Early detection of Fabry cardiomyopathy by tissue Doppler imaging. Circulation 2003 Apr 22;107(15):1978-84.
(179) Weidemann F, Breunig F, Beer M, Sandstede J, Turschner O, Voelker W, et al. Improvement of cardiac function during enzyme replacement therapy in patients with Fabry disease: a prospective strain rate imaging study. Circulation 2003 Sep 16;108(11):1299-301.
(180) Koyama J, Ray-Sequin PA, Davidoff R, Falk RH. Usefulness of pulsed tissue Doppler imaging for evaluating systolic and diastolic left ventricular function in patients with AL (primary) amyloidosis. Am J Cardiol 2002 May 1;89(9):1067-71.
(181) Koyama J, Ray-Sequin PA, Falk RH. Longitudinal myocardial function assessed by tissue velocity, strain, and strain rate tissue Doppler echocardiography in patients with AL (primary) cardiac amyloidosis. Circulation 2003 May 20;107(19):2446-52.
(182) Palka P, Lange A, Donnelly JE, Scalia G, Burstow DJ, Nihoyannopoulos P. Doppler tissue echocardiographic features of cardiac amyloidosis. J Am Soc Echocardiogr 2002 Nov;15(11):1353-60.
(183) Vogel M, Anderson LJ, Holden S, Deanfield JE, Pennell DJ, Walker JM. Tissue Doppler echocardiography in patients with thalassaemia detects early myocardial dysfunction related to myocardial iron overload. Eur Heart J 2003 Jan;24(1):113-9.
141
(184) Abraham WT, Fisher WG, Smith AL, Delurgio DB, Leon AR, Loh E, et al. Cardiac resynchronization in chronic heart failure. N Engl J Med 2002 Jun 13;346(24):1845-53.
(185) Bristow MR, Saxon LA, Boehmer J, Krueger S, Kass DA, De MT, et al. Cardiac-resynchronization therapy with or without an implantable defibrillator in advanced chronic heart failure. N Engl J Med 2004 May 20;350(21):2140-50.
(186) Bleeker GB, Schalij MJ, Molhoek SG, Holman ER, Verwey HF, Steendijk P, et al. Frequency of left ventricular dyssynchrony in patients with heart failure and a narrow QRS complex. Am J Cardiol 2005 Jan 1;95(1):140-2.
(187) Leclercq C, Faris O, Tunin R, Johnson J, Kato R, Evans F, et al. Systolic improvement and mechanical resynchronization does not require electrical synchrony in the dilated failing heart with left bundle-branch block. Circulation 2002 Oct 1;106(14):1760-3.
(188) Yu CM, Chau E, Sanderson JE, Fan K, Tang MO, Fung WH, et al. Tissue Doppler echocardiographic evidence of reverse remodeling and improved synchronicity by simultaneously delaying regional contraction after biventricular pacing therapy in heart failure. Circulation 2002 Jan 29;105(4):438-45.
(189) Bax JJ, Bleeker GB, Marwick TH, Molhoek SG, Boersma E, Steendijk P, et al. Left ventricular dyssynchrony predicts response and prognosis after cardiac resynchronization therapy. J Am Coll Cardiol 2004 Nov 2;44(9):1834-40.
(190) Bax JJ, Abraham T, Barold SS, Breithardt OA, Fung JW, Garrigue S, et al. Cardiac resynchronization therapy: Part 2--issues during and after device implantation and unresolved questions. J Am Coll Cardiol 2005 Dec 20;46(12):2168-82.
(191) Yu CM, Fung WH, Lin H, Zhang Q, Sanderson JE, Lau CP. Predictors of left ventricular reverse remodeling after cardiac resynchronization therapy for heart failure secondary to idiopathic dilated or ischemic cardiomyopathy. Am J Cardiol 2003 Mar 15;91(6):684-8.
(192) Kapetanakis S, Kearney MT, Siva A, Gall N, Cooklin M, Monaghan MJ. Real-time three-dimensional echocardiography: a novel technique to quantify global left ventricular mechanical dyssynchrony. Circulation 2005 Aug 16;112(7):992-1000.
(193) Yu CM, Fung JW, Zhang Q, Chan CK, Chan YS, Lin H, et al. Tissue Doppler imaging is superior to strain rate imaging and postsystolic shortening on the prediction of reverse remodeling in both ischemic and nonischemic heart failure after cardiac resynchronization therapy. Circulation 2004 Jul 6;110(1):66-73.
(194) Weidemann F, Bijnens B, Strotmann JM. Letter regarding article by Yu et al, "Tissue Doppler imaging is superior to strain rate imaging and postsystolic shortening on the prediction of reverse remodeling in both ischemic and nonischemic heart failure after cardiac resynchronization therapy". Circulation 2004 Nov 9;110(19):e498-e499.
142
(195) Nagueh SF, Middleton KJ, Kopelen HA, Zoghbi WA, Quinones MA. Doppler tissue imaging: a noninvasive technique for evaluation of left ventricular relaxation and estimation of filling pressures. J Am Coll Cardiol 1997 Nov 15;30(6):1527-33.
(196) Nagueh SF, Sun H, Kopelen HA, Middleton KJ, Khoury DS. Hemodynamic determinants of the mitral annulus diastolic velocities by tissue Doppler. J Am Coll Cardiol 2001 Jan;37(1):278-85.
(197) Leclercq C, Cazeau S, Ritter P, Alonso C, Gras D, Mabo P, et al. A pilot experience with permanent biventricular pacing to treat advanced heart failure. Am Heart J 2000 Dec;140(6):862-70.
(198) Ohte N, Narita H, Hashimoto T, Akita S, Kurokawa K, Fujinami T. Evaluation of left ventricular early diastolic performance by color tissue Doppler imaging of the mitral annulus. Am J Cardiol 1998 Dec 1;82(11):1414-7.
(199) Firstenberg MS, Greenberg NL, Main ML, Drinko JK, Odabashian JA, Thomas JD, et al. Determinants of diastolic myocardial tissue Doppler velocities: influences of relaxation and preload. J Appl Physiol 2001 Jan;90(1):299-307.
(200) Wang M, Yip G, Yu CM, Zhang Q, Zhang Y, Tse D, et al. Independent and incremental prognostic value of early mitral annulus velocity in patients with impaired left ventricular systolic function. J Am Coll Cardiol 2005 Jan 18;45(2):272-7.
(201) Wang M, Yip GW, Wang AY, Zhang Y, Ho PY, Tse MK, et al. Tissue Doppler imaging provides incremental prognostic value in patients with systemic hypertension and left ventricular hypertrophy. J Hypertens 2005 Jan;23(1):183-91.
(202) Ommen SR, Nishimura RA, Appleton CP, Miller FA, Oh JK, Redfield MM, et al. Clinical utility of Doppler echocardiography and tissue Doppler imaging in the estimation of left ventricular filling pressures: A comparative simultaneous Doppler-catheterization study. Circulation 2000 Oct 10;102(15):1788-94.
(203) Liang HY, Cauduro SA, Pellikka PA, Bailey KR, Grossardt BR, Yang EH, et al. Comparison of usefulness of echocardiographic Doppler variables to left ventricular end-diastolic pressure in predicting future heart failure events. Am J Cardiol 2006 Mar 15;97(6):866-71.
(204) Takemoto Y, Pellikka PA, Wang J, Modesto KM, Cauduro S, Belohlavek M, et al. Analysis of the interaction between segmental relaxation patterns and global diastolic function by strain echocardiography. J Am Soc Echocardiogr 2005 Sep;18(9):901-6.
(205) Meluzin J, Spinarova L, Bakala J, Toman J, Krejci J, Hude P, et al. Pulsed Doppler tissue imaging of the velocity of tricuspid annular systolic motion; a new, rapid, and non-invasive method of evaluating right ventricular systolic function. Eur Heart J 2001 Feb;22(4):340-8.
(206) Moustapha A, Lim M, Saikia S, Kaushik V, Kang SH, Barasch E. Interrogation of the tricuspid annulus by Doppler tissue imaging in patients with chronic pulmonary hypertension: implications for the assessment of right-ventricular systolic and diastolic function. Cardiology 2001;95(2):101-4.
143
(207) Forfia PR, Fisher MR, Mathai SC, Housten-Harris T, Hemnes AR, Borlaug BA, et al. Tricuspid annular displacement predicts survival in pulmonary hypertension. Am J Respir Crit Care Med 2006 Nov 1;174(9):1034-41.
(208) Lyseggen E, Rabben SI, Skulstad H, Urheim S, Risoe C, Smiseth OA. Myocardial acceleration during isovolumic contraction: relationship to contractility. Circulation 2005 Mar 22;111(11):1362-9.
(209) Urheim S, Cauduro S, Frantz R, McGoon M, Belohlavek M, Green T, et al. Relation of tissue displacement and strain to invasively determined right ventricular stroke volume. Am J Cardiol 2005 Oct 15;96(8):1173-8.
(210) Cheung BM, Kumana CR. Natriuretic peptides--relevance in cardiovascular disease. JAMA 1998 Dec 16;280(23):1983-4.
(211) Yasue H, Yoshimura M, Sumida H, Kikuta K, Kugiyama K, Jougasaki M, et al. Localization and mechanism of secretion of B-type natriuretic peptide in comparison with those of A-type natriuretic peptide in normal subjects and patients with heart failure. Circulation 1994 Jul;90(1):195-203.
(212) Nakagawa O, Ogawa Y, Itoh H, Suga S, Komatsu Y, Kishimoto I, et al. Rapid transcriptional activation and early mRNA turnover of brain natriuretic peptide in cardiocyte hypertrophy. Evidence for brain natriuretic peptide as an "emergency" cardiac hormone against ventricular overload. J Clin Invest 1995 Sep;96(3):1280-7.
(213) Tsutamoto T, Wada A, Maeda K, Hisanaga T, Maeda Y, Fukai D, et al. Attenuation of compensation of endogenous cardiac natriuretic peptide system in chronic heart failure: prognostic role of plasma brain natriuretic peptide concentration in patients with chronic symptomatic left ventricular dysfunction. Circulation 1997 Jul 15;96(2):509-16.
(214) Yandle TG. Biochemistry of natriuretic peptides. J Intern Med 1994 Jun;235(6):561-76.
(215) Stingo AJ, Clavell AL, Heublein DM, Wei CM, Pittelkow MR, Burnett JC, Jr. Presence of C-type natriuretic peptide in cultured human endothelial cells and plasma. Am J Physiol 1992 Oct;263(4 Pt 2):H1318-H1321.
(216) Nakagawa O, Ogawa Y, Itoh H, Suga S, Komatsu Y, Kishimoto I, et al. Rapid transcriptional activation and early mRNA turnover of brain natriuretic peptide in cardiocyte hypertrophy. Evidence for brain natriuretic peptide as an "emergency" cardiac hormone against ventricular overload. J Clin Invest 1995 Sep;96(3):1280-7.
(217) Nakao K, Mukoyama M, Hosoda K, Suga S, Ogawa Y, Saito Y, et al. Biosynthesis, secretion, and receptor selectivity of human brain natriuretic peptide. Can J Physiol Pharmacol 1991 Oct;69(10):1500-6.
(218) Yasue H, Yoshimura M, Sumida H, Kikuta K, Kugiyama K, Jougasaki M, et al. Localization and mechanism of secretion of B-type natriuretic peptide in comparison with those of A-type natriuretic peptide in normal subjects and patients with heart failure. Circulation 1994 Jul;90(1):195-203.
144
(219) Maeda K, Tsutamoto T, Wada A, Hisanaga T, Kinoshita M. Plasma brain natriuretic peptide as a biochemical marker of high left ventricular end-diastolic pressure in patients with symptomatic left ventricular dysfunction. Am Heart J 1998 May;135(5 Pt 1):825-32.
(220) Wilkins MR, Redondo J, Brown LA. The natriuretic-peptide family. Lancet 1997 May 3;349(9061):1307-10.
(221) Hystad ME, Klinge R, Spurkland A, Attramadal H, Hall C. Contrasting cardiac regional responses of A-type and B-type natriuretic peptide to experimental chronic heart failure. Scand J Clin Lab Invest 2000 Jul;60(4):299-309.
(222) Hosoda K, Nakao K, Mukoyama M, Saito Y, Jougasaki M, Shirakami G, et al. Expression of brain natriuretic peptide gene in human heart. Production in the ventricle. Hypertension 1991 Jun;17(6 Pt 2):1152-5.
(223) Vogeser M, Jacob K. B-type natriuretic peptide (BNP)--validation of an immediate response assay. Clin Lab 2001;47(1-2):29-33.
(224) Maisel AS, McCullough PA. Cardiac natriuretic peptides:a proteomic window to cardiac function and clinical management. Rev Cardiovasc Med 2003;4 Suppl 4:S3-12.
(225) Grantham JA, Borgeson DD, Burnett JC, Jr. BNP: pathophysiological and potential therapeutic roles in acute congestive heart failure. Am J Physiol 1997 Apr;272(4 Pt 2):R1077-R1083.
(226) Richards AM, Nicholls MG, Espiner EA, Lainchbury JG, Troughton RW, Elliott J, et al. B-type natriuretic peptides and ejection fraction for prognosis after myocardial infarction. Circulation 2003 Jun 10;107(22):2786-92.
(227) Maisel AS, Krishnaswany P, Nowak RM, McCord J, Hollander JE, Duc P, et al. Rapid measurement of B-type natriuretic peptide in the emergency diagnosis of heart failure. N Engl J Med 2002;347:161-7.
(228) Yoshimura M, Yasue H, Okumura K, Ogawa H, Jougasaki M, Mukoyama M, et al. Different secretion patterns of atrial natriuretic peptide and brain natriuretic peptide in patients with congestive heart failure. Circulation 1993 Feb;87(2):464-9.
(229) Knudsen CW, Omland T, Clopton P, Westheim A, Abraham WT, Storrow AB, et al. Diagnostic value of B-Type natriuretic peptide and chest radiographic findings in patients with acute dyspnea. Am J Med 2004 Mar 15;116(6):363-8.
(230) Yu CM, Sanderson JE. Plasma brain natriuretic peptide--an independent predictor of cardiovascular mortality in acute heart failure. Eur J Heart Fail 1999 Mar;1(1):59-65.
(231) Berger R, Huelsman M, Strecker K, Bojic A, Moser P, Stanek B, et al. B-type natriuretic peptide predicts sudden death in patients with chronic heart failure. Circulation 2002 May 21;105(20):2392-7.
145
(232) Cheng V, Kazanagra R, Garcia A, Lenert L, Krishnaswamy P, Gardetto N, et al. A rapid bedside test for B-type peptide predicts treatment outcomes in patients admitted for decompensated heart failure: a pilot study. J Am Coll Cardiol 2001 Feb;37(2):386-91.
(233) Stanek B, Frey B, Hulsmann M, Berger R, Sturm B, Strametz-Juranek J, et al. Prognostic evaluation of neurohumoral plasma levels before and during beta-blocker therapy in advanced left ventricular dysfunction. J Am Coll Cardiol 2001 Aug;38(2):436-42.
(234) Maeda K, Tsutamoto T, Wada A, Mabuchi N, Hayashi M, Tsutsui T, et al. High levels of plasma brain natriuretic peptide and interleukin-6 after optimized treatment for heart failure are independent risk factors for morbidity and mortality in patients with congestive heart failure. J Am Coll Cardiol 2000 Nov 1;36(5):1587-93.
(235) Troughton RW, Frampton CM, Yandle TG, Espiner EA, Nicholls MG, Richards AM. Treatment of heart failure guided by plasma aminoterminal brain natriuretic peptide (N-BNP) concentrations. Lancet 2000 Apr 1;355(9210):1126-30.
(236) Derchi G, Bellone P, Forni GL, Lupi G, Jappelli S, Randazzo M, et al. Cardiac involvement in thalassaemia major: altered atrial natriuretic peptide levels in asymptomatic patients. Eur Heart J 1992 Oct;13(10):1368-72.
(237) Lainchbury JG, Campbell E, Frampton CM, Yandle TG, Nicholls MG, Richards AM. Brain natriuretic peptide and n-terminal brain natriuretic peptide in the diagnosis of heart failure in patients with acute shortness of breath. J Am Coll Cardiol 2003 Aug 20;42(4):728-35.
(238) Mueller T, Gegenhuber A, Poelz W, Haltmayer M. Diagnostic accuracy of B type natriuretic peptide and amino terminal proBNP in the emergency diagnosis of heart failure. Heart 2005 May;91(5):606-12.
(239) Zaphiriou A, Robb S, Murray-Thomas T, Mendez G, Fox K, McDonagh T, et al. The diagnostic accuracy of plasma BNP and NTproBNP in patients referred from primary care with suspected heart failure: results of the UK natriuretic peptide study. Eur J Heart Fail 2005 Jun;7(4):537-41.
(240) Ray P, Arthaud M, Birolleau S, Isnard R, Lefort Y, Boddaert J, et al. Comparison of brain natriuretic peptide and probrain natriuretic peptide in the diagnosis of cardiogenic pulmonary edema in patients aged 65 and older. J Am Geriatr Soc 2005 Apr;53(4):643-8.
(241) McCullough PA, Duc P, Omland T, McCord J, Nowak RM, Hollander JE, et al. B-type natriuretic peptide and renal function in the diagnosis of heart failure: an analysis from the Breathing Not Properly Multinational Study. Am J Kidney Dis 2003 Mar;41(3):571-9.
(242) Maisel AS, Clopton P, Krishnaswamy P, Nowak RM, McCord J, Hollander JE, et al. Impact of age, race, and sex on the ability of B-type natriuretic peptide to aid in the emergency diagnosis of heart failure: results from the Breathing Not Properly (BNP) multinational study. Am Heart J 2004 Jun;147(6):1078-84.
146
(243) Mueller C, Laule-Kilian K, Scholer A, Frana B, Rodriguez D, Schindler C, et al. Use of B-type natriuretic peptide for the management of women with dyspnea. Am J Cardiol 2004 Dec 15;94(12):1510-4.
(244) Mueller C, Laule-Kilian K, Scholer A, Nusbaumer C, Zeller T, Staub D, et al. B-type natriuretic peptide for acute dyspnea in patients with kidney disease: insights from a randomized comparison. Kidney Int 2005 Jan;67(1):278-84.
(245) Wang TJ, Larson MG, Levy D, Benjamin EJ, Leip EP, Wilson PW, et al. Impact of obesity on plasma natriuretic peptide levels. Circulation 2004 Feb 10;109(5):594-600.
(246) McCord J, Mundy BJ, Hudson MP, Maisel AS, Hollander JE, Abraham WT, et al. Relationship between obesity and B-type natriuretic peptide levels. Arch Intern Med 2004 Nov 8;164(20):2247-52.
(247) Morrison LK, Harrison A, Krishnaswamy P, Kazanegra R, Clopton P, Maisel A. Utility of a rapid B-natriuretic peptide assay in differentiating congestive heart failure from lung disease in patients presenting with dyspnea. J Am Coll Cardiol 2002 Jan 16;39(2):202-9.
(248) Mair J, Hammerer-Lercher A, Puschendorf B. The impact of cardiac natriuretic peptide determination on the diagnosis and management of heart failure. Clin Chem Lab Med 2001 Jul;39(7):571-88.
(249) Biosite Incorporated SDC. BNP Product Literature. 2002. Ref Type: Pamphlet
(250) Tanner MA, Galanello R, Dessi C, Smith GC, Westwood MA, Agus A, et al. A randomized, placebo-controlled, double-blind trial of the effect of combined therapy with deferoxamine and deferiprone on myocardial iron in thalassemia major using cardiovascular magnetic resonance. Circulation 2007;115:1876-84.
(251) Westwood M, Anderson LJ, Firmin DN, Gatehouse PD, Charrier CC, Wonke B, et al. A single breath-hold multiecho T2* cardiovascular magnetic resonance technique for diagnosis of myocardial iron overload. J Magn Reson Imaging 2003 Jul;18(1):33-9.
(252) Maceira AM, Prasad SK, Khan M, Pennell DJ. Normalized left ventricular systolic and diastolic function by steady state free precession cardiovascular magnetic resonance. J Cardiovasc Magn Reson 2006;8:417-26.
(253) Tanner MA, Galanello R, Dessi C, Westwood MA, Smith GC, Nair SV, et al. Myocardial iron loading in patients with thalassaemia major on deferoxamine chelation. J Cardiovasc Magn Reson 2006;8:543-7.
(254) Tanner M, Galanello R, Dessi C, Smith G, Westwood M, Agus A, et al. Combined chelation therapy in thalassemia major for the treatment of severe myocardial siderosis with left ventricular dysfunction. Journal of Cardiovascular Magnetic Resonance 2008;10(1):12.
(255) Tanner MA, Galanello R, Dessi C, Smith GC, Westwood MA, Agus A, et al. A randomized, placebo controlled, double blind trial of the effect of combined therapy
147
with deferoxamine and deferiprone on myocardial iron in thalassemia major using cardiovascular magnetic resonance. Circulation 2007;115:1876-84.
(256) Delea TE, Hagiwara M, Thomas SK, Baladi JF, Phatak PD, Coates TD. Outcomes, utilization, and costs among thalassemia and sickle cell disease patients receiving deferoxamine therapy in the United States. Am J Hematol 2008 Apr;83(4):263-70.
(257) Cunningham MJ, Macklin EA, Neufeld EJ, Cohen AR. Complications of beta-thalassemia major in North America. Blood 2004 Jul 1;104(1):34-9.
(258) Atiq M, Bana M, Ahmed US, Bano S, Yousuf M, Fadoo Z, et al. Cardiac disease in beta-thalassaemia major: Is it reversible? Singapore Med J 2006 Aug;47(8):693-6.
(259) Vichinsky E, Butensky E, Fung E, Hudes M, Theil E, Ferrell L, et al. Comparison of organ dysfunction in transfused patients with SCD or beta thalassemia. Am J Hematol 2005 Sep;80(1):70-4.
(260) Cario H, Stahnke K, Sander S, Kohne E. Epidemiological situation and treatment of patients with thalassemia major in Germany: results of the German multicenter beta-thalassemia study. Ann Hematol 2000 Jan;79(1):7-12.
(261) Ucar T, Ileri T, Atalay S, Uysal Z, Tutar E, Ertem M. Early detection of myocardial dysfunction in children with beta-thalassaemia major. Int J Cardiovasc Imaging 2008 Dec 24.
(262) Aessopos A, Farmakis D, Polonifi A, Tsironi M, Fragodimitri C, Hatziliami A, et al. Plasma B-type natriuretic peptide concentration in beta-thalassaemia patients. Eur J Heart Fail 2007 May;9(5):537-41.
(263) Kremastinos DT, Tsiapras DP, Kostopoulou AG, Hamodraka ES, Chaidaroglou AS, Kapsali ED. NT-proBNP levels and diastolic dysfunction in beta-thalassaemia major patients. Eur J Heart Fail 2007 May;9(5):531-6.
(264) Akpinar O, Acarturk E, Kanadasi M, Unsal C, Baslamisli F. Tissue doppler imaging and NT-proBNP levels show the early impairment of ventricular function in patients with beta-thalassaemia major. Acta Cardiol 2007 Jun;62(3):225-31.
(265) Bellenger NG, Burgess MI, Ray SG, Lahiri A, Coats AJ, Cleland JG, et al. Comparison of left ventricular ejection fraction and volumes in heart failure by echocardiography, radionuclide ventriculography and cardiovascular magnetic resonance; are they interchangeable? Eur Heart J 2000 Aug;21(16):1387-96.
(266) Bellenger NG, Francis JM, Davies CL, Coats AJ, Pennell DJ. Establishment and performance of a magnetic resonance cardiac function clinic. J Cardiovasc Magn Reson 2000;2(1):15-22.
(267) Malm S, Frigstad S, Sagberg E, Larsson H, Skjaerpe T. Accurate and reproducible measurement of left ventricular volume and ejection fraction by contrast echocardiography: a comparison with magnetic resonance imaging. J Am Coll Cardiol 2004 Sep 1;44(5):1030-5.
148
(268) Malm S, Sagberg E, Larsson H, Skjaerpe T. Choosing apical long-axis instead of two-chamber view gives more accurate biplane echocardiographic measurements of left ventricular ejection fraction: a comparison with magnetic resonance imaging. J Am Soc Echocardiogr 2005 Oct;18(10):1044-50.
(269) Edvardsen T, Gerber BL, Garot J, Bluemke DA, Lima JA, Smiseth OA. Quantitative assessment of intrinsic regional myocardial deformation by Doppler strain rate echocardiography in humans: validation against three-dimensional tagged magnetic resonance imaging. Circulation 2002 Jul 2;106(1):50-6.
(270) Magri D, Sciomer S, Fedele F, Gualdi G, Casciani E, Pugliese P, et al. Early impairment of myocardial function in young patients with beta-thalassemia major. Eur J Haematol 2008 Jun;80(6):515-22.
(271) Hamdy AM. Use of strain and tissue velocity imaging for early detection of regional myocardial dysfunction in patients with beta thalassemia. Eur J Echocardiogr 2007 Mar 1;8(2):102-9.
(272) Dokainish H, Zoghbi WA, Lakkis NM, Al-Bakshy F, Dhir M, Quinones MA, et al. Optimal noninvasive assessment of left ventricular filling pressures: a comparison of tissue Doppler echocardiography and B-type natriuretic peptide in patients with pulmonary artery catheters. Circulation 2004 May 25;109(20):2432-9.
(273) Hadano Y, Murata K, Liu J, Oyama R, Harada N, Okuda S, et al. Can transthoracic Doppler echocardiography predict the discrepancy between left ventricular end-diastolic pressure and mean pulmonary capillary wedge pressure in patients with heart failure? Circ J 2005 Apr;69(4):432-8.
(274) Dokainish H. Combining tissue Doppler echocardiography and B-type natriuretic peptide in the evaluation of left ventricular filling pressures: review of the literature and clinical recommendations. Can J Cardiol 2007 Oct;23(12):983-9.
(275) Paulus WJ, Tschope C, Sanderson JE, Rusconi C, Flachskampf FA, Rademakers FE, et al. How to diagnose diastolic heart failure: a consensus statement on the diagnosis of heart failure with normal left ventricular ejection fraction by the Heart Failure and Echocardiography Associations of the European Society of Cardiology. Eur Heart J 2007 Oct;28(20):2539-50.
(276) Parale GP, Pawar SS, Tapare VS. Assessment of LV diastolic function in patients with beta-thalassemia major with special reference to E/Eann ratio. J Pediatr Hematol Oncol 2009 Jan;31(1):69-73.
(277) Kidawa M, Coignard L, Drobinski G, Krzeminska-Pakula M, Thomas D, Komajda M, et al. Comparative value of tissue Doppler imaging and m-mode color Doppler mitral flow propagation velocity for the evaluation of left ventricular filling pressure. Chest 2005 Oct;128(4):2544-50.
(278) Aessopos A, Deftereos S, Tsironi M, Karabatsos F, Yousef J, Fragodimitri C, et al. Predictive echo-Doppler indices of left ventricular impairment in B-thalassemic patients. Ann Hematol 2007 Jun;86(6):429-34.
149
(279) Citro R, Galderisi M. Myocardial postsystolic motion in ischemic and not ischemic myocardium: the clinical value of tissue Doppler. Echocardiography 2005 Jul;22(6):525-32.
(280) Citro R, Galderisi M, Guarini P, Cicala S, Mattioli D, Bianco A, et al. Left bundle branch block with and without coronary artery disease: which value for a tissue Doppler-derived post-systolic motion? Ital Heart J 2003 Oct;4(10):706-12.
(281) Edvardsen T, Skulstad H, Aakhus S, Urheim S, Ihlen H. Regional myocardial systolic function during acute myocardial ischemia assessed by strain Doppler echocardiography. J Am Coll Cardiol 2001 Mar 1;37(3):726-30.
(282) Jamal F, Strotmann J, Weidemann F, Kukulski T, D'hooge J, Bijnens B, et al. Noninvasive quantification of the contractile reserve of stunned myocardium by ultrasonic strain rate and strain. Circulation 2001 Aug 28;104(9):1059-65.
(283) Weidemann F, Dommke C, Bijnens B, Claus P, D'hooge J, Mertens P, et al. Defining the transmurality of a chronic myocardial infarction by ultrasonic strain-rate imaging: implications for identifying intramural viability: an experimental study. Circulation 2003 Feb 18;107(6):883-8.
(284) Aypar E, Alehan D, Hazirolan T, Gumruk F. The efficacy of tissue Doppler imaging in predicting myocardial iron load in patients with beta-thalassemia major: correlation with T2* cardiovascular magnetic resonance 12. Int J Cardiovasc Imaging 2010 Apr;26(4):413-21.
(285) Balci YI, Gurses D. Detection of early cardiac dysfunction in patients with beta-thalassemia major and thalassemia trait by tissue doppler echocardiography. Pediatr Hematol Oncol 2011 Sep;28(6):486-96.
(286) Garadah TS, Mahdi N, Kassab S, Shoroqi IA, bu-Taleb A, Jamsheer A. The pro-BNP Serum Level and Echocardiographic Tissue Doppler Abnormalities in Patients with Beta Thalassemia Major. Clin Med Insights Cardiol 2010;4:135-41.
(287) Balkan C, Tuluce SY, Basol G, Tuluce K, Ay Y, Karapinar DY, et al. Relation between NT-proBNP levels, iron overload, and early stage of myocardial dysfunction in beta-thalassemia major patients. Echocardiography 2012 Mar;29(3):318-25.
150
CHAPTER 9: APPENDIX
9.1 PUBLICATIONS ARISING FROM THIS WORK
9.1.1 Peer Reviewed Papers
Nair SV, Galanello, R. Tanner, M.A, Westwood, M.A, Pennell, D.J, Walker, J.M. Tissue Doppler imaging complements the assessment of cardiac function in β-thalassaemia but does not supplant magnetic resonance imaging assessment of tissue iron load by T2* New York Academy of Science, In Press 9.1.2 Contributions To Other Papers
Tanner M, Galanello R, Dessi C, Smith G, Westwood M, Agus A, Nair SV et al. Combined chelation therapy in thalassemia major for the treatment of severe myocardial siderosis with left ventricular dysfunction. Journal of Cardiovascular Magnetic Resonance 2008;10(1):12. Tanner MA, Galanello R, Dessi C, Smith GC, Westwood MA, Agus A, Roughton M, Assomull R Nair SV et al. A randomised, placebo-controlled, double-blind trial of the effect of combined therapy with deferoxamine and deferiprone on myocardial iron in thalassaemia major using cardiovascular magnetic resonance. Circulation 2007 Apr 10; 115(14): 1876-84 Tanner MA, Galanello R, Dessi C, Westwood MA, Smith GC, Nair SV et al. Myocardial iron loading in patients with thalassaemia major on deferoxamine chelation. Journal of Cardiovascular Magnetic Resonance. 2006; 8(3): 543-7. 9.1.3 Abstracts British Cardiac Society Annual Conference, April 2006. Oral Presentaion. “Limitations of Standard Transthoracic Echocardiogaphy to Assess The Cardiovascular Consequences Of Transfusional Iron Overload In Thalassaemia Major”. 9.1.4 Poster Presentations Diastolic Tissue Doppler Velocities and Longitudinal Motion Improve Significantly In Thalassaemia Patients with Severe Cardiac Iron Siderosis Following Intensive Combination Chelation. Euroecho 2009, December 2009 Systolic Tissue Doppler Velocities In The Septum And RV Free Wall Significantly Increase With Removal of Cardiac Iron Using Combined Iron Chelation Therapy. International Thalassaemia Conference, October 2008 Transthoracic Echocardiography Ejection Fraction (EF) Correlates Well With Cardiac MRI EF In Thalassaemia Major Patients But Normal EF Fails To Reassure. International Thalassaemia Conference, October 2008 Standard Transthoracic Echocardiography Is Limited In Assessing Cardiovascular Consequences Of Transfusional Iron Overload In Thalassaemia Major Patients But Newer
151
Tissue Doppler Techniques May Be More Useful. International Thalassaemia Conference, October 2008 9.2 PERSONAL CONTRIBUTION TO THE RESEARCH
This project stemmed from a previous study by Dr Malcolm Walker, Dr Lisa Anderson and Dr
Vogel. I wrote a grant application to explore the roles of brain natriuretic peptide and tissue
Doppler echocardiography in the management of transfusion dependant thalassaemia major
patients and was awarded a 2 year British Heart Foundation Junior Research Fellowship under
the supervision of Dr Malcolm Walker.
I performed the majority of the TTE scans at the baseline visit to Cagliari and all the TTE scans
at both the 6 and 12 month visits. I performed all of the echo analysis and reporting. I
performed and analysed all the tissue Doppler imaging data. I have compared and analyzed all
the results personally. The cardiac MRI and T2* data was obtained and analysed by Dr Mark
Tanner, Royal Brompton Hospital.
9.3 SUPERVISION
My supervisor for this research was Dr J Malcolm Walker, consultant cardiologist and head of
the Thalassaemia Cardiomyopathy Clinic, University College Hospital.
I received additional supervision and advice from Professor Dudley Pennell, director of the
CMR Unit at the Royal Brompton Hospital, London; Professor Renzo Galanello, consultant
haematologist, Ospedale Regionale per le Microcitemie, Cagliari, Italy; Dr Beatrix Wonke,
consultant haematologist, Whittington Hospital, London and Dr Denis Pellerin, consultant
cardiologist, The Heart Hospital, London.
I would like to thank my colleagues Dr Mark Tanner & Dr Mark Westwood for their assistance
and support. Thank you also to other staff at the thalassaemia cardiomyopathy clinic, University
152
College Hospital, London; The Hatter Institute, University College Hospital, London; Ospedale
le Microcitemie, Cagliari, Italy; CMR unit, Royal Brompton Hospital, London and the
haematology department, Whittington hospital, London.
Special thanks go to Veronica Green, my partner, for her support and encouragement during my
period of research and thereafter. I am truly grateful for the sacrifices she has made during the
completion of this thesis.
9.4 RESEARCH FUNDING
This project was funded by a Junior Research Fellowship grant from the British Heart
Foundation (FS/04/011).
9.5 ADDITIONAL DOCUMENTATION ON ENCLOSED CD
Baseline echo data spreadsheet.
6 Month echo data spreadsheet
12 month echo data spreadsheet
TDI data at baseline
TDI data at 6 months
TDI data at 12 months
Related Documents