ORIGINAL ARTICLE The role of anthropogenic vs. natural in-stream structures in determining connectivity and genetic diversity in an endangered freshwater fish, Macquarie perch (Macquaria australasica) Leanne K. Faulks, 1 Dean M. Gilligan 2 and Luciano B. Beheregaray 1,3 1 Department of Biological Sciences, Molecular Ecology Lab, Macquarie University, Sydney, NSW, Australia 2 Industry and Investment New South Wales, Batemans Bay Fisheries Office, Batemans Bay, NSW, Australia 3 School of Biological Sciences, Flinders University, Adelaide, SA, Australia Introduction At large spatial and temporal scales, such as across land- scapes and geological time, habitat fragmentation is a natural process that promotes the diversification of ecological niches and the evolution of species. However, contemporary habitat fragmentation is largely induced by anthropogenic activities and usually occurs at a much fas- ter rate than the natural process. Indeed, habitat fragmen- tation is now recognized as one of the leading threats to ecosystems worldwide (Kingsford et al. 2009). Freshwater environments are naturally fragmented by mountain ranges and coastlines that delineate basin boundaries and are also structured as hierarchical riverine networks (Fausch et al. 2002; Magalhaes et al. 2002; Boys and Thoms 2006) with features such as waterfalls and cascades acting as natural barriers. Some of the most disruptive anthropogenic activities in freshwater environments are the construction of impoundments and agricultural or industrial practices (Cadwallader 1978; Allan and Flecker 1993; Maitland 1995). For example, the construction of impoundments can affect habitat structure, change macro-invertebrate community composition, alter natural flow regimes and impede fish dispersal (Petts 1984; Gehrke et al. 2002). Changes in water quality can also result from impoundment construction but are often a consequence of catchment land use such as clearing for agriculture and mining activities (Dudgeon et al. 2006; Growns et al. 2009). These landscape-level processes can impact immediate in-stream habitats as well as have cascading effects at larger scales within a river basin. Similarly, habitat fragmentation can have both direct and indirect consequences at the population level. Habitat loss and fragmentation are known to result in reduced Keywords Australia, habitat fragmentation, impoundment, landscape and conservation genetics, phylogeography, riffle. Correspondence Luciano Beheregaray, School of Biological Sciences, Flinders University, Adelaide 5001, SA, Australia. Tel.: +61 8 8201 5243; fax: +61 8 8201 3015; e-mail: luciano.beheregaray@flinders. edu.au Received: 14 December 2010 Accepted: 15 December 2010 doi:10.1111/j.1752-4571.2011.00183.x Abstract Habitat fragmentation is one of the leading causes of population declines, threatening ecosystems worldwide. Freshwater taxa may be particularly sensitive to habitat loss as connectivity between suitable patches of habitat is restricted not only by the natural stream network but also by anthropogenic factors. Using a landscape genetics approach, we assessed the impact of habitat availability on population genetic diversity and connectivity of an endangered Australian fresh- water fish Macquarie perch, Macquaria australasica (Percichthyidae). The rela- tive contribution of anthropogenic versus natural in-stream habitat structures in shaping genetic structure and diversity in M. australasica was quite striking. Genetic diversity was significantly higher in locations with a higher river slope, a correlate of the species preferred habitat – riffles. On the other hand, barriers degrade preferred habitat and impede dispersal, contributing to the degree of genetic differentiation among populations. Our results highlight the importance of landscape genetics to understanding the environmental factors affecting fresh- water fish populations and the potential practical application of this approach to conservation management of other freshwater organisms. Evolutionary Applications ISSN 1752-4571 ª 2011 Blackwell Publishing Ltd 1

Welcome message from author
This document is posted to help you gain knowledge. Please leave a comment to let me know what you think about it! Share it to your friends and learn new things together.
Transcript
ORIGINAL ARTICLE
The role of anthropogenic vs. natural in-stream structuresin determining connectivity and genetic diversity in anendangered freshwater fish, Macquarie perch (Macquariaaustralasica)Leanne K. Faulks,1 Dean M. Gilligan2 and Luciano B. Beheregaray1,3
1 Department of Biological Sciences, Molecular Ecology Lab, Macquarie University, Sydney, NSW, Australia
2 Industry and Investment New South Wales, Batemans Bay Fisheries Office, Batemans Bay, NSW, Australia
3 School of Biological Sciences, Flinders University, Adelaide, SA, Australia
Introduction
At large spatial and temporal scales, such as across land-
scapes and geological time, habitat fragmentation is a
natural process that promotes the diversification of
ecological niches and the evolution of species. However,
contemporary habitat fragmentation is largely induced by
anthropogenic activities and usually occurs at a much fas-
ter rate than the natural process. Indeed, habitat fragmen-
tation is now recognized as one of the leading threats to
ecosystems worldwide (Kingsford et al. 2009). Freshwater
environments are naturally fragmented by mountain
ranges and coastlines that delineate basin boundaries and
are also structured as hierarchical riverine networks
(Fausch et al. 2002; Magalhaes et al. 2002; Boys and
Thoms 2006) with features such as waterfalls and cascades
acting as natural barriers. Some of the most disruptive
anthropogenic activities in freshwater environments are
the construction of impoundments and agricultural or
industrial practices (Cadwallader 1978; Allan and Flecker
1993; Maitland 1995). For example, the construction of
impoundments can affect habitat structure, change
macro-invertebrate community composition, alter natural
flow regimes and impede fish dispersal (Petts 1984;
Gehrke et al. 2002). Changes in water quality can also
result from impoundment construction but are often a
consequence of catchment land use such as clearing for
agriculture and mining activities (Dudgeon et al. 2006;
Growns et al. 2009). These landscape-level processes can
impact immediate in-stream habitats as well as have
cascading effects at larger scales within a river basin.
Similarly, habitat fragmentation can have both direct
and indirect consequences at the population level. Habitat
loss and fragmentation are known to result in reduced
Keywords
Australia, habitat fragmentation,
impoundment, landscape and conservation
genetics, phylogeography, riffle.
Correspondence
Luciano Beheregaray, School of Biological
Sciences, Flinders University, Adelaide 5001,
SA, Australia.
Tel.: +61 8 8201 5243; fax: +61 8 8201
3015; e-mail: luciano.beheregaray@flinders.
edu.au
Received: 14 December 2010
Accepted: 15 December 2010
doi:10.1111/j.1752-4571.2011.00183.x
Abstract
Habitat fragmentation is one of the leading causes of population declines,
threatening ecosystems worldwide. Freshwater taxa may be particularly sensitive
to habitat loss as connectivity between suitable patches of habitat is restricted
not only by the natural stream network but also by anthropogenic factors. Using
a landscape genetics approach, we assessed the impact of habitat availability on
population genetic diversity and connectivity of an endangered Australian fresh-
water fish Macquarie perch, Macquaria australasica (Percichthyidae). The rela-
tive contribution of anthropogenic versus natural in-stream habitat structures in
shaping genetic structure and diversity in M. australasica was quite striking.
Genetic diversity was significantly higher in locations with a higher river slope,
a correlate of the species preferred habitat – riffles. On the other hand, barriers
degrade preferred habitat and impede dispersal, contributing to the degree of
genetic differentiation among populations. Our results highlight the importance
of landscape genetics to understanding the environmental factors affecting fresh-
water fish populations and the potential practical application of this approach
to conservation management of other freshwater organisms.
Evolutionary Applications ISSN 1752-4571
ª 2011 Blackwell Publishing Ltd 1

population sizes and reduced demographic and genetic
connectivity (Ewers and Didham 2006; Lowe and Allen-
dorf 2010). The latter takes place because increased isola-
tion and novel ecological boundaries can impact on the
relative contribution of net immigration to demographic
connectivity – total population recruitment and also
genetic connectivity – the effective number of dispersers
(Lowe and Allendorf 2010). In turn, fragmented popula-
tions are supposed to experience reduced levels of genetic
diversity, population growth rate and population viability
(Frankham 1995; Ewers and Didham 2006) and increased
risk of local extinction (Spielman et al. 2004). Ongoing
habitat fragmentation also impacts negatively on evolu-
tionary resilience – the ability of populations to persist in
their current state and to undergo evolutionary adapta-
tion in response to a changing environment (sensu Blan-
chet et al. 2010; Sgro et al. 2010; Ewers and Didham
2006).
The eventual impact of these demographic and genetic
changes on a species can be influenced by the species
biology, particularly dispersal ability, life-history charac-
teristics and habitat requirements. Dispersal potential
enables species to respond to changes in the availability
of preferred habitat and can be crucial in determining the
effect of habitat fragmentation on genetic diversity (Raey-
makers et al. 2008; Watanabe et al. 2010). A recent review
revealed a significant negative association between the
genetic diversity of fish populations and human distur-
bance (DiBattista 2008), and there are several examples in
freshwater species (e.g. Belfiore and Anderson 2001). The
majority of studies of freshwater taxa have focused on the
impact of fragmentation on key migratory species such as
salmon; however, there is increasing recognition of whole
community effects (Gehrke et al. 2002). For species that
are naturally more sedentary, the genetic consequences of
habitat fragmentation such as reduced diversity could be
accentuated (Dehais et al. 2010; McCarney et al. 2010).
A valuable approach for exploring the influence of con-
temporary environmental factors on genetic diversity is
landscape genetics, an area of study that integrates popu-
lation genetics, environmental data and spatial statistics
(Manel et al. 2003; Storfer et al. 2007; Holderegger and
Wagner 2008). Landscape genetics can provide a greater
understanding of the interactions between species, ecosys-
tems and anthropogenic activities and can contribute to
conservation management of endangered species and the
environments in which they reside. Here, we use a land-
scape genetics approach to assess the impact of habitat
availability on population genetic diversity and structure
of an endangered (Australian Environment Protection and
Biodiversity Conservation Act 1999) Australian freshwater
fish, the Macquarie perch Macquaria australasica (Perc-
ichthyidae). This species is a habitat specialist and
remnant populations are found in rocky gorge country
with an abundance of riffles and where water quality is
good (Bruce et al., 2008; Gilligan et al. 2010). Adults are
thought to undergo small-scale migrations during the
breeding season to spawn in riffle beds (see Methods for
more details on species biology). These characteristics
make M. australasica an ideal species with which to test
the effect of habitat fragmentation on organisms with
limited dispersal behaviour and specific habitat require-
ments. Specifically, we evaluated the roles of natural habi-
tats (i.e. riffles) as well as anthropogenic in-stream
structures (i.e. weirs) in driving levels of genetic diversity,
population structure and contemporary patterns of
genetic connectivity. We predicted that the availability of
optimal habitat (riffles) would promote genetic diversity
and conversely that habitat fragmentation (anthropogenic
structures) would decrease genetic diversity and restrict
connectivity. We anticipate that the outcomes of this
study will contribute towards the conservation manage-
ment of this endangered species. In addition, the results
should further our understanding of the genetic conse-
quences of habitat loss and fragmentation on other fresh-
water organisms that have specific habitat requirements
and show limited dispersal behaviour.
Methods
Species distribution, status and biology
Remnant populations of M. australasica are restricted to
the headwaters of the Lachlan, Murrumbidgee, Murray,
Kiewa, Ovens, Goulburn-Broken and Campaspe Rivers in
the Murray-Darling Basin (MDB) to the west of the Great
Dividing Range (GDR), as well as the Hawkesbury-Nepean
(HN), Georges River and Shoalhaven basins on the east
of the GDR (Industry and Investment NSW Freshwater
Fish Research Database; Lintermans 2007) (Fig. 1). Previ-
ous genetic and morphological studies have provided
strong support for the differentiation of lineages on either
side of the GDR (Dufty 1986; Faulks et al. 2010a). During
the early 1900s, translocation occurred from the MDB
into the Yarra River (Victoria), Mongarlowe River (New
South Wales) and Cataract Dam (New South Wales)
(Cadwallader 1981). However, interbasin translocations
are no longer undertaken. Although both lineages co-
occur in the Cataract River (because of the translocation
of individuals), the extent of hybridization between them
is unknown and the taxonomic status of these two groups
is yet to be established (Faulks et al. 2010a). Despite the
species being protected throughout its natural range, the
natural population in the Shoalhaven catchment (Kanga-
roo River) declined rapidly during the late 1990s, and
despite intensive sampling effort (118 sampling occa-
sions), no individuals have been observed in the wild
Anthropogenic vs. natural in-stream structures in M. australasica Faulks et al.
2 ª 2011 Blackwell Publishing Ltd

since 1998. Monitoring of M. australasica populations
elsewhere indicates that the species is absent from up to
95% of its previous distribution (Bruce et al. 2008; Davies
et al. 2008). Loss of habitat and the construction of
impoundments are likely to be largely responsible for
these declines (Lintermans 2007; Bruce et al. 2008).
Other causes of population decline include increased
competition from native species following stocking, intro-
duced species (Perca fluviatilis and salmonids), overfishing
and susceptibility to epizootic haematopoietic necrosis
virus (EHNV) (Cadwallader 1978; McDowall, 1996; Allen
et al. 2002; Lintermans 2007).
Macquaria australasica adults from the MDB reach an
average length of 350 mm, and sexual maturity is reached
at 2 years for males and 3 years for females. Details of the
age, growth and maturity of coastal populations are still
unknown. Reproductive conditioning occurs during late
winter/spring, and adults undergo small-scale migrations
from pools to riffles to spawn in spring/early summer
when water temperature reaches approximately 15�C
(Wharton 1968; Cadwallader and Douglas 1986). Eggs
and larvae are demersal and remain in the riffles and the
extent of dispersal in juvenile stages is also thought to be
limited, resulting in localized recruitment (Cadwallader
and Rogan 1977). Even at this small scale, anthropogenic
structures have the potential to interfere with the species
reproductive cycle by restricting movement and habitat
availability.
Sample collection and DNA extraction
A total of 299 samples from 26 locations (n = 5–40) were
obtained from across the species range (Fig. 1) over sev-
eral years (2003–2008). Despite the potential for temporal
instability in population structure (e.g. McCairns and
Bernatchez, 2008), in this case, localized recruitment and
restricted dispersal mean that it is unlikely to have
influence on our results. Fish were collected using nonde-
structive methods such as electrofishing and bait trapping.
Small pieces of caudal fin tissue were taken, placed in
100% ethanol and stored at )20�C in the laboratory.
Total DNA was extracted from the tissue using a
Figure 1 Map of Australia indicating the study region. The first inset shows details of sampling locations of Macquaria australasica. The second
inset provides further details of sampling locations in the Hawkesbury-Nepean Basin. Dotted line indicates the Great Dividing Range (GDR).
Faulks et al. Anthropogenic vs. natural in-stream structures in M. australasica
ª 2011 Blackwell Publishing Ltd 3
salting-out method. We modified the method of Sun-
nucks and Hales (1996) by doubling the volume of TNES
(600 lL) in the digestion step and saturated salt solution
(170 lL) in the precipitation step. One sample from the
South Australian Museum and a few other samples that
yielded low-quality DNA using the salting-out method
were extracted using a QIAGEN DNeasy kit (Qiagen,
Hilden, Germany).
Microsatellite genotyping
Eight microsatellite DNA loci were amplified using PCR
primers originally developed for Australian Bass (Macqua-
ria novemaculeata) [AB009 (Schwartz et al. 2005)] and
Murray Cod (Macculochella peelii) [Mpe3.B11, Mpe2.E01,
Mpe1.F01, Mpe2.F07, Mpe3.G04, Mpe3.G12, Mpe1.H04
(Rourke et al. 2007)]. The forward primer for each primer
pair was incorporated with a fluorescent-labelled M13 tag
(Schuelke 2000). Loci were amplified and fluorescent dyes
incorporated in either single (AB009 VIC, Mpe3.B11
NED, Mpe2.E01 NED, Mpe3.G12 VIC) or multiplex
(Mpe3.G04 and Mpe1.H04 PET, Mpe1.F01 and Mpe2.F07
FAM) reactions. PCRs consisted of 1 lL template DNA,
2.5 mmol MgCl2, 60 mm KCl, 12 mm Tris–HCl pH 9.0,
0.12% Triton-X, 0.4 mm each dNTP, 0.78 pmol M13 for-
ward primer, 3.8 pmol reverse primer, 3.8 pmol M13 fluo-
rescent dye, 0.5 lg bovine serum albumin, 0.25 U Taq
DNA polymerase (Promega, Madison, WI, USA) and
dH2O to a final volume of 10 lL. PCR conditions were as
described in Schwartz et al. (2005). PCR products for the
eight loci (3–4 lL) for each sample were pooled, and 1 lL
of this product was mixed with 0.1 lL LIZ500 ladder and
9.9 lL HiDi. Products were then screened on an ABI
PRISM 377 with Genescan software (Applied Biosystems,
Carlsbad, CA, USA) at the Macquarie University DNA
Analysis Facility. Genotypes were visually inspected and
scored using GeneMapper (Applied Biosystems). In cases
of poor amplification, re-runs were conducted with a sin-
gle locus per reaction and without pooling. Genotypes
were checked for scoring errors because of null alleles,
stutter and large allele dropout using Microchecker 2.2.3
(van Oosterhout et al. 2004).
Genetic diversity
Fisher’s exact test of linkage disequilibrium between all
pairs of loci and conformance to Hardy–Weinberg
equilibrium in each population across all loci were tested
using Genepop 3.4 (Raymond and Rousset 1995).
Significance levels were Bonferroni-corrected to
address the risk of increased Type 1 error associated with
multiple tests (Rice 1989) and Benjamini-Yekutieli (B-Y)-
corrected to balance the risks of Type 1 and Type 2 errors
(Narum 2006). The expected (HE) and observed (HO) het-
erozygosities were calculated in Arlequin 3.1 (Excoffier
et al. 2006), and the corrected allelic richness (AR) and
inbreeding coefficient (FIS) per population were calculated
in FSTAT 2.9.3.2 (Goudet 2002). To evaluate whether pop-
ulations may have experienced recent bottlenecks, we cal-
culated the M ratio [Arlequin 3.1 (Garza and Williamson
2001)] and levels of heterozygosity [Bottleneck 1.2.02 (Piry
et al. 1999)]. The M ratio is the mean ratio of the number
of alleles compared to the range in allele size, and values
smaller than 0.68 indicate that the population has experi-
enced a recent and severe reduction in population size
(Garza and Williamson 2001). Hybridization can invalidate
the M ratio; therefore the Cataract River population, where
translocation of distinct lineages has occurred, was not
tested. Excess heterozygosity, owing to a faster rate of the
number of alleles lost compared to the reduction in gene
diversity, was assessed using both the stepwise (SMM) and
two-phased models of mutation (TPM) and a Wilcoxon
test in Bottleneck (Piry et al. 1999).
Population genetic structure
Population differentiation was evaluated using global and
pairwise FST tests, and levels of population subdivision
were assessed (AMOVA) among basins and among loca-
tions within basins. Weir and Cockerhams (Weir and
Cockerham 1984) FST values and significance levels were
calculated in Arlequin 3.1 (Excoffier et al. 2006). We used
FST rather than RST because of our relatively small number
of loci (<20) and recently diverged populations (Gaggiotti
et al. 1999), as shown in our mtDNA phylogeographical
study of this species (Faulks et al. 2010a).
Preliminary data analyses using both STRUCTURE
(nonspatial) (Pritchard et al. 2000) and Geneland (spa-
tial) (Guillot et al. 2005) to estimate population structure
obtained similar results. Geneland was chosen for final
analyses as the incorporation of spatial information pro-
vides a more realistic representation of the study system,
optimizing the ability to determine population structure
(sensu Dionne et al. 2008; Latch et al. 2008). All translo-
cated populations were removed from this analysis (Yarra
River, Mongarlowe River, Cataract Dam and River and
Loddon Ck). Geneland uses a Markov chain Monte Carlo
(MCMC) approach to identify genetic spatial discontinu-
ities. Five replicate runs were performed, each with
1 · 106 MCMC iterations, the Dirichlet model of allele
frequencies, no uncertainty in the spatial coordinates,
maximum rate of Poisson process 100 and the maximum
number of nuclei in the Poisson-Voronoi tessellation set
to 200. Plots of MCMC runs were assessed for mixing.
The most probable number of population clusters (K)
was the same for each run. The final output displays
Anthropogenic vs. natural in-stream structures in M. australasica Faulks et al.
4 ª 2011 Blackwell Publishing Ltd

maps of posterior probabilities of locations belonging to a
particular genetic cluster (K) or population. Although
these clusters (classes) may include areas of suboptimal
habitat, the important consideration is that a class con-
tains populations that are grouped together with a higher
probability than with populations from any other class.
Gene flow
Estimates of recent gene flow across the GDR as well as
among populations within the MDB and east coast were
assessed in BayesAss+ 1.3 (Wilson and Rannala 2003).
The program was run for 3 · 106 iterations including a
burn-in of 1 · 106 iterations. Delta values for allele fre-
quencies, inbreeding coefficients and migration rate were
set at 0.05, 0.10 and 0.02 for the entire data set; 0.45,
0.45 and 0.25 in the MDB; and 0.35, 0.35 and 0.15 on the
east coast. These values achieved the recommended accep-
tance rates of changes of 40–60% (Wilson and Rannala
2003). Convergence was assessed by plotting the cumula-
tive log likelihoods of the iterations. Estimates were con-
sidered ‘real’ if they were consistent in at least seven of 10
replicate runs, and the run with the best acceptance rates
and convergence was chosen for the parameter estimates.
Landscape genetics
We used a general linear model selection approach (e.g.
Banks et al. 2007) to identify the environmental variables
influencing genetic diversity [allelic richness (AR)]. AR was
used as the measure of diversity as it is a sensitive indicator
of changes in population demography (Nei et al. 1975).
The following environmental variables were considered:
distance of the site from the source (headwater), river
slope, total number of anthropogenic barriers within the
entire reach (including all upstream tributaries and down-
stream to the junction with the next larger waterway in the
stream hierarchy), riparian land use immediately surround-
ing the location (ranked from 1 to 4 in increasing order of
disturbance) and elevation and latitude of the sampling
location. Distance from the source was measured in Arc-
Map. River slope was calculated as the change in altitude in
m/km from 5 km upstream to 5 km downstream of each
sampling location. This measure was used as a surrogate of
potential riffle habitat within the reach. Although river
slope may also indicate flow velocity and valley shape, this
approach is considered appropriate in the absence of
detailed habitat mapping across the species distribution
(Jowett 1993; Thompson et al. 2006). The number of barri-
ers was calculated using the I&I NSW database (I&I NSW,
2008). These data include all structures of all ages, ranging
from culverts on road crossings to weirs and large dams
on impoundments (I&I NSW, 2008). Unfortunately,
equivalent data from catchments in Victoria were unavail-
able, so data from those locations were removed from this
analysis. Land use was inferred from Global Map 2001
(Geoscience Australia) and was categorized as follows:
1 = Forests, 2 = Grasslands, 3 = Water, 4 = Agriculture.
For the model selection analyses, all variables were stan-
dardized to a mean of zero and a standard deviation of
one. The assumptions of general linear models, including
normality and colinearity of variables, were assessed prior
to performing the modelling analyses. Only two of the vari-
ables were slightly skewed to lower values: river slope and
distance from the headwater source. In addition, only five
of the 15 pairwise comparisons were significantly corre-
lated, with none of the variables consistently correlated
with all others (Appendix 2). Therefore, all variables were
retained in the modelling analyses.
The best models were selected using Akaike’s Informa-
tion Criterion for small sample sizes (AICc) (Burnham
and Anderson 2002) and the independent effect of each
variable to the model estimated using hierarchical parti-
tioning (Walsh and MacNally 2008). In addition, we con-
ducted a re-sampling-based regression analysis to estimate
the effect of our environmental variables on AR while
controlling for unequal sample sizes among sites. In each
of 10 000 iterations, we re-sampled an equal number of
individuals (5) from each population, recalculated AR
over loci within a population and fitted a simple linear
regression model of the best environmental variable to
the AR data. We obtained the distribution (95% CI) of
the regression coefficient and considered our conclusions
robust if >97.5% of the coefficients were either consis-
tently positive or consistently negative.
Finally, we performed simple and partial Mantel tests
in FSTAT 2.9.3.2 (Goudet 2002) to determine the effect
of anthropogenic barriers and riverine distance on popu-
lation differentiation (FST). These tests were conducted
on the coastal populations only, because of the small
number of sites for which data were available in the
MDB. Riverine distances between pairs of populations
were calculated using ArcMap, and the number of barri-
ers between populations was calculated using the I&I
NSW database (I&I NSW, 2008). To investigate the effect
of variable samples sizes, we performed two tests, the first
with FST values calculated from the entire data set and
the second with FST values calculated from a single ran-
dom selection of five individuals from each population.
Each test involved 2000 permutations.
Results
Genetic diversity
We amplified eight polymorphic loci with no consistent
evidence for stutter, large allele dropout or linkage
Faulks et al. Anthropogenic vs. natural in-stream structures in M. australasica
ª 2011 Blackwell Publishing Ltd 5
disequilibrium. Some loci showed evidence of null alleles
(E01, G04 and G12). However, these were not consistent
across populations, and when analyses were run without
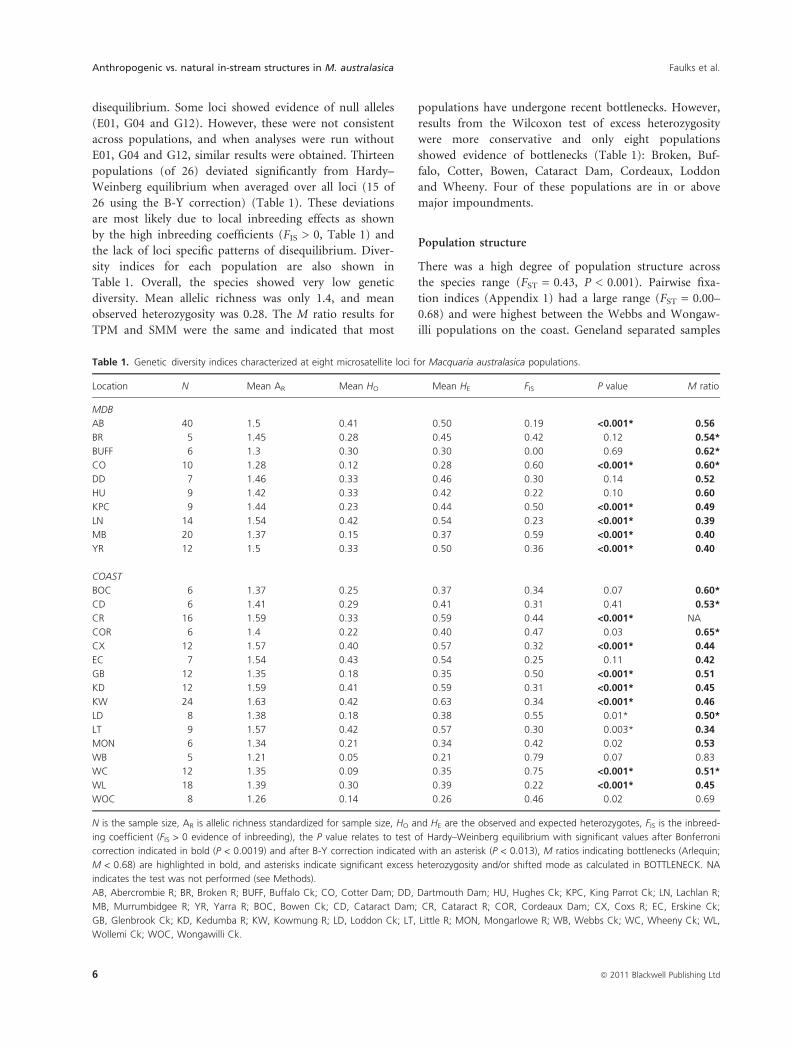
E01, G04 and G12, similar results were obtained. Thirteen
populations (of 26) deviated significantly from Hardy–
Weinberg equilibrium when averaged over all loci (15 of
26 using the B-Y correction) (Table 1). These deviations
are most likely due to local inbreeding effects as shown
by the high inbreeding coefficients (FIS > 0, Table 1) and
the lack of loci specific patterns of disequilibrium. Diver-
sity indices for each population are also shown in
Table 1. Overall, the species showed very low genetic
diversity. Mean allelic richness was only 1.4, and mean
observed heterozygosity was 0.28. The M ratio results for
TPM and SMM were the same and indicated that most
populations have undergone recent bottlenecks. However,
results from the Wilcoxon test of excess heterozygosity
were more conservative and only eight populations
showed evidence of bottlenecks (Table 1): Broken, Buf-
falo, Cotter, Bowen, Cataract Dam, Cordeaux, Loddon
and Wheeny. Four of these populations are in or above
major impoundments.
Population structure
There was a high degree of population structure across
the species range (FST = 0.43, P < 0.001). Pairwise fixa-
tion indices (Appendix 1) had a large range (FST = 0.00–
0.68) and were highest between the Webbs and Wongaw-
illi populations on the coast. Geneland separated samples
Table 1. Genetic diversity indices characterized at eight microsatellite loci for Macquaria australasica populations.
Location N Mean AR Mean HO Mean HE FIS P value M ratio
MDB
AB 40 1.5 0.41 0.50 0.19 <0.001* 0.56
BR 5 1.45 0.28 0.45 0.42 0.12 0.54*
BUFF 6 1.3 0.30 0.30 0.00 0.69 0.62*
CO 10 1.28 0.12 0.28 0.60 <0.001* 0.60*
DD 7 1.46 0.33 0.46 0.30 0.14 0.52
HU 9 1.42 0.33 0.42 0.22 0.10 0.60
KPC 9 1.44 0.23 0.44 0.50 <0.001* 0.49
LN 14 1.54 0.42 0.54 0.23 <0.001* 0.39
MB 20 1.37 0.15 0.37 0.59 <0.001* 0.40
YR 12 1.5 0.33 0.50 0.36 <0.001* 0.40
COAST
BOC 6 1.37 0.25 0.37 0.34 0.07 0.60*
CD 6 1.41 0.29 0.41 0.31 0.41 0.53*
CR 16 1.59 0.33 0.59 0.44 <0.001* NA
COR 6 1.4 0.22 0.40 0.47 0.03 0.65*
CX 12 1.57 0.40 0.57 0.32 <0.001* 0.44
EC 7 1.54 0.43 0.54 0.25 0.11 0.42
GB 12 1.35 0.18 0.35 0.50 <0.001* 0.51
KD 12 1.59 0.41 0.59 0.31 <0.001* 0.45
KW 24 1.63 0.42 0.63 0.34 <0.001* 0.46
LD 8 1.38 0.18 0.38 0.55 0.01* 0.50*
LT 9 1.57 0.42 0.57 0.30 0.003* 0.34
MON 6 1.34 0.21 0.34 0.42 0.02 0.53
WB 5 1.21 0.05 0.21 0.79 0.07 0.83
WC 12 1.35 0.09 0.35 0.75 <0.001* 0.51*
WL 18 1.39 0.30 0.39 0.22 <0.001* 0.45
WOC 8 1.26 0.14 0.26 0.46 0.02 0.69
N is the sample size, AR is allelic richness standardized for sample size, HO and HE are the observed and expected heterozygotes, FIS is the inbreed-
ing coefficient (FIS > 0 evidence of inbreeding), the P value relates to test of Hardy–Weinberg equilibrium with significant values after Bonferroni
correction indicated in bold (P < 0.0019) and after B-Y correction indicated with an asterisk (P < 0.013), M ratios indicating bottlenecks (Arlequin;
M < 0.68) are highlighted in bold, and asterisks indicate significant excess heterozygosity and/or shifted mode as calculated in BOTTLENECK. NA
indicates the test was not performed (see Methods).
AB, Abercrombie R; BR, Broken R; BUFF, Buffalo Ck; CO, Cotter Dam; DD, Dartmouth Dam; HU, Hughes Ck; KPC, King Parrot Ck; LN, Lachlan R;
MB, Murrumbidgee R; YR, Yarra R; BOC, Bowen Ck; CD, Cataract Dam; CR, Cataract R; COR, Cordeaux Dam; CX, Coxs R; EC, Erskine Ck;
GB, Glenbrook Ck; KD, Kedumba R; KW, Kowmung R; LD, Loddon Ck; LT, Little R; MON, Mongarlowe R; WB, Webbs Ck; WC, Wheeny Ck; WL,
Wollemi Ck; WOC, Wongawilli Ck.
Anthropogenic vs. natural in-stream structures in M. australasica Faulks et al.
6 ª 2011 Blackwell Publishing Ltd

into four major groups, which correspond broadly with
catchment structure: Class 1. upper-mid-HN (Kowmung,
Coxs, Kedumba, Little, Erskine, Glenbrook), Class 2.
lower HN (Bowens, Cordeaux, Wollemi, Wongawilli,
Webbs), Class 3. Murrumbidgee and Class 4. Lachlan and
Murray. The inclusion of Cordeaux Dam and Wongawilli
with the lower HN group (Class 2) may indicate that
some long-distance dispersals or localized translocations
have occurred in the HN. However, there were no reliable
estimates of migration among the coastal populations as
BayesAss+ results were inconsistent between runs (<7 of
10 runs). There was very little recent gene flow across the
GDR, with the proportion of migrant individuals per gen-
eration being 0.004 from the HN to the MDB (CI 0.000–
0.016) and 0.010 from the MDB to the HN (CI 0.000–
0.036). In contrast, estimates of recent gene flow among
populations of the MDB consistently (10 of 10 runs)
indicated significant amounts of migration from the
Abercrombie to the Lachlan [0.231 (CI 0.121–0.314)].
However, estimates of migration among the remaining
MDB populations were inconsistent between runs (<7 of
10 runs).
Landscape genetics
The model that best explained levels of genetic diversity
within populations included just one environmental vari-
able: river slope (Table 2). Other highly ranked models
retained river slope but also included distance from the
headwater source (DAICc = 0.2892) and land use
(DAICc = 0.8075). Hierarchical partitioning of the data
indicated that the majority of variation in genetic diver-
sity among populations could be explained by variation
in the river slope (58.9%) and distance from the source
(21.5%). However, the only significant variable in all of
the models was river slope, which was positively corre-
lated with genetic diversity (AR) (Fig. 2). The results of
our regression analyses were shown to be robust to varia-
tion in sample size. Our re-sampling procedure indicated
that the coefficient for river slope was always positive
[0.041 CI (0.029, 0.052)]. Mantel tests revealed that both
riverine distance and the number of barriers between sites
are correlated with genetic differentiation (FST) among
the coastal populations (Appendix 3). The number of
barriers that separate localities explains a significant por-
tion of genetic divergence across localities (R2 = 0.25,
P = 0.0245), even when riverine distance is factored out
in partial Mantel correlation analysis. The same results
were obtained when we recalculated FST using a random
sample of five individuals from each population.
Discussion
Our study of an endangered freshwater fish shows that
recent habitat fragmentation leads to negative genetic
consequences. Genetic diversity in M. australasica was sig-
nificantly higher in locations with a higher river slope, a
surrogate for riffles, the species preferred habitat
structure. In contrast, barriers both fragment and degrade
preferred habitat and impede dispersal, contributing to
the genetic differentiation of populations. We highlight
the importance of the landscape genetics approach to
understand environmental factors affecting freshwater fish
populations and its potential practical application to
conservation management of other freshwater organisms
with specific habitat requirements and limited dispersal
ability.
Preferred habitat promotes genetic diversity
Macquaria australasica is known to be a habitat specialist,
as extensive habitat mapping and surveying within some
of the most abundant remnant populations (the upper
Lachlan and Abercrombie Rivers and the HN) suggest
Table 2. Models of environmental variables to explain the distribution of genetic variation at eight microsatellite loci (AR) among populations of
Macquaria australasica.
Model
rank
River
slope
km from
source Barriers
Land
use Elevation Latitude Intercept AICc deltaAICc
Rsqu
(adj) ANOVA
Sig
variables
1 0.0592 1.43 )29.3577 0 0.228 0.019 rs
2 0.0551 0.0357 1.43 )29.0685 0.2892 0.278 0.024 rs
3 0.0657 0.0436 1.44 )28.5502 0.8075 0.26 0.03 rs
Null (12) )25.5947 3.7631
Full (63) 0.0679 0.0359 )0.0014 0.0343 )0.0206 )0.0456 1.46 )15.2042 14.1535 0.145 0.242 rs
HP%IC 58.9 21.5 4.8 8.5 2.6 3.7
All variables are standardized to mean of zero and standard deviation of one. HP %IC, independent contribution of each environmental variable
to explaining the variation in AR; AICc, Akaike’s Information Criterion adjusted for small sample sizes; R2 (adj), R2 adjusted for the number of
variables in the multiple regression analysis; ANOVA, P value for the analysis of variation of environmental variables in the multiple regression
(significance at P < 0.01 following Bonferroni correction); Sig., variables making a significant contribution to the model according to the ANOVA;
rs, river slope.
Faulks et al. Anthropogenic vs. natural in-stream structures in M. australasica
ª 2011 Blackwell Publishing Ltd 7

that the area of riffles within a reach is one of the best
predictors of the species presence (Bruce et al., 2008;
Gilligan et al. 2010). Species-habitat association modelling
indicates that at least one ha and an optimum of three ha
of riffle habitat per kilometre of stream are required for
M. australasica to be present (Gilligan et al. 2010). Riffles
are known to be a vital factor for successful recruitment
of M. australasica populations (Cadwallader and Rogan
1977). These areas of the stream habitat are where demer-
sal eggs are laid and remain until hatching and where lar-
vae shelter during development. Therefore, a greater area
of riffles provides a greater area of suitable spawning sub-
stratum and may also improve the survival of larval fish.
Gilligan et al. (2010) indicated that the Abercrombie
River had more optimal habitat for the species, with 56%
of reaches containing suitable habitats, including riffles,
compared with 20% in the Lachlan River. Our measure
of riffle habitat, river slope, was also higher in the Aber-
crombie than in the Lachlan River (6.4 and 4.3 m/km,
respectively), supporting our use of this measure as a
surrogate for the species preferred habitat.
Although natural river structures and river slope have
been observed to influence the levels of genetic structure
in other species (Wofford et al. 2005; Boizard et al. 2009;
Blanchet et al. 2010; Cook et al. 2010), we believe there is
also a clear need to consider the patterns and processes
that influence genetic diversity of populations. This is
especially true in endangered species where management
resources need to be directed to populations of high
priority, such as those with reduced levels of genetic
diversity (Amos and Balmford 2001). Maintaining the
resilience and evolutionary potential of such populations
could be facilitated by enhancing the environmental
processes identified by landscape genetics studies to be
important drivers of genetic diversity.
Anthropogenic structures contribute to population
genetic structure and restricted gene flow
Overall, broad-scale population genetic structure reflected
drainage basin divisions with the clear differentiation of
the MDB and HN, as well as the major catchments within
these drainage basins. There was no evidence of signifi-
cant amounts of recent gene flow across the GDR. This
provides further support to our finding of historically iso-
lated lineages based on mtDNA data (Faulks et al. 2010a)
as well as studies that showed allozyme and morphologi-
cal differentiation among populations across the GDR
(Dufty 1986). In addition, many characteristics of the
species biology and ecology are thought to differ on either
side of the GDR (A. Bruce, personal communication).
Therefore, support for the designation of the coastal and
MDB forms as separate evolutionary significant units
(ESUs) (sensu Crandall et al., 2000) is strong, and further
investigation into the taxonomic distinction of these
forms should be considered a priority.
Although the movement patterns of M. australasica are
not well documented, the species has been observed
undertaking small migrations within a localized home
range (Katie Ryan, University of Canberra, personal com-
munication). Despite relatively limited dispersal behav-
iour, we have demonstrated that habitat fragmentation, in
the form of anthropogenic structures, has led to increased
genetic differentiation of populations. We hypothesize
that M. australasica may undertake rare long-distance
dispersal events that are hindered by anthropogenic
structures. Alternatively, habitat fragmentation may have
a cumulative negative effect on the species genetic archi-
tecture. Until further studies clarify patterns of dispersal
behaviour in M. australasica, the specific effect that
anthropogenic structures exert on the species will remain
unclear.
The separation of populations within the MDB is likely
driven by a combination of extensive geographical
distances, unsuitable habitat conditions as well as the
presence of major anthropogenic structures, e.g. Cotter
Dam, Dartmouth Dam and Wyangala Dam. The only evi-
dence of recent migration was from the Abercrombie
River into the Lachlan River, adjacent waterways in the
same catchment. Migration between the two populations
appears unidirectional with the Abercrombie potentially
acting as a source population for the Lachlan. It is possi-
ble that greater habitat quality and quantity within the
Abercrombie River (Gilligan et al. 2010) result in a larger
population size and consequent Ne within the Abercrom-
bie River population. Within the HN basin, the two pop-
ulation groups (upper-mid-HN and lower HN) are
separated not only by geographical distance, in some
cases the saline tidal waters in the Hawkesbury River estu-
ary, but also by anthropogenic barriers. For example, the
upper-mid-HN group contains populations above War-
ragamba and Cordeaux Dams; these are large impound-
ments that likely act as effective barriers to dispersal in
both downstream and upstream directions.
y = 0.0057x + 1.3921R2 = 0.228
11.11.21.31.41.51.61.71.81.9
2
0 5 10 15 20 25
AR
River slope (m/km)
Figure 2 Relationship between genetic diversity (AR) and river slope
(m/km).
Anthropogenic vs. natural in-stream structures in M. australasica Faulks et al.
8 ª 2011 Blackwell Publishing Ltd
Management
Macquaria australasica has experienced widespread popu-
lation declines (Bruce et al., 2008; Davies et al. 2008), and
despite extensive sampling effort, many of the populations
in this study are represented by relatively small sample
sizes. We acknowledge that sample sizes may have con-
tributed to the Hardy–Weinberg disequilibrium observed
in some populations as well as reduced the power of
BayesAss+ to detect recent migration. Nonetheless, simu-
lation studies with BayesAss+ have shown that increasing
sample size has only a moderate effect on the accuracy of
estimates, particularly when the number of loci and
migration rates are low (Wilson and Rannala 2003).
Importantly, the major findings of our study – the influ-
ence of habitat fragmentation (anthropogenic and natural
in-stream structures) on genetic structure and diversity –
are supported by re-sampling procedures designed to
account for variable and small sample sizes. Overall, we
believe that our results have significant biological mean-
ing and can contribute to the conservation management
of this species.
Levels of genetic variation in M. australasica were very
low, both in absolute values and in comparison with the
congeneric M. ambigua (Faulks et al. 2010b). Our analy-
ses also provided strong evidence for population bottle-
necks and inbreeding in M. australasica. The tests
performed are sensitive to the detection of inbreeding
within the past three generations (Piry et al. 1999; Goudet
2002), a period of at least 10 years for M. australasica.
The widespread construction of barriers to movement as
well as declines in population abundances across the spe-
cies range has occurred within this timeframe (Cadwall-
ader and Rogan 1977) and has most likely contributed to
the genetic deterioration of populations. We suggest that
in order to help boost genetic variation, there is a need to
mitigate the effects of habitat fragmentation and barrier
construction (Hughes 2007). The installation of fishways
to assist dispersal of fish over dams and weirs has proven
beneficial for rehabilitating fish communities in Australia
and overseas (Calles and Greenberg 2007; Stuart et al.
2008) and should be considered as an important compo-
nent in the management of M. australasica. Allowing
passage over barriers could provide M. australasica
populations with access to additional spawning habitat
and enhance recruitment success. The rehabilitation of
preferred habitat, e.g. removing sand or sedimentation
from riffles or enhancing environmental flows to scour
sediment loads, could also help increase population sizes.
Other management options being considered in the cur-
rent species recovery planning process include reducing
illegal fishing, reducing disease risk, establishing new
populations, increasing community awareness and
establishing a long-term monitoring programme (I&I
NSW, 2010). In addition, we recommend that the follow-
ing distinct catchment-scale groups be recognized to help
maintain the genetic diversity, the evolutionary resilience
and the evolutionary potential of the species as a whole:
Lachlan, Murrumbidgee, Murray, upper HN and lower
HN. In conclusion, we highlight the value of incorporat-
ing landscape genetics studies into established frameworks
such as the ESU, particularly in cases where conservation
outcomes can be achieved and assessed through adaptive
management strategies.
Acknowledgements
Samples were provided by Industry & Investment NSW,
Arthur Rylah Institute Department of Sustainability and
Environment Victoria, the South Australian Museum and
Peter Unmack. Meaghan Rourke provided advice on
marker selection. Sam Banks provided assistance with the
re-sampling analysis. Funding for this project was pro-
vided by the Australian Research Council (grant LP
0667952 to L. Beheregaray and D. Gilligan) and the New
South Wales Recreational Freshwater Fishing Trust
Expenditure Committee.
References
Allan, J. D., and A. S. Flecker. 1993. Biodiversity conservation
in running waters. BioScience 43:32–43.
Allen, G. R., S. H. Midgley, and M. Allen. 2002. Field guide to
the freshwater fishes of Australia. Western Australian
Museum, Perth, Australia.
Amos, W., and A. Balmford. 2001. When does conservation
genetics matter? Heredity 87:257–265.
Banks, S. C., M. P. Piggott, J. E. Williamson, U. Bove,
N. J. Holbrook, and L. B. Beheregaray. 2007. Oceanic
variability and coastal topography shape genetic structure in
a long-dispersing sea urchin. Ecology 88:3055–3064.
Belfiore, N., and S. L. Anderson. 2001. Effects of contaminants
on genetic patterns in aquatic organisms: a review. Mutation
Research 489:97–122.
Blanchet, S., O. Rey, R. Etienne, S. Lek, and G. Loot. 2010.
Species-specific responses to landscape fragmentation:
implications for management strategies. Evolutionary
Applications 3:291–304.
Boizard, J., P. Magnan, and B. Angers. 2009. Effects of
dynamic landscape elements on fish dispersal: the example
of creek chub (Semotilus atromaculatus). Molecular Ecology
18:430–441.
Boys, C. A., and M. C. Thoms. 2006. A large-scale, hierarchical
approach for assessing habitat associations of fish assem-
blages in large dryland rivers. Hydrobiologia 572:11–31.
Bruce, A., J. Knight, and B. Creese. 2008. Survey of aquatic
threatened species Macquarie perch (Macquaria australasica)
Faulks et al. Anthropogenic vs. natural in-stream structures in M. australasica
ª 2011 Blackwell Publishing Ltd 9
and Adams’ emerald dragonfly (Archaeophya adamsi) within
the Hawkesbury-Nepean catchment. Interim report for the
Hawkesbury-Nepean Catchment Management Authority,
NSW Department of Primary Industries, Port Stephens
Fisheries Centre.
Burnham, K. P., and D. R. Anderson. 2002. Model Selection
and Multimodel Inference: A Practical Information-
Theoretic Approach. Springer-Verlag, New York, USA.
Cadwallader, P. L. 1978. Some causes of the decline in range
and abundance of native fish in the Murray-Darling river
system. Proceedings of the Royal Society of Victoria
90:211–224.
Cadwallader, P. L. 1981. Past and present distributions and
translocations of Macquarie perch Macquaria australasica
(Pisces: Percichthyidae), with particular reference to Victo-
ria. Proceedings of the Royal Society of Victoria 93:23–30.
Cadwallader, P. L., and J. Douglas. 1986. Changing food habits
of Macquarie perch, Macquaria australasica Cuvier (pisces:
percichthyidae), during the initial filling phase of Lake
Dartmouth, Victoria. Australian Journal of Marine and
Freshwater Research 37:647–657.
Cadwallader, P. L., and P. L. Rogan. 1977. The Macquarie
perch, Macquaria australasica (Pisces: Perchichthyidae),
of Lake Eildon, Victoria. Australian Journal of Ecology
2:409–418.
Calles, E. O., and L. A. Greenberg. 2007. The use of two
nature-like fishways by some fish species in the Swedish
River Eman. Ecology of Freshwater Fish 16:183–190.
Cook, B. D., M. J. Kennard, K. Real, B. J. Pusey, and J. M.
Hughes, 2010. Landscape genetic analysis of the tropical
freshwater fish Mogurnda mogurnda (Eleotridae) in a
monsoonal river basin: importance of hydrographic factors
and population history. Freshwater Biology, Doi: 10.1111/
j.1365-2427.2010.02527.x.
Crandall, K. A., O. R. P. Bininda-Emonds, G. M. Mace, and
R. K. Wayne. 2000. Considering evolutionary processes in
conservation biology. Trends in Ecology and Evolution
15:290–295.
Davies, P., J. Harris, T. Tillman, and K. Walker. 2008. SRA
Report 1: A Report on the Ecological Health of Rivers in the
Murray-Darling Basin, 2004–2007. Murray-Darling Basin
Commission, Canberra, Australia.
Dehais, C., R. Eudeline, P. Berrebi, and C. Argiller. 2010.
Microgeographic genetic isolation in chub (Cyprinidae:
Squalius cephalus) population of the Durance River:
estimating fragmentation by dams. Ecology of Freshwater
Fish 19:267–278.
DiBattista, J. D. 2008. Patterns of genetic variation in anthro-
pogenically impacted populations. Conservation Genetics
9:141–156.
Dionne, M., F. Caron, J. J. Dodson, and L. Bernatchez. 2008.
Landscape genetics and hierarchical genetic structure in
Atlantic salmon: the interaction of gene flow and local
adaptation. Molecular Ecology 17:2382–2396.
Dudgeon, D., A. H. Arthington, M. O. Gessner, Z. I. Kawabata,
D. J. Knowler, C. Leveque, R. J. Naiman et al. 2006. Freshwa-
ter biodiversity: importance, threats, status and conservation
challenges. Biological Review 81:163–182.
Dufty, S. 1986. Genetic and morphological divergence between
populations of Macquarie perch (Macquaria australasica)
east and west of the Great Dividing Range. Honours Thesis,
University of New South Wales.
Ewers, R. M., and R. K. Didham. 2006. Confounding factors in
the detection of species responses to habitat fragmentation.
Biological Review 81:117–142.
Excoffier, L., G. Laval, and S. Schneider. 2006. Arlequin ver 3.1
An integrated software package for population genetics data
analysis. Computational and Molecular Population Genetic
Lab, University of Bern, Bern, Switzerland.
Faulks, L. K., D. M. Gilligan, and L. B. Beheregaray. 2010a.
Evolution and maintenance of divergent lineages in an
endangered freshwater fish, Macquaria australasica. Conser-
vation Genetics 11:921–934.
Faulks, L. K., D. M. Gilligan, and L. B. Beheregaray 2010b.
Islands of water in a sea of dry land: hydrological regime
predicts genetic diversity and dispersal in a widespread fish
from Australia’s arid zone, the golden perch (Macquaria
ambigua). Molecular Ecology 19:4723–4737.
Fausch, K. D., C. E. Torgersen, C. V. Baxter, and H. W. Li.
2002. Landscapes to riverscapes: bridging the gap between
research and conservation of stream fishes. BioScience
52:483–498.
Frankham, R. 1995. Conservation genetics. Annual Review of
Genetics 29:305–327.
Gaggiotti, O. E., O. Lange, K. Rassman, and C. Gliddon. 1999.
A comparison of two indirect methods for estimating
average levels of gene flow using microsatellite data.
Molecular Ecology 8:1513–1520.
Garza, J. C., and E. G. Williamson. 2001. Detection of
reduction in population size using data from microsatellite
loci. Molecular Ecology 10:305–318.
Gehrke, P. C., D. M. Gilligan, and M. Barwick. 2002. Changes
in fish communities of the Shoalhaven River 20 years after
construct of Tallowa Dam, Australia. River Research and
Applications 18:265–286.
Gilligan, D., T. McGarry, and S. Carter, 2010. A scientific
approach to developing habitat rehabilitation strategies in
aquatic environments: a case study on the endangered
Macquarie perch (Macquaria australasica) in the Lachlan
catchment. Fisheries Final Report Series, Industry &
Investment NSW, Cronulla.
Goudet, J. 2002. FSTAT (version 2.9.3.2). Institute of Ecology,
UNIL, Lausanne, Switzerland.
Growns, I., I. Reinfelds, S. Williams, and G. Coade. 2009.
Longitudinal effects of a water supply reservoir (Tallowa
Dam) on downstream water quality, substrate and riffle
macroinvertebrate assemblages in the Shoalhaven River,
Australia. Marine and Freshwater Research 60:594–606.
Anthropogenic vs. natural in-stream structures in M. australasica Faulks et al.
10 ª 2011 Blackwell Publishing Ltd
Guillot, G., F. Mortier, and A. Estoup. 2005. GENELAND: a
computer package for landscape genetics. Molecular
Ecology Notes 5:712–715.
Holderegger, R., and H. H. Wagner. 2008. Landscape genetics.
BioScience 58:199–207.
Hughes, J. M. 2007. Constraints on recovery: using molecular
methods to study connectivity of aquatic biota in rivers
and streams. Freshwater Biology 52:616–631.
Industry and Investment New South Wales. 2008. Inventory
and assessment of fish passage barriers in NSW. I&I NSW,
Cronulla.
Industry and Investment New South Wales, 2010. Macquarie
Perch (Macquaria australasica) DRAFT National Recovery
Plan. I&I NSW, Orange, Australia.
Jowett, I. G. 1993. A method for objectively identifying pool,
run, and riffle habitats from physical measurements. New Zea-
land Journal of Marine and Freshwater Research 27:241–248.
Kingsford, R. T., J. E. M. Watson, C. J. Lundquist, O. Venter,
L. Hughes, E. L. Johnston, J. Atherton et al. 2009. Major
conservation policy issues for biodiversity in Oceania.
Conservation Biology 23:834–840.
Latch, E. K., D. G. Scognamillo, J. A. Fike, M. J. Chamberlain,
and O. E. Rhodes Jr. 2008. Deciphering ecological barriers
to North American River Otter (Lontra canadensis) gene
flow in the Louisiana landscape. Journal of Heredity 99:265–
274.
Lintermans, M. 2007. Fishes of the Murray-Darling Basin an
Introductory Guide. Murray Darling Basin Commission,
Canberra.
Lowe, W. H., and F. W. Allendorf. 2010. What can genetics
tell us about population connectivity? Molecular Ecology
19:3038–3051.
Magalhaes, M. F., D. C. Batalha, and M. J. Collares-Pereira.
2002. Gradients in stream fish assemblages across a Mediter-
ranean landscape: contributions of environmental factors
and spatial structure. Freshwater Biology 47:1015–1031.
Maitland, P. S. 1995. The conservation of freshwater fish: past
and present experience. Biological Conservation 72:259–270.
Manel, S., M. K. Schwartz, G. Luikart, and P. Taberlet. 2003.
Landscape genetics: combining landscape ecology and
population genetics. Trends in Ecology and Evolution
18:189–197.
McCairns, R. J. S., and L. Bernatchez. 2008. Landscape genetic
analyses reveal cryptic population structure and putative
selection gradients in a large-scale estuarine environment.
Molecular Ecology 17:3901–3916.
McCarney, W. T., G. Goldsmith, D. K. Jacobs, and A. P.
Kinziger. 2010. Rampant drift in artificially fragmented
populations of the endangered tidewater goby (Eucyclogobius
newberryi). Molecular Ecology 19:3315–3327.
McDowall, R. 1996. Freshwater fishes of south eastern Austra-
lia. Reed Books, Sydney.
Narum, S. R. 2006. Beyond Bonferroni: less conservative analy-
ses for conservation genetics. Conservation Genetics 7:783–
787.
Nei, M., T. Maruyama, and R. Chakraborty. 1975. The bottle-
neck effect and genetic variability in populations. Evolution
29:1–10.
van Oosterhout, C., W. F. Hutchinson, D. P. M. Wills, and
P. Shipley. 2004. MICRO-CHECKER: software for identify-
ing and correcting genotyping errors in microsatellite data.
Molecular Ecology Notes 4:535–538.
Petts, G. E. 1984. Impounded Rivers: Perspectives for
Ecological Management. John Wiley & Sons, Chichester.
Piry, S., G. Luikart, and J.-M. Cornuet. 1999. Bottleneck: a
computer program for detecting recent reduction in the
effective population size using allele frequency data. Journal
of Heredity 90:502–503.
Pritchard, J. K., M. Stephens, and P. Donnelly. 2000. Inference
of population structure using multilocus genotype data.
Genetics 155:945–959.
Raeymakers, J. A. M., G. E. Maes, S. Geldof, I. Hontis,
K. Nackaerts, and F. A. M. Volckaert. 2008. Modeling
genetic connectivity in sticklebacks as a guideline for river
restoration. Evolutionary Applications 1:475–488.
Raymond, M., and F. Rousset. 1995. Population genetics
software for exact tests and ecumenicism. Journal of
Heredity 86:248–249.
Rice, W. R. 1989. Analyzing tables of statistical tests. Evolution
43:223–225.
Rourke, M., J. Nheu, H. Mountford, J. Lade, B. Ingram, and
H. McPartlan. 2007. Isolation and characterization of 102
new microsatellite loci in Murray cod, Maccullochella peelii
peelii (Percichthyidae), and assessment of cross-amplification
in 13 Australian native and six introduced freshwater
species. Molecular Ecology Notes 7:1258–1264.
Schuelke, M. 2000. An economic method for the fluorescent
labelling of PCR fragments. Nature 18:233–234.
Schwartz, T. S., F. Jenkins, and L. B. Beheregaray. 2005. Micro-
satellite DNA markers developed for the Australian bass
(Macquaria novemaculeata) and their cross amplification in
estuary perch (M. colonorum). Molecular Ecology Notes
5:519–520.
Sgro, C. M., A. J. Lowe, and A. A. Hoffmann, 2010. Building
evolutionary resilience for conserving biodiversity under
climate change. Evolutionary Applications (in press).
Spielman, D., B. B. Brook, and R. Frankham. 2004. Most
species are not driven to extinction before genetic factors
impact them. Proceedings of the National Academy of
Sciences 101:15261–15264.
Storfer, A., M. A. Murphy, J. S. Evans, C. S. Goldberg,
S. Robinson, S. F. Spear, R. Dezzani et al. 2007. Putting the
‘landscape’ in landscape genetics. Heredity 98:128–142.
Stuart, I. G., B. P. Zampatti, and L. J. Baumgartner. 2008. Can
a low-gradient vertical-slot fishway provide passage for a
lowland river fish community? Marine and Freshwater
Research 59:332–346.
Sunnucks, P., and D. Hales. 1996. Numerous transposed
sequences of mitochondrial cytochrome oxidase I-II in
Faulks et al. Anthropogenic vs. natural in-stream structures in M. australasica
ª 2011 Blackwell Publishing Ltd 11

aphids of the genus Sitobion (Hemiptera, Aphididae). Mole-
cular Biology and Evolution 13:510–524.
Thompson, C. J., J. Croke, R. Ogden, and P. Wallbrink.
2006. A morpho-statistical classification of mountain
stream reach types in southeastern Australia. Geomorphol-
ogy 81:43–65.
Walsh, C., and R. MacNally. 2008. The hier.part Package.
http://www.r-project.org/ (accessed on 1 March 2009).
Watanabe, K., M. T. Monaghan, Y. Takemon, and T. Omura.
2010. Dispersal ability determines the genetic effects of
habitat fragmentation in three species of aquatic insect.
Aquatic Conservation: Marine and Freshwater Ecosystems
20:574–579.
Weir, B. S., and C. C. Cockerham. 1984. Estimating F-statistics
for the analysis of population structure. Evolution 38:1358–
1370.
Wharton, J. C. F. 1968. Spawning areas of Macquarie perch
Macquaria australasica above the Eildon Lake (Victoria).
Australian Society of Limnology Newsletter 6:11–13.
Wilson, G. A., and B. Rannala. 2003. Bayesian inference of
recent migration rates using multilocus genotypes. Genetics
163:1177–1191.
Wofford, J. E. B., R. E. Gresswell, and M. A. Banks. 2005.
Influence of barriers to movement on within-watershed
genetic variation of coastal cutthroat trout. Ecological
Applications 15:628–637.
Anthropogenic vs. natural in-stream structures in M. australasica Faulks et al.
12 ª 2011 Blackwell Publishing Ltd

Ap
pen
dix
1
Pai
rwis
eF
ST
valu
eso
fM
acqu
aria
aust
rala
sica
bas
edo
nei
ght
po
lym
orp
hic
mic
rosa
tell
ite
loci
.Si
gnifi
can
tF
ST
valu
esar
ein
dic
ated
inb
old
(P<
0.00
19).
AB
,A
ber
-
cro
mb
ieR
;B
UF
,B
uff
alo
R;
DD
,D
artm
ou
thD
am;
BR
,B
roke
nR
;C
O,
Co
tter
Dam
;H
U,
Hu
ghes
Ck;
KP
C,
Kin
gP
arro
tC
k;L
N,
Lac
hla
nR
;M
B,
Mu
rru
mb
idge
e
R;
YR
,Y
arra
R;
CD
,C
atar
act
Dam
;L
D,
Lo
dd
on
Ck;
MO
N,
Mo
nga
rlo
we
R;
BO
C,
Bo
wen
sC
k;C
OR
,C
ord
eau
xD
am;
CR
,C
atar
act
R;
CX
,C
oxs
R;
EC
,E
rski
ne
Ck;
GB
,G
len
bro
ok
Ck;
KD
,K
edu
mb
aR
;K
W,
Ko
wm
un
gR
;L
T,
Lit
tle
R;
WB
,W
ebb
’sC
k;W
C,
Wh
een
yC
k;W
L,
Wo
llem
iC
k;W
OC
,W
on
gaw
illi
Ck.
AB
BU
FFD
DBR
CO
HU
KPC
LNM
BY
RC
DLD
MO
NBO
CC
OR
CR
CX
ECG
BK
DK
WLT
WB
WC
WL
WO
C
AB
0.0
0
BU
FF0.1
40.0
0
DD
0.1
50.0
10.0
0
BR
0.1
10.0
80.0
70.0
0
CO
0.2
80.4
90.3
80.4
40.0
0
HU
0.1
60.1
20.0
80.1
20.3
50.0
0
KPC
0.0
90.1
60.1
80.1
30.3
70.1
30.0
0
LN0.0
60.0
50.0
70.0
90.3
50.1
20.1
20.0
0
MB
0.1
90.2
90.2
50.3
00.3
00.2
20.2
10.2
60.0
0
YR
0.0
90.1
60.1
10.1
50.3
30.1
40.1
50.1
30.2
20.0
0
CD
0.1
20.1
80.1
30.1
50.3
40.1
60.0
90.1
20.2
20.1
50.0
0
LD0.2
40.3
10.2
30.3
20.3
70.2
70.2
40.1
40.3
20.3
10.1
60.0
0
MO
N0.1
90.2
20.2
20.2
50.3
60.1
90.1
20.2
10.0
20.1
60.1
60.2
90.0
0
BO
C0.4
40.5
80.4
70.5
30.6
10.4
70.5
20.4
20.5
30.4
60.5
30.5
30.5
50.0
0
CO
R0.4
30.5
40.4
40.5
00.5
80.4
40.4
90.4
00.5
20.4
40.5
00.5
00.5
30.2
80.0
0
CR
0.1
60.1
40.1
00.1
70.2
80.1
50.1
50.0
90.1
80.1
40.0
90.1
30.1
70.3
50.3
30.0
0
CX
0.3
40.4
50.3
70.4
00.4
80.3
80.4
00.3
30.4
40.3
40.4
00.4
40.4
40.3
20.2
70.2
30.0
0
EC0.3
80.4
80.4
00.4
00.5
10.4
00.4
30.3
70.5
00.3
20.4
10.4
80.4
70.4
30.4
30.2
80.1
50.0
0
GB
0.4
70.6
00.5
50.5
50.6
20.5
30.5
50.4
80.6
00.4
90.5
50.5
80.5
90.5
10.5
70.3
90.3
20.1
70.0
0
KD
0.3
60.3
90.3
50.3
40.4
60.3
60.3
70.3
20.4
30.3
40.3
80.4
10.4
10.2
90.2
50.2
60.0
50.1
70.2
90.0
0
KW
0.3
30.3
70.3
20.3
30.4
00.3
30.3
40.3
00.3
60.3
00.3
50.3
80.3
70.2
70.2
30.2
20.0
00.1
40.2
70.0
30.0
0
LT0.3
50.5
20.4
40.4
10.5
60.4
40.4
20.3
50.5
20.4
00.4
60.4
70.4
90.4
40.4
00.2
60.1
60.2
50.4
10.0
90.1
00.0
0
WB
0.5
00.6
70.6
00.6
00.7
10.5
90.5
90.5
00.6
60.5
60.6
20.6
20.6
50.4
60.5
20.4
40.4
00.4
40.5
50.3
40.3
20.4
20.0
0
WC
0.4
40.5
30.4
80.5
10.6
10.5
00.5
10.4
20.5
50.4
80.5
30.5
10.5
40.5
40.5
40.3
70.4
60.5
10.5
80.4
20.3
80.5
20.6
40.0
0
WL
0.4
60.5
70.5
30.5
20.6
10.5
10.5
20.4
60.5
70.4
90.5
50.5
50.5
70.4
50.5
40.4
00.3
90.3
40.3
40.3
50.3
50.3
60.4
60.5
50.0
0
WO
C0.4
80.6
50.5
30.6
00.6
50.5
10.5
70.4
50.6
00.5
30.5
90.5
40.6
30.5
50.3
40.4
00.3
70.5
20.6
40.3
60.3
00.4
90.6
80.6
30.6
00.0
0
Faulks et al. Anthropogenic vs. natural in-stream structures in M. australasica
ª 2011 Blackwell Publishing Ltd 13

Appendix 2
Matrix of the Pearson’s correlation coefficients for environmental vari-
ables used in the modelling procedure. Upper line = correlation coeffi-
cient, lower line = P value. Significant correlations are indicated by
italics. rs = river slope (m/km).
km Barriers rs Latitude Landuse
Barriers 0.496
0.026
rs 0.121 0.288
0.611 0.218
Latitude )0.129 0.052 0.483
0.588 0.829 0.031
Land use 0.191 0.169 )0.211 )0.084
0.419 0.476 0.372 0.725
Elevation 0.466 0.571 )0.193 )0.649 0.063
0.038 0.009 0.415 0.002 0.793
Appendix 3
Results of simple and partial Mantel tests to determine the relation-
ship between riverine distances, number of anthropogenic barriers
and genetic differentiation (FST) in coastal populations of Macquaria
australasica.
Variable P value Coefficient R2
Riverine km 0.0005 0.429 0.184
Barriers 0.0005 0.492 0.243
Barriers (km controlled) 0.0245 0.429 0.250
km (barriers controlled) 0.0005 0.257 0.250
Anthropogenic vs. natural in-stream structures in M. australasica Faulks et al.
14 ª 2011 Blackwell Publishing Ltd
Related Documents


![Kawerua lichens - a revision. Kawerua lichens.pdfXanthoparmelia australasica [a "Parmelias isidiigera] 2r,3r Xanthoparmelia scabrosa 9rstm Xanthoparmelia thamnoides 9rstm Physciaceae](https://static.cupdf.com/doc/110x72/6044b2cd954edc383e3e07bd/kawerua-lichens-a-kawerua-lichenspdf-xanthoparmelia-australasica-a-parmelias.jpg)

