The Role of Affect in Commercializing New Ideas by Gordon Kwesi Adomdza A thesis presented to the University of Waterloo in fulfillment of the thesis requirement for the degree of Doctor of Philosophy in Management Sciences Waterloo, Ontario, Canada, 2008 ©Gordon Kwesi Adomdza 2008

Welcome message from author
This document is posted to help you gain knowledge. Please leave a comment to let me know what you think about it! Share it to your friends and learn new things together.
Transcript

The Role of Affect in Commercializing New Ideas
by
Gordon Kwesi Adomdza
A thesis presented to the University of Waterloo
in fulfillment of the thesis requirement for the degree of
Doctor of Philosophy in
Management Sciences
Waterloo, Ontario, Canada, 2008 ©Gordon Kwesi Adomdza 2008

ii
Author’s Declaration
I hereby declare that I am the sole author of this thesis. This is a true copy of the thesis, including any required final revisions, as accepted by my examiners.
I understand that my thesis may be made electronically available to the public.

iii
Abstract
Psychological attachment to an entrepreneurial opportunity may motivate the
entrepreneur to persevere but can also bias decisions made in the entrepreneurial process,
especially on market entry. This thesis investigates how psychological attachment to an
entrepreneur’s idea influences decision making at the commercialization stage with special
emphasis on control tendencies. Data collected from 106 fourth-year students from the
Engineering Design Program at a top engineering-focused Canadian university revealed some
interesting results. In the model estimated, the higher the subject’s psychological attachment to
the opportunity, the more control oriented the subject was. Interestingly, psychological
attachment is a strong predictor of control tendency even when subjects’ perceptions of projected
returns (value) are statistically controlled in the analysis. Furthermore, psychological attachment
correlates with proxy measures of the level of cognitive evaluation: the indication, affective
constructs like psychological attachment elicit affect-laden evaluation of outcomes in a way that
is divergent from the cognitive evaluation of commercialization situations.
Within a framework of financial decision making, even as subjects generally
acknowledged outside investor expertise in a potential commercialization partnership, the main
finding was that high levels of attachment are more likely to lead to control-oriented funding
preferences over optimal financing preferences. Further, alternative research explanations for
control tendency failed to hold, as individual personality-type factors were not significant in
explaining the variability in control tendency. Therefore, control tendency may be dependent on
attachment to the creative process as opposed to an individual’s personality construct. The results
provide insight into the role that affective constructs like psychological attachment and control
tendency may play in important decision making in the entrepreneurship process.

iv
Acknowledgements
First and foremost, I thank the Almighty God for making this possible. I also want to thank my
supervisors, Dr. Tom Astebro and Dr. Scott Jeffrey, and the other members of my dissertation
committee for their valuable insight and advice. I am especially indebted to Dr. Astebro for
supporting me academically and financially, as well as constantly challenging me to excel.
I am particularly grateful to my beautiful wife Ailsa for her patience and endurance. I also want
to extend my appreciation to my office mate, Won No, for his support throughout this period.
Finally, I am thankful for all the constructive comments I received from various people
throughout the dissertation period, which helped make this dissertation what it is today.

v
Dedication
To Ailsa and Lydia

vi
Table of Contents Item Page Chapter 1 ......................................................................................................................................... 1
1.1 Introduction and Review of the Literature 1
1.1.1. Outside Party’s Concerns and Reactions 2
1.1.2. Developers’ Concerns and Reactions 4
1.1.3. Why Some Developers will be More Concerned than Others 6
1.1.4. Evidence of Developer Reactions to Concerns 8
1.1.5. Explaining the Empirical Evidence: The Affective Characteristics of PA and CT 10
1.1.6. Characteristics of Affect and Implications for Performance 11
1.1.7. The Objectives of this Study 12
1.1.8. Contributions 13
1.1.9. Other Areas of Research Application 14
Chapter 2 ................................................................................................................................... …16 2.1 Literature Review ........................................................................................................... 16 2.1.1 Decision Making in Entrepreneurship 16
2.1.2. Empirical and Anecdotal Evidence of Psychological Attachment and Control in
Entrepreneurship 26
2.1.3. Why Control from Attachment Can Be Detrimental To Venture Performance 35
Chapter 3 ....................................................................................................................................... 39 3.1 Theory and Predictions ................................................................................................... 39 3.1.1 Psychological Attachment (PA) 39
3.1.2 Entrepreneurial Process-Generated Affect (Opportunity Recognition and
Development) 49
3.1.3 Psychological Attachment vs. Cognitive Evaluation 59
3.1.4. Control Tendency and Psychological Attachment 65
3.1.5. Moderated Relationship between Psychological Attachment and Control 77
Chapter 4 ....................................................................................................................................... 82 4.1 Methodology and Analysis............................................................................................ 82 4.1.1. Domain of Study 82
4.1.2. Preliminary Work 82
4.1.3. Participant Population 93
4.1.4. Descriptive Analysis: Participant Population 96

vii
Item Page
4.1.4. Measures and Analysis: The Dimensions of Psychological Attachment 98
4.1.5. Measures and Analysis: Psychological Attachment and Cognitive Evaluation 111
4.1.6. Measures and Analysis: Psychological Attachment and Control Tendency 119
4.1.6. Measures and Analysis: Testing the Moderating Effect of Threats on the Relationship
between Psychological Attachment and Control Tendency 135
Chapter 5 ..................................................................................................................................... 152 5.1 Control Tendency in Financing Decisions ........................................................................ 152 5.1.1 Types of Financing ................................................................................................... 152 5.1.2 Literature Review: External Financing ..................................................................... 153 5.1.3 Predictions ................................................................................................................ 156 5.1.4 Measures and Analysis ............................................................................................. 157
Chapter 6 ..................................................................................................................................... 171 6.1 Discussion ......................................................................................................................... 171 6.2 Conclusion ........................................................................................................................ 175 6.3 Limitations ........................................................................................................................ 178 6.4 Contributions and Opportunities for Future Research ...................................................... 179
References ................................................................................................................................... 184 Appendices .................................................................................................................................. 197
Appendix 1: The Scale Development Process ....................................................................... 197 Appendix 2: Codebooks ......................................................................................................... 198 A. Pre-test of Questionnaire 198
B. Final Study: Part I 213
C. Final Study: Part 2 – Treatment Group 221
D. Final Study: Part 2 - Control Group 235
Appendix 3: Sample Interview Transcripts from Interviews With Subjects ......................... 248 Appendix 4: Information on Design Projects ........................................................................ 252 Appendix 5 : Additional Statistical Results ............................................................................ 255

viii
List of Tables Item page Table 1: Descriptive Statistics of Industries Categorization for Projects………...…………….…….….. 96 Table 2: Descriptive Statistics of Sources of Commercialization Knowledge…………… ….…….….. ..98 Table 3: Results for Principal Component Analysis on Affective Latent Items for PA……..…………..103 Table 4: Correlations between PA Measures…………………………………………….………………108 Table 5: Correlations between PA and Latent Items……………………...……......................................109 Table 6: Descriptive Statistic for Severity and Likelihood of Commercialization Outcomes …...…...…114 Table 7: Descriptive Statistics for Control Tendency Measure………………………………….............120 Table 8: Descriptive Statistics for Personality-Type Variables……………………………..…….…..…124 Table 9: Hierarchical Regression Analysis of CT on Predictors ………………………...….……..….129 Table 10: Hierarchical Regression Analysis of CT on Predictors…………………………………...…..134 Table 11: Descriptive Statistics for Affect-Type in Manipulation Check…… …………………………139 Table 12: Descriptive Statistics for Fear in Manipulation Check …………………………..…….……..140 Table 13: Descriptive Statistics for Mood Changes Before and After the Manipulation ……….…...….141 Table 14: ANOVA Tests For Differences in Mood Before and After the Manipulation …………...…..142 Table 15: Results For Paired Differences In Mood for Experimental Groups Before and After The Manipulation…………………………………………………………………………...…………….......143 Table 16: Descriptive Statistics of Mood Changes Before and After the Study…………………………144 Table 17: Frequency Distribution for Mood Changes within the Treatment and Control Groups………144 Table 18: Frequency Distribution for Mood Changes Within the Treatment Group………………….....145 Table 19: Descriptive Statistics of Subject’s Specific Feelings After the Study...……………….......….146 Table 20: Hierarchical Regression Analysis for Testing Moderation of PA on CT ………………….....149 Table 21: Percentage Takes In Venture Capital and Angel Investor Financing Decision Contexts……..158 Table 22: Venture Capital and Angel Investor Offers and Developers Takes …………………….....….159 Table 23: Percentages of Subjects Choosing VC and Angel Offers….…………………………..….…..162 Table 24: Descriptive Statistics for Importance of Outside Financier Management Ability..…………...169

ix
List of Figures
Item page
Figure 1: Decision-Making: Dual, Cognitive and Affective Processes…………….……..….…………..21 Figure 2: Developing PA ………………………………………………………….……………………..40 Figure 3: Dimensions to PA..……………………….…………………………………..………...............49 Figure 4: Psychological Attachment Vs. Cognitive Evaluation of The Microeconomic Environment.….59 Figure 5: Differing Approaches To Perception Due To Divergence between Cognitive and Affective Evaluation of the Microeconomic Environment………………………………………………...………...63 Figure 6: The Effect of PA on Control Tendency ………………………………………….……....……..76 Figure 7: The Moderating Effect of Threat Perception on the Relationship between PA and CT…….….78 Figure 8: Relationship between PA, Objective and Subjective Evaluation of the Idea and Future Commercialization Environment……………………………………………..………………………….118 Figure 9: Interaction Between PA and Likelihood Of Loss (LL)……………………………………… 151 Figure 10: Percentages of Subjects Choosing VC and Angel Offers Within High and Low PA Groups…………………………………………………………………………………………………....164 Figure 11: Percentages of Subjects in High and Low PA Groups Choosing VC and Angel Offers within Rounds …………………………………………………………………………………………….….....166 Figure 12: Comparison of Subjects Share Preferences in the High and Low PA Groups With the Optimal Choice…………………………………………………………………………………….……………...167

1
Chapter 1
1.1 Introduction and Review of the Literature
Commercialization of a new technology often involves relinquishing control of the
technology to outside parties. In this thesis, an outside party is defined generally as an entity that
provides resources (financial, production, logistic, etc.) towards the commercialization process.
Relinquishing more control to an outside party, hereafter referred to as an “outsider”, implies
choosing a strategy that reduces the technology developer’s involvement in decision making and
increases the outsider’s involvement. Relinquishing less control implies choosing a strategy that
increases the developer’s involvement and reduces the outsider’s involvement in the
commercialization process. Based on their own interests, developers of technology and outsiders
haggle over control at the point of commercialization. While the developer seeks to protect the
technology from expropriation, the outsider seeks to protect her/his investment in the process.
Therefore, each party’s perception of the other’s intentions, and uncertainty surrounding future
behaviour, may play a role in how much control each party desires. This thesis attempts to
investigate the issue of control from the developer’s point of view and discusses the dimensions,
factors, mechanism of effects, and behavioural implications of the desire to control at the point
of commercialization. More importantly, the thesis centres on the role of psychological
attachment to one’s idea in shaping the desire to control. To proceed, the following identifies the
background to the notion of control and the role of psychological attachment.
The background concerns market problems or issues with transactions at the point of
commercialization; developer and outsider actions and reactions in anticipation to market
problems; and reasons for such behaviour. To begin, I present the outsider’s concerns about

2
market problems and strategies they adopt to solve these problems. Next, I argue that the
outsider’s demands and strategies are logical given the uncertainty and unpredictability
surrounding new technological ideas. However, given that developers often need outsider
investment for successful commercialization, avoiding outsiders will lead to non-optimal
commercialization decisions. Also, I introduce the notion and subsequent explanations as to why
developers might choose to avoid outsider investment even if such investment is instrumental to
success. Finally, I conclude this chapter by identifying some “real world” situations in which this
research could be applied.
1.1.1. Outside Party’s Concerns and Reactions
Transactions at the point of commercialization involve costs, especially under conditions
of risk and uncertainty. Williamson (1985) adopted the concept of transaction costs to describe
the costs of interactions in an imperfect market situation where complete information is not
available to all parties. Under such conditions of incomplete and asymmetric information, market
problems of concern abound. Information asymmetry refers to the situation where the developer
is believed to know more than the outsider (Jensen and Thursby, 2001). One such problem
arising from information asymmetry is the “agency/principal-agent problem” to which outsiders
react by wanting to control the technology when contracting with the developer. For instance,
investors typically prefer to have control over a technology if they invest their funds (see
evidence in venture capital literature Hart and Holmström, 1987, Hart, 1995, and Kaplan and
Stromberg, 2003). Before elaborating on why outsiders want control when considering the
agency problem, I will first provide a brief description of the principal-agent concept.
The agency problem occurs when the economic incentives of the outsider (principal) and
developer (agent) are not costlessly aligned (Pratt and Zeckhauser, 1985). The principal-agent

3
theory, as it pertains to entrepreneurship, can be described as follows. The principal (an investor)
provides resources to an agent (entrepreneur) to innovate on the principal’s behalf. However, the
principal cannot ensure that the agent uses the resources efficiently according to the agreement
signed because of the high monitory costs and differences in economic incentives between the
two. With that said, there are core reasons for the principal-agent problem. 1. The divergence of
desires or goals of the principal and agent and the difficulty or cost the principal must incur to
verify the agent’s appropriate behaviour. 2. The problem of the principal and the agent preferring
different actions for risk sharing when they have different risk preferences (Eisenhardt, 1989).
Consequently, in anticipation of the principal-agent (agency) problem, the outsider desires to
control the technology in attempt to seek alignment between his or her economic incentives and
the economic incentives of the developer. The long-term aim is to reduce agency costs (Jensen
and Meckling, 1976) or loss in the relationship.
The outsider’s conviction in the need for control stems from the underlying belief that the
developer knows more about the technology (information asymmetry). This belief is
strengthened when considering the fact that the development of a new technology involves the
investment of developer knowledge and skills and, therefore, information asymmetry between
the developer and the outsider may be high. Thus, control is needed to reduce any information
asymmetry. Such control is seen in the two main approaches to reducing information asymmetry
and combating agency problems. The approaches are as follows: design an optimal contract
(Jensen and Meckling, 1976) through pre-contract screening, due diligence and contract writing;
use the incomplete contracts approach which concentrates on the post-contract allocation of
control (Hart, 1995). Alternatively, the outsider (principal) can extend a simple control structure
to include complex incentive contracting techniques that motivate the developer (agent) to take
4
actions preferable to the principal. Such complex techniques may include ex post punishments
and rewards to align incentives. The incomplete approach may be common in the
commercialization of new technologies due to the uncertainty and unpredictability associated
with the future of the technologies involved. Under such circumstances, it’s not possible to
specify the legal consequences of every possible state of the world; hence the contract is
“incomplete” (Hart, 1995).
Consequently, considering the above-mentioned agency problems in contracting within
risky and uncertain domains, such as in technology development, it is logical to expect outsiders
who invest resources to require control for the purposes of safeguarding their investment.
However, relinquishing control to outsiders may not be an easy task for developers, especially
those who are heavily and psychologically invested in the technology or the development
process. For developers wielding maximum control until the point of commercialization, the
experience of relinquishing control at that point may feel like losing “their baby” (I will return to
this point shortly). In the next section, I discuss the market problems from the developer’s
perspective and identify factors that make developers more worried about “loosing their baby”.
This discussion is important since, in the agency theory domain, the culprit is the “agent” and the
main objective is to get the agent to “behave” in the interest of the principal, with little
consideration for how the agent might act in anticipation of the principal’s strategies. My interest
is in the notion that possible reactions might include the developer “selecting out” of essential
outsider agreements needed for successful commercialization.
1.1.2. Developers’ Concerns and Reactions
Developers may be more concerned about market problems at the point of
commercialization because commercialization entails exposure of the technology to the target

5
market, opportunistic outsiders and potential competitors. Typical problems of concern derive
from the issues of appropriability, expropriation and opportunism (Williamson, 1985); paradox
of disclosure (Arrow, 1962, 1963; Anton and Yao, 1994); information asymmetry (Jensen and
Thursby, 2001); and disproportionate power of channel members (e.g., manufacturers and
distributors), among others. The following are brief explanations of the non-self-explanatory
concepts in the list. The explanations are constructed to suit the entrepreneurship domain from
multiple sources and dictionary definitions and, thus, references are not necessarily cited.
Appropriability is the ability to extract rents from the technology and is characterized by formal
intellectual property rights such as patents, or informal mechanisms such as secrecy.
Expropriation is the ability to extract rents from the technology belonging to another party in
exchange for little or no compensation without regard to the original owner’s wishes.
Opportunism is the propensity for people to act in self interest, “with guile” (Williamson, 1985),
not be entirely honest and truthful about their intentions, or attempt to take advantage of
unforeseen circumstances that gives them the chance to exploit another party. The paradox of
disclosure occurs when the entrepreneur risks disclosing information about the opportunity
before a binding contract is signed. Since appropriability is more central to the goal of achieving
returns to the technology, the following discussion of developer response to these market
problems employs “appropriability” for illustrations.
How do developers respond to these concerns? The extent to which the above-mentioned
developer concerns can materialize depends on the level of control that a developer grants to the
outsider. If the perception is that the concerns are high, rampant or persistent, developers will
likely desist from sharing control. There is empirical evidence suggesting that founders avoid
sharing control with outsiders when outsider control threatens ownership, even if the potential

6
for an increase in performance is evident (Cressy and Olofsson, 1997; Winborg and Landström,
2001; Müller, 2007) – discussed later. Thus, a strong desire to appropriate returns from the
technology demands more control than less. According to the viewpoint of the developer, the
agency problem reinforces this position. The developer’s perception that the principal’s
economic goals are likely to diverge from his or her perception is likely to increase weariness
toward potential contracts due to the prevalence of concerns for appropriability. This weariness
motivates a desire in the developer to control the technology. In effect, on perceiving the market
problems, the developer seeks control to safeguard appropriability since the extent of
appropriability determines the level of returns from the technology.
However, the main question of interest here is “why would some developers who
perceive market problems, want control and desire to safeguard appropriability more than
others?” I propose that the level of psychological investment in the technology or in the
technology’s development process impacts the developer’s level of sensitivity towards the
microeconomic environment and, therefore, the issue of appropriability. The following provides
support for this argument.
1.1.3. Why Some Developers will be More Concerned than Others
I argue that affective experiences during technology development can culminate in a
possessive sensation (I call this “psychological attachment” [PA]) which goes on to bias decision
making through an excessive want of control (Control Tendency [CT]) as a reaction to the
perceptions of market problems in the microeconomic environment. PA is characterized as an
affectional tie that a developer feels towards the technology. I define CT as the willingness to
intentionally produce desired outcomes and prevent undesired outcomes (Skinner, Chapman, and
Baltes, 1988). I concentrate on the affective components of these two constructs in studying

7
possible influences on making decisions (reasons provided later in this chapter). The following
argues for PA as an affective construct operating in the technology development process.
An important belief in this study is that attachment will emanate from the affective
experiences in a typical technology development process. Until recently, the role of “affect” in
entrepreneurship has not been considered. Developing a pioneering framework for studying
affect in entrepreneurship, Baron (2008) identifies various areas of the entrepreneurial process
where affect can play a role. The author characterizes affect as emotions and feelings, and notes
that affect is likely to influence cognition and behaviour in entrepreneurial environments due to
the unpredictability and rapid nature of change in that domain. Baron (2008) also notes that
affect may play a role in entrepreneurial creativity. In fact, research in the creativity literature
points to affect-related constructs such as intrinsic drive (Amabile, 1983) and flow – optimal
experience (Csikszentmihalyi, 1990, 1996 and 1997).
In addition, Baron (1998) notes that since entrepreneurs have a deep commitment to their
opportunities, they are more likely than other people to experience intense emotions, more
frequently, in relation to their work. In effect, the literature suggests a strong presence of affect
in technology development and consequently, a higher level of concern over outsider control for
the most affect-invested developers. In essence, developers that are more psychologically-
invested than others are more likely to have greater concern about the market problems identified
above and, also, are more likely to take steps to reduce outsider control in contracts with the aim
of ensuring high levels of appropriability. Next, I note empirical evidence of developers’
reactions to these concerns and also note reasons why this evidence is interesting.

8
1.1.4. Evidence of Developer Reactions to Concerns
Before proceeding, the following provides the normative expectations for behaviour at
the point of commercialization. Contrasting these expectations with the evidence of developers’
reactions shows why the evidence is interesting and worth studying.
At the point of commercialization, the developer(s)’ behaviour is based on the creation of
new ventures on new technology; however, this is not necessarily a defining condition for
entrepreneurship (Shane and Venkataraman, 2000). As well, the developer is not required to
engage in all parts of the entrepreneurial process (Venkataraman, 1997 and Shane and
Venkataraman, 2000, Eckhardt and Shane, 2003). Hence, technology developers are expected to
choose the most efficient strategy at commercialization even if it limits their control and personal
involvement in the market process. This view is supported by the argument that, technology
developers do not often possess the financial resources and complementary assets necessary to
achieve a successful commercialization (Fontes and Coombs, 2001; Gans and Stern, 2003;
Teece, 1986). As a result, developers normally need to depend on outsiders for investment in
order to achieve successful commercialization and ensure performance.
For developers who need outside investment, the task is to relinquish some of the
ultimate control held from the time of idea recognition and also prepare for a limited
involvement in the market process. These tasks are onerous for developers who have high
psychological investment. Therefore, considering the risks and uncertainty surrounding new
technology, one expects the typical technology developer to be more susceptible to outside
investors or partners. However, as noted previously, outside investment comes with control
conditions that will be most protested by developers who are highly-attached. Hence, reactions
to the perception of outsider control may range from hesitation to outright avoidance or refusal to

9
elicit outside investment in the commercialization process. The following are some empirical
evidence to that effect.
While existing empirical evidence is more common to venture financing (Cressy and
Olofsson, 1997; Winborg and Landström, 2001; Müller, 2007), it is insightful for general
commercialization decision making. For instance, Müller (2007) noticed that founders who
experience a loss of control were reluctant to increase the size of equity, were prepared to pay
higher interest rates for additional loans in order to maintain control and, as a result, experienced
smaller growth. Winborg and Landström (2001) found owner financing to be the main method of
financing in new firms. Cressy and Olofsson (1997) found that entrepreneurs aversive to losing
control of the opportunity were mindful that relinquishing some control would improve
performance. The concept of relinquishing control for success is not limited to venture financing.
In the area of commercialization strategy, Gans and Stern (2003) argue that, through cooperation,
start-ups can avoid duplicative investment thereby avoiding sunken investment in
complementary assets necessary for commercialization.
Essentially, except for special cases where the developer controls financial resources,
complementary assets, tight intellectual property and or enjoys inalienable human capital, it is
generally counter-intuitive to seek control over the technology during commercialization.
Further, the resistance to relinquishing control to qualified outside parties seems to go beyond
cognitive reasoning and connotes affective influences. If the developer needs to relinquish
control to gain access to essential resources but does not, the developer is likely to defy his or her
own cognitive reasoning, and rather listen to visceral voices that, for instance, trumpet the future
pain of loss of control. This point takes us back to how psychological attachment and control

10
tendency as affective constructs might help explain some of these findings. The following
discusses the “affectiveness” of PA and CT.
1.1.5. Explaining the Empirical Evidence: The Affective Characteristics of PA and CT
Affect has been shown to play a role in risky decision making and various aspects of
human judgment (Lowenstein, Weber, Hsee, Welch, 2001) – reviewed in later sections. This
section looks at how affective the construct of CT is. I focus on CT since the connection between
PA and affect does not need further exposition when you consider the central theme in the
definition of PA as the “affectional tie” between the developer and the technology.
Having emotionally invested in the technology, the perception of outsider control in light
of appropriability and opportunism concerns is enough to evoke a developer’s control tendency.
Experts who research the concept of control argue that perceived or subjective control is a
stronger predictor of functioning than actual or objective control (Skinner, 1996). Thus, an
individual’s perceived control, or conviction that control is available, is enough to mobilize
action and modulate arousal (Averill, 1973) as well as influence affective states and behaviour
(Skinner, 1996).
Hence, the point to note here is that CT could emanate from affective processes and may
or may not have any cognitive or logical basis. Also note that by adopting the Shane and
Venkataraman (2000) position that opportunities could be exploited without the developer’s
complete involvement and control, the thesis narrowly characterizes CT as the developer’s urge to
take charge of affairs at commercialization. Further, in concentrating on the affective components,
the thesis links CT to PA and developer perceptions of control or loss of control in the
microeconomic environment. If PA and CT possess strong affective components, the mechanisms
can explain some of the empirical findings. Especially, the mechanism might fit the observation that

11
developers or founders accurately perceive the need for developer involvement but choose to ignore
it. Such mental processes can easily be described from the characteristics of affect (in terms of PA
and CT) and the relationship between affect and cognition. The following characterizes affect and
draws implications for venture performance if PA and CT can be described as affective constructs.
1.1.6. Characteristics of Affect and Implications for Performance
I start by reviewing the current status of research on affect and relate the empirical
findings to the behavioural expectations for PA and CT. Zajonc (1998) identifies affective
processes as those evaluative sensations that address the “go/no-go” questions (that lead to
approach/avoidance behavior), while cognitive processes are those that answer the true/false
questions. Further, there are key characteristics of affective processes in relation to cognitive
processes. First, affect is primary and often occurs below the cognitive radar (Bechara, Damasio,
Damasio, and Lee, 1999). Second, affect plays an informational role and guides cognitive
reasoning (e.g., the somatic marker hypothesis - Damasio, 1994; affect-as-information
hypothesis - Clore, 1992; affect heuristic theories - Slovic, Layman, Kraus, Flynn, Chalmers and
Gesell, 1991). Third, in decisions under risk and uncertainty, empirical evidence shows that
affective processes diverge from cognitive processes and, when they do, affective processes
often exert a dominating influence on behavior (Lowenstein et. al., 2001, Wilson and Arvai,
2006) leading to errors in judgment (Kahneman and Ritov, 1994; Kahneman, Ritov, and
Schkade, 1999; Kahneman, Schkade, and Sunstein, 1998; Gneezy and Potters, 1997). For
instance, considering specific affective states such as fear, Lerner and Keltner (2000, 2001) find
that fearful people made more pessimistic judgments about the likelihood of adverse events and,
in addition, they made risk-averse choices.

12
Essentially, affect and affect-laden constructs are instrumental in decision making and
can steer the process towards inefficiency especially in decisions involving risk and uncertainty.
In other words, if highly invested developers develop PA, it will aid in moving the technology
from conception through development. However, at the point of commercialization (i.e., when
issues of control creep in), excessive attachment might evoke the desire to control the process
and the technology, when relinquishing control would ensure higher efficiency. As shown above,
such victory for affect (in terms of PA and control) over cognition (in terms of a more accurate
evaluation) spells inefficiency for commercialization decisions and strategies. Thus, one can
advance this argument toward explaining why entrepreneurs shun outsider investment even when
they realize that such investment will improve performance (Cressy and Olofsson, 1997; Müller,
2007). As noted earlier, those decision cases seem to initially involve an accurate cognitive and
objective evaluation which is then discarded in the decision process.
1.1.7. The Objectives of this Study
As can be discerned from the foregoing this thesis studies developer CT at the point of
commercialization. This study has five main objectives. The first is to identify the dimensions of
PA. The second is to determine if PA leads to a decrease in cognitive evaluation of the
microeconomic environment. The third is to verify if PA leads to CT. The fourth is to identify
the moderators and, possibly, the mediators of the relationship between PA and CT. The fifth is
to assess the relationship between PA in a hypothetical commercialization decision context
where developers encounter outsiders and make decisions on how much control to share.
In order to fulfill these objectives, an experimental survey process was employed. The
main challenges in this research design were to gain access to respondents who started
developing similar technologies within the same timeframe, and obtain measures of PA and CT.

13
To minimize the problems posed by these challenges, the study employed a group of respondents
tasked to develop engineering design projects within the same technology stream and with the
same start and end dates. PA is elicited after a period of development, and respondents are
presented with various hypothetical decision scenarios where their CT and other measures are
captured.
1.1.8. Contributions
The study presents various contributions to the literature in entrepreneurship. The results
of the study provide insight into the adverse effect of affect-laden concepts in entrepreneurship
decision making, thereby contributing to a burgeoning literature on the role of affect in
entrepreneurship. By presenting the viewpoint of affective biases, the study complements
research on the role of cognitive biases such as overconfidence (Camerer and Lovallo, 1999) and
overoptimism (Arabshabani, de Meza, Maloney, and Pearson, 2000) in entrepreneurial decision
making, research that sometimes lacks consensus. For instance, Lowe and Ziedonis (2006) found
no effects for overoptimism in the decision to start a firm for entrepreneurs commercializing
university technology. The authors found that entrepreneurs continue unsuccessful development
efforts for longer periods of time than established firms, and economic returns for many are
realized after the start-up has been acquired by an established firm. By speculation, one can
relate what appears to be unfruitful persistence to the adverse effects of PA and CT. Thus, the
results in this thesis question the extent to which affect influences sub-optimal decisions to self-
commercialize.
Further, the study contributes to the venture performance literature by suggesting a
nonlinear relationship between affect and performance – affect is instrumental in venture
development, but could prevent venture goals from being attained. The effects of affective

14
constructs such as PA and CT may be fleeting, but have the potential to impact decisions with
dire consequences in extemporaneous decision situations as found in entrepreneurship (Baron,
2008).
1.1.9. Other Areas of Research Application
The concepts could be applied to study a variety of phenomena in entrepreneurship. One
such area is risk perception in the case of over-entry into markets. For example, CT may
motivate self-commercialization when market concerns “push” the developer to launch his/her
own venture. However, self-commercialization to “safeguard” the opportunity denotes risk-
aversion but could be more “risky” due to higher uncertainty. This behavioural pattern denotes a
simultaneous existence of gambling and insurance. Employing the prospect theory framework
(Khaneman and Tversky, 1979) or other relevant frameworks can, in this context, complement
current research on the role of emotions in expected utility computations (Caplin and Leahy,
2001) in order to better explain risk seeking as well as risk aversion in entrepreneurship. Another
application is the transfer of control from entrepreneur-managers to more professional hands
during business re-structuring, mergers and acquisitions. Entrepreneur-managers’ resistance to
the control transfer could stem from excessive attachment to the idea, technology or business.
Other areas include the “not invented here” syndrome, where employees will only adopt systems
that are initiated by them or within the company or react adversely to outsourcing by the firm,
with implications for productivity. A specific application to new technology technicians, such as
software coders, could unveil ways to manage ownership issues and improve performance. A
final application that can be considered is the work of product champions in corporate venturing.
The concepts of PA and CT may help in studying how product champions transition between

15
new products and also identify avenues to improve on transition as well as performance in the
process.
Finally, there may be implications for government programs that support
commercialization efforts, possibly supporting unnecessary or misguided entrepreneurial efforts
in the economy. Implications for practitioners include strategies for reducing the biasing effect of
attachment in decision-making, while implications for public policy include designing innovative
financing schemes to ensure the positive effects of attachment and reduce the negative ones. In
general, the study has implications for the role of affect in various areas of entrepreneurship such
as: opportunity recognition and exploitation, risk perception, strategy formulation, social, and
venture capital formation.
The rest of the thesis is structured as follows. Chapter 2 identifies relevant literature,
detailing some of the literature previewed in the introduction; Chapter 3 concentrates on theory
and predictions; Chapter 4 reports measures and results for the various main effects; Chapter 5
describes application settings where control preferences in financial decision making is
considered; and Chapter 6 provides discussion and conclusions.

16
Chapter 2
2.1 Literature Review “Again, if the affections in themselves were pliant and obedient to reason, it were true there should be no great use of persuasions and insinuations to the will, more than of naked proposition and proofs; but in regard of the continual mutinies and seditious of the affections— reason would become captive and servile, if eloquence of persuasions did not practise and win the imagination from the affections’ part, and contract a confederacy between the reason and imagination against the affections; for the affections themselves carry ever an appetite to good, as reason doth. The difference is that the affection beholdeth merely the present; reason beholdeth the future and sum of time. And, therefore, the present filling the imagination more, reason is commonly vanquished; but after that force of eloquence and persuasion hath made things future and remote appear as present, then upon the revolt of the imagination reason prevaileth”. Francis Bacon (1561 – 1626)1
This chapter provides a review of extant literature on judgment decision making, relating
cognitive to affective influences in evaluation of outcomes and decision making. In addition, the
chapter reviews issues of control and ownership in various areas in management and
entrepreneurship, citing the different effects of control and ownership on interactions and
relationships between agents and principals. The chapter then narrows in on control and PA in
idea development and ends with implications for venture performance.
2.1.1 Decision Making in Entrepreneurship
Entrepreneurial Decision Making: Heuristics and Biases
Current research on entrepreneurial decision making concentrates on entrepreneurial
cognitions: how entrepreneurs think and process information for opportunity assessment and
exploitation. The focus on cognitions stems primarily from research in the area of judgment
decision making which shows that people might not be expected-utility maximizers as the
expected utility theory postulates. The subjective expected-utility theory (SEU) developed by 1The Advancement of Learning (Second book, XVIII, 4) The Web edition published by the University of Adelaide Library, South Australia: http://etext.library.adelaide.edu.au/b/bacon/francis/b12a/complete.html

17
von Neumann and Morgenstern (1944/1947) and Savage (1954) is a model for “rational choice”
derived from simple axioms of consistent preferences under risk and uncertainty. In the model,
alternative decisions are based more on uncertain events rather than outcomes of well-understood
gambles. The agent calculates SEU for each decision alternative, and subsequently chooses the
alternative with the highest SEU. In terms of the underlying axioms, the independence axiom
(where two alternative decisions can yield the same consequence) plays a crucial role since it
allows the definition of conditional preferences. Although the model has enjoyed the status of an
acceptable normative standard and a useful descriptive model for decision making, its axioms
(especially the independence axiom) have been contested in laboratory experiments in which
these axioms are violated (Allais, 1953; Ellsberg, 1961; Kahneman and Tversky, 1979).
Tests by Allais (1953) and Ellsberg (1961) displayed paradoxical behavior while
Kahneman and Tversky (1979) showed that subjects resorted to predictable “heuristics and
biases” that were not in line with the expected utility theory. Earlier in 1955, Hebert Simon
introduced the idea of “bounded rationality” when he argued that utility theory reflects
assumptions about human information processing that are beyond the scope of people’s cognitive
abilities. The limits on knowledge and cognitive ability motivate individuals to choose the first
alternative that meets identified minimal criteria. This process is termed by Simon as
“satisficing”. It involves the use of cognitive shortcuts or heuristics rather than an elaborate SEU
process that chooses an optimizing solution. However, satisficing, or to be more precise, the use
of cognitive shortcuts, is not always an efficient strategy, especially when one considers risk and
uncertainty about future outcomes. Consider an illustration from the realm of entrepreneurship.
In relation to entrepreneurship, the level of uncertainty and risk involved in the process
sometimes propels entrepreneurs to resort to heuristics and biases in decision making, often

18
resulting in errors in their intuitive predictions and judgments. Kahneman and Tversky (1996)
define judgmental heuristics as ‘a small number of distinctive mental operations’ while biases
are described as cognitive errors made in decision making. Although the heuristics technique is
often used in problem solving (such as entrepreneurship); it does not always guarantee a correct
solution. Empirically, some individual-level and heuristic-laden factors able to introduce biases
into entrepreneurial decision making, including: overconfidence (Camerer and Lovallo, 1999),
overoptimism (Arabshabani, de Meza, Maloney, and Pearson, 2000; Astebro, Jeffrey and
Adomdza, 2007), entrepreneurial self-efficacy (Krueger, 2000), entrepreneurial locus of control
(Wijbenga and Witteloostuijn, 2007), among others. The following highlights the tenets of some
of these cognitive biases (such as overconfidence and optimism) and also empirical evidence for
their biasing role in decision making in general and, specifically, in the domain of
entrepreneurship.
Overconfidence was first explained to result from lack of meta-knowledge. Thus, people
are unaware of the limits of their knowledge when making forecasts (Oskamp, 1965). Many
other sources of overconfidence have been identified. An example is the “availability bias”
(Kahneman and Tversky, 1973) – being influenced by the mental availability of instances when
constructing perceptions of likelihood. Availability leads to the systematic overestimation of the
probability of events that are familiar, recent and/or easily imaginable. Another source is the
“confirmation bias” (Koriat, Lichtenstein, and Fishhoff, 1980) – the retrieval and use of evidence
that supports existing hypotheses or a set of beliefs. The individual tends to want to confirm
existing beliefs and avoid disconfirming evidence.
In entrepreneurship, notable among studies on the overconfident bias is the work of
Camerer and Lovallo (1999) who constructed a laboratory experiment in which subjects were

19
asked to choose the extent to which they would enter a market where payoffs depended on
entrant skill. The authors found that experimental subjects displayed overconfidence as they
were more likely to excessively enter markets when they thought that post-entry performance
depended on their skills. Further, subjects neglected the skill levels of other entrants and in doing
so, neglected their reference groups in making market entry decisions. Camerer and Lovallo
(1999) noted two reasons why firms would make biased entry decisions. First, firms are likely to
be aware of their skill capacity but fail to appreciate the number of competing entities. Second,
firms may accurately forecast the competition but overconfidently think that they will succeed
while the competing firms will fail. Similarly, Cooper, Woo, and Dunkelberg (1988) asked
nearly 3000 new business founders about their chances of success, and found that 81% of
respondents thought their businesses had more than a 70% chance of succeeding.
In addition to overconfidence, optimism has been largely studied in entrepreneurial
decision making with positive and negative effects on decisions. Scheier and Carver (1985)
define optimism as “the favorability of a person’s generalized outcome expectancy” (p. 232). In
other words, optimism is the general belief that good things are more likely to happen and bad
things are less likely to happen. However, the construct is often operationalized as a positive
outlook on future financial states in business research. It has been studied in many other domains
with good evidence of robustness in effects (see Weinstein and Klein, 1995 for a review of these
studies).
Moderate optimism might lead to rational financial decisions, but overoptimism may lead
to bad financial decisions (Manju and Robinson, 2007). Landier and Thesmar (2004) used a
dataset of French businesses to examine entrepreneurial optimism and its effect on capital
structure and performance. They found that optimistic entrepreneurs prefer short-term over long-

20
term debt, and prefer inside rather than outside financing. Astebro, Jeffrey and Adomdza (2007)
found that optimistic independent inventors continue to spend resources after receiving a
negative expert evaluation. Further, Arabsheibani et al. (2000) found the self-employed to have a
better financial outlook than employees, but had worse experiences. Crane and Crane (2007)
surveyed extant entrepreneurship literature over a 25-year period and concluded that
dispositional optimism predicts entrepreneurial success and appears to be a defining
characteristic of entrepreneurs. These studies have provided insight not only in the way
entrepreneurs make decisions, but in the general mechanisms for judgement decision making.
The following provides a recount of some mechanisms unearthed over time in research in the
area.
Mental Processes in Decision Making
All in all, research on decision making, including the avalanche of studies on heuristics
and biases in the mainstream literature, has provided some consensus on the processes through
which the human mind operates in making decisions. The following presents the state of current
research on the process of decision making as shown in Figure 1. Figure 1 presents a map of the
psychological decision making literature and relevant progress made in outlining the process of
human decision making. In doing that, Figure 1 compares the dual process system of decision
making with the affective-cognitive systems, identifying the similarities and differences between
the two. The basic assumption used in developing Figure 1 is that the processes outlined in the
dual system mirrors the processes outlined in the cognitive-affective systems. The discussion of
the right side will focus on the characteristics of affective and cognitive factors, differences in
their effects on decision making, and how their characteristics influence the effects. The aim is to

21
show that affective processes are a powerful part of human decision making and then introduce
PA as an affective construct with the potential to bias entrepreneurial decision making by way of
unnecessary and inefficient control-seeking strategies during idea commercialization.
Therefore, the discussion will briefly highlight the symmetric characteristics of the right
(cognitive-affective) and the left (dual system) sides of Figure 1, and concentrate on the right
(cognitive-affective) side of Figure 1.
Figure 1
Decision-Making: Dual, Cognitive and Affective Processes
It is widely agreed that decision making results from a dual process of information
processing: “intuitive” and “analytical” (see Kunda, 2001 for a review). Notable among these
theories is the dual process concepts of System 1 and System 2 which exhibit the interaction
between intuitive and reflective judgments (Kahneman and Frederick, 2002). According to the
model, System 1 involves a more rapid, associative, automatic and effortless intuitive process
Affective processes Non-cognitive evaluative sensation go/no-go’ questions (that lead to approach/avoidance (Zajonc 1998, Bechara, Damasio, Damasio, and Lee, 1999)
Deliberative processes System 2 process of making judgments - rule-based - deliberate and - effortful (Sloman, 1996; Stanovich and West, 1999).
Cognitive processes Analytic reasoning above consciousness
Automatic processes System 1 process of making judgments - more rapid - associative - automatic, and - effortless intuitive process (Sloman, 1996; Stanovich and West, 1999).
Dual Process Cognitive versus affective
Decisions
• Good judgements when System 2 prevails • Errors when system 1 generates them and
system 2 fail to correct them
• Affect informs cognition (Damasio, 1994) • Affective dominates cognition (Lowenstein et al.,
2001) • Affect dominated judgment often erroneous
(Lowenstein et al., 2001,Gneezy and Potters,

22
while System 2 involves a rule-based, deliberate and effortful process of making judgments
(Sloman, 1996; Stanovich and West, 1999). System 1 processes do not necessary occur with
awareness or consciousness and, therefore, may be out of cognitive reach. In the model, errors in
the decision making process take effect when System 1 generates them and System 2 fails to
correct them, as noted in the middle panel of the left side column in Figure 1.
Although the intuitive and reflective processes in the dual process model could be argued
to operate purely on a cognitive basis, the distinction between intuitive and reflective is mirrored
in the distinction between cognitive and affective processes (column on the right side of Figure
1). Zajonc (1998) identifies affective processes as those that address the ‘go/no-go’ questions
(that lead to approach/avoidance behaviour) while cognitive processes are those that answer
true/false questions. At this point, it should be noted that some researchers distinguish between
“affect”, “feelings” and “emotions”. For instance, Masters (2000) noted such distinctions. He
describes affect as an innately structured, non-cognitive evaluative sensation that may or may not
register in consciousness. Feelings are described as affect made conscious, possessing an
evaluative capacity that is not only physiologically based, but that is often also psychologically
(and sometimes relationally) oriented. Finally, Masters (2000) describes emotion as
psychosocially constructed and dramatized feeling. Although these distinctions are important and
may influence conceptualization, the terms are used loosely in this thesis due to the interest in
their behavioral outcome. Therefore, it is assumed that affective/feeling/emotional processes lead
to approach/avoidance behaviour, meaning that there is no need to distinguish between them for
the purposes of this study.
Going back to the idea that intuitive and reflective processes mirror cognitive and
affective processes, it is important to note some characteristics about affective processes.

23
Affective responses are generally positive or negative (has valence) and may occur above the
threshold of conscious awareness (knowing how you feel) or below it (reacting to a noise before
you know what it is). Similar to System 1, affective processes are mostly automatic and
unconscious as they often occur below the cognitive radar (Bechara et al., 1999). The question,
therefore, is: “if affective processes can be automatic and unconscious, what effect do they have
on cognitive processing or on decision making?”
I start with evidence from the judgment decision making literature and neuroscience and
go on to briefly review the conclusions on how affect influences cognition. Theories have been
developed to support the claim that analytic (cognitive) reasoning cannot be effective unless it is
guided by affective processes (e.g.. the somatic marker hypothesis - Damasio, 1994; affect-as-
information hypothesis - Clore, 1992; affect heuristic theories - Slovic, Layman, Kraus, Flynn,
Chalmers and Gesell, 1991). Neuroscience studies show that cognitive processes are controlled
by the cerebral cortex (or the higher brain) while affective processes are controlled by the
amygdala (the lower brain). Conducting studies within this domain, Damasio (1994) argues that
events and stimuli get tagged affectionately and these tags (somatic markers) are evoked when
similar stimuli are encountered. Damasio (1994) found evidence for his theory when he observed
that patients who have suffered prefrontal brain damage (leading to the uncoupling of their
cognitive processes from their affective senses) were, in some cases, not able to make good
decisions although they were capable of logical analyses. Studies in the domain of judgment
decision making by Clore (1992), such as affect-as-information hypothesis model, hypothesizes
the direct effect of feelings on judgment. In terms of social judgment, this is exemplified in how
judgments of others are influenced by the positive and negative of liking and disliking.

24
From the foregoing, there are two main effects through which affect influences decision
or cognition. First, affect can be evoked without intervention from cognition and second, the
influence of cognition on decisions is mediated, to an extent, by affective processes. In the
mediation process, affect can have a positive impact when it plays an informational role and aids
cognitive decision making as Damasio pointed out. However, beyond the informational role,
affective processes are likely to evoke negative consequences on decisions.
In effect, affective processes could be automatic and unconscious and their prevalence
over cognitive processes could lead to errors in judgment and, therefore, failure in decision
making. Much empirical evidence supports this claim. Empirical evidence shows that when
affective processes diverge from cognitive processes, affective processes often exert a
dominating influence on behaviour (Lowenstein et al., 2001; Wilson and Arvai, 2006) and
thereby lead to errors in judgment in various domains (Kahneman and Ritov, 1994; Kahneman,
Ritov, and Schkade, 1999; Kahneman, Schkade, and Sunstein, 1998; Gneezy and Potters, 1997;
Benartzi and Thaler, 1995; Gneezy and Potters, 1997; Thaler, Tversky, Kahnerman, and
Schwartz, 1997). Further, illustrating with empirical evidence from work on specific affects such
as fear and anxiety, researchers found evidence in line with cautious and risk-averse decision
making (Lerner and Keltner, 2000, 2001). Fear, the response to imminent threat, discourages
people from taking advantageous gambles (Gneezy and Potters, 1997). Lo, Repin and
Steenbarger (2005) found that subjects whose emotional reaction to monetary gains and losses
was more intense on both the positive and negative sides, exhibited significantly worse trading
performance. There is also evidence from neuroscience research. Kenning, Mohr, Erk, Walter,
and Plassmann (2006) used functional magnetic resonance imaging (fMRI) to investigate the
neural mechanisms underlying home–biased financial decision making. One of their findings is a

25
correlation between activity within the amygdala-hippocampal regions of the brain, a region
involved in negative emotional processing such as fear, and the investor’s general risk aversion.
The Divergence between Emotional and Cognitive Processes
A number of reasons have been identified for the divergence between emotional and
cognitive processes. Lowenstein et al (2001) identify immediacy of risk and the manner of
emotional responses to probabilities and outcome values as some factors responsible for the
divergences. How individuals perceive risk and its immediacy determines, to a large extent, how
they react to it. Essentially, individuals’ personal risk preferences are driven at least in part by
emotional reactions to risky choices (Hsee and Weber, 1997; Lowenstein et al., 2001).
Elaborating on the mechanism by which negative emotions such as fear can affect risky decision
making, it is important to note that the functional objective of fear centers on minimizing the
potential for harm to oneself or something close in relationship to oneself. Lerner and Keltner
(2000) argue that the specific impact of an emotion on cognitive appraisal shapes the willingness
to take risks. Identifying characteristics of fear (in comparison with anger), the authors note that
fear is associated with low certainty, high anticipated effort, low control, and medium
responsibility. Also, fear produces a tendency to perceive negative events as unpredictable and
under situational and not human control. So, in relation to the technology developer who is faced
with commercialization, fear of outside encroachment and loss threatens existing control over the
opportunity and, therefore, motivates risk-averse and control-oriented decision making.
Further, emotional responses to probabilities and outcome values in the perception of risk
also determine how individuals react to risk. Technology entrepreneurs, for instance, may
entertain basic worry about the possibility of the idea being stolen irrespective of the probability

26
that it may be secure enough. Such fear, as a response to imminent threat of loss, motivates
escape and the search for safety (Frijda, 1986; Lazarus, 1991; Levenson, 1999; Öehman and
Mineka, 2001). Thus the possibility of loss of the creative idea will evoke enough fear to cause a
risk-aversive action even if the probability of a loss is negligible. Lerner and Keltner (2000,
2001) found that fearful people made more pessimistic judgements about the likelihood of
adverse events and also made risk-averse choices. Entrepreneurs who put undue weight on the
possibility of adverse circumstances befalling the opportunity miss the chance to collaborate and
partner in areas such as financing and technology development; areas that provide crucial
support for a successful commercialization of an innovation.
In short, affective processes are important for efficient decision making under risk and
uncertainty. However affective processes play an informational role serving as somatic markers
for guiding decisions. Also, affective processes mediate the influence of cognitive processes on
decisions, and when they dominate cognitive processes, there is the potential for inefficiency in
the decision outcomes. Having established these notions, the discussion can turn to the role of
affective processes in the domain of the entrepreneurial processes and implications for
performance.
2.1.2. Empirical and Anecdotal Evidence of Psychological Attachment and Control in
Entrepreneurship
The above review discussed the decision-making literature and the role of affective and
cognitive processes in risky decision making in uncertain decision scenarios, typical of the
domain of entrepreneurship. The following provides an account of empirical evidence that
suggests the role for PA and CT as affective constructs in entrepreneurial decision making. The
account dwells on behaviour in different areas of management that exemplifies the notion of

27
possessiveness in how entrepreneurs deal with outside parties. To proceed, I start from research
on cognitive biases in entrepreneurship (introduced earlier). The aim of this recapitulation is to
argue that evidence of no effects reported for some cognitive biases suggests that affective biases
could be considered.
Beyond Cognitive Biases: Affective Biases
Although biases may stem from cognitive factors as earlier reviewed, the review of the affect
literature also suggests that affective factors might play a far more significant role in decision
making. The fact that many new ventures normally fail (Dunne, Roberts and Samuelson, 1988
and Cooper, Woo and Dunkelberg, 1988) implies that entrepreneurial decision making is often
biased in judgment (Cooper, Woo and Dunkelberg, 1988; Busenitz and Lau, 1996, Barnes, 1984;
Arabshabani, de Meza, Maloney and Pearson, 2000; Coelho, de Meza and Reyniers, 2004;
Camerer and Lovallo, 1999; Forbes, 2005; Palich and Bagby, 1995; Åstebro, 2003; Åstebro,
Jeffrey and Adomdza, 2007). I argue that it may be useful to consider affective biases in such
decisions. One reason is that biases may not only emanate from cognitive thought processes but
also from affective psychological states. As reviewed earlier, affective processes can dominate
cognitive processes, thereby, biasing the decision-making process with a higher likelihood of
inefficiency in outcomes. For illustration, let me turn to a study that suggests a lack of consensus
on the role of cognitive biases while also suggesting a stronger role for affective biases (from
factors such as psychological attachment and control tendency).
Consider Lowe and Ziedonis (2006) who found no effects for overoptimism in the decision
to start a firm for entrepreneurs commercializing university technology. The authors find that
entrepreneurs continue unsuccessful development efforts for longer periods of time than do
established firms and also, that economic returns for many are realized after an established firm

28
has acquired the start-up. Thus, the authors question whether entrepreneurs are overoptimistic in
continuing to develop products with limited chances for future success. From this illustration, it
appears that another type of bias is influencing these entrepreneurs in their decision to persist –
possibly, a bias that is affective and probably eludes consciousness.
Clearly, the lack of evidence for overoptimism is worrisome because it indicates that despite
their seemingly excessive persistence, these entrepreneurs do not necessarily believe in the
prospects of their ideas. As well, it may also imply that they are not overconfident in their
abilities to ensure the ventures success, otherwise they would have scored high on optimism and
most possibly be overoptimistic. On the other hand, evidence from the data shows that they
persisted with little success, success was only realised when they relinquished control to an
outside party. Although not implied in the discussion given by Lowe and Ziedonis (2006), there
appear to be reasons to believe that these entrepreneurs were reluctant to allow outside
involvement till it was absolutely necessary. The realization of positive financial returns for the
opportunities upon transfer implies that the entrepreneurs’ control over the ideas prevented the
enactment of efficient strategies for commercialization. If these analogies hold, evidence will
indicate a biasing influence from affective constructs such as desiring control over the
opportunity, most likely due to attachment to the opportunity.
Similarly, Roberts (1990) studied the early years of technology-based firms and found lone
founders to be slower to evolve from an engineering focus to product and market orientation.
One can argue that according to intuitive logic, faster decision deliberations will emanate from
lone founders compared to groups. However, on the contrary, we see lone founders being slower
in adding value to their innovations. There appears to be stagnation and persistence at the
development stage of the technology with reluctance to move to efficient commercialization.

29
Again by sheer speculation, one can envisage technology entrepreneurs who are too highly
attached to the technology to organise market deployment in a more efficient and timely manner.
Another point of illustration is what is commonly referred to in the business press as
“entrepreneurial disease” (Rubenson and Gupta, 1992). This notion is based on the idea that
entrepreneurs have difficulty developing skills they need to transition into professional
management. Thus, manager replacement becomes the efficient strategy as the firm grows. The
business press is littered with founders and CEOs who do not possess the requisite human capital
necessary to lead the firm forward, but who are reluctant to hand over control to more competent
hands. Although there is no hard evidence of empirical research that links these behaviours to
affective constructs such as psychological attachment and control tendency, the situations match
the behavioural stipulations for these constructs.
Control over an Entrepreneurial Idea
In addition to the anecdotal and implied sense of control found in the literature, there are a
few empirical studies citing “control over an entrepreneurial idea” as a variable of interest. An
example from the broader management area is that entrepreneurs strongly desire to control the
activities of their organizations (Drucker, 1970; Gray and Ariss, 1985; Mintzberg, 1984) even
though most of them lack managerial competence.
However, most of the studies on the topic have been done in the area of new venture
financing. For instance, Müller (2007) did a study on the influence of the benefits of control on
the capital structure and the growth of private companies for a sample of 8,964 UK companies
with limited liability observed for up to five years. She notes that “[owners of private companies]
want to remain in control because they obtain private benefits over and above the financial return

30
on their investment. In order to stay in control, they need to forego some growth opportunities, if
the opportunities are too extensive to be realized with debt finance alone. This means that
companies do not reach their growth potential and employ fewer people than would otherwise be
the case”. She found that founders who might experience a loss of control were reluctant to
increase the size of equity, were prepared to pay higher interest rates for additional loans in order
to maintain control and as a result they experienced smaller growth. Similar conclusions are
drawn from other studies, which also show that entrepreneurs seem to prefer internal financing
over external financing especially if it affects ownership (Winborg and Landström, 2001; Cressy,
1995; and Berggren, Olofsson and Silver, 2000). Cressy (1995) relates the phenomenon to
“control aversion” where entrepreneurs are averse to losing control of the opportunity although,
they are aware that relinquishing some control would improve performance (Cressy and
Olofsson, 1997).
Post Market Entry Problems of Private Benefits and Control
At the heart of appropriability are private benefits. One can argue that entrepreneurs who
enjoy private benefits from their technologies are likely to feel that they have appropriated the
returns to the technology to a large extent. This argument works on the assumption that private
benefits are over and above “normal” returns to the entrepreneur. Although private benefits are
not operationalized in this study, interest in them stems from the notion that psychological
attachment may explain the notion that control-oriented entrepreneurs behave in a certain way
due to their quest for private benefits. In other words, deep interest in private benefits might stem
from attachment and can also lead to non-optimal decisions. Entrepreneurs may be in the “I
deserve more” frame of mind even if “getting more” is unfair (or opportunistic) to the outsider.

31
Research in corporate finance provides empirical evidence that points to the agency problem
of extraction of private benefits by shareholders from the firm when their voting rights far
outweigh the cash flow rights (Bebchuk, Kraakman and Triantis, 2000; and Shleifer and Vishny,
1997). Recall the agency theory (Eisenhardt, 1989) where an agency relationship exists in which
one party (the principal) delegates responsibilities to another (the agent). Problems such as:
divergence of goals, cost of information and different risk preferences exist in these
relationships.
Thus, private benefits are pursued by entrepreneur-managers (agents) who are entrusted with
the management of funds provided by financiers (principals). A more exact description of the
problem is given by evidence of controlling shareholders (entrepreneur-managers) extracting
private benefits or profiting unfairly by deliberately choosing ineffective projects (e.g. see Berle
and Means, 1932; Zingales, 1994; Dyck and Zingales, 2004; and Nenova, 2003). Dyck and
Zingales (2004) show higher benefits of control in less-developed capital markets where there
may not be high government protection for minority shareholders. In the US and UK, firms
mostly respect the “one share-one vote” rule. However in areas or countries with a high
concentration of entrepreneurs like in Canada, larger shareholders will have the advantage even
when there is government regulations that protect minority shareholders.
Closely related to the private benefits problem is the desire for founders and entrepreneur-
managers to remain at the helm of affairs even if relinquishing control might appear more
prudent. Data provided by Dyck and Zingales (2004) show that for most of continental Europe
and Asia, ownership is concentrated in the hands of individuals, families, governments or
industrial groups and, therefore, the reluctance is evident. In Canada, ownership is concentrated
in families with evidence in some of the major corporations such as Power Corp., Magna Corp.,

32
Bombardier Inc., Quebecor Inc. which are still controlled by their founders or their families
(Ben-Amar and Andre, 2006). Ben-Amar and Andre (2006) reported a study that suggests that in
spite of the legal protection offered by the Canadian Business Law, some reserachers find certain
forms of expropriation in Canada (Attig, Fischer and Gadhoum, 2004 and Bozec and Laurin,
2004). In addition, Ben-Amar and Andre (2006) also report numerous research findings from
around the world that note the decrease in firm value when there is a separation of ownership and
voting rights as well as a decrease in firm performance (even though the evidence is mixed)
when families consolidate their hold on the business through generations. Clearly, the
concentration of ownership indicates the willingness of founders to remain at the helm of affairs
when there is the possibility of greater potential for these firms to grow beyond their present
capacity. A possible solution to this problem would be the relaxation of founder control of the
firms.
In a quick summary, the incidence of private benefits indicates the willingness of agents to
take advantage of their control positions and unfairly expropriate from agreements with
principals. When such agents are entrepreneur-managers, their behaviour might be a reaction to a
sense of entitlement to the technology, an attachment from conception or development that
makes them think they deserve more than they are getting.
Market Entry Financing Issues
Agency problems are not limited to after-market-entry interactions between entrepreneurs or
managers and financiers. These problems guide interactions, decisions and relationships during
financing of market-entry efforts. As briefly noted earlier, financiers encounter asymmetric
information – when one party is believed to have better or more information than the other – in

33
their attempt to fund entrepreneurial ventures or opportunities. The problem is more profound
when the non-human elements of such a contract can be more easily secured than the human
elements especially when the entrepreneur’s human capital is inalienable from the
entrepreneurial opportunity.
In the venture capital financing literature, Van Osnabrugge (2000) reiterated two primary
causes of agency problems: conflicts in alignment and verification of goals; and conflicts in risk
sharing. The author identifies two approaches to combat agency problems. The first, aimed at
decreasing asymmetric information, is the classical agency theory approach of designing an
optimal contract between the principal and agent (Jensen and Meckling, 1976) through pre-
investment screening and due diligence of the entrepreneur and idea. The second approach is the
incomplete contracts theory which notes that because of transaction costs, bounded rationality,
and asymmetric information, contracts are “incomplete” and the emphasis is on the post-contract
allocation of control rather than the pre-contract screening and contract writing (Hart, 1995).
There has been considerable work done on the structuring of post-contract allocation of control
(Hart and Holmström, 1987; Hart, 1995; and Kaplan and Stromberg, 2003). Venture capitalists
are typically concerned about monetary returns to safeguard their investments. Hence, to boost
the entrepreneur’s performance, venture capitalists typically enable the entrepreneur to obtain
more control rights when company performance improves. It is often hoped that transfer of such
rights may satisfy the entrepreneur’s non-pecuniary motives and increase performance. However,
any party’s want to control is not solely dependent on that party’s individual motive, but also in
the level of trust existing or perceived to exist at that moment or in the future.

34
Control and Trust
It is incomplete to discus control and not mention “trust”. Dasgupta (1988) points out that
trust between contracting parties is essential to overcome control problems that plague contract
environments with severe agency risks and incomplete contracts. In extant research reports,
control is viewed as relating to formal legal contractual agreements, while trust relates to
psychological contracts. Also, the substitutability of trust and control has been discussed. Ring
and Van de Ven (1994) contend that the two constructs are substitutes in interfirm cooperation,
while Das and Teng (1998) argue that “a higher trust level does not automatically dictate a
lowering of the control level, and vice versa.” (p. 496). At each development stage of a
cooperative relationship, there is an optimum level of trust and control introduced to facilitate
both the transaction and the long-term business success (Shepherd and Zacharakis, 2001). The
implications are that trust and control play different roles in cooperative relationships. Control
mechanisms include social controls, imposed on both parties externally, behavioural controls,
based on agreements between both parties that establish rules around future behaviours, and
output controls, designed to reward good and punish poor performance (Das and Teng, 1998).
Controls can be introduced to coerce appropriate behaviour by the agent and build confidence.
However, control can have a negative impact on outcomes, motivation of the innovator and
innovation rates (Bromiley and Cummings, 1995; Dyer and Chu, 2003; Ring and Van de Ven,
1992; Teece, 1992). In this thesis, the concept of trust is not a major operational variable since
discussions concentrate on the early stage of a potential relationship between a developer and an
outsider. At that point, since the developer typically does not have a previous relationship with

35
the outsider for trust to have developed, we can only discuss the developer’s dispositional trust
when evaluating the outcomes of a possible relationship.
In summary, this section reviewed the literature on the issues of control from various
perspectives. There is empirical evidence that point to the desire to control or cases which
illustrate or suggest the desire to control in entrepreneurial endeavours. There is very little
evidence in the empirical reports that the control instances emanate from a psychological
attachment to one’s creative idea. However, some of the cases of control denote some sort of
attachment to the technology making it difficult for the developer (e.g. founders) to relinquish
control, a strategy sometimes needed to improve performance. The following section discusses
why control is detrimental to venture performance especially when emanating from attachment
to the technology.
2.1.3. Why Control from Attachment Can Be Detrimental To Venture Performance
The arguments in this section were briefly introduced in the introduction of this thesis. I
provide more detailed discussion here. Entrepreneurs may need to control the entrepreneurial
process, especially during opportunity recognition and development, as well as initial stages of
venture creation to ensure the realization of set goals. Therefore, one will expect control to be
instrumental to the continuity of the entrepreneurial process. For instance, the Schumpeterian
model of entrepreneurship states that the work of the entrepreneur is done when a business is
established (Schumpeter, 1934). Thus, the underlying theme of entrepreneurship is own-venture
creation. However, Shane and Venkataraman (2000) argue that entrepreneurship consists of
opportunity discovery and exploitation. The authors define entrepreneurship as “examination of
how, by whom, and with what effects opportunities to create future goods and services are
discovered, evaluated, and exploited” (p. 218). Thus, the creation of new ventures or ideas is not

36
necessarily a defining condition for entrepreneurship and, also the opportunity discoverer is not
required to engage in all parts of the entrepreneurial process (Venkataraman, 1997 and Shane
and Venkataraman, 2000; Eckhardt and Shane, 2003). Essentially, an entrepreneur does not need
to establish a sole-venture on the idea but can cooperate with an outside party to commercialize
or sell the idea outright. For instance, Gans and Stern (2002) note that cooperating with an
outside party is particularly desirable when the degree of excludability is high and
complementary assets belong to a third party. Generally, cooperating with third parties should
bring as much benefit, if not more, as competing with existing ventures (Weick and Eakin,
2005).
In effect, if entrepreneurship is not defined by the entrepreneur’s sole effort in venture
creation, then the entrepreneur’s control of the idea or the process is not paramount to successful
innovation. Control is only of strategic importance if supported by available capacity (human,
financial and complementary capital). Without such capacity, negotiations for financing,
manufacturing and distribution contracts will involve some level of control trading since third
parties typically require some control to reduce information asymmetry. This is evident in
partnerships with manufacturers, R&D outfits and financiers, which often come with the
redistribution of equity and control. In fact, entrepreneurial pedagogy stresses training students
on how to “cooperate” with important outsiders like venture capitalists and other members of the
value chain. Certainly, in these partnerships, the entrepreneur’s control over the idea is
acceptable if the entrepreneur’s human capital is inalienable (cannot be surrendered) and the
entrepreneur possesses some managerial ability.
However, given that most entrepreneurs lack the capacity or the managerial ability to solely
develop a successful venture, it is logical to expect that most entrepreneurs will cooperate with

37
outsiders especially at the point of market entry or commercialization to ensure success.
However, the empirical evidence chronicled above indicates otherwise. The evidence points to
control behaviour deriving from some attachment to an innovation of one’s creation and not from
the position of available capacity or existing ability. This attachment seems to drive founders and
entrepreneurs to choose inefficient strategies and to persist longer than is required in their
entrepreneurial endeavours when relinquishing some control can increase performance to a
greater extent. If such inefficient decisions and persistence can be explained by the desire to
control due to attachment, then such a behavioural tendency is expected to be directed away from
objective normative behaviour and lead to sub-optimal outcomes. Attachment-laden control will
result in behaviour that is expected to be limiting since objectivity in evaluation is curtailed and
cooperation with essential outsiders is discouraged. The reasons for these expectations have
already been outlined above when the characteristics and differences between affective and
cognitive factors were discussed, and psychological attachment and control were identified as
affective constructs.
Consequently, the underlying theme in this thesis is that the desire to control (resulting from
attachment) is likely to be detrimental to performance. Some major implications include
resistance to feedback and rejection of base rates in decision making. Thus, highly-oriented
entrepreneurs will be less likely to accept feedback from evaluation of their ideas (mostly if
negative); less likely to pursue R&D with outsiders that they fear might change the core design
of the innovation; more likely to disregard statistics on performance in the industry; and
therefore, in addition to other reasons, resort to decisions that are narrow-minded and indifferent
to important and available information. Given these implications, psychological attachment
presents an interesting dimension to studying decision making especially at the point of

38
commercialization where the issue of control is prominent. Control preferences resulting from
psychological attachment may explain additional variance in entrepreneurial decision making
with implications for venture performance. Therefore, it is imperative to understand the
constructs of control and psychological attachment, dimensions and effects. Chapter 3 provides
the theoretical underpinnings of the constructs and the relationships between them.

39
Chapter 3
3.1 Theory and Predictions
In the previous chapter I showed evidence of control tendency CT being an instrumental
factor in commercialization of new technology. Also, I linked CT to psychological attachment
(PA), when I argued that CT is most detrimental if it is based on subjective factors, such as
attachment rather than objective factors such as inalienable human capital. In this chapter, I
discuss the dimensions to PA, the relationships between PA and CT and the expected
behavioural effects by way of hypotheses.
3.1.1 Psychological Attachment (PA)
This section outlines the construct of PA, its tenets and its relationship with CT. The basic
idea behind the construct is that the entrepreneurial process establishes a relationship between
the developer and the opportunity. Figure 2 provides the conceptual view of the proposed
relationship. In the right panel there is a set of steps identified in Bowlby’s (1969, 1973)
attachment theory. The right panel provides concepts identified in the entrepreneurship and
creativity literature that relate to items in the steps from attachment theory. For instance,
concepts such as intrinsic motivation relate to the formation and maintenance of an affective
bond between the creator and the idea. The following sections discuss the constructs and
relationships as they pertains to Figure 2.

40
Figure 2
Developing Psychological Attachment
The construct of “attachment” is inherently affect driven. Considering the tenets of
attachment theories in psychology (Fairbairn, 1952; Bowlby, 1969, 1973), PA can be generally
characterized as an affectional tie that forms based on interactions between “self” and “other”
often accompanied by affective experiences, and constitutes affective states that can be major
building blocks for decision making. Bowlby’s (1969, 1973) attachment theory provides a
complete account of the normative and individual difference processes that generate emotions in
close relationships. According to Bowlby, the attachment system plays the roles of protecting
vulnerable individuals from potential threats and regulating subsequent negative affect. In his
book “Attachment and Loss” Bowlby (1969) explains… “Many of the most intense emotions
arise during the formation, the maintenance, the disruption, and the renewal of attachment
relationships [as shown on the right side of Figure 2]. The formation of a bond is described as
falling in love, maintaining a bond as loving someone, and losing a partner as grieving over
someone.” In a parallel relation to the entrepreneurial process (technology especially), one can
envisage entrepreneurs developing intense emotions when conceiving the opportunity (falling in
love), developing an attachment to the opportunity (maintaining the bond as loving the
Attachment develops through the: of affective bonds
• Intrinsic motivation (Amabile, 1973) • Flow (Csikszentmihalyi, 1990, 1996,1997) • Psychological ownership
(Pierce, Kostova, and Dirks, 2003) • Passions (Cardon et al, 2005) • Affect in entrepreneurship
(Baron, 2008)
Attachment Theories (Bowlby, 1969, 1973)
Entrepreneurship/Creativity Literature
• Venture failure (depression) • Overcoming failure (Sheppard, 2003, 2004)
• Formation
• Maintenance
• Disruption
• Renewal

41
opportunity), developing sorrow or depression from failing in venture formation (losing the
opportunity and grieving over it) (see Figure 2).
In addition, Bowlby notes that “[the] threat of loss arouses anxiety, and actual loss gives
rise to sorrow, while each of these situations is likely to arouse anger”. Further, Bowlby (1973)
postulated that an individual’s attachment system activates when the person perceives a threat
thereby forcing her/him to protect themself from that threat. In his example, a child’s attachment
system is activated when he/she perceives threats in the environment and because of that he/she
is motivated to seek protection from a caregiver. Bowlby says the unchallenged maintenance of
this bond with the caregiver is “experienced as a source of security and the renewal of a bond as
a source of joy”. He says “…because such emotions are usually a reflection of the state of a
person’s affectional bonds, the psychology and psychopathology of emotion is found to be in
large part the psychology and psychopathology of affectional bonds”.
Again, in relating to the entrepreneurial process, the entrepreneur develops an attachment
to the idea and the perception of a threat of loss from the commercialization environment leads to
a protective psychological posture. The emphasis is in guarding and maintaining the bond with
the opportunity and then, the entrepreneur derives security from the maintenance of that bond.
Further, Bowlby advocates the concept of “internal working models” which demonstrates the
process through which children internalize their childhood attachment experiences with
caregivers and rely on these internalized experiences when they form new personal relationships
with outsiders. These models are the basis of current work in attachment that distinguishes
between different styles of attachment (Hazan and Shaver, 1987; Mikilincer and Shaver, 2003).
In effect, one of the key characteristics of attachment theory is the developmental
experience. The theory provides an explanation for the mechanisms at different stages of a

42
relationship: why an individual is attracted to a relationship; the appeal factor; and how the
individual reacts to its dissolution. In relation to the entrepreneurial process, the attachment
theory could provide a framework for studying the affective factors that: motivate an individual
to be attracted to entrepreneurship; makes the entrepreneurial relationship with the opportunity
appealing; and affective factors that explain reactions to disengagement from that entrepreneurial
relationship (the dissolution of the relationship). In other words, the opportunity recognition,
development and growth stages of the entrepreneurial process map onto the developmental
paradigm noted by Bowlby within which an entrepreneur experiences the formation,
maintenance, disruption and renewal of the affectional bond with the opportunity (see the
mapping in Figure 2).
Also, entrepreneurs internalise their entrepreneurial experiences which influence their
interactions with outsiders. The perception of a threat will kick in the attachment system that
motivates the protection of that bond with the opportunity. However, these developmental
experiences form an essential part of the affective experiences that entrepreneurs must encounter
as they develop opportunities. The following provides empirical accounts of concepts that may
apply to the various stages of the developmental process of formation, maintenance, disruption
and renewal of the affectional bond with the opportunity.
Developer–opportunity interactions that indicate the formation and maintenance of
affectional ties or psychological bonds as described in Bowlby’s work are noted in the creativity
and entrepreneurship literatures and are characterized by concepts such as intrinsic drive (Ryan
and Deci, 2000; Amabile, 1983); psychological ownership (Pierce, Kostova and Dirks, 2003),
flow (Csikszentmihalyi, 1990, 1996 and 1997); passions (Baum and Locke, 2004; Branzei and
Zietsma, 2004; Cardon et al., 2005); intense emotions from commitment to the opportunity

43
(Baron, 1998); and the role of affect in entrepreneurship (Baron, 2008). Although they don’t
directly argue for the effect of PA, these concepts provide evidence for affect-induced behaviour.
For instance, Baron (2008) notes that affect is likely to influence cognition and behaviour in
entrepreneurial environments due to the unpredictability and rapid nature of change. He also
points out that affect may play a role in entrepreneurial creativity. The author specifically
identifies opportunity recognition (corresponding to formation in attachment theory) and
acquisition of essential resources (pertaining to the issue of control) as two areas where affect
may play a role in entrepreneurship. Further, Baron (1998) notes that since entrepreneurs have a
deep commitment to their opportunities, they are more likely than other people to experience
intense emotions, more frequently, in relation to their work, and are more susceptible to affect
infusion — when affective states elicited by one source or experience influences judgments
about other, unrelated events (Forgas, 1995).
There are other concepts, such as entrepreneurs’ grief over business failure (Shepherd,
2003, 2004), which illustrate the disruption of the affectional bond (business failure and loss
leading possibly to depression) and renewal of the bond (getting over the loss and continuing to
pursue the opportunity). For instance, Shepherd (2004) notes that the reasons entrepreneurs start
their own businesses could highlight entrepreneurs’ emotional attachment to their businesses. He
advocates for pedagogical methods to help students in entrepreneurship manage emotions to
avoid failure, learn from failure and improve their emotional intelligence. The following
provides more illustrations of how some of the other identified concepts and processes might
motivate PA to the opportunity.
Further, the concept of intrinsic motivation demonstrates a platform for the formation and
maintenance of an affectional bond. For instance, many studies have shown that opportunity

44
development or creation is intrinsically motivating and rewarding (Deci, Koestner and Ryan,
2001; Rossman, 1931; Schumpeter, 1934; White, 1959; deCharms, 1968; Deci, 1975). For
instance, White’s (1959) effectance motivation theory suggests that individuals are motivated
from the feeling of having an effect on their environment. deCharms’ (1968) personal causation
theory suggests that individuals get motivation from the feeling of being the initiators of their
own actions. Amabile (1983) found that an individual’s interest in an activity, rather than in
external rewards, leads to a more creative performance. However, Deci’s (1975) intrinsic
motivation theory emerges as the most tested theory of motivation. It is defined as the doing of
an activity for its inherent satisfactions rather than for some separable consequences (Ryan and
Deci, 2000, p. 56). Deci’s theory suggests that individuals’ need for relatedness, competence and
autonomy, individuals drive them to persist with tasks and report high interest and enjoyment.
Intrinsic motivation then provides the mechanism through which the entrepreneur forges a closer
bond with the opportunity; to form and maintain an affectional bond out of the reactions to
successful problem solving and other positive experiences.
Another construct capable of providing an environment within which an affectional bond
can be discussed is “psychological ownership”. Psychological ownership is essentially the
psychology of MINE. It is related to possessive tendencies (biological, social, situational or
developmental) that establish the connection between self and targets of possession. Pierce,
Kostova, and Dirks (2003) define the state of psychological ownership as ‘that state where an
individual feels as though the target of ownership or a piece of that target is theirs’. They
identified the following features for the construct. The first feature is based on the concept of
possession and relates to the sense of ownership which manifests itself in the meaning and
emotion commonly associated with the expression MINE. The second feature they identify is the

45
relationship between the individual and the object. Here the object is experienced as having a
close connection with the self or becomes part of the extended self. The third feature is a
complex mix of cognitive-affective elements in which the individual is aware through
intellectual perception. The affective component of interest here, according to Pierce et. al.
(2003), ‘becomes apparent in the feelings that arise when others lay claim to objects for which
one feels a sense of personal ownership”
In addition to the features, Pierce, Kostova and Dirks (2003) identify three routes to the
emergence of the construct or the state of psychological ownership; controlling the ownership
target (object); coming to know the target intimately; and investing the self into the target. Of
particular interest is the process of investing the self into the target. It is easy to realize that the
process of opportunity development is commensurate with investing the self into the idea. Pierce
et. al. (2003) notes that ‘the most obvious and perhaps the most powerful means by which an
individual invests him/herself into an object is to create it’. The authors mention writings of
Locke (1691) who argued that we own our labour and ourselves, and therefore, are likely to feel
that we own what we create, shape or produce. Along the same lines, Norton and Ariely (2005)
show that people value goods more highly when they invest their own labour in creating them.
They show that novices who make origami value their creations as highly as those made by
experts, and individuals who make self-built Legos value it more highly than sets built by others.
Thus, when creators endeavour to solve problems on their ideas and go through iterative rounds
to develop a working prototype, they invest emotional energy into the process and the outcome
(which is the idea).
Lastly, Pierce et al (2003) note that just like our words, our thoughts and emotions are
representations of our self. Also, the authors note that ‘creation involves investing time, energy

46
and even one's values and identity’. Feelings of ownership in these circumstances are clearly not
derived from legal possession, but from the feelings of the ownership target belonging to or
being a part of the self as the creator conceives and develops the idea. Pierce et al (2003) indeed
acknowledge that individuals may feel ownership for the products they create in vocations such
as academia (through scholarly pursuits), entrepreneurship (through pursuing entrepreneurial
opportunities), and politics (through the drafting of bills). In effect, effective reactions from
interaction with the idea and resultant ownership are expected to lead to emotional attachment
when the ownership target is felt to be threatened, as postulated by Bowlby (1969, 1973). The
same way politicians are staunch defenders of bills they draft, entrepreneurs’ PA will magnify in
the face of perceptions of hostility on the market.
Going further, the concept of Flow is another construct that suggests the formation and
maintenance of an affectional bond during the entrepreneurial process. Flow is the concept of
optimal experience developed by Mihalyi Csikszentmihalyi (1990, 1996 and 1997).
Csikszentmihalyi describes the feeling of having been able to create something new and original
by focusing attention on a challenge. He notes the concept of ‘Flow’ which is a state of
consciousness where an individual experiences feelings of deep enjoyment and of control and
dominion. In this state, individuals are immersed in the present as they eradicate from their
minds the impossibilities of the past and the uncertainties of the future. However, the state of
Flow is a balance between psychological processes of differentiation and integration. The
process of differentiation follows the notion of individuation put forth by Carl Jung (see Jung
and Baynes, 1921). It is the process where the individual opens up to parts of him/herself beyond
his/her ego. According to Jung, the individual needs to pay attention to dreams and question the
assumptions of operant societal worldview rather than be blinded by the dominant norms and

47
assumptions. Therefore, differentiation is a break from the norm to realize dreams or attain new
goals –in effect, is passion-laden. Integration, however, is bringing together information and
experience into the process, and could be described as objectivity. Complexity is generated when
differentiation interacts with integration. Having interviewed 91 people described as exceptional
individuals, Csikszentmihalyi (1996) notes that some respondents describe the creative process a
yin-yang alternation between the two extremes. With sufficient complexity to challenge and hold
their attention, intrinsically motivated creators can easily achieve the optimal experience. The
objectivity does not slow down the process of creation but lends credibility to the ideas
conceived.
The concept Flow seems to imply that individuals are not inherently creative until they
are intrinsically motivated by the complexities they face. Csikszentmihalyi (1996) notes that
without passion individuals lose interest in a difficult task. Further, the state of consciousness
could occur several times a day and might not give birth to novel ideas worth pursuing.
However, the concept is appealing due to the importance of drive in the creation process, and
also, due to the feelings of deep enjoyment, control and domination that accompany the Flow
state. These are feelings at conception and at problem-solving points during development which
are in line with Bowlby’s (1969) formation and maintenance concepts when applied to the
psychological bond between the idea and the entrepreneur.
Lastly, there are a number of other positive emotions identified in the literature which
suggest an affectional bond between creator and idea. An example is “passion” in idea creation.
Passion described by early philosophers such as Aristotle is what is now referred to as emotion.
Bennett-Goleman (2001) describe passion as that gift of emotion that causes individuals to take a
precise interest in and pay keen attention to something. Baron (1998) identified passion as being

48
associated with entrepreneurship. Also, Cardon, Zietsma, Saparito, Matherne and Davis (2005)
argue for the consideration of emotion in entrepreneurship, compare entrepreneurial creation to
parenthood, and identify factors such as passion, commitment and identification as drivers in
entrepreneurship. As entrepreneurs conceive an idea and work on it, they are more likely to seek
security in it and be protective of it. Further, working in the domain of relationship literature,
Branzei and Zietsma (2004) provide a long list of qualitative evidence showing that founders
speak with more passion about their business opportunities than non-founders. If the
entrepreneurial process leads to passion, it is not difficult to see how the process will generate
affectional ties between the entrepreneur and idea through passion.
In summary, attachment theory postulated by Bowlby (1969, 1973) can provide a
framework for conceptualizing the formation, maintenance, disruption and renewal of the
affectional bond between an entrepreneur/creator and an opportunity/idea. Concepts that
illustrate the formation and development of this affectional tie are identified above. Among them
are psychological ownership, intrinsic motivation, flow and passions. These factors are
conceptualized to motivate an attachment to the opportunity which gets stronger when
entrepreneurs perceive threats from the commercialization environment. Further, through the
concept of internal working models these factors are expected to motivate entrepreneurs to
internalize their affective experiences and evoke them during interactions with outsiders. Given
these observations, the following identifies two dimensions of PA. The first dimension relates to
the formation of the affective tie and is identified as the positive-experience affective states
resulting from the entrepreneurial process. The second dimension relates to the maintenance of
the affective tie and that is identified as affective states that enhance entrepreneurial self-identity
(see Figure 3). Figure 3 shows a relationship between these two dimensions and PA.

49
Figure 3 Dimensions to Psychological Attachment
3.1.2 Entrepreneurial Process-Generated Affect (Opportunity Recognition and Development)
Positive- and Negative-experience Affective States
Characterizing the entrepreneurial process (before commercialization) as comprising
opportunity recognition and opportunity development, the following discusses the
characterization of opportunity, opportunity recognition and development, and relates to the
generation of affect in these two areas. I start with opportunity recognition, and provide a
definition, review the literature on the issues of recognition process and what it entails. Then I
discuss the role of affect in the process.
Extant literature on the nature of opportunity and recognition of opportunities
Opportunity recognition is defined as a process of perception, discovery and creation of new
ideas (Singh, Hills, Hybels and Lumpkin, 1999). However, what characterizes an opportunity is
subject to debate. The debate relates back to what defines entrepreneurship. A number of
definitional paradigms can be identified (see Shane and Eckhardt, 2003). I review them because
they focus on the role of the individual, and since affect emanates and resides in individuals, the
paradigms provide insight into how affective states relate to the opportunity recognition process.
One of these paradigms is the psychological-theories paradigm that suggests that there are a
number of psychological traits possessed by the entrepreneur which allow him or her to
undertake the task of entrepreneurship. There is also the Neoclassical equilibrium theories
Construct Psychological Attachment Affectional tie between entrepreneurial opportunity and entrepreneur
Dimensions Entrepreneurial process-generated affective states • Positive-experience affective states • Self-identity-enhancing affective states

50
paradigm which notes that markets are made up of maximizing agents and that there are no
unnoticed business opportunities. Thus, only the people who choose to become entrepreneurs do
so - not because the opportunities themselves haven't been noticed by anyone else. Then, there is
the Austrian school paradigm which claims business opportunities arise because not everyone
has the same amount of information and thus some are not equipped to "see" the opportunities.
In essence two overarching paradigms emerge, one where entrepreneurship is a function of the
individual and the other where it is a function of an enabling environment.
In the same fashion, the definition of an opportunity is also subject to debate; and this
debate also has a bearing on the arguments for this thesis. Acs and Audretsch (2005) contend that
a set of weakly held assumptions appear to dominate this debate leaving the fundamental nature
of opportunity vague and unresolved. The debate is on whether “opportunity” is a subjective or
an objective construct. Some researchers dwell on the subjectivity and the “socially-constructed”
nature of opportunity arguing that these characteristics make it impossible to separate the
opportunity from the individual. Others argue that an opportunity is an objective construct visible
only to knowledgeable and attuned individuals. For instance, Shane and Venkataraman (2000)
portray opportunities as objective phenomenon that may be discovered by entrepreneurs with
unique cognitive abilities. However, Shane (2003) develops the idea of an individual-opportunity
nexus which merges the traditional views of entrepreneurship offering a coherent and
overarching conceptual framework that explains the different parts of the entrepreneurial
process: the opportunities, the people who pursue them, the skills and strategies used to organize
and exploit opportunities, and the environmental conditions favourable to them.
Mirroring the debate of entrepreneurship stemming from the individual or from the
environment, there is also a debate as to whether “an opportunity” stems from the individual or is

51
independent of the individual. The view that is eventually adopted will determine the nature of
the discussion of the role of affect in the opportunity recognition process. However, the role and
traits of the individual can be seen to play a part in either approach. The following argues for the
role of the individual irrespective of what approach is adopted, and what the implications are for
the role of affect in the process.
The individual in opportunity recognition Without arguing for an individual-centric
process for dealing with opportunities, it is clear that the role of the individual cannot be
relegated to the background. Even if opportunity recognition is episodic as the critics of the
person-based view argue, when the episodes occur, it still takes an individual to realize the
prospects of the opportunity and act on it. From that view point it could be argued that,
irrespective of the characteristic of the opportunity, there is a certain level of personal judgement
and decision making that must come from an individual for the opportunity to be exploited. For
instance, Schwartz, Teach and Birch (2005) contend that opportunity recognition may follow a
cognitive or a process approach. The cognitive approach is based on personal characteristics of
entrepreneurs, scripts and mental models behind opportunity recognition, while the process
approach emphasizes opportunity recognition as more of a manageable activity. In both
approaches there will be the need for an individual mental (cognitive and affective) factor to
move the process forward.
First dimension: Positive affect in opportunity recognition and development Having
argued that the individual (and, therefore, his or her affective experience) plays a role, in
opportunity recognition and development, I proceed to argue for the role of affect in these
processes. I start by making the case that since affect goes hand in hand with cognition, where
cognition plays a role; affect plays a role as well. Thus, with a cognitive process at play, one will

52
expect an affective dimension to play an informative, supporting or reactionary role. Therefore,
whether by a cognitive or process approach, the employment of a cognitive entrepreneurial
capability (Baron, 2004, 2006a) that implies the recognition of opportunities is grounded in
cognitive realizations with accompanying affective states (e.g., the ‘Flow’ concept of
Csikszentmihalyi, 1996). Positive affective reactions to these cognitive realisations are expected
to initiate an affectional tie to the idea as a natural response to the experiential experience. Baron
(2008) identifies two ways in which affect influences opportunity recognition: through the
influence on creativity and through the moderating effects of affect on the influence of other
individual-level factors on opportunity recognition. Specifically, Baron (2008) notes that, in
general, positive affect is more likely to facilitate creativity than negative affect and, thereby,
enhance opportunity recognition. However, it should be noted that while Baron (2008) discusses
affect that aids the creative process, the emphasis in this study is on affect that is a “by-product”
of the creative process. In other words, the study dwells on the affective reactions to the events
comprising the creative process.
For an illustration, let’s revisit the concept of “Flow”. Csikszentmihalyi (1996) associated
the feeling of Flow with having to create something new and original by focusing attention on a
challenge. As introduced above, “Flow” is a state of consciousness where an individual
experiences feelings of deep enjoyment and of control and dominion. In a unique study of
creativity, Csikszentmihalyi (1996) studied 100 individuals who had produced socially
recognised creative works and were made up of scientists, artists, writers, educators, politicians
and social activists, engineers, and religious leaders. He identified domain expertise as an
instrumental factor in their excellence and creativity. This suggests that intrinsic motivation is a
crucial aspect of creativity. Thus, creators possessing mastery in their skills will be intrinsically

53
motivated to endeavour in their areas of expertise. With the view that intrinsic motivation has
affective components, it is not difficult to see that intrinsically motivated creators will experience
positive affect from successful endeavours, and possibly negative affect, such as
disappointments, from failure. These two cases will reinforce the creator’s actions positively and
negatively. One will expect that positive affect will correlate more with an affectional tie to the
opportunity than negative affect (if at all).
The development stage will consist of similar mechanisms. Take the view that
development is typically grounded in problem solving (see Brown and Eisenhardt, 1995). Then,
for technology entrepreneurs developing product innovations, the development stage presents
difficult tradeoffs in the areas of demand expectations, quality, design and fabrication in order to
achieve goals such as the lowest manufacturing cost structure. Therefore, positive affective states
resulting from successful recognition or discovery, as well as finding solutions to development
problems (or to a previously difficult problem) are expected to increase attachment to the
opportunity.
Further, creative problem solving has been identified to follow two different thinking
processes: convergent or analytical, and lateral or associative (Guildford, 1967). While
convergent reasoning produces one solution, divergent thinking produces multiple solutions
thereby producing novel ideas and unusual responses to questions. Thus, divergent thinking
cognitively leads in various directions some conventional and some original. Research in
neuroscience supports these distinctions. For instance, the brain is found to function differently
under the two types of thinking. Dacey and Lennon (1998) find the brain to be involved in a
higher degree of neural complexity and, therefore a greater degree of neural connections under
divergent thinking tasks than under analytical tasks. Funtional MRI tests that contrasted insight
54
with analytical problem solving (devoid of insight) showed increased activity in the right
hemisphere anterior superior temporal gyrus, an area of the brain noted for initial problem-
solving efforts.
In addition, the existence of different thinking processes imply subjects can make
connections across distantly related information and find connections that were not previously
obvious (Jung-Beeman et. al., 2004; Bowden et. al., 2005). It is also known that observed
Gamma bursts seen in these neuroscience studies activates emotions increasing the plasticity of
the cortex and facilitating the formation of new associations in the thinking process. The
divergent nature of thinking and the brain processes associated with creative thinking, suggest a
high level of emotions from cognitive realizations when patterns are found or when discoveries
are made. Divergence in thought suggests that discovery will be “unusual” and, therefore, evoke
a high-level emotional reaction, in this case, positive emotions such as joy. The classic discovery
story is told of Archimedes who rushed out of his bathtub onto the street, naked, and yelling
“Eureka, Eureka” when he suddenly discovered his well-known principle of hydrostatics.
Clearly, there was an intense outflow of emotions evoked by the discovery.
For entrepreneurs, such an experience is likely to initiate an affectional tie with the idea
since the “affective discovery mode” might linger for a longer period. Empirically, there is also
some correlation found between positive moods and creativity. In several studies conducted by
Isen and colleagues, they found positive mood to positively affect creative problem solving than
negative or neutral moods (Isen, 1990; Isen and Baron, 1991; Isen et. al., 1987). In relation to
entrepreneurship, affect can shape thoughts during opportunity recognition (Baron, 2006b;
Baron, 2008) and the recognition process, in turn, will reinforce the affective states. Likewise

55
depressed, sad and/or stressed people are less likely to conduct creative problem solving because
the negative moods restrict attention and evoke stereotypic responses (Gazzaniga, 1988).
Further, I recount one of the processes of attachment theory (Bowlby, 1969, 1973): the
formation of attachment – “falling in love”. The presence of affective states in creativity,
whether emotions (such as joy, excitement) or drive states (such as intrinsic drives), suggest the
likelihood of the actor falling in love with the creation. Referring to entrepreneurs as creative
individuals, the argument can be made that positive affective states will garner attachment
towards the entrepreneurial opportunity, while negative experiences, in contrast, will inhibit
affectional ties to the opportunity. In this sense, the affective states in question relate to the
equilibrium state the developer is in. So, during opportunity recognition and development,
positive states refer to cases in which the problem (or key problem) is solved, while negative
states refers to cases where the problem is not solved and, therefore, the creator is reacting
negatively.
H1a: Positive affective states resulting from opportunity development process will be positively related to PA while negative affective states will be negatively related to PA2.
Second dimension: Self- Identity- Enhancing Affective States As the entrepreneur
identifies self with the opportunity the notion of the entrepreneurial role identity may begin to
form. The entrepreneur may begin to envisage a burgeoning identity based on the idea and likely
begin to develop possessive feelings. Using a related concept, Pierce, Kostova, and Dirks (2003)
noted that the motivation for psychological ownership (of one’s creation) is partially grounded in
2 Hypothesis H1a and H1b are what I refer to as validation hypotheses. Since hypotheses are not typically developed to investigate dimensionality, I developed these two hypotheses to assess the theoretical underpinnings of the two constructs as presented. I achieved this by correlating the dimensions with alternative measures of PA. A high correlation suggests a considerable level of validity.

56
self identity. The authors note that “the most obvious and perhaps the most powerful means by
which an individual invests him/herself into an object is to create it” (pg 93). Through the
reinforcing process of affect shaping opportunity and vice versa, entrepreneurs gain self
understanding, express self identity to others, and become attached to the opportunity as they
begin to view it as a natural extension of the self. Cardon et al. (2005) note that, entrepreneurial
decisions sometimes stem from “emotions and deep identity connections between an
entrepreneur and an idea or opportunity” (pg 24). As entrepreneurs begin to see the opportunity
as an “extension of self”, they begin to develop a sustained commitment to the role-identity as
they define themselves in terms of that role “I am going to be an entrepreneur”. Thus, the role
identity will come to define the person, and to some degree, the role will merge with the person's
self-definition (Turner 1978).
With roots in sociology, role identity relates to a person's individualized version of a
social role. Role theory is based on the idea that people function within a society; and as a result
there is communication of certain expectations regarding one’s behaviour (Burke and Reitzes,
1991; Hoelter, 1983; Pilivain, and Callero 1991; Stryker 1980). Thus, a role becomes a set of
individual and shared meanings (see Weigert, Teitge and Teitge 1986, for a comprehensive
review of different views of identity theory).
Further, role identity has been shown to be a strong predictor of behaviour. For example,
focusing on blood donors, Callero, Howard and Piliavin (1987) show that the extent to which an
individual views himself or herself as a blood donor is more likely to sustain the behaviour of
blood donation. When a role is sustained over time, it may become part of an individual’s role
identity (Reich, 2000). Thus, over time, the person becomes a “blood donor” as perceived by self
and others. Role identity is also explained in symbols and positions. Stryker (1980) builds on

57
symbolic interactionism and connects symbols and positions to roles in social interaction. He
notes that “In this usage, positions are symbols for the kinds of persons it is possible to be in
society: rich man, poor man, thief, fool, teacher, sergeant, intellectual, rebel, president, and so
on” (Stryker, 1980, p. 57). On symbols he adds, “Symbols enable people to predict their own and
other’s behaviour and to anticipate the future course of interaction” (1980, p. 37). And on
positions he notes that, “Like other symbolic categories, positions serve to cue behaviour and so
act as predictors of the behaviour of persons who are placed into a category” (1980, p. 57). Thus,
symbols and positions have certain behaviours attached to them and individuals use these roles to
describe aspects of the self. Callero, Howard and Piliavin (1987) suggest that predictions of
future behaviour can be made based on the extent an individual has merged a given role with his
or her definition of self.
The identity literature provides some conceptualization of this role-person merger. Turner
(1978) describes the role-person merger as the extent to which a role identity is integrated with a
person’s overall self definition. A greater role-person merger implies a higher impact of role
identity factors in the definition of self and consequently corresponds to a higher amount of time
spent in the role. High role-person merger has been associated with self labeling as a person who
performs the role (e.g., Burke and Reitzes, 1991; Piliavin and Callero, 1991; Stryker, 1980). The
more an entrepreneur merges the self into the entrepreneurial role, the more he or she labels him
or herself as an entrepreneur (or entrepreneurial). Research also shows that the choice of roles
and the definition of self, is based on those roles develop over a period of time through role-
related development stages. Kleine and Kleine (2000) outlined five stages of role-identity
development for freely chosen, ordinary role identities (e.g., bridge player): role-identity
presocialization, discovery, construction, maintenance and disposition. For instance, identity

58
discovery relates to the process of exploring a particular identity to determine the level of fit with
the self, while identity construction refers to the individual choosing actively to devote time and
energy to the pursuit of the identity. In relation, opportunity recognition is expected to motivate
the entrepreneur towards entrepreneurial identity discovery while the process of problem solving
through opportunity development might motivate the construction of an entrepreneurial identity
through the experiences enjoyed. The crucial argument here is that entrepreneurs may need to
necessarily develop some affectional tie to the opportunity in order to successfully discover and
construct the entrepreneurial role identity.
Recent research in this area in entrepreneurship is beginning to discuss the role of
entrepreneurial identity in the nascent process and effects on persistence and performance. For
instance, employing role theory, George, Jain and Maltarich (2006) conceptualize the nascent
process as a role identity transformation, and find, among other factors, perceived social and
economic enablers to affect role identity adoption and opportunity commercialization. In general,
attempts try to describe the entrepreneurial process in terms of identity dynamics as an
alternative to the trait research in trying to understand the motivations to pursue entrepreneurial
activity (Hoang and Gimeno, 2007, and Hytti, 2000). For example, Hytti (2000) argues for
studying how the entrepreneurs define themselves as well as how other people define
entrepreneurship and entrepreneurs according to their interactions in different circumstances.
Further, Hoang and Gimeno (2007) develop the concept of founder role identity and
describe how centrality and complexity affect successful role transition. The authors explain
founder centrality as how important the entrepreneurial identity is to the entrepreneur’s self
concept while complexity is explained as the depth and breadth of the entrepreneur’s conception
of the role. In relation to this study, developers with a high centrality are expected to view

59
entrepreneurship favourably and, therefore, begin investing emotionally into the opportunity as
they observe its prospects. Also, developers may endeavour to actualize whatever entrepreneurial
role they conceptualize such that they will carry out entrepreneurial activities to various stages.
Thus, some will only develop ideas to transfer to outsiders for commercialization while others
will build new ventures on their ideas in accordance with their perceived entrepreneurial role
identity.
On the whole, it is clear that an entrepreneurial identity might be an attraction for
potential entrepreneurs, and this may also help explain entrepreneurial endeavours and
persistence. However, since identity is constructed and not innate, the process might begin with
opportunity identification but will be fostered through the development process. Positive
experiences and celebrative affective states resulting from success in problem solving and other
developmental achievements, may result in cognitive anticipation of a prospective
entrepreneurial identity in the future. The affective reactions to this cognitive anticipation are
expected to motivate a stronger bond between the opportunity and the developer, creating a PA.
H1b: Self-identity-enhancing affective states will be positively related to psychological attachment to the opportunity
3.1.3 Psychological Attachment vs. Cognitive Evaluation Figure 4 Psychological Attachment vs. Cognitive Evaluation of the Microeconomic Environment
Having argued that PA stems from affective conditions during opportunity recognition
and development, it is important to discuss the differences in mechanisms between decision
-,+ ?
Psychological Attachment
Cognitive evaluation

60
processes governed by PA and those governed by cognitive evaluation, as indicated in Figure 4.
Figure 4 shows that there is a relationship between PA and cognitive evaluation, the nature of
which is discussed in this section. As briefly introduced earlier, affective processes are known to
diverge from cognitive processes, and sometimes overshadow them, in judgment decision
making (see Lowenstein et al., 2001 for a review). The authors note that “ …other strands of
literature in psychology most closely associated with the clinical literature suggest that [affect]
often conflict with cognitive evaluations and can in some situations produce pathologies of
decision making and behaviour” (p. 269). They cite examples such as anxiety and fear which
make people react more strongly to outcomes they recognize as highly unlikely (such as airplane
crashes) or not objectively terrible (such as public speaking), while reacting less strongly to
negative outcomes that are more likely and probably more severe (such as car accidents).
The differences in mechanisms are also shown in related evidence which supports the
notion that highly anxious individuals attend preferentially to threat-related stimuli and interpret
ambiguous stimuli and situations as threatening (Eysenck, 1992 Derakshan and Eysenck, 1997;
Eysenck, Mac-Leod and Matthews, 1987; Vasey, El-Hag and Daleiden, 1996). Further, studies
by Wilson and Arvai (2006) show that despite expected gains in evaluability, affective responses
to a stimulus may overwhelm analytic computations in decision making. These positions can be
bolstered with the mood congruence theory. Baron (2008) suggests that entrepreneurs’ current
moods may affect the information they store in memory and retrieve for later use. In relation,
technology developers might envisage emotional reactions to adverse commercialization
situations and the resulting mood may affect information storage, retrieval and use.
The differences in mechanisms for affective and cognitive processes are also seen in dual
process models. Lowenstein et al., (2001) cite the work of Sloman (1996) who distinguished

61
between rule-based and associative processing. Similar to the System 2 – System 1 dual
processes reviewed earlier, rule-based processing “is a relatively controlled form of processing
that operates according to formal rules of logic and evidence and is mediated by conscious
appraisal of information”, while “…associative processing is a more spontaneous form of
processing that operates by principles of similarity and temporal contiguity” (p. 270). They argue
that since associative processing is not mediated by conscious appraisal it is difficult to suppress
its influence on judgments and decisions. Thus, in the case of divergence, the consequences can
be dire mostly due to the negative influence of affective processes.
Lowenstein et al., (2001) also noted determinants of affective reactions that differ from
cognitive evaluations. They argue that the divergences between affective and cognitive reactions
occur for two reasons. Firstly, affective processes respond to probabilities and outcomes in a
different manner from what is expected with cognitive evaluation. Secondly, there are situation-
specific factors that have a minimum effect on cognitive evaluations: time-course of the decision,
nonconsequentialist (not ‘if then’) aspects of the decision outcomes (e.g. vividness) and
evolutionary preparedness for some reactions. The time-course of the decision refers to the
temporal nature of affect, while vividness is concerned with individual differences in mental
imagery in influencing affective responses. However, evolutionary preparedness relates to the
idea that humans are preprogrammed to experience certain types of fears that are not cognitively
dangerous but because evolution has prepared them for such experiences.
For an illustration of the divergence between affective and cognitive processes, consider
the case of an entrepreneur of a low-technology household appliance, faced with a simple
decision of choosing a type or size of distribution channel. A reasonable expectation is for the
entrepreneur to choose a distributor that possesses maximum distribution capacities for a number

62
of reasons. A large distributor will ensure high volume and market share or reach, hence, the
entrepreneur will experience higher economic returns and brand building or possibly quicker
brand dominance. However, when the entrepreneur is highly attached to the idea, the pattern of
decision making may deviate from this normative expectation, reflecting a divergence between
affective and cognitive evaluation based on the reasons identified by Lowenstein et al. (2001).
To see the reasons at play, assume the marketing/distribution channel the entrepreneur
contacted demands more than 50% mark-up on the final price of the product, and the
entrepreneur was aware of this information. First, in relation to the evaluation of probabilities
and outcomes, as identified by Lowenstein et al. (2001), a highly-attached entrepreneur will
begin considering all the possibilities of his or her profits being squeezed to the barest minimum
(against the probability that it might not happen), as well as envisioning all the possible negative
future outcomes. In terms of situational factors identified by Lowenstein et al. (2001), the
proximity of the decision moment (at the point of commercialization) will bring these concerns
to the fore (time-course). Likewise, the value of the mark-up will serve as a vivid signal of
expropriation which might emanate from the entrepreneur’s evolutionary make up. All these
mechanisms can occur irrespective of the fact that operating costs and the complexity of
channels of distribution require high mark-up fees.
In effect, the divergence between affective and cognitive processes will reflect in
differences in PA-infused evaluations and cognitive evaluations of the commercialization
environment as shown in Figure 5. Figure 5 relates the situational factors just reviewed and
entrepreneurial effort to the differing cognitive and affective forms of evaluation, and further
relates these forms of evaluation to types and differences in perception (shown in the right most
panel). Although there are cognitive and affective influences throughout the decision-making
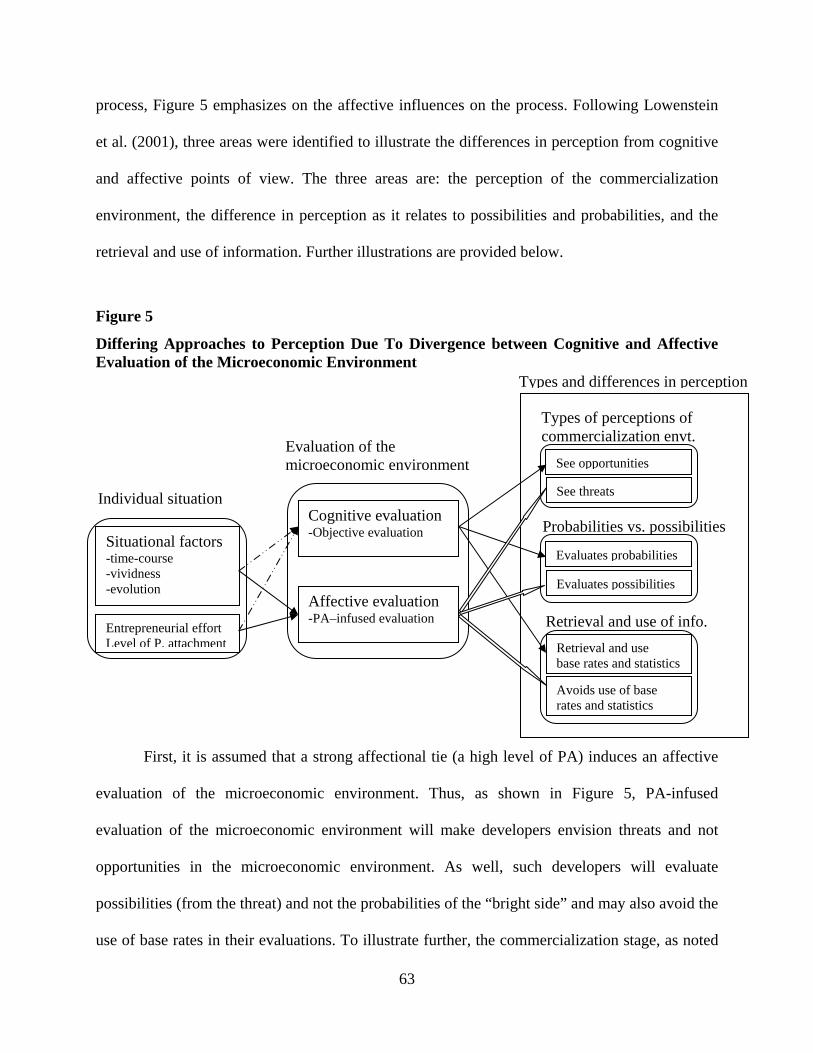
63
process, Figure 5 emphasizes on the affective influences on the process. Following Lowenstein
et al. (2001), three areas were identified to illustrate the differences in perception from cognitive
and affective points of view. The three areas are: the perception of the commercialization
environment, the difference in perception as it relates to possibilities and probabilities, and the
retrieval and use of information. Further illustrations are provided below.
Figure 5
Differing Approaches to Perception Due To Divergence between Cognitive and Affective Evaluation of the Microeconomic Environment
First, it is assumed that a strong affectional tie (a high level of PA) induces an affective
evaluation of the microeconomic environment. Thus, as shown in Figure 5, PA-infused
evaluation of the microeconomic environment will make developers envision threats and not
opportunities in the microeconomic environment. As well, such developers will evaluate
possibilities (from the threat) and not the probabilities of the “bright side” and may also avoid the
use of base rates in their evaluations. To illustrate further, the commercialization stage, as noted
Evaluation of the microeconomic environment
Individual situation
Types and differences in perception
Retrieval and use of info.
Probabilities vs. possibilities
Types of perceptions of commercialization envt.
Cognitive evaluation -Objective evaluation
Affective evaluation -PA–infused evaluation
Situational factors -time-course -vividness -evolution
Retrieval and use base rates and statistics
See opportunities
See threats
Evaluates possibilities
Avoids use of base rates and statistics
Evaluates probabilities
Entrepreneurial effort Level of P. attachment
64
elsewhere, is characterized by exposure of the idea to potential stakeholders, an exposure that
carries an element of risk due to the stakeholders’ unknown and untested motives. The developer
will naturally perceive threatening signals. As noted in Bowlby’s (1969) attachment theory, the
affectional tie increases when a threat is perceived.
Second, cognitive evaluation is based largely on the probability and desirability
associated with the consequences, while affective evaluation is more sensitive to outcomes than
to probabilities (Lowenstein et al., 2001). For example, emotional evaluations of strong positive
or negative consequences of outcomes in uncertain or risky situations will be more sensitive to
the possibility than the probability of outcomes. This pattern leads to an overweight of very small
probabilities (Loewenstein et al., 2001). Thus developers will be psychologically affected by the
possibilities of encroachment on property and appropriability rights even if property protection
and alternative safeguards such as non-disclosure agreements and trade secrecy are available.
Further, there is substantial research on the distinction between affective evaluation and
cognitive evaluation relating to probabilities and possibilities. For instance, Rottenstreich and
Hsee (2001) found that strong sensitivity to departure from impossibility and certainty (and also
insensitivity to changes in probability), are more dramatic for affect-rich than for affect-poor
outcomes.
Third, attachment will prevent the use of valuable information such as base rates in the
face of perceived adverse outcomes, even if the developer acknowledges the value of such
information. So, even if highly-attached developers realize the value of cooperation with a
potential outsider and associated potential gains, they may fail to make use of this realization and
place undue emphasis on the severity of a possible loss and less so on the probability of a
positive outcome. Concentration on the negative possibilities decreases the salience of the

65
“positive” probabilities and reduces objective and cognitive evaluation of the microeconomic
environment.
Therefore, considering the level of affective investment a developer pours into an
opportunity, a high level of attachment is expected to magnify the possibilities of negative
outcomes without full consideration of the probabilities of those outcomes. Hence, a high
attachment to the opportunity is expected to lead to a lower level of cognitive evaluation of
commercialization outcomes, most especially, when the possibility of loss is perceived.
H2: Increases in psychological attachment decreases cognitive evaluation of outcomes for the opportunity.
3.1.4. Control Tendency and Psychological Attachment
To discuss the concept of control, there is the need to first introduce the concept of
commercialization options, the point where the issue of control in this study is argued to be most
intense.
3.1.4.1. Commercialization Options
There is a variety of frameworks for categorizing options of commercialization. Gans and
Stern (2003) note that key aspects of the commercialization environment motivate start-ups to
choose between cooperative or competitive strategies. Others categorize options of
commercialization into licensing or creation of new firms (Colyvas, Crow, Gelijns, Mazzoleni,
Nelson, Rosenberg and Sampat, 2002; Shane, 2001; Shane 2002; and Neckar and Shane, 2003).
Another type of categorization is provided by Pries and Guild (2004), who argue for substance
over form and develop three categories, namely; create new business, partner with industry, or
66
sell. Yet, others look at more novel categorizations that depend on the type of technology
involved (Nicolaou and Birley, 2003).
Simplifying the options Acknowledging the variety and the strategic implications of the
various commercialization options, the simple bi-modal framework of “compete” or “cooperate”
(Gans, Hsu and Stern, 2002 and Gans and Stern, 2003) is adopted in this paper for its simplicity
and generalizability. This adoption is to orient the commercialization options to the Shane and
Venkataraman (2000) notion of entrepreneurship where successful commercialization weighs
heavily on collaboration with outside parties. The compete or cooperate framework is for
evaluating start-up commercialization strategy and patterns of competitive interaction between
start-ups and established firms. Gans and Stern (2003) contend that commercialization strategy
for start-up innovators often presents a trade-off between establishing a novel value chain and
competing against established firms, and leveraging an existing value chain and earning returns
through cooperating with others. The following is a short elaboration on the two modes of
commercialization and the modifications done to them to support the framework for this thesis.
Gans and Stern (2003) describe the option of competing as a situation where the start-up
sets up a venture on the idea to compete with incumbents. Some factors that motivate firms to
consider the competing option is the design of the technology (enabling trade secrecy –
Pressman, 1988), pioneering nature of the invention, first mover advantage (Lieberman and
Montgomery, 1988), and learning curves (Levin et al, 1987). However, Gans and Stern (2003)
argue that without seeking cooperation, start-ups may lose the opportunity to earn returns as was
the case of Robert Kearns who fought royalty payments for his intermittent windshield wiper for
decades (Seabrook, 1994, as cited in Gans and Stern, 2003).

67
Conversely, the option of cooperating is where the start-up enters into agreements with
other firms (Gans and Stern, 2003). There are many strategic options with cooperating. The
authors identify licensing, acquisition of start-ups, joint ventures, strategic and educational
alliances, milestone financing, among others. Essentially, cooperating is likely to make the start-
up disclose technical information to the established firm, weakening its bargaining position
(Gans and Stern, 2003). A possible solution is for the start-up to threaten pervasive disclosure
which will increase its bargaining power and reduce the degree of expropriation (Anton and Yao,
1994, 1995). In addition, start-ups face problems of higher search costs for appropriate partners,
unknown reputations of potential collaborators, differences in industry experience, among others.
Even though obstacles in this option may be higher, cooperating has the advantages of allowing
sellers of technology to soften downstream competition, avoiding duplicative investment, and
enhancing complementary technology development (Gans and Stern, 2003).
Commercialization options as pertains to this study In moving from the frame of
technology start-ups to technology entrepreneurs, a few adjustments need to be made to the Gans
and Stern model. Competition will imply a number of options with the extreme being solely
developing a venture on the idea while a less extreme option will entail subcontracting a part of
the value chain, e.g. manufacturing or distribution. Cooperation will also include a number of
options with extreme cooperation implying a complete sale of the idea and a less extreme option
entailing partnering with outside parties in the areas of finance, manufacturing, R&D and
distribution, among others. It should be noted that the options of “cooperating” and “competing”
are not directly operationalized in this study. However, this characterisation forms the basis of
the expectations for developers under different commercialization decision scenarios.

68
Cooperating implies sharing or relinquishing control for performance and competing implies
restricting control sometimes at the cost of performance.
3.1.4.2. Control At The Point of Commercialization
At the point of commercialization, the technology entrepreneur has to decide on what
commercialization strategy to employ. Choosing a roll-out strategy is always challenging and as
Gans and Stern (2003) put it, start-ups typically lack the knowledge and expertise needed to find
the appropriate markets for their idea and to translate their ideas into returns. However, many
entrepreneurs and start-ups make these important decisions all the time. From the foregoing, we
have seen that given knowledge constraints, uncertainty with the environment, and perceptions
of outsider’s motives as per agency theory, decisions emanate from a battle between cognitive
and affective forces. Thus, in line with the conceptual issues developed in this study, the
commercialization environment for a highly-attached entrepreneur naturally presents threats to
the developer’s control over the technology. Also, due to the affectional tie to the opportunity
there is also a high sensitivity to these threats. Thus, the primary explanation for such high
sensitivity to threats is the perception of fear of loss (of control) over the opportunity. For
instance, fear will elicit appraisals of uncertainty and lack of individual control, two central
determinants of risky judgments (Slovic, 1987). Therefore, due to such threats or fears, highly-
attached entrepreneurs must perceive a high possibility of controlling their ideas in the future, to
be openly receptive to partnership proposals from outsiders, while lowly-attached entrepreneurs
may be relatively more receptive to such proposals. In line with this preface, the following
discusses CT as a result of threat perception given a level of affectional tie (PA) to the idea.

69
3.1.4.3. The Construct of Control
Control generally refers to the extent to which an agent can intentionally produce desired
outcomes and prevent undesired outcomes (Skinner, Chapman, and Baltes, 1988). Skinner
(1996) developed a framework that classifies all constructs of control as objective, subjective or
experienced and these labels refer to connections between ‘agents’ and ‘means’, ‘means’ and
‘ends’ and ‘agents’ and ‘ends’. Further, the framework compares constructs on whether they
refer to future or past experiences and whether they have specific or general domains as their
referents. According to Skinner (1996), the classical definitions of control hinges on the
connections between agents and outcomes. Thus, entrepreneurs perceive control or lack of
control depending on their perception of the commercialization environment or expected
entrepreneurial outcomes.
This also implies that control does not need to be actual in order for it to be effective.
Research provides support for perceived or subjective control as a stronger predictor of
functioning than actual or objective control (Skinner, 1996). Therefore, an individual’s perceived
control or conviction that control is available is enough to mobilize action and modulate arousal
(Averill, 1973) as well as influence affective states and behaviour. Entrepreneurs are therefore
expected to react to perceptions of control or lack of control in the commercialization
environment. Accordingly, the concept of control hypothesized in this study concerns the desire
to control the rights to the opportunity in reaction to the perception of threats from the
commercialization environment. The control phenomenon is therefore a “drive” state premised
on the affective connection between the entrepreneur and the opportunity.
Similar control constructs This concept of desire to control in the entrepreneurial
experience shares certain characteristics with other constructs of control such as locus of control

70
(Rotter, 1966) and self-efficacy (Bandura, 1977). Locus of control is the individual’s general
expectancy of the outcome of an event as being within his or her personal control and
understanding or beyond his or her personal control and understanding (Rotter 1966). Rotter
developed the concept in studying individuals’ perception about the underlying main causes of
events in their lives. Rotter's view was that behavior was largely guided by "reinforcements"
(rewards and punishments) and that through contingencies such as rewards and punishments,
individuals come to hold beliefs about what causes their actions. These beliefs, in turn, guide the
kinds of attitudes and behaviors people adopt.
Rotter (1966) differentiated between internal and external locus of control on his Rotter
Internal-External Locus of Control Scale which measures generalized expectancies for internal
versus external control of reinforcement. Internals (with internal locus of control) believe that
their own actions determine the rewards that they obtain, while externals (with external locus of
control) believe that rewards in life are generally outside of their control and their behavior has
little effect. The scoring for the scale ranges from 0 to 13 and a low score indicates an internal
control while a high score indicates external control. Many studies have found entrepreneurs to
have more locus of control than others (e.g. Evans and Leighton, 1989; Brockhaus, 1980; Cromie
and Johns 1983; Gilad 1982; van Praag, van Sluis and van Witteloostuijn, 2004). For example,
van Praag, van Sluis and van Witteloostuijn (2004) studied interviews of 6,111 young US
citizens over a two-decade period and show that entrepreneurs had higher mean locus of control
score than employees. The authors note that having an internal locus of control positively relates
to earnings while entrepreneurs realized a higher effect than employees.
Self-efficacy is also closely related to the control concept in this study. Self-efficacy is an
individual’s self-judgments of personal capabilities to initiate and successfully perform specified

71
tasks at designated levels, expend greater effort, and persevere in the face of adversity (Bandura,
1977; 1986). Self-efficacy beliefs influence the choices people make and actions they take.
People tend to select tasks and activities in which they feel competent and confident and avoid
those in which they do not. In that sense one expects the self-efficacious entrepreneur to envisage
control over the rights to the entrepreneurial opportunity. Empirically, Krueger (2000) argues
that the perception of entrepreneurial opportunities depends on an individual’s perception that
the situation is controllable and positive.
How they differ Clearly, there are overlaps between locus of control, self-efficacy and
the concept of control as described in this study. For example, self-efficacy in the Bandura
(1977) formulation is assessed as prospective and at an extremely specific behavioural level
(Skinner, 1996) while locus of control is time-neutral and domain-specific. However, despite
these overlaps, control as conceptualized in this study is unique to the opportunity creation
context, connects past to future experiences with emphasis on control expectancies, refers to
connections between agents (entrepreneurs) and ends (outcomes) and is related to perceptions of
loss of control at the point of commercialization. In this sense, control in this study is more
influenced by context rather than individual level factors such as the personality of the
entrepreneur.
Theoretically, an entrepreneur who is affectively-invested in the process may become
control-oriented even if he or she has low self-efficacy and an external locus of control. A low
self-efficacy implies the entrepreneur doesn’t believe in the strategic importance of his or her
skills in ensuring performance while an external locus of control implies the entrepreneur
believes performance is determined by external forces and is not under his or her control. In
these cases, one expects a “rational” entrepreneur to favour cooperating with more capable

72
entities to ensure a successful commercialization. However, a high level of PA is expected to
motivate non-cooperative behavior. At worst, a highly-attached entrepreneur may shelve the idea
to prevent others from controlling the rights rather than expose it to the market.
3.1.4.4. Reaction to the Perception of Control And The Role Of PA
The control response is characteristic of emotions It has been established above that the
perception of control or lack of control is enough to mobilize action. The perception of lack of
control sets a coping mechanism into motion. Skinner (1996) identifies approach vs. avoidance
as reactions to perceptions of opportunity and loss of control. The emotional/affective connection
to control should be noted here. Frijda (1986) describes emotions as the change in action
readiness through the appraisal of a situation. Thus, emotions carry a tendency for action. Similar
to reactions to perceptions concerning control, Zajonc (1998) identifies emotional processes as
those that address the ‘go/no-go’ questions (that lead to approach/avoidance behaviour), while
cognitive processes are those that answer true/false questions. Thus, we see that behavioural
reactions conceptualised for control and emotions are identical: approach vs. avoidance.
Control as a coping strategy Skinner (1996) identifies two coping strategies in response
to threats and loss of control: primary control and relinquishment of control (Heckhausen and
Schulz, 1995; Rothbaum Weisz, and Snyder, 1982). Primary control relates to the individual’s
attempt to change the environment to fit his or her own desires and wishes while relinquishment
of control relates to the voluntary yielding of control to another person (Burger, 1989). In
general, when people perceive a high degree of control there is a general sense of action
orientation where they exert more effort and are optimistic (Skinner, 1996). When people
perceive less control, they withdraw, become fearful, pessimistic and distressed (Skinner, 1996).

73
In related literature in health psychology, positive affect elicits approach strategies while
negative affect elicits avoidance strategies in dealing with stress (Carver, 2001). Further, across a
number of domains, a number of theories illustrate the approach-avoidance behavioural tendency
although most of these theories typically assume a conceptually cognitive paradigm. The theories
include loss aversion (Kahneman and Tversky, 1979); risk aversion (Camerer, Lowenstein, and
Rabin, 2004); regret aversion (Bell, 1982; Loomes, and Sugden, 1982, 1987); and protection
motivation theory (Rogers, 1975, 1983; Boer and Seydel, 1996).
Similar coping-strategy theories The following are short descriptions of these theories.
In each of the descriptions, one observes the notions of approach and avoidance in reaction to the
level of risk and uncertainty perceived. In prospect theory3, Kahneman and Tversky (1979)
describe loss aversion as the tendency for individuals to strongly prefer avoiding losses to
acquiring gains. Much research evidence on this theory put the weight of losses at about twice
that of gains in their psychological effects. Risk aversion could be described as the reluctance of
an individual to accept a bargain with an uncertain payoff rather than another bargain with more
certain, but possibly lower, expected payoff. Research in behavioral finance (see Camerer,
Loewenstein and Rabin, 2004) considers risk as the degree of uncertainty associated with the
return on an asset. Regret theory (Bell, 1982; Loomes and Sugden, 1982, 1987) says that
individuals anticipate regret when they think of making a wrong choice and this anticipation is
considered when making decisions. The fear of regret can therefore lead to risk-seeking in
attempt to breakeven and risk aversion in a threat-coping fashion. The last is the protection
motivation theory developed by Rogers (1975, 1983). Rogers (1975) first developed the theory
3 A descriptive theory of risk taking in which individuals, due to diminishing sensitivity for absolute quantities, are both risk averse for gains and risk seeking in the domain of losses. An important metric is reference-dependency where changes in the reference point often lead to reversals of preference (Lichtenstein and Slovic, 1971; Tversky and Kahneman, 1991). Thus, evaluation and perception of the decision outcomes will depend on the initial wealth of the decision maker.

74
to explain fear appeals and extended it into a cognitive model for studying the effects of
persuasive communication on behaviour (Rogers, 1983). The protection motivation theory
describes adaptive and maladaptive coping with a health threat from two appraisal processes
(Boer and Seydel, 1996). An individual resorts to a threat and a coping appraisal process leading
to adaptive responses such as protecting oneself or maladaptive responses such as failing to
protect oneself.
Focusing on loss aversion theory The loss aversion theory is closer and more
appropriate to the mechanisms advocated for PA and CT in this study. Therefore, it better
illustrates the approach-avoidance mechanism since decisions relate to the perception of threats
(such as the threat of loss) in the commercialization environment. In effect, there is the need to
elaborate a little on it. One implication of loss aversion is that individuals have a strong tendency
to remain at the status quo, because the disadvantages of leaving it loom larger than the
advantages. In experiments, Burmeister and Schade (2007) find that entrepreneurs are as
affected by the status quo as students but less affected than bankers. Some studies show that fear
or myopic loss aversion causes employees to forgo substantial financial gains by investing their
retirement in safe bond or money market funds rather than in equities even though the long-term
return of equities is often many times higher (Benartzi and Thaler, 1995; Gneezy and Potters,
1997; Thaler, Tversky, Kahnerman and Schwartz, 1997).
In relation to this study, when entrepreneurs perceive loss of control, avoidance strategies
will include preferring or choosing among commercialization strategies that preserve prior
control (the status quo) and avoiding choices that reduce prior control. In addition to influencing
the commercialization stage the control tendency also applies to the development stage of the
opportunity where entrepreneurs may avoid outsiders who by virtue of their contribution may

75
acquire part-ownership of the innovation. Such outsiders will include design or fabrication
experts who propose significant changes to the design as well as financiers who contribute
substantial development funds. Anecdotal evidence from personal interviews with Canadian
inventors indicates that some will rather avoid such partners and delay the development process
despite being aware of the potentially-adverse implications for the technology. However, most
concede that due to current regrettable experiences; they will consider partnering or collaborating
on their next project at an early stage.
Further, one relevant and related research area where the loss aversion theory is
employed is the endowment effect phenomenon. The endowment effect concerns the increase in
the value of a good and therefore resistance to exchange the good when it becomes a part of a
person’s endowment (Kahneman, Knetsch, and Thaler, 1990, 1991; Thaler, 1980). Several
studies suggest that emotional attachment, through loss aversion, plays a role in the endowment
effect (Ariely and Simonson, 2003; Carmon, Wertenbroch, and Zeelenberg, 2003; Dhar and
Wertenbroch, 2000; Strahilevitz and Loewenstein, 1998; Ariely, Huber, and Wertenbroch, 2005).
Following this view, the argument for the effect of PA on CT will be stronger in the
entrepreneurship case than in the endowment effect case. I cite this evidence again: Norton and
Ariely (2005) show that people value goods more highly when they invest their own labour in
creating them. The authors show that novices who make origami value their creations as highly
as those made by experts and, individuals who make self-built Legos value it more highly than
sets built by others. Generally, an individual’s reaction towards the good/object will be similar in
both cases. However, in the entrepreneurship case, the good is not just endowed to the individual
but is self-conceived and developed by the individual. In other words, if individuals are so
unwilling to part with an endowed good, one will expect a higher level of unwillingness to “part”

76
with control over a created object, an object of ones labour and investment of self, as in the case
of the entrepreneur.
In the forgoing, it was established that the perception of loss can influence a CT, leading
to avoidance behaviour. I conclude the section with a summary of the mechanism through which
PA will influence CT in the evaluation of the microeconomic environment, during
commercialization attempts. I use Figure 6 to provide a graphic picture of this summary. Figure
6 provides the processes that developers will go through from the opportunity recognition and
development stages to the commercialization stage and the affective mechanisms for the effect of
PA leading to a CT.
Figure 6
The Effect of Psychological Attachment on Control Tendency
Affective experiences during opportunity recognition and development contribute to an
affectional tie between the entrepreneur and the opportunity. In line with attachment theory, the
Commercialization environment
Perception of a threat of loss (of opportunity or control of opportunity)
Sensitivity to threats Perceptions of control or lack of control
Seek more or less control
Transaction cost problems
Psychological attachment Control tendency
Opportunity recognition and development
Avoidance and approach
Psychological Attachment

77
PA is assumed to lead to a higher sensitivity to threats from the commercialization environment
(shown in the left panel of Figure 6). The commercialization stage presents a very strategic point
in the technology entrepreneurial process where important decisions need to be made about what
market options to adopt. Due to the latent sensitivity to threats (middle panel of Figure 6),
transaction costs, the issues with information asymmetry, etc, the developer is primed to sense a
possible loss of control in future interactions with outsiders (as seen in right panel of Figure 6).
The threat of loss and the complicity of agency problems initiate a coping mechanism which
urges avoidance of strategies that relinquish control of the opportunity and reduce the affectional
tie with the opportunity (right bottom panel of Figure 6). In other words, a threat of loss
introduces a tendency to seek control. Thus, since the affectional tie encourages sensitivity to
threats, an affectional tie (PA) will generally motivate a CT (middle bottom panel of Figure 6).
However, the presence of an actual threat is expected to increase CT further.
H3: As psychological attachment increases general control tendency increases
3.1.5. Moderated Relationship between Psychological Attachment and Control
As already noted, the threat of loss is expected to influence the perception of future
control or lack of control in the commercialization environment. The argument was that, issues
of, and concerns about, transaction costs emanating from economic situations such as
asymmetric information and perceptions of loss of control will provide threatening signals. In
effect, threat is treated as a moderator of the relationship between PA and CT. When the
perception of threat is high, a stronger relationship between PA and CT is expected. The
following discusses the two main types of affective responses or emotional reactions to

78
perceived threats: anticipatory and anticipated responses (Loewenstein et al., 2001). The
illustrations employ the specific-emotions approach4 rather than the global positive-negative
valence approach (Johnson and Tversky, 1983; Wright and Bower, 1992). Specific emotions
have been shown to elicit specific appraisals (Lerner and Keltner, 2000, 2001; Tiedens and
Linton, 2001) and are appropriate for this study since the concepts of PA and CT will elicit
specific affective reactions such as fear and dread. Figure 7 presents an illustration of the
moderating effects of anticipated and anticipatory emotions on the relationship between PA and
CT.
Figure 7
The Moderating Effect of Threat Perception on the Relationship between PA and CT
3.1.5.1. Moderating Effect of Anticipated Emotions on the Relationship between PA and CT
Anticipated emotions are emotions that are not currently experienced but are expected to
be experienced in the future. Research on emotion and rationality (Elster, 1996, 1998) as well as
emotions and decisions under risk and uncertainty (Bell, 1982, 1985; Loomes and Sugden, 1982,
1987; Mellers et. al., 1997, 1999) employ this category of emotions. Essentially, people are seen
as “consequentialist” in the manner in which they consider the future in making some decisions 4 Studies on emotions in recent years argue for the importance of studying specific emotions (DeSteno, Petty, Wegener, and Rucker, 2000; Lerner and Keltner, 2000, 2001; Tiedens and Linton, 2001; Lerner, Gonsalez, Small, and Fischhoff, 2003). One example is the appraisal tendency theory (Lerner and Keltner, 2000). This approach moves away from past research, which modelled emotions in a global positive-negative valence paradigm (Johnson and Tversky, 1983; Isen and Patrick, 1983; Wright and Bower, 1992). For instance, Lerner and Keltner (2001) show that fear and anger influence judgments of risk in opposite ways. Thus, fearful individuals make pessimistic judgments about future events while angry individuals seem to make optimistic judgments.
Psychological attachment Control tendency
Threat related affect/emotions -anticipated/anticipated
79
in the present (Loewenstein, et. al., 2001). Typical emotions that are expected to be experienced
considering the future outcomes of present decisions are disappointment or regret that may arise
from counterfactual comparisons (Bell, 1982, 1985; Loomes and Sugden, 1982, 1987; Mellers,
Schwartz, Ho and Ritov, 1997; Mellers, Schwartz and Ritov, 1999; Baron, 2000).
For instance, entrepreneurs making decisions within this framework may be reluctant to
adopt a strategy of cooperating with an outsider, fearing expropriation or infringement on the
rights to their idea. Such reluctance might result from perceived disappointment and regret in the
future states considered. Thus, entrepreneurs may seek to control the situation to avert perceived
undesirable outcomes. As noted by Skinner (1996), control tends to be considered in terms of its
effectiveness in interactions with the environment. As a result, control outcomes have often been
equated to changing the external world to fit the demands and wishes of the individual
(Rothbaum et al., 1982) and also when dealing with the multiple consequences of the outcome.
H4a: Anticipated emotional reactions to perceived threats will positively moderate the
relationship between psychological attachment and control tendency
3.1.5.2. Moderating Effect of Anticipatory Emotions on the Relationship between PA and CT
Anticipatory emotions, however, are immediate visceral reactions and mood states such
as fear, anxiety, worry and dread of uncertainties and risks. The “moment of truth” when the
entrepreneur has to decide on a commercialization option, given perceptions of threat in the
market environment, is likely to evoke emotions that will affect the choice made. Affective states
enable individuals to seek mood-congruent information (Bower and Cohen, 1982; Blaney, 1986).
As well, affective states influence the content of information retrieved, e.g. happy people report
80
higher probabilities on positive events (Wright and Bower, 1992) and affect the process of
information retrieval, e.g. complexity reduction (Isen and Means, 1983). Baron (2008) cites
similar work in his review of the role of affect in entrepreneurship.
Further, for entrepreneurs, anticipatory emotions will take input from memories from the
development period. Difficult, exciting, and anxious experiences of self or others during problem
solving and feasibility studies may stay in the entrepreneur’s limbic system5 and be evoked by
perceptions of threat. Adverse experiences are expected to loom larger and stay longer than
pleasant ones. For instance, Lowenstein et al (2001) note that fear responses could be evoked by
crude or subliminal cues and fear conditioning may be permanent or last longer than other types
of learning. Thus, in addition to pleasant memories, adverse circumstances resulting from
persistence in the development of the opportunity such as divorce or bankruptcy may result in
precautionary and self-protective behaviour (safeguarding the idea – the only consolation left).
Studies have shown that individuals tend to develop precautionary and self-protective behaviour
towards issues where they have previously had a personal experience that led to adverse
consequences (Kunreuther, et al., 1978; Weinstein, 1989; Browne and Hoyt, 2000).
H4b: Anticipatory emotional reactions to perceived threats will positively moderate the
relationship between psychological attachment and control tendency
This chapter introduced the constructs, outlined conceptual underpinnings and provided
expected relationships between the constructs of psychological attachment, cognitive evaluation,
5 The limbic system is a term for a set of brain structures including the hippocampus and amygdala that support a variety of functions including emotion, behaviour and long term memory http://en.wikipedia.org/wiki/Limbic_system Accessed March, 20, 2008

81
and control tendency. The next chapter identifies methodological issues and statistical analyses
of the theoretical positions and predictions outlined in Chapter 3.

82
Chapter 4
4.1 Methodology and Analysis
4.1.1. Domain of Study
There are a number of decision making areas in the commercialization or market entry
domain where the behavioural effects of PA and CT can be studied. However, due to the nature
of the constructs involved (such as attachment and control), there was the need to consider
laboratory-type studies where the potential effects of alternative hypotheses could be minimized.
Prior to describing the study population and the rationale for the sample choice, the following
provides insight into preparation for conceptualization of the constructs identified.
4.1.2. Preliminary Work
A background study on CT included a study of responses to two sets of semi-structured
interviews, one with 13 actual independent inventors and the other with a sample of subjects
used for this study (post-study). The independent inventors were selected randomly from a pool
of 1,776 independent Canadian inventors based on close proximity (driving distance of 150 kms)
to the interviewer. The interviews were mainly unstructured, but with probing questions on the
origins of the idea; development and financing; the inventor’s personal situation and experiences;
plans developed and actions taken; expectations for the invention; achievements,
disappointments and failures, market outlook and future plans. On the question of what triggered
the idea, the respondents recounted stories of conceiving the idea from recreational endeavours,
house chores or professional experience. Most of the descriptions indicated ‘Eureka’ kinds of
moments during the inventive process: the type of moments that can spur emotional attachment.
Further to that, the interview transcripts also showed signs of the emotional attachment affecting

83
or playing a role in the decisions that inventors made. In the following accounts, I provide
portions of transcripts on various issues in the commercialization process.
Independent Inventor interviews The first issue deals with inventors’ reservations about
members of the value chain such as manufacturers and distributors. Almost all the respondents
whose products were near or at the market stage expressed some reservations towards the
distribution and marketing channels. One respondent, having pulled his product off the shelves
due to dissatisfaction with returns, had this to say about his search for a new distributor: “……so
I’m still in the process of finding that perfect relationship corporately”. The product in question
was a simple household fixture with very little potential for long term market success. Without a
patent and being very easy to copy, the product did not possess characteristics that afforded a
pause in sales for any length of time. Hence the decision to pull it off the market and spend a
considerable period of time searching for a new distributor was economically inefficient.
The second inventor commented on a similar situation. He had stocks of supplies for his
product in storage at the time of the interview and marketing efforts had seized for a long time.
This is what he has to say: “Yes, there’s that issue [not wanting to discuss with outsiders] again,
and do I want to go through that?, because I would kick myself if I did do that and the product
was then developed by somebody else, and I’d be left with nothing”. Asked if trying to get a
distributor was not a better strategy than hording the pieces in storage, he responded “I suppose,
I don’t want anyone else benefiting from it without me…but, I don’t know, maybe I just don’t
trust people enough, I just, and maybe that’s part of my problem, I have to get over that hurdle
but, I don’t know, I don’t know what I am going to do”
Another inventor made comments concerning intellectual property (IP) protection which
is instrumental in discussions with outside parties. Normatively, IP protection is expected to

84
increase cooperation due to the IP strengthening the inventor’s bargaining power. A patent on the
idea should assure and encourage the inventor to be willing to engage a host of outsiders with the
aim of finding an efficient commercialization strategy. However, the transcript from this inventor
suggests otherwise: “………you know, when you start an idea and you start a product and
you’re using…and you apply for intellectual property protection and you get patents granted in
the United States and Canada and you get trademarks granted in United States and Canada,
you’re pretty close to the idea and you are pretty close to the product and you are very leery
about who comes in to work with you and you want to protect it…. so was I over protective and
missed out on some opportunities?, maybe, I don’t know”
One striking note to make of this inventor’s comments is that he starts being “protective”
after obtaining patents, not before. The implication is that IP protection reinforces that feeling of
ownership and the claim over rights to the idea, evoking protective tendencies that are
characteristic of PA. As noted above, a stronger bargaining position from IP protection was
expected to make the inventor “open” to outsiders and not be overly protective. The respondent’s
partner continues: “Well, probably we did because when you are trying to keep everything close
to, close to yourself, you sometimes get a bit of a tunnel vision and you don’t see that maybe
there are…but again, it’s the caution thing where you are being cautious, maybe a little too
cautious, and probably, if you were…just in hindsight today...I think that we would look at
bringing someone in, maybe to ease some of the financial burden, but again, it’s got to be
someone that you totally trust and is pretty much thinking…either they’re thinking along the
same lines as you and they are a partner as such, or they’re just a silent partner and don’t want
anything to do with it” The last parts of the response point to the need to consider level of trust in
control and sharing decisions. The influence of trust was introduced and briefly discussed in the

85
literature review sections of this thesis and included as a control variable in the analysis section.
However, since respondents are being asked to respond to hypothetical scenarios, disposition to
trust and not actual trust was operationalized.
In another transcript, the inventor commented on his feelings towards commercialization
efforts that may tarnish his personal image through a reduction in the quality of the product.
Although logical and expected, his concerns indicate a level of connection he shares with the
idea which I believe points to a possible attachment. When asked whether his want of control
over the idea was responsible for his seemingly low tolerance for cooperation, the inventor had
this to say: “I would say, yes. And I’m [control-oriented]…and as years pass I get less and less
concerned about it. Certainly at the beginning I had to control everything…..if I were to have it
made in China I would be very concerned about product quality. Because I do look at it as its
got my name written on it and I want it to work as I would expect it to work when a consumer
picks it up, pumps it up and down in the tub, I expect it to work for them. So yeah, I take it very
personally. That’s one of the reasons I don’t do any of the sales…I do very few sales calls.
There has been some, where they want to speak to the guy who made it. And I have been a little
bit involved in the whole Canadian Tire thing. But I typically leave all of that up to my wife and
to my buddy [name omitted] because in the sales business there’s tons of rejection. And I hate
it…because you are beating up on my baby“. This response also shows the difficulty with which
inventors take critical evaluation of their creations. It has the potential to determine their level of
susceptibility to feedback from evaluators. If inventors tend to dismiss critical but useful
evaluation feedback, because it stabs their ego, their ability to improve on their inventions will
be limited. On another hand, the inventor’s response suggests that his control orientation
decreased over the years. This is an interesting point that’s not discussed in this thesis.

86
In addition to aversion to manufacturers, distributors and potential imitators, inventors
indicated reservations towards financiers taking control of their ideas. The perception of losing
control is instrumental in this study in terms of the commercialization strategies that inventors
adopt. In this example where the inventor talked about financing the commercialization effort, he
had this to day; “We’ve also looked at Venture Capital and different people like that. But to go
into that level is an entrepreneurial step back because they basically want 3/4 of the company,
right? So you kind of go, no I don’t really think I want to go there”. There was a clear reluctance
to consider venture capital (VC) funding due to reservations towards high VC equity stake
conditions. In effect, the VC agent’s ability to raise the much needed funds for the company is
entirely ignored. High attachment is capable of blurring the perception or even knowledge of an
outsider’s potential to support commercialization goals.
Similarly, another inventor who was initially more accepting of VC financing reported
disappointment with the process at the end. This inventor had spent about 20 years developing
various improvements and applications of the idea. Rather than resisting cooperation, this
inventor embraced cooperation and regretted doing so. “In our attempts to get funding in
Vancouver, people in Seattle became aware of this and they ended up funding,...they put in
$3million… we moved, shut down the operations in Guelph, moved it to Seattle and they took
control of the whole thing. They eventually sold it for 20 million dollars and [the firm] is now
going to commercialize it. But in the process I lost control and my net financial reward for this
was $170, 000. So the inventor did not get well rewarded at all. Fortunately this is only first of a
series of technologies and I’m now working on the next ones with the hope that having done it
once it should be easy to do it a second time. The Ontario Government is acutely aware of all
the problems I had. They watched as I had to shut down the Guelph operation and had to move it

87
all to the west coast, and were unable to do anything to help. But it’s being used in example now
why government programs should be changed to try and encourage this type of thing happening
in Ontario, rather than moving it”
The inventor’s decision to cooperate was influenced by the choices he had available at
the time. Rather than hold on to control and risk bankruptcy, he decided to cooperate with
potential financiers risking takeover of control from him. However, the loss of control initiated a
set of events that created discontent: “When you lose control, you have no bargaining power at
all, and we lost control when the Americans put the money in……. there was no choice. It was
either that or go bankrupt. If you go bankrupt, then they pick it all up for nothing. So, we just
weren’t in a strong bargaining position, we just could not raise the money and by the time we
raised it, we were out of it. And a lot of these investment people, the venture capitalists, enjoy
this messiness; it just increases their leverage. So they made their fantastic returns. Out of the
$20 million, the guy who put the $3 million in, he got $12 million. The guy they put in as CEO
got $2 million, so there’s 14 of the 20 million gone right there. The US government took 2
million in taxes, so we’re down to 4 million,… that is what we got out of the whole thing, the
Canadian group and over those years we put in it, we put in about $4 million so we got our
money back, big deal!
…………. No incentive at all, very frustrating. But, better to see technology go than to have it
just fail. It’s a nightmare, an absolute nightmare. The biggest frustration is the money people are
only interested in one thing…making money. They don’t give a damn about anything else. So
they don’t care that I can’t carry on, they don’t care about job creation, they don’t care about
anything, they just want to make their money. They get their 40% rate of return, bang!, that’s
what they want, and they are out of it and they’re gone and they are on to the next deal. And the

88
government, if they are going to do anything about encouraging innovation and
commercialization and have it stay here in Canada, they’ve got to address some of these
problems head on. Up to now, they have not been able to address the problems that need to be
addressed”
Clearly, VCs want good return on investment and their actions may not necessarily
constitute attempts to expropriate returns from inventors. Once a venture financing process goes
through multiple stages, share dilution is expected to leave the inventor with low and
unsatisfactory returns. However, of particular interest is being aware and perceiving this situation
prior to closing financing deals. Accurately reading the VC capitalization sheet will show the
extent of share dilution and associated returns at the end of the day. However, it is likely that the
discontent will creep in at the end when the returns are compared with the investments.
Nevertheless, the interesting point is that inventors who are able to predict their reaction or
feeling at that end state might reconsider the decision to accept VC investment (see from the
empirical evidence presented earlier). Therefore, although VC financing of some inventions is
the most appropriate route to commercialization, the perception of VC “expropriative”
tendencies may leave many inventors wanting to avoid them and explore sub-optimal financing
avenues.
The last issue identified in the inventor interviews is the indication that some inventors do
perceive their attachment to the idea or want of control over the rights to the idea as well as the
possible negative consequences on decision making. For an illustration, this inventor noted that
he was making efforts to emotionally disengage from the project: “I am trying to remove myself
from my idea because I know how dangerous it is to be possessive of it. I am ready to listen to
people’s views even if I won’t act on them”. The danger many inventors face is the ability to

89
realize their strong commitment to their ideas and its potentially negative effects on decision
making, yet do nothing to counterbalance with objectivity. Realizing the attachment, this
inventor perceives the potential to err in assessing commercialization options and therefore
decides to remove self from the idea to allow a more effective evaluation of commercialization
issues. His attitude points to a potential remedy for control-oriented behaviour being
disengagement from the idea. This concept is not researched in this thesis.
Study subject interviews The second set of interviews involved five (5) individuals from
the pool of subjects used for this study. The subject pool is taken from a final year engineering
design class in one of Canada’s top technology-oriented universities – University of Waterloo.
Subjects worked in groups of four or five to develop a novel idea with proven consumer need.
The sample is described in more detail in the next section. However, the interviews were
conducted after the study and interviewees were asked to respond to questions on the origins of
the idea, experiences during the development process, instances of excitement and frustrations
and their personal views on PA and CT; with respect to their own experiences and with respect
to the experiences of others.
Most of the descriptions pointed to technological innovation. One respondent noted: “The
intent was to come up with a high-tech solution with some marketing potential”. Respondents
indicated that attachment was likely if the idea was something they were passionate about from
the beginning rather than if it was suggested by someone else in their group. One respondent
commented: “Personally, I'm not too attached to the project. It wasn't the idea that I came up
with…the one I was most excited about.” Respondents indicated that they believed people could
be attached to new ideas in which they invest. Sample responses were as follows. “I think that
people do, depending on their interest in the idea. If my group were still doing our 2nd idea

90
[which I was most interested in], I would have been more attached to it.” Another commented,
“It depends on the motivation behind their development. There can conceivably be three in my
opinion: something to pass the course, something to market, or something revolutionary... the
last motive will definitely cause emotional attachment. I think any could apply to any group,
depending on the idea they came up with in time for the proposal submission.”
The respondents were also of the view that the projects may not involve the high level of
investment expected of full-time technology developers so attachment might not be high.
However, they indicated that they believed emotional investment in the idea may develop an
attachment to the idea and there was the potential for this attachment to affect the decision
making process with likely dire consequences. One respondent commented: “I don't think it's
beneficial to keep control for emotional reasons. It should depend on interest and potential
revenue”. Another commented: “I'm not sure... My father is an entrepreneur, and I know how
attachment limits marketing potential due to insistence on control and resistance to sharing. It
will depend on how the majority of the group feels. If enough people want to participate in future
development, we will keep control, otherwise, perhaps we should sell all of it”. Clearly, although
respondents wouldn’t say they were highly attached to the idea (social desirability effect) they
perceive the possibility of attachment to the project and also realise that attachment may have
negative consequences on revenue generation. Two samples of these transcripts are provided in
the Appendix 3. Together, these two sets of interview cases (independent inventors and subjects
in this study) provide insight and anecdotal support for the concept of CT and PA at the
commercialization stage while informing on elements that aided in the development of the
experimental conditions for studying the phenomena.

91
Secondary search effort To complement the first-hand anecdotal evidence of attachment
and control in idea and venture creation, a search was conducted on Proquest research database
through the University of Waterloo library website. Keying in the words “invention” and
“inventor” and indicating multiple databases as search source, Proquest provides pages of
academic, business and regular articles (on empirical studies and business cases), as well as news
items (on inventions and inventors). Empirical research publications often referred to
cooperation with outsiders as a strategic approach to commercialization while business articles
often cited idea developers’ want for control to attain pecuniary and non pecuniary gains even
when they lacked the resources to do so. For the subjects in these stories, if by a stroke of luck,
or extraordinary execution of strategy, they succeed, they were hailed as entrepreneurial heroes.
Idea creation was also often described as a positively and negatively exciting process with stories
depicting Eureka moments, emotional attachment, perceptions and exaggeration of threats,
overcoming threats in various ways –many of the notions that have been expressed in theorizing
PA and CT in this study.
There were stories on perseverance both at the individual and at the corporate level,
perseverance which is likely to result from a certain level of attachment and be impacted by
affective influences on behaviour. On the corporate level, the accounts were sometimes on
“product champions” such as in the Sony Walkman and 3M’s Post It Note cases where the
champions defied business analysts’ negative feedback and pressed on to push the ideas to
market. In the case of the Sony Walkman, the perseverance of its product champion, Akio
Morita, is well noted. He is reported to have said: “I do not believe that any amount of market
research could have told us that the Sony Walkman would be successful, not to say a sensational
hit that would spawn many imitators”. Clearly, the product was successful due to encouraging a

92
latent consumer need by providing people with an innovative product they hadn't known they
needed. In the case of the Post It Note, there were accounts of perseverance on the part of Dr.
Spence Silver, inventor of the adhesive, Arthur Fry, who discovered the Post It application, and
Geoff Nicholson, the product champion in upper management (all of the 3M Company).
Through their individual and collective perseverance they were able to chart a winning course
through the corporate minefield despite the “doomed to fail” predictions they received in
feedback. Fortunately in their case, the product was successful and is one of 3M’s famous
inventions.
Accounts of individual cases of perseverance, most strongly explainable by some type of
attachment to the idea, were also available. There is the story of Thomas Edison, the inventor
accredited with the invention of the light bulb, who is also noted for saying “invention is 95%
perspiration and 5% inspiration”. Despite reports of rampant failure in developing inventions,
Edison is widely regarded as a very accomplished and successful inventor. Others were not so
lucky. One such account is the story of Robert Kearns who waged a protracted legal battle
against auto manufacturers for hijacking his intermittent windshield wiper technology. After
winning and losing some of the cases, his net winnings went to pay legal fees. His frustrations,
the various reports noted, were because “He had hoped not just to collect royalties but make the
devices himself”. One of the US district judges who presided over five of his trials was reported
to have said "His zeal got ahead of his judgment." Finally, there was the story of a Chicago man
who shot and killed three people at a law firm in 2006. The Chicago Tribune reported that
“sources said they believed the shooter was a disgruntled former client of the attorney he had
asked to see. Joe Jackson, 59, told police, before he was shot, that he had been cheated over a
toilet he had invented for use in trucks”. Although there may be other factors involved in the

93
shooter’s behaviour, the story is an indication of how far some people will go to protect the fruit
of their creative endeavours.
On the whole, the preliminary exercises provided insight into the creative process,
concerns, issues, organisation, and management of the creative environment. Such insight was
useful in helping identify appropriate and fitting concepts to investigate for this study. It was also
useful in providing motivation for arguments and ideas on how to operationalize concepts
theorised.
4.1.3. Participant Population
The participant population for the study is made up of students recruited from the area of
engineering design. The rationale for recruiting from this population was to ensure that subjects
were all at an equal level of creative endeavour and were developing products that had minimal
technical variability. Specifically, the study sample was from the ECE 492A class of the
University of Waterloo (UW) (see Appendix 4 for more details on design projects). Subjects
were engaged in opportunity identification and development in a manner close, in process, to
what actual technology entrepreneurs encounter. The project curriculum requires that students
develop a novel design project following strict design rules. Project deliverables include a project
specification, design block verification, a detailed design, prototype testing, prototype
demonstration, and an experience report6. The projects are developed in groups of four or five
and receive support in the areas of lab space, machine shop, educational discounts, student
research funds and sponsorship in-cash and in-kind from companies such as Microsoft or
through the university. The groups are also given direction on patenting and commercialization
6 http://ece.uwaterloo.ca/~ece492a/ accessed Nov 17, 2007

94
by firms associated with the program after development. At the time of the study, they had not
received any such direction.
The subjects engage and develop their design projects in an environment with a high
level of commercializable research productivity. The indication is that the quality of the projects
is high and the commercialization of successful projects is encouraged, mostly due to the
“creator owns it” intellectual property policy of the university. To gain an understanding of the
technology environment of the university and the impact of its intellectual property, consider a
report that was produced by PricewaterhouseCoopers (PwC) in 2001 from an effort to document
and quantify the economic impact of UW on the economy of the Waterloo Region. Comparing
with a 1999 Statistics Canada report, the PwC report indicates that UW accounts for over 22% of
all spin-offs in Canada, generating over 100 of the 454 spin-offs from 84 universities across the
country. The report indicates that when the definition of the transfer of technological resources is
broadened to include the transfer of intellectual resources, 250 spin-off companies with some
level of attribution to UW were identified. Essentially, UW boasts of a more than 25-year old
legacy of spin-off companies including reputable companies such as Waterloo Maple, Open Text
Corp. and Dalsa Inc.
The university also has the largest co-operative education enrolment of any university in
the world, enrolling about 10,000 students across multiple faculties in the year 2000
(PricewaterhouseCoopers, 2001). Among prominent beneficiaries of this coop system are
Microsoft, Google and RIM, makers of Blackberry (RIM is also located one block away from the
university). In fact, the coop option is mandatory for the subject group and they are expected to
complete a minimum of six (6) work terms (2 and a half years of work experience) throughout
their undergrad studies. By the time of conducting this study, the subjects would have completed

95
a minimum of four (4) work terms and an average of five (5). The coop placements equip
subjects with different skill-sets as they are exposed to engineering design tools in industry.
Further, the flexible intellectual property policy of UW, the spin-off track record of UW
and the coop experience of the students has implications for the projects they develop. On such
implication is that most projects will have a considerable commercialization value and some of
the groups or developers will endeavour to develop ventures on their projects. Although there is
no hard data on the number of projects attempting commercialization or leading to start-ups, the
ratio is considered to be close to 50% if not more (personal conversation with program director).
From this viewpoint it is not unreasonable to posit that the quality of some, if not a significant
number, of these projects match the average quality of technology innovations developed by
independent inventors or start-up project teams in industry. Hence the sample group provides
significant benefits in terms of costs and access, etc, to studying the concept of attachment in
technology entrepreneurship.
Further support for the relevance of the subject group emanates from the approach to the
formation of the groups, which bears similarity to the structure of technology teams or start-up
firms. Post-survey interviews revealed that most project groups are set up by individuals who
had recognized an opportunity and needed “experts” to form a team to develop the idea. Thus,
group members typically possessed complementary skills in the different areas of product
engineering. However, the group efforts threaten biasing the subjects’ responses due to different
kinds of group psychological effects or biases. To prevent or reduce these biases, survey
questions elicited individual evaluations and subjects were instructed to concentrate on their
individual perceptions and discard any group views they might hold. Subjects were also asked to
provide an amount of money they are willing to pay (willingness to pay) the other team members

96
(excluding themselves) to acquire total ownership of the project technology. The procedure of
thinking about the task and writing down the amount is expected to evoke a sense of ownership
that will encourage individual judgement in the survey. In addition to these characteristics of the
sample, the subject pool also theoretically ensures variance in the attachment measure since
some students are normally actively involved and heavily emotionally invested in the project
while others are not.
4.1.4. Descriptive Analysis: Participant Population
Survey Online surveys were sent to subjects twice with email reminders sent on a weekly
basis for a period of three weeks. The first survey captured background and control factors and
the second captured research measures identified for the study. The second survey was sent two
weeks after the first ended. At the end of the second survey, of 248 contacts, 106 students
responded culminating in a response rate of 43%. Out of the 106 responses, 89 students
completed the surveys with 60 participating in the first and second while 29 participated only in
the second. There were no significant differences between those who participated in both surveys
and those who participated only in the second survey. Also, dividing the sample between ‘early’
and ‘late’ respondents, led to no significant differences between the groups.
Descriptive statistics The average age of subjects was 22 years, 83% were men and 17%
women. The average number of hours spent on the project per week was 14 hours (Std. Dev.=
12). More projects (30) fell within the “hi-tech equipment” category (21%) than in any other
category. This category was followed by household or general consumer products, then games or
toys, sports or leisure, and security or safety products. See the distribution of projects in the
various categories in the Table 1 below. Subjects were allowed to choose more than one category
and therefore there are multiple choices for the categories.

97
Table 1
Descriptive Statistics of Industries Categorization for Projects
Industries – categories N % Environmental or Energy 6 4 Automotive 10 7 Sports or Leisure 16 11 Games or toys 16 11 Medical or health 11 8 Tools 6 4 Household or general consumer products 23 16
High tech equipment 30 21 Security or safety 16 11 Industrial equipment 4 3 Other 8 5
Total 146 100
Participants generally ranked their knowledge of commercialization as low (Median=2,
Std. Dev = 1) on a five-point Likert-type scale. The results are provided in Table 2 which shows
percentages of subjects distributed among options of how much they knew about
commercialization prior to the study. The question was “on a scale of 1 to 5, rank your
knowledge of commercialization and attendant issues prior to this study. About 63% reported
knowing “little” (2) and “very little” (1) with 20% being neutral (3) and 16% knowing
“something” (4) and 1% knowing “everything” (5). For those who indicated knowing about
commercialization, in the two latter cases, their knowledge was gained from the following
sources: 26% read about it, 20% attended a talk or seminar where commercialization was
discussed, 11% took a course in which commercialization was incorporated, 24% did personal
research, 20% learned about the topic on the job while none of the subjects had a personal
commercialization experience. Clearly, subjects did not know much about commercialization
prior to the study. This will normally be the case for majority of technology developers who

98
develop new ideas, and attempt to commercialize while learning about commercialization at the
same time.
Table 2
Descriptive Statistics of Sources of Commercialization Knowledge
Source of Knowledge %
Reading about it 26
Seminar/public lecture 20
took a course 11
personal research 24
Previous experience from a job 20
Previous personal experience 0
Total 100
4.1.4. Measures and Analysis: The Dimensions of Psychological Attachment
Measure: The Dimensions of Psychological Attachment
Hypothetical items Since psychological attachment cannot be directly measured, it is
expected that when the unobservable magnitude is measured with a scale of hypothetical items,
the resulting measure will capture the true score of the construct (see Appendix 1 for scale
development process). The strength and quantity of psychological attachment is believed to
cause the hypothetical items to take on certain values (DeVellis, 1991). Each item then gives an
indication of the strength of psychological attachment.
Therefore, hypothetical items were designed for the two dimensions identified in the
theory section. Positive affective states and self-identity-enhancing affective states were the two
dimensions of PA identified in the theory section. For the positive-experiences dimension, items
included “I am experiencing a lot of exciting moments working on this project”, with an item on

99
negative experience, “I am personally experiencing a lot of frustrations working on this project”.
The self-identity dimension comprised of items such as “The project reflects who I am” and its
reverse written item “The project does not reflect who I am” (See Appendix 2 for study
instrument).
Pre-tests led to the refinement and removal of some of the items and this process was
based on inter-item correlations and interviews with a sample of pre-test respondents. The
refined list of items was measured on a five-point Likert-type scale: subjects rated agreement
from 1 (strongly disagree) to 5 (strongly agree). The latent items were randomly presented and
mixed with filler items. For validation purposes, PA was also measured “directly” with the item
“I feel emotionally attached to this idea” and a reverse coded version on a five point scale.
However, due to the importance of the construct development process, there is the need to
illustrate further, the mechanism behind the use of hypothetical items. To arrive at an efficient
scale for the construct, there is the need to consider the issues of validity and reliability.
Validity Validity is considered a vital aspect of psychological tests (Anastasi and Urbina,
1997) and is instrumental in ensuring the value of the construct under study. Validity refers to
the truthfulness of findings and if the measures used capture what was planned or what was
expected to be measured. Cronbach (1971) describes validation as a process used by the test
developer to collect evidence that supports the types of inferences to be made from the test
scores. Crocker and Algina (1986) identified three types of validity: content, criterion-related and
construct validity7. The other type of validity is face validity, which looks at an evaluation by
the researcher or an external expert to examine the extent to which the survey instrument
measures what was intended to be measured.
7 Validity was reduced from four categories to three by the American Psychological Association (1954) with criterion-related validity developed from a combination of predictive and concurrent validity.
100
Elaborating on the various types of validity, content validity assesses whether the items in
the inventory adequately represent psychological attachment or if inference could be drawn from
test scores to a larger domain. Criterion-related validity encompasses predictive and concurrent
validity and deals with the ability to draw inference about a test score to performance on a real
behavioural variable that has practical importance. Construct validity is for drawing inference
from a test score to performances that can be grouped under a particular psychological construct,
such as PA. Construct validity is therefore the extent to which the items are tapping into the
underlying theory or model of behaviour in conceptualising psychological attachment. Further,
construct validity consists of convergent validity which deals with how well the items belong
together or discriminant validity which deals with how well the items distinguish different
respondents on the measures. Some researchers have argued that construct validity comprises
both content and criterion-related validity (Shepperd, 1993; Anastasi, 1986). In this study,
construct validity is the main type of validity investigated in measuring PA. To investigate the
convergent and discriminant validity the affective items were taken through a factor analysis
(Thurstone, 1931).
Reyment and Joreskog (1993) describe factor analysis as a generic term used to describe
a number of methods aimed at analysing the interrelationship between a set of variables resulting
in fewer hypothetical variables called factors8. This is based on the assumption that the observed
8 DeVellis (1991) identifies three purposes for doing a factor analysis on a set of items. The first purpose is to help the investigator to determine how many latent variables underlie a set of items. The second purpose is to provide a means of explaining variation among relatively many original variables or items from a few newly created variables or the factors. The third purpose is to define the substantive content or meaning of the factors (i.e. latent variables) that account for the variation among a larger set of items. The substantive content or meaning of the latent variables could be defined by identifying groups of items that covary with one another.

101
or measured values are linear combinations of some underlying source variables or factors. There
are two types of factor analysis: exploratory and confirmatory factor analysis9.
Exploratory factor analysis is appropriate for this study because the items developed need
to be accessed in terms for their affinity to the dimensions that were theorised. The process of
exploratory factor analysis initially involves analyzing the fit of the model after producing factor
loadings. Factor loadings represent the relationship of a specific variable to a specific factor
without the influence of other variables (Stevens, 1992). Since factors are latent aggregates of the
observed variable, the factor name will depict the aggregate. In order to determine the factors
underlying the variables, a variable reduction scheme is used (Gorsuch, 1983) resulting in a
matrix of association which shows how the variables cluster together or are correlated with one
another. Further, the factor loadings are determined through the process of rotation which
indicates the simplest solution among a potentially infinite number of solutions that are equally
compatible with the observed correlations (Kim and Mueller, 1978).
Rotation gives a more interpretable solution for the factor loadings. In this study, the
principal axis factor method10 is employed and among other methods, a scree plot of eigenvalues
was evaluated to identify the number of factors to retain. There are several methods to determine
how many factors to retain. The decision of the number of factors to be retained and the
substantive meaning given to a factor are decisions that mainly stem from the researcher’s
intuition. According Gorsuch (1983), it’s advisable to use a method that accounts for 70% of the
total variance. A statistical measure of association is then used to analyse the variance and
9 Exploratory factor analysis is a theory-generating study used to determine the number of existing factors and the pattern of their loadings (Stevens, 1992). Confirmatory factor analysis is a theory-confirming study with the measurement items based on theoretical or empirical foundation and the researcher’s ability to specify the exact factor model in advance (Stevens, 1992). 10 Principal components were extracted through a process which amounts a variance maximizing (varimax) rotation of the original variable space. This type of rotation is called variance maximizing because the criterion for the rotation is to maximize the variance of the factor, while minimizing the variance around the new variable (Afifi and Clark, 1990; Stevens, 1986).

102
covariance structures. The fit of the model depends on the level of convergent and discriminant
validity.
Results: The Dimensions of Psychological Attachment
Factor analysis results An exploratory factor analysis was conducted with Varimax
rotation. The results reported in Table 3 contain factor loadings with Eigen values greater than
one (Gorsuch, 1983). Without restricting the number of factors to compute, the process revealed
two factor dimensions with the positive and self-identity affective states emerging as separate
factors (Eigen values, 3.84 and 1.65). Judging from the structure of the loadings, there are
indications of possible discriminant and convergent validity as the theoretical dimensions
defined separate as well as group some latent items together. Discriminant validity was verified
by determining for each latent variable the extent to which the average variance extracted by the
latent variable’s measures was larger than the latent variable’s shared variance with any other
latent variable (Fornell and Larcker, 1981). The items for positive affective states seem to load
together and separate from the items identified for the self-identity affective states. In terms of
the cumulative percentage explained, the two factor model registered a cumulative variance of
54%.

103
Table 3 Results for Principal Component Analysis on Affective Latent Items for PA Item Two dimensions
Positive experiences
Self-identity-enhancing
Negative experience
I am experiencing a lot of exciting moments working on this design project
0.81
0.31
Working through this project, I feel like a genius 0.74
0.05
I have personally put a lot of work into this project
0.56
0.36
The design of the project reflects how I think personally
0.68
0.23
I see my personal ideas in every aspect of the project
0.74
-0.04
The project reflects who I am
0.55
0.58
The project does not reflect who I am (r-coded)
0.45
0.68
The key concept for this project came from me
0.23
0.74
The key concept of this project is from others in the group (r-coded)
-0.27
0.86
I am personally experiencing a lot of frustrations working on this design project 0.91*
Eigen value 3.17 2.27 Percentage of variance explained 31.72 22.70 Cumulative percentage of variance explained 31.72 54.42 *Reported only for comparison sake, not as a separate factor NB: Values bold are those defining a factor (N, 60)
Further, the negative affective item loaded on a separate dimension but since it is a single
item, this loading is not analysed further than just to note that negative affect might relate
negatively with PA as expected. In removing this negative item from the computation, the factor

104
loadings did not change much and the percentage variance improved (35% from 32% for positive
affect and 25% from 23% for self-identity affect). The cumulative variance also improved (61%
from 54%).
Cross loading items Table 3 also indicates the specific hypothetical items that loaded on
the dimensions. One could see items such as “I am experiencing a lot of exciting moments
working on this design project” making the strongest presence in that dimension. However,
there appear to be cross-loading items. Some items loaded below 0.70 (although slightly above
0.50) for the identified primary factor and above 0.30 (in two cases) for the cross-loading factor.
Further, some items that should intuitively fall in the self-identity dimension are seen loading
under the positive experience dimension. An example is “working through this project, I feel like
a genius” While the argument could be made that the subjects may be concentrating mainly on
the positive experience of feeling like a genius, the argument can also be made that the subject
maybe be responding to the self-identity-enhancing aspect of feeling like a genius. Another
factor loading with relative ambiguity is the item “I see my personal ideas in every aspect of the
project”. Intuitively a similar argument could be made about this item. The subject may be
responding with elation from seeing their personal ideas in the project or from the self-identity-
enhancing feeling from seeing their ideas in the project. Thus, there are some indications that
some of the items identified for one dimension belong to another, and that some important items
were left unidentified or that there is possibly just one dimension to psychological attachment.
These possibilities are analysed by correlating the individual items with the average of the two-
item measure of attachment administered (reported in Table 4). Before proceeding to that
section it is important to briefly assess reliability in the measures identified.

105
Reliability of the measure Reliability assesses the element of consistency if the study is
repeated several times. DeVellis (1991) defines scale reliability as the proportion of variance
attributable to the true score of the latent variable; a definition shared by the various reliability
methods11. One common type of reliability is internal consistency reliability12. DeVellis notes
that internal consistency deals with the homogeneity of the items comprising the scale. This is
based on the notion that the relationships among variables are logically connected to the
relationships the items have with the latent variable. If the items of a scale have a strong
relationship to their latent variable, they will have a strong relationship to each other. A scale is
therefore internally consistent by the level to which the items are highly intercorrelated. Thus,
high-item correlations imply the items are measuring the same thing which indicates a strong
link between the items and the latent variable. A commonly used measure of internal consistency
is Cronbach’s (1951) coefficient alpha13,α which denotes high internal consistency between
items when α is closer to one (1). The internal consistency for the items of the positive affective
dimension (Mean=3.13, Std Dev=0.76) was quite high (α =0.79). The self-identity-enhancing
items (Mean=2.95, Std Dev=0.87) also recorded a high reliability (α =0.75). The average of the
total set of items (hereafter referred to as the multiple-item measure) recorded an even higher
internal consistency (α =0.82). This composite measure was computed as the average of all the
individual items employed in the factor analysis (without the negative affective item)
11 There are different methods for measuring reliability (see Nunnally, 1978 and Crocker and Algina, 1986). Some methods identified are test-retest, multiple forms, inter-rater and split-half methods. The test-retest method administers the test instrument to the same study population at different points in time and reports a reliability coefficient computed from a correlation coefficient between the two scores of the population. The multiple forms method which is also known as parallel forms is the technique of mixing up the questions in the test instrument and presenting to the same study population twice. The split-half reliability, is estimated by analyzing half of the test instrument and comparing the results with the overall analysis on the full instrument. One example of this method is the Cronbach (1951) alpha 12 Internal consistency is the convergent validity rule of unidimensionality while external consistency is the discriminant validity rule of unidimensionality. 13 Alternative measures include composite factor reliability and average variance extracted. The composite factor reliability assesses whether there is a sufficient relationship between the scale items and their respective constructs. The average variance extracted measures the amount of variance that is captured by the factor as opposed to the variance due to error.

106
(Mean=3.10, Std Dev=0.68). Summing across the facets of a latent construct seems conceptually
appropriate since the composite of the dimensions should relate to a diverse range of affective
instances better than does one any one component dimension. Thus, the composite measure will
contain more important information than any lower level information obtained (see Carver,
1989). Further, as noted in the previous paragraph, a two-item measure of PA (Mean=3.43, Std
Dev=0.85) was also computed. Since only two items, this measure recorded a low internal
consistency (α =0.30). The following provides further analysis on validation.
Validity of the PA measure: The concept Further to the indications in the factor analysis
of the possibility of achieving convergent and discriminant validity for the PA measure (in terms
of the dimensions); additional analysis is conducted to investigate the issue of validity. An
appropriate procedure is to collect data from independent samples and use these samples as
validation samples to test for invariance of the factor structures across the calibration and the
validation samples (Cudeck and Browne, 1983). However, due to the unavailability of validation
samples, an “in-sample” test of validation was conducted. This involved testing the correlation
between the multiple PA items used in the factor analysis and a two-item measure of PA (noted
earlier). The multiple items were elicited in the first round and the two-item measure was
administered three weeks after the first round of the survey. Since the two item measure asked
specifically whether the respondent felt attached to the technology, it is believed that correlating
with the multiple items will provide an avenue for investigations according to the basic objective
of validity; which is the extent to which the survey instrument measures what was intended to be
measured. The procedure also provides the analysis for the validation hypotheses H1a (Positive
affective states resulting from opportunity development process will be positively related to PA

107
while negative affective states will be negatively related to PA) and H1b (Self-identity-
enhancing affective states will be positively related to PA to the opportunity).
The analyses were conducted on two levels. On the first level, the dimensions from the
factor analysis, the two-item PA measure and the multiple-item PA measure are correlated to test
the validation hypotheses H1a and H1b. The second level of analyses correlated the items in the
multiple-item measure individually with the two-item measure, to learn about the pattern of
correlations the individual items bring to a PA measure. This procedure is deemed important
since the factor analysis recorded near cross-loading items. It is believed that some insight into
why the near cross-loading happened could be gathered from this exercise.
Validity of the PA measure: The analyses, Level 1 Correlations were computed between
the two-item PA measure and the factor scores of the two dimensions, to investigate support for
hypotheses H1a and H1b. The results are presented in Table 4. The results show a significant
relationship (r= 0.49, p<0.01)14 between the two-item PA and the factor scores of the positive
affective states. Hence H1a is supported partially (this procedure couldn’t test the relationship
for the negative affective states. It is operationalized in the next section). Also, there was a
positive relationship between the two-item PA measure and the self-identity factor score (r=
0.34, p<0.01)15. Hence H1b is supported. There was also a high positive relationship between the
two-item PA measure and the composite of the multiple-item PA measure (r= 0.60, p<0.01).
14 A correlation was also computed between the two-item PA and the average of the actual scores of the positive affective states (r= 0.60, p<0.01) 15 A correlation was also computed between the two-item PA and the average of the actual scores of the self-efficacy affective states (r= 0.43, p<0.01)

108
Table 4 Correlations between PA Measures
PA measures Mean SD PA (two-item) PA (multiple-item) PA (two-item)
3.42
0.85
PA(multiple-item)
3.10
0.68
0.60**
Factor scores for positive affective states dimension
0.06
0.96
0.49**
0.76**
Factor scores for self-identity-enhancing states dimension
-0.00 0.96 0.34** 0.64**
(N, 60, 91), **p < 0.01, *p < 0.05
Validity of measure: The analyses, Level 2 The second set of analyses is to assesses the
individual correlations between the individual attachment items and the two-item measure. The
correlation matrix provided in Table 5 shows that almost all the items were correlated with the
two-item measure of PA with significant correlation coefficients ranging from 0.30 to 0.67.
However negative affect was not correlated with the two-item PA measure and therefore H1a
was only partially supported.

109
Table 5 Correlations between Psychological Attachment and Latent Items
Items Mean SD 1 2 3 4 5 6 7 8 8 10
1
PA (two-item measure)
3.43
0.85
2 I am experiencing a lot of exciting moments working on this design project
3.67
1.08
0.42**
3 Working through this project, I feel like a genius 2.43 1.17 0.32* 0.52**
4 I have personally put a lot of work into this project 3.50
1.03 0.66** 0.51** 0.28*
5 The design of the project reflects how I think personally
3.00
1.01 0.42** 0.43** 0.42** 0.29*
6 I see my personal ideas in every aspect of the project 3.07
0.97 0.40** 0.47** 0.41** 0.47** 0.43**
7 The project reflects who I am 3.00 1.07 0.30* 0.47** 0.48** 0.28* 0.61** 0.23
8 The project does not reflect who I am (r-coded) 3.27 1.12 0.46** 0.48** 0.35** 0.44** 0.39** 0.25 0.63**
9 The key concept for this project came from me 2.70 1.28 0.31* 0.26* 0.22 0.41** 0.29* 0.21 0.46** 0.38**
10 The key concept of this project is from others in the group (r-coded)
2.93 1.13 0.23 -0.06 -0.13 0.20 -0.03 -0.12 0.22 0.46** 0.45**
11 I am personally experiencing a lot of frustrations working on this design project
2.90 1.15 0.06 -0.08 0.08 -0.03 0.06 0.16 0.15 -0.16 0.04 -0.10
(N, 60) **p < 0.01 *p < 0.05

110
Upon further scrutiny, it was interesting to discover that the most correlated item in the
list is “I have personally put a lot of work into this project” (r= 0.66, p<0.01). This item was
positively correlated with the item “the key concept for this project comes form me” (r= 0.41,
p<0.01) (which is also weakly correlated with PA). This finding is surprising given those who
initiated the idea were also expected to be the ones more attached to it. However, judging from
the weak correlations between these items, it appears conception of a new idea does not directly
increase PA.
Further, one can realize that there is no significant correlation between “the key concept
for this project came from me” and “Working through this project, I feel like a genius” (r= 0.22,
p>0.10). The indication is that those who conceived the idea are not necessarily the subjects who
“worked hard” on the idea. This was expected considering that most groups started with the
“leader” assembling fellow “technician” colleagues to develop his or her conception (learned
from post-survey conversations). It is therefore not surprising that when subjects conceived the
idea, they were not necessarily attached to it. However, what is interesting is the notion that idea
conception and development might affect PA in different ways. There are real world
implications for this notion. The following are a few of such implications.
This notion of different effects for the two dimensions could be considered in the scope
of corporate venturing where the project scientist conceiving an idea may not necessarily be the
technician working on it, generating positive affective states and therefore being attached to the
project. An illustration could be made of the 3M Post It Note case, where although Spence Silver
was the one who discovered the adhesive, it was Arthur Fry who is more noted for championing
the product. Comparing to the scenario above, one can argue that Fry invested a lot more
psychologically in the product’s applications than Silver, hence Fry would be more likely to be
attached (if he was) to the Post it Note than Silver.

111
Another area of application is the distinction in attachment between entrepreneur-
managers and investor-managers. Will both have the same level of attachment to the idea? Is the
process of attachment different for each group or is it the same? I propose that given the
evidence from above it is possible that investor-managers might become as attached as
entrepreneur-managers so long as they spend a considerable amount of emotion, time, money
and experience affect working on the project. The result shows that one does not necessarily
need to conceive the idea to be attached to it. The implication being that, investor-managers are
capable of developing the level of attachment that can have consequences on decision making at
the point of commercialization. So the development process is crucial for the growth and
sustenance of PA.
In sum, given the results above –findings of the different effects of idea conception and
development on attachment— the main implication for this study is that conceiving an idea does
not necessarily guarantee PA. Working through the development phase and psychologically
investing in problem solving, etc., is more likely to lead to attachment to the idea. This finding
will be explored in future research. Further, PA might be a multidimensional construct as there
was some distinctive difference in the loadings for the two dimensions put forth by this study.
4.1.5. Measures and Analysis: Psychological Attachment and Cognitive Evaluation In the theory section, it was proposed that due to the differences in cognitive and
affective processes, PA as an affective construct was likely to instigate an affective evaluation of
the microeconomic environment. It was theorized that such an evaluation will limit the use of
cognition and therefore through a number of processes, high PA will reduce cognitive evaluation
of the microeconomic environment. One mechanism identified that could result in this reduction

112
of cognitive evaluation is the individual emphasizing more on possibilities than on probabilities.
The following presents the operationalization of the level cognitive evaluation.
Measures: Subjects’ cognitive evaluation To approximate subjects’ cognitive evaluation,
an expected value-based model was adopted. A good cognitive model giving full consideration
to probabilities can be evaluated within the subjective expected utility (SEU) paradigm (Savage,
1954). The paradigm combines the decision-maker’s perceived utility function and a subjective
probability to obtain the expected value of the utility. SEU dwells on strong assumptions such as
completeness or independence which have be vigorously challenged in behavioural decision
research. Subjects for experiments on SEU displayed predictable “biases” and “heuristics”
(Kahneman and Tversky 1979) leading to many modifications of SEU in behavioural decision
research (see Wakker, 2006 for annotated reference review). However, I resort to simple
expected value (EV) calculations to operationalize the construct of cognitive evaluation. The
following describes the process designed to obtain subjects’ subjective values and probabilities
for this computation.
Measures: Subjects’ rating of outcomes and probabilities Subjects’ ratings of severity
and probability for identified adverse future commercialization outcomes and pleasureability of
favourable outcomes were collected in the areas of intellectual property, financial management
and product development. The outcomes are chosen to represent possible outcomes in a
commercialization partnership with an outsider. Hypothetical items were developed on these
outcomes for subjects to evaluate. To illustrate, the hypothetical item based on IP presented a
future possibility of the idea being stolen (by a potential partner).There is also the possibility of
imitation by a potential partner in the form of the partner leveraging the technology in outside
private products. The third item presented the possibility of hidden clauses in contracts signed
with potential partners. The final item was based on level of success achieved with a potential

113
commercialization partnership with the outsider. The severity or pleasurebility of these future
outcomes was scored on a Likert-type 5-point scale. Subjects were given a prelude concerning an
unfamiliar outsider who was described as being able to successfully help them commercialize as
well as cheat them in the process. Subjects were then asked to generate probability judgements
and place a mark on a 10-point scale to determine their perceived probability of the outcomes
occurring.
Table 6 reports the descriptive statistics of subjects’ judgements on the severity/
pleasureability and likelihood of the commercialization outcomes just reviewed. For each
outcome, there are two columns. The first column reports that scores of severity/pleasureability
and the second reports the likelihood. I report on some of the results. Responding to the
possibility of an adverse IP outcome (first set of columns), a majority indicated on a five-point
scale that it would be “extremely painful”(1) “if the potential partner forcibly took over their
idea” (62%, Median=1, St. Dev.= 0.68). In terms of probabilities, most participants believed (on
a 10-points scale) that there is a 50-50 chance that the potential partner would “forcibly take over
ownership of their idea” (Median=5, St. Dev = 2.04). For pleasurable outcomes, most students
indicated that it will be “extremely pleasurable” if the partner assisted in achieving the level of
expected success (77%, Median=5, St. Dev=0.52). However, they only perceived a just above-
average likelihood (on a 10-points scale) that the potential partner will assist in that manner
(Median=6.50, St. Dev =1.73). These results are interesting because although the subjects were
presented with a hypothetical situation, they indicated some affect as they noted the
pleasureability of a successful partnership while doubting the outsider’s credibility in such a
partnership.

114
Table 6 Descriptive Statistic for Severity and Likelihood of Commercialization Outcomes
Forcible takeover of
ownership by partner Imitation by partner Hidden clauses in
contract Private success with
partner
Severe (1)
Pleasurable (5) Likelihood (1 – 10)
Severe (1) Pleasurable (5)
Likelihood (1 – 10)
Severe (1) Pleasurable (5)
Likelihood (1 – 10)
Severe (1) Pleasurable (5)
Likelihood (1 – 10)
Mean 1.47 5.28 1.57 5.65 1.97 6.33 4.73 6.13 Median 1.00 5.00 1.00 6.00 2.00 7.00 5.00 6.50 Mode 1.00 5.00 1.00 5.00 2.00 8.00 5.00 7.00 Std. Dev 0.68 2.04 0.81 2.18 0.69 2.30 0.52 1.73 N 60 60 60 60 60 60 60 60
Measures: Computing EV The concept of expected value (EV) stems from the basic idea
that the value of an option is an additive function of the value of outcomes that are supported by
the option’s attributes. In computations, there is the assumption of an explicit set of options and
that each option in the set has identifiable potential outcomes. Each outcome holds the subject’s
perceived value with a perceived probability of that option. The computation of EV comprises
summarizing the value of each option as the sum of the values of its potential outcomes, each
discounted by or multiplied by the probability of the outcome occurring. The product sum is
known as the option's expected value.
Subjects’ EV calculations of the commercialization outcome were computed as a
summation of their rankings of severity (and pleasureability) multiplied by the probability of the
outcomes presented. The formula for the computation is given as follows:
∑=4
1ii pxEV where x denotes the ratings of the commercialisation outcomes
presented and the p denotes the probabilities of those outcomes occurring. i represents the
outcomes: 1. forcible takeover of ownership, 2. imitation by partner, 3. hidden clauses in a
contract, 4. private success with partner.

115
Measures: EV – Subjects’ cognitive evaluation As noted above, the underlying
assumption for EV-type models (SEU type models and other modifications) is that the rational
decision-maker maximises some kind of expectation by evaluating beliefs or probabilities and
the values or utilities of possible outcomes. Given this view, employing the expected value
calculations in assessing entrepreneurial outcomes denotes consideration for the probabilities of
the outcomes and hence an appreciable level of objectivity in judgement. Further, a cognitive
process involves a conscious analysis of a situation, resorting to base rates and past information
that informs the decision-maker’s intuitive judgement on the value of the option and the
likelihood of its occurrence.
The use of EV to tap into cognitive evaluation is in line with the arguments for the
mechanism by which affect-based constructs like PA influences evaluation of the micro–
economic environment. As argued in the theory section, PA is expected to affect perceptions of
the environment, the evaluation of possibilities and probabilities and the retrieval and use of
information from the micro-economic environment. Subjects are expected to weight the values
of the negative outcomes high and positive outcomes low when they are highly attached to the
opportunity. This is because they tend to place a high value on the idea as a result of the
attachment. Likewise highly-attached subjects are expected to report high probabilities for
negative outcomes more than for the positive outcomes. In essence the EV variable is used in
this study to represent the level of cognitive processing the subject employs. A decrease in the
EV variable is assumed to signify a decrease in cognitive engagement possibly due to the
differences in evaluation within the cognitive and affective paradigms and consequently, an
influence of an affective evaluation process over the cognitive evaluation process. The EV
variable therefore represents the level of cognitive evaluation in this study. It was found to have
a mean of 2.95 and a standard deviation of 1.21.

116
Measures: Discrepancy measure – Difference between assumed objective and
subjective evaluations Deviation from an assumed normative cognitive decision frame is what
underlies research in decision biases. To further study this hypothesised deviation, a discrepancy
measure, computed as the difference between an assumed objective evaluation and subjective
evaluation of the micro-economic environment, was developed. The objective factor was
represented by the subject’s estimation of the project’s value. Subjects were asked to indicate the
amount they will pay the rest of the group (excluding themselves) to obtain sole ownership of the
project. The average subjective value offered was $3,322.57 CDN (Mean= $3,323,
Median=$500, Std Dev=$9,046, maximum $60,000, Skewness=4.63) (see distribution in
Appendix 5.2).The values were concentrated on the lower end of the scale, below $10,000 with a
median of $500, a 25th percentile of $100 and a 75th percentile of $1,275. The log of this dollar
amount was used to represent the value of the project in the analyses of the results. Taking
logarithms of the variable transformed the probability distribution to approximate the Normal
distribution (see distribution in Appendix 5.1), effectively reducing the excessive variance
(Mean= $2.76, Std Dev=$0.83).
The discrepancy measure was therefore the log of the project value minus the subjective
expected value described above (Mean= -0.13, Std Dev=1.378). A high value for this
discrepancy measure indicates a wider deviation from the normative and therefore the cognitive
and implies a higher level of bias. Likewise a small value for the measure indicates a higher level
of congruence in the supposed objective and subjective measures and therefore a lower level of
bias. One should however note that the supposed objective value has a level of subjectivity in its
elicitation. This is the case because the project value was taken from subjects’ subjective
estimates rather than obtained from actual market sources. However, the project value is
assumed to be a good proxy for an objective value of the project and may have merit because it

117
indicates the subject’s attempt to estimate of the objective value of the project. Hence the
discrepancy measure provides the opportunity to compare the subject’s objective and subjective
estimates of the project and outcomes and also the comparison provides insight into the subject’s
realizations (in objective terms) and preferences (actionable preferences influenced by a
subjective evaluation).
Results: PA and cognitive evaluation (H2) H2 predicts a decrease in the level of
cognitive evaluation when PA increases. In support of H2, there was a significant negative
correlation between PA and the level of cognitive evaluation (r= -0.26 p<0.05)16, a positive
significant relationship between the log of project value (objective measure) and PA (r= 0.37
p<0.01), and a significant positive relationship between PA and the discrepancy measure
(difference between log of project value and the level of cognitive evaluation) (r= 0.48 p<0.01).
These relationships are shown in Figure 8.
It appears high attachment prevented subjects from employing cognitive mental
processes to enable them effectively incorporate objective valuation of future outcomes and
probabilities associated with these outcomes. Hence, when subjects’ PA increased, their level of
cognitive evaluation of the future outcomes decreased, widening the difference between that
evaluation and their estimation of project value. While the subjective expected value
computation and the discrepancy measure may not reflect the level of cognitive evaluation, these
measures provide insight into how subjects weight value and expectancy in evaluating the micro-
economic environment. Irrespective of alternative explanations, the relationship between the
measures and PA suggests a divergence in effects between PA as an affective construct and
cognitive-type measures such as the expected value measure, computed here.
16 The PA measure used here is the composite multiple-item measure of PA which averages the actual scores of those affective items. However, the relationship was stronger when the two-item PA measure was correlated with the level of cognitive evaluation (r= - 0.37 p<0.01)
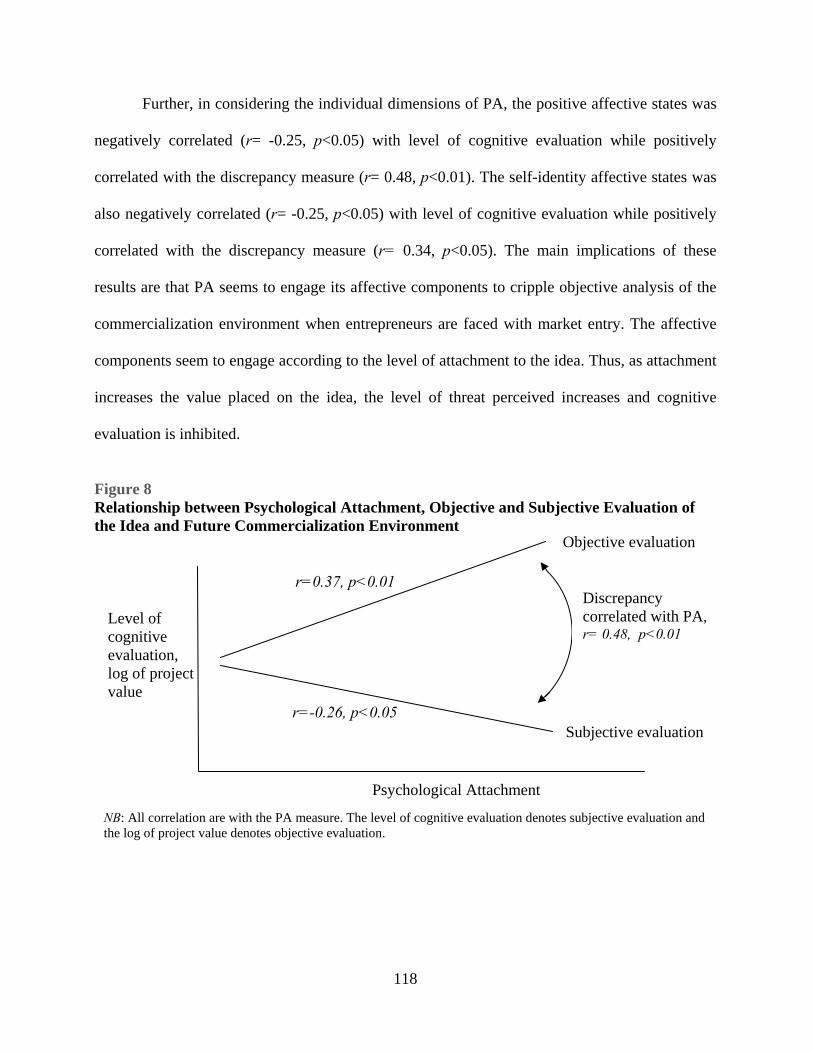
118
Further, in considering the individual dimensions of PA, the positive affective states was
negatively correlated (r= -0.25, p<0.05) with level of cognitive evaluation while positively
correlated with the discrepancy measure (r= 0.48, p<0.01). The self-identity affective states was
also negatively correlated (r= -0.25, p<0.05) with level of cognitive evaluation while positively
correlated with the discrepancy measure (r= 0.34, p<0.05). The main implications of these
results are that PA seems to engage its affective components to cripple objective analysis of the
commercialization environment when entrepreneurs are faced with market entry. The affective
components seem to engage according to the level of attachment to the idea. Thus, as attachment
increases the value placed on the idea, the level of threat perceived increases and cognitive
evaluation is inhibited.
Figure 8 Relationship between Psychological Attachment, Objective and Subjective Evaluation of the Idea and Future Commercialization Environment
NB: All correlation are with the PA measure. The level of cognitive evaluation denotes subjective evaluation and the log of project value denotes objective evaluation.
Level of cognitive evaluation, log of project value
Objective evaluation
Subjective evaluation
Psychological Attachment
r=-0.26, p<0.05
r=0.37, p<0.01 Discrepancy correlated with PA, r= 0.48, p<0.01

119
4.1.6. Measures and Analysis: Psychological Attachment and Control Tendency
Measures: Control tendency Control tendency was measured by presenting subjects with
six items (three reverse scaled) on three areas of control identified to be of concern to the
entrepreneur: the right to the intellectual property of the opportunity, the right to influence
decisions involving the opportunity, the right to the returns on the opportunity. Similar measures
defined within these categories have been used in research on psychological ownership in the
organizational setting (Pierce, Rubenfeld and Morgan, 1991) and property rights (Furubotn and
Pejovich, 1974)17. For the set-up of the measures, subjects were introduced to a hypothetical
potential commercialization partner and provided with the costs and benefits of developing a
business relationship with the partner. Since commercialization decisions are decisions made
under risk and uncertainty, an element of uncertainty is also introduced into the introductory
statement. Subjects are told that they do not know anything about the company they are going to
partner with and as such do not have any idea of how a business relationship may turn out. Pre-
tests led to the refinement of the items. (See Appendix 2 for study instrument).
Instructions required subjects to rate on a five-point scale the extent to which they will
want their decisions to prevail in the three areas and the extent to which they are comfortable
allowing a fictitious potential partner to make overriding decisions on the commercialization
effort. Table 7 provides descriptive statistics on the items used in this measure. When asked if
they will “want to be the sole owner” of their projects, subjects response was strong (Mean=3.72,
Std. Dev=0.93). The responses were also strong for questions on the extent of willingness to 17 These three rights were adapted from the characterization of rights in ownership culture (Pierce, Rubenfeld and Morgan, 1991) and from the property and control rights literature (Furubotn and Pejovich, 1974; Williamson, 1991; Grossman and Hart, 1986; Hart and Moore, 1990; Hart, 1995; Aghion and Tirole, 1994). Pierce, Rubenfeld and Morgan (1991) define ownership culture around certain rights associated with owning a business and from which employees can derive psychological ownership: the right to information about the status of the business, the right to exercise influence over the business and the right to some share of the financial value of the business. In the property rights literature, three types of property rights are identified: the right of use, the right of changing forms and structure of the product and the right to reap profits from the product (Furubotn and Pejovich, 1974; Williamson, 1991).

120
maintain the right to make overriding manufacturing and distribution decisions (Mean= 3.54,
Std. Dev=0.93). Responses were also strong on the question of the extent to which subjects will
prefer to be the key decision-maker in how money is spent on the project (Mean=3.65, Std
Dev=0.85). On the question of the extent to which subjects are willing to allow the outsider to be
the sole owner of the project, the response was low (Mean 1.58, Std. Dev=0.82). The response
was not comparatively low for subjects when asked about allowing the outsider to control
manufacturing and distribution (Mean=2.40, Std. Dev=0.95). Subjects were also not comfortable
with allowing the outsider to make decisions on how financial disbursements are made
(Mean=2.29, Std. Dev=0.97).
Table 7 Descriptive Statistics for Control Tendency Measure
Want to be sole owner
Main decision-maker on
manufacturing and distribution
Main financial manager
Allow outsider sole
ownership
Allow outsider to decide on
manufacturing and distribution
Allow outsider to manage finances
Mean 3.72 3.54 3.65 1.58 2.40 2.29 Median 4.00 4.00 4.00 1.00 2.00 2.00 Std. Dev 0.93 0.93 0.85 0.82 0.95 0.97
Min 1 1 1 1 1 1 Max 5 5 5 5 5 5
Factor analysis supported the unidimensionality of the control tendency scale at an Eigen
value of 2.186. The items in the scale also recorded a reasonably high inter-item reliability
(Cronbach alpha, α=0.64). Reversing the scores for items based on outsider control, an average
control tendency was computed. The average control tendency was quite high (Mean= 3.77, Std.
Dev= 0.54). The distribution the control tendency average is skewed towards the left (Skewness=
- 0.757) with the median and the mode falling into the range of values that define a high control

121
tendency (See Appendix 5.1). Given these analyses, one can conclude that on average, subjects
were relatively control-oriented when dealing with hypothetical outsiders.
Measures: Statistical control variables – Personality-type variables To better argue for
significant effects of PA, there is the need to statistically control for conceptually similar but
personality-type factors. These factors are chosen from a purely conceptual point of view. Thus,
the personality controls have the capacity to influence CT in a similar manner to how PA will
affect CT. Hence evidence of their insignificance in a statistical effect on CT lends support for
the robustness of PA in influencing CT. Most of the items were taken from Dr. Goldberg’s
International Personality Items Pool (IPIP), which is “a scientific collaboratory for the
development of advanced measures of personality traits and other Individual differences”
(www.ipip.ori.org).
The first is Emotion-Based Decision Making (EBDM) (Barchard, 2001). CT could result
from an individual disposition to make decisions by emotions. Therefore this measure is a good
statistical control for testing PA. EBDM is one of seven components of Emotional Intelligence
IPIP (EI-IPIP) developed by Barchard (2001). EBDM is the tendency to make important life
decisions based upon emotions, rather than using logic. The construct is a 10-item measure with
5 positively-keyed and 5 negatively-keyed items. Barchard modelled the scale on the TEIS
(Tett’s Emotional Intelligence Scale) Flexible Planning subscale. TEIS (Tett, Wang, Fisher et,
1997; Tett, Wang, Gribler, Martinez, 1997) is a multi-dimensional measure of emotional
intelligence which gives scores for twelve separate subscales and an infrequency scale. Some
items of the emotion-based decision making scale are “I rarely, consider my feelings when

122
making decisions” and “I plan my life based on how I feel”. The items as tested in this study
produced a Cronbach alpha of 0.82 (9 items)18.
The second is Risk-taking propensity. This measure is important because low-risk-taking
developers might be control-oriented due to their perception of the risk of losing the idea on the
market. Therefore, it becomes a good statistical control for testing the effects of PA. The Risk-
taking construct is also taken from the Jackson Personality Inventory (JPI-R). The construct
assesses the propensity to take risks in general risk domains across a variety of situations related
to health, finance and goal attainment. The scale taken from the IPIP database is a 10-item
measure with 6 positively-keyed and 4 negatively-keyed items. Some items of the risk-taking
scale are “I seek danger” and “I would never make a high risk investment”. Reliability test when
the measure was administered in this study produced a Cronbach alpha of 0.82 (10 items)19.
Another factor measured is Machiavellianism (IPIP, 2001). Machiavellianism is an ideal
statistical control due to the similarities between the construct and CT with respect to control.
Therefore CT might be a result of the Machiavellian disposition in developers. The
Machiavellianism scale is also taken from IPIP and was modelled on the Social Astuteness
aspect of the Jackson Personality Inventory - JPI-R (Jackson et al, 1972, Jackson, 1994).
Christie and Geis (1970) developed the construct of Machiavellianism on the basis of the
sixteenth century works of Niccolo Machiavelli. The trait of Machiavellianism refers to an
orientation in which individuals think that manipulating others is an underlying strategy of social
influence. Individuals with a high level of this trait have a powerful need to hold leadership
positions, influence others, and they usually dominate relations with other people. The scale
taken from the IPIP database is a 6-item measure with 3 positively-keyed and 3 negatively-keyed
18 Cronbach alpha for the scale from tests conducted by Barchard ( 2001) is 0.73 19 The scale is reported by IPIP (2001) to have a Cronbach alpha of 0.78

123
items. Some items of the Machiavellianism scale are “I have a natural talent for influencing
people” and “I lack the talent for influencing people”. A reliability test for the measure in this
study, revealed a Cronbach alpha 0.82 (6 items)20.
The final personality-type construct measured is Need for control (Siegrist, 1996, 2002).
CT could result from the innate disposition of having the need to control. Hence statistically
controlling for need for control in testing the effects of PA provides insight into the
characteristics of PA. The need for control construct is a subscale of the Effort-Reward-
Imbalance model (Siegrist, 1996, 2002) which is based on social reciprocity where an employee
invests efforts and expects rewards. Illustrating further, where there is an imbalance, employees
with excessive work-related overcommitment underestimate the external demands and
overestimate their own coping resources, without realising their contribution to the imbalance.
Need for control is described by need for approval, competitiveness, disproportionate irritability,
and inability to withdraw from work. The construct is closely related to aspects of the type A
behaviour pattern that reflect an exorbitant ambition in combination with the need for approval
and esteem. Examples of the items on this scale include “Work rarely let me go, its still on my
mind when I go to bed” (effort) and “'my job promotion prospects are poor” (reward). Items
were personally received from Dr. Siegrist through email. References to “office work” in the
original questionnaire were replaced with “group work” to fit the school work environment.
Reliability test when administered to the sample in this study produced an alpha of 0.7621 (6
items).
Table 8 provides the descriptive statistics for the above-outlined personality-type
variables. Machiavellianism scored highest among the variables (Mean=3.21, Std Dev=0.75).
20 The scale is reported by IPIP (2001) to have a Cronbach alpha of 0.79 21 There was no available record of Cronbach alpha for the scale used but the alpha computed in this study was relatively high.

124
Risk-taking propensity was also high among subjects (Mean=3.12, Std Dev=0.66). Emotion-
based decision making (Mean=2.55, Std Dev=0.58) and need for control (Mean=2.30, Std
Dev=0.63) recorded low averages. In essence, subjects had higher levels of Machiavellianism
and risk-taking while having lower propensities to make decisions based on emotions or need for
control. These results have significant implications for this study. If subjects have lower
propensities to make decisions based on emotions and on the need for control, then any evidence
of control tendency arising from PA suggests that the effects originate from their experiences
with the project (context driven) rather than their innate psychological dispositions.
Table 8 Descriptive Statistics for Personality-Type Variables
Personality-type variables Minimum Maximum Mean Std. Deviation Emotion-based decision making 1 4 2.55 0.58
Risk-taking 1 4 3.12 0.66 Machiavellianism 1 5 3.21 0.75 Need for Control 1 4 2.30 0.63
(N, 92)
Measures: Statistical control variables – other variables Another control variable
considered was project value. As already reported above, subjects were asked to indicate the
amount they will pay the rest of the group (excluding themselves) to obtain sole ownership of the
project. The average subjective value offered was $3,322.57 CDN and the log of this dollar
amount was used to represent the value of the project in analyses. (the variable is described in
the measures section for H2).
Yet another variable considered is trust. The social capital literature describes trust as a
subjective belief about the likelihood that a potential partner will act honestly (see Dasgupta,
2003). Some also draw a connection between trust and control. For example, Das and Teng
(1998) identify trust and control as two alternative sources in developing confidence in partner

125
cooperation and suggest that trust level will facilitate the deployment of control mechanisms. In
this study, since the subjects have no prior experience with the potential third-party, an attempt
was made to capture dispositional trust (Rotter, 1980) towards the outsider, rather than
employing a multidimensional view of trust (Rousseau Sitkin, Burt, and Camerer, 1998). Rotter
(1980) defines dispositional trust as "a generalised expectancy held by an individual that the
word, promise, oral or written statement of another individual or group can be relied upon."
In effect, the subject’s trusting disposition towards a potential partner was measured by
eliciting the likelihood that “the potential partner will write hidden clauses that limited the
subject’s rights in the contract” (on a 10 points scale). There seemed to be a general dispositional
distrust for the potential partner (Mean=6.46, Median=7, St. Dev= 2.30) (See distribution in
Appendix 5.3). In other words, subjects expressed a considerable level of distrust towards
hypothetical outsiders with the view that such hidden clauses had the potential to restrict their
rights to the project.
The next control variable considered is perceived likelihood of expected success from a
potential collaboration. Simply put, entrepreneurial reward orientation could be shaped by
pecuniary or non-pecuniary motives. Either way, the entrepreneur will build this motive into
goals and expectations for the future outcomes concerning the opportunity. To capture the
likelihood of such expectations in possible outside-party collaboration, subjects were asked to
rate on a 10 point scale, the probability that the potential partner will play a positive role in
realising an expected level of success. The responses show the perception that “the potential
partner will help achieve the level of success expected” (Mean=6.13, Median=6, St. Dev= 1.84)
(see distribution in Appendix 5.4).
The final control variables considered are the perceived severity of a future loss of the
opportunity and the likelihood of a future loss of the opportunity. Subjects might perceive the

126
consequences of a future loss of the project and therefore be less willing to give up control to
outside party. This mechanism might occur outside of a PA to the idea. In effect, it is advisable
to include this variable as a statistical control in studying the effect of this perception on CT. The
severity variable was elicited by asking subjects to rank on a 5-point scale, how severe they think
it will be if a third party “forcibly takes over ownership of the project idea”. As partly reported
earlier, responses to this question was high in severity (low on the scale) (Mean=1.52,
Median=1, Std Dev=0.80). Subjects largely felt that the impact on them, if they lost their idea on
the market, will be devastating.
Results: Correlational analysis – PA, CT and statistical controls Prior to analyzing the
effect of PA on CT, correlations was computed for PA, CT and the identified statistical control
variables. The variables in this correlation procedure included: PA; personality-type constructs;
project value; level of cognitive evaluation; dispositional trust, the likelihood of personal gain
from third-party partnership; and perceived severity of a future loss of the opportunity. CT was
significantly and positively correlated with PA (r= 0.29, p<0.01), albeit weakly. Further, the
correlational relationships between the personality-type control variables and control tendency
were examined. Among the personality variables, the only correlation reported was a positive
correlation between PA and Machiavellianism (r= 0.29, p<0.05). This implies that subjects who
believe they can influence or manipulate their social interactions might be more attached to their
opportunity, probably because they also believe they can influence the outcomes through the
development and commercialization processes. Given that the average score for
Machiavellianism was higher (Mean=3.20), it was not surprising that it was the only personality
factor to be statistically significant in the correlations.
Other correlations of interest that were not hypothesised are provided as follows. There
was a positive relationship between Machiavellianism and risk-taking (r= 0.36, p<0.01) while

127
risk-taking was negatively correlated with need for control (r= -0.35, p<0.01). Intuitively
subjects who felt they could manipulate others were also likely to take risks while those with
need for control were less likely to take risks. Further, positive affective states were also
positively correlated with need for control (r= 0.34, p<0.01) and positively with estimates of the
project value (r= 0.40, p<0.01). Subjects who experienced a lot of positive affective states
during development were likely to also have a need for control and these subjects were also
likely to rate the value of the project high. PA was also positively correlated with project value
estimates (r= 0.37, p<0.01). The more attached the subject is, the more likely they were to raise
the value of their project. The average measure of attachment was positively correlated with the
likelihood of achieving expected success with an outsider (r= 0.27, p<0.05) while increasing the
perceived severity of a future loss (r= 0.27, p<0.05).
Results: Hierarchical modeling analysis – PA and CT with statistical controls To test
H3— as PA increases CT increases — the CT measure was modeled hierarchically (Raudenbush
and Bryk, 2002) on factors identified in the previous section (see Table 9 below). Hierarchical
linear models take into account the dependence between observations. Also, tests for identified
hypotheses can be done at different levels making it possible to assess the amount of variation at
each level. Table 9 provides the tests of models entered into the statistical software
hierarchically. The models with the single unit labels (e.g. Model 1) are the initial models to
which the subsequent models in the decimal unit labels (e.g. Model 1.1) are compared. Model 1
predictors consisted of the personality-type variables. The results show that Machiavellianism
was weakly significantly related to CT (p=0.90). The implication is that when subjects believed
that they were capable of manipulating outsiders, they were more control-oriented. Model 1.1
introduced the estimated project value, the level of cognitive evaluation and the multiple-item
composite measure of PA into Model 1. Although none of the predictors were significantly

128
correlated with CT, the weak effects of Machiavellianism disappeared (also none of the model
statistics was significant). The correlations computed earlier indicated a correlation between
Machiavellianism and PA (r= 0.23, p<0.05) and this could have caused the disappearance of the
effects for Machiavellianism.

129
Table 9 Hierarchical Regression Analysis of CT on Predictors
Predictors Model
1 Model
1.1 Model
2 Model
2.1 Model
3 Model
3.1 Constant 4.09** 3.82** 4.35** 3.97** 3.97** 3.65**
(0.60) (0.62) (0.59) (0.61) (0.60) (0.82)
Emotion-Based decision making ‐0.20 ‐0.17 ‐0.21 ‐0.18 ‐0.18 ‐0.14
(0.13) (0.13) (0.13) (0.13) (0.13) (0.12)
Risk-taking ‐0.13 ‐0.18 ‐0.05 ‐0.14 ‐0.14 ‐0.08
(0.11) (0.11) (0.11) (0.11) (0.11) (0.10)
Machiavellianism 0.16† 0.13
(0.09) (0.09)
Need for control 0.06 ‐0.04 0.07 ‐0.05 ‐0.05 ‐0.17
(0.12) (0.14) (0.12) (0.14) (0.13) (0.13)
Estimated project value (log) 0.03 0.04 0.03 0.05
(0.09) (0.09) (0.09) (0.08)
Level of cognitive evaluation ‐0.01 ‐0.00
(0.07) (0.07)
PA composite multiple-item 0.20 0.24† 0.24* 0.28*
(0.13) (0.13) (0.12) (0.12)
Trusting disposition ‐0.05
(0.03)
Likelihood of achieving expected level of successes with outside partnership
‐0.07†
(0.04)
Perceived severity of future loss of opportunity
0.18†
(0.11)
Likelihood of future loss of opportunity 0.00
(0.04)
R2 0.14 0.21 0.09 0.18 0.21 0.37
R2 adjusted 0.07 0.10 0.04 0.08 0.11 0.24
R2 change 0.07 0.09 0.16
F 2.05 1.81 1.67 1.78 2.15† 2.69*
F change 1.42 1.81 2.41*
(N, 56) ** p < 0.01 * p < 0.05 † p < 0.10
Model 2 excluded Machiavellianism as a predictor. The predictors of Model 1.1 (without
Machiavellianism) were repeated for Model 2.1. As expected we observe a positive and

130
significant coefficient for PA (β =0.24, p=0.06), hence H2 which predicted a positive
relationship between PA and CT was supported. Thus, controlling for the personality-type
variables (without Machiavellianism), PA was significant in explaining variability in CT.
However, what is more striking about Model 2.1 is that there are interesting implications for the
lack of significant effects found for the statistical control variables. There were no effects found
for emotion-based decision making: implying that subjects were not control oriented because
they were emotionally aroused in perceiving all the possible adverse conditions associated with
losing IP, managerial, R&D and financing rights to the idea. Further, subjects were not control
oriented because they were risk seeking or had a need for control as innate dispositions.
More interestingly, there were no effects found for estimated project value. It was
believed that since the question for this measure asked subjects to indicate their willingness to
pay, this value was what they placed on the project. Therefore, if the project value was high it
indicated that subjects viewed the project favourably and will consequently have a desire to
control the rights due to their perceptions of favourable returns. A rational model would indicate
that a project valued highly will predict a high level of CT. Therefore the lack of effects for
project variable lends strength to the effect of PA on CT, controlling for project value, among
others. There were relatively large values recorded for changes in the coefficient of
determination, R2 22, and the F values23 although not significant (see bottom panel of Table 9)
For Model 3, the level of cognitive evaluation was removed to enable the inclusion of
other correlates that form a part of the computation of the level of cognitive evaluation. The
correlates are: the trusting disposition; likelihood of achieving expected level of success with
outside partnership; perceived severity of a future loss of the opportunity; and the likelihood of a
22 R2 – The coefficient of determination is the proportion of variability in a data set that is accounted for by the statistical model 23 The F test is calculated generally as F = (between-group variability) / (within-group variability).

131
future loss of the opportunity. Unlike Model 2.1, Model 3, with the removal of level of cognitive
evaluation, registered a significant F value (p<0.10) and a slightly higher R2, meaning the model
with the excluded variable performs better in predicting CT. This result is insightful because,
aside from the potential statistical explanations, it suggests that without cognitive evaluation,
subjects’ CT is better explained by PA. In terms of the effect of PA on CT, PA improved in
significance (from p=0.06 to p=0.04) comparing Model 2.1 to Model 3 and the standard errors
also decreased slightly.
Model 3.1 included the variables for which the level of cognitive evaluation was removed
from Model 3. The model seemed to improve over Model 3 with a significant F change (F=2.41,
p<0.05) and a sizeable in R2 change (0.16). PA increased in significance in Model 3.1 (β =0.28,
p=0.03) over Model 3 (β =0.24, p=0.04) in explaining variability in CT. Of the four correlates
added to Model 3.1, two were weakly significant. The likelihood of achieving expected level of
successes with outside partnership was weakly significant (β = -0.07, p=0.07). This result
implied that when subjects’ viewed outsider assistance favourably in achieving expected level of
success, their CT decreased. This finding is also very interesting because it implies that
controlling for PA, the perception of a successful outsider partnership motivates control sharing.
A further implication is that if this perception is strong, the effects of PA might be overcome and
CT will decrease enough for an increase in performance. The other correlate that was weakly
significant is the perceived severity of a future loss of the opportunity (β =0.18, p=0.098).
Although the significance of this variable is very weak, the result suggests the intensity of the
perception of adverse commercialisation outcomes may explain additional variance in CT,
controlling for PA.
Finally, for validation purposes, the two-item PA measure was introduced into the
models to replace the multiple-item PA measure. The Model 1.1 results for the two-item PA

132
measure revealed a similar trend to the composite measure (β =0.13, p=0.14). Also, the results
were similar when entered into the following models: Model 2.1 which excluded
Machiavellianism (β =0.16, p=0.06), Model 3 (β =0.17, p=0.04) and into Model 3.1 (β =0.19,
p=0.03). Likewise, the results were similar in Model 3.1 for the additional correlates: the
likelihood of achieving expected level of success with outside partnership (β = -0.07, p=0.06)
and the perceived severity of a future loss of the opportunity (β = 0.20, p=0.07) – a slight
improvement in the latter. Also, the model statistics were similar. Thus, the similarity in effects
may be explained by the high correlation between the two-item and multiple-item measures of
PA. Further, the multiple-item measure very well captures the essence of PA in explaining CT by
virtue of the fact that the two-item measure asked subjects the extent to which they were attached
to the idea.
Further to testing the effects of PA (using the multiple-item measure), it is important to
examine individually the effect of the PA dimensions on CT. To that end, the factor scores of the
positive affective states and the self-identity affective states (dimensions) were introduced into
Models 2, 2.1, 3 and 3, run above, in replacement of the multiple-item measure. The results are
reported in Table 10 below. The models are renamed in continuation of the previous set run
(hence are from 4 to 5.1). The models also exclude Machiavellianism which correlates with PA.
Model 4.1 (converted Model 2.1), shows that the positive affective states dimension was
significant in explaining variability in CT (β =0.20, p=0.03), while the self-identity dimension
was not (β =0.05, p=0.54)24. These results present a very interesting take on the dimensions of
PA. Although the results are not surprising, judging from the correlations between the
dimensions and CT, it is worth speculating on. The lack of effect for the self- identity dimension
24 The pattern of effects is confirmed, but did not improve, when the factor scores are replaced by averages of the actual scores of the two dimensions. The positive affective states dimension was weakly significant (β =0.22, p=0.08), while the self-efficacy dimension was not (β =0.04, p=0.67)

133
implies that experiencing what is termed in this study as self-identity-enhancing affective states,
does not automatically lead to CT. This is an intuitively reasonable conclusion since enhanced
self-identity should not necessarily drive CT. The reason being that enhancing self-identity
relates to personal association with the idea and this association can be upheld even when control
is shared or relinquished. Developers can christen technologies according to their preferences
when partnering with outsiders and obtain both the financial resources from improved business
as well as the name-association with the technology.
The pattern of effects for the dimensions is repeated in Model 5 and Model 5.1. Models 5
and 5.1 exclude both Machiavellianism and level of cognitive evaluation as was the case in
Models 3 and 3.1. There was a significant effect reported in Model 5 for the positive affective
states (β =0.19, p=0.02) and no effect for self-identity affective states (β =0.04, p=0.54). Model
5.1 results also report a significant effect for the positive affective states (β =0.19, p=0.02) and
no effect for self-identity affective states (β =0.08, p=0.30). However, unlike in Model 3.1 when
significant but weak effects were recorded for the likelihood of achieving expected level of
success with outside partnership and the perceived severity of a future loss of the opportunity,
Model 5.1 only recorded an effect for the likelihood of achieving expected level of success with
outside partnership (β = - 0.07, p=0.07). The effects for the perceived severity of a future loss of
the opportunity disappeared (β = 0.18, p=0.11) and this is not surprising since the effect was very
weak in Model 3.1. However the pattern of the model statistics reported was also very similar to
those of the other set of models with significant differences in statistics, showing improvements
in the hierarchical models.

134
Table 10 Hierarchical Regression Analysis of CT on Predictors
Predictors Model
4 Model
4.1 Model
5 Model
5.1 Constant 4.35** 4.82** 4.81** 4.55**
(0.59) (0.64) (0.63) (0.10)
Emotion-Based decision making ‐0.21 ‐0.19 ‐0.19 ‐0.15
(0.13) (0.13) (0.13) (0.12)
Risk-taking ‐0.05 ‐0.13 ‐0.13 ‐0.08
(0.11) (0.11) (0.11) (0.10)
Need for control 0.07 ‐0.08 ‐0.07 ‐0.18
(0.12) (0.14) (0.13) (0.13)
Estimated project value (log) 0.02 0.02 0.04
(0.09) (0.09) (0.08)
Level of cognitive evaluation 0.01
(0.07)
Trusting disposition ‐0.05
(0.03)
Likelihood of achieving expected level of successes with outside partnership
‐0.07†
(0.11)
Perceived severity of future loss of opportunity 0.18
(0.11)
Likelihood of future loss of opportunity 0.00
(0.04)
Positive affective states – factor scores 0.20* 0.19* 0.19*
(0.09) (0.08) (0.08)
Self- identity enhancing affective states – factor scores
0.05 0.04 0.08
(0.07) (0.07) (0.07)
R2 0.09 0.21 0.20 0.38
R2 adjusted 0.04 0.09 0.11 0.24
R2 change 0.12 0.18
F 1.67 1.76 2.09† 2.75*
F change 1.75 3.17*
(N, 56) ** p < 0.01 * p < 0.05 † p < 0.10
In summary, one can conclude from the analyses that there is strong support for the
influence of PA on CT, while statistically controlling for essential correlates. The key
previously-hypothesised evidence in this section is the positive effect of PA on CT. Other

135
unhypothesized evidence include: the lack of effect of estimated project value, the weak positive
effect of Machiavellianism, the negative effect of success expectations with outsider on CT, and
the very weak positive effect perceived severity of loss of the opportunity on CT. The results
also suggest that if PA is multidimensional, then there is the possibility of differing dimensional
effect on CT. Finally, personality-type factors such as Emotion-Based Decision-Making, Risk-
Taking and Need for Control were not significantly correlated with control tendency.
4.1.6. Measures and Analysis: Testing the Moderating Effect of Threats on the Relationship
between Psychological Attachment and Control Tendency
4.1.6.1. Introduction
As noted earlier, commercialization presents a situation where an analysis of the micro-
economic environment is necessary in order to chart an efficient commercialization strategy.
Results from data analysis in the previous session have shown that subjects perceive a high level
of severity for adverse conditions concerning their projects. In the theory section, I noted the
threat of loss is expected to influence the perception of future control or lack of control in the
commercialization environment. The underlying argument was that the perception of loss of
control will provide threatening signals that will influence the relationship between PA and CT.
Essentially the notion of threat should be treated as a moderator of the relationship between PA
and CT. The argument for the hypotheses, when the perception of threats is high, was a stronger
relationship between PA and CT. I also introduced the main types of affective responses or
emotional reactions to perceived threats: anticipatory and anticipated responses (Loewenstein et
al., 2001). The hypotheses developed were H4a (Anticipated emotional reactions to perceived

136
threats will positively moderate the relationship between PA and CT) and H4b (Anticipatory
emotional reactions to perceived threats will positively moderate the relationship between PA
and CT). In this section I test hypotheses H4b, focusing on an experimental procedure aimed at
inducing threat and assessing its impact on the relationship between PA and CT. I concentrate on
anticipatory affect: affective states of the now.
4.1.6.2. Experimental Design
To study the effect of anticipatory affect on the relationship between PA and CT, I
employed a quasi-experimental paradigm (Cook and Campbell, 1979). Quasi-experimental
design is useful in applied research settings where real-life constraints restrict complete control
over the research setting. Since subjects develop PA outside of the experimental process, the
quasi-experimental paradigm provides a better framework for studying it effects. Classic
experimental designs (Campbell and Stanley, 1963) are characterized by the ability to randomize
subjects into treatment and control groups and thereby control the variables that are not explicitly
included in the study. Quasi-experimental designs however, have to control for confounding
variables explicitly through statistical techniques and are therefore sometimes labeled as
correlational designs. Further, certain alternative hypotheses for instance, history effects, are
allowed to prevail: a choice of relevance and external validity over control and internal validity.
4.1.6.3. Experimental Manipulation
After PA was measured, subjects were randomly assigned to two experimental groups.
As noted above, the purpose of this experimental effort was to investigate the effect of
anticipatory emotions such as fear on the relationship between PA and CT. There are various
forms and causes of fear; personal fear, social fear, fears of physical danger, etc. Generally, fear

137
can be described as functional defense behaviour with survival advantages for the individual.
Fear could be learned (e.g. Pavlovian classical conditioning) or be evolutionary (e.g. fear of
snakes). Fear in this context refers to the personal fear of loss in a commercialization situation. It
should be noted that since subjects consider potential dangers (such as theft of their creative idea
in the future); there is the potential for fear to be mixed with anxiety at the point of
commercialization25. Lerner and Keltner (2000, 2001) find that fearful people made more
pessimistic judgments about the likelihood of adverse events and also made risk-averse choices.
The authors argue that the specific impact of an emotion on cognitive appraisal shapes the
willingness to take risks. Thus, fear is associated with low certainty, high anticipated effort, low
control, and medium responsibility.
The pathways of fear have been studied extensively through functional neuroimaging and
neuropsychological studies which relate the fear system to the amygdala26 (LeDoux, 1996, 1998,
see Zald, 2003 for a review). Other methods include physiological measures such as heart rate,
skin conductance, and facial electromyography. Studies typically use threatening stimuli such as
pictures (threatening or fearful faces), sounds and also masked stimuli (unconscious processing)
for fear inducements (Zald, 2003). Lang, Bradley and Cuthbert (1999) develop a set of normative
emotional stimuli for experimental investigations of emotion and attention. Findings have shown
these stimuli to be effective. For instance, within the same framework, Cuthbert, Lang, Strauss,
Drobes, Patrick, and Bradley (2003) assessed psychophysiological responses to fear memory
imagery and found participants to be significantly more reactive (in physiology and report of
affect) to fear than neutral cues.
25 Animal models conceptualize anxiety as a response to potential danger while fear is a response to present danger (Catherall, 2003) 26 The amygdala is a sub‐cortical nuclear group of neurons located deep within the brain in humans and other animals. It is regarded as the “heart and soul” of the fear system.

138
First Treatment It was believed that inducing ambient fear will create the environment
for subjects to perceive the fear of loss when presented with potential commercialization
partners. A pre-test of the first treatment used fearful pictures from the International Affective
Picture System (IAPS)27 pool (Lang et al., 1999) as a better alternative to other stimuli such as
sound. The IAPS database is a large set of standardized, emotionally-evocative, internationally
accessible, color photographs that includes contents across a wide range of semantic categories.
With regards to the database, emotions are defined as a coincidence of values on three strategic
dimensions: affective valence (ranging from pleasant to unpleasant), arousal (ranging from calm
to excited) and dominance or control. The database comes in CD-ROM format and includes over
900 pictures which were assembled from studies in which 12 sets of 60 pictures each, varying on
the dimensions identified, were rated in the course of 10 years (prior to 1999). Further, Mikels et
al. (2005) provide an image set from the IAPS which they find to be effective in eliciting
different discrete emotions, such as fear, more than others. Such a set avoids contamination of
the targeted emotions by other related emotions.
In this study, only pictures depicting threat-evoking emotions with negative valence
(such as snakes, tornadoes, gun threats), according to the data in Lang et al. (1999), were chosen
for the inducements. Subjects are first screened to ensure that they were willing to view
negatively-valenced graphic images. They were first shown four representative images excluded
from the experiment and only those who are willing to participate were employed for the
experiment. Subjects who refused were not included in the control group even though they were
allowed to finish the experimental process. Willing subjects viewed each image after which
27 Lang, Bradley and Cuthbert (1999) report on The International Affective Picture System (IAPS), the International Affective Digitized Sound system (IADS), the Affective Lexicon of English Words (ANEW), as well as other collections of affective stimuli, developed and distributed by the NIMH Center for Emotion and Attention (CSEA) at the University of Florida in order to provide standardized materials that are available to researchers in the study of emotion and attention.

139
irrelevant rating cards were provided for them to fill. In summary, subjects were taken through
the procedure with sample pictures before they begun and they went through the rest of the
pictures at their own pace. The control group was shown a set of neutral-to-scenic pictures. The
results for this pre-test are given below.
First Treatment Results:
Manipulation check asked subjects to rate the degree to which they felt the following
emotions when they saw the pictures. The results are noted in Tables 11. The table provides
descriptive statistics of subjects’ responses to the affective states experienced when they saw the
pictures. By the averages, subjects felt less fear and anger than disgust and sadness. Clearly the
manipulation did not have the desired impact on the subjects. The upper 95% bound for fear is
2.37, which is below “neutral” score.
Table 11 Descriptive Statistics for Affect-Type in Manipulation Check
N Minimum Maximum Mean Std. Deviation Fear 13 1 4 2.15 1.345 Disgust 13 1 5 2.92 1.656 Sadness 13 1 5 2.92 1.382 Anger 13 1 4 1.77 1.092
In further analysing just the fear factor, Table 12 was developed to show the frequency
distribution for the variable. The table provides the distribution for the scores from the various
facets of the 5-point scale. The tables shows that slightly more than half of the subjects (54%)
chose “not at all” when asked the extent to which they felt fear when they viewed the pictures,
while about 23% of subjects chose “somewhat”. Only 23% of the subjects felt fear to “a
considerable amount” while none felt fear by “a great amount”.

140
Table 12 Descriptive Statistics for Fear in Manipulation Check
Fear Frequency % Not at all 7 53.8 Somewhat 3 23.1 A considerable amount 3 23.1 A great amount 0 Total 13 100
In sum, with respect to the first treatment, albeit the small sample size, the results showed
that the fear manipulation using the IAPS pictures was not effective. In effect, the manipulation
was changed from picture-induced fear to a recall-induced fear of loss, presented in the second
treatment, reported below.
Second Treatment The poor pre-test results confirmed the view that it is almost
impossible to use fear inducing manipulations in such samples without evoking large demand
effects. Therefore, theoretically, following methods adopted from social psychology and
judgement decision making literature (e.g. loss aversion etc), a manipulation was designed to
directly evoke a sense of loss. Subjects in the treatment group were asked to describe a loss of a
personal possession in the past – in detail: providing details of the process of the loss, its effect
on them and if they expect that such a loss can occur again in the future. Similar methods can be
found in Keltner, Ellsworth and Edwards (1993) where subjects were asked to recollect events
that make them feel what they felt then (when the event happened). The self-report methodology
is also commonly used to elicit affective states (e.g. Smith and Ellsworth, 1985; Lerner and
Keltner, 2001). There is also generally, a tradition of studying the carryover effects of emotions
on economic decision making (see Lerner, Small and Loewenstein, 2004). The control group, on

141
the other hand, was asked to write about a recent realization they had or something interesting
that they recently observed.
Second Treatment Results Manipulation checks revealed no significant differences
between the control and treatment groups. Results are presented in Table 13 and Table 14. Table
13 provides descriptive statistics for the treatment and control groups before and after the study.
Before and after the study, subjects were asked to indicate on a five-point Likert-type scale their
affective state with the question “how do you feel?” A score below three (3) indicated that the
subject was in a bad mood and a score above three (3) means the subject is in a good mood.
Table 13 shows that in general, subjects were very slightly above neutral (3) (into the “good
mood” range, - Mean=3.39, Std. Dev=1.07) at the beginning of the study, compared to the end of
the study (Mean=3.30, Std. Dev=0.97). The difference is very small and any differences could
have been due to experimental fatigue rather the effects of the manipulation.
Table 13 Descriptive Statistics for Mood Changes before and After the Manipulation
Mood tests N Mean
Std. Deviation
Std. Error
95% Confidence Interval for Mean
Lower Bound
Upper Bound
Before Study Treatment 50 3.52 1.04 0.15 3.23 3.81 Control 45 3.24 1.09 0.16 2.92 3.57 Total 95 3.39 1.07 0.11 3.17 3.61 After Study Treatment 49 3.33 0.97 0.14 3.05 3.60 Control 43 3.28 0.98 0.15 2.98 3.58 Total 92 3.30 0.97 0.10 3.10 3.51
Further, still observing from Table 13, we see that the results for the treatment and
control groups also show that the mean mood for the treatment group seems to be slightly lower
after the study (Mean=3.33, Std. Dev=0.97) than before the study (Mean=3.52, Std. Dev=1).

142
Meanwhile the mean mood for the control group was just slightly higher (0.06 points) after the
study (Mean=3.28, Std. Dev=0.98) than before the study (Mean=3.24, Std. Dev=1.1). One will
expect both groups to express a lower mean mood after the study, at least due to experimental
fatigue, but the mood of the control group seem to have improved (very slightly) while that of
the treatment group declined. Following this lead, ANOVA28 tests were conducted to check for
statistical differences between these mood scores. The results shown in Table 14 indicate that the
mood changes between and within groups were not statistically significant.
Table 14 ANOVA Tests for Differences in Mood Before and After the Manipulation
Mood tests
Sum of Squares Df Mean Square F Sig.
Before Study Between Groups 1.80 1 1.79 1.60 0.21 Within Groups 104.79 93 1.13 Total 106.59 94 After Study Between Groups 0.05 1 0.05 0.05 0.82 Within Groups 85.43 90 0.95 Total 85.48 91
However, a paired-sample T test, which tests if the difference between two variables,
within group, is different from zero, suggested dissimilar results. Table 15 presents results that
suggest the mean difference in mood for the treatment group before and after the study was
statistically significant (p=0.019) from zero and insignificant (p=0.623) for the control group.
28 This was a one way ANOVA test which is a technique used to compare means of two or more samples or groups (based on the F-distribution)

143
Table 15 Results for Paired Differences in Mood for Experimental Groups Before and After the Manipulation
Paired Differences
T df Sig. (2-tailed)
Mood Mean Std.
Deviation
Std. Error Mean
95% Confidence Interval of the
Difference
Lower Upper Treatment group
Before Study - After Study 0.18 0.53 0.08 0.03 0.34 2.44 48 0.02
Control group
Before Study - After Study 0.05 0.62 0.09 -0.14 0.24 0.50 42 0.62
Delving deeper into the change in mood, subjects were also asked to indicate “the extent
to which their mood had changed since they started the study” and “the extent to which their
mood was affected by remembering the loss they suffered”. These questions were scored on a 5-
point Likert-type scale. The descriptive statistics for these two questions are provided in Table
16. Given the neutral point as 3, both questions scored a mean of less than 3 – indicating “little”
change, if any. However, the means were lower for the treatment group (Mean=1.73) than the
control group (Mean=2.91) especially on the question of the extent to which mood is affected by
narration. The treatment group indicated that there was very little change in their mood during
the study while the control group indicated more change than the treatment group. This
difference is possibly due the differences in the manipulation tasks.

144
Table 16 Descriptive Statistics of Mood Changes Before and After The Study
Extent of mood change since study
begun Extent to which mood is affected by
narration of loss suffered
All Treatment
group Control group All
Treatment group
Control group
Mean 2.91 2.88 2.95 2.28 1.73 2.91 Median 3.00 3.00 3.00 2.00 1 3.00 Std. Deviation 0.48 0.48 0.48 1.25 1.02 1.21 Minimum 2 2 2 1 1 1 Maximum 4 4 4 5 4 5 N 92 49 43 92 49 43
Further, frequency distributions of the two questions were also computed and the results
reported in Table 17 and Table 18. About 76% of the subjects indicated that there was no change
in their mood in the course of the study. About 16% indicated their moods changed for the worst
while about 8% indicated that their mood changed for the better. There were no differences in
the pattern of the categories within which the treatment and control groups indicated the extent to
which their moods changed during the study. Most subjects in the treatment and control groups
expressed no change (around 76%) in their mood.
Table 17 Frequency Distribution for Mood Changes Within the Treatment and Control Groups
Extent of mood change since study begun
All Treatment group Control group
Frequency % Frequency % Frequency % Change for the worst 15 16.3 9 18.4 6 14.0
No change 70 76.1 37 75.5 33 76.7
Change for the better 7 7.6 3 6.1 4 9.3
Total 92 100.0 49 100.0 43 100
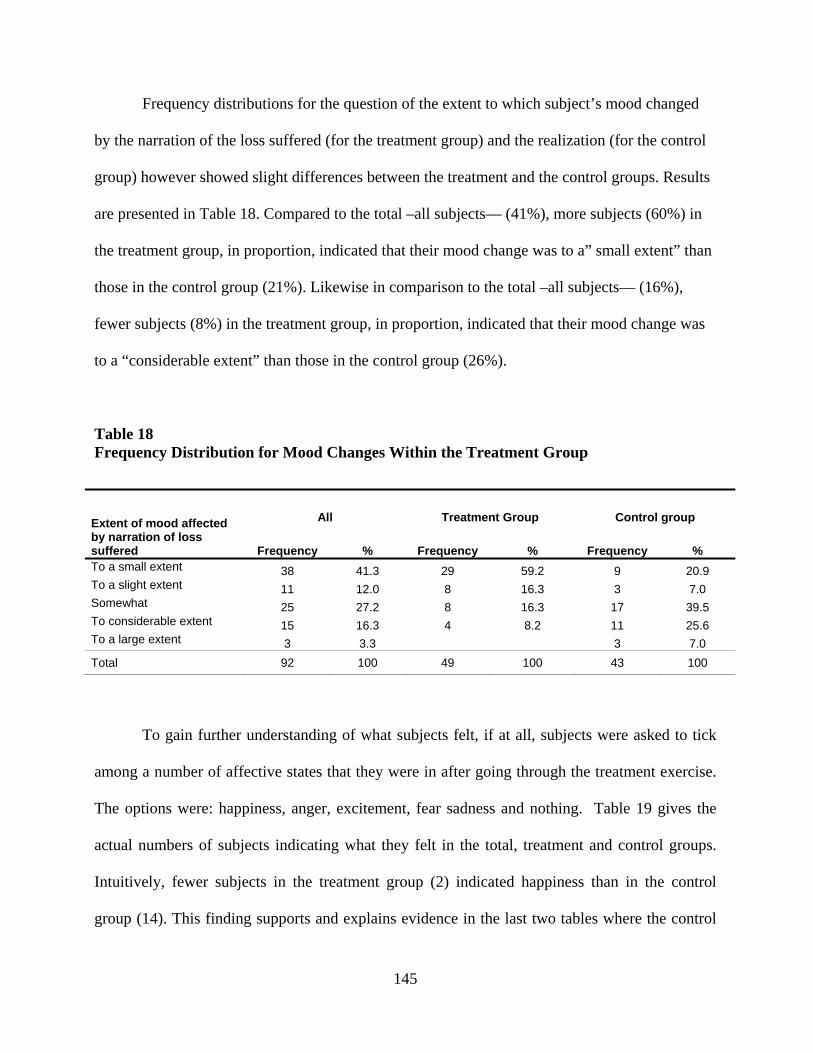
145
Frequency distributions for the question of the extent to which subject’s mood changed
by the narration of the loss suffered (for the treatment group) and the realization (for the control
group) however showed slight differences between the treatment and the control groups. Results
are presented in Table 18. Compared to the total –all subjects— (41%), more subjects (60%) in
the treatment group, in proportion, indicated that their mood change was to a” small extent” than
those in the control group (21%). Likewise in comparison to the total –all subjects— (16%),
fewer subjects (8%) in the treatment group, in proportion, indicated that their mood change was
to a “considerable extent” than those in the control group (26%).
Table 18 Frequency Distribution for Mood Changes Within the Treatment Group
Extent of mood affected by narration of loss suffered
All Treatment Group Control group
Frequency % Frequency % Frequency % To a small extent 38 41.3 29 59.2 9 20.9 To a slight extent 11 12.0 8 16.3 3 7.0 Somewhat 25 27.2 8 16.3 17 39.5 To considerable extent 15 16.3 4 8.2 11 25.6 To a large extent 3 3.3 3 7.0 Total 92 100 49 100 43 100
To gain further understanding of what subjects felt, if at all, subjects were asked to tick
among a number of affective states that they were in after going through the treatment exercise.
The options were: happiness, anger, excitement, fear sadness and nothing. Table 19 gives the
actual numbers of subjects indicating what they felt in the total, treatment and control groups.
Intuitively, fewer subjects in the treatment group (2) indicated happiness than in the control
group (14). This finding supports and explains evidence in the last two tables where the control

146
group had noted more change in mood than the treatment group. The result is expected since the
control group was asked to write about an event that gave them a realisation they felt was
“interesting” while the treatment group was asked to recollect and note down a loss of a personal
property that was “dear to them”. This also explains why many more in the treatment group (15)
reported sadness than in the control group (3). However, with the affective state of interest –
fear— the number of subjects reporting this state (2) was less than in the control group (4).
Clearly, the concept of fear of loss did not explicitly connect with incidental fear. There is also
the possibility of social desirability effects here, as subjects in the treatment group might sense
that the loss narration was designed to make them feel fearful and therefore made a conscious
effort to not report that affective state.
Table 19 Descriptive Statistics of Subject’s Specific Feelings after the Study
What subject felt after the manipulation All Treatment group
Control group
Happiness 16 2 14 Anger 8 6 2 Excitement 7 1 6 Fear 6 2 4 Sadness 18 15 3 Nothing 58 30 28 Total 113 56 57
NB: Subjects had the option of choosing more than one emotion therefore the total number of responses is greater than the number of subjects
In effect, hypothesis H4b on the moderating effect of anticipatory emotional reactions on
the relationship between attachment and control orientation is not supported. However, it should
be noted that, under the circumstances, lack of support for this hypothesis is due in part to failure
of the manipulation or treatment employed. A better designed manipulation might unearth the

147
effects expected. Although the accepted test for differences between and within groups for the
various measures (ANOVA) yielded no significant results, various descriptive statistics
suggested differences might exist between the groups. To ensure that any “hidden” differences
did not exist to affect the results in other tests, a dummy variable was created for the
experimental groups for further analysis (1=treatment group, 0=control group). For illustration,
this dummy variable was included in a regression of CT on its correlates. The coefficient for the
dummy variable was not significant (β = 0.22, p=0.11). But, there was a very weak significance
for estimated project value (β = 0.14, p=0.09). However, due to the weakness of the significance,
this result is not explored further. With slimmer chances of testing for moderation, while
maintaining that some sort of moderation of the relationship between PA and CT takes place, I
turned to the data to identify variables that could be used as moderators to test for possible
effects.
Additional moderation tests: identified moderator One of the variables employed in the
cognitive evaluation computation (also included as a correlate in testing for effects on CT) is
conceptually close to the indication of threat perception from the microeconomic environment.
As previously reviewed and reported, subjects were asked to indicate the likelihood of loss of the
opportunity (the IP) in future market attempts. To briefly recap, subjects were asked to assume a
commercialization decision scenario where they choose a partner, an outsider, to assist in the
process. They were told that they know little about this outsider but the relationship can be
successful or unsuccessful. Among other questions, subjects are specifically asked “How likely
is it that the company (the partner) forcibly takes over ownership of the project idea?” The
question was scored on a 10-point scale. As previously reported, the distribution of subjects’
responses were almost Normally distributed (Mean=5.28, Median=5, Std. Dev=2.04). About

148
half, 46%, of the subjects, noted that the chances of losing the project to the outsider were more
than 50% (see Appendix 5.7 for the distribution). This variable was therefore considered for
moderation analyses. Other variables eliciting likelihood were not considered appropriate to
include in computing a composite moderation variable. These other variables asked about the
likelihood of the project being imitated or the outsider including hidden clauses in a contract
with the subject. These perspectives do not directly and necessarily lead to a loss of the idea and
therefore were excluded in the moderation test.
Additional moderation tests: Results Hierarchical multiple regression is employed in the
analysis since the predictor (PA) and the moderator are measured on the continuous scale
(Aguinis, 1995). To proceed, the predictor and moderator variables were standardized to avoid
multicollinearity (high correlations) between the interaction tem and the predictor and moderator
variables (Aiken and West, 1991, Cohen et, al, 2003). Standardizing also enables easier
computation of standard deviations around the mean in plotting the moderator effects. After
standardizing, the interaction term was created by computing the product of the standardized
predictor and moderator variables (PA and likelihood of loss – LL).
To test for interactions in the hierarchical regression process, the variables were added in
steps as was done in testing the effects of PA on CT earlier (Aiken and West, 1991, Cohen et, al.,
2003). The first step involved testing the main effects of the predictor and moderator variables
and the second step involved adding the interaction term (Aiken and West, 1991, Cohen et, al.,
2003, Judd et al., 1991). The next activities involve interpreting the effects of the predictor and
the moderator variables; testing the significance of the moderator effect and plotting the
significant moderator effect.
For completeness, the three variants of the predictor were considered: the multiple-item
PA, the positive affective dimension of PA and the two-item PA measure. Regression tests with

149
the multiple-item PA variable failed to identify any significant effects for the moderator. The
moderator variable was not statistically significant (β = 0.07, p=0.28) on the second step as
described above. The F change was also not significant (F=1.17, p=0.28). The positive affective
states dimension was also tested and reported no significance for the moderator coefficient (β =
0.09, p=0.25) and the F change (F=1.33, p=0.25). However, when the two-item PA was
considered, there were some significant observations recorded. These results are shown in Table
20 below.
Table 20 Hierarchical Regression Analysis for Testing Moderation of PA on CT
Predictors Model
1 Model
2 Constant 3.82** 3.85** (0.06) (0.06)
PA (two-item) 0.17* 0.18** (0.06) (0.06)
Likelihood of loss (LL) 0.03 0.02 (0.07) (0.06)
Interaction term (PA x LL) 0.11† (0.06)
R2 0.11 0.17
R2 adjusted 0.08 0.12
R2 change 0.06
F 3.52* 3.68*
F change 3.67† (N, 60), ** p < 0.01, * p < 0.05, † p < 0.10
Model 1 tests the main effects of PA and likelihood of loss. The results show that PA was
statistically significant (β = 0.17, p=0.01) while the likelihood of loss (LL) was not (β = 0.03,
p=0.71). Model 2 is the addition of the interaction term to Model 1. The results show that while
PA improved in significance (β = 0.18, p=0.006), likelihood of loss remained not significant and
the interaction term was weakly significant (β = 0.11, p=0.06). The Model statistics also showed

150
a small increase in R2 (0.06) moving from Model 1 to Model 2. This means that the interaction
between PA and LL explained an additional 6% of the variance in CT scores over and above the
11% explained by the first order effects of PA and LL alone. The F change was also significant
(F=3.67, p=0.06). The indications are that they may be evidence of moderation between PA and
CT when the two-item PA measure is used29. The lack of effects from the multiple-item and
positive affective states dimensions is difficult to explain: except to speculate that the two-item
measure used more direct questions on attachment although the potential for social desirability
bias on the part of subjects in answering the question cannot be ruled out.
Since some significance was found for the interaction term, a moderation plot was
developed to assess the results further. A common procedure recommended by Cohen et al.,
(2003) is to choose the groups at the mean and at low (1 standard deviation from the mean) and
high (1 standard deviation from the mean) values of the continuous variable. Figure 9 shows the
interaction plot developed with predicted values that are calculated by multiplying the
unstandardized regression coefficients for each variable by the appropriate value (-1, 1) for each
variable in the regression equation.
29 To check the effects of controlling for the other correlates used earlier in testing CT (Table 9), the following procedure was followed. Correlates were entered in the first step of the regression equation, followed by the predictor variable, moderator variable, and interaction term in the last step. In evaluating the last step, there was no significance recorded for the moderator variable (β = 0.07, p=0.31) and the F change (F=1.06, p=0.31).

151
Figure 9 Interaction between Psychological Attachment (PA) and Likelihood of Loss (LL)
High LL 3.58 3.87 4.17 Mean LL 3.67 3.85 4.03 Low LL 3.77 3.83 3.90
(N,56), Solid triangles- low LL, solid squares – mean LL and solid diamonds – high LL
The plot shows some interaction between PA and LL in predicting CT. The differences in
groups, in terms of control tendency, were larger in the high PA than in the low PA condition.
Subjects with a highest level of CT (CT=4.17) were those who perceived a high likelihood of
loss with high PA. This was higher compared to subjects who perceived a low likelihood of loss
with high PA (CT=3.90). Subjects perceiving high and low likelihood of loss with mean PA
were similar in their CT scores (CT=3.87, CT=3.83 respectively) and subjects perceiving high
and low likelihood of loss with low PA did not differ as much (CT=3.58, CT=3.77 respectively)
as those with high PA, in their CT scores. Essentially, given high PA, when there is a high
likelihood of loss perceived, CT is also high. The results indicate the potential for investigating
the moderation of PA on CT in further studies.

152
Chapter 5
There are a number of decision making areas in venture commercialization where control
tendency can be studied. One interesting area is entrepreneurial financing where entrepreneurs
seem to prefer control in financing decisions. This preference sometimes implies choosing
internal financing over external financing when ownership is at stake. This chapter discusses PA
and control in terms of preferences for external financing.
5.1 Control Tendency in Financing Decisions
5.1.1 Types of Financing
Choosing the appropriate financing package has tremendous implications for the
performance of the new venture. The implications are more pronounced from the viewpoint of
the entrepreneurial equity gap – shortage of financing availability (various sources). There is
much debate about whether the equity gap results from insufficient supply of funds or from the
prevalence of market problems such as information asymmetry, agency costs and moral hazard
problems (Hillier and Ibrahimo, 1993) (see the introduction to this thesis for discussion).
However, it is clear that in any commercialization partnership or contract, such market problems
will impact on most of the conditions governing the financial offers as well as perceptions
guiding acceptance of these offers. Both financiers and entrepreneurs react to these problems in
unique ways. Their individual reactions, however, depend on the type of venture financing
pursued.
There are two types of financing strategies for venturing: internal and external financing.
Internal financing involves producing funds from business operations or through close personal

153
relationships with no financing conditions and therefore avoiding most transaction costs.
External financing is simply raising money through debt or equity. Intuitively, there is no reason
to doubt that an equity gap exists, entrepreneurs and start-ups are credit constrained, and
therefore often need to resort to external financing. However, the transaction costs involved in
external financing coerces some to avoid that route even if such avoidance is costly. Some
entrepreneurs will avoid external finance to retain control even if performance suffers as a result.
5.1.2 Literature Review: External Financing
For the sake of illustration, I recount some of the literature reviewed in the introduction
and literature review sections of this thesis. I recap the literature on venture capitalist financing
and introduce the literature on angel financing to compare and contrast with venture capital
financing. As previously noted, there is evidence to suggest that entrepreneurs prefer internal
financing over external financing especially if it affects ownership (Winborg and Landström,
2001; Cressy, 1995; and Berggren, Olofsson, and Silver, 2000). Cressy (1995) relates the
phenomenon to control aversion where entrepreneurs are averse to losing control of the
opportunity, although aware that relinquishing some control would improve performance (Cressy
and Olofsson, 1997). Müller (2007) argues that founders tend to remain in control and forego
some growth opportunities, if the opportunities are too extensive to be realized with debt finance
alone. These founders are content paying higher interest rates for additional loans in order to
maintain control. The implication is that their firms are limited in their growth potential.
However, as prefaced in the introduction to this thesis, in being control-oriented,
entrepreneurs are simply reacting to financier strategies that attempt to wrestle control from
entrepreneurs in the bid to safeguard investments. The notion of financiers seeking control is
well studied in the venture financing literature with respect to agency problems — when the

154
economic incentives of the financier (principal) and entrepreneur (agent) are not costlessly
aligned (Pratt and Zeckhauser, 1985). To combat agency problems, the financier can either;
design an optimal contract (Jensen and Meckling, 1976) through pre-investment screening and
due diligence; or use the incomplete contracts approach which concentrates on the post-contract
allocation of control rather than the pre-contract screening and contract writing (Hart, 1995).
Venture capitalists Financiers such as venture capitalists (VCs) often resort to either
principal-agent or incomplete contracts or both approaches to combating agency problems.
Especially in the incomplete contracting paradigm, entrepreneurs and venture capitalists (VCs)
are known to wrestle over control rights due to conflicting objectives (Hart and Holmström,
1987, Hart, 1995, and Kaplan and Stromberg, 2003). A VC is a person or entity that provides
financing for new, growing or struggling businesses from a venture fund (a pooled investment
vehicle that invests third party capital in ventures too risky for the standard capital markets or
bank loans)(various sources). In VC financing, control rights are allocated such that the VCs
obtain full control if the company performs poorly (Kaplan and Stromberg, 2003). But to boost
the entrepreneur’s performance, VCs typically give up some of their control and liquidation
rights, enabling the entrepreneur to obtain more control rights, when company performance
improves. However, since VCs need to reduce information asymmetry to provide sufficient
funds, agency costs increase and their control over the opportunity also increases. They typically
need to assert considerable control over the opportunity to safeguard their investment of effort
and money as well as ensure high performance. Nevertheless, we have seen from the foregoing
that entrepreneurs’ perception of conditions for financing might be affected by their level of
attachment to the opportunity. Initial control terms in a contract might prevent some from
accessing these opportunities.

155
Angel investors Another group of external financiers that are somehow different from
VCs are Angel investors (Angels). Angels are “private individuals using their own money
directly in unquoted companies in which they have no family connection” (Mason and Harrison,
1996). Angels dominate early stage entrepreneurial investment - making 30 – 40 times as many
deals as VCs, and risking about the same amount of dollars - $23.1 bn (Center for Venture
Research, 2005) compared to $23.0 bn (Moneytree, 2006). Angels invest their own money at the
high-risk stage of a venture's existence (Freear, Sohl and Wetzel, 2002) which is often a catalyst
for subsequent VC investment (Shepherd and Zacharakis, 2001).
There are differences in Angel and VC financing, although there are basic similarities in
their financing conditions. For example, Zacharakis and Meyer, (2000) suggests four main
categories on which VCs base their decision: entrepreneur/team capabilities, product/service
attractiveness, market/competitive conditions, and potential returns if the venture is successful.
However, Angels do not necessarily use these categories. Feeney, Haines and Riding, (1999)
note that although Angels view management ability as important, they tend to concentrate on the
growth potential of the opportunity and how reliable and capable the entrepreneur is in ensuring
that growth potential. Hence, the Angel is more likely to value the entrepreneur’s role in the
business more than the VC, leading to differences in their contract preference. Van Osnabrugge
(2000) suggests that VCs may prefer the principal-agent approach partly to demonstrate
responsible conduct in competing for fund provider’s money (Van Osnabrugge, 2000) and partly
to signal competence and reliability in the VC marketplace (Sapienza et al. 1996). Similarly, Fiet
(1995) suggests that VC’s are more concerned about market risks or those risks due to uncertain
market conditions that affect the size of the growth and accessibility of the market. In contrast,
Van Osnabrugge (2000) suggests that Angels may prefer the contracts incompleteness approach.

156
Angels are also concerned with agency risks but they will tend to place more emphasis on the
“fit” with the entrepreneur as an important ingredient in combating divergence in interests.
5.1.3 Predictions
Preference for Angel vs. VC financing given a level of PA From the foregoing, the
indications are that, generally, entrepreneurs at the early stage of development may prefer Angel
investment to VC investment. Angel investment is more associated with early stage financing
and serves to prepare the opportunity for larger VC financing (Shepherd and Zacharakis, 2001).
Also, entrepreneurs and technology developers might prefer Angel investors due to the
connotation of the label “Angel”. They might view an Angel investor more like a “helper” than a
profit-hungry investor (often associated with VCs in the business press). Entrepreneurs may also
prefer Angel investors because of the more “informal” approach they bring to due diligence and
contractual deliberations, compared to the VC.
However, it should be noted that both VCs and Angels employ control strategies to
minimise investment risk. According to the literature just reviewed, the VC typically demands a
high level of decision making control –while the Angel typically seeks to participate in the
venture with the entrepreneur – in order to enhance the value of the business and also mitigate
the risks. These forms of control limit the entrepreneurs’ independence, autonomy and rights
over his or her creation. Hence highly attachment entrepreneurs, not willing to share control with
financiers, will be weary of accepting external financing of any kind (as seen in the empirical
evidence presented above).
In effect, high levels of PA may increase CT as entrepreneurs perceive avenues for
opportunism on the part of potential financiers. Opportunistic possibilities arising from
informational asymmetries are quite pervasive during commercialization (Williamson 1979,

157
1985). As such, although VCs possess high matching abilities and are capable of matching
entrepreneurs to essential financial resources; and BAs provide flexible finance terms and invest
industry experience alongside funds; a high level of attachment is likely to increase developers’
preference for control even if they cognitively realise that relinquishing some control would
improve performance.
H4: High levels of psychological attachment are more likely to lead to strong control preferences in making financing choices, than low levels of attachment.
5.1.4 Measures and Analysis
Measures: Control preferences in financing decision Subjects were provided with
generic information about commercialization, its definition and one-sentence description of a
venture capitalist (VC) and an Angel investor. They were then provided with pairs of offers from
a VC and an Angel with a share structure designed such that an optimal set of offers and takes
could be easily determined. Table 21 presents the percentage shares of equity that financiers
expect to take in six rounds of paired financing (VC paired with Angel). The first row indicates
the rounds or deals presented to subjects. The second row provides the VC’s equity demanded, in
percentages, for $4m investment into the company in each round presented to subjects. The third
row provides the Angel investor’s equity demand for a $2.5m investment in the company for
each round listed. It could be observed that the VC’s equity stake demanded decreased from 55%
in the first round to 50% in the 6th round, in unitary decreases over the period. The Angel’s
shares demanded increased from 45% in the first round to 50% in the 6th round. Also, the
Angel’s offer is just a little more than half (62.5%) the offer presented by the VC.

158
Table 21 Percentage Takes In Venture Capital and Angel Investor Financing Decision Contexts
Rounds 1 2 3 4 5 6
VC offers $4m, takes shares %
55 54 53 52 51 50
Angel offers $2.5m, takes shares %
45 46 47 48 49 50
Further, subjects were told that in partnering to commercialize, whichever party held
more than 50% shares effected decisions on product development, finance, sales etc (See
Appendix 2 for questionnaire). In each round, subjects were required to pick one option, the
VC’s offer or the Angel’s offer. For instance, in the first round subjects choose between Option
A: A VC offer of $4m with a 55% VC equity stake and Option B: An Angel offer of $2.5m with
a 45% Angel equity stake. The six pairs were presented individually on separate pages with
alternating positions for the options in each subsequent pair presented. The design takes
motivation from the notions of loss aversion and the violations of first-order stochastic
dominance in the work of Kahneman and Tversky (1979)30. On each round it was optimal to pick
the VC’s offer over the Angel’s offer. Table 22 provides calculations that reveal the optimal
choice in each round.
30 In prospect theory, loss aversion refers to the tendency for people to strongly prefer avoiding losses than acquiring gains. Some studies suggest that losses are twice as psychologically powerful as gains. First order stochastic dominance - The original version of prospect theory showed violations of first-order stochastic dominance (a situation where one lottery - a probability distribution over outcomes - can be ranked as superior to another. It is based on preferences regarding outcomes - e.g., if each outcome is expressed as a number, i.e. gain or utility, a higher value is preferred).

159
Table 22 Venture Capital and Angel Investor Offers and Developers Takes
Venture capitalist A B C D E F G H
Deal Offer Takes Pre-money
value Total
valuationDeveloper’s
share Developer’s
value 1 4 0.55 3.27 7.27 0.45 3.27 2 4 0.54 3.41 7.41 0.46 3.41 3 4 0.53 3.55 7.55 0.47 3.55 4 4 0.52 3.69 7.69 0.48 3.69 5 4 0.51 3.84 7.84 0.49 3.84 6 4 0.5 4.00 8.00 0.50 4.00
Angel investor
Deal Offer Takes Pre-money
value Total
valuationDeveloper’s
share Developer’s
value
Deal value difference: VC - Angel
1 2.5 0.45 3.06 5.56 0.55 3.06 0.21 2 2.5 0.46 2.93 5.43 0.54 2.93 0.48 3 2.5 0.47 2.82 5.32 0.53 2.82 0.73 4 2.5 0.48 2.71 5.21 0.52 2.71 0.98 5 2.5 0.49 2.60 5.10 0.51 2.60 1.24 6 2.5 0.5 2.5 5 0.5 2.5 1.50
Column A is the list of rounds or deals presented to subjects (as shown Table 21).
Column B represents the offers from the potential financiers: VCs offer $4m and Angels offer
$2.5m. Column C provides the percentage of equity takes that the financiers demanded. E.g. For
the first deal VCs requested 55% equity in the business when they offered $4m as was shown in
Table 21. Column D presents a calculation of pre-money valuation, which is the value of the
business before investment. Investors use the pre-money valuation to determine the amount of
equity to demand for the amount invested. In this example for Column D, it is calculated as offer
x (1-% take) / % take. For example, for the first round, the Angel offered $2.5m and demanded
45% equity. Using the formula, the pre-money valuation is calculated as 2.5 x (1-0.45) /0.45 =
3.06.
160
Hence, the pre-money valuation when the Angel offered $2.5m and demanded 45%
equity is $3.06m. This implies the total valuation of the company is $2.5m + $3.06m = $5.56m.
Note that for the $5.56m total valuation, the 55% equity stake accruing to the developer amounts
to $3.06 – the pre-money value. Having identified the total valuation and pre-money valuation,
the investor evaluates the investment against the economic environment. For instance, in this
example, the Angel has to determine that the business is worth $5.56m before committing the
$2.5m for the 45% stake. Otherwise, the Angel can proceed to update the investment amount, the
shares demanded or both.
Column E in Table 22 provides the total valuation of the company (offer added to the
pre-money valuation) given the offer and percentage equity stakes. Column F showcases the
percentages of developer equity stakes as shown in Table 21 above. Column G indicates
developers’ stake in the company in million dollar amounts (which also equals the pre-money
valuation as shown in the example above.
To determine the optimal offer, compare Column G for the financiers and developers
across the rounds or deals. One can observe that for every deal the value of the developer’s stake
in the company is higher from the VC offer than from the Angel’s offer. Column H provides the
difference between developer values for the VC and Angel for each deal. E.g. for the first deal,
the difference, $3.27 - $3.06, equals $0.21m. The deal value in Column H is positive for each
deal and increases throughout the deals from $0.22m to $1.50.
Essentially, subjects employing a cognitive model in their evaluations are expected to be
close in judgement to realising the VC option as optimal in all deals31. In effect, the hypothesis
31 Note that even without the pre-money valuation calculations, the percent structure of stakes and offers, provides subjects with enough information to realise the optimal offers provided by the VC. Since the VC offers $4m and the Angel, $2.5, simple calculations quickly reveal the optimal offer in each paired deal. For example, adopting the developer’s percent stakes for illustration, the highest amount a developer obtains in equity within the VC offers is

161
tested with this design thrives on the notion that when PA is high and therefore the evaluation
process is affect-biased, subjects are likely to concentrate on how much control they are
relinquishing to the VC rather than the optimal offers the VC presents. It should be stressed that
the information presented to subjects was limited to the financiers’ percentage takes of equity
and offers (see Appendix 2 for questionnaire). In effect, subjects were expected to make choices
more according to what they feel about control and the consequences of choosing the various
options.
Results: Control tendency in financing decisions The hypothesis of interest here is H5
(High levels of PA are more likely to lead to strong control preferences in making financing
choices, than low levels of PA). The multiple and two-item PA measures provided a similar
pattern of choices. The results from the use of the multiple-item PA are reported here, in the
main text, and those of the two-item PA measure are placed in Appendix 6. Table 23 provides
the proportions of subjects picking among offers in the high PA and low PA groups, computed
from a median split of the PA responses.
$2.2 (45% of the $4m offer in the first deal, when the VC demanded 55% equity), while the lowest is $2m (50% of the $4m offer, with VC demand of 50%). Conversely, the highest amount in the Angel offers for the developer is $1.38m (55% of the $2.5m Angel offer, when the Angel demands 45% equity), while the lowest is $1.25m (50% of the $2.5m Angel offer). Clearly, simple proportions show that the VC offers are optimal in all deal rounds. Hence, subjects are not expected to necessarily compute the pre-money valuation calculations to make the expected (normative) choices.

162
Table 23 Percentages of Subjects Choosing VC and Angel Offers
A Rounds of offers 1 2 3 4 5 6 VC Angel VC Angel VC Angel VC Angel VC Angel VC Angel
B High PA
% of subject choices 15 85 15 85 15 85 18 82 24 76 97 3
C a.8 b.47 a.8 b.47 a.8 b.47 a.10 b.45 a.13 b.42 a.53 b.2
D Low PA
% of subject choices 56 44 63 37 59 41 59 41 63 37 97 3
E c.25 d.20 c.28 d.17 c.27 d.18 c.27 d.18 c.28 d.17 c.43 d.2
F F 12.89** 18.68** 15.57** 12.72** 10.45** 0.02 G VC (offer $4m), takes
% 55 54 53 52 51 50
H Angel (offer $2.5m) , takes %
45 46 47 48 49 50
(N, 59), ** p < 0.01, * p < 0.05, † p < 0.10 Note: The cells denoted as a, b, c and d, indicate the percentages of subjects choosing within each round (deals) and sums up to 100%.
Using the alphabetical letter labels in the leftmost column and the numbers in the top row
(which denote the rounds/deals); I describe the cells in Table 23. The columns corresponding to
the rounds, 1,2,3..6, present the percentages of subjects preferring VC and Angel offers in each
round. Rows B and D, report these preferences within the high and low PA groups respectively.
For example, cell 1B (column, row), reports that in the first round of deals, subjects in the high
PA group preferred the Angel’s offer (85%) over the VC’s offer (15%). Also computed is the
distribution of subjects within each round on their preferences for VC and Angel offers in the
high and low PA groups. These are reported in the C and E rows and labelled a, b in the C row
and c, d in the E row for VC and Angel preferences respectively. a,b,c, and d sum up to 100%.
For instance, for the first round of deals, cell 1C reports a=8% (high PA subjects who preferred
the VC’s offer) and b=47% (high PA subjects who preferred the Angel’s offer); while the cell
1E reports c=25% (low PA subjects who preferred the VC’s offer) and d=20% (low PA subjects

163
who preferred the Angel’s offer). So, the highest percentage of offers in the first round was from
high PAs who preferred the Angel’s offer. These percentages add up to 100% for the subjects’
responses in the first round. The percentages across and within rounds are developed into charts
that provide a pictorial view of the distribution of subject responses (See Figures 11, and 12
below). Row F contains ANOVA results testing the differences between and within the high PA
and low PA groups and the VC and Angel groups. Row’s G and H provide the VC and Angel
equity demands (in percentages) for their investment. This is included in the table for
comparison sake. Rows B and D are developed into a pictorial presentation as shown in Figure
10 below (with row B on top and row D at the bottom of the diagram).

164
Figure 10 Percentages of Subjects Choosing VC and Angel Offers within High and Low Psychological Attachment Groups
F 12.89** 18.68** 15.57** 12.72** 10.45** 0.02
VC ($4m) takes % 55 54 53 52 51 50
Angel ($2.5m) takes % 45 46 47 48 49 50
(N, 59), ** p < 0.01, * p < 0.05, † p < 0.10
The results in Table 23 and Figure 10 indicate that, except for the last round, subjects
within the high PA group strongly and consistently preferred the Angel’s options, over the VC’s
options (see Row B in Table 23 and the top part of Figure 10). The Angel offered more control
to subjects (see row H) while the VC offered less control (see row G). These preference styles go

165
against the conventional economic wisdom that subjects should choose the VC offers because
they are economically optimal. However, subjects within the low PA group had a choice pattern
closer to the optimal set of choices as low PA subjects consistently preferred the VC’s offers (see
Figure 12– to be discussed). Despite the differences in their preference styles, subjects in the
high and low PA groups unanimously voted for the VC offer in the last round where the
financiers demanded 50% of equity with the VC providing $4m investment and the Angel, a
$2.5m investment. Further, there were remarkable statistical differences between and within
group for the first five rounds of deals but no significant difference for the last group of deals
(see F values in row F of Table 23).
To probe these results further, Figures 11 was developed to study distribution of
preferences within each round of deals (see Rows C and E in Table 23). Figure 11 plots the
percentages of subjects in the high and low PA groups preferring the VC and Angel offers within
the rounds, thereby presenting a more integrated view of how the sum of a 100 percentage points
is distributed among the groups in each round. The plot on the left (a) shows that from the first to
the fifth round, the largest group in each round of deals was the high PA group who preferred the
Angel’s offers. The next largest group was the low PA group who preferred the VC offers. The
two smaller groups were the low PA groups that preferred the Angel offers and these groups
were slightly larger than the high PA group that preferred the VC offers. The striking feature of
the plot is that the largest group preferring the VC offers in the last round of equal share offers
was the high PA group who had consistently preferred the Angel offers in the previous rounds.
Although, the low attachment group comparatively voted more for the VC in the previous
rounds, the high PA group oversubscribed to the VC position by 10% points (53% over 43%).

166
Figure 11 Percentages of Subjects in High and Low Psychological Attachment Groups Choosing VC and Angel Offers within Rounds (a) (b) (N,56); Solid triangles- High PA choosing Angel offer; solid squares – Low PA choosing VC offer; stars - Low PA choosing Angel offer; and solid diamonds – High PA choosing VC offer,
Finally, Figure 12 was developed to model the deviation from the optimal choice across
the 6 rounds of deals. For each round, the highest percentage of subjects preferring the VC or the
Angel was recorded and the corresponding developer equity share value noted. For instance, if
for the first round the majority preference was for the Angel, a value of $3.06 corresponding to
the developer’s equity share value (when the Angel invests $2.5m and demands a 45% stake)
was recorded. Figure 12 then plots the identified developer’s equity share values for the high and
low PA groups, alongside the optimal developer share values (which are the developer values
when accepting the VC offers). The plot shows that for each round, the low PA group preferred
the optimal choice (lines coincide). However, the high PA group deviated away from the optimal
choices till the last round when shares were of equal proportion. Nevertheless, it is striking to
observe that developer share value for the high PA group consistently decreased in deviation
from the optimal, spanning a range of $0.22m to $1.24m in the first to fifth rounds. By
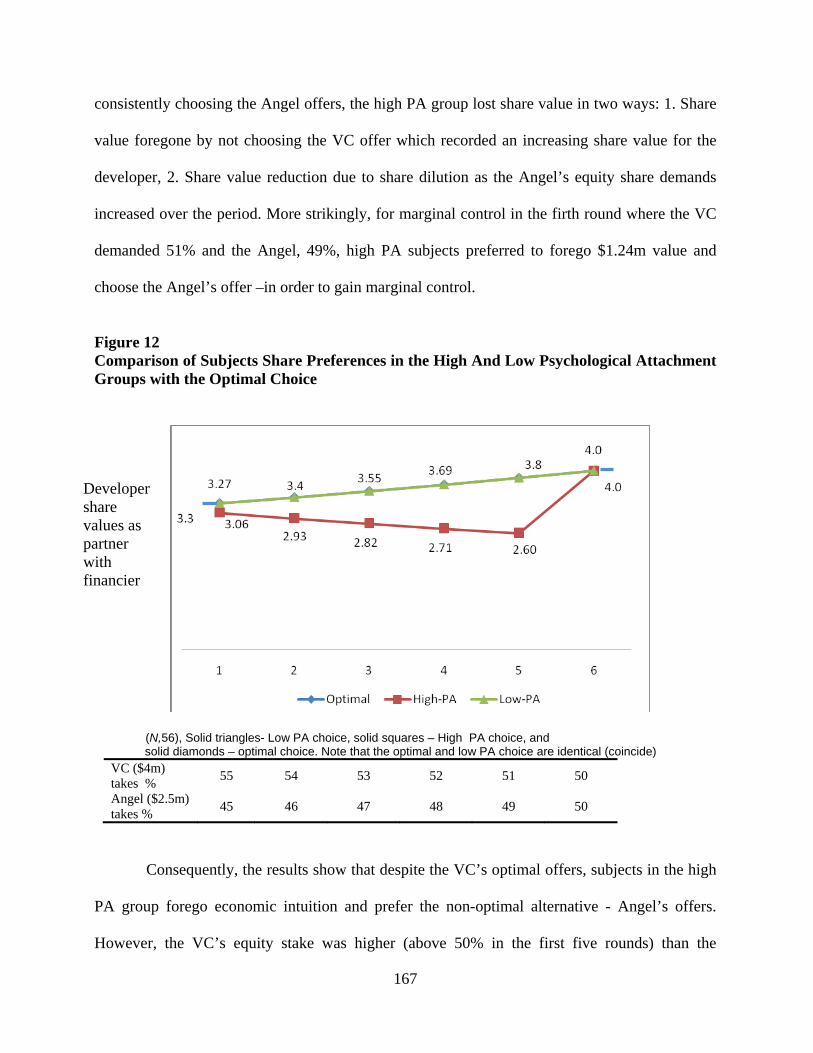
167
consistently choosing the Angel offers, the high PA group lost share value in two ways: 1. Share
value foregone by not choosing the VC offer which recorded an increasing share value for the
developer, 2. Share value reduction due to share dilution as the Angel’s equity share demands
increased over the period. More strikingly, for marginal control in the firth round where the VC
demanded 51% and the Angel, 49%, high PA subjects preferred to forego $1.24m value and
choose the Angel’s offer –in order to gain marginal control.
Figure 12 Comparison of Subjects Share Preferences in the High And Low Psychological Attachment Groups with the Optimal Choice
(N,56), Solid triangles- Low PA choice, solid squares – High PA choice, and solid diamonds – optimal choice. Note that the optimal and low PA choice are identical (coincide)
VC ($4m) takes % 55 54 53 52 51 50
Angel ($2.5m) takes % 45 46 47 48 49 50
Consequently, the results show that despite the VC’s optimal offers, subjects in the high
PA group forego economic intuition and prefer the non-optimal alternative - Angel’s offers.
However, the VC’s equity stake was higher (above 50% in the first five rounds) than the
Developer share values as partner with financier

168
subject’s stake but the Angel’s equity stake was lower (below 50%) than the subject’s equity
stake. Hence, to avoid the optimal offers of the VC implies that subjects were concerned about
VC control. This claim is substantiated by the results from the sixth round of deals where
subjects in the high PA group changed course and subscribed to the VC’s offer because both
financiers demanded 50% equity stake and the VC offered 60% more investment than the Angel.
Clearly, high PA subjects suddenly regained their economic wisdom when they encountered the
sixth round where the equity allocations put them at equal footing with the financier.
Therefore, given the correlation between PA and CT in previous analysis, evidence of the
high PA group preferring the Angel offers suggests that: 1. High PA can lead to the desire to
control in venture financing32 and 2. High PA can lead to disregard for rational intuition in
venture financing decisions and consequently lead to inefficient financing strategies. As noted a
few times already, Müller (2007) found founders to limit the growth potential of their firms by
being content with paying higher interest rates for additional loans in order to maintain control.
Given the results, H5 which predicted a control-orientation for high PA subjects in financing
decision preferences is strongly supported.
Financier’s ability To check for possible alternative explanations, such as low credence
for VC/Angel ability, subjects were later asked to indicate on a 5-point Likert scale the
importance of the VC or the Angel’s management ability in ensuring the success of the
commercialization effort33. Results are presented in Table 24 which shows the responses to
32 Note that in the instructions, subjects were told that whichever party has more than 50% equity holds sway in decision making 33 The question asked subjects to indicate the importance of the VC or the Angel without separating the two. The question could have asked subjects to allocate marks of importance to the two financiers and then correlated with PA in analysis. However, while probably unwise, the VC and Angel were lumped together for fear of comparing VCs and Angels. Note that the labels “VC” and “Angel” were employed for description purposes and do not denote differences in VC and Angel equity demands. In reality, both VCs and Angels may demand more than 50% stake in the business in order to control decision-making. Therefore the labels could have been “Financier 1” and “Financier
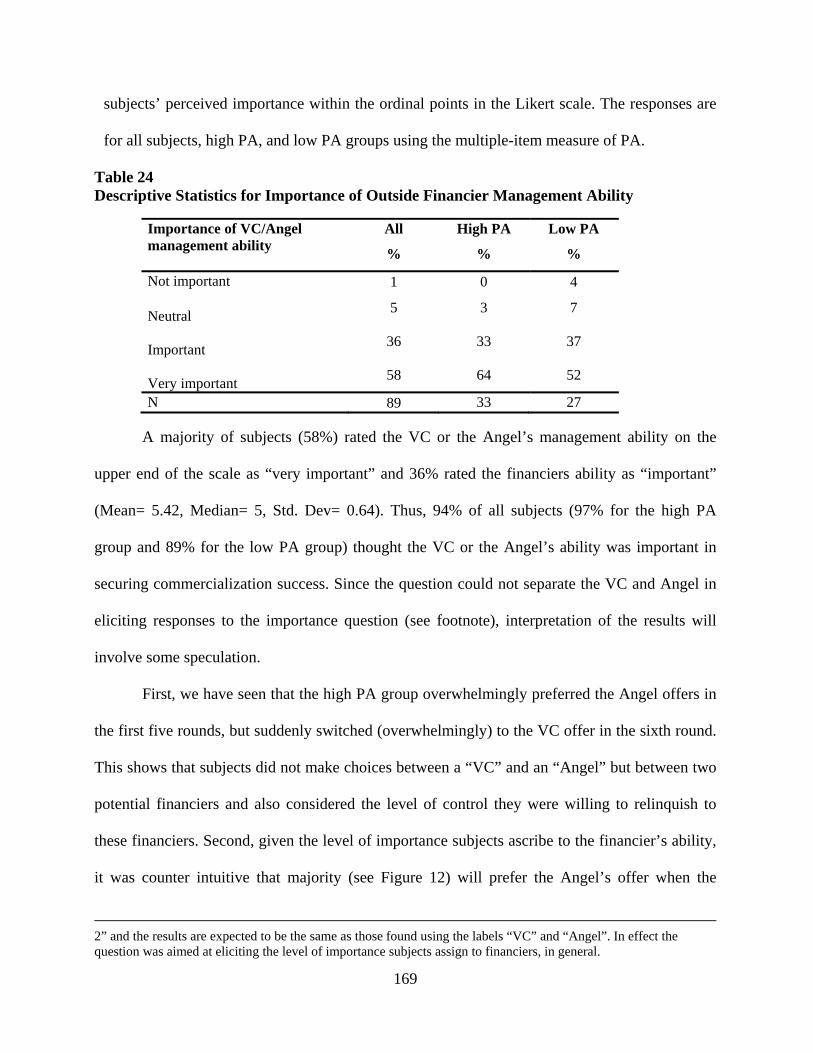
169
subjects’ perceived importance within the ordinal points in the Likert scale. The responses are
for all subjects, high PA, and low PA groups using the multiple-item measure of PA.
Table 24 Descriptive Statistics for Importance of Outside Financier Management Ability
Importance of VC/Angel management ability
All
%
High PA
%
Low PA
%
Not important 1 0 4 Neutral 5 3 7
Important 36 33 37
Very important 58 64 52
N 89 33 27
A majority of subjects (58%) rated the VC or the Angel’s management ability on the
upper end of the scale as “very important” and 36% rated the financiers ability as “important”
(Mean= 5.42, Median= 5, Std. Dev= 0.64). Thus, 94% of all subjects (97% for the high PA
group and 89% for the low PA group) thought the VC or the Angel’s ability was important in
securing commercialization success. Since the question could not separate the VC and Angel in
eliciting responses to the importance question (see footnote), interpretation of the results will
involve some speculation.
First, we have seen that the high PA group overwhelmingly preferred the Angel offers in
the first five rounds, but suddenly switched (overwhelmingly) to the VC offer in the sixth round.
This shows that subjects did not make choices between a “VC” and an “Angel” but between two
potential financiers and also considered the level of control they were willing to relinquish to
these financiers. Second, given the level of importance subjects ascribe to the financier’s ability,
it was counter intuitive that majority (see Figure 12) will prefer the Angel’s offer when the
2” and the results are expected to be the same as those found using the labels “VC” and “Angel”. In effect the question was aimed at eliciting the level of importance subjects assign to financiers, in general.

170
Angel’s equity share demand was lower than the VC’s, in the first five rounds. The worst culprit
was the high PA group who ascribed more importance to the financiers’ ability (97%) than the
low PA group did (89%). Yet, this group preferred to hold control over decision making in a
potential partnership deal with their preferred financier.
One will expect that if subjects view the financier’s ability to be important, they should
not strive to take over control of decision making from the financier (especially given the
background of these subjects). In effect, the results support evidence cited earlier that
entrepreneurs prefer control in financing decisions even when aware of positive effects on
performance. For instance, to repeat for illustration purposes, Cressy (1995) coins the term
“control aversion” to described situations where entrepreneurs are aversive to losing control of
the opportunity, although aware that relinquishing some control would improve performance
(Cressy and Olofsson, 1997).
In closing, high levels of psychological attachment seem to increase developers’ desire to
control as they likely overweight concerns over opportunism on the part of potential financiers.
More importantly, subjects are willing to forego optimal financial offers for marginal control
over their ideas. In addition to foregoing optimal offers, subjects also fail to incorporate their
stated beliefs that the potential financiers possess the resources (ability) to aid in
commercialization. These conclusions are derived from observations that highly-attached
subjects indicated belief in the ability of the VC/Angel but preferred to control decision making
even if this position was secured with marginal control over the idea and at the cost of foregoing
optimal financial resources.

171
Chapter 6
6.1 Discussion
The findings in this study support the underlying theory in this paper that psychological
attachment influences the perception of outcomes and therefore control preferences. Among the
key findings are the following. There is a positive effect of psychological attachment on control
tendency, controlling for personality factors and other statistical control factors such as the
subjective value of the developer’s project. As a proxy for how developers value their projects
and therefore the returns they expect from pursing it, no statistical significance for the effect of
estimated project value indicates the strength of psychological attachment in explaining control
tendency.
The results also highlight the possible differences between entrepreneurs’ cognitive and
affective evaluations of the commercialization environment, given a level of attachment to the
opportunity. In this study, subjects’ level of attachment was negatively correlated with their level
of cognitive evaluation employed in evaluating the microeconomic environment. Further, as
psychological attachment increased, the discrepancy between the proxy variables for objective
and subjective evaluations of the project and its outcomes, increased. Thus, affect-based
constructs such as attachment may cause entrepreneurs to overweight the possibility of losses,
inadequately weight probabilities of gains and lower their subjective expected value of future
commercialization outcomes even as the objective valuation increased. While subjects in this
study did not necessarily possess base rate information on the probabilities of the outcomes
presented to them, the pattern of correlations between these variables provide insight into
affective mechanisms governing entrepreneurial decision making at the commercialization stage.

172
The concepts were taken to a financing application context where subjects were
confronted with hypothetical financing options. The main finding was that high levels of
attachment are more likely to lead to control-oriented funding preferences than low levels of
attachment. Also, preferring control let subjects to forego optimal financing options. These
findings are very interesting due to the potential for economically bad choices as some
researchers have pointed out. For instance, as noted several times already, Cressy (1995) argues
that entrepreneurs are averse to losing control. Further, Cressy and Olofsson (1997), working
with Swedish data, argue that this aversion can persist even if entrepreneurs are aware that
relinquishing some control would improve performance.
As expected, high levels of attachment will increase the desire to control as entrepreneurs
become concerned with market issues and agency problems. Such a desire for control may be
especially strong for technology developers when they overweight the fears of opportunism on
the part of potential financiers. It should however be noted that depending on the level of equity
already invested, the developer might be indifferent to the contractual conditions and accept any
satisficing arrangement. In effect, attachment effects may be reduced in cases where external
funds are instrumental to the continual development of the technology. Landström and Winborg
(1995) find that when the firm experiences financial difficulties, the attitude towards external
financiers changes and tends to be more positive. However, in cases where the development
costs are low and attachment is high, one can envisage entrepreneurs avoiding necessary external
funding due to preference for control. Interestingly, such situations describe the cases of millions
of independent inventors who strive to either fill the shelves of hardware stores with new
creations or to develop new ventures on these ideas.
Considering other findings, personality-type factors such as Emotion-Based Decision-
Making, Machiavellianism, Risk-Taking and Need for Control were not significantly correlated

173
with control tendency. Machiavellianism was however weakly correlated with both
psychological attachment and control tendency. In an attempt to interpret this finding, one can
assert that when subjects felt they were capable of manipulating others, they were more attached
to their creative ideas and also desired to control the rights to their ideas. However, the effects of
Machiavellianism did not hold when other correlates were controlled for.
Nevertheless, the lack of effects for these personality-type factors is important because
the implication is that control tendency, as conceptualized in this study, is not an individual level
personality-type construct and also differentiates from control-type personality dispositions like
Need for Control. Thus, the implication for the field of entrepreneurship is that, irrespective of
entrepreneurs’ psychological or attitudinal dispositions, as effort is exerted in the creative
process and attachment increases, a control orientation develops. In effect, control tendency, as
described here, is essentially context-driven and depends on the relationship between the
opportunity and its developer.
In terms of construct of psychological attachment, an attempt was made to study its
dimensionality. Two theoretically-identified dimensions emerged, lending some statistical
credibility to the notion that the construct may have a multidimensional scale. Positive affective
states and self-identity-enhancing affective states seem to hold as two possible dimensions
(among potential others not operationalized here). Results from testing the effects of the
dimensions, individually, on control tendency, reported significant coefficients for the positive
affective states but not for the self-identity-enhancing states. The indications are that, albeit the
measurement errors in eliciting the latter, affective states that enhance self identity do not
necessarily lead to control tendency. This result is intuitive because, an entrepreneur who highly
identifies with the technology does not necessarily need to control the rights to the opportunity to
reach his or her commercialization goals. In effect, the investigation of dimensionality for the

174
construct achieved one objective – determining the extent to which positive affective states
determine psychological attachment. However, it also indicated that there is the need to further
investigate the issue of dimensionality to determine other possible dimensions of the construct.
All in all, the issue is not whether it is rational for entrepreneurs to be attached to their
ideas or to be control-oriented, but rather, the consequences excessive attachment and control
present to the decision maker. As affect-based constructs, the effects of attachment and control
tendency may be fleeting but are instrumental in entrepreneurial decision making because of the
potential for unalterable rash decisions with grave economic consequences. For example, a
control tendency in making decisions involving rapidly developing technologies can be
extremely counter-productive and inefficient. Also, the spontaneity with which entrepreneurs
react to their environment affords a fertile ground for affect-based constructs to play a part in
their decisions. Baron (2008) notes that affect is likely to influence cognition and behaviour in
entrepreneurial environments due to the unpredictability and rapid nature of change.
It may then be reasonable to suggest that the negative effects of psychological attachment
and control tendency in response to signals from the microeconomic environment may play a
role in rampant over-entry into markets and subsequent business failure. The reason is
psychological attachment and control tendency promote self-commercialization and dissuades
essential cooperation with outside parties. Thus, in cases where cooperation provides better
prospects, entrepreneurs may over-enter or fail. Thus, this work on affective biases may go a
long way to complement current research on cognitive biases in understanding entrepreneurial
decision making and entrepreneurial failure.
For practitioners, the issue of interest is how to reduce the effects of psychological
attachment. Although not tested in this study, methods to reduce attachment and therefore its
consequences may include: educating entrepreneurs and promoting disengagement from the

175
opportunity, either through reduced interactions or deliberate psychological depersonalisation in
the decision making process. Another issue is when to promote disengagement since
psychological attachment may be needed to motivate the entrepreneur to persevere during the
initial problem solving stages of the development process. Essentially, ways of de-biasing the
decision-making process of highly-attached entrepreneurs will increase efficiency and
performance. Further, from the regression results in this study, it appears assuring entrepreneurs
of their expected personal gains will decrease their desire to control. Therefore, contracts that
identify and assure entrepreneurs of their specific reward expectations may facilitate the transfer
of control to outside parties, reduce information asymmetry and possibly increase performance.
There may also be the need for more efficient government intervention in safeguarding
the intellectual property of smaller entrepreneurs as well as more efficient financing schemes.
Entrepreneurs will be hesitant to collaborate with outside parties if highly attached to the
opportunity and without the necessary safeguards and funds. This implies missed opportunities,
inefficient capital formation, and the risk of stifling innovation. Therefore, public policy schemes
aimed at ensuring the positive effects of psychological attachment and reducing its negative
effects will be socially desirable.
6.2 Conclusion
This thesis investigated the role psychological attachment to an entrepreneur’s
opportunity plays in decision making at the commercialization stage. Essentially, the thesis
explored the dimensionality of psychological attachment; the relationship between psychological
attachment as an affective construct and cognitive evaluation of the microeconomic

176
environment; the relationship between psychological attachment and control tendency; and the
effects of psychological attachment on control preferences within a financing context.
Entrepreneurs, especially in technology, are noted for opportunistically taking an
extemporized approach to strategy planning and implementation, considering potential revenue
opportunities as they present themselves, rather than having a long term focus (Gans and Stern,
2003; Bhide, 2000). The implication is that affect-based constructs such as psychological
attachment and control tendency cannot be ignored. This is especially so when these constructs
have the potential to influence decisions, in major ways, given the extent of unpredictability in
the entrepreneurial environment (Baron, 2008). The argument for the role of such constructs is
more compelling considering transactions costs and market problems in designing a partnership
contract with outside parties at the point of commercialization. Agency theory suggests the need
to preserve control as a leverage point for coercing partners to put up mutually beneficial
behaviour. For outside parties, it implies putting measures in place to control the rights to the
opportunity. For the entrepreneur, it implies safeguarding the rights to the opportunity to avert or
minimise opportunism and expropriation. A high level of psychological attachment will motivate
the entrepreneur to avoid such outside parties or if they are unavoidable, resist elements of the
partnership that threaten attachment to the idea.
The entrepreneur’s resistance and hesitation to partner is still expected even if the outside
party is in the position to contribute much needed resources to the commercialization effort and
even if the entrepreneur cognitively realises the outsider’s position. However, since
psychological attachment is affect-based, the chances that the entrepreneur’s fears are
unnecessarily heightened are rather high. Likewise, the chances that the entrepreneur’s
evaluation of the micro-economic environment is biased are also high. Hence, a high level of
attachment leads to biased perceptions and inefficient strategies. So, although attachment to the

177
opportunity might motivate the entrepreneur to persevere and also signal value to investors,
attachment can also prevent the entrepreneur from effectively evaluating commercialization
outcomes, choosing efficient market entry strategies and performing well.
Data collected from 106 fourth-year engineering design students from a top engineering-
focused Canadian university, provided some interesting results. In the model estimated, the
higher subjects’ psychological attachment was to the opportunity the more control oriented they
were. Subjects’ perceived project value was statistically insignificant as a statistical control
variable. The implication being that psychological attachment is a strong predictor of control
tendency even when subjects’ perceptions of projected returns (value) are controlled for. Also,
perceived likelihood of achieving success through outside party assistance correlated negatively
with control tendency. From correlational analysis, when subjects’ psychological attachment
increased, their level of cognitive evaluation of the microeconomic environment decreased even
if they previously rated the project high. The indication is that, as an affect-laden construct,
psychological attachment can lead to a decrease in objective, logical and cognitive evaluation of
commercialization outcomes.
Further, alternative explanations for control tendency failed to hold as individual
personality-type factors such as Emotion-Based Decision Making, Machiavellianism, Risk-
Taking and Need for Control were not significant in explaining variability in control tendency.
Control tendency may therefore be context-dependent, on attachment through a creative process,
and not an individual level personality construct. Finally, analysis within a framework of
financial decision making showed that although subjects rated the financier’s management skills
as highly critical for performance, they strongly preferred to control the rights to decision
making on the project and thereby forfeit optimal financial offers. The results therefore provide
insight into the role psychological attachment may play in forming behavioural tendencies during

178
important decision making stages of the entrepreneurship process. The results also provide insight into the
implications of attachment- and control-oriented decision preferences for performance on the market,
with particular emphasis on the role of affect in these preferences.
6.3 Limitations
There are a number of limitations to this study. Fundamentally, this study is exploratory
and will benefit from a well grounded empirical exercise involving actual entrepreneurs.
Although the student sample used share characteristics with technology developers, they are not
full-fledged entrepreneurs and therefore generalizability of the results under certain conditions
might be limited. Further, the need to measure psychological attachment required sampling to be
done in a group that had spent sometime developing entrepreneurial ideas. However, the
development process could not be captured adequately and therefore certain history effects might
exist in the results. It is a big challenge to secure access to a sample that develop new technology
in a similar technological area or industry and are on the same stage of the development process.
Therefore, there might be the need to control some aspects of the process to be able to collect
data for analyses. However, an actual entrepreneur sample may be more conducive. Further, a
study capturing the opportunity recognition as well as the development aspects of the process
may provide a better understanding of the creative process and psychological attachment to the
idea.
Lastly, the decision preferences measured were not actual decisions. Due to the
circumstances of the sample, such as the opportunity being a school design project with stringent
intellectual property safeguards to protect students ideas, it was not possible to observe and
measure actual decisions. Thus, although intentions and tendencies to act may well predict actual

179
decisions and behaviour, the effects studied may be more appropriately unearthed if actual
decisions are measurable.
6.4 Contributions and Opportunities for Future Research
However, in contributing to the research on the role of affect in entrepreneurship the
study raises empirical questions that need further research. One such question is what role does
psychological attachment play in commercialization strategy formulation inconsideration of the
intellectual property position and complementary asset needs of the venture? Since, this question
forms a crucial part of the commercialization process, I devote a few paragraphs to it and then
present short paragraphs on two other areas of future research.
Formulating commercialization strategies Innovation or the commercialization of new
ideas is likely to require lateral, vertical and horizontal linkages. Successful commercialization,
especially for entrepreneurs or start-ups, often needs to involve access to complementary assets
that are not available within the organisation. In other words, without the necessary resources in-
house, start-ups have little choice but to partner in restrictive contracts with outside parties to be
able to successfully enter their target market. However, in these contracts the most important
concern for the parties involved is appropriability – the ability to extract rents from the
opportunity. Appropriability is most effectively ensured through formal and informal intellectual
property (the degree of excludability). Hence, to realise fair appropriability terms, a
commercialization strategy should find a good balance between issues of complementary assets
and intellectual property protection (Teece 1986; Gans, Hsu and Stern, 2002; Gans and Stern,
2003; Arora and Ceccagnoli, 2006 and Hsu, 2006).
A high level of IP protection implies a high degree of excludability of parties with bad
intentions. Therefore, when the degree of excludability increases the entrepreneur is expected to

180
gain confidence in the intellectual property protection and be willing to share information on the
technology. This should be the case because entrepreneurs will be able to legally enforce their
control over the rights to the opportunity and also command a stronger bargaining power.
However, due to the perceived possibility of a loss of control over the idea and of expropriation
in a contract, highly-attached entrepreneurs may rather want tighter control than loose control.
This view is further supported by the fact that strong excludability signals value to the
entrepreneur and therefore the desire to control the rights to the opportunity further increases as
the perceived value increases. Hence with high excludability, the highly-attached entrepreneur
may desire more control when expected to desire less.
In terms of complementary assets, cooperating with firms that own complementary assets
seems to be an efficient strategy (Teece, 1986, Gans and Stern, 2003). Gans and Stern (2003)
note that through cooperation, start-ups can avoid duplicative investment and thereby avoid
sunken investment in complementary assets necessary for commercialization. However, Gans
and Stern (2003) also note that firms with complementary assets are more likely to imitate the
innovator. Entrepreneurs and start-ups typically do not have the knowledge, expertise and tact in
choosing contracts that have proper safeguards to avert opportunism. Even when a seemingly
appropriate outside party is located, there are still risks of opportunism present in the
relationship. A common example is the “hold up” problem (Williamson, 1985; Levin, Klevorick,
Nelson, and Winter, 1987). In a hold up situation, the partner firm might demand more of the
quasi-rents of the joint effort. How will a highly-attached developer react to such situations? Due
to the glaring power imbalance, the developer will be hesitant to sign any contract with the
partnering firm if the terms are considered threatening to the rights to the idea. In other words,
the perception of a possible future loss might retard a highly-attached developer’s progress in
signing a contract even if the actual potential advantages loom large.

181
However, in reality, control preferences might be short-lived in conditions characterized
by high excludability with complementary assets belonging to an outside party. As noted by
Gans and Stern (2003), these market conditions provide the perfect opportunity to cooperate with
outside parties to ensure a successful commercialization. So, considering that complementary
assets often belong outside the start-up (Teece, 1986), entrepreneurs may have little choice but to
partner with outside parties. However, there are possible cases where strong influence from
psychological attachment and control preferences might motivate some developers to establish
otherwise available complementary assets. That is, building manufacturing or distribution
facilities when such facilities exist elsewhere and cooperating is the most efficient strategy.
Examples are cases where failing start-ups refuse to outsource capabilities when it’s more cost-
effective to do so.
In effect, although developers are expected to heed to the requirements of the
microeconomic environment when faced with commercialization challenges, a strong influence
from psychological attachment and control, especially when decision making is on an ad-hoc
basis, can spell dire consequences. Future research can aim to unearth effects of psychological
attachment and control on commercialization strategies; to develop own venture, license, sell or
pursue other options.
Other research interests The issue of risk perception is another potential area for further
research. The results in this study suggest risk perception may be guided by shifting reference
points. Thus, control tendency may motivate self-commercialization as a result of the “push”
situation where affect-led perceptions of loss of the opportunity drive the entrepreneurs to
develop their own venture. However, self-commercialization to “safeguard” the opportunity
denotes risk-aversion but could be more “risky” due to higher uncertainty. This scenario implies
a simultaneous existence of gambling and insurance. Future studies could employ the prospect

182
theory framework (Khaneman and Tversky, 1979) or other frameworks that study the role of
emotions in expected utility models (Caplin and Leahy, 2001) to better explain risk-seeking as
well as risk-aversion in entrepreneurship.
Lastly, this study is in line with recent research attention on the role of affect in
opportunity recognition (Baron, 1998, 2006b, 2008). Research in this area may also consider
psychological “by-products” of the entrepreneurship process such as psychological attachment
and its effects. A thorough scale development process to empirically test and validate
antecedents and dimensionality of psychological attachment will provide a useful measure for
further studies. Further, there is the need to identify potential mediators and moderators
impacting the relationship between psychological attachment and control tendency. For instance,
it will be interesting to investigate the moderating effects of psychological attachment (as an
affective construct) on the relationship between micro-level factors (such as optimism and self-
efficacy) and new venture performance. Baron (2008) urges researchers to investigate the
mediating role of affect in the relationship between individual-level (or micro-level) variables
and macro-level variables. There is great research potential for affect and affective constructs.
Below is a list of possible future issues or questions to study, related to the concepts
unearthed here.
Areas of Application for Research on Control Orientation and Psychological Ownership 1. The role of control tendency in the transfer of management oversight from owner-
managers to more qualified personnel 2. The role of control tendency in the transfer of responsibilities from CEO’s at any point in
time 3. The role of psychological ownership in how effective employed engineers are in
preparing complete manuals on their inventions to prevent others from “reinventing the wheel”
4. The role of psychological ownership in the effectiveness of transitioning between products for product champions
5. The extent to which psychological ownership can help explain the Not Invented Here or the Invented Here syndromes
6. The effect of control tendency on the performance of employed inventors as compared to

183
independents 7. The role of psychological ownership on the performance or turnover of employees whose
creative solutions are subverted. 8. The effect of control tendency on tenured researchers of academic faculty and their
willingness to collaborate 9. The effect of control tendency on the choice of commercialization options in tight and
loose appropriability regimes (Teece, 1986, 1998), across countries, cultures, regions etc. 10. The role of control tendency in different licensing agreements 11. The effect of control tendency on complete vs. incomplete contracts 12. The effect of control tendency on performance of agents considering different allocation
mix for control rights in venture capital contracts 13. The role of control tendency in the commercialisation decisions of VC-backed vs. non-
VC-backed technology. Are non-VC-backed developers missing market opportunities simply because of threat-related emotional reactions towards the VC structure?
14. The role of subjective probability estimates in the development of the control tendency

184
References Acs Z. and D. Audretsch, D. (2005) Handbook of Entrepreneurship Research Springer Verlag, New York. Afifi, A. A. and Clark, V. (1990) Computer-Aided Multivariate Analysis New York, NY: Van Nostrand
Reinhold. Aghion, P. and Tirole, J. (1994) On the management of innovation. Quarterly Journal of Economics,
109:1185-1207. Aguinis, H. (1995). Statistical power problems with moderated multiple regression in management
research. Journal of Management, 21, 1141–1158. Aiken, L. S. and West, S. G (1991), Multiple Regression: Testing and Interpreting Interactions, Newbury
Park, CA: SAGE Publications. Allais, M. (1953) Le comportement de l’homme rationnel devant le risque: critique des postulats et
axiomes de l’ecole Americaine, Econometrica 21, 503–46. Amabile, T. M. (1983) The social psychology of creativity. New York, Springer-Verlag. Anastasi, A., and Urbina S. (1997). Psychological testing (7th ed). New York: McMillian. Anastasi, A. (1986). Evolving concepts of test validation. Annual Review of Psychology, 37:1-15 Anton, J.J. and Yao, D. (1994). Expropriation and inventions: Appropriable rents in the absence of
property rights American Economic Review 84: (1):190-209 Anton, J.J. and D. Yao (1995), Start-ups, Spin-offs, and Internal Projects, Journal of Law Economics and
Organization, 11: 362-378. Arabshabani, G.D., de Meza, D., Maloney, R.J and Pearson, B. (2000) And a vision appeared unto them of
a great profit: evidence of self- deception among the self-employed. Economic Letters 67: 35–41. Ariely, D. and Simonson, I. (2003). Buying, bidding, playing, or competing? Value assessment and
decision dynamics in online auctions, Journal of Consumer Psychology, 13: 113-123 Ariely, D. Huber, J. and Wertenbroch, K. (2005). When do losses loom larger than gains? Journal of
Marketing Research 42: 134-38 Arora, A. and Ceccagnoli, M. (2006) Patent protection, complementary assets and firms: incentives for
technology licensing. Management Science, 522:293–308 Arrow, K. J. (1962) Economic welfare and the allocation of resources for invention. In Richard R. Nelson
(ed.), The Rate and Direction of Inventive Activity: Economic and Social Factors, National Bureau of Economic Research, Conference Series, p. 609-625 Princeton: Princeton University Press.
Arrow, K. J. (1963). Uncertainty and the welfare economics of medical care. American Economic Review. 53 (5): 941-973.
Åstebro, T. (2003) The return to independent invention: evidence of unrealistic optimism, risk seeking or skewness loving? Economic Journal, 113(484):226-239.
Åstebro, T., Jeffrey, S. A., and Adomdza, G. 2007. Inventor Perseverance after being told to quit: The role of cognitive biases. Journal of Behavioural Decision Making 20(3): 253-272
Attig N., Fong W-M., Gadhoum Y., and Lang L. (2004) Effects of Large Shareholding on Information Asymmetry and Stock Liquidity, Working Paper, Chinese University of Hong Kong.
Averill, J. R. (1973) Personal control over aversion stimuli and its relationship to stress Psychological Bulletin 80: 286 – 303.
Bandura, A. (1977) Social learning theory. Englewood Cliffs, NJ: Prentice-Hall Bandura, A. (1986) Social Foundations of Thought and Action: A Social Cognitive Theory. Englewood
Cliffs, New Jersey: Prentice-Hall. Barchard, K. A. (2001) Emotional and social intelligence: Examining its place in the nomological
network. Unpublished doctoral dissertation, University of British Columbia, Canada Barnes, J. H., Jr. (1984) Cognitive biases and their impact on strategic planning. Strategic Management
Journal 5:129-137. Baron, R. A. (1998) Cognitive mechanisms in entrepreneurship: why and when entrepreneurs think
differently than other people. Journal of Business Venturing 13: 275–294.

185
Baron, R.A. (2000) Counterfactual thinking and venture formation: the potential effects of thinking about what might have been. Journal of Business Venturing, 15(1):79-92.
Baron, R. A. (2004) The cognitive perspective: a valuable tool for answering entrepreneurship's basic "why" questions” Journal of Business Venturing, 19(2):221-239
Baron, R.A. (2006a) Opportunity recognition as pattern recognition: How entrepreneurs “connect the dots” to identify new business opportunities. Academy of Management Perspectives, 20 (1): 104-119.
Baron, R. A. (2006b) Affect and entrepreneurial cognition: how feelings shape thought during the entrepreneurial process. Paper presented at the annual meeting of Academy of Management, Atlanta, Georgia. Aug 11-16, 2006. http://meetings .aomonline.org/2006
Baum, J. R., and Locke, E. A. (2004) The Relationship of Entrepreneurial Traits, Skills, and Motivation to Subsequent Venture Growth, Journal of Applied Psychology, 89(4), 587-598
Bebchuk, L., Kraakman, R., Triantis, G., (2000). Stock Pyramids, Cross-Ownership, and Dual Class Equity: The Creation and Agency Costs of Separating Control From Cash Flow Rights. In: R. Morck, eds., Concentrated Corporate Ownership. Chicago: University of Chicago Press
Bechara, A., Damasio, H., Damasio, A.R., Lee, G.P., (1999) Different contributions of the human amygdala and ventromedial prefrontal cortex to decision-making. Journal of Neuroscience. 19 (13), 5473–5481.
Bell, D.E. (1982). Regret in decision making under uncertainty. Operations Research, 30: 961–981. Bell, D. E. (1985). Disappointment in decision making under uncertainty. Operations Research, 33: 1-27. Ben-Amar, W. and André, P., (2006) Separation of Ownership from Control and Acquiring Firm
Performance: The Case of Family Ownership in Canada Journal of Business Finance and Accounting, 33(3-4): 517-543
Benartzi, S., and Thaler, R. H. (1995) Myopic Loss Aversion and the Equity Premium Puzzle, Quarterly Journal of Economics 110: 73-92.
Bennett-Goleman, T. (2001) Emotional alchemy: how the mind can heal the heart. New York: Harmony Books
Berggren, B., Olofsson, C. and Silver, L., (2000) Control aversion and the search for external financing in Swedish SMEs. Small Business Economics, 15 (3): 233-242.
Berle, A. and Means, G. (1932). The Modern corporation and private property. New York: Macmillan. Bhide, A (2000). The origin and evoloution of new businesses, New York (NY): Oxford Univerisity Press Blaney, P.H., (1986). Affect and memory: a review. Psychological Bulletin. 99: 229–246. Boer, H., and Seydel, E.R. (1996) Protection motivation theory. In M. Connor and P. Norman (Eds.)
Predicting Health Behaviour. Buckingham: Open University Press. Bower, G. H., and Cohen, P. R. (1982). Emotional influences in memory and thinking: Data and theory. In
M. S. Clark and S. T. Fiske (Eds.), Affect and cognition. The 17th Annual Carnegie Symposium on Cognition (pp. 291-331). Hillsdale, NJ: Erlbaum.
Bowden, E. M., Jung-Beeman, M., Fleck, J. and Kounios, J. (2005) New approaches to demystifying insight. Trends in Cognitive Sciences, 9, 322-328.
Bowlby, J. (1969) Attachment and loss, Vol. 1: Attachment. New York: Basic Books. Bowlby, J. (1973). Attachment and loss: Vol.2, Separation. New York: Basic. Bozec, Y. and C. Laurin (2004) Concentration des droits de propriété, distribution des droits de vote and
performance opérationnelle des sociétés: une étude canadienne Finance Contrôle Stratégie 7(2): 123-164
Branzei, O., and Zietsma, C. (2004) Temporary cognitions of entrepreneurial love: dancing with the opportunity. In W.D. Bygrave, C.G. Brush, P.Davidsson, J. Fiet, P.G. Green, R.T. Harrison, M. Lerner, G.D. Meyer, J. Sohl, A. Zacharakis (Eds), Frontiers of Entrepreneurship Research, Wellesley, MA, 620-633.
Brockhaus, R. H. (1980). Risk taking propensity of entrepreneurs. Academy of Management Journal.

186
23(3), 509-520 Bromiley, P. and Cummings, L.L. (1995) Transaction costs in organizations with trust. In R. Bies, B.
Sheppard, and R. Lewicki (eds.), Research on negotiations in organizations, vol. 5. Greenwich CT: JAI press, 219-247
Brown, S. L., and Eisenhardt, K. M. (1995) Product Development: Past Research, Present Findings, and Future Directions Academy of Management Review (20): 343-379.
Browne, M. J., and Hoyt, R. E. (2000). The demand for flood insurance: empirical evidence. Journal of Risk and Uncertainty, 20: 271-289.
Burger, J. M. (1989) Negative reactions to increases in perceived personal control. Journal of Personality and Social Psychology 52:246 -256
Burke, P. J. and Reitzes, D. C. (1991) An identity theory approach to commitment. Social Psychology Quarterly, 54(3): 239-251.
Burmeister, K. and Schade, C. (2007) Are entrepreneurs’ decisions more biased? An experimental investigation of the susceptibility to status quo bias Journal of Business Venturing 22: 340– 362
Busenitz, L. W., and Lau, C. M. (1996) A cross-cultural cognitive model of new venture creation. Entrepreneurship: Theory and Practice, 20(4): 25-39
Callero, P. L., Howard, J. A., and Piliavin, J. A. (1987). Helping behavior as role behaviour: Disclosing social structure and history in the analysis of prosocial action. Social Psychology Quarterly, 50(3): 247-256.
Camerer, C. and Lovallo, D. (1999) Overconfidence and excess entry: an experimental approach American Economic Review 89: 306-318.
Camerer, C.F. Loewenstein, G. and Rabin, M. (2004) Behavioural economics: past, present, future. In: Camerer, Loewenstein, and Rabin (eds.): Advances in Behavioral Economics. Chapter 1: 3-51. Princeton, N.J: Princeton Univ. Press
Campbell, D. T. and Stanley, J. C. (1963) Experimental and quasi-experimental designs for research. Chicago: Rand McNally
Caplin, A. and Leahy, J. (2001) Psychological expected theory and anticipatory feelings. Quarterly Journal of Economics 116(1): 55-80.
Cardon, M., Zietsma, C., Saparito, P, Matherne, B. and Davis, C. (2005) A tale of passion: new insights into entrepreneurship from a parenthood metaphor. Journal of Business Venturing, 20(1): 23-45.
Carmon, Z., Wertenbroch, K. and Zeelenberg, M. (2003) Option attachment: When deliberating makes choosing feel like losing. Journal of Consumer Research, 30:15-29.
Carver, C. S. (2001). Affect and the functional bases of behavior: On the dimensional structure of affective experience. Personality and Social Psychology Review, 5: 345–356.
Catherall, D. R. (2003) How fear differs from anxiety Traumatology, 9 (2): 76-92 Center for Venture Research (2005) Whittemore School of Business and Economics at the University of
New Hampshire, http://www.unh.edu/cvr/ Christie, R. and Geis, F. (1970) Studies in machiavellianism New York: Academic Press Clore, G. L. (1992) Cognitive phenomenology: Feelings and the construction of judgment. In L. L. Martin
and A. Tesser (Eds.), The construction of social judgments pp. 133-163. Hillsdale, NJ: Erlbaum. Coelho, M., de Meza, D. and Reyniers, D. (2004) Irrational exuberance, entrepreneurial finance, and
public policy. International Tax and Public Finance 11: 391–417. Cohen, J., Cohen, P., West, S. G., and Aiken, L. S. (2003). Applied multiple regression/correlation
analysis for the behavioral sciences, Third Edition. Mahwah, NJ: Earlbaum. Colyvas, J., Crow, M., Gelijns, A., Mazzoleni, R., Nelson, R. R., Rosenberg, N., and Sampat, B. N. (2002)
How do university inventions get into practice? Management Science, 48(1):61-72. Cook, T. D. and Campbell, D. T. (1979) Quasi-experimentation: design and analysis issues for field
settings. Boston: Houghton-Mifflin. Cooper, A. C., Woo, C. Y., and Dunkelberg, W. C. (1988) Entrepreneurs' perceived chances for success.
Journal of Business Venturing, 3: 97-108.

187
Crane F. G. and Crane, E. C (2007) Dispositional Optimism and Entrepreneurial Success The Psychologist-Manager Journal, 10(1):13 - 25
Cressy, R. (1995) Business Borrowing and Control: A Theory of Entrepreneurial Types, Small Business Economics 7(3):291–300.
Cressy, R. and Olofsson, C., (1997), The financial conditions for Swedish SMEs: Survey and research agenda. Small Business Economics, 9: 179-192
Crocker, L. and Algina, J. (1986) Introduction to Classical and Modem Test Theory. New York: Holt, Rinehart and Winston
Cromie, S., and Johns, S. (1983) Irish entrepreneurs: Some personal characteristics. Journal of Organizational Behavior 4 317-324
Cronbach, L. J. (1951). Coefficient alpha and the internal structure of tests. Psychometrika, 16(3), 297-334.
Cronbach, L.J. (1971). Test validation. In R.L. Thorndike (Ed.), Educational measurement (2nd ed., pp. 443-507). Washington, DC: American Council on Education.
Czikszentmihalyi, M. (1990) Flow: the psychology of optimal experience. New York: Harper and Row. Csikszentmihalyi, M. (1996) Creativity: Flow and the psychology of discovery and invention. New York:
HarperCollins Publishers, Inc. Csikszentmihalyi, M. (1997) The evolving self: a psychology for the third millennium. Cambridge:
Cambridge University Press Cudeck, R., and Browne, M. W. (1983). Cross-validation of covariance structures. Multivariate Behavioral
Research, 18(4), 147-167. Cuthbert, B. N., Lang, P. J., Strauss, C., Drobes, D., Patrick, C. J. and Bradley, M. M. (2003) The
psychophysiology of anxiety disorder: Fear memory imagery Psychophysiology, 40 (3): 407–422. Dacey, John S. and Kathleen H. Lennon. (1998) Understanding Creativity: The Interplay of Biological,
Social and Psychological Factors. San Francisco: Jossey-Bass. Damasio, A.R. (1994) Descartes' error: emotion, reason, and the human brain. New York: .G.P. Putnam's
Sons. Das, T.K., and Teng, B.S. (1998) Between trust and control: Developing confidence in partner cooperation
in alliances. Academy of Management Review 23(3): 491-512 Dasgupta, P., (1988) Trust as a commodity in D. Gambetta (ed), Trust: Making and Breaking Cooperative
Relations, Oxford: Basil Blackwell: 49-72 Dasgupta, P. (2003). Social capital and economic performance: Analytics. In E. Ostrom and T. K. Ahn
(Eds.), Foundations of Social Capital. Critical Studies in Economic Institutions, vol. 2. pp. 309–39. Cheltenham: Edward Elgar.
deCharms, R (1968) Personal causation: the internal affective determinants of behaviour. New York: Academic Press
Deci, E. L. 1975. Intrinsic motivation. New York: Plenum. Deci, E., Koestner, R., and Ryan, R. (2001) Extrinsic Rewards and Intrinsic Motivation in Education:
Reconsidered Once Again. Review of Educational Research 71 (1): 1-27 Derakshan, N., and Eysenck, M. W. (1997). Interpretive biases for one's own behaviour and physiology in
high-trait-anxious individuals and repressors. Journal of Personality and Social Psychology, 73: 816-825.
DeSteno, D., Petty, R.E., Wegener, D.T., and Rucker, D.D. (2000). Beyond valence in the perception of likelihood: the role of emotion specificity. Journal of Personality and Social Psychology, 78: 397-416.
DeVellis, R. F. (1991). Scale development: Theory and applications. Newbury Park, CA: Sage. Dhar, R. and Wertenbroch, K. (2000). Consumer choice between hedonic and utilitarian goods. Journal of
Marketing Research, 37: 60-71 Drucker, P.K. (1970) Entrepreneurship in the business Enterprise. Journal of Business Policy 1 (1): 3 – 12.

188
Dunne, T., Roberts, M. J. and Samuelson, L. (1988) Patterns of Firm Entry and Exit in U.S. Manufacturing Industries. Rand Journal of Economics 19 (4):495-515.
Dyck, A. and Zingales, L. (2004) Private benefits of control: an international comparison. Journal of Finance, 59(2):537-600.
Dyer, J. H. and Chu, W. (2003) The Role of Trustworthiness in Reducing Transaction Costs and Improving Performance: Empirical Evidence from the United States, Japan, and Korea. Organization Science 14(1): 57-68.
Eckhardt, J., S. Shane (2003) Opportunities and Entrepreneurship. Journal of Management. 29 333-349 Eisenhardt, K.M. (1989) Building theories from case study research. Academy of Management Review 16
(3), 620-627 Ellsberg, D. (1961) Risk, Ambiguity, and the Savage Axioms Quarterly Journal of Economics 75: 643-
669. Elster, J.(1996) Rationality and the Emotions The Economic Journal 106: 1386-1397 Elster, J. (1998) Emotions and Economic Theory Journal of Economic Literature XXXVI, 47-74 Evans, D. S. and Leighton, L. S. (1989) Some Empirical Aspects of Entrepreneurship, American Economic
Review, 79:3, 519-535 Eysenck, M. W. (1992) Anxiety: the cognitive perspective. Hove, England: Erlbaum. Eysenck, M. W., MacLeod, C., and Matthews, A. (1987) Cognitive functioning and anxiety. Psychological
Research, 49: 189-195. Fairbairn, W. R. D. (1952) An object-relations theory of the personality. New York: Basic Books. Feeney, L. G.H. Haines, and Riding, A.L. (1999) Private investors' investment criteria: insights from
qualitative data. Venture Capital 1 (2): 121-145 Fiet J.O. (1995) Risk avoidance strategies in venture capital markets. Journal of Management Studies, 32
(4): 551-574. Fontes, M. and Coombs, R. (2001) Contribution of New Technology-Based Firms to the Strengthening of
Technological Capabilities in Intermediate Economies. Research Policy 30: 79–97. Forbes, D. P. (2005) Are some entrepreneurs more overconfident than others? Journal of Business
Venturing. 20 (5): 623-640 Forgas, J. P. (1995) Mood and judgment: The affect infusion model. Psychological Bulletin, 117, 39–66. Fornell C.D., and Larcker F. (1981) Evaluating structural equation models with unobservable variables
and measurement errors. Journal of Marketing Research; 18: 39-50. Freear, J., Sohl, J. E. and Wetzel, W. (2002) Angles on angels: financing technology-based ventures – a
historical perspective Venture Capital, 4 (4): 275-287 Frijda, N. (1986) The emotions. Cambridge: Cambridge University Press. Furubotn, E. G. and Pejovich, S. (1974) The economics of property rights. Cambridge, MA: Ballinger Gans, J. S. and Stern, S. (2003) The product market and the market for ideas: commercialization strategies
for technology entrepreneurs. Research Policy 32: (2) 333 – 350 Gans, J.S., Hsu, D. and Stern, S. (2002) When does start-up innovation spur the gale of creative
destruction? RAND Journal of Economics, 33 (4):.571-586. Gazzaniga, M.S. (1988) Transcript of interview from The infinite voyage: Fires of the mind, a production
of WQED/Pittshurg and The National Academy of Sciences. Kent, OH: PTV Publications. George, G., Jain, S. and Maltarich, M. A. (2005) Academics or Entrepreneurs? Entrepreneurial Identity
and Invention Disclosure Behavior of University Scientists Available at SSRN: http://ssrn.com/abstract=799277 accessed Oct 14, 2007
Gilad, B. (1982) On encouraging entrepreneurship: An interdisciplinary analysis, Journal of Behavioural Economics 11(1):132-163
Gneezy, U. and Potters, J. (1997) An experiment on risk taking and evaluation periods, Quarterly Journal of Economics, 112: 631-645

189
Gorsuch, R.L. (1983) Factor analysis (2nd ed.). Hillsdale, NJ: Erlbaum. Gray, B. and Ariss, S. 1985. Politics and change across organizational life cycles. Academy of
Management Review, 10 (6): 707-723. Grossman, S. J. and Hart, O. D. (1986) The costs and benefits of ownership: a theory of vertical and lateral
integration. Journal of Political Economy 94(4):691–719. Guilford, J.P. (1967) The Nature of Human Intelligence. New York: McGraw-Hill Hart, O. and Holmström, B. (1987) The theory of contracts. In Truman F. Bewley. (ed) Advances in
Economic Theory. Fifth World Congress. Cambridge: Cambridge University Press Hart, O. and Moore, J. (1990) Property rights and the nature of the firm. Journal of Political Economy,
98(6): 1119-1158. Hart, O. 1995. Firms, contracts, and financial structure. Oxford: Clarendon Press. Hazen, C. and Shaver, P. (1987) Romantic love conceptualized as an attachment process. Journal of
Personality and Social Psychology, 52: 511-524. Heckhausen, J., and Schulz, R. (1995). A life-span theory of control. Psychological Review. 102, 284-304 Hillier, B. and Ibrahimo M.B. (1993). Asymmetric information and models of credit rationing. Bulletin of
Economic Research 45(4): 271-304. Hoang, H. T. and Gimeno, J. (2007) Becoming a Founder: How Founder Role-Identity Affects
Entrepreneurial Transitions and Persistence in Founding. INSEAD Business School Research Paper No. 2007/46/EFE/ST Available at SSRN: http://ssrn.com/abstract=1021739
Hoelter, J. W. (1983) The Effects of Role Evaluation and Commitment on Identity Salience Social Psychology Quarterly, 46: 140-147.
Hsee, C. K., and Weber, E. U. (1997) A fundamental prediction error: Self—other discrepancies in risk preference. Journal of Experimental Psychology: General, 126: 45-53.
Hsu, D. (2006) Venture capitalists and cooperative start-up commercialization strategy. Management Science, 52: 204-219
Hytti, U. (2000) The concept of identity and its relevance for entrepreneurship research A paper presented at the RENT XIV Conference in Prague, Czech Republic, November 23-24, 2000. Published in RENT XIV Research and Entrepreneurship and Small Business Proceedings (EIASM and ECSB)
IPIP (2001) International Personality Item Pool: A Scientific Collaboratory for the Development of Advanced Measures of Personality Traits and Other Individual Differences (http://ipip.ori.org/). Internet Web Site Accessed June 30, 2007
Isen, A. M. (1990) The Influence of Positive and Negative Affect on Cognitive Organization: Some Implications for Development. In Psychological and Biological Approaches to Emotion. N.L .Stein, B. Leventhal, T. Trabasso (eds.). Hillsdale, NJ: Erlbaum.
Isen, A. M., and Baron, R. (1991) Positive Affect as a Factor in Organizational Behavior. In Research in Organizational Behavior. L.L. Cummings and B.M. Staw (eds.). Greenwich, CT: JAI Press.
Isen, A. M., and Means, B. (1983). The influence of positive affect on decision-making strategy. Social Cognition, 2: 18-31
Isen, A. M., and Patrick, R. (1983) The effect of positive feelings on risk taking: When the chips are down. Organizational Behaviour and Human Decision Processes, 31: 194–202.
Isen, A. M., ,Kimberley A. Daubman, and Gary P Nowicki. (1987) Positive Affect Facilitates Creative Problem Solving. Journal of Personality and Social Psychology 52(6):1122-1131
Jackson, D., Hournay, L., and Vidmar, N. (1972) A four-dimensional interpretation of risk taking. Journal of Personality, 40: 483-501.
Jackson, D. N. (1994). Jackson personality inventory-revised manual. Port Huron, MI: Sigma Assessment Systems
Jensen, M.C., and W.H. Meckling, (1976), Theory of the Firm: Managerial Behaviour, Agency Costs and Ownership Structure. Journal of Financial Economics, 3: (4): 305-360.
Jensen, R., and Thursby, M. (2001) Proofs and Prototypes for Sale: The Licensing of University

190
Inventions. American Economic Review, 91 (1): 240-259. Johnson, E. J., and Tversky, A. (1983) Affect, generalization, and the perception of risk. Journal of
Personality and Social Psychology, 45: 20-31. Judd, C. M., Smith, E. R. and Kidder, L. H. (1991) Research methods in social relations (6th ed.). Fort
Worth, TX: Holt, Rinehart and Winston Jung, C. G., and Baynes, H. G. (1921). Psychological Types, or, The Psychology of Individuation. London:
Kegan Paul Trench Trubner. M. Jung-Beeman, E.M. Bowden, J. Haberman, J.L. Frymiare, S. Arambel-Liu, R. Greenblatt, P.J. Reber, J.
Kounios, (2004) Neural Activity When People Solve Verbal Problems with Insight. PLoS Biol 2(4): e111,
Kahneman, D., and Ritov, I. 1994. Determinants of stated willingness to pay for public goods: a study in the headline method. Journal of Risk and Uncertainty, 9: 5-38.
Kahneman, D. and Tversky, A. (1973) On the psychology of prediction. Psychological Review, 80: 237- 251
Kahneman, D., and Tversky, A. (1979) Prospect theory: an analysis of decision under risk. Econornetrica, 47: 263-291.
Kahneman, D., and Tversky, A. (1996) On the reality of cognitive illusions: A reply to Gigerenzer's critique. Psychological Review, 103:582-591.
Kahneman, D. and Shane F. (2002) Representativeness Revisited: Attribute Substitution in Intuitive Judgment, in Heuristics and Biases: The Psychology of Intuitive Judgment, eds. Thomas Gilovich, Dale Griffin, and Daniel Kahneman, New York, NY: Cambridge University Press, 48 – 81.
Kahneman, D., Knetsch, J.K., and Thaler, R.H. (1990) Experimental tests of the endowment effect and the Coase Theorem. Journal of Political Economy. 98(6):1325-1348.
Kahneman, D., Knetsch, J.K., and Thaler, R.H. (1991) Anomalies: the endowment effect, loss aversion, and status quo bias. Journal of Economic Perspectives, 5(1):193–206.
Kahneman, D., Ritov, I., and Schkade, D. (1999) Economic preferences or attitude expressions? An analysis of dollar responses to public issues. Journal of Risk and Uncertainty, 19: 203-237.
Kahneman, D., Schkade, D. A., and Sunstein, C. R. (1998) Shared outrage and erratic awards: the psychology of punitive damages. Journal of Risk and Uncertainty, 16: 49-86.
Kaplan, S. and Stromberg, P. (2003) Financial contracting theory meets the real world: an empirical analysis of venture capital contracts. Review of Economic Studies, 70(2): 281-315
Keltner, D., Ellsworth, P. C., and Edwards, K. (1993). Beyond simple pessimism: Effects of sadness and anger on social perception. Journal of Personality and Social Psychology, 64: 740-752
Kenning, P., Mohr, P., Erk, S., Walter, H. and Plassmann, H. (2006) The role of fear in home-biased decision making: First insights from neuroeconomics. MPRA Paper 1076, University Library of Munich, Germany, revised 18 Nov 2006. http://mpra.ub.uni-muenchen.de/1076/01/MPRA_paper_1076.pdf
Kim, J O and Mueller, C W (1978) Factor analysis: statistical methods and practical issues. Quantitative Applications in the Social Sciences Series, No. 14. Thousand Oaks, CA: Sage Publication.
Kleine, R. E., III and Kleine, S. S. (2000) Consumption and Self-Schema Changes Throughout the Identity Project Life Cycle, in Advances in Consumer Research, Vol 27, eds. Robert J. Meyer and Stephen Hoch, Provo, UT: Association for Consumer Research, 279-285.
Koriat, A., Lichtenstein, S. and Fischhoff, B. (1980) Reasons for Confidence, Journal of Experimental Psychology: Human Learning and Memory 6: 107-118.
Krueger, N. (2000) The cognitive infrastructure of opportunity emergence, Entrepreneurship Theory and Practice, 24(3), 5-23
Kunda, Z. (2001) The case for motivated reasoning. Psychological Bulletin, 108(3): 480-498. Kunreuther, H., Ginsburg, R., Miller, L., Sagi, P., Slovic, P., Borkan, B., and Katz, N. (1978) Disaster
insurance protection: public policy lessons. New York: Wiley. Landier, A. and Thesmar, D. (2004) Financial contracting with optimistic entrepreneurs: theory and
evidence. Mimeo,New York University and HEC, Paris.

191
Landström, H. and Winborg, J. (1995) Small business managers´ attitudes towards and use of external financial sources. In W.D. Bygrave et al. (eds.). Frontiers of Entrepreneurship Research (pp 172-186). Center for Entrepreneurial Studies. Babson College.
Lang, P.J., Bradley, M.M., and Cuthbert, B.N., (1999) International affective picture system (IAPS): instruction manual and affective ratings. Technical Report A-4, The Center for Research in Psychophysiology, University of Florida.
Lang, P.J., Bradley, M.M., and Cuthbert, B.N. (1999). International Affective Picture System (IAPS): Technical manual and affective ratings . Gainesville, FL: Center for Research in Psychophysiology.
Lazarus, R. S. (1991) Emotion and adaptation. New York: Oxford University Press. LeDoux, J. (1996) The emotional brain. New York: Simon and Schuster. LeDoux, J. (1998) Fear and the brain: where have we been, and where are we going? Biological
Psychiatry, 44 (12): 1229-1238. Lemer, J. S. and Keltner, D. (2000) Beyond valence: toward a model of emotion-specific influences on
judgment and choice. Cognition and Emotion, 14: 473-494. Lerner, J.S., and Keltner, D. (2001) Fear, anger, and risk. Journal of Personality and Social Psychology,
81: 146-159. Lerner, J.S., Gonsalez, R.M., Small, D.A. and Fischhoff, B. (2003) Effects of fear and anger on perceived
risks of terrorism. Psychological Science, 14: 144-150. Lerner J.S., Small D.A., and Loewenstein G. (2004) Heart strings and purse strings: carryover effects of
emotions on economic decisions. Psychological Science, 15(5): 337-341 Levenson, R. W. (1999) The intrapersonal functions of emotion. Special issue: Functional accounts of
emotion, Cognition and Emotion. 13: 481–504. Levin, R. C., Klevorick, A. K., Nelson, R. R. and Winter, S. G. (1987) Appropriating the Returns from
Industrial Research and Development. Brookings Papers on Economic Activity 3 : 783- 831 Lichtenstein, S. and Slovic, P. (1971) Reversals of Preference Between Bids and Choices in Gambling
Situations, Journal of Experimental Psychology, 89: 46-55. Lieberman, M. B. and Montgomery, D. B. (1988) First-mover advantages. Strategic Management Journal,
9: 41-58. Lo, A. W., Repin, D. V., and Steenbarger, B. N. (2005). Fear and greed in financial markets: A clinical
study of day-traders. American Economic Review, 95(2): 352-359 Locke, J. (1691) Some Considerations on the consequences of the Lowering of Interest and the Raising of
the Value of Money Rod Hay's Archive for the History of Economic Thought, McMaster University, Canada http://socserv2.socsci.mcmaster.ca/~econ/ugcm/3ll3/index.html
Loewenstein, G. (1996) Out of control: visceral influences on behaviour Organizational Behaviour and Human Decision Processes 65(3): 272–292
Loewenstein, G. F., Weber, E.U., Hsee, C. K., and Welch, E. S. (2001) Risk as feelings. Psychological Bulletin, 127(2): 267–286.
Loomes, G. and Sugden, R. (1982) Regret theory: an alternative theory of rational choice under uncertainty. Economic Journal 92: 805-24.
Loomes, G. and Sugden, R. (1987) Some implications of a more general form of regret theory. Journal of Economic Theory 41: 270-87
Lowe, R.A. and Ziedonis, A.A. (2006) Over-optimism and the performance of entrepreneurial firms, Management Science, 52 (2): 173-186
Puri, Manju and Robinson, David T. (2007) Optimism and Economic Choice. Journal of Financial Economics 86(1): 71-99
Mason, C.M. and R.T. Harrison (1996), Informal venture capital: a study of the investment process and post-investment experience, Entrepreneurship and Regional Development, 8 (2):105-126
Masters, R. A. (2000). Compassionate Wrath: Transpersonal Approaches to Anger. The Journal of Transpersonal Psychology, 32(1): 31-51
Mellers, B. A., Schwartz, A., Ho, K., and Ritov, I. (1997) Decision affect theory: emotional reactions to the outcomes of risky options. Psychological Science, 8: 423-429.

192
Mellers, B., Schwartz, A., and Ritov, I. (1999) Emotion-based choice. Journal of Experimental Psychology: General, 128: 332-345.
Mikels, J. A., Fredrickson, B., Larkin, G. R., Lindberg, C. M., Maglio, S. J., and Reuter-Lorenz, P. A. (2005) Emotional category data on images from the International Affective Picture System Behaviour Research Methods, 37(4): 626-630.
Mikulincer, M., and Shaver, P. R. (2003). The attachment behavioral system in adulthood: Activation, psychodynamics, and interpersonal processes. In M. P. Zanna (Ed.), Advances in experimental social psychology (Vol. 35). New York: Academic Press.
Mintzberg, H. (1984) Power and organization life cycles. Academy of Management Review, 9(2): 207-224. Moneytree Report (2006) Downloaded from “www.pwcmoneytree.com” on 10 Jan. 2008. Müller, E. (2007) Benefits of control, capital Structure and company growth, Applied Economics,
forthcoming Nenova, T. (2003) The value of corporate voting rights and control: a cross-country analysis. Journal of
Financial Economics, 68: 325-351. Nerkar, A., and Shane, S. (2003) When do start-ups that exploit patented academic knowledge survive?
International Journal of Industrial Organization, 21:1391-1410. Nicolaou, N., and Birley, S.( 2003) Academic networks in a trichotomous categorisation of university
spinouts. Journal of Business Venturing, 18: 333-359. Norton, M. I. and Ariely, D. (2005) The “IKEA effect”: Why Labor Leads to Love”Society for Judgment
and Decision Making Annual Conference 26th Anniversary Edition Sheraton Centre, Toronto Canada, November 11-14, 2005 Master Schedule page 8 http://www.sjdm.org/programs/2005-program.pdf.
Nunnally, J. C. (1978). Psychometric theory (2nd ed.). New York: McGraw-Hill. Öehman, A., and Mineka, S. (2001) Fears, phobias, and preparedness: Toward an evolved module of fear
and fear learning. Psychological Review, 108: 483–522. Oskamp, S. (1965). Overconfidence in case-study judgments. Journal of consulting psychology, 29, 261–
265. Palich, L. E., and Bagby, D. R. (1995) Using cognitive theory to explain entrepreneurial risk taking:
Challenging conventional wisdom. Journal of Business Venturing, 10:425-438. Pierce, J. L., Kostova, T and Dirks, K.T. (2003) The state of psychological ownership integrating and
extending a century of research. Review of General Psychology, 7(1): 84-107. Pierce, J. L., Rubenfeld, S. A., and Morgan, S. (1991) Employee ownership: a conceptual model of process
and effects. Academy of Management Review, 1:121 – 144. Pilavin, J. A. and Callero, P. L. (1991) Giving blood: The development of an altruistic identity. Baltimore:
Johns Hopkins University Press Pratt, J. and Zeckhauser, R. J. (1985) Principals and agents: The structure of business, Cambridge, MA:
Harvard Business School Press. Pressman, D. (1988). Patent Yourself. Second Edition. Nolo Press. California PricewaterhouseCoopers (2001) Regional Economic Benefits Study (documenting and quantifying the
economic impact of University of Waterloo on the Waterloo Region. Information and Public Affairs, University of Waterloo
Pries, F and Guild, P (2004) Analyzing the commercialization of university research: a proposed categorization scheme. Institute Innovation Research, University of Waterloo http://www.iir.uwaterloo.ca/WorkingPaperSeries.html
Raudenbush, S.W. and Bryk, A. S. (2002). Hierarchical Linear Models: Applications and Data Analysis Methods (2nd ed.). London: Sage.
Reich, W. A. (2000). Identify structure, narrative accounts, and commitment to a volunteer role. The Journal of Psychology, 134(4), 422-434
Reyment, R. and Jöreskog, K.G., (1993) Applied Factor Analysis in the Natural Sciences, Cambridge University Press
193
Ring, P.S. and A.H. Van de Ven (1992) Structuring cooperative relationships between organizations, Strategic Management Journal, 13: 483-498
Ring, P.S. and A.H. Van de Ven (1994) Developmental processes in cooperative interorganizational relationships, Academy of Management Review, 19: 90-118
Roberts, E. B (1990) Evolving toward product and Market orientation: The early years of technology-based firms. Journal Production and Innovation Management 7:274-287
Rogers, R. W. (1975) A protection motivation theory of fear appeals and attitude change. Journal of Psychology, 91: 93-114.
Rogers, R.W. (1983) Cognitive and physiological processes in fear appeals and attitude change: a revised theory of protection motivation. In J. Cacioppo and R. Petty (Eds.), Social Psychophysiology. New York: Guilford Press.
Rossman, J. (1931) The psychology of the inventor. Washington DC: Inventor's Publishing. Rothbaum, F., Weisz, J. R., and Snyder, S. S. (1982). Changing the world and changing the self: a two-
process model of perceived control. Journal of personality and social psychology, 42(1), 5-37. Rottenstreich, Y., and Hsee, C.K. (2001). Money, kisses, and electric shocks: On the affective psychology
of risk. Psychological Science, 12:185–190. Rotter, J. (1966) Generalized expectancies for internal versus external control of reinforcement.
Psychological Monographs: General and Applied, 80: 1-28. Rotter, J. B. (1980). Interpersonal trust, trustworthiness, and gullibility. American Psychologist, 35, 1-7. Rousseau, Denise M., and Judi McLean Parks (1993) The Contracts of Individuals and organizations, in
Larry L. Cummings and Barry M. Staw (Eds.), Research in Organizational Behavior, Vol. 15, Greenwich: JAI Press, 1-47.
Rubenson, G. C. and Gupta, A. K. (1992) Replacing the Founder: Exploding the Myth of the Entrepreneur's Disease, Business Horizons 53 – 57
Ryan, R. M., and Deci, E. L. (2000) Intrinsic and extrinsic motivations: classic definitions and new directions. Contemporary Educational Psychology, 25: 54- 67
Sapienza, H. J., Manigart, S., and Vermeir, W. (1996) Venture capitalist governance and value added in four countries. Journal of Business Venturing, 11: 439-469.
Savage, L. J. (1954). The foundations of statistics. Dover. Scheier, M. F., and Carver, C. S. (1985). Optimism, coping and health: Assessment and implications of
generalized outcome expectancies. Health Psychology, 4, 219-247 Schumpeter, J. A. 1934. The theory of economic development. New York: Oxford University Press. Schwartz, R.G., Teach, R.D., Birch, N.J. (2005) A longitudinal study of entrepreneurial firms opportunity
recognition and product development strategies. International Journal of Entrepreneurial Behaviour and Research, 11(4): 315-329.
Seabrook, J. (1994) The Flash of Genius, The New Yorker, Jan 11, pp. 38-52. Shane, S. (2001) Technological opportunities and new firm creation. Management Science, 47(2):205-220. Shane, S. (2002) Selling university technology: patterns from MIT. Management Science 48(1): 122-137. Shane, S. (2003) A General Theory of Entrepreneurship. The individual-opportunity Nexus.
Massachusetts: Edward Elgar Publishing, Inc Shane, S. and Venkataraman, S. (2000) The promise of entrepreneurship as a field of research. Academy of
Management Review, 25: 217-226 Shane, S., and Eckhardt, J. (2003). The individual-opportunity nexus. In Z. J. Acs and D. B. Audretsch
(Eds.), Handbook of Entrepreneurship Research (pp. 161-194). Dordrecht, NL: Kluwer Shepherd, D.A., and Zacharakis, A. (2001) The venture capitalist-entrepreneur relationship. Venture
Capital- An International Journal of Entrepreneurial Finance, 3 (2): 129-149. Shepherd, D. A. (2003) Learning from business failure: Propositions about the grief recovery process for
the self-employed. Academy of Management Review, 28:318–329. Shepherd, D. A. (2004) Educating entrepreneurship students about emotion and learning from failure
Academy of Management Learning and Education, 3(3):274–287.

194
Shleifer, A. and R.Vishny (1997) A Survey of Corporate Governance, Journal of Finance, 52:737-82 Siegrist, J. (1996) Adverse health effects of high-effort/low-reward conditions. Journal Occupational
Health Psychological 1(1): 27-41 Siegrist, J. (2002) Effort-reward Imbalance at Work and Health. In P. Perrewe, and D. Ganster (Eds.),
Research in Occupational Stress and Well Being (pp. 261-291). New York: JAI Elsevier. Simon, M., Houghton, S. M. and Lumpkin, G. T. (2001) Making lemonade out of lemons: the role of
strategy in managing misperceived start-ups. Academy of Management Annual Best Papers Proceedings, Washington, DC, 2001.
Singh, R., Hills, G, Hybels, R and Lumpkin (1999) Opportunity recognition through social network characteristics in entrepreneurship. Paper presented at the 1999 Babson College on Entrepreneurship Research, Columbia. SC
Skinner, E. A. (1996) A guide to constructs of control. Journal of Personality and Social Psychology, 71: 549 - 570.
Skinner, E. A., Chapman, M., and Baltes, P. B . (1988) Control, means-ends, and agency beliefs: A new conceptualization and its measurement during childhood. Journal of Personality and Social Psychology 54: 117-133
Sloman, S. A. (1996) The empirical case for two systems of reasoning. Psychological Bulletin, 119(1), 3-22.
Slovic, P. (1987) Perception of risk. Science 236: 280–285. Slovic, P., Layman, M., Kraus, N., Flynn, J., Chalmers, J., and Gesell, G. (1991) Perceived risk, stigma,
and potential economic impacts of a high-level nuclear waste repository in Nevada. Risk Analysis, 11: 683- 696.
Smith, C. A. and Ellsworth, P. C. (1985) Patterns of cognitive appraisal in emotion. Journal of Personality and Social Psychology, 48: 813-838
Stanovich K.E, and West R.F. (1999) Discrepancies between normative and descriptive models of decision making and the understanding/acceptance principle. Cognitive. Psychology. 38: 349–85
Stevens, J. (1986) Applied Multivariate Statistics for the Social Sciences. Hillsdale, NJ: Lawrence Erlbaum Associates.
Stevens, J.P. (1992) Applied Multivariate Statistics for the Social Sciences (2nd edition). Hillsdale, NJ: Erlbaum.
Strahilevitz, M. A., and Loewenstein, G. F. (1998) The effect of ownership history on the valuation of objects, Journal of Consumer Research, 25: 276-289.
Stryker, S. (1980) Symbolic interactionism: A social structural version. Menlo Park, CA: The Benjamin/Cummings Publishing Company.
Teece, D. J. (1986) Profiting from technological innovation: implications for integration, collaboration, licensing and public policy. Research Policy 15: 285-305
Teece, D. J. (1998) Capturing value from knowledge assets. California Management Review, 40(3): 55-79. Teece, D.J. (1992) Competition, Cooperation and Innovation: Organisational Arrangements for Regimes
of Rapid Technological Progress, Journal of Economic Behaviour and Organization, 18: 1–25 Tett, R., Wang, A., Gribler, J. and Martinez, A. (1997) Development of Self-report measures of emotional
intelligence. Paper presented at the 1997 Annual Convention of the Southern Psychological Association, Atlanta, GA
Thaler, R. H. (1980) Toward a positive theory of consumer choice. Journal of Economic Behavior and Organization, 1(1):39-60.
Thaler, R., Tversky, A., Kahneman, D. and Schwartz, A. (1997) The Effect of Myopia and Loss Aversion on Risk Taking: An Experimental Test, Quarterly Journal of Economics, CXII: 647–661.
Thurstone, L.L. (1931). Measurement of social attitudes. Journal of Abnormal and Social Psychology, (26), 249-269
Tiedens, L.Z., and Linton, S. (2001) Judgment under emotional certainty and uncertainty: the effects of specific emotions on information processing. Journal of Personality and Social Psychology, 81:

195
973-988. Turner, R. H. (1978) The role and the person, American Journal of Sociology, 84:1-23. Tversky A. and D. Kahneman (1991) Loss aversion in riskless choice: A reference dependent model,
Quarterly Journal of Economics 106: 1039-1061. Van Osnabrugge, M. (2000) A comparison of business angel and venture capitalist investment procedures:
An agency theory-based analysis. Venture Capital, 2 (2): 91-10. van Praag, M., van der Sluis, J. and van Witteloostuijn, A. (2004) The Impact of the Locus of Control
Personality Trait on the Earnings of Employees vis-à-vis Entrepreneurs. Tinbergen Institute Discussion Paper Ii 2004-130/3 [http://www.tinbergen.nl (March,2005)]
Vasey, M. W., El-Hag, N., and Daleiden, E. L. (1996) Anxiety and the processing of emotionally threatening stimuli: distinctive patterns of selective attention among high- and low-test-anxious children Child Development, 67:1173-1185.
Venkataraman, S. (1997) The distinctive domain of entrepreneurship research. In J. A. Katz (Ed.), Advances in Entrepreneurship Research: Firm Emergence and Growth. Vol. 119-138. Greenwich, CON: JAI Press.
von Neumann, J. and Morgenstern, O. (1944) The Theory of Games and Economic Behaviour, Princeton University Press.
Von Neumann, J. and Morgenstern, O. (1947). Theory of games and economic behaviour, 2nd ed. Princeton, NJ: Princeton University Press.
Wakker, P. (2006). Annotated References on Decisions and Uncertainty. Web site: http://www1.fee.uva.nl/creed/wakker/refs/rfrncs.htm.
Weick, C. W. and Eakin, C. F. (2005) Independent inventors and innovation: an empirical study. The International Journal of Entrepreneurship and Innovation, 6 (1): 5-15
Weigert, A. J., Teitge, J. S. and Teitge, D. W. (1986), Society and Identity: Toward a Sociological Psychology, New York, NY: Cambridge University Press
Weinstein, N. D., and Klein, W. M. (1995) Resistance of personal risk perceptions to debiasing interventions. Health Psychology, 14, 132-140.
Weinstein, N. D. (1989) Effects of personal experience on self-protective behaviour. Psychological Bulletin, 105: 31-50.
White, R.W. (1959) Motivation reconsidered: the concept of competence. Psychological Review, 66: 297–333
Wijbenga, F.H. and van Witteloostuijn, A. (2007) Entrepreneurial locus of control and competitive strategies – The moderating effect of environmental dynamism. Journal of Economic Psychology 28(5): 566-589
Williamson, O.E. (1979) Transaction cost economics: the governance of contractual relations. Journal of Law and Economics, 22: 233-261.
Williamson, O.E. (1985) The economic institutions of capitalism. New York: The Free Press. Williamson, O. E. (1991) Comparative economic organization: the analysis of discrete structural
alternatives. Administrative Science Quarterly 36: 269-296 Wilson, R. S and Arvai, J.L (2006) When less is more: how affect influences preferences when comparing
low and high-risk options. Journal of Risk Research 9(2): 165-178 Winborg, J. and Landström, H. (2001) Financial Bootstrapping in Small Business – Examining small
business manager’s resource acquisitions behaviours Journal of Business Venturing 16(3): 235 – 254 Wright, W.F. and Bower, G.H. (1992) Mood effects on subjective probability assessment. Organizational
Behaviour and Human Decision Processes, 52: 276-291. Zacharakis, A. L., and Meyer, G. D. (2000) The potential of actuarial decision models: Can they improve
the venture capital investment decision? Journal of Business Venturing, 15 (4): 323-346. Zajonc, R. B. (1998) Emotions, In D. Gilbert, S. Fiske and G. Lindzey (Ed) The Handbook of Social
Psychology pp. 591-632 New York: Oxford University Press. Zald, D.H. (2003) The human amygdala and the emotional evaluation of sensory stimuli. Brain Research

196
Reviews 41 (1): 88–123. Zingales, L. (1994) The value of the voting right: a study of the Milan Stock Exchange experience. Review
of Financial Studies 7:125-148.

197
Appendices
Appendix 1: The Scale Development Process
S
yes
Prepare initial scale items
Content validity procedure: expert (inventors) evaluations
Redraft scale items
Redraft scale items
Sorting procedure
Tests of reliability
Tests of validity: Confirmatory factor analysis validated with an exploratory factor analysis
Final research instrument
Conduct interviews and pilot tests
Redraft scale items
Modify instrument
Modify instrument
Modify instrument
Start
End
yes
yes
No
No
No

198
Appendix 2: Codebooks
A. Pre-test of questionnaire This test involved the first attempt to measure psychological attachment using the psychological ownership measure. The measure for psychological ownership is adapted from Dyne and Pierce’s (2004) measure of the construct in the organisation (Seven items with Cronbach’s coefficient alpha, 0.87, 0.90, and 0.93 for three samples). Below is a tentative scale for measuring the construct in this study (Four items – items referring to OUR in terms of the organisation where deleted from the Dyne and Pierce (2004) scale). Psychological Ownership Instructions: Think about the car, bike or gadget you own, and the experiences and feelings associated with the statement ‘THIS IS MY CAR!’ The following questions deal with the ‘sense of ownership’ that you feel for the object (product) in front of you. Indicate the degree to which you personally agree or disagree with the following statements on a scale of 1 (disagree) to 5 (agree). Item 1. This is MY___________(object, product) 2. I feel a very high degree of personal ownership for this ___________(object, product) 3. I sense that this is MY ___________(object, product) 4. It is hard for me to think about this ___________(object, product) as MINE. (reversed) The items are consistent with the core meaning of psychological ownership and uses possessive vocabulary such as reflected in everyday associations with property and possessions, such as “That idea was MINE,” (Dyne and Pierce, 2004).
Due to the failure of this scale to capture the construct, hypothetical items were written to theoretically get to the construct. Also included in the pre-test were threat-inducing pictures to introduce the threat manipulation. The pictures are not included due to space constraints. Other items tested were the items for the control tendency measure, the items for venture capitalist/Angel investor studies, control preferences in commercialization strategy making and other control variables.

199

200

201

202

203

204

205

206

207

208

209

210

211

212

213
B. Final Study: Part I This codebook outlines the questions for the first part of the final study. The first part was mainly to measure psychological attachment and compare with a later measure for differences. Also, statistical control variables were measured in this part to avoid demand effects in the next part.

214
2.1
2.5
1.1
1.2

215
4.1
4.2
4.3
4.4
4.5
4.6
4.7
4.8
4.9
4.10
4.11
4.12
4.13
4.14
4.15
4.16
5.3
5.4
5.5 5.6
5.7
5.8
5.9 5.10 5.11
5.2
5.1

216
8.1
8.4
7.1
7.4

217
9.1 9.5

218
10.17
10.18
10.19
10.16
10.20
10.14
10.15
10.21
10.22
10.23
10.24
10.25
10.13
10.12
10.11
10.10
10.9
10.8
10.7
10.6
10.5
10.4
10.3
10.2
10.1

219
11.3
11.4
11.6
11.5
11.2
11.1
12.1 12.2

220

221
C. Final Study: Part 2 – Treatment group The treatment group was asked to recount a personal possession they lost and answer questions of how it felt

222
Q24_0
1 to 5
1 to 5

223
3 1
3 2
3 3
5 1
5 2

224
6 1 6 2
7 1 7 6
5 3
5 4
5 5
5 6

225

226
11 1
11 6

227
12 1 12 2

228
12 2 12 1

229

230
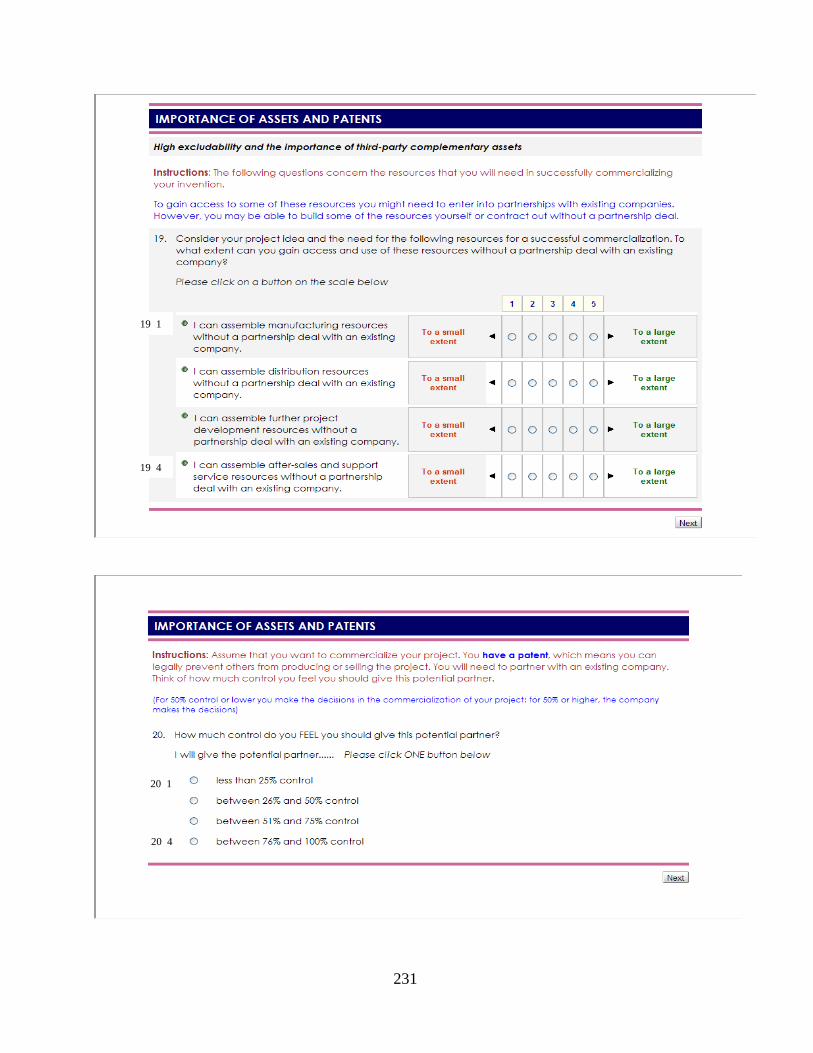
231
19 1
19 4
20 1
20 4
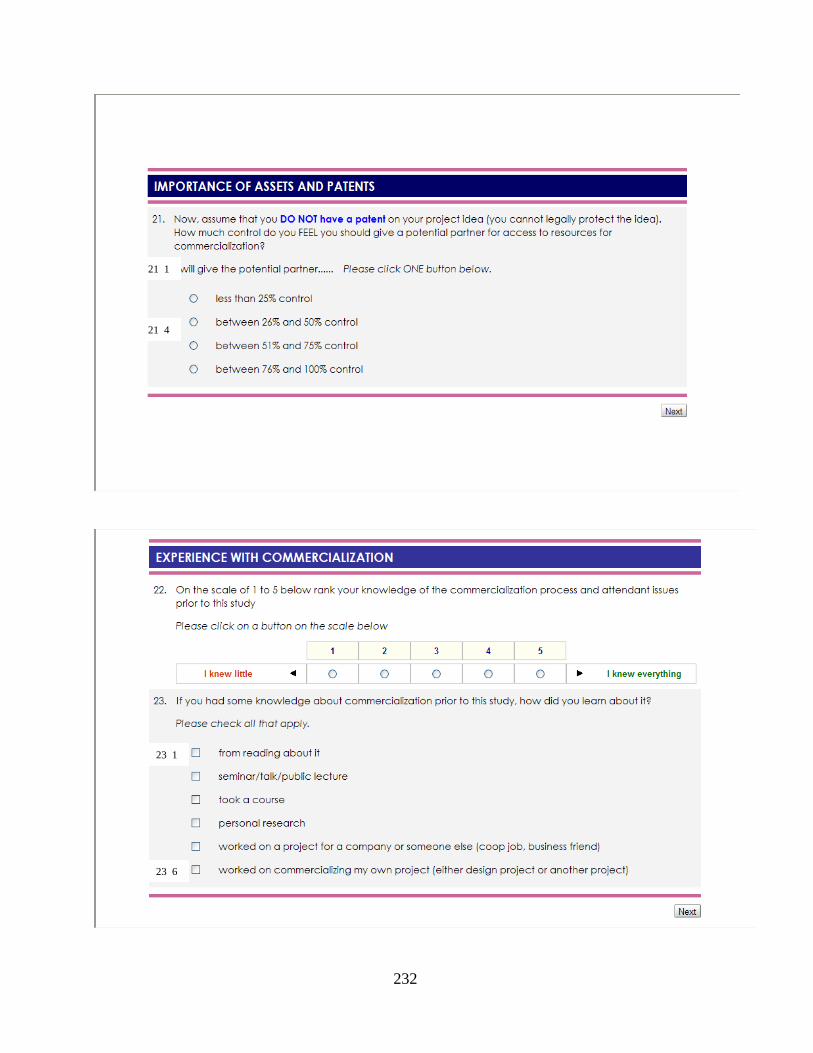
232
21 1
21 4
23 1
23 6

233
24 1 24 5
25 1
25 5
27 1
27 6
This question is about the loss you reported earlier at the beginning of the survey
To what extent was your mood affected by remembering the loss you suffered?
What did you feel after answering the questions on the loss you suffered?

234

235
D. Final Study: Part 2 - Control Group The control group were asked to write out an interesting experience that they encountered

236
Q24_0
1 to 5
1 to 5

237
3 1
3 2
3 3

238

239
11 1
11 6
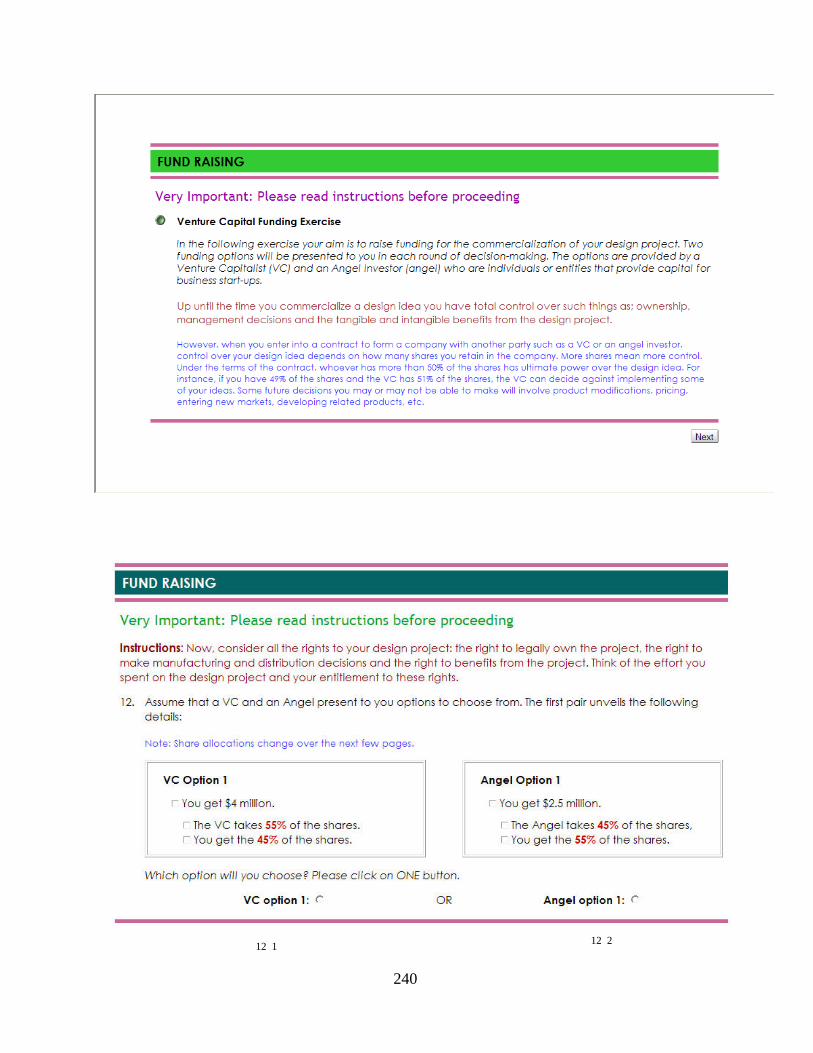
240
12 1 12 2

241
12 2 12 1

242

243

244
19 1
19 4
20 1
20 4

245
21 1
21 4
23 1
23 6

246
24 1 24 5
25 1
25 5
27 1
27 6

247

248
Appendix 3: Sample interview transcripts from interviews with subjects Respondent 1 1. What is the origin of this design project? What prompted the idea in the first
place? How exciting was the realization? Any memories?
Answer: The idea came up in a brainstorming session. It was originally a more complex solution that resulted in problems that we couldn't immediately solve. As a result, we dismissed the idea as not plausible and went about another idea. This other idea was exciting for me - something I wanted to do. However, group members opposed the idea at the start of the design phase and we reverted back to a simpler implementation of our original idea which was plausible. This new implementation, being purely software based, was less interesting to me, thus, I was less excited about it. 2. How difficult or easy was the process of putting together the concept of the design project? What kinds of experiences did you have? Any memories? Answer: As first mentioned, the original idea did not seem plausible due to some unsolvable issues. However, when reviewed, we discovered a simpler implementation which was feasible. Our ideas went through several brainstorming sessions which made the whole process difficult. This includes when we finally put together the design ideas of the actual project. 3. Once the concept was put together, how did the development process evolve? Did you and your team members spend more time than you envisaged? Less time? What kinds of challenges did you face?> Answer: Our development process involved several major problems that had to be resolved in order for the system to work. As a result, getting through each one was like reaching a milestone. It was generally a step-by-step procedure to get piece-by-piece working which worked well for our project. The time used was approximately what was expected. Certain portions took less, others took more. 4. Do you remember any moments of celebration during the development of the design project? What happened? How good was it? How did you feel?> Answer: Reaching each "milestone" (as mentioned above) was rewarding. The group was happy and up-beat each time we triumphed over a problem. 5. Do you remember any moments of frustration during the development of the design projects? What happened? How bad was it? How did you feel? Answer: There were several moments of frustration - unexpected issues and difficult problems. Each time we encountered one of these, it was very frustrating. There were feelings of anger and despair at times - like we wouldn't be able to solve an issue. 6. How will you describe the exhibition where the group showcased the idea? How did you feel about seeing the project on display, showing it off, or speaking about it? Answer: Personally, I felt good about it. I knew exactly what it was capable of, as well as its shortcomings. In terms of requirements, I knew it would pass, so I wasn't worried. I think my group members were a little more worried than I was. 7. How will you describe your level of attachment to this design > project? How attached do you feel to this project? Why? Answer: Personally, I'm not too attached to the project. It wasn't the idea that I was most excited about.

249
8. If you were to decide on transferring the project to someone else to market, will your attachment to it have any effect on the terms of agreement with this third-party? Why? Answer: I would doubt it. With limited attachment to begin with, I would only ensure simple terms to ensure that I benefit from the sale of the idea, nothing spectacular. 9. To what extent will you like to control the rights you have to the product prior to discussing transfer to a third party? What will you like to retain control of? Why? Answer: Personally, I would pass off a lot of the control provided I properly benefit from it. 10. Do you think when people create new ideas like this design project; they become attached to it in a way? How? Why? Answer: I think that people do, depending on their interest in the idea. If my group were still doing our 2nd idea (which I was most interested in), I would have been more attached to it. 11. Do you think when people create new ideas like this design project; it is difficult for them to allow third-parties to become a part of the commercialization process? How? Why? Answer: Again, I think it depends on the interest in the idea and, thus, their attachment. - Thank you very much for your time. End
Respondent 2 Interview guidelines 1. What is the origin of this design project? What prompted the idea in the first place? How exciting was the realization? Any memories? Answer: One team member thought of this idea, it was one of many considered. The intent was to come up with a high-tech solution with some marketing potential. Any field of application would have been OK. There was a lot excitement to finalize the project topic. We knew it would be difficult, but better something interesting to motivate, than something straightforward but dull. 2. How difficult or easy was the process of putting together the concept of the design project? What kinds of experiences did you have? Any memories? Answer: It was not a difficult process. Members volunteered ideas, and the group discussed advantages and disadvantages of each. People were not egotistic, hence all such meetings were educational and productive. 3. Once the concept was put together, how did the development process evolve? Did you and your team members spend more time than you envisaged? Less time? What kinds of challenges did you face? Answer: A lot more time was invested in the project than the course required/recommended. But we anticipated this from the initial design. There were some insurmountable challenges most due to limitations on the hardware we selected. Project scope needed some adjustment. We plan on doing some additional work before Symposium to better demonstrate the potential of the product at that point. 4. Do you remember any moments of celebration during the development of the design project? What happened? How good was it? How did you feel?

250
Answer: Yes.. we always wanted to go out and grab a drink/meal after each milestone. And we did have time for that sometimes... It was nice to socialize with team members instead of discuss the project at those times. 5. Do you remember any moments of frustration during the development of the design projects? What happened? How bad was it? How did you feel? Answer: Yes.. sometimes very trivial errors took many days/weeks to find. The waste of time and effort is frustrating. Additionally, when people are stressed, sometimes they feel unhappy about any unbalance of control of the project across the team members. 6. How will you describe the exhibition where the group showcased the idea? How did you feel about seeing the project on display, showing it off, or speaking about it? Answer: This will occur in the Winter term (at Symposium). How happy we are will greatly depend on whether we revamp the system in the next four months in our spare time. 7. How will you describe your level of attachment to this design project? How attached do you feel to this project? Why? Answer: If it is a commercially viable product, we want to consider prospects of commercialization. We have enough attachment I think to continue forward with it. If we can't get it to work well enough, it will take some conscious effort to pull the plug (at least on my part). 8. If you were to decide on transferring the project to someone else to market, will your attachment to it have any effect on the terms of agreement with this third-party? Why? Answer: I'm not sure... My father is an entrepreneur, and I know how attachment limits marketing potential due to insistence on control and resistance to sharing. It will depend on how the majority of the group feels. If enough people want to participate in future development, we will keep control, otherwise, perhaps we should sell all of it. 9. To what extent will you like to control the rights you have to the product prior to discussing transfer to a third party? What will you like to retain control of? Why? Answer: I don't think it's beneficial to keep control for emotional reasons. It should depend on interest and potential revenue. 10. Do you think when people create new ideas like this design project; they become attached to it in a way? How? Why? Answer: It depends on the motivation behind their development. There can conceivably be three in my opinion: something to pass the course, something to market, or something revolutionary... the last motive will definitely cause emotional attachment. I think any could apply to any group, depending on the idea they came up in time for the proposal submission. 11. Do you think when people create new ideas like this design project; it is difficult for them to allow third-parties to become a part of the commercialization process? How? Why?

251
Answer: I think they'll have difficulty taking risks. Because of the amount of development effort already invested. But design project shouldn't be too significant of a problem, because its duration was short, and is already shared with four people. The way I think of it, if they were able to come up with a great idea once, there will be many more down the road. No need to hang on too tightly... - Thank you very much for your time.

252
Appendix 4: Information on design projects A. Project Deliverables
Design Project Timetable Term Deliverable Comments Scheme Code Submission Marker 4A Class of 2007 ECE 492A Engineering
Design Project 0.15 credit
ECE Lab
Access Request access to ECE project lab space and equipment
Not graded Lab Instructor
Project Specification
Pass/Resubmit PS UW ACE Instructors
Block Verification
Pass/Resubmit BV UW ACE Instructors
Detailed Design
Pass/Resubmit DD UW ACE Instructors
Prototype Testing Checklist
Pass/Resubmit PT UW ACE Instructors
Prototype Demonstration
Submit a hardcopy of the checklist to your consultant for assessment
0.15 letter PD Submit with Experience Report
Consultants and Instructors
Experience Report
Submit online and submit a signed hardcopy to the drop box in the ECE Main Office
Pass/Resubmit ER UW ACEand ECE Main Office
Instructors
Project Deliverables Group sign up Sign up Proposal sign up Sign up Project Agreement P/F 1 sheet Abstract P/F 50-100 words Statement of Work 4-5 pages Requirements Specification 2-3 pages Block Diagram 1-2 pages

253
Plan and Budget 2-3 pages Proposal Presentation 15 min. Proposal Critiques (x2) P/F 1 sheet 4 A EandCE 492A 0.15 credit -5% late penalty per day Block Verification 0.03 2-5 pages Detailed Design 0.03 5-20 pages Prototype Testing Checklist 0.03 2-5 pages Prototype Demonstration 0.03 See PT Experience Report 0.03 2-5 pages B. News Release on Display of Projects in this sample http://newsrelease.uwaterloo.ca/news.php?id=4934 2008-01-15 10:28:23 Engineering students showcase innovative tech projects
WATERLOO, Ont., (Tuesday, Jan. 15, 2008) -- Students from the University of Waterloo's
electrical and computer engineering program will exhibit innovative projects, such as an
automatic transmission for bicycles and an energy storage system for home use, at the
eighth annual design project symposium next week.
They will present design projects covering technological developments in such diverse areas
as computing, communications, entertainment, information technology and robotics, as well
as in medical, power and transportation systems.
The event will be held Wednesday, Jan. 23. at the William G. Davis Computer Research
Centre on the UW campus, from 9 a.m. to 8 p.m. Visitors are welcome to browse the
interactive displays and meet with students during the symposium.
"This is an exceptional opportunity for people to see these exciting projects first-hand and
to speak with our students," says Bill Bishop, fourth-year design project coordinator. "The
symposium showcases the talent and innovation of our outstanding students in the electrical
and computer engineering program."
The more than 250 students will present 60 interactive projects in seminar format to guests
from industry and the academic community. They will also display design project prototypes
at a poster presentation session running the entire day.
The Infusion Cup will be awarded for the best overall design project. The prize is sponsored
by Infusion Angels, a company located at the Waterloo Research and Technology Park.
The design projects include:

254
* Automatic Bicycle Transmission. The project showcases a prototype automatic
transmission system for a bicycle. Riders input various parameters describing their bicycle
and cycling style into the system. The design results in increased simplicity for riders, as
well as improved customization, precision and performance.
* Automatic Garbage Pickup Robot. The project's prototype aims to solve garbage pickup
problems by creating a machine that automatically detects and collects garbage. The
designed system involves a movable mini robot with a video camera. It features a control
system that processes the incoming image to identify garbage and sends a signal for the
robot to collect the trash.
* Home Energy Distribution and Storage System. The project presents a prototype energy
storage system for homes. It will draw and store energy from the electricity grid during off-
peak hours and supply a house with power during the day. The device will include the power
electronics necessary to supply the house with electricity of acceptable quality.
* Smart Avalanche Transceiver. The project's prototype combines existing avalanche
transceiver technology with a new system that allows rescuers to locate an avalanche victim
faster, more reliably and with less product-specific training. Each device will utilize GPS and
continuous inter-device communication to provide information on the victim's whereabouts.
Students participating in the symposium have completed an intensive design project course
sequence. The final-year course challenges them to work in groups to identify and address
specific design problems.
Past Symposiums For the past seven years, the design project symposiums have provided excellent opportunities to the general public to view the innovative work of our undergraduate students in Electrical and Computer Engineering. If you have not yet had an opportunity to attend a previous symposium, you can get a feel for the event by viewing the following segment entitled, "Waterloo's Casinobot", that appeared nationally on the Daily Planet television show.
Waterloo’s Casinobot http://www.exn.ca/dailyplanet/view.asp?date=1/23/2006

255
Appendix 5 : Additional statistical results 5.1 Histogram of control tendency measure
Control Tendency5432
Freq
uenc
y
20
15
10
5
0
Mean =3.77�Std. Dev. =0.544�
N =89

256
5.2 Histogram of estimated project value
Estimated project value6000050000400003000020000100000
Frequ
ency
80
60
40
20
0
Mean =3322.57�Std. Dev. =9046.275�
N =94
Descriptive statistics for estimated project value
(N, 94)
Statistics Value Mean 3322.57Median 500.00Std. Deviation 9046.28Skewness 4.63Std. Error of Skewness 0.25Minimum 0Maximum 60000Percentiles 25 100.00 50 500.00 75 1275.00

257
Histogram of log of estimated project value
log of estimated project value543210
Frequ
ency
25
20
15
10
5
0
Mean =2.76�Std. Dev. =0.834�
N =88
5.3 Histogram of trust proxy
Likelihood of hidden clauses in third party contract10987654321
Freq
uenc
y
12.5
10.0
7.5
5.0
2.5
0.0

258
5.4 Histogram of perceived likelihood of expected success from a potential collaboration
Likelihood of expected success from third party partnership1098765432
Frequ
ency
20
15
10
5
0
5.5 Histogram of perceived severity of idea loss on the market
Severity of losing idea on the market (1: severe; 5: pleasureable)54321
Freq
uenc
y
40
30
20
10
0

259
5.6 Control Preferences for subjects using the two-item measure of psychological attachment
1. Percentages of subjects choosing VC and Angel offers
A Rounds of offers 1 2 3 4 5 6 VC Angel VC Angel VC Angel VC Angel VC Angel VC Angel
B High PA
% of subject choices 24 76 24 76 25 75 27 73 29 71 94 6
C a.13 b.44 a.13 b.44 a.15 b.43 a.16 b.42 a.17 b.40 a.54 b.3
D Low PA
% of subject choices 42 58 47 53 50 50 50 50 53 47 95 5
E c.18 d.25 c.20 d.23 c.21 d.21 c.21 d.21 c.22 d.21 c.41 d.2
F F 3.55† 5.77* 5.93* 4.90* 5.09* 0.02 G VC (offer $4m), takes
% 55 54 53 52 51 50
H Angel (offer $2.5m) , takes %
45 46 47 48 49 50
(N, 56), * p < 0.05, † p < 0.10 Note: The cells denoted as a, b, c and d, indicate the percentages of subjects choosing within each round (deals) and sums up to 100%.

260
5.7 Percentages of subjects choosing VC and Angel offers within high and low psychological attachment groups
F 3.55† 5.77* 5.93* 4.90* 5.09* 0.02
(N, 89), * p < 0.05, † p < 0.10

261
5.8 Percentages of subjects in high and low psychological attachment groups
choosing VC and Angel offers across rounds (a representation of Appendix 6.2)
5.9 Percentages of subjects in high and low psychological attachment groups choosing VC and Angel offers within rounds
Percent subject preferences across rounds
Percent subject preferences within each round

262
5.10 Comparison of subjects share preferences in the high and low psychological attachment groups with the optimal choice
VC (offer $4m), takes % 55 54 53 52 51 50 Angel (offer $2.5m) , takes % 45 46 47 48 49 50
Developer’s value
Related Documents