The role of actuaries in defined-benefit pension reporting Divya Anantharaman Rutgers Business School 1 Washington Park, #916 Newark, NJ 07102 [email protected] http://andromeda.rutgers.edu/~divya/ This study examines the role of the pension actuary in the choice of discount rate assumptions used in defined-benefit pension accounting, to estimate pension obligations on corporate balance sheets. Clients of larger actuarial firms (which are presumably subject to stronger litigation- and reputation-based incentives to remain independent of their clients) use more conservative (i.e., obligation-increasing) discount rates, than clients of smaller actuarial firms. Within actuarial firms, clients that are economically important (to their actuarial practice-office, and to the individual actuary responsible) use more aggressive (i.e., obligation-reducing) discount rates, compared to less important clients. The effect of actuarial client importance is concentrated in highly leveraged plan sponsors with poorly funded pension plans, that are strongly motivated to understate reported pension obligations by managing assumptions, and in plan sponsors with weak auditor oversight. Finally, there is some evidence that the effect of client importance is driven by smaller plans (that might be subject to lower external scrutiny) in combination with smaller actuarial practice-offices. Overall, the results show that variation in the nature and incentives of the pension actuary translate into observable differences in the pension assumptions used. This, in turn, suggests that actuaries and their incentives play a role in the plan sponsor’s ability to manage assumptions so as to improve reported pension funding. Keywords: defined-benefit pensions, pension accounting, actuarial assumptions, actuaries, independence I am indebted to Eli Amir, Sharad Asthana, John Bury, Woo-jin Chang, Matt Cedergren, Liz Chuk, Joseph Comprix, Paquita Davis-Friday, Alberto Dominguez, Jennifer Gaver, Sally Gunz, Bikki Jaggi, Bjorn Jorgensen, Robin Knowles, S.P. Kothari, Kaitlin Morecraft, Lars Oxelheim, Stephen Penman, Avri Ravid, Alex Sannella, Bharat Sarath, Yong Yu, Yuan Zhang, Daniel Taylor (discussant) and participants at the AAA Financial Accounting and Reporting Section Meetings 2011, Kris Allee (discussant) and participants at the Conference on Financial Economics and Accounting 2011, Clive Lennox (discussant) and participants at the HKUST Accounting Symposium 2011, the University of North Carolina-Charlotte, Yeshiva University, the Midwest Finance Association 2011 meetings, the AAA Mid-Atlantic Regional Meeting 2011, the AAA Annual Ethics Research Symposium 2012, and the AAA Annual Meeting 2013 for useful comments on the manuscript. I am indebted to many members of the actuarial and accounting professions for generously sharing their knowledge and experience. All errors are my own. Comments and suggestions are greatly appreciated.

Welcome message from author
This document is posted to help you gain knowledge. Please leave a comment to let me know what you think about it! Share it to your friends and learn new things together.
Transcript
The role of actuaries in defined-benefit pension reporting
Divya Anantharaman
Rutgers Business School
1 Washington Park, #916
Newark, NJ 07102
http://andromeda.rutgers.edu/~divya/
This study examines the role of the pension actuary in the choice of discount rate
assumptions used in defined-benefit pension accounting, to estimate pension obligations
on corporate balance sheets. Clients of larger actuarial firms (which are presumably
subject to stronger litigation- and reputation-based incentives to remain independent of
their clients) use more conservative (i.e., obligation-increasing) discount rates, than
clients of smaller actuarial firms. Within actuarial firms, clients that are economically
important (to their actuarial practice-office, and to the individual actuary responsible) use
more aggressive (i.e., obligation-reducing) discount rates, compared to less important
clients. The effect of actuarial client importance is concentrated in highly leveraged plan
sponsors with poorly funded pension plans, that are strongly motivated to understate
reported pension obligations by managing assumptions, and in plan sponsors with weak
auditor oversight. Finally, there is some evidence that the effect of client importance is
driven by smaller plans (that might be subject to lower external scrutiny) in combination
with smaller actuarial practice-offices. Overall, the results show that variation in the
nature and incentives of the pension actuary translate into observable differences in the
pension assumptions used. This, in turn, suggests that actuaries and their incentives play a
role in the plan sponsor’s ability to manage assumptions so as to improve reported
pension funding.
Keywords: defined-benefit pensions, pension accounting, actuarial assumptions,
actuaries, independence
I am indebted to Eli Amir, Sharad Asthana, John Bury, Woo-jin Chang, Matt Cedergren, Liz
Chuk, Joseph Comprix, Paquita Davis-Friday, Alberto Dominguez, Jennifer Gaver, Sally Gunz,
Bikki Jaggi, Bjorn Jorgensen, Robin Knowles, S.P. Kothari, Kaitlin Morecraft, Lars Oxelheim,
Stephen Penman, Avri Ravid, Alex Sannella, Bharat Sarath, Yong Yu, Yuan Zhang, Daniel
Taylor (discussant) and participants at the AAA Financial Accounting and Reporting Section
Meetings 2011, Kris Allee (discussant) and participants at the Conference on Financial
Economics and Accounting 2011, Clive Lennox (discussant) and participants at the HKUST
Accounting Symposium 2011, the University of North Carolina-Charlotte, Yeshiva University,
the Midwest Finance Association 2011 meetings, the AAA Mid-Atlantic Regional Meeting 2011,
the AAA Annual Ethics Research Symposium 2012, and the AAA Annual Meeting 2013 for
useful comments on the manuscript. I am indebted to many members of the actuarial and
accounting professions for generously sharing their knowledge and experience. All errors are my
own. Comments and suggestions are greatly appreciated.

1
1. INTRODUCTION
The actuarial assumptions used in defined-benefit pension accounting are often
chosen strategically, to make plans appear better funded or plan costs appear smaller than
they actually are (Feldstein and Morck, 1983; Asthana, 1999; Bergstresser et al., 2006).
As pension assets, liabilities and costs are an economically significant part of corporate
financial statements, even small changes in pension assumptions can impact earnings and
balance sheets substantially. While managers of the firm sponsoring the plan (“plan
sponsor”) are ultimately responsible for choosing pension assumptions, these
assumptions are typically chosen on the recommendation of the pension actuary. In spite
of this vital role that actuaries play, little is known about their effect on pension reporting.
I examine the role of the pension actuary in the financial reporting of pension obligations,
and examine whether the incentives of the actuary affect actuarial assumptions used.
Actuaries are self-regulated, with an institutional framework similar to that of the
accounting profession prior to the Sarbanes-Oxley Act. Researchers note that “the issues
surrounding the professional independence of actuaries are not, in principle, unlike those
that faced the audit profession before the regulatory changes early this century” (Gunz et
al., 2009). Actuaries render opinions for a fee, making them susceptible to conflicts
between providing advice based on objective analysis, and serving the needs of plan
sponsor clients, when the two diverge. This conflict has long been a subject of discussion
within the actuarial profession—for example, “…as long as a client can threaten to find
another actuary to provide actuarial services, the implied leverage might well have an
effect on the actuary’s work product” (American Academy of Actuaries Task Force,
2006)—across all areas where actuaries function, such as pensions and insurance

2
(Feldblum, 1993; White and Atkinson, 1993, Carmichael, 1997).1 Vaughan, Cooper, and
Frank (1993), in a survey of insurance actuaries, report that “responding to pressure from
clients or management to change assumptions” was considered the most serious ethical
challenge facing the profession. These issues have received some wider attention,2 but the
generally low visibility of the profession and lack of public exposure to its work has
limited a robust debate on actuarial independence from developing in the United States.
These concerns about the professional independence of actuaries, when
juxtaposed with academic evidence on firms’ strategic use of pension assumptions, beg
the question of whether the pension assumptions that plan sponsors ultimately use are
affected by actuaries’ economic incentives, i.e., whether certain plan sponsors
successfully exert pressure on actuaries to tilt assumptions in a specific direction. If the
threat of losing fee revenues from a client affects the actuary’s work product, this might
manifest in actuarial assumptions that better fit the client’s reporting objectives. Actuaries
do, however, face countervailing incentives to resist client pressure - from the threat of
litigation, the need to maintain reputation, and perhaps more fundamentally from
1In other examples, “An actuary can only really claim independence if the advice given is totally open and
public, and is capable of being relied on by any interested party. The fiduciary relation which a consulting
actuary has with his or her client (not to mention the receipt of a fee) implies that they are beholden to their
client...” in published comments to Bellis (2000)’s speech to the Institute of Actuaries. In the insurance
arena, Feldblum (1993) argues in a discussion paper of the Casualty Actuarial Society that the insurance
actuary is “torn between the two roles” of professional expert (certifying to insurance regulators that loss
reserves are reasonable) and business manager (seeking to optimize company performance), and provides
the interesting example that “almost all major insurers have unqualified actuarial opinions”, but yet “most
actuaries believe that industry reserves are seriously deficient on a statutory basis”. 2For example, there is ““subtle pressure on the actuary to come up with numbers that make the pension
fund look good” (Mary Williams Walsh, “Actuaries scrutinized on pensions”, The New York Times, May
21, 2008). Warren Buffett, in his 2007 letter to shareholders, famously decried pension expected rate-of-
return assumptions for being unrealistic, adding that somehow, “the auditors and actuaries charged with
vetting these return assumptions seem to have no problem with it”. Standard & Poors’ insurance analyst
Steven J. Dreyer asserts, “The accounting profession has come in for a lot of criticism in recent years.
Meanwhile, the insurance industry has done something almost as egregious by, in effect, overstating prior-
year earnings by billions of dollars. Somehow, actuaries have avoided the spotlight for abetting this.”
(Dreyer, Steven J., Siddhartha Ghosh, John Iten, Robert G. Partridge, and Mark Puccia. “Insurance
Actuaries: A crisis of credibility.” November 19, 2003. Standard & Poor’s RatingsDirect: New York, NY.)

3
personal integrity and professional codes of conduct. Whether these incentives dominate
economic considerations, is an empirical question.
In this study, I focus on one actuarial recommendation – the discount rate with
which projected future benefit payments are discounted to present value to estimate
pension obligations — and examine first, whether this assumption varies systematically
across actuarial firms, and second, whether it varies, within actuarial firms, with the
economic importance of the plan sponsor to its actuary. Following prior literature in the
auditing setting (e.g., DeAngelo, 1981; Becker et al., 1998), I expect larger actuarial
firms to recommend more conservative assumptions, due to their presumably stronger
litigation- and reputation-based incentives to remain independent. Further, if economic
considerations do overwhelm these incentives to remain independent, we would expect to
see actuaries recommending more aggressive assumptions to their relatively more
important clients, the loss of whom would affect fee revenues more substantially.
I focus on the discount rate first because its determination is a key responsibility
of the pension actuary (Patel and Daykin, 2010). The discount rate is crucially dependent
on the duration of pension obligations, which in turn depends on the timing of expected
cash outflows from the plan. The timing of cash outflows further depends on
demographic assumptions about employee retirement, termination, mortality, etc., which
the actuary is primarily responsible for determining. Second, the pension obligation and
pension expense are both very sensitive to the discount rate, making it a powerful lever of
these numbers and thereby susceptible to manipulation (Naughton, 2011; Brown, 2013).
In a sample of 4,169 firm-years from 2000-2008, there is evidence that clients of
the largest actuarial firms use systematically lower, or more conservative (i.e., obligation-

4
increasing) discount rate assumptions, consistent with larger actuarial firms having
incentives to enforce conservative pension valuations. Within actuarial firms, there is
strong evidence that economically important clients (i.e., that account for a greater
proportion of their actuary’s client portfolio) use higher, or more aggressive (obligation-
reducing) discount rates, compared to less important clients. Examining client importance
at three levels – the actuarial firm level, the actuarial practice-office level, and the level
of the individual actuary signing the actuarial report, client importance at both practice-
office and individual levels is incrementally associated with higher discount rates.
Partition tests show that the effects of client importance are driven, as expected,
by client firms with strong incentives to overstate discount rates - highly leveraged plan
sponsors with poorly-funded pension plans (“financially weak” plans). This effect exists
both within actuarial firms (across their client portfolio), and within client firms (over
time). In these plans, there is some evidence that client importance effects at the practice-
office level are stronger when auditor oversight of actuarial valuations is weak.
Finally, the effect of client importance manifests in both large and small actuarial
firms. Interestingly, however, sorting plans by absolute size shows that the effect of client
importance is driven by relatively small plans in combination with smaller practice-
offices. In other words, the plan sponsors that appear to successfully exert pressure for
aggressive assumptions are not the very largest plans by absolute size (these plans may
face significant external scrutiny that constrains manipulation) but rather, smaller plans
that happen to be relatively important to their practice-office.
This study makes three contributions. First and most important, while many
studies have shown that pension assumptions are managed to achieve reporting

5
objectives, this study sheds some light on the how, by illustrating one mechanism that
allow plans sponsors to implement the desired window-dressing of pension status. If the
actuary’s sign-off on pension assumptions is necessary for the auditor’s vetting of
pension reporting, then plan sponsors that are strongly motivated to manipulate
assumptions may resort to exerting pressure on actuaries to produce numbers that better
fit their reporting objectives. The evidence in this study is consistent with this picture —
not for all plan sponsors or actuaries, but for subgroups of highly motivated plan sponsors
in combination with certain actuarial practice-offices. To take another perspective, extant
research has focused on identifying plan sponsors’ incentives to manipulate assumptions,
assuming implicitly that managers’ ability to manipulate does not vary. I focus on ability,
and shows that it varies with the nature and incentives of the pension actuary.
Second, even though actuaries play a key role in pensions and insurance,
empirical evidence on their role in financial reporting is scarce, the sole exception being
Gaver and Paterson (2001), who study actuaries in property-casualty insurance reporting.
The many layers of evidence here: first, that actuarial firm fixed-effects are highly
significant determinants of discount rates; then, that clients of large and small actuarial
firms use systematically different discount rates; and finally, within actuarial firms, that
important clients use more aggressive discount rates – combine to suggest that actuaries’
incentives do matter, and are a heretofore-unconsidered force in pension reporting.
Taking a broader perspective, even though I focus on pensions sponsored by public firms,
the approach used here to characterize actuaries’ incentives could be relevant in other

6
arenas where actuaries set assumptions: pension plans of non-public firms, not-for-profit
institutions, and governments; multi-employer plans; and insurance reporting.3
Third, this study contributes to an interdisciplinary literature examining
professional independence in auditors, compensation consultants (Cadman et al., 2010;
Murphy and Sandino, 2010) and equity analysts (e.g., Michaely and Womack, 1999).4
Research has found limited evidence of impaired independence in audit firms for
economically important clients, leading to the conclusion that auditors have strong
countervailing incentives — from the desire to maintain their reputations, and to avoid
litigation — to resist client pressure (DeFond et al., 2002; Hope and Langli, 2010). The
findings here suggest that such incentives, on average, are weaker for actuaries,
potentially for many reasons: the subjective, complex and uncertain nature of the pension
actuary’s work, and the lack of transparent disclosure on how assumptions are
determined. Finally, the fact that litigation risk has historically been low for actuarial
firms compared to accounting firms - which, in turn, could relate to the low visibility of
and lack of public exposure to actuaries’ work, could be an important driving force
behind the findings (Bellis, 2000; Collins, Dewing, and Russell, 2009).5,6
3 One in five workers in U.S. private industry are covered by defined-benefit plans (Bureau of Labor
Statistics’ National Compensation Survey: http://www.bls.gov/ncs/). Almost 80% of state and local
government employees are covered only by defined-benefit plans (Munnell, Aubry, and Muldoon 2008). 4 The auditor independence literature is extensive: see Antle et al. (2006) for a review. Murphy and Sandino
(2010) find that consultants who also provide actuarial services to their clients recommend higher CEO
pay. This study takes a different perspective: that of the actuarial firm itself, examining whether clients that
are more influential (within the portfolio of actuarial work) have differing pension reporting outcomes. 5 These differences are highlighted by the contrasting effects of client importance to the actuary versus
auditor. Controlling for client importance to the actuary, client importance to the auditor associates with
more conservative assumptions, consistent with auditors’ litigation- and reputation-based incentives
incentivizing them to be stricter with large clients (e.g., Reynolds and Francis 2001). 6 Gaver and Paterson (2001) find in their study of property-casualty insurers that auditors who use third-
party actuarial firms estimate loss reserves less conservatively than auditors who rely on actuaries from the
Big Six accounting firms. They conclude that stand-alone actuarial firms are less likely to be attuned to
auditors’ liability exposure, as actuarial firms are only infrequently sued. In this study, I arrive at a similar
conclusion but in the context of pension reporting.
7
The disclosure of the identity of the individual actuary responsible also allows
insights into the way in which economic bonding functions, that are not available in the
U.S. audit setting where signing partner names are not disclosed. A key issue in the
literature on economic bonding is what the appropriate level of analysis is. While the
audit literature has evolved from firm- to office-level analysis of client importance,
DeFond and Francis (2005) suggest drilling down further to the engagement partner-
level. Although the very different environments facing actuaries vis-à-vis auditors in the
U.S. make it difficult to transfer inferences directly, finding in the actuary setting that
both office-level and individual-level client importance matter incrementally, first,
supports the argument for drilling down. Second, the fact that client importance matters
in spite of the “accountability effect” from requiring disclosure of the individual
responsible, suggests that disclosure of identities alone could be ineffective at
constraining manipulation, unless accompanied by litigation or professional sanctions.
These findings are also of interest to regulators. In the United Kingdom, the
highly visible failure of the Equitable Life Insurance Company and resulting revelations
of actuarial conflicts of interests that contributed to its collapse, led to intense public
scrutiny and a government review of the actuarial profession that overhauled its
regulatory framework to address conflicts of interest (Morris, 2005).7 These events have
led to a robust debate in the U.K. ever since on how to maintain the quality and
independence of actuaries’ work. In Australia, governmental enquiry revealed that client
7 The Morris review concluded: “professional standards have been weak, ambiguous or too limited in
range, and perceived as influenced by commercial interests”. Consequently, the actuarial profession lost
its purely self-regulated status and was brought under the oversight of the Financial Reporting Council
(“FRC”, the U.K.’s independent regulator of financial reporting and corporate governance), in a sequence
of events similar to the U.S. accounting profession’s shift from self-regulation to statutory regulation in
2002. The FRC explains that its oversight of the actuarial profession is necessitated by the fact that “many
of the FRC’s stakeholders, from institutional investors to individual insurance policyholders to pension
fund members, rely, either directly or indirectly, on actuarial work.”

8
pressure on the actuary had contributed similarly to the severe under-estimation of the
asbestos liabilities of James Hardie Limited, the dominant Australian producer of
asbestos (Gunz and van der Laan, 2011). A self-review of the U.S. profession (American
Academy of Actuaries Task Force, 2006) recognizes that “actuaries face the same
potential conflicts of interest as anyone working in the business world”, but concludes
that “the profession has done a good job of balancing these pressures”. The empirical
evidence in this study has the potential to inform this discussion.
2. INSTITUTIONAL BACKGROUND ON THE ACTUARIAL PROFESSION
2.1. The actuarial profession in the United States, and what pension actuaries do
Actuaries are professionals trained in evaluating the current financial implications
of future contingent events (Hager and Chretien, 1982); they work usually in insurance
and pension sectors. In the U.S., actuaries belong to a self-regulated profession with four
designation-granting professional organizations. The profession’s Code of Professional
Conduct requires actuaries to act honestly and in a manner that “fulfills the profession’s
responsibility to the public” (American Academy of Actuaries, 2009). Actuaries must
also follow generally accepted actuarial principles, codified as Actuarial Standards of
Practice (ASOPs), opinions, recommendations, and interpretations.
Pension benefits are paid far into the future, based on when employees retire,
what form of benefit they elect, how long they live, who survives them, etc. Valuing such
long-term liabilities hence requires assumptions about the future. The pension actuary
sets these assumptions, and combines them with participant data and benefits formulae to
project benefit payments and value plan liabilities. She then estimates the contributions
required to fund those promises over a period of time.

9
Assumptions are of two kinds. Demographic assumptions relate to the
composition and expected behavior of the beneficiary pool, e.g., how long participants
continue to work (termination, disability, and retirement assumptions) and how long
retirees will live (mortality assumptions). Economic assumptions relate to how market
forces affect the cost of the plan, e.g., the expected rate of return (ERR) on plan assets,
the discount rate, and the rate at which salaries grow over service lives. As the future is
uncertain and the “selection of assumptions is not a precise mathematical process”, the
actuary applies considerable professional judgment to determine a best-estimate range for
each assumption, and then select a specific point from within the range, using generally
accepted actuarial principles (Actuarial Standards Board, 1996).
2.2. The pension actuary’s role in pension funding and pension accounting
The Employee Retirement Income Security Act 1974 (ERISA), enacted to
improve retirement income security for private industry workers, expanded the role of the
pension actuary greatly. ERISA created the Joint Board for Enrolment of Actuaries,
which regulates any actuary who performs services for plans under ERISA (an “Enrolled
Actuary”). It also requires all qualified plans with more than 100 participants to engage
an actuary to perform periodic valuations of plan liabilities and assets, to certify the
contribution estimated as necessary to eliminate the plan’s funding deficit (if any), and to
justify any changes in assumptions, in a yearly report to the Department of Labor (DOL)
and the IRS.8 ERISA imposes a statutory duty on the actuary to act on behalf of the plan
participants (as opposed to the plan sponsor), and to use independent judgment in
choosing methods and assumptions (Hager and Chretien, 1982).
8The actuary also states that all costs and liabilities are determined with reasonable actuarial assumptions
and methods, which in combination offer her best estimate of anticipated experience for the plan.

10
For pension funding (i.e., reporting to the DOL through the Form 5500), the
actuary is responsible for selecting the assumptions used to estimate plan liabilities, and
certifies them in the actuarial report. For pension accounting (i.e., reporting in plan
sponsor’s financial statements filed with the SEC), the managers of the plan sponsor, by
virtue of being responsible for all information in financial statements, are also responsible
for the assumptions chosen. But even though managers are ultimately responsible for the
assumptions used in pension accounting, the institutional environment effectively
constrains managers to choose from within the actuary’s recommended range. First, as
pension assumptions fall within the specialist domain of the actuary, auditors vetting
these assumptions typically request written confirmation from actuaries that assumptions
have been chosen in accordance with SFAS 87, and are unlikely to allow assumptions
that are outside the actuary’s explicit sign-off (Society of Actuaries, 1986; Rezaee, 1982;
Zuber, 1988). Furthermore, it is standard audit practice to test the data, methods and
assumptions used by the actuary in her Form 5500 valuation report filed with the DOL,
and to compare assumptions across 10-K filings and DOL filings (where the actuary
certifies assumptions), to check that they are similar, if not identical, except only when
GAAP and ERISA explicitly prescribe differing treatment (Brown, 2013).
2.3. The discount rate assumption: how it is determined, and sources of discretion
The pension liability (“projected benefit obligation” or “PBO”, which is the
present value of expected future benefit payments) and pension plan assets net out to the
pension funding status, which appears as a liability (asset) on the corporate balance sheet
if the firm’s pensions are under- (over-) funded. As the discount rate is used to discount

11
future benefit payments to present value, a higher discount rate leads to lower PBO, and
stronger funding status, ceteris paribus.
The discount rate is the rate at which pension benefits can effectively be settled,
and is estimated by the yield on a hypothetical portfolio of high-quality corporate bonds
whose coupons and maturities match the plan’s projected benefit payments (SEC, 2005).
To determine this rate, the actuary first estimates the stream of future cash outflows of the
plan, which in turn requires demographic assumptions, such as retirement, early
retirement, disability and involuntary termination rates, the forms of benefit employees
will choose (e.g., annuity or lump-sum), and pre- and post-retirement mortality. Then,
each cash flow is discounted to present value with an interest rate applicable to its
maturity, from a yield curve developed to comply with SFAS 87 (e.g., the Citigroup
Pension Discount Curve, or firm-specific curves). These present values are summed up to
arrive at the PBO. The discount rate reported in the financial statements is the single rate
that, if applied to all cash flows, would produce this same PBO (Naughton, 2011).
While there is some discretion available in determining the yield curve (for
example, what securities to include, how to eliminate outliers, how to extrapolate yields
beyond the 30-year duration of traded securities), it is still a highly visible, market-
determined parameter that is difficult to manipulate, even in the presence of strong
incentives to do so. Furthermore, conversations with actuaries indicate that the universe
of bonds included in the yield curve is often determined at the actuarial firm-level,
leaving individual actuaries or offices with little discretion to add or remove bonds.
The larger source of discretion lies more fundamentally in determining the stream
of future cash flows itself (which is subject to many assumptions based on plan
12
demographics and features of the benefits contract), which is the domain of the pension
actuary. These assumptions, and consequently, the stream of cash flows that results, are
subject much more to professional judgment on the part of the actuary, and could be
skewed in a particular direction based on incentives. Any discretion in cash flow
forecasts, in turn, manifests in the discount rate, as it is the yield on a hypothetical
portfolio that mirrors the amounts and maturities of the plan’s cash outflows.
3. HYPOTHESES
3.1. Incentives to acquiesce to pressure, and countervailing forces
The potential conflicts of interest faced by actuaries resemble those faced by
accountants, or any professional giving an opinion for a fee. When the actuary receives
substantial revenues from a client, the resulting dependence may make the actuary more
willing to acquiesce to client pressure. This could translate into recommending
assumptions that help clients fulfill their financial reporting objectives (DeAngelo, 1981;
Gunz et al., 2009). The complexity of pension accounting in turn could enable such
window-dressing (e.g., Picconi, 2006). Further, assumption-setting does involve
judgment, and ASOPs recognize that there is an acceptable range for many assumptions.
If fear of termination forces actuaries to be indifferent over a range of values, difficulty in
detecting manipulation ex ante or in disentangling it from honest error in good-faith
estimates ex post could facilitate misreporting (Asthana, 1999, 2007; Brown, 2013).9
Still, actuaries have many reasons to resist client pressure, both intrinsic — the
desire to maintain integrity and adhere to professional codes of conduct), and extrinsic —
9 It is unclear if investors can see through manipulated assumptions: Feldstein and Morck (1983) and
Brown (2013) conclude that they can, but Amir and Gordon (1996) and Coronado and Sharpe (2003) find
the opposite. Even if investors are able to see through, managers could still have incentives to manipulate if
other stakeholders (employees, creditors, regulators) cannot completely see through (Brown, 2013).

13
sanctions from the profession, and the risk of compromising reputation. Finally, even
though managers are finally responsible for assumptions in financial statements, actuaries
can be, and are, sued by third parties (such as plan beneficiaries) for failing to advice plan
sponsors in a way that ensures sufficient funds to pay benefits. Actuarial liability can
arise under federal statute (ERISA), and under state common law that applies to
malpractice by any professional.10
Moreover, audit literature has shown that auditor
litigation risk is higher for economically important clients (Lys and Watts, 1994); if this
is true for actuaries, it could act as a constraint against acquiescing to pressure, even (or
especially) from important clients.
It is unclear whether litigation risk affects actuaries as significantly as it does
auditors. There is anecdotal evidence that malpractice insurance premia are low relative
to accounting firms (Ladbury, 1995; Gaver and Paterson, 2001). The largest actuarial
firms also commonly ask pension clients to sign retainers that cap actuaries’ liability for
malpractice (Morse, 2003). Litigation has however increased since the 1990s, fueled by
widespread pension deficits (Dailey and Selznick, 2002; Harrington, 2008; Walsh, 2008),
as has the size of malpractice settlements. 11
Hence, it remains an empirical question as to
whether these incentives are significant enough to counteract economic considerations.
3.2. Identifying variation in actuaries’ incentives
A stream of research has shown that plan sponsors have incentives to understate
plan liabilities (and overstate the reported funding status). One way to do this is to choose
10
Dailey and Selznick (2002) provide a comprehensive history of litigation against actuaries. 11
2010 saw one of the largest actuarial malpractice settlements in the history of lawsuits against actuaries
($500m, against a $2.8b damage claim), paid by Mercer to the Alaska public employees’ retirement system,
for failures to properly estimate health care cost increases, exacerbating severe funding deficiencies in
Alaska’s plans. This case made actuarial malpractice insurance prohibitively expensive for a period of time
(Gretchen Morgenson. “Mercer’s Little Alaska Problem”, The New York Times, December 19, 2009.).

14
an aggressively high discount rate. Blankley and Swanson (1995) find that the majority of
firms choose discount rates higher than published benchmarks for the average yield on
high-quality corporate bonds. A higher discount rate (and stronger funding status)
benefits the plan sponsor in many ways: it translates into a healthier balance sheet, which
lowers the cost of raising financing (Feldstein and Morck, 1983), avoids violating debt
covenants (Amir and Gordon, 1996), and reduces negative attention from the media and
regulators (Bodie et al., 1987; Mittelstaedt, 1989; Asthana, 1999).
From the actuary’s perspective, an aggressively high discount rate makes the plan
appear better funded than it really is, and so allows sponsors to reduce contributions into
the plan. This eventually erodes benefit security for employees by reducing the likelihood
of sufficient funds being available to pay benefits as they become due, and increases the
likelihood of lawsuits against the actuarial firm. So when there is client pressure for an
aggressive discount rate, the actuary faces a trade-off: by acquiescing to this pressure, she
retains the client’s business on the one hand; but on the other hand, runs the risk of un-
conservative actuarial valuations being (eventually) revealed, and then costs associated
with lawsuits from beneficiaries, loss of reputational capital, and loss of revenues from
other clients who depart at that point.
This trade-off is similar to that faced by auditors. To understand better the trade-
offs facing actuaries, I apply to this setting some insights from frameworks in the
auditing literature that aim to predict when auditors will compromise independence (for
e.g., Chung and Kallapur, 2003).
3.2.1. Large versus small actuarial firms
15
Many factors from the Chung and Kallapur (2003) framework suggest that
incentives to acquiesce to client pressure are weaker for large actuarial firms, compared
to the smaller actuarial firms. First, the large roster of clients such firms have makes each
client less important on average. Second, these firms are likely to have larger clients, who
are subject to more scrutiny from analysts, investors, unions and regulators, increasing
the risk of detection. Third, the costs of being detected are likely to be higher.
Extrapolating from the audit setting, the most prominent actuarial firms could face higher
litigation exposure than small firms (even though we do not have well-organized data on
lawsuits against actuaries to confirm this conjecture), as also greater reputational
consequences from the revelation of manipulation (Becker et al., 1998). If larger actuarial
firms do have stronger incentives to remain independent, we would expect larger
actuaries to recommend more conservative (i.e., obligation-increasing) discount rates on
average. The first hypothesis follows:
Hypothesis 1 (H1): Clients of large actuarial firms use lower (i.e., more obligation-
increasing) discount rates than clients of small actuarial firms.
Actuaries have, however, increasingly expanded into providing “non-actuarial
services” such as benefits administration and compensation consulting. While large
actuaries may face higher costs to acquiescing to client pressure, they may also face more
pressure to cross-sell such services to clients. The lack of public disclosures on fees from
such services makes it difficult to assess their importance in actuarial firms’ decisions.12
3.2.2. The effect of client importance within actuarial firms
If actuaries’ incentives to remain independent are not strong enough to
overwhelm the incentives to acquiesce to client pressure, this could manifest in their
12
Fees for compensation consulting services are available from proxy statements post-2006, but they are
usually small compared to fees for other services provided by actuaries (Murphy and Sandino, 2010).

16
allowing aggressive (i.e., obligation-reducing) discount rates for at least some clients.
This is more likely with influential clients that account for a large proportion of the
actuary’s revenues, as the benefits of acquiescing to pressure (i.e., retaining client
revenues) are more likely to exceed the costs, with larger clients (Chung and Kallapur,
2003). To the contrary, if incentives to resist client pressure dominate, then client
importance need not have any relation with discount rates, or could even lead to more
conservative assumptions, akin to findings in the audit setting (Reynolds and Francis,
2001; Gaver and Paterson, 2007). The second hypothesis (in alternative form) follows:
Hypothesis 2 (H2): Economically important clients of an actuary use higher (i.e., more
obligation-reducing) discount rates than less important clients of the actuary.
3.2.3. The effect of client importance: partitioning on plan sponsor incentives
The actuary’s incentive to acquiesce to client pressure is stronger when the client
is strongly motivated to improve its reported funding status, and so highly likely to
switch actuaries in the face of resistance (Chung and Kallapur, 2003). Not all plan
sponsors have similar incentives to use aggressive discount rates: this incentive is
stronger for plan sponsors with poorly-funded plans, and where the plan sponsor is also
financially constrained from borrowing to fund the plan, e.g., because it is already highly
leveraged (Feldstein and Morck, 1983; Asthana, 1999). If client importance affects
discount rates, then the effect of client importance should manifest primarily in such
highly leveraged plan sponsors with poorly funded plans (“financially weak” plans).13
Hypothesis 3 (H3): The effect of client importance on discount rates is stronger in, or
driven by, financially weak plans.
13
Taking the perspective of the plan sponsor, most financially weak sponsors have strong incentives to
inflate discount rates. However, not all these sponsors may have the ability to obtain an aggressively high
discount rate. If influence over the actuary is an underlying requirement to achieving a higher discount rate,
and if client importance captures that influence, then within this group of ‘high-incentive’ firms, we should
observe the economically important clients being better able to realize the desired discount rate assumption.

17
3.2.4. The effect of client importance: partitioning on plan sponsor opportunities
External auditors ultimately test the assumptions recommended by actuaries and
chosen by managers. Even though auditors rely on actuaries’ work, they are expected to
vet actuaries’ data, assumptions and methods. Stronger auditor oversight may hence
weaken opportunities to manipulate assumptions. If auditor oversight effectively
constrains discretion in estimates, then even economically important clients will not be
able to discount pension cash flows at inflated rates. The fourth hypothesis follows:
Hypothesis 4 (H4): The effect of client importance on discount rates is stronger in, or
driven by, plan sponsor clients with weak auditor oversight.
Finally, the actuary’s opportunities to manipulate, even for economically
important clients, could be lesser in larger actuarial firms, which are likely to have
internal checks and balances, and firm-wide standards that individual actuaries cannot
deviate from. If this is true, any increase in client importance need not translate into
higher discount rates in these firms. The final hypothesis follows:
Hypothesis 5 (H5): The effect of client importance on discount rates is stronger in, or
driven by, smaller actuarial firms.
3.3. How about downward manipulation of discount rates?
Even though I focus on plan sponsors’ attempts to improve the reported funding
status by manipulating discount rates upwards, plan sponsors also have incentives to
worsen the reported funding status by manipulating discount rates downward, e.g., to
maximize tax-deductible contributions to the plan (Asthana, 1999), or to exaggerate the
apparent economic burden of maintaining the plan, so as to ease negotiations with unions
to freeze the plan (Amir and Gordon, 1996; Comprix and Muller, 2011).
Choosing lower (conservative) discount rates increases the reported pension
liability and necessitates larger contributions into the plan, whereas lawsuits against

18
actuaries usually involve allegations that actuaries under-estimated liabilities, leaving
insufficient funds to eventually pay benefits (Dailey and Selznick, 2002).14
Therefore, it
is hard to define what the cost (or trade-off) is for the actuary who acquiesces to client
pressure for a conservative discount rate. As actuaries might presumably be willing to
recommend conservative assumptions to all clients, not just economically important ones,
we do not obtain the same prediction on client importance in this setting.
4. DATA, RESEARCH DESIGN, AND DESCRIPTIVE STATISTICS
4.1. Data and sample selection
The key piece of data required for this study is the identity of the pension actuary,
which is not disclosed on the plan sponsor’s SEC filings. Every qualified defined-benefit
plan, however, is required to file an annual report (Form 5500) with the IRS, DOL, and
the Pension Benefit Guaranty Corporation, which includes a statement from the plan’s
Enrolled Actuary, with her name, enrolment number, and name and address of the
actuarial firm. The database of Form 5500 filings, obtained from the DOL’s Employee
Benefits Security Administration, consists of almost 400,000 filings for 2000-2008 (“the
universe” of plan filings); filings for 2000-2007 (2008) are complete (incomplete).15
Each
plan files a separate Form 5500, with multiple filings possible for a firm in a year. Note
14
Landmark cases against actuaries include Mertens v. Hewitt Associates, where beneficiaries of Kaiser
Steel’s pension plan sued Hewitt for assumptions that led to inadequate funding and eventual plan
termination. The actuary was also accused of delegating assumption-setting to the sponsor. Claims have
also centered on specific assumptions, e.g., Steiner Corp Retirement Plan v. Johnson & Higgins (annuities
versus lump sum payments), Pappas v. Buck Consultants (discount rates) that under-estimated plan
liabilities. In another landmark case, the Pension Benefit Guaranty Corporation (PBGC) sued George Buck
Actuaries for aggressive assumptions that led to funding deficits that the PBGC eventually had to cover. 15
I start the sample in 2000 as some key plan features required as controls (%FROZEN, %CASHBAL) are
unavailable in the pre-2000 format. I end the sample in 2008 as the new format post-2008, to accommodate
Pension Protection Act (PPA) 2006 requirements, made other controls (e.g., for plan duration) unavailable
or defined differently. A partial set of 2008 filings (for which measurement year ended before the new rules
phased in) exists under the pre-2007 format.

19
that all entities with ERISA-qualified plans file Form 5500s, including privately held
firms, foreign firms unlisted in the U.S., partnerships, and not-for-profit entities.
To conduct the study, data on discount rates, firm characteristics, and auditors
from SEC filings have to be matched to the Form 5500 data. All data from SEC filings
are obtained from Compustat Fundamental, Compustat Pensions, and Audit Analytics;
there are 6,657 firm-year observations with sufficient data (the “potential sample”).
Matching Compustat to Form 5500s is challenging, as there is no common firm-level
identifier. The Form 5500 identifies plan sponsors by name and Employer Identification
Number (EIN), while Compustat provides EINs; but when firms have multiple EINs,
Compustat provides only one. Hence, I match the data in a multiple-step, iterative process
(detailed in Appendix A), which matches 73% (80%) of the potential sample for 2000-
2008 (2000-2007) to Form 5500s, yielding 4,864 matched observations. I drop all
observations from 2005 –Form 5500s are available for this year but many fields (e.g., the
number of beneficiaries) are “0” for almost all filings, indicating widespread coding
errors for that year. The final sample has 4,169 firm-year observations. As assumptions
in financial reporting are disclosed at the firm-level (and not individual plan-level), all
tests are run at the firm-year level; control variables from the Form 5500 are aggregated
across all plans sponsored by the firm in that year.
4.2. Measuring client importance
4.2.1. Size-based measure of client importance
Conceptually, client importance is the ratio of quasi-rents from each client, to the
professional’s total quasi-rents from all sources (DeAngelo, 1981; Chung and Kallapur,
2003). Assuming that fee revenues from each client are a good proxy for quasi-rents, the

20
audit literature has often used the ratio fee revenues from each client / total fee revenues
of the professional in that period to measure client importance. Data on actuarial fees,
however, are problematic for a few reasons detailed in the next section. Prior to required
disclosure of audit fees, the literature defined client importance as the size of each client
relative to the combined size of the auditor’s client portfolio in that period.16
This
requires the assumption that quasi-rents from each client are strongly correlated with
client size. I follow this approach to create a size-based measure of client importance to
the actuary, using the number of beneficiaries to measure plan size:
EIMP = Number of employee beneficiaries of each client firm’s plans/Total number of
employee beneficiaries of all plan clients of that actuary in that period
A key issue here is what level at which to define the client portfolio in the
denominator. While audit literature has considered both firm and practice-office levels,
the practice-office is believed to be more relevant, as it is the decision-making unit that
contracts with clients and makes recommendations (Reynolds and Francis, 2001). With
the data available in this setting, I measure client importance at three levels: the actuarial
firm level (‘national’ - EIMPNAT), the practice-office level (‘office’ - EIMPOFF), and level
of the Enrolled Actuary signing the Form 5500 (‘individual’ - EIMPIND).
4.2.2. Fee-based measure of client importance
Actuarial fee data suffer from many limitations. First, data on professional fees
paid by the plan appear on the Form 5500’s Schedule H, which is required only for ‘large
plans’ (with more than 100 participants), which are only about 25% of the universe of
filings. Second, fee data are missing even for about 45% of large plan filings, as fees are
only disclosed when paid directly by the plan (as opposed to by the plan sponsor).
16
Examples of such client importance measures are found in Stice (1991), DeFond (1992), Lys and Watts
(1994), Krishnan and Krishnan (1996), Reynolds and Francis (2001), and Gaver and Paterson (2007).

21
Finally, Schedule H requires only aggregated information on total professional fees paid;
not only to the actuary but also to benefit plan auditors, valuation experts, and lawyers.17
Notwithstanding these limitations, I construct a fee-based measure of client
importance to supplement EIMP. I first assume that professional fees largely reflect
actuarial fees, as disaggregated fee data (available for 1992-1998, due to different
erstwhile disclosure requirements) show that actuarial (accounting) fees comprise 85%
(8%) of total fees for the median firm, with legal and valuation fees only negligible. The
larger issue is that fees are unavailable for much of the universe of plan filings, making
measurement of the denominator (total fees from the actuary’s client portfolio) very
incomplete. As a solution, I first construct a plan-level model to explain fees, for all
filings with available data, and then use coefficients from this model to predict fees for
filings without fee data. I then measure total fees for the actuary’s client portfolio with
disclosed fees when available, and predicted fees otherwise. In this manner, I construct
fee-based measures of client importance (FEEIMPNAT, FEEIMPOFF, FEEIMPIND) for all
plan sponsors for which the numerator (fees paid by that plan sponsor) is disclosed.
Appendix B presents the model for plan professional fees. I look to audit fee
models (e.g., Whisenant et al., 2003) to motivate determinants. Actuarial effort, and fees,
should increase with plan size (measured in beneficiaries, liabilities, and assets), and with
plan complexity, which is a many-faceted concept. I capture many aspects of it: duration
(plans with active beneficiaries have uncertainties in actuarial estimates of retirement,
form of benefit, etc., which have largely been resolved in plans with mostly retired
beneficiaries); financial status (weaker plans require the effort to calculate required
17
Disaggregated fees are disclosed on the Form 5500 Schedule C, but Schedule C data also suffer from
incomplete samples. Fees also have to be disaggregated only when they exceed $5,000 each.

22
contributions, how to amortize deficits, etc.); and other aspects, such as actuarial methods
used. I include fixed-effects for year, year-end, sponsor’s industry, location, and actuary.
The adjusted R2 is 55.3%, lower than those in audit fee models (which are in the 70-80%
range) but still reasonable. Most of the R2 comes from plan size, similar to audit fee
models; this also helps to justify the size-based measure to some extent.
On the one hand, fees may more closely reflect quasi-rents, but fee data are low
quality; on the other hand, size, while only a surrogate for quasi-rents, is broadly
available and measured consistently. I use both EIMP and FEEIMP measures in baseline
tests, recognizing the limitations of each, to triangulate the evidence. Due to the many
issues with fee data, however, I view EIMP as the primary measure of client influence.
4.3. Specification
I use the following specification to test the hypotheses.
Discount rate = f(Client importance, actuary size, fundamental determinants of the
discount rate, plan characteristics, firm characteristics, auditor characteristics) +
DR = 0 + 1*IMP + 2*EMKT1-5% + 3*EMKT5-10% + 4*EMKT10% + 1*CPLI +
2*%ACTUNVEST + 3*%ACTVEST + 4*%RETIRED + 5*NORMCOST +
6*DISBURSE + 7*%FROZEN + 8*%CASHBAL + 9*SC/SCIC + 10*HORIZON +
1*LnFVPA + 2*LnEMPS + 3*%FUNDINGEXP + 4*%UNION + 5*COMPLEXITY +
1*LnFIRMSIZE + 2*LEV + 3*MTR + 4*ROA + 5*CFO + 6*SIGMACFO +
1*%F5500BIG4 + 2*%LIMSCOPE + 3*10KBIG4 + 4*AUDFEEIMP +
5*AUDOFFICEN + Year dummies + Fiscal year-end dummies + (Equation 1)
All variables are measured as of the end of fiscal year or plan measurement year.
Appendix C defines each variable in detail. The dependent variable DR is the discount
rate used to estimate the PBO on the plan sponsor’s financial statements. I include three
indicators to test H1 on the difference between large and small actuarial firms: EMKT1-
5% (EMKT5-10%, EMKT10%), to represent actuarial firms with 1-5% (5-10%, >10%)

23
size-weighted market share of the Form 5500 universe. H1 predicts that 2 (3, 4) < 0.
IMP stands for the client importance measures, and H2 predicts that 1 > 0.
The model includes four groups of control variables. First, observed variation in
discount rates could be driven either by real economic differences across plans and time
periods, or by the discretionary choice of assumptions. Therefore, it is essential to control
for non-discretionary, or fundamental variation in the discount rate, which is a function of
the prevailing yield on high-quality bonds as well as the duration of the liability. To
capture prevailing high-quality bond yields, I include the Citigroup Pension Liability
Index for the fiscal year-end month (CPLI). This is derived from the Citigroup Pension
Discount Curve, a SFAS 87-compliant yield curve commonly used by plan sponsors.
As pension duration is not required disclosure either in 10-Ks or in Form 5500s, I
use available disclosures to construct a series of proxies. Following Naughton (2011), I
break the pension liability down into active unvested (%ACTUNVEST), active vested
(%ACTVEST), terminated, and retired (%RETIRED) components. Active unvested
liabilities have the highest duration (as these employees were hired relatively recently),
followed by active vested liabilities. Retired beneficiaries (already receiving benefits)
have the lowest duration. Per Naughton (2011), I incorporate the ‘normal cost’, or
benefits accrued during the year — which will be higher for plans with beneficiaries still
actively accruing benefits (NORMCOST); and benefits expected to be disbursed in the
year — which separates plans that expect to pay down benefits quickly, e.g., due to lump
sum withdrawals (DISBURSE). I also include the proportion of employees in hard-frozen
plans (%FROZEN), as these plans have stopped accruing benefits and so have declining
durations (Fried et al., 2010), and in cash-balance plans (%CASHBAL), for which lump-

24
sum withdrawals are more common. Finally, I include two common proxies for duration
constructed from 10-K disclosures: the ratio of service cost to interest cost (SC/SCIC),
which should be higher for longer-duration plans, and the weighted-average remaining
service life of beneficiaries (HORIZON), inferred from the relation between the projected
benefit obligation and the accumulated benefit obligation (Amir and Benartzi, 1999).
Second, I control for plan characteristics associated with incentives or ability to
manipulate discount rates: plan size, with the natural logarithm of fair value of plan assets
(LnFVPA) and total beneficiaries (LnEMPS), and funding status (%FUNDINGEXP), as
larger plans and underfunded plans have stronger incentives to choose obligation-
reducing assumptions. As the funding status itself is a function of the assumptions
chosen, I estimate a hypothetical, ‘non-discretionary’ PBO and funding status assuming
an industry-median discount rate and salary growth rate, and standard post-retirement life
expectancy of 15 years, following Hann, Lu and Subramanyam (2007). I also control for
collective bargaining (%UNION), as union presence could make it harder to reduce
benefits, making managers resort to managing assumptions to lower the reported PBO. I
also incorporate an index capturing the complexity of the actuarial valuation in the
current year, in terms of methods used and changes thereof (COMPLEXITY).
Third, I control for the plan sponsor’s financial health: the natural logarithm of
assets (LnFIRMSIZE), leverage (LEV), marginal tax rate (MTR), profitability (ROA), and
level (CFO) and volatility (SIGMACFO) of operating cash flows. Fourth, as auditors can
constrain attempts at manipulation, I control for quality of the 10-K auditor with a Big 4
indicator (10KBIG4) and practice-office size (AUDOFFICEN) (Francis and Yu, 2009).
One concern is that EIMP or FEEIMP, being correlated with client size, is picking up

25
client importance to the auditor, who may be more inclined to allow obligation-reducing
assumptions for larger clients. I hence control for the client’s fee importance to its audit
office (AUDFEEIMP). I also control for quality of the Form 5500 audit with indicators
for Big 4 (%F5500BIG4) and limited-scope audits (%LIMSCOPE), which are common in
this setting. The model includes fixed-effects for year, fiscal year-end, and for actuarial
firm, to allow for systematic differences in practices across actuarial firms, so as to more
cleanly isolate the effects of actuarial firm-size tier and client importance.
4.4. Descriptive statistics
Table 1, Panel A, describes the discount rate DR. It drops steadily from a mean
(median) of 7.53% (7.50%) in 2000 to 5.85% (5.75%) in 2004, and then rises, with
annual standard deviation ranging from 23-33 bps. Panel B describes controls. The CPLI
broadly tracks movement in, but is consistently lower than DR. The median plan has 4%
(39%) active unvested (vested), and 41% retired liabilities, with median normal cost
(disbursement) 3.8% (5.3%) of the liability. On average, 3% (19.1%) of plan assets are in
hard-frozen (cash-balance) plans. The service life remaining is 3.6 (2.7) years.
The mean (median) plan has about $1.5bn ($218m) in assets and 18,700 (4,500)
employees. Non-discretionary funding status is 87.4% (84.2%). On average, 25% of plan
assets are in collectively bargained plans. The median plan sponsor has about $2bn in
assets, debt of 28.2% of assets, and earnings (CFO) of 4.5% (8.9%) of assets (before
pension expense or contributions).18
61% (63%) of plan assets, on average, have big 4
benefit plan auditors (a limited-scope benefit plan audit). Almost 96% of firms have a
18
Sample firms are larger, more profitable, and have stronger cash flows than plan sponsors excluded from
the sample. Their plans tend to be larger, with more retirees, cash-balance features, and unionization.

26
Big 4 auditor for the 10-K. The mean (median) sponsor accounts for 14.7% (5.6%) of
audit practice-office fees, and the number of clients of the practice-office is 56 (26).
Table 2, Panel A, describes the actuarial services market. The ‘large’ actuarial
firms, defined as those with over 10% size-weighted market share, hold about 60% of the
market. 19
Medium-size actuarial firms with 1-10% market share hold another 22%, with
the rest going to 170 small firms. Panel B describes size-based client importance,
separated by the largest actuarial firms and the rest. The average client is 8.1% of the
national portfolio of a small actuary but only 0.4% that of a large actuary. This difference
narrows at the practice-office level, 15.6% (for a small actuary) versus 9.1% (for a large
actuary), but interestingly, reverses at the individual level, with the average client being
39.6% of an individual portfolio at a small actuary, but 44% at a large actuary. So even
though large actuaries’ practice-offices have more clients, their ratio of personnel to
clients is also higher. Fee-based client importance (Panel C) exhibits similar patterns.20
4.5. Correlations
Table 3 displays selected Spearman correlations. DR is strongly negatively
correlated with EMKT10%, and positively correlated with EIMPNAT and EIMPOFF, but
insignificantly correlated with FEEIMP measures. EIMP and FEEIMP measures at each
level are positively correlated with each other (correlations range from 0.64-0.73). DR is
strongly correlated with most economic determinants (except SC/SCIC) in the expected
direction. Smaller, more leveraged, less profitable firms with poor and volatile cash flows
19
The large (medium-size) firms are Towers Perrin, Mercer, Watson Wyatt, Hewitt, and Segal (Buck,
Mellon, Aon, Milliman, PwC, PRIAC, JP Morgan Benefit Strategies, and Chicago Consulting Actuaries). 20 A caveat is that these measures only capture the importance of each sponsor relative to the actuary’s
portfolio of ERISA-qualified defined-benefit plans for which it does actuarial valuation work. Actuaries
have other sources of revenue (for e.g., non-actuarial services) for which data are not available and so are
excluded from the denominator.

27
use higher discount rates, while firms with high marginal tax rates use lower discount
rates, consistent with Bodie et al. (1987) and Asthana (1999). Larger actuarial firms
attract larger plan sponsor clients. Economically important clients have older
beneficiaries, lower accruals, and more upcoming disbursements (i.e., lower duration).
5. EMPIRICAL RESULTS
5.1. Does actuary firm size and client importance associate with discount rates?
Table 4, Panel A, presents Equation (1), incorporating EIMPNAT, EIMPOFF, and
EIMPIND in turn, and then simultaneously. As expected, CPLI, %ACTUNVEST,
NORMCOST (DISBURSE, %FROZEN, %CASHBAL) are positively (negatively)
associated with discount rates. Larger plans in smaller firms use higher discount rates,
possibly due to stronger incentives to understate the PBO when it is an economically
significant liability. Less profitable firms with poorly funded plans also use aggressive
discount rates. SC/SCIC is inexplicably negative and significant in all specifications.
All specifications incorporate actuarial firm fixed-effects. The actuarial firm
fixed-effects are jointly significant at <1% level, indicating that there are systematic
differences across actuarial firms in the methodologies and practices used to determine
discount rates. Across all models, EMKT1-5%, EMKT5-10%, and EMKT10% are
negative, and EMKT10% is always significant at the 10% level or less. The coefficients
indicate that clients of the largest actuarial firms, on average, use discount rates about 7-
10 bps lower than clients of the smallest firms. Of client importance measures, EIMPNAT
is insignificant, but EIMPOFF and EIMPIND are both significant at 5% level or less,
individually. The relative insignificance of national-level client importance suggests that
the office and the individual are the more relevant decision-making units in this setting.

28
EIMPOFF and EIMPIND continue to be significant in the final model with all three levels
of EIMP included. These results are, therefore, broadly consistent with H1 and H2.
Many controls that are new to the literature show interesting coefficients. Firms
with union presence have more conservative rates, consistent with unions monitoring
pension reporting. When actuarial valuations are more complex, discount rates again tend
to be lower. I conjecture that actuaries (defensively) set assumptions conservatively when
there is more complexity. Further, sponsors that are important clients of their auditors use
more conservative discount rates. The effect of audit client importance, while opposite to
that of actuary client importance, is consistent with the Reynolds and Francis (2001) and
Gaver and Paterson (2007) findings that auditors require more conservative reporting of
important clients, because they face potentially heightened litigation risk for such clients.
Larger audit offices also enforce more conservative assumptions.
Panel B replicates the tests with fee-based measures, for the smaller sample for
which plan sponsor fees (for the numerator of client importance) are disclosed.
FEEIMPNAT is insignificant, while FEEIMPOFF and FEEIMPIND are significant,
individually and in conjunction. The coefficient on EMKT10%, while negative, is
however insignificant. In untabulated tests, it becomes significant when EMKT1-5% and
EMKT5-10% are removed, i.e., when comparing the largest actuarial firms to all other
firms. Coefficients on control variables are broadly consistent with Panel A. As results
with FEEIMP measures mostly confirm results with EIMP measures, I focus on EIMP
measures in further tests.
5.2. The effect of client importance: partitioning by client incentives and
opportunities

29
H3 posits that the effect of client importance is stronger in, or driven by,
financially weak plan sponsors that have inherently strong incentives to inflate discount
rates. Table 5 presents results of estimating each specification from Table 4, separately
within subsamples by ‘total’ leverage (TLEV), which combines plan sponsor leverage
with any underfunding in pension and healthcare plans. The low (high) TLEV subsample
has a mean TLEV of 20% (43%). In the low-TLEV subsample, all three levels of client
importance are insignificant, individually and simultaneously. In the high-TLEV
subsample, on the other hand, EIMPOFF and EIMPIND are strongly significant,
individually and incrementally to each other. Financially weak plan sponsors hence drive
the effect of client importance, consistent with H3.21
An interquartile shift in EIMPOFF
and EIMPIND together translates into about 5 bps shift in DR. While this is only a modest
effect in absolute terms, it is about 15% of the annual standard deviation in DR. Further,
for comparison, an interquartile shift in %FUNDINGEXP, a key determinant from prior
work, translates into a 2.6 bps shift in DR.22
H4 and H5 posit that the effect of client importance manifests more in, or is
driven by firms for which other aspects of the monitoring environment are weak,
allowing more opportunities for manipulation. Audit oversight is one such aspect of
21 Throughout the study, I present results of estimating Eq. (1) separately within subsamples, rather than
presenting an interacted model of the form DR = 0 + 1*EIMP + 2*SUBSAMPLE +
3*SUBSAMPLE*EIMP. The objective here is to establish whether client importance matters, and if so,
when and in what groups of firms. Hence, in the above model, the coefficient of interest is not 3 (which
captures how, e.g., TLEV affects the association between EIMP and DR), but 1 and 1 + 3, which capture
the effect of EIMP in each subgroup. I conclude that a partially interacted model (i.e., interacting only
EIMP while restraining coefficients on controls to be the same across groups) is not appropriate, as
coefficients on many controls differ significantly across groups. Running a fully interacted model (i.e.,
interacting the full Eq. 1 with subsample indicators) and testing 1=0 and 1 + 3=0, gives virtually
identical results to those documented. 22
Interquartile shifts in DISBURSE, AUDFEEIMP, and AUDOFFICEN (all significant regressors) imply 2
bps, 1 bps, and 1.5 bps shift in DR. There is also some indication that client importance effects are non-
linear: in alternative specification that replaces EIMPOFF with indicators for levels of EIMPOFF (<1%, 1-5%,
5-25%, >25%), the largest clients’ discount rates are 12 bps higher than the smallest clients’.

30
monitoring that could constrain manipulation, even (or especially) for important clients.
To identify variation in auditor oversight of the actuary’s work, I exploit an institutional
feature specific to this setting. In addition to the financial statements audit (by SEC
requirement), defined-benefit plans are also subject to an independent, plan-level
regulatory audit (by ERISA requirement), which requires an audit report filed with the
Form 5500. ERISA, however, allows plans to obtain only a limited-scope audit, under
certain circumstances.23
In such audits, the auditors usually disclaim an opinion on plan
statements. It is unclear what audit procedures have been performed in such audits, and
so the level of assurance provided is low (DOL, 2012). I partition the sample by whether
plans have been subject to a full-scope or limited-scope audit (%LIMSCOPE).
As the effects of client importance are concentrated in high-TLEV firms, I
partition the high-TLEV sample by %LIMSCOPE (Table 6). EIMPOFF is positively
significant only in firms with limited-scope audits; in fact, when all three measures are
included together, EIMPOFF becomes negative and marginally significant in the
subsample with full-scope audits. The effect of EIMPIND, however, manifests in both full-
scope and limited-scope subsamples. Overall, Table 6 only shows only weak and mixed
evidence in support of H4. The size of the actuarial firm could also affect opportunities to
manipulate (H5). Table 7 presents results of partitioning the high-TLEV sample by
EMKT10%. Interestingly, EIMPOFF and EIMPIND are positive and significant in both
large and small actuarial firms. Separating actuarial firms into small, medium (1-10%
market share), and large (more than 10% share) also does not change inferences. Overall,
there is no evidence to support H5.
23
Plans may request auditors not to perform procedures to test assets (for existence, valuation, etc.), as long
as this information is prepared and certified by a trustee or custodian who is a bank/insurance carrier/
institution that is regulated and supervised by a government agency (ERISA 103(a)(3)(C)).

31
One interesting pattern from the subsample tests is that the negative coefficients
on large actuary indicators from the baseline tests, appear confined to subsamples of
financially strong, well-funded clients whose incentives to inflate DR are expected to be
weak (Table 5), and to clients with strong auditor oversight (Table 6). Table 5, for
example, shows the largest actuaries are associated with discount rates about 20 basis
points lower than the smallest (a very economically significant difference), but only
amongst clients that are not strongly motivated to inflate discount rates. Within strongly
motivated clients, these differences are insignificant.
6. DISCUSSION OF RESULTS AND ADDITIONAL ANALYSIS
The results so far suggest that proxies for actuaries’ incentives associate with
observable differences in clients’ discount rates. While broadly consistent with important
clients using influence to tilt actuarial recommendations in the desired direction, these
findings call for careful interpretation, and in turn raise many more questions.
6.1. Interpreting coefficients on size-based client importance measures
The association tests presented here are subject to the concern of correlated
omitted variables. Client importance is essentially a measure of relative size (the size-
based measure in particular, but to some extent even the fee-based measure, as fees
correlate strongly with size); so larger plans tend to be more important plans, on average.
One key point here is that plan size has no intrinsic relation to the discount rate,
which is only a function of the yield curve on high-quality bonds, and the plan duration.
In other words, in the absence of manipulation, if discount rates were set purely based on
economic fundamentals, there is no conceptual reason to expect larger plans to have
higher discount rates. This is in contrast to other assumptions such as the ERR: larger

32
plans not only have economies of scale in investment administration and management,
but also have access to a broader set of investment opportunities, both of which predict
higher ERRs for larger plans, even in the absence of manipulation. Moreover,
empirically, larger plans tend to also be older plans, with shorter durations (Table 3).
Assuming an upward-sloping yield curve (as is the case in the sample period), shorter-
duration plans have lower discount rates, predicting a negative association between plan
size and DR. Thus, to the extent to which duration has not been fully controlled for, it
biases against finding a positive relation of client importance to the discount rate. 24
6.1.1. Looking within client firms to mitigate correlated omitted variable concerns
A major concern with the use of size-based client importance measures, is that
larger plans simply have stronger incentives to inflate discount rates – as any ‘x’ basis
points rise in DR translates into a larger absolute reduction in obligations for larger plans.
Therefore, the positive coefficient on EIMP could simply be capturing the
correspondingly stronger incentives of large plans to inflate discount rates. This concern
is mitigated by the similar results with FEEIMP, but FEEIMP measures come with many
caveats, and even fees are ultimately strongly correlated with plan size.
While larger plans have stronger incentives to inflate DR, it is not immediately
obvious that they have the ability to do so. Holding actuarial client importance constant,
larger plans – and larger firms – face more scrutiny from analysts, investors, unions,
regulators, and auditors, which could constrain their ability to manipulate assumptions.
But while the ultimate direction of this effect is unclear, the broader issue of correlated
24
However, larger actuaries attract larger clients (Table 3), with lower duration, and so lower discount
rates. This works in the same direction as H1, and is difficult to disentangle, in the absence of perfect
controls for duration. The specifications here use a set of duration controls that are much more
comprehensive than extant literature, and control for it to the extent possible with publicly available data.

33
omitted factors at the plan sponsor-level remains (e.g., corporate culture, governance,
monitoring technology, manipulability of other accounts).
To mitigate effects of firm-specific unobservables, I rerun the tests with fixed-
effects at the client firm level (Table 8). As shown, EIMPOFF is insignificant in the whole
sample, but is significant at <5% level in the high-TLEV subsample (and insignificant in
the low-TLEV subsample). As these specifications use only within-client, over-time
variation in EIMP, and as plan size itself is sticky over time, over-time variation in EIMP
comes mainly from switching actuaries, and from other changes to the actuary’s client
portfolio. This is confirmed by restricting the high-TLEV sample to clients that have
switched actuaries at least once in the period (Column 4): EIMPOFF is highly significant
in this group, but insignificant in firms that do not switch (untabulated). In contrast to the
Table 4 results, EIMPIND is insignificant, possibly due to the much lower testing power in
these specifications. EMKT10% is also insignificant, possibly due to the fact that clients
do not appear to switch actuary size categories often.25
Overall, the robust effect of
EIMPOFF, even in the stricter within-client specifications, adds confidence that EIMPOFF
coefficients are not an artifact of firm-specific, time-invariant, unobservable factors.26
6.1.2. Looking within partitions by plan size
25
Out of the 511 actuary switches (in high- and low-TLEV samples together), only 21% are switches from
EMKT10%=1 to EMKT10%=0 (or reverse), with a majority of the switches within actuaries of similar size. 26
Client importance could also capture complexity. Complex plans could have greater uncertainty, leading
to a wider recommended range, and more leeway for managers to use a higher rate from within the range.
First, while uncertainty can widen the range, there is no reason to expect a widening of the range to always
correspond to its upper bound moving to the right, in the absence of client pressure for an aggressive
assumption; e.g., a recommendation of 7-7.5% might just as well widen to 6.75–7.75%, or even to 6.5-
7.5%, as to 7-8%. Second, it is not clear that larger clients always bring more uncertainty. Note that much
uncertainty with inputs has been resolved in plans with older beneficiaries, and, so larger plans, which are
typically also older plans, might actually be less complex. Third, effects of complexity are mitigated by
extensive controls for its various aspects (to the extent to which they are time-varying), and by the within-
client firm specifications (to the extent to which they remain constant over time).

34
EIMP (or FEEIMP), while correlated with absolute plan size, really measures
relative size (especially as the model controls for absolute plan size). It is, hence, driven
not only by the size of each plan sponsor, but also by its choice of actuary, how many
other clients that actuarial practice-office has, and how big those clients are. To further
verify this interpretation of EIMP, I separate the high-TLEV sample into subgroups by
plan size, and examine the effect of EIMP separately within each subgroup. The idea is to
hold absolute plan size constant, and so isolate more cleanly the variation in, and effect of
relative size. If EIMP effects in the baseline tests are driven by absolute plan size, then
EIMP will not necessarily load strongly within any of the subgroups.
I partition the sample into quartiles, to strike a balance between homogenous size
and a reasonable number of observations in each subgroup (Table 9). The results are very
interesting. EIMPOFF is significant even within these quartiles, but not uniformly so: it is
insignificant in the two higher quartiles, but significant in the two lower quartiles with
smaller plans. These results raise two key points. First, the fact that EIMP loads even
within subgroups suggests that its effect is not entirely an artifact of absolute plan size,
and that relative size is an important driver of the EIMP effect. Second, however, the fact
that EIMPOFF is not uniformly significant in all subgroups suggests that absolute size
matters too, as a conditioning variable. For plans that are large in absolute terms, relative
size (EIMP) does not matter – they do not have more aggressive assumptions even when
they are important clients of their actuaries, perhaps because they face more constraints to
manipulation (greater external scrutiny, stronger governance mechanisms, etc.).
While these results pinpoint the source of the effects more clearly, they are also
relevant to correlated omitted variables concerns relating to plan size. Putting the two

35
observations together, the plans that successfully exert pressure are not necessarily the
largest in absolute terms. In fact, they are amongst the smaller plans in the sample, but
happen to be important to their actuary. Small plans that are also high-EIMPOFF must
have chosen a small actuarial practice-office. This suggests that the phenomenon
documented here is driven by smaller plans (which are subject to less scrutiny) combined
with smaller practice-offices (which, perhaps, have fewer checks and balances).
6.2. Who drives the observed discount rate: the actuary or the manager?
Thinking about actuarial recommendations as a range raises a key question: what
if the range recommended by the actuary is appropriate, but managers exercise their own
discretion to pick a higher point within the range? If so, actuaries are not directly
involved with aggressive choices. Here, it is the financial reporting environment – where
representations must be audited (by auditors, who in turn have strong incentives to be
objective and exercise due care), that effectively constrains managers from choosing their
own estimate minus involvement from the actuary. From descriptions of current audit
practice and conversations with auditors and actuaries, it is highly unlikely that auditors
will accept an assertion from management about any assumption, in the absence of sign-
off from the designated specialist — in this case, the actuary. Further, once a certain
practice (such as using the mid-point of the recommended range) has been established,
attempts to change will be met with auditor scrutiny. In such an environment, managers
motivated to manipulate assumptions would need the implicit consent of the actuaries,
who must ultimately certify to auditors that the assumptions are reasonable.
Even so, this study does not take the actuary’s involvement for granted – to the
contrary, the tests here can be viewed as an empirical examination of this very question:

36
are managers acting on their own in choosing aggressive discount rates, or do actuaries
also have to be complicit, or involved, in any such effort? If aggressive discount rate
choices are driven purely by managerial discretion in choosing point estimates within the
recommended range, then we would not necessarily expect a positive association between
the importance of the plan sponsor to the actuary, and the discount rate chosen, as
potentially any manager, regardless of whether or not he is an important client of his
actuary, can choose a higher rate, subject only to other constraints such as scrutiny from
directors, auditors and analysts. But if any effort to choose aggressive rates requires
actuaries to act in concert with managers, then actuaries are more likely to acquiesce to
more influential clients, which in turn predicts the positive association between client
importance and discount rates. Therefore, managers being constrained from acting on
their own – and actuaries being involved – in attempts to raise assumptions, is a
necessary condition for observing that client importance matters.
6.3. Who drives the observed discount rate: the actuary or the auditor?
The results make it evident that both actuaries and auditors play key roles in
pension reporting. Their roles are different but related: client importance from the
perspective of both actuary and auditor is incrementally associated with discount rates;
and the effect of actuarial client importance is, to some degree, conditional on auditor
oversight. This study’s focus on the actuary should not be interpreted to mean that the
actuary’s role is more important than the auditor’s. If data on (pre-audited) internal
recommendations made by actuaries were available (which they are not), they could then
be contrasted with the final assumptions used, which might differ from pre-audited

37
numbers due to the auditors’ adjustments. While this would help disentangle the auditor’s
effect on the process from the actuary’s, lack of data makes such a test infeasible.
6.4. Expanding the scope to other actuarial assumptions
Demographic assumptions also have considerable impact on the PBO, and in
many ways provide an ideal setting to examine the actuary’s role. These assumptions are,
however, not disclosed in a tractable form on the Form 5500.27
One economic assumption
that also affects the PBO is the salary growth rate. In an effort to capture discretion in
both DR and the salary growth rate together, I estimate the ‘discretionary’ funding status
(%FUNDINGDISC) with reported minus non-discretionary funding status (%FUNDING -
%FUNDINGEXP), and replace DR with %FUNDINGDISC. EIMPOFF and EIMPIND remain
strongly positively associated with %FUNDINGDISC.
7. CONCLUSIONS
I examine whether incentives of the pension actuary affect the discount rate
assumption used to estimate pension obligations on plan sponsor financial statements.
With a sample from 2000-2008, I find first that clients of larger actuarial firms (that are
presumably subject to stronger litigation- and reputation-based incentives to remain
independent) use more conservative (obligation-increasing) discount rates, and second
that economically important clients use more aggressive rates, compared to less important
clients of the same actuary. The effect of client importance is driven by financially weak
plans that have strong underlying incentives to decrease the reported pension obligation,
27
For example, plans have to identify the mortality table used from a list of options on the Form 5500, but
about 30% of plans pick the “Other” category without specifying the table they actually use; many other
plans use modified versions of the tables listed. Another interesting demographic assumption disclosed is
the weighted-average retirement age. A lower (i.e., early) retirement age implies more years of benefits
paid, but also implies reduced benefit levels, making the overall effect on the obligation difficult to predict.

38
but further analysis also suggests that the effects are driven by smaller plans in
combination with smaller actuarial practice-offices.
Overall, these findings are consistent with actuaries playing a key role in pension
reporting. Yet, this study takes only the first step in examining that role, and suffers from
many limitations. First, the assumptions originally recommended by the actuary are not
available; only the assumptions finally used are. Second, actuaries set many economic
and demographic assumptions together, not simply the discount rate. Third, the
fundamentals drivers of the discount rate are incompletely specified, as pension duration
is not available. Fourth, client importance is measured with noise, and in particular does
not consider non-actuarial services, for which data are mostly unavailable. Finally, cross-
sectional associations cannot establish that client importance exerts a causal effect on
assumptions. If the relevant data should eventually become available, addressing these
issues would expand upon, and test the robustness of, the results presented here.
REFERENCES
Actuarial Standards Board. 1996. Actuarial Standard of Practice No 27: Selection of
economic assumptions for measuring pension obligations. Washington, D.C.
Actuarial Standards Board. 2010. Actuarial Standard of Practice No 35: Selection of
demographic and other non-economic assumptions for measuring pension obligations.
Washington, D.C.
American Academy of Actuaries Task Force. 2006. A Critical Review of the U.S.
Actuarial Profession: Final report for the U.S. actuarial profession and other interested
parties. Http://www.crusap.net/pdf/final/final.pdf.
American Academy of Actuaries. 2009. Code of Professional Conduct. Yearbook and
Leadership Manual: Retrieved from www.actuary.org
Amir, E., Benartzi, S. 1999. Accounting recognition and the determinants of pension
asset allocation. Journal of Accounting, Auditing, and Finance 14(3).
Amir, E., Gordon, E. 1996. Firms’ choice of estimation parameters: empirical evidence
from SFAS 106. Journal of Accounting, Auditing and Finance.

39
Antle, R., Gordon, E., Narayanamoorthy, G., Zhou, L. 2006. The joint determination of
audit fees, non-audit fees and abnormal accruals. Review of Quantitative Finance &
Accounting 27:235-263.
Asthana, S. 1999. Determinants of funding strategies and actuarial choices for defined-
benefit pension plans. Contemporary Accounting Research 16(1): 39-74.
Asthana, S. 2007. Earnings management, expected returns on pension assets, and
resource allocation decisions. Pension Economics and Finance: 1-33.
Becker, C.L., DeFond, M.L., Jiambalvo, J., Subramanyam, K.R. 1998. The effect of audit
quality on earnings management. Contemporary Accounting Research 15(1): 1-24.
Bellis, C.S. 2000. Professions in society. British Actuarial Journal 6: 317-364.
Bergstresser, D., Desai, M.A., Rauh, J.D. 2006. Earnings manipulation, pension
assumptions and managerial investment decisions. Quarterly Journal of Economics 121.
Blankley, A., Swanson, E. 1995. A longitudinal study of FAS 87 pension assumptions.
Accounting Horizons 9(4): 1-21.
Bodie, Z., Light, J.O., Morck, R., Taggart, R.A. 1987. Funding and asset allocation in
corporate pension plans: an empirical investigation. In Issues in Pension Economics, eds
Z. Bodie, et. al., 15-47. Chicago: University of Chicago Press.
Brown, S. 2013. Market values and credit risk: Reassessing the interpretation of
flexibility in pension assumptions. Working paper.
Buffett, W. 2007. Letter to shareholders. Berkshire Hathaway, Inc. Available at:
http://www.berkshirehathaway.com/letters/letters.html
Cadman, B., Carter, M.E., Hillegeist, S. 2010. The incentives of compensation
consultants and CEO pay. Journal of Accounting and Economics 49: 263-280.
Carmichael, S. 1997. Business Ethics: The new bottom line. A discussion paper. British
Actuarial Journal 3(5): 1059-1075.
Chung, H., Kallapur, S. 2003. Client importance, non-audit services and abnormal
accruals. The Accounting Review 78(4): 931-956.
Collins, D., Dewing, I., Russell, P. 2009. The actuary as fallen hero: On the reform of a
profession. Work, Employment, and Society: 23: 249-266.
Comprix, J., Muller, K.A. 2011. Pension plan accounting estimates and the freezing of
defined-benefit pension plans. Journal of Accounting and Economics 51 (1-2): 115-133.
Coronado, J.L., Sharpe, S.A. 2003. Did pension plan accounting contribute to a stock
market bubble? Brooking Papers on Economic Activity.
Dailey, J.P., Selznick, L.F. 2002. Navigating the litigation minefield: a guide to actuarial
practice claims. Dailey & Selznick: New York, NY.

40
DeAngelo, L.E. 1981. Auditor size and audit quality. Journal of Accounting and
Economics 3(3): 183-199.
DeFond, M.L. 1992. The association between changes in client firm agency costs and
auditor switching. Auditing: A Journal of Practice and Theory 11(1): 16-31.
DeFond, M.L., Francis, J.R. 2005. Audit research after Sarbanes-Oxley. Auditing: A
Journal of Practice and Theory 24: 5-30.
DeFond, M.L., Raghunandan, K., Subramanyam, K.R. 2002. Do non-audit fees impair
auditor independence? Evidence from going-concern audit opinions. Journal of
Accounting Research 40(4): 1247-1274.
Department of Labor. September 28th
, 2012. Changes are still needed in the ERISA audit
process to increase protections for employee benefit plan participants. Report #09-12-
002-12-121, Employee Benefits Security Administration: Washington, D.C.
Feldblum, S. 1993. Professional ethics and the actuary. Casualty Actuary Society
Discussion Paper Program, Casualty Actuary Society Meeting: Dallas, TX.
Feldstein, M., Morck, R. 1983. Pension funding decisions, interest rate assumptions, and
share prices. In Financial Aspects of the U.S. Pension System, eds Z. Bodie and J.B.
Shoven 177-207. Chicago: University of Chicago Press.
Financial Accounting Standards Board (FASB). 1985. Statement of Financial Accounting
Standards No 87: Employers’ accounting for pensions. Stanford, CT: Financial
Accounting Standards Board.
Financial Times. Dec 20, 2004. Age-old conflicts: reforms are required for insular
actuaries.
Francis, J., Yu, M.D. 2009. Big 4 office size and audit quality. The Accounting Review
84(5): 1521-1552.
Fried, A.N., Davis, H.Z., Davis-Friday, P.Y. 2010. Accounting choice, economic
environment and employee demographics. Working paper.
Gaver, J. J., Paterson, J.S. 2001. The association between external monitoring and
earnings management in the property-casualty industry. Journal of Accounting Research
39 (2): 269-282.
Gaver, J. J., Paterson, J.S. 2007. The influence of large clients on office-level auditor
oversight: Evidence from the property-casualty insurance industry. Journal of Accounting
and Economics 43: 299-320.
Gunz, S., McCutcheon, J., Reynolds, F. 2009. Independence, conflict of interest and the
actuarial profession. Journal of Business Ethics 89:77-89.

41
Gunz, S., and Van der Laan, S.. 2011. Actuaries, conflicts of interest and professional
independence: The case of James Hardie Industries Limited. Journal of Business Ethics
98: 583-596.
Hager, W. D., Chretien, P-N. 1982. The emerging law of actuarial malpractice. Drake
Law Review 31: 831-854.
Hann, R. N., Lu, Y.Y., Subramanyam, K.R. 2007. Uniformity versus flexibility: evidence
from pricing of the pension obligation. The Accounting Review 82(1): 107-137.
Harrington, A. November 24, 2008. Love actuary? Its tough times ahead for the actuarial
profession. Financial Director.
Hope, O-K., Langli, J.C. 2010. Auditor independence in a private firm and low litigation
risk setting. The Accounting Review 85(2): 573-605.
Krishnan, J., Krishnan, J. 1996. The role of economic trade-offs in the audit opinion
decision: An empirical analysis. Journal of Accounting, Auditing and Finance 11(Fall):
565-586.
Lys, T., Watts, R. 1994. Lawsuits against auditors. Journal of Accounting Research 32:
65-93.
Ladbury, A. January 30, 1995. NRG Litigation may prompt similar suits. Business
Insurance, Crain Communications Inc: 17.
Michaely, R., Womack, K. L. 1999. Conflict of interest and the credibility of underwriter
analyst recommendations. The Review of Financial Studies 12(4): 653-686.
Mittelstaedt, F.H. 1989. An empirical analysis of the factors underlying the decision to
remove excess assets from overfunded pension plans. Journal of Accounting and
Economics 11(9): 399-418.
Morris, D. 2005. Morris Review of the Actuarial Profession, Final Report.
Http://www.hm-treasury.gov.uk/6240.htm
Morse, D.E. 2003. What’s a little malpractice among friends? Benefits Law Journal
16(1): 1-3.
Munnell, A.H., Aubry, J-P., Muldoon, D. 2008. The financial crisis and state/local
defined benefit plans. Center for Retirement Research Working Paper 8-19, Boston
College.
Murphy, K.J., Sandino, T. 2010. Executive pay and ‘independent’ compensation
consultants. Journal of Accounting and Economics 49: 247-262.
Naughton, J. 2011. The impact of footnote transparency on managerial discretion:
Evidence from FAS 132R pension disclosure. Working paper.
Patel, C., Daykin, C.D. 2010. Actuaries and Discount Rates: A discussion paper. Institute
of Actuaries and Faculty of Actuaries: London, Oxford and Edinburgh, U.K.

42
Picconi, M. 2006. The perils of pensions: does pension accounting lead investors and
analysts astray? The Accounting Review 81(4): 925-955.
Reynolds, J.K., Francis, J.R. 2001. Does size matter? The influence of large clients on
office-level auditor reporting decisions. Journal of Accounting and Economics 30: 375-
400.
Rezaee, Z. 1982. Auditing employee benefit plans. National Public Accountant.
Securities and Exchange Commission (SEC). December 1, 2005. Current Accounting and
Disclosure Issues in the Division of Corporation Finance. Washington, D.C.
Society of Actuaries. 1986. Pension plan accounting under the Financial Accounting
Standard 87. Record of the Society of Actuaries 12 (4A).
Stice, J.D. 1991. Using financial and market information to identify pre-engagement
factors associated with lawsuits against auditors. The Accounting Review 66 (3): 516-
533.
Vaughan, T.M., Cooper, R.W., Frank, G.L. 1993. Ethical issues, helps, and challenges:
Perceptions of U.S. Actuaries. Journal of Actuarial Practice 1(2): 5-26.
Whisenant, S., Sankaraguruswamy, S., Raghunandan, K. 2003. Evidence on the joint
determination of audit and non-audit fees. Journal of Accounting Research 41(4): 721-
744.
White, C.S., Atkinson, R.V. 1993. The ethical development of actuaries. Casualty
Actuary Society Discussion Paper Program, Casualty Actuary Society Meeting: Dallas,
TX.
Zuber, G.R. 1988. What auditors should know about FASB Statement no: 87. Journal of
Accountancy: March 1988.

43
Appendix A: Sample selection and matching 10-K filings to Form 5500s
Table A.1: Sample evolution
Sample selection criterion Observations
Firm-year observations in Compustat Pensions for 2000-2008 27,223
Observations with non-missing, non-zero pension liabilities 20,566
Observations with all data available from Compustat Fundamentals & Pensions
for dependent & control variables
7,933
Observations with auditor data available from Audit Analytics (“Potential
Sample”)
6,657
Observations with all Form 5500 data 4,864
Observations for 2005 removed (due to Form 5500 Schedule B Introduction
information uniformly set to “0” for majority of filings)
(695)
Final sample 4,169
Procedure for matching Potential Sample to Form 5500s
1. The only common identifier across Compustat and Form 5500s is the Employer Identification
Number (EIN). The EIN does not provide an exact match, though, as a firm may have multiple
EINs (Single-unit firms, defined as those with only one establishment, have only one EIN. Multi-
unit firms – firms with at least two establishments – could have a cluster of many EINs). It is
common for firms to make Form 5500 filings under different EINs, making an automated match
on EINs noisy and incomplete. As a first step, I expand on the list of Compustat-provided EINs
and make it more complete. Unfortunately, no comprehensive, public database of EINs exists, or
any lookup service for the same. However, some private data providers offer these services. I turn
over all GVKEYs from Compustat Pensions with non-zero pension liabilities to Judy Diamond
Associates, Inc, which offers an EIN Finder service with a database of over 7 million EINs. This
service identified many EINs missing from Compustat, and additional EINs for multi-unit firms.
With this information, I do the first round of automated matching on EINs.
2. I then look up each GVKEY in the Potential Sample that is still unmatched, by hand, in the Form
5500 database, by firm name. As matching on name is fuzzy, I declare a match only if the firm
name, business description, and location of business all match. The Form 5500 universe consists
of 396,500 filings, with 42,000-47,000 plan-level filings per year from 2000-2007, and a partial
set of filings (~7,000) for 2008. When the plan measurement date does not correspond to the
fiscal year-end, I match so as to minimize the difference between the plan measurement year-end
month and Compustat fiscal year-end month.
3. Firms could still remain unmatched at this stage, if for example, their plans are foreign (i.e.,
provide benefits to non-U.S. workers), or if the Form 5500 filing is made by a majority- or fully-
owned subsidiary of the firm listed on Compustat. For the unmatched firms, I search through 10-
Ks and Bloomberg Businessweek online to identify subsidiary names, and repeat Step (2). This
process yields many more matches particularly for utilities and to a lesser extent for financial
firms, which are often held in complex ownership structures. I also look up corporate websites of
the firms still unmatched to identify any name changes, and look up Form 5500 filings by old
name(s). For firms still unmatched, I try to identify the reason (for example, foreign plan).
Table A.2: Match rates of Potential Sample to Form 5500 data
Year Potential
Sample
Observations (%) matched to Form 5500
Total sample 2000-2008 6,657 4,864 (73.0%)
Sample 2000-2007* 5,937 4,774 (80.4%)
*Form 5500 filings database is incomplete for 2008.

44
Table A.3: Potential Sample that is unmatched: Possible reasons
Possible reason % sample
GVKEY-EIN match found but no Form 5500 filing for that year 36.3%
Foreign plan 20.7%
Utility: parent or subsidiary already matched 7.9%
No match found 35.1%
Appendix B: The actuarial fee model
*,
**,
*** indicate statistical significance at 10%, 5%, and 1% level. Robust standard errors are in
parentheses. The ordinary least squares regression is run at the plan-year level for 2000-2008, with all plan
filings that have non-missing, non-zero data on professional fees paid (the dependent variable) and
sufficient data for all explanatory variables. All variables are from the Form 5500 and are at the plan-level.
The dependent variable is the natural logarithm of (1+total professional fees paid) (LnFEEPLAN), where total
professional fees paid are the total fees paid by the plan to actuaries, auditors, lawyers, and
valuation/appraisal experts (Schedule H Item 2(i)(1)). Explanatory variables are as follows:
Plan size: LnASSETSPLAN is the natural logarithm of [1+current value of plan assets (Schedule B Item
1(b)(1))]. LnLIABSPLAN is the natural logarithm of [1+RPA ’94 current liability (Schedule B Item 2(b)(4),
Col (3))]. LnEMPSPLAN is the natural logarithm of [1+number of employee-beneficiaries (Introduction
Section 7(f))].
Plan duration: %ACTUNVESTPLAN (proportion of pension liabilities accrued toward active unvested
participants), %ACTVESTPLAN (proportion of pension liabilities accrued toward active vested participants),
%TERMINATEDPLAN (proportion of pension liabilities accrued toward terminated participants),
%NORMCOSTPLAN (expected increase in pension liabilities due to benefits accruing during the year), and
%DISBURSEPLAN (expected plan disbursements for the year) are all defined as in Appendix C, but at the
plan-level. TERMINATEDPLAN, FROZENPLAN, and CASHBALPLAN are indicator variables set to one for
terminated, frozen, and cash-balance plans respectively (Introduction Item 8(a)).
Plan funding status: FUNDINGPLAN is ASSETSPLAN / LIABSPLAN. FUNDING2
PLAN is the square of
FUNDINGPLAN.
Other aspects of plan complexity: The following are indicator variables set to one if the respective actuarial
cost method is used as the basis for estimating plan liabilities for that year, and to zero otherwise: Attained
Age Normal (AANPLAN), Entry Age Normal (EANPLAN), Projected Unit Credit (PUCPLAN), Aggregate
(AGGPLAN), Frozen Initial Liability (FILPLAN), Individual Level Premium (ILPPLAN), and Individual
Aggregate (IAGGPLAN) (Schedule B Items 5(a)-(g)). The following are indicator variables set to one if each
of the following scenarios is true: if any change has been made in the funding method for this plan-year
(FUNDING_METHOD_CHGPLAN) (Form 5500 Schedule B Item 5(i)), if any waiver of funding deficiency
was granted in this plan-year (FUNDING_DEF_WAIVEDPLAN) (Form 5500 Schedule B Item 8(a)), if any
alternative methods or rules were used this plan-year (ALT_RULES_USEDPLAN) (Form 500 Schedule B
Item 8(b)), if any changes were made to actuarial assumptions (interest rate, retirement age, mortality
tables, withdrawal rates, salary scales, investment return) in this plan-year (ACTRL_ASS_CHGPLAN) (Form
5500 Schedule B Item 11), and if the plan is covered by the PBGC insurance program (INSUREDPLAN)
(Introduction Item 8(a)).
Fixed effects: The model also includes fixed-effects by year, plan year-end month, plan sponsor’s industry
by 6-digit NAICS code (Introduction Item 2(d)), plan sponsor’s location by 5-digit zip code (Introduction
Item 2(a)), and fixed-effects for each actuarial firm with >5% size-weighted market-share and for each
actuarial practice-office and individual with >1% size-weighted market-share (with size measured by
number of employee-beneficiaries of each plan).
Coefficients from Column 4 are used to compute a predicted fee for all plan filings for which fee data are
missing (FEEHATPLAN).

45
(1) (2) (3) (4)
Dependent variable LnFEEPLAN
LnEMPSPLAN 0.092***
0.083***
0.081***
0.076***
(0.00) (0.00) (0.00) (0.00)
LnASSETSPLAN 0.013 0.042***
0.043***
0.041***
(0.01) (0.01) (0.01) (0.01)
LnLIABSPLAN 0.449***
0.409***
0.408***
0.382***
(0.01) (0.01) (0.01) (0.01)
%ACTUNVESTPLAN 0.001 0.001 0.001
(0.00) (0.00) (0.00)
%ACTVESTPLAN 0.001 0.001 0.001
(0.00) (0.00) (0.00)
%TERMINATEDPLAN -0.005**
-0.005**
-0.004**
(0.00) (0.00) (0.00)
%NORMCOSTPLAN -0.002 -0.002 -0.002
(0.00) (0.00) (0.00)
%DISBURSEPLAN 0.011**
0.010**
0.010**
(0.00) (0.00) (0.00)
TERMINATEDPLAN 0.303***
0.294***
0.281***
(0.07) (0.07) (0.07)
FROZENPLAN
-0.050
** -0.049
** 0.004
(0.02) (0.02) (0.02)
CASHBALPLAN
0.351
*** 0.342
*** 0.335
***
(0.02) (0.02) (0.02)
FUNDINGPLAN
-0.394
*** -0.491
*** -0.487
***
(0.05) (0.06) (0.06)
FUNDING2
PLAN 0.160***
0.158***
0.132***
(0.02) (0.02) (0.02)
AANPLAN
-0.185
* -0.107 -0.047
(0.11) (0.11) (0.11)
EANPLAN
0.100
** 0.115
** 0.018
(0.05) (0.05) (0.05)
PUCPLAN
0.211
*** 0.209
*** 0.105
**
(0.05) (0.05) (0.05)
FILPLAN
-0.031 -0.021 -0.014
(0.05) (0.05) (0.05)
ILPPLAN
0.284 0.278 0.226
(0.43) (0.43) (0.40)
AGGPLAN
-0.079 -0.074 -0.022
(0.05) (0.05) (0.05)
IAGGPLAN
0.029 0.055 0.011
(0.08) (0.08) (0.08)
FUNDING_METHOD_CHGPLAN 0.013 0.014 0.037***

46
(0.01) (0.01) (0.01)
FUNDING_DEF_WAIVEDPLAN 0.136 0.141 0.274**
(0.13) (0.13) (0.13)
ALT_RULES_USEDPLAN 0.117**
0.140***
0.152***
(0.05) (0.05) (0.05)
ACTRL_ASS_CHGPLAN 0.053***
0.049***
0.004
(0.01) (0.01) (0.01)
INSUREDPLAN
-0.039
* -0.051
** -0.016
(0.02) (0.02) (0.02)
Constant 2.414***
2.778***
2.975 2.717
(0.05) (0.08) (15.50) (30.94)
Year & year-end FE No No Yes Yes
Actuarial firm, office &
individual FE No No No Yes
Sponsor industry FE No No No Yes
Sponsor zip code FE No No No Yes
Observations 46,982 46,982 46,982 46,982
Adjusted R2 0.46 0.472 0.475 0.553
Appendix C: Variable definitions
Compustat Fundamental or Pension variable names are prefixed with “#”. As all Form 5500 data
are at the individual plan-level and each plan sponsor could have more than one plan, all
measures constructed with Form 5500 data are rolled-up to the plan sponsor-level.
Variable name Definition and data source
Dependent variable
DR The discount rate used to discount projected future benefit payments to present
value (#PBARR).
Key independent variables
EMKT1-5%
(EMKT5-10%,
EMKT10%)
Indicator set to one if the actuarial firm has 1-5% (5-10%, >10%) share in the
actuarial client market that year, and to zero otherwise, with market share
calculated on a size-weighted basis, and client size measured by number of
employee beneficiaries (Form 5500 Introduction Item 7(f)).
EIMPNAT
(EIMPOFF,
EIMPIND)
Size of each plan sponsor client in a particular year / Sum of sizes of all plan
clients of that actuary in that year, where size is measured by the number of
employee-beneficiaries of each plan (Form 5500 Introduction Item 7(f)). When
a firm has more than one plan, and (i) all plans have the same actuary, the
numerator is the total size of all plans of the sponsor; (ii) all plans do not have
the same actuary, the actuary who handles the largest group of plans is used.
The denominator is defined at the actuarial firm- (i.e., national) level for
EIMPNAT, at the actuary practice office-level for EIMPOFF, where offices are
defined using the zip code of the Enrolled Actuary’s office, and at the
individual Enrolled Actuary-level for EIMPIND, where Enrolled Actuaries are
identified using enrolment number with the Joint Board for Enrolment of
Actuaries. Zip codes are often missing in the Form 5500 data and are manually
looked up using office address. In all three cases, denominator totals are
constructed using the entire universe of Form 5500 filings for single- and
multi-employer plans with Schedule B (actuarial information) available and the

47
actuary’s name listed on the Schedule B (there are ~396,500 individual filings
in total, with 42,000-47,000 filings each year except 2008, which is incomplete
with about 8,000 filings). The Form 5500 Schedule B must be filed by all plans
subject to the minimum funding requirement of ERISA (1974).
FEEIMPNAT
(FEEIMPOFF,
FEEIMPIND)
Professional fees from each plan sponsor client in a particular year / Sum of
fees from all plan clients of that actuary in that year. The denominator is
constructing by summing up disclosed professional fees (FEEPLAN from
Appendix B) wherever it is non-missing and non-zero, and predicted
professional fees (FEEHATPLAN) otherwise. The measure is defined only for
clients with the numerator (FEEPLAN) disclosed. When a plan sponsor has more
than one plan, the procedure described for EIMP is used. The denominator is
defined at the actuarial firm-, practice-office-, or individual Enrolled Actuary-
level for FEEIMPNAT, FEEIMPOFF, and FEEIMPIND respectively.
Controls for the non-discretionary variation in the discount rate
CPLI The Citigroup Pension Liability Index rate, derived from the Citigroup Pension
Discount Curve (CPDC) published by Citigroup Global Markets. The CPDC is
one of the yield curves developed specifically to meet the requirements of
SFAS 87 (Naughton 2011). It is constructed by (i) taking the universe of non-
callable corporate bonds rated Aa/AA, (ii) dividing the bonds into five buckets
by maturity, ranging from 1-3 years to 25+ years, (iii) applying outlier filters to
eliminate bonds with a spread more than two standard deviations away from
the average spread in the bucket, (iv) calculating market-weighted average
spread of the bonds remaining in each bucket, (v) interpolating the rest of the
curve from these averages, and (vi) combining this curve with the Treasury
Model Par Curve, converting the result into a spot curve and annualizing. The
resulting curve consists of zero-coupon interest rates for 30 years in 60 half-
year periods. Detailed methodology is described in Bernstein, M., 31
December 2010 “Citigroup Pension Liability Index: Revised Methology”,
Citigroup Global Markets Portfolio Strategies-US. [Source: Society of
Actuaries Professional Resources: http://www.soa.org/professional-
interests/pension/resources/pen-resources-pension.aspx]
%ACTUNVEST
Proportion of pension liabilities accrued toward active unvested participants at
the beginning of the year, calculated as Retirement Protection Act (RPA) ’94
current liability accrued toward active unvested participants / Total RPA ’94
current liability. [Source: Form 5500 Schedule B, (Item 2(b)(3), Col (3) – Item
2(b)(3), Col (2)) / Item 2(b)(4), Col (3)]
%ACTVEST Proportion of pension liabilities accrued toward active vested participants at
the beginning of the year, calculated as RPA’94 current liability accrued
toward active vested participants / Total RPA ’94 current liability. [Source:
Form 5500 Schedule B, Item 2(b)(3), Col (2) / Item 2(b)(4), Col (3)]
%RETIRED Proportion of pension liabilities accrued toward retired plan participants at the
beginning of the year, calculated as RPA ’94 current liability accrued toward
retired participants / Total RPA ’94 current liability. [Source: Form 5500
Schedule B, Item 2(b)(1), Col (3) / Item 2(b)(4), Col (3)]
NORMCOST Expected increase in pension liabilities due to benefits accruing during the plan
year / Total RPA ’94 current liability [Source: Form 5500 Schedule B, Item
1(d)(2)(b) / Item 2(b)(4), Col (3)]
DISBURSE Expected plan disbursements for the year / Total RPA ’94 current liability
[Source: Form 5500 Schedule B, Item 1(d)(3) / Item 2(b)(4), Col (3)]
%FROZEN Proportion of employees in hard-frozen plans [Plan employees from Form
5500 Introduction Item 7(f), Frozen plans from Introduction Item 8(a)].

48
%CASHBAL Proportion of employees in cash-balance plans [Plan employees from Form
5500 Introduction Item 7(f), Cash-balance plans from Introduction, Item 8(a)].
SC/SCIC Annual pension service cost (#PPSC) / [service cost + interest cost (#PPIC)].
HORIZON Weighted-average expected remaining service life of beneficiaries, estimated
from the relation between projected benefit obligation “PBO” (#PBPRO),
accumulated benefit obligation “ABO” (#PBACO), and assumed annual salary
growth rate “SGR” (#PPRCI): PBO = ABO*[1+(SGR/100)]HORIZON
.
Controls for plan characteristics
LnFVPA Natural logarithm of [1+fair value of pension assets (# PPLAO)]
LnEMPS Natural logarithm of [1+number of employee-beneficiaries (Form 5500
Introduction Item 7(f))]
%FUNDING Fair value of pension assets (#PPLAO)/ PBO (#PBPRO).
%FUNDING
_EXP
The hypothetical, non-discretionary pension funding status, calculated as the
fair value of assets / non-discretionary PBO. Non-discretionary PBO is
estimated using industry (2-digit SIC code)-median discount rate and salary
growth rate instead of firms’ chosen assumptions, and life expectancy of 15
years post-retirement, following Hann, Lu and Subramanyam (2007).
%UNION Proportion of employees in collectively bargained plans [Plan employees from
Form 5500 Introduction Item 7(f), collectively-bargained plans from the Form
5500 Introduction, Item C].
COMPLEXITY
The complexity index is the sum of the following, all from the Form 5500
Schedule B: (i) the proportion of employees in plans for which Projected Unit
Credit actuarial cost method is used (Item 5(a)-(h)) (ii) proportion of
employees in plans for which any change has been made in the funding method
this plan-year (Item 5(i)), (iii) proportion of employees in plans for which any
waiver of funding deficiency was granted this plan-year (Item 8(a)) (iv)
proportion of employees in plans for which any alternative methods or rules
were used this plan-year (Item 8(b)) (v) proportion of employees in plans for
which any changes were made to actuarial assumptions (interest rate,
retirement age, mortality tables, withdrawal rates, salary scales, investment
return) this plan-year (Item 11).
Controls for plan sponsor characteristics
LnFIRMSIZE Natural logarithm of [1+total assets (#AT)] of plan sponsor at fiscal year-end.
LEV (Long-term debt (#DLTT) + Debt in current liabilities (#DLC) + OPEB
underfunding) / Total assets (#AT). OPEB underfunding is explained in TLEV.
MTR Pre-financing marginal tax rates, constructed in Blouin, J., J.E. Core, and W.
Guay. 2010. “Have the tax benefits of debt been overestimated?” Journal of
Financial Economics 98(2): 195-213.
ROA Income before extraordinary items and pension expense (#IB + #PPC) / Total
assets (#AT).
CFO Cash flow from operations before pension contributions (#OANCF +
#PBEC)/Total assets (#AT).
SIGMACFO Standard deviation of CFO over years [t-4, t]; minimum 3 years’ data required.
Controls for auditor characteristics
%F5500BIG4 Proportion of pension assets that are in plans with a Big 4 or erstwhile Big 5
benefit plan auditor [The benefit plan auditor is identified from the Form 5500
Schedule H Item 3(c), only from those plans that file Schedule H].
%LIMSCOPE Proportion of pension assets in plans receiving limited-scope audits. [Limited-
scope audits are identified from Form 5500 Schedule H, Item 3(b), only from
those plans that file Schedule H]
10KBIG4 Set to one if plan sponsor’s financial statements are audited by a Big 4 (or

49
erstwhile Big 5) firm, set to zero otherwise. [Auditor from Compustat #AU].
AUDFEEIMP Measures the importance of the plan sponsor to its financial statements auditor;
defined as (audit fees from each plan sponsor in a particular year / Total audit
fees received from all clients of the audit practice-office in that year) for the
audit firm signing the plan sponsor’s financial statements, with data from Audit
Analytics. Audit practice-offices are identified with a combination of signing
audit firm name and zip code. The denominator is restricted to clients covered
by Audit Analytics.
AUDOFFICEN The size of the audit practice-office signing the plan sponsor’s financial
statements, in number of audit clients.
Partitioning variables
TLEV Estimate of ‘total’ firm leverage including debt and any underfunding in
pension and Other Post-Employment Benefit (OPEB) plans, defined as [long-
term debt + debt in current liabilities + pension underfunding + OPEB
underfunding] / total assets. Pension underfunding is the non-discretionary
projected benefit obligation – fair value of plan assets when non-discretionary
projected benefit obligation > fair value of plan assets; set to zero when non-
discretionary projected benefit obligation <= fair value of plan assets. OPEB
underfunding is the OPEB projected benefit obligation (#PRAA)– fair value of
plan assets (#PRBO) whenever the OPEB projected benefit obligation > fair
value of plan assets; set to zero when the firm has no OPEB plan, or when the
OPEB projected benefit obligation <= fair value of plan assets.

50
Table 1: Descriptive statistics of discount rates and control variables
Panel A: Discount rates
DR P5 P25 P50 P75 P95 Mean SD
Year 2000 7.00 7.50 7.50 7.75 8.00 7.528 0.328
Year 2001 6.80 7.10 7.25 7.41 7.63 7.236 0.292
Year 2002 6.25 6.50 6.75 6.80 7.25 6.740 0.320
Year 2003 5.80 6.00 6.25 6.25 6.50 6.162 0.232
Year 2004 5.50 5.75 5.75 6.00 6.25 5.848 0.290
Year 2006 5.30 5.75 5.85 6.00 6.25 5.824 0.282
Year 2007 5.75 6.00 6.25 6.41 6.60 6.226 0.289
Year 2008 5.90 6.20 6.60 7.10 8.00 6.721 0.648
Whole sample 5.64 5.95 6.25 6.95 7.60 6.426 0.665
Panel B: Control variables
P5 P25 P50 P75 P95 Mean SD
Economic determinants
CPLI 5.680 5.900 6.050 6.640 7.270 6.282 0.543
%ACTUNVEST 0.002 0.019 0.038 0.064 0.141 0.049 0.044
%ACTVEST 0.132 0.287 0.386 0.502 0.732 0.401 0.177
%RETIRED 0.039 0.266 0.405 0.517 0.670 0.386 0.184
NORMCOST 0.005 0.024 0.038 0.056 0.111 0.046 0.039
DISBURSE 0.015 0.040 0.053 0.070 0.109 0.057 0.031
%FROZEN 0 0 0 0 0.008 0.032 0.167
%CASHBAL 0 0 0 0 1 0.191 0.377
SC/SCIC 0.126 0.254 0.331 0.416 0.559 0.337 0.134
HORIZON 0.263 1.531 2.735 4.425 8.328 3.557 5.084
Plan characteristics
FVPA ($m) 8 55 218 872 6,566 1,544 5,589
LnFVPA 2.161 4.032 5.391 6.772 8.790 5.419 1.980
EMPS 88 1,317 4,480 15,396 78,995 18,677 44,830
LnEMPS 4.489 7.184 8.408 9.641 11.277 8.188 2.310
%FUNDING 0.557 0.727 0.846 0.978 1.304 0.877 0.270
%FUNDINGEXP 0.551 0.722 0.842 0.973 1.300 0.874 0.268
%UNION 0 0 0 0.444 1 0.253 0.379
COMPLEXITY 0 1 2 2 3 1.693 0.744
Firm characteristics
FIRMSIZE ($m) 107 632 2,160 7,857 43,091 16,133 84,456
LnFIRMSIZE 4.683 6.450 7.678 8.969 10.671 7.697 1.907
LEVERAGE 0.016 0.167 0.282 0.400 0.640 0.302 0.220
MTR 0.233 0.328 0.343 0.350 0.350 0.327 0.045
ROA -0.044 0.019 0.045 0.081 0.149 0.049 0.108
CFO -0.007 0.054 0.089 0.132 0.214 0.095 0.073
SIGMACFO 0.008 0.018 0.031 0.050 0.097 0.039 0.033
Auditor characteristics

51
%F5500BIG4 0 0 1 1 1 0.612 0.483
%LIMSCOPE 0 0 1 1 1 0.633 0.475
10KBIG4 1 1 1 1 1 0.958 0.201
AUDFEEIMP 0.004 0.019 0.056 0.168 0.673 0.147 0.217
AUDOFFICEN 3 11 26 60 248 56.261 77.602
Statistics are for the final sample of 4,169 firm-years. P5, P25, P50, P75, and P95 represent the
5th, 25
th, 50
th, 75
th, and 95
th percentiles of the distribution respectively. “SD” stands for standard
deviation.
DR is the discount rate used to discount projected future benefit payments to present value. CPLI
is the Citigroup Pension Liability Index rate for the fiscal year-end month, from the Citigroup
Pension Discount Curve. %ACTUNVEST (%ACTVEST, %RETIRED) is the proportion of pension
liabilities accrued toward active unvested (active vested, retired) participants. NORMCOST is the
expected increase in pension liabilities due to benefits accruing during the plan year. DISBURSE
is benefits expected to be disbursed to participants during the year. %FROZEN (%CASHBAL) is
the proportion of employees in hard-frozen (cash-balance) plans. SC/SCIC is the ratio of annual
pension service cost to the sum of service cost and interest cost. HORIZON is the weighted-
averaged remaining service life of beneficiaries, estimated from the relation between the
projected and accumulated benefit obligation.
FVPA is the fair value of plan assets, and LnFVPA is the natural logarithm thereof. EMPS is the
number of beneficiaries of the firm’s plans, and LnEMPS is the natural logarithm thereof.
%FUNDING is the fair value of plan assets scaled by the projected benefit obligation.
%FUNDINGEXP is the fair value of plan assets scaled by the non-discretionary projected benefit
obligation, defined using an industry-median discount rate, salary growth rate, and constant life
expectancy. %UNION is the proportion of employees in collectively bargained plans.
COMPLEXITY is an index capturing various factors that make actuarial valuation more complex.
FIRMSIZE is total assets of the plan sponsor, and LnFIRMSIZE is the natural logarithm thereof.
LEV is long-term debt plus short-term debt + Max(OPEB liability – OPEB plan assets, 0) scaled
by total assets. MTR is the firm’s pre-financing marginal tax rate. ROA is income before
extraordinary items and pension expense, scaled by total assets. CFO is cash flow from
operations before pension contributions, scaled by total assets. SIGMACFO is the standard
deviation of CFO[t-4, t], with a minimum of three years’ data required.
%F5500BIG4 is the proportion of plan assets with a Big 4 benefit plan auditor. %LIMSCOPE is
the proportion of plan assets with only a limited-scope review from the benefit plan auditor.
10KBIG4 is set to one if the financial statements auditor is a Big 4 firm. AUDFEEIMP measures
the fee importance of the plan sponsor to the audit practice-office that signs its financial
statements (audit fees for this client / total audit fees received by the audit office from all clients).
AUDOFFICEN is the number of clients of the audit practice-office signing the plan sponsor’s
financial statements. Detailed variable definitions are in Appendix C.

52
Table 2: Descriptive statistics of actuary size and client importance measures
Panel A: Actuary size measures
Actuary size indicator Proportion of sample
EMKT1-5%=1 10.43%
EMKT5-10%=1 11.68%
EMKT10%=1 60.71%
Panel B: Descriptive statistics of size-based client importance measures
Sample P5 P25 P50 P75 P95 Mean SD
EIMPNAT All 0.00 0.00 0.00 0.01 0.13 0.034 0.138
EIMPNAT EMKT10%=0 0.00 0.00 0.01 0.03 0.63 0.081 0.211
EIMPNAT EMKT10%=1 0.00 0.00 0.00 0.00 0.02 0.004 0.010
EIMPOFF All 0.00 0.01 0.03 0.11 0.61 0.116 0.206
EIMPOFF EMKT10%=0 0.00 0.01 0.04 0.16 0.86 0.156 0.253
EIMPOFF EMKT10%=1 0.00 0.01 0.03 0.09 0.45 0.091 0.163
EIMPIND All 0.01 0.09 0.33 0.76 1 0.422 0.356
EIMPIND EMKT10%=0 0.01 0.08 0.28 0.72 1 0.396 0.355
EIMPIND EMKT10%=1 0.01 0.10 0.36 0.80 1 0.440 0.356
Panel C: Descriptive statistics of fee-based client importance measures
Sample P5 P25 P50 P75 P95 Mean SD
FEEIMPNAT All 0.00 0.00 0.00 0.01 0.09 0.028 0.121
FEEIMPNAT EMKT10%=0 0.00 0.00 0.01 0.03 0.47 0.073 0.197
FEEIMPNAT EMKT10%=1 0.00 0.00 0.00 0.00 0.01 0.004 0.010
FEEIMPOFF All 0.00 0.01 0.03 0.09 0.49 0.101 0.186
FEEIMPOFF EMKT10%=0 0.00 0.01 0.04 0.14 0.78 0.144 0.238
FEEIMPOFF EMKT10%=1 0.00 0.01 0.03 0.07 0.37 0.077 0.145
FEEIMPIND All 0.02 0.10 0.29 0.68 1 0.397 0.337
FEEIMPIND EMKT10%=0 0.02 0.08 0.26 0.66 1 0.379 0.340
FEEIMPIND EMKT10%=1 0.02 0.11 0.30 0.69 1 0.407 0.335
Statistics in Panel A and statistics marked “All” in Panel B are for the final sample of 4,169 firm-
years, except EIMPIND, which is for 3,997 firm-years. Statistics in Panel C are for the sample of
2,375-2,483 firm-years with available data. EMKT1-5% (EMKT5-10%, EMKT10%) is an
indicator for actuarial firms with 1-5% (5-10%, >10%) size-weighted market share in the
actuarial client market that year, with size measured by number of employee-beneficiaries. Statistics marked “EMKT10%=1” (“EMKT10%=0”) are for the subsample of firm-years with
actuaries who service more than (less than) 10% of the actuarial client market in that year. P5,
P25, P50, P75, and P95 represent the 5th, 25
th, 50
th, 75
th, and 95
th percentiles of the distribution
respectively. “SD” stands for standard deviation. EIMPNAT (EIMPOFF, EIMPIND) is the size of each
plan sponsor client / Sum of sizes of all plan clients of that actuarial firm (practice-office,
Enrolled Actuary) in that year, where size is measured by the number of employee-beneficiaries
of each plan sponsor’s plans. FEEIMPNAT (FEEIMPOFF, FEEIMPIND) is the professional fees from
each plan sponsor client / Sum of fees from all plan clients of that actuarial firm (practice-office,
Enrolled Actuary) in that year, with the denominator composed of disclosed fees when available,
and predicted fees otherwise. Detailed variable definitions are in Appendix C.

53
Table 3: Spearman correlations
DR EMKT10% EIMPNAT EIMPOFF EIMPIND FEEIMPNAT FEEIMPOFF FEEIMPIND
EMKT10% -0.105***
EIMPNAT 0.046***
-0.365***
EIMPOFFICE 0.051***
-0.117***
0.748***
EIMPIND 0.030* 0.065
*** 0.527
*** 0.628
***
FEEIMPNAT 0.019 -0.410***
0.639***
0.419***
0.276***
FEEIMPOFFICE 0.028 -0.145***
0.420***
0.638***
0.347***
0.711***
FEEIMPIND 0.032 0.054***
0.298***
0.352***
0.732***
0.471***
0.565***
Economic determinants
CPLI 0.783***
-0.108***
0.044***
0.035**
0.015 0.026 0.039* 0.028
%ACTUNVEST 0.082***
0.086***
-0.039**
-0.006 0.054***
-0.070***
-0.040**
0.022
%ACTVEST 0.027* -0.094
*** -0.111
*** -0.129
*** -0.139
*** -0.074
*** -0.079
*** -0.070
***
%RETIRED 0.011 0.110***
0.110***
0.126***
0.131***
0.067***
0.085***
0.091***
NORMCOST 0.115***
-0.071***
-0.083***
-0.091***
-0.077***
-0.048**
-0.065***
-0.038*
DISBURSE -0.101***
0.130***
0.059***
0.112***
0.130***
0.063***
0.097***
0.108***
%FROZEN -0.165***
0.013 0.040**
0.054***
0.041**
0.024 0.047**
0.007
%CASHBAL -0.092***
0.128***
0.122***
0.146***
0.184***
0.072***
0.085**
0.132***
SC/SCIC -0.076***
-0.076***
-0.089***
-0.121***
-0.093***
-0.033* -0.082
*** -0.054
***
HORIZON 0.225***
-0.065***
-0.119***
-0.124***
-0.111***
-0.031 -0.069***
-0.079***
Plan characteristics
LnFVPA -0.113***
0.289***
0.395***
0.468***
0.460***
0.190***
0.266***
-0.337***
LnEMPS -0.014 0.290***
0.586***
0.658***
0.642***
0.231***
0.283***
0.376***
%FUNDINGEXP 0.174***
0.045**
0.111***
0.106***
0.100***
0.075***
0.069***
0.073***
%UNION -0.025 0.039**
0.129***
0.107***
0.119***
0.049**
0.037* 0.095
***
COMPLEXITY -0.072***
0.188***
0.002 0.073***
0.126***
-0.057***
-0.018 0.002
Firm characteristics
LnFIRMSIZE -0.145***
0.268***
0.336***
0.412***
0.408***
0.189***
0.254***
0.314***
LEVERAGE 0.048***
0.032**
0.035**
0.075***
0.090***
0.042**
0.085***
0.085***
MTR -0.122***
0.166***
0.084***
0.133***
0.164***
0.043**
0.086***
0.109***

54
ROA -0.133***
0.070***
-0.012 -0.021 0.029* -0.049
** -0.049
** -0.023
CFO -0.031**
0.072***
-0.007 0.001 0.053***
-0.041**
-0.016 0.023
SIGMACFO 0.058***
-0.105***
-0.079***
-0.118***
-0.119***
-0.032 -0.066***
-0.126***
Auditor characteristics
%F5500BIG4 0.177***
0.047***
0.079***
0.117***
0.123***
0.007 0.025 0.035*
%LIMSCOPE -0.131***
0.016 -0.067***
-0.040**
-0.031**
-0.033* -0.048
** -0.064
*
10KBIG4 -0.003 0.154***
0.010 0.085***
0.110***
-0.034* 0.067
*** 0.089
***
AUDFEEIMP 0.012 0.091***
0.223***
0.284***
0.201***
0.117***
0.141***
0.131***
AUDOFFICEN -0.129***
0.050***
-0.006 -0.070***
0.039***
0.018 -0.015 0.068***
*, **, *** indicate statistical significance at 10%, 5% and 1% respectively. All correlations are for the maximum observations available. DR is the
discount rate used to discount projected future benefit payments to present value. EMKT10% is an indicator set to 1 if the actuarial firm has >10%
size-weighted market share in the actuarial client market that year, and to zero otherwise. EIMPNAT (EIMPOFF, EIMPIND) is the size of each plan
sponsor client / Sum of sizes of all plan clients of that actuarial firm (practice-office, Enrolled Actuary) in that year, where size is measured by the
number of employee-beneficiaries of each plan sponsor’s plans. FEEIMPNAT (FEEIMPOFF, FEEIMPIND) is the professional fees from each plan
sponsor client in a particular year / Sum of fees from all plan clients of that actuarial firm (practice-office, Enrolled Actuary) for that year, with the
denominator composed of disclosed fees when available, and predicted fees otherwise. All other variable definitions are in Appendix C.

55
Table 4: Are actuarial firm size and client importance associated with discount rate
assumptions?
Panel A: Models with the size-based client importance measure
(1) (2) (3) (4)
Dependent variable DR
EIMPNAT 0.062
-0.040
(0.13)
(0.13)
EIMPOFF
0.084
**
0.074**
(0.03)
(0.03)
EIMPIND
0.048
*** 0.041
***
(0.01) (0.01)
EMKT1-5% -0.055 -0.048 -0.052 -0.046
(0.03) (0.03) (0.03) (0.03)
EMKT5-10% -0.060 -0.046 -0.043 -0.034
(0.04) (0.04) (0.04) (0.04)
EMKT10% -0.104**
-0.088**
-0.084* -0.074
*
(0.04) (0.04) (0.04) (0.04)
CPLI 0.466***
0.466***
0.456***
0.455***
(0.03) (0.03) (0.03) (0.03)
%ACTUNVEST 0.195 0.213* 0.215 0.226
(0.13) (0.13) (0.13) (0.13)
%ACTVEST 0.033 0.034 0.039 0.041
(0.08) (0.08) (0.09) (0.09)
%RETIRED -0.002 0.003 0.013 0.016
(0.08) (0.08) (0.08) (0.08)
%NORMCOST 0.712**
0.704**
0.673**
0.664**
(0.29) (0.28) (0.28) (0.28)
%DISBURSE -0.704***
-0.692***
-0.650***
-0.638***
(0.20) (0.20) (0.21) (0.20)
%FROZEN -0.161***
-0.162***
-0.160***
-0.161***
(0.04) (0.04) (0.04) (0.04)
%CASHBAL -0.029**
-0.029**
-0.028**
-0.028**
(0.01) (0.01) (0.01) (0.01)
SC/SCIC -0.238***
-0.238***
-0.241***
-0.240***
(0.06) (0.06) (0.06) (0.06)
HORIZON -0.001 -0.001 -0.001 -0.001
(0.00) (0.00) (0.00) (0.00)
LnFVPA 0.019**
0.016* 0.015
* 0.013
(0.01) (0.01) (0.01) (0.01)
LnEMPS 0.015***
0.013***
0.012***
0.011***
(0.00) (0.00) (0.00) (0.00)
%FUNDINGEXP -0.122***
-0.121***
-0.119***
-0.118***

56
(0.04) (0.04) (0.04) (0.04)
%UNION -0.038***
-0.037***
-0.041***
-0.040***
(0.01) (0.01) (0.01) (0.01)
COMPLEXITY -0.015**
-0.014**
-0.012**
-0.012*
(0.01) (0.01) (0.01) (0.01)
LnFIRMSIZE -0.027***
-0.027***
-0.027***
-0.027***
(0.01) (0.01) (0.01) (0.01)
LEV 0.002 0.003 0.003 0.004
(0.02) (0.02) (0.02) (0.02)
MTR 0.152 0.166 0.179 0.189
(0.18) (0.18) (0.17) (0.17)
ROA -0.090***
-0.090***
-0.099***
-0.099***
(0.03) (0.03) (0.04) (0.04)
CFO -0.053 -0.053 -0.035 -0.034
(0.10) (0.10) (0.11) (0.10)
SIGMACFO -0.082 -0.083 -0.150 -0.147
(0.15) (0.15) (0.16) (0.16)
%F5500BIG4 0.005 0.004 0.002 0.002
(0.01) (0.01) (0.01) (0.01)
%LIMSCOPE -0.021**
-0.020**
-0.017* -0.016
*
(0.01) (0.01) (0.01) (0.01)
10KBIG4 -0.033 -0.034 -0.029 -0.030
(0.04) (0.04) (0.04) (0.04)
AUDFEEIMP -0.052**
-0.056**
-0.056**
-0.060***
(0.02) (0.02) (0.02) (0.02)
AUDOFFICEN (times 1000) -0.372***
-0.365***
-0.373***
-0.366***
(0.00) (0.00) (0.00) (0.00)
Constant 4.457***
4.451***
4.507***
4.507***
(0.25) (0.26) (0.27) (0.27)
Year & fiscal year-end FE Yes Yes Yes Yes
Actuary firm FE Yes Yes Yes Yes
Observations 4169 4169 3997 3997
Adjusted R2 0.835 0.835 0.839 0.839
F-test of actuary FE 4.48***
4.51***
4.48***
4.46***
*,
**,
*** indicate statistical significance at 10%, 5%, and 1% level. Robust standard errors are in
parentheses. The dependent variable is DR, the discount rate assumption used to discount projected future
benefit payments to present value. EIMPNAT, EIMPOFF, and EIMPIND capture (the size of each plan sponsor
client / sum of sizes of all plan clients of that actuary in that year), with size measured by the number of
employee-beneficiaries, and denominator defined at the actuarial firm-, practice-office-, and individual
actuary-level respectively. EMKT1-5%, EMKT5-10%, and EMKT10% are indicators for actuarial firm with
1-5%, 5-10%, or >10% size-weighted market share that year. All other variables are defined in Appendix
C. “FE” denotes “fixed-effects”. The last row presents F-tests for joint significance of actuarial firm FE.

57
Panel B: Models with the fee-based client importance measure
(1) (2) (3) (4)
Dependent variable DR
FEEIMPNAT 0.100
-0.069
(0.12)
(0.13)
FEEIMPOFF
0.166
***
0.113***
(0.03)
(0.04)
FEEIMPIND
0.079
*** 0.061
***
(0.01) (0.02)
EMKT1-5% 0.078 0.094**
0.071 0.080*
(0.05) (0.04) (0.05) (0.05)
EMKT5-10% -0.021 0.019 -0.005 0.016
(0.10) (0.10) (0.11) (0.10)
EMKT10% -0.068 -0.022 -0.042 -0.017
(0.10) (0.09) (0.10) (0.10)
CPLI 0.468***
0.469***
0.444***
0.446***
(0.06) (0.06) (0.07) (0.06)
%ACTUNVEST 0.108 0.135 0.172 0.177
(0.21) (0.21) (0.20) (0.20)
%ACTVEST 0.097 0.101 0.107 0.110
(0.09) (0.09) (0.09) (0.09)
%RETIRED 0.004 0.010 0.043 0.045
(0.08) (0.08) (0.08) (0.08)
%NORMCOST 0.590 0.594 0.567 0.573
(0.37) (0.36) (0.36) (0.37)
%DISBURSE -0.870***
-0.854***
-0.857***
-0.832***
(0.20) (0.19) (0.24) (0.24)
%FROZEN -0.156***
-0.156***
-0.143**
-0.144***
(0.05) (0.05) (0.06) (0.06)
%CASHBAL -0.022* -0.024
* -0.020 -0.021
(0.01) (0.01) (0.02) (0.02)
SC/SCIC -0.223**
-0.230**
-0.234**
-0.237**
(0.11) (0.11) (0.11) (0.11)
HORIZON -0.001 -0.002 -0.001 -0.001
(0.00) (0.00) (0.00) (0.00)
LnFVPA 0.016 0.012 0.008 0.006
(0.01) (0.01) (0.01) (0.01)
LnEMPS 0.017***
0.016***
0.015***
0.015***
(0.00) (0.00) (0.00) (0.00)
%FUNDINGEXP -0.135***
-0.132***
-0.119***
-0.119***
(0.03) (0.03) (0.03) (0.03)
%UNION -0.013 -0.011 -0.019**
-0.018*

58
(0.01) (0.01) (0.01) (0.01)
COMPLEXITY -0.007 -0.006 -0.004 -0.004
(0.01) (0.01) (0.01) (0.01)
LnFIRMSIZE -0.027***
-0.027***
-0.024**
-0.024**
(0.01) (0.01) (0.01) (0.01)
LEV -0.030 -0.026 -0.041 -0.037
(0.04) (0.04) (0.04) (0.04)
MTR 0.111 0.113 0.121 0.119
(0.20) (0.21) (0.18) (0.18)
ROA -0.155 -0.145 -0.187 -0.179
(0.11) (0.11) (0.13) (0.13)
CFO -0.038 -0.039 0.003 0.003
(0.09) (0.09) (0.09) (0.09)
SIGMACFO -0.060 -0.034 -0.101 -0.092
(0.18) (0.18) (0.19) (0.20)
%F5500BIG4 0.004 0.004 0.006 0.005
(0.01) (0.01) (0.01) (0.01)
%LIMSCOPE -0.036***
-0.036***
-0.030***
-0.030***
(0.01) (0.01) (0.01) (0.01)
10KBIG4 -0.040 -0.040 -0.029 -0.030
(0.04) (0.04) (0.03) (0.03)
AUDFEEIMP -0.058**
-0.060**
-0.065**
-0.066**
(0.02) (0.03) (0.03) (0.03)
AUDOFFICEN (times 1000) -0.400**
-0.383**
-0.426***
-0.410***
(0.00) (0.00) (0.00) (0.00)
Constant 4.432***
4.384***
4.531***
4.504***
(0.42) (0.41) (0.47) (0.47)
Year & fiscal year-end FE Yes Yes Yes Yes
Actuary firm FE Yes Yes Yes Yes
Observations 2483 2481 2375 2372
Adjusted R2 0.841 0.842 0.847 0.847
F-test of actuary FE 2.83***
2.86***
2.89***
2.87***
*,
**,
*** indicate statistical significance at 10%, 5%, and 1% level. Robust standard errors are in
parentheses. The dependent variable is DR, the discount rate assumption used to discount projected future
benefit payments to present value. FEEIMPNAT, FEEIMPOFF, and FEEIMPIND capture (total professional
fees from each plan sponsor client / sum of fees from all plan clients of that actuary in that year), with
denominator defined at the actuarial firm-, practice-office-, and individual actuary-level respectively. The
denominator is composed of disclosed fees when available, and predicted fees otherwise, as explained in
Appendix B. EMKT1-5%, EMKT5-10%, and EMKT10% are indicators for actuarial firms with 1-5%, 5-
10%, or >10% size-weighted market share that year. All other variables are defined in Appendix C. “FE”
denotes “fixed-effects”. The last row presents F-tests for joint significance of all actuarial firm FE.

59
Table 5: The effects of actuarial firm size and client importance: Partitioning on plan and plan sponsor financial status
(1a) (1b) (2a) (2b) (3a) (3b) (4a) (4b)
Low TLEV High TLEV Low TLEV High TLEV Low TLEV High TLEV Low TLEV High TLEV
Strong plans Weak plans Strong plans Weak plans Strong plans Weak plans Strong plans Weak plans
Dependent variable DR
EIMPNAT 0.088 -0.019
-0.018 -0.071
(0.16) (0.12)
(0.17) (0.12)
EIMPOFF
0.054 0.109
***
0.061 0.091**
(0.05) (0.04)
(0.04) (0.04)
EIMPIND
0.031 0.059
*** 0.025 0.050
***
(0.02) (0.01) (0.02) (0.01)
EMKT1-5% -0.063* -0.031 -0.062
* -0.026 -0.073
** -0.027 -0.066
* -0.023
(0.03) (0.03) (0.04) (0.03) (0.03) (0.03) (0.03) (0.03)
EMKT5-10% -0.149***
0.057 -0.142***
0.063 -0.135***
0.071* -0.121
*** 0.070
*
(0.04) (0.04) (0.04) (0.04) (0.03) (0.04) (0.04) (0.04)
EMKT10% -0.231***
0.054 -0.224***
0.065 -0.210***
0.066 -0.196***
0.067
(0.05) (0.05) (0.05) (0.05) (0.04) (0.05) (0.04) (0.05)
All controls from Eq. (1) Yes Yes Yes Yes Yes Yes Yes Yes
Year & fiscal year-end FE Yes Yes Yes Yes Yes Yes Yes Yes
Actuary firm FE Yes Yes Yes Yes Yes Yes Yes Yes
Observations 2086 2083 2086 2083 1999 1998 1999 1998
Adjusted R2 0.827 0.853 0.827 0.854 0.831 0.857 0.831 0.857
F-test of actuary FE 3.56***
4.28***
3.57***
4.32***
3.54***
4.37***
3.53***
4.36***
*,
**,
*** indicate statistical significance at 10%, 5%, and 1% level. Robust standard errors are in parentheses. “Strong plans” (“Weak plans”) are the subsample of
firms with TLEV below (above) the annual median, with TLEV (total leverage) defined as financial leverage plus any underfunding in pension and OPEB plans.
DR is the discount rate used to discount projected future benefit payments to present value. EIMPNAT, EIMPOFF, and EIMPIND are (the size of each plan sponsor
client / sum of sizes of all plan clients of that actuary in that year), with size measured by the number of beneficiaries, and denominator at actuarial firm-,
practice-office-, and individual-level respectively. EMKT1-5%, EMKT5-10%, and EMKT10% are indicators for actuarial firms with 1-5%, 5-10%, or >10%
market share. All variables are defined in Appendix C. “FE” is “fixed-effects”.

60
Table 6: The effects of actuarial firm size and client importance in financially weak plans: Partitioning on auditor oversight
(1a) (1b) (2a) (2b) (3a) (3b) (4a) (4b)
High TLEV sample,
partitioned by %LIMSCOPE
=0
%LIMSCOPE
>0
%LIMSCOPE
=0
%LIMSCOPE
>0
%LIMSCOPE
=0
%LIMSCOPE
>0
%LIMSCOPE
=0
%LIMSCOPE
>0
Full audit Limited audit Full audit Limited audit Full audit Limited audit Full audit Limited audit
Dependent variable DR
EIMPNAT -0.321 -0.109
0.022 -0.161
(0.40) (0.10)
(0.60) (0.10)
EIMPOFF
-0.011 0.116
**
-0.092* 0.138
**
(0.06) (0.05)
(0.05) (0.05)
EIMPIND
0.059
** 0.040
** 0.069
** 0.029
(0.03) (0.02) (0.03) (0.02)
EMKT1-5% -0.327***
0.098**
-0.329***
0.107**
-0.323***
0.101**
-0.332***
0.104**
(0.08) (0.04) (0.08) (0.05) (0.07) (0.05) (0.07) (0.05)
EMKT5-10% -0.211**
0.110 -0.213**
0.128 -0.271**
0.121 -0.279**
0.113
(0.10) (0.09) (0.10) (0.09) (0.12) (0.09) (0.11) (0.09)
EMKT10% -0.173* 0.117 -0.176
* 0.143 -0.259
** 0.149 -0.268
*** 0.148
(0.10) (0.10) (0.10) (0.11) (0.11) (0.11) (0.10) (0.10)
Controls from Eq. (1) Yes Yes Yes Yes Yes Yes Yes Yes
Year, fiscal year-end &
actuary FE Yes Yes Yes Yes Yes Yes Yes Yes
Observations 714 1369 714 1369 687 1311 687 1311
Adjusted R2 0.855 0.858 0.855 0.859 0.861 0.862 0.861 0.862
F-test of actuary FE 3.68***
3.36***
3.67***
3.40***
3.70***
3.31***
3.71***
3.35***
*,
**,
*** indicate statistical significance at 10%, 5%, and 1% level. Robust standard errors are in parentheses. Tests are with “High TLEV” sample partitioned by
%LIMSCOPE, the % of assets in plans subject only to limited-scope benefit plan audit. DR is the discount rate used to discount projected future benefit payments
to present value. EIMPNAT, EIMPOFF, and EIMPIND are (the size of each plan sponsor client / total size of all plan clients of that actuary in that year), with size
measured by the number of beneficiaries, and denominator at actuarial firm-, practice-office-, and individual-level respectively. EMKT1-5%, EMKT5-10%, and
EMKT10% are indicators for actuarial firms with 1-5%, 5-10%, or >10% market share. All variables are defined in Appendix C. “FE” is “fixed-effects”.

61
Table 7: The effects of actuarial client importance in financially weak plans: Partitioning into large and small actuarial firms
(1a) (1b) (2a) (2b) (3a) (3b) (4a) (4b)
High TLEV sample,
partitioned by:
EMKT10%
=1
EMKT10%
=0
EMKT10%
=1
EMKT10%
=0
EMKT10%
=1
EMKT10%
=0
EMKT10%
=1
EMKT10%
=0
Large Small Large Small Large Small Large Small
Dependent variable DR
EIMPNAT 0.280 -0.067
0.378 -0.147
(1.60) (0.12)
(1.78) (0.11)
EIMPOFF
0.093
** 0.116
*
0.069**
0.101
(0.03) (0.06)
(0.02) (0.08)
EIMPIND
0.048
*** 0.087
*** 0.042
** 0.073
**
(0.01) (0.03) (0.01) (0.03)
EMKT1-5% - -0.030 - -0.026 - -0.025 - -0.022
- (0.04) - (0.04) - (0.04) - (0.04)
EMKT5-10% - 0.010 - 0.012 - 0.022 - 0.016
- (0.05) - (0.05) - (0.05) - (0.05)
Controls from Eq. (1) Yes Yes Yes Yes Yes Yes Yes Yes
Year & fiscal year-end FE Yes Yes Yes Yes Yes Yes Yes Yes
Actuary firm FE Yes Yes Yes Yes Yes Yes Yes Yes
Observations 1279 804 1279 804 1215 783 1215 783
Adjusted R2 0.854 0.844 0.854 0.845 0.860 0.845 0.860 0.845
F-test of actuary FE 2.76**
4.24***
2.79**
4.28***
2.41**
4.25***
2.33* 4.24
***
*,
**,
*** indicate statistical significance at 10%, 5%, and 1% level. Robust standard errors are in parentheses. Tests are with the “High TLEV” sample, partitioned
by EMKT10%, an indicator for actuarial firms with >10% size-weighted share of the actuarial client market that year (“large firms”). DR is the discount rate used
to discount projected future benefit payments to present value. EIMPNAT, EIMPOFF, and EIMPIND are (the size of each plan sponsor client / total size of all plan
clients of that actuary in that year), with size measured by the number of beneficiaries, and denominator at the actuarial firm-, practice-office-, and individual-
level respectively. EMKT1-5% and EMKT5-10% are indicators for actuarial firms with 1-5% or 5-10% market share that year. All variables are defined in
Appendix C. “FE” is “fixed-effects”.
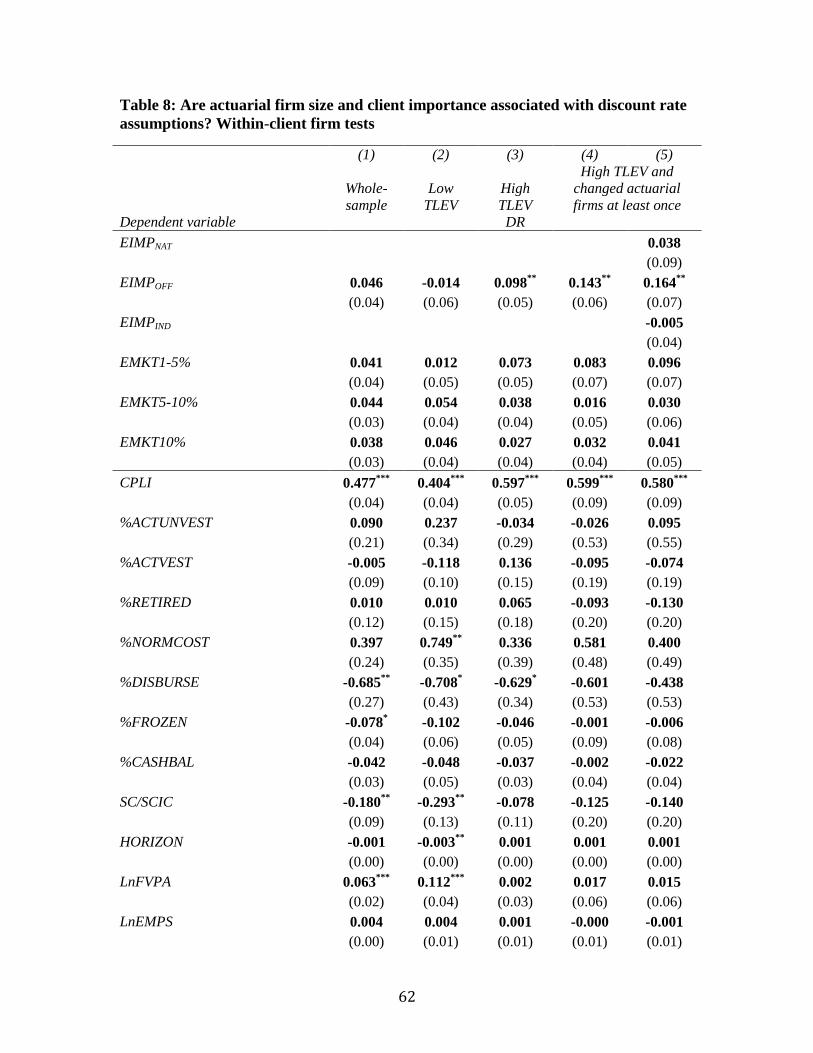
62
Table 8: Are actuarial firm size and client importance associated with discount rate
assumptions? Within-client firm tests
(1) (2) (3) (4) (5)
Whole-
sample
Low
TLEV
High
TLEV
High TLEV and
changed actuarial
firms at least once
Dependent variable DR
EIMPNAT
0.038
(0.09)
EIMPOFF 0.046 -0.014 0.098**
0.143**
0.164**
(0.04) (0.06) (0.05) (0.06) (0.07)
EIMPIND
-0.005
(0.04)
EMKT1-5% 0.041 0.012 0.073 0.083 0.096
(0.04) (0.05) (0.05) (0.07) (0.07)
EMKT5-10% 0.044 0.054 0.038 0.016 0.030
(0.03) (0.04) (0.04) (0.05) (0.06)
EMKT10% 0.038 0.046 0.027 0.032 0.041
(0.03) (0.04) (0.04) (0.04) (0.05)
CPLI 0.477***
0.404***
0.597***
0.599***
0.580***
(0.04) (0.04) (0.05) (0.09) (0.09)
%ACTUNVEST 0.090 0.237 -0.034 -0.026 0.095
(0.21) (0.34) (0.29) (0.53) (0.55)
%ACTVEST -0.005 -0.118 0.136 -0.095 -0.074
(0.09) (0.10) (0.15) (0.19) (0.19)
%RETIRED 0.010 0.010 0.065 -0.093 -0.130
(0.12) (0.15) (0.18) (0.20) (0.20)
%NORMCOST 0.397 0.749**
0.336 0.581 0.400
(0.24) (0.35) (0.39) (0.48) (0.49)
%DISBURSE -0.685**
-0.708* -0.629
* -0.601 -0.438
(0.27) (0.43) (0.34) (0.53) (0.53)
%FROZEN -0.078* -0.102 -0.046 -0.001 -0.006
(0.04) (0.06) (0.05) (0.09) (0.08)
%CASHBAL -0.042 -0.048 -0.037 -0.002 -0.022
(0.03) (0.05) (0.03) (0.04) (0.04)
SC/SCIC -0.180**
-0.293**
-0.078 -0.125 -0.140
(0.09) (0.13) (0.11) (0.20) (0.20)
HORIZON -0.001 -0.003**
0.001 0.001 0.001
(0.00) (0.00) (0.00) (0.00) (0.00)
LnFVPA 0.063***
0.112***
0.002 0.017 0.015
(0.02) (0.04) (0.03) (0.06) (0.06)
LnEMPS 0.004 0.004 0.001 -0.000 -0.001
(0.00) (0.01) (0.01) (0.01) (0.01)

63
%FUNDINGEXP -0.165***
-0.254***
-0.017 0.122 0.130
(0.05) (0.07) (0.08) (0.15) (0.15)
%UNION -0.006 0.019 -0.011 -0.011 -0.022
(0.02) (0.03) (0.03) (0.04) (0.05)
COMPLEXITY -0.009 0.002 -0.016 -0.004 0.003
(0.01) (0.01) (0.01) (0.02) (0.02)
LnFIRMSIZE 0.006 -0.006 0.011 -0.020 -0.022
(0.02) (0.04) (0.03) (0.05) (0.05)
LEV 0.010 0.280**
-0.078 -0.032 -0.032
(0.04) (0.11) (0.05) (0.07) (0.07)
MTR 0.117 0.293 0.019 -0.089 -0.131
(0.14) (0.22) (0.18) (0.29) (0.29)
ROA -0.058**
-0.018 -0.046 -0.038 0.010
(0.03) (0.03) (0.09) (0.13) (0.14)
CFO -0.063 0.094 -0.188* -0.239 -0.287
*
(0.08) (0.15) (0.11) (0.15) (0.15)
SIGMACFO 0.042 -0.021 0.115 0.314 0.334
(0.22) (0.31) (0.36) (0.48) (0.47)
%F5500BIG4 0.017 0.019 0.009 0.023 0.030
(0.01) (0.02) (0.02) (0.04) (0.04)
%LIMSCOPE -0.010 0.000 -0.025 -0.092**
-0.097***
(0.02) (0.02) (0.02) (0.04) (0.04)
10KBIG4 -0.005 0.021 -0.008 0.054 0.054
(0.04) (0.05) (0.05) (0.07) (0.07)
AUDFEEIMP 0.018 0.030 -0.019 -0.069 -0.073
(0.04) (0.06) (0.06) (0.09) (0.09)
AUDOFFICEN -0.000***
-0.000***
-0.000* -0.000 -0.000
(0.00) (0.00) (0.00) (0.00) (0.00)
Constant 3.911***
4.167***
2.690***
3.177***
3.341***
(0.33) (0.39) (0.48) (0.81) (0.84)
Year & fiscal year-end FE Yes Yes Yes Yes Yes
Client firm FE Yes Yes Yes Yes Yes
Observations 4169 2086 2083 872 838
Adjusted R2 0.889 0.873 0.904 0.894 0.895
*,
**,
*** indicate statistical significance at 10%, 5%, and 1% level. Robust standard errors are in
parentheses. The dependent variable is DR, the discount rate assumption used to discount projected future
benefit payments to present value. EIMPNAT, EIMPOFF, and EIMPIND capture (the size of each plan sponsor
client / sum of sizes of all plan clients of that actuary in that year), with size measured by the number of
employee-beneficiaries, and denominator defined at the actuarial firm-, practice-office-, and individual
actuary-level respectively. EMKT1-5%, EMKT5-10%, and EMKT10% are indicators for actuarial firms
with 1-5%, 5-10%, or >10% size-weighted market share that year. All other variables are defined in
Appendix C. “FE” denotes “fixed-effects”.

64
Table 9: Partitioning client firms by absolute plan size
(1) (2) (3) (4)
High TLEV sample,
partitioned by LnEMPS:
Quartile 1
(smallest) Quartile 2 Quartile 3
Quartile 4
(largest)
Dependent variable DR
EIMPOFF 0.271**
0.394**
-0.096 -0.055
(0.11) (0.20) (0.09) (0.07)
EMKT1-5% 0.217 -0.135 -0.036 0.163
(0.14) (0.09) (0.09) (0.10)
EMKT5-10% 0.219 -0.043 -0.128**
0.076
(0.15) (0.09) (0.06) (0.08)
EMKT10% 0.017 -0.037 -0.040 0.011
(0.12) (0.09) (0.05) (0.07)
CPLI 0.552***
0.522***
0.531***
0.599***
(0.05) (0.09) (0.08) (0.13)
%ACTUNVEST 0.662 -0.468 1.073 -0.004
(0.50) (0.40) (0.86) (0.66)
%ACTVEST 0.667***
-0.428* 0.309 -0.069
(0.23) (0.23) (0.32) (0.45)
%RETIRED 0.465* -0.230 0.606 -0.301
(0.25) (0.22) (0.46) (0.48)
%NORMCOST -1.039 0.353 1.255 -0.797
(0.65) (0.54) (1.17) (1.17)
%DISBURSE -1.010* 0.242 -1.339
** -0.424
(0.58) (0.74) (0.62) (0.92)
%FROZEN -0.279***
-0.013 -0.185* 0.097
(0.07) (0.10) (0.11) (0.09)
%CASHBAL 0.054 0.009 0.117 -0.029
(0.04) (0.09) (0.13) (0.07)
SC/SCIC -0.186 -0.071 -0.065 0.077
(0.20) (0.14) (0.30) (0.24)
HORIZON 0.016***
0.013* -0.002 0.001
(0.01) (0.01) (0.00) (0.00)
LnFVPA 0.016 -0.091 0.050 0.003
(0.05) (0.09) (0.08) (0.11)
LnEMPS -0.005 0.109 -0.045 0.055
(0.01) (0.07) (0.08) (0.07)
%FUNDINGEXP -0.057 -0.093 0.062 0.134
(0.14) (0.18) (0.18) (0.21)
%UNION -0.080 0.021 0.035 -0.012
(0.08) (0.18) (0.06) (0.06)
COMPLEXITY -0.040* 0.012 -0.011 -0.045
**

65
(0.02) (0.02) (0.03) (0.02)
LnFIRMSIZE 0.145* -0.018 -0.033 0.070
(0.08) (0.05) (0.08) (0.06)
LEV 0.345**
-0.084 -0.319* -0.177
(0.17) (0.07) (0.18) (0.14)
MTR -0.277 0.109 -0.137 -0.349
(0.44) (0.22) (0.33) (0.38)
ROA 0.299 -0.000 0.116 -0.193*
(0.33) (0.13) (0.28) (0.11)
CFO -0.090 -0.353* -0.539 -0.065
(0.16) (0.18) (0.42) (0.28)
SIGMACFO 2.434***
0.425 -2.493* -0.148
(0.77) (0.30) (1.09) (0.88)
%F5500BIG4 -0.073* -0.000 0.003 0.013
(0.04) (0.06) (0.05) (0.04)
%LIMSCOPE -0.090**
-0.050 -0.012 0.068**
(0.04) (0.04) (0.07) (0.03)
10KBIG4 -0.186**
0.171* 0.096 -0.073
(0.09) (0.10) (0.15) (0.09)
AUDFEEIMP -0.348* -0.015 0.094 0.124
(0.19) (0.11) (0.16) (0.09)
AUDOFFICEN -0.123 -0.629**
-0.433* -0.078
(0.00) (0.00) (0.00) (0.00)
Constant 2.228***
3.620***
3.835***
2.250*
(0.69) (0.95) (1.01) (1.15)
Year & fiscal year-end FE Yes Yes Yes Yes
Client firm FE Yes Yes Yes Yes
Observations 524 519 522 518
Adjusted R2 0.904 0.901 0.916 0.922
*,
**,
*** indicate statistical significance at 10%, 5%, and 1% level. Robust standard errors are in
parentheses. The subsamples are quartiles by annual distributions of LnEMPS. DR is the discount rate used
to discount projected future benefit payments to present value. EIMPOFF is (the size of each plan sponsor
client / sum of sizes of all plan clients of that actuarial practice-office in that year), with size measured by
number of employee-beneficiaries. EMKT1-5%, EMKT5-10%, and EMKT10% are indicators for actuarial
firms with 1-5%, 5-10%, or >10% size-weighted market share that year. All variables are defined in
Appendix C. “FE” is “fixed-effects”.
Related Documents


