LETTER The robustness of pollination networks to the loss of species and interactions: a quantitative approach incorporating pollinator behaviour Christopher N. Kaiser- Bunbury, 1*‡ Stefanie Muff, 2‡ Jane Memmott, 3 Christine B. Mu ¨ ller 4† and Amedeo Caflisch 2 1 Ecosystem Management, Institute of Terrestrial Ecosystems, Swiss Federal Institute of Technology (ETH) Zurich, Universita ¨ tstrasse 16, 8092 Zu ¨ rich, Switzerland 2 Department of Biochemistry, University of Zurich, Winterthurerstrasse 190, 8057 Zu ¨ rich, Switzerland 3 School of Biological Sciences, University of Bristol, Woodland Road, Bristol BS8 1UG, UK 4 Institute of Evolutionary Biology and Environmental Studies, University of Zurich, Winterthurerstrasse 190, 8057 Zu ¨ rich, Switzerland *Correspondence: E-mail: [email protected] † Deceased 7 March 2008. ‡ These authors contributed equally to this work. Abstract Species extinctions pose serious threats to the functioning of ecological communities worldwide. We used two qualitative and quantitative pollination networks to simulate extinction patterns following three removal scenarios: random removal and systematic removal of the strongest and weakest interactors. We accounted for pollinator behaviour by including potential links into temporal snapshots (12 consecutive 2-week networks) to reflect mutualistsÕ ability to ÔswitchÕ interaction partners (re-wiring). Qualitative data suggested a linear or slower than linear secondary extinction while quantitative data showed sigmoidal decline of plant interaction strength upon removal of the strongest interactor. Temporal snapshots indicated greater stability of re-wired networks over static systems. Tolerance of generalized networks to species extinctions was high in the random removal scenario, with an increase in network stability if species formed new interactions. Anthropogenic disturbance, however, that promote the extinction of the strongest interactors might induce a sudden collapse of pollination networks. Keywords Behaviour, complex networks, extinction, habitat restoration, Mauritius, mutualism, network re-wiring, pollination. Ecology Letters (2010) INTRODUCTION The stability of ecological networks has been a focus of empirical and theoretical studies over several decades. Most of our current understanding of interactions in ecological communities derives from advances in preda- tor–prey relationships in food web analyses (Polis 1998; Sole ´ & Montoya 2001; Dunne et al. 2002; Kondoh 2003; Ives & Cardinale 2004; Montoya et al. 2006; Rooney et al. 2006). Although equally important, knowledge on the stability of mutualistic interaction networks is less developed, not least due to a lack of extensive and highly resolved quantitative datasets of pollination and seed dispersal communities. Memmott et al. (2004) modelled the effect of mutualist extinctions on the stability of two temperate qualitative pollination networks and showed that preferential removal of the most-linked pollinators, considered as the worst-case scenario, resulted in a linear decline of plant species diversity. With the recent increase in data quality, quanti- tative analyses of ecological networks has revealed that simply focusing on diversity and richness metrics may disguise important changes in community structure and ecosystem functions (Bascompte et al. 2006; Bascompte & Jordano 2007; Tylianakis et al. 2007). In analyses of mutualistic networks, for example, the use of quantitative data has revealed strong asymmetrical dependencies (Bas- compte et al. 2006; Va ´zquez et al. 2007). Furthermore, Ecology Letters, (2010) doi: 10.1111/j.1461-0248.2009.01437.x ȑ 2010 Blackwell Publishing Ltd/CNRS

Welcome message from author
This document is posted to help you gain knowledge. Please leave a comment to let me know what you think about it! Share it to your friends and learn new things together.
Transcript

L E T T E RThe robustness of pollination networks to the loss of
species and interactions: a quantitative approach
incorporating pollinator behaviour
Christopher N. Kaiser-
Bunbury,1*‡ Stefanie Muff,2‡
Jane Memmott,3 Christine B.
Muller4† and Amedeo Caflisch2
1Ecosystem Management,
Institute of Terrestrial
Ecosystems, Swiss Federal
Institute of Technology (ETH)
Zurich, Universitatstrasse 16,
8092 Zurich, Switzerland2Department of Biochemistry,
University of Zurich,
Winterthurerstrasse 190, 8057
Zurich, Switzerland3School of Biological Sciences,
University of Bristol, Woodland
Road, Bristol BS8 1UG, UK4Institute of Evolutionary
Biology and Environmental
Studies, University of Zurich,
Winterthurerstrasse 190, 8057
Zurich, Switzerland
*Correspondence: E-mail:
[email protected]†Deceased 7 March 2008.‡These authors contributed
equally to this work.
Abstract
Species extinctions pose serious threats to the functioning of ecological communities
worldwide. We used two qualitative and quantitative pollination networks to simulate
extinction patterns following three removal scenarios: random removal and systematic
removal of the strongest and weakest interactors. We accounted for pollinator behaviour
by including potential links into temporal snapshots (12 consecutive 2-week networks) to
reflect mutualists� ability to �switch� interaction partners (re-wiring). Qualitative data
suggested a linear or slower than linear secondary extinction while quantitative data
showed sigmoidal decline of plant interaction strength upon removal of the strongest
interactor. Temporal snapshots indicated greater stability of re-wired networks over
static systems. Tolerance of generalized networks to species extinctions was high in the
random removal scenario, with an increase in network stability if species formed new
interactions. Anthropogenic disturbance, however, that promote the extinction of the
strongest interactors might induce a sudden collapse of pollination networks.
Keywords
Behaviour, complex networks, extinction, habitat restoration, Mauritius, mutualism,
network re-wiring, pollination.
Ecology Letters (2010)
I N T R O D U C T I O N
The stability of ecological networks has been a focus of
empirical and theoretical studies over several decades.
Most of our current understanding of interactions in
ecological communities derives from advances in preda-
tor–prey relationships in food web analyses (Polis 1998;
Sole & Montoya 2001; Dunne et al. 2002; Kondoh 2003;
Ives & Cardinale 2004; Montoya et al. 2006; Rooney et al.
2006). Although equally important, knowledge on the
stability of mutualistic interaction networks is less
developed, not least due to a lack of extensive and
highly resolved quantitative datasets of pollination and
seed dispersal communities.
Memmott et al. (2004) modelled the effect of mutualist
extinctions on the stability of two temperate qualitative
pollination networks and showed that preferential removal
of the most-linked pollinators, considered as the worst-case
scenario, resulted in a linear decline of plant species
diversity. With the recent increase in data quality, quanti-
tative analyses of ecological networks has revealed that
simply focusing on diversity and richness metrics may
disguise important changes in community structure and
ecosystem functions (Bascompte et al. 2006; Bascompte &
Jordano 2007; Tylianakis et al. 2007). In analyses of
mutualistic networks, for example, the use of quantitative
data has revealed strong asymmetrical dependencies (Bas-
compte et al. 2006; Vazquez et al. 2007). Furthermore,
Ecology Letters, (2010) doi: 10.1111/j.1461-0248.2009.01437.x
� 2010 Blackwell Publishing Ltd/CNRS
quantitative network parameters have revealed substantial
changes in food web structure depending on the degree of
habitat modification, which were not detected by their
qualitative counterparts (Tylianakis et al. 2007). To provide
accurate predictions of the stability of mutualistic networks
to human-induced extinctions, the ideal approach is to use
data from highly resolved, quantitative networks assembled
over entire field seasons.
The lability of species interactions presents another
challenge when analysing mutualistic systems. Like other
ecological networks, the structure of pollination networks
changes continually as pollinators switch plant species in
response to the availability of resources and plant species
attracting a changing pollinator assemblage throughout the
season depending on pollinator phenology. The importance
of such behavioural shifts to community persistence was
clearly shown for food webs where switches in food choice
were shown to stabilize food webs (Kondoh 2003). So far, few
studies have considered behaviour in mutualistic networks,
and those studies that have considered it, have analysed
qualitative data (Petanidou 1991; Medan et al. 2002, 2006;
Lundgren & Olesen 2005; Basilio et al. 2006; Fortuna &
Bascompte 2006; Olesen et al. 2008; Petanidou et al. 2008).
Plant–pollinator communities are dynamic systems in which
species enter and exit frequently, causing interactions to
establish, break down or vary substantially in frequency. This
�re-wiring� has not yet been investigated in plant–pollinator
communities despite its known prevalence. Moreover, re-
wiring does not only include shifts of entire interactions but
also shifts in the frequencies of mutual dependencies meaning
that the standard network parameters do not change, but
quantitative parameters such as interaction evenness could
undergo large changes (see Tylianakis et al. 2007).
The stability of mutualistic networks can be affected by a
range of human-induced processes. Species and population
extinctions, the introduction of invasive species, and habitat
restoration are only a few examples of anthropogenic
changes in community composition and function. While
advances in the analysis of complex ecological networks
have furthered understanding of invasion processes (Mor-
ales & Aizen 2006; Lopezaraiza-Mikel et al. 2007; Aizen et al.
2008) we know little about how habitat restoration rebuilds
ecological interactions in the system (but see Forup et al.
2008). Human-induced extinctions of populations and
species impose a serious threat to biodiversity (Hughes
et al. 1997; Sala et al. 2000), and by working with ecological
networks, ecologists can begin to predict how the current
wave of extinctions will affect ecosystems and their
functioning (Tylianakis 2008).
In this study, we investigate the stability of mutualistic
interactions by using two of the most comprehensive and
temporally highly resolved pollination networks collected to
date, and by accounting for behavioural processes in these
communities. We draw on two published, fully quantitative
pollination networks from Mauritius (Kaiser-Bunbury et al.
2009) to predict the resistance of dynamic mutualistic
networks to species extinction. We ask two basic questions:
(1) are quantitative networks more sensitive in detecting
biological processes and therefore show different and
potentially more realistic extinction patterns under different
modelling scenarios compared with qualitative networks? (2)
accounting for behaviour, do networks with re-wiring prove
more stable compared with networks without re-wiring, as
species loss will be ameliorated by newly established
connections? We selected the two Mauritian networks –
one restored site from which all introduced plants were
removed, and one unrestored invaded site – to assess the
impact of dominant exotic plant species on the robustness
of plant–pollinator communities to extinction.
M E T H O D S
Study system
The pollination networks were collected between September
2003 and March 2004 at two sites at Petrin on Mauritius
(20�42¢ S, 57�44¢ E). One of the communities, the restored
site (6.2 ha), has been regularly managed since 1994 by
manual removal of all exotic plants. The unrestored, heavily
invaded site was of equal size and located c. 0.54 km from the
restored site. In terms of native plant species richness and
abundance both sites represent a similar sample of the original
heath community in Mauritius (Vaughan & Wiehe 1937). The
major difference between the plant communities of the two
sites was the dominance of exotic plants at the unrestored site.
While the pollination webs differed in size, reflecting higher
floral and pollinator species richness and abundance at the
restored site, network structure appeared to be similar. For a
detailed description of site characteristics and plant–pollina-
tor communities see Kaiser-Bunbury et al. (2009).
Data collection and quantification
The networks contained 74 and 64 species of woody
flowering species and 135 and 100 pollinator species with a
total of 744 and 534 species interactions at the restored and
the unrestored site respectively. Flowering herbaceous
species were almost absent from both sites, and those that
were present, primarily orchids, occurred in such low
numbers and with unpredictable flowering times that they
could not be included in the network. Floral abundance was
recorded following a stratified sampling scheme along 23
parallel transects at each site. We conducted random flower
counts in 10 cubic metres along each transect every 2 weeks
for 12 consecutive fortnights (230 cubes ⁄ site ⁄ fortnight).
Pollination interactions were recorded by timed observa-
2 C. N. Kaiser-Bunbury et al. Letter
� 2010 Blackwell Publishing Ltd/CNRS
tions, of 30 min duration, on randomly selected flowering
individuals across the study site. Each flowering species was
observed on average for 1.84 ± 0.5 h (mean ± SD;
restored) and 1.72 ± 0.6 h (unrestored) during each 2-week
period, amounting to 471 and 387.5 h across the full season
in the restored and the unrestored site respectively. We
recorded the identity of all flower visitors that touched the
sexual parts of flowers, the number of flowers observed, and
the number of visits by each pollinator. Each visitor
approaching a flowering plant was considered a separate
visit and the majority of pollinators were pollen collec-
tors ⁄ feeders such as beetles and flies (see Kaiser 2006;
Kaiser-Bunbury et al. 2009). We used the total number of
visits of each animal species as pollinator abundance.
Floral abundance is expressed as the mean number of
flowers (F ) per cubic metre (F m)3 ). We used visitation
frequency as a measure of mutual interaction strength
between a plant and an animal species (Vazquez et al. 2005;
Sahli & Conner 2007), and defined normalized interaction
strength LN(i,j) as the total number of visits (V ) per flower
per hour (h) (V ⁄ F · h) of animal species i. Absolute
interaction strength LA(i, j) between animal species i and
plant species j is then defined as LN(i, j) times the floral
abundance F m)3 of plant j. That is, each visit was
quantified based on the floral abundance of the interaction
partner, thus the unit of LA is V hm)3. The interaction
strength of a species then corresponds to the sum of the
strengths of all interactions in which a species is involved,
i.e. NAðiÞ ¼P
j
LAði; jÞ and NAð jÞ ¼P
i
LAði; jÞ for ani-
mals and plants, respectively, and the total interaction
strength present in the network sums up to
NA ¼P
i
NAðiÞ ¼P
j
NAð jÞ. Both networks are strongly
asymmetrical, with a few highly generalized abundant
species and many specialized rare species (Kaiser-Bunbury
et al. 2009), whereby the level of generalization refers to the
number of mutualistic partners in the community.
In addition to the full-season networks, we used 12
temporal networks each representing a 2-week subsection
of the full-season networks. The recording of floral
abundance and pollinator activity was carried out repeat-
edly at 2-week intervals throughout the flowering season.
Thus, each temporal network represents a defined tempo-
ral sub-unit of the full-season networks (see also Kaiser
2006; Kaiser-Bunbury et al. 2009). These 2-week webs are
referred to forthwith as �temporal snapshots�. In compar-
ison with full-season networks, the temporal snapshots
reflect more realistic network structures as they include
only species with existent phenological or morphological
overlap, i.e. no forbidden links (sensu Vazquez 2005).
While forbidden links have often been overlooked in the
analysis of mutualistic networks (Olesen & Jordano 2002),
they may act as an obstacle when modelling species
extinction as they inflate the number of potential links and,
consequently, overestimate network stability. In addition,
as plant–pollinator communities are subject to continuous
spatial and temporal change in species composition,
temporal snapshots can be used to investigate whether
network structure is inherent to the system or if it changes
throughout the season.
Qualitative and quantitative species removal simulations
We removed plants and pollinators from both networks
following three extinction scenarios: systematic removal
from the strongest interactor (either plant or pollinator
species), systematic removal from the weakest interactor and
random removal without replacement, where a species was
considered to be extinct if it was left without plant host or
animal pollinator. Similar to Memmott et al. (2004) and
Dunne et al. (2002), random removal represents a null model
with which to compare two types of systematic removal.
Removal from the weakest interactor simulates a potential
extinction sequence as weakly linked plants and pollinators
appear at greatest risk of real-world extinction (Rathcke &
Jules 1993; Olesen & Jain 1994), and the removal from the
strongest interactor explores the �attack tolerance� of
networks to loss of highly connected nodes (see Albert et al.
2000; Sole & Montoya 2001; Dunne et al. 2002).
We use both full-season networks and temporal snapshots
to assess the effect of species removal on interaction partners
under a restoration scenario, the plot where the dominant
introduced plant species have been removed and the adjacent
control plot. While there is no replication of the treatment
effect, this analysis provides a first approximation of the
short-term impact of removing dominant food supplies (see
Lopezaraiza-Mikel et al. 2007; Bartomeus et al. 2008) from a
pollination network. The removal of alien plants is a feature
of most restoration programmes, but the impact of this
management approach on ecological networks is rarely
considered (Carvalheiro et al. 2008; Dixon 2009).
Qualitative models
Qualitative interaction data (i.e. presence ⁄ absence of inter-
actions) was used to model the effect of pollinator removal
on plant species diversity and vice versa. In this model each
species was considered to contribute equally to the fraction
of extinction among pollinators or plants, e.g. if originally the
network contains 10 plant species and one species becomes
extinct, 10% of the plants are considered to be extinct. These
analyses were carried out on both entire networks and on the
12 temporal snapshots of each full-season network.
Quantitative models
Having fully-quantitative interaction networks allows a more
sophisticated model scenario than the qualitative models
described above. These are closer to natural processes
Letter Stability of pollination networks 3
� 2010 Blackwell Publishing Ltd/CNRS
because each species shows different interaction frequencies
and abundances in the system. Here, abundant and highly
linked pollinators or plants are considered more important
to the system than rare or specialized ones. Thus, the
extinction of a species i as a result of not being visited was
given the impact corresponding to its interaction strength
NA(i ), meaning that the total interaction strength present in
the network NA declines immediately by the amount NA(i )
once the species i dies out. Thus, the removal of different
species leads to different levels of surviving interaction
strength NA. As above, the analyses were carried out on the
two entire networks and the 12 temporal snapshots of each
network (for network data see Appendix S6).
Adding behaviour to the networks
The two full-season networks provide an estimate of all the
potential interactions in the network and this information
can be used to add behavioural shifts to the 12 snapshots as
follows. All interactions observed at least once in each full-
season network were considered potential links and these
were used as �re-wiring� options for potentially disrupted
links of the respective temporal networks, i.e. dietary
switches leading to new links in the 12 temporal snapshots.
We applied models described above to the temporal
snapshots accounting for re-wiring processes. Models were
calculated for temporal snapshot based on the species and
interaction strength observed in the respective fortnight,
and the potential links derived from the full-season networks
accounting for re-wiring. For example, when a pollinator
species i in the temporal snapshot t1 lost all interactions as a
consequence of the extinction of its mutualistic partners,
i will remain in the model with its full interaction strength if
t1 contains plant species with which i interacted at any other
time throughout the season. Thus, in contrast to previous
studies which used additional re-wiring modelling assump-
tions, such as preferential attachment (e.g. Olesen et al.
2008), we applied information on potential re-wiring links
derived from the empirical information available in the full-
season networks. No species were added to temporal
snapshots to avoid false assumptions on phenological
overlap. Similarly, species interaction strength did not
change following re-wiring in the models. Interactions
strength NA was used to define the importance of
mutualistic species in the network, and the species�properties remained the same throughout the modelling.
R E S U L T S
Qualitative and quantitative species removal simulations
Qualitative models
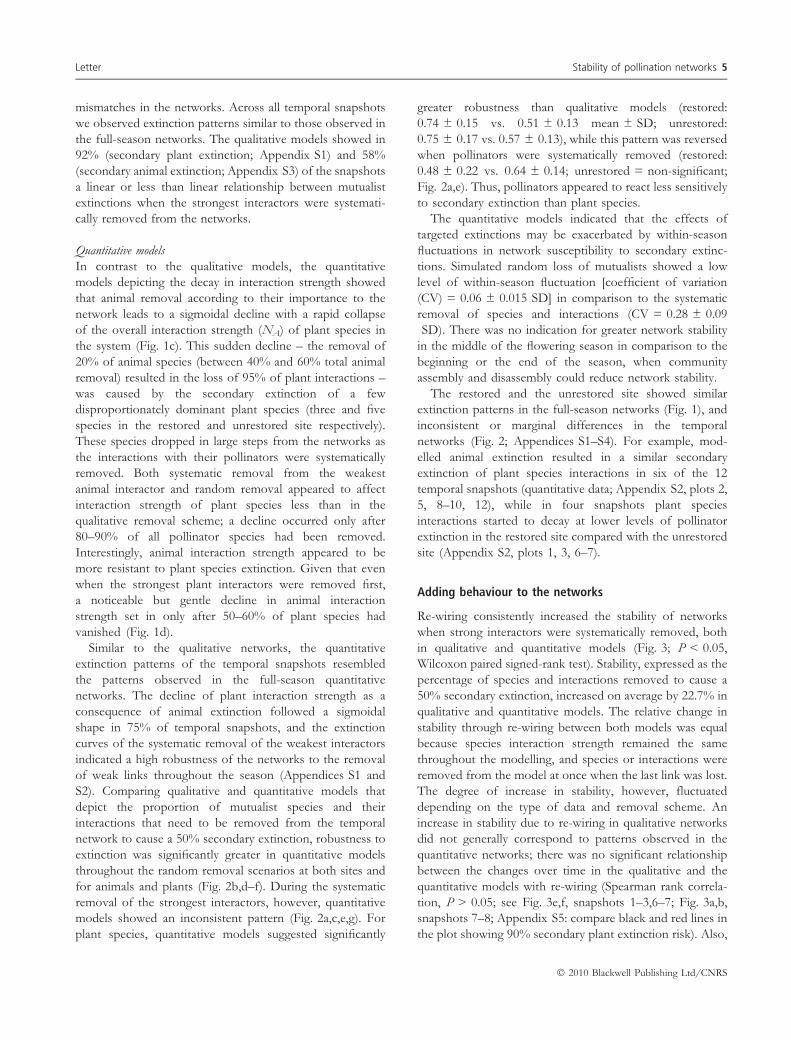
For both communities, the decay of pollinator- and plant
species richness with mutualist loss for the three extinction
scenarios (systematic removal from the strongest interactor,
systematic removal from the weakest interactor and random
removal) are depicted in Fig. 1. The extinction patterns of
plant and pollinators in the qualitative models were, at most,
linear (removal of strongest interactors), and the decay was
much slower than linear as plant and pollinators were
removed randomly from the networks (Fig. 1a,b).
We used temporal snapshots from each site to investigate
whether the observed patterns were consistent throughout
the season and independent of network size and phenological
(a) (b)
(c) (d)
Figure 1 Extinction plots upon systematic
removal from the strongest or weakest
interactor, and random removal. (a, b)
Qualitative data, i.e. presence ⁄ absence of
interactions; (c, d) quantitative data, i.e.
interaction strength, both for the full-season
networks. Thick lines (restored site) and thin
lines (unrestored site) show extinction pat-
terns of the different restoration schemes.
The left panels (a, c) displays the decline of
plant species and interaction strength fol-
lowing the removal of animal species, and
the right panels (b, d) display the decline of
animal species and interaction strength
following the removal of plant species.
4 C. N. Kaiser-Bunbury et al. Letter
� 2010 Blackwell Publishing Ltd/CNRS
mismatches in the networks. Across all temporal snapshots
we observed extinction patterns similar to those observed in
the full-season networks. The qualitative models showed in
92% (secondary plant extinction; Appendix S1) and 58%
(secondary animal extinction; Appendix S3) of the snapshots
a linear or less than linear relationship between mutualist
extinctions when the strongest interactors were systemati-
cally removed from the networks.
Quantitative models
In contrast to the qualitative models, the quantitative
models depicting the decay in interaction strength showed
that animal removal according to their importance to the
network leads to a sigmoidal decline with a rapid collapse
of the overall interaction strength (NA) of plant species in
the system (Fig. 1c). This sudden decline – the removal of
20% of animal species (between 40% and 60% total animal
removal) resulted in the loss of 95% of plant interactions –
was caused by the secondary extinction of a few
disproportionately dominant plant species (three and five
species in the restored and unrestored site respectively).
These species dropped in large steps from the networks as
the interactions with their pollinators were systematically
removed. Both systematic removal from the weakest
animal interactor and random removal appeared to affect
interaction strength of plant species less than in the
qualitative removal scheme; a decline occurred only after
80–90% of all pollinator species had been removed.
Interestingly, animal interaction strength appeared to be
more resistant to plant species extinction. Given that even
when the strongest plant interactors were removed first,
a noticeable but gentle decline in animal interaction
strength set in only after 50–60% of plant species had
vanished (Fig. 1d).
Similar to the qualitative networks, the quantitative
extinction patterns of the temporal snapshots resembled
the patterns observed in the full-season quantitative
networks. The decline of plant interaction strength as a
consequence of animal extinction followed a sigmoidal
shape in 75% of temporal snapshots, and the extinction
curves of the systematic removal of the weakest interactors
indicated a high robustness of the networks to the removal
of weak links throughout the season (Appendices S1 and
S2). Comparing qualitative and quantitative models that
depict the proportion of mutualist species and their
interactions that need to be removed from the temporal
network to cause a 50% secondary extinction, robustness to
extinction was significantly greater in quantitative models
throughout the random removal scenarios at both sites and
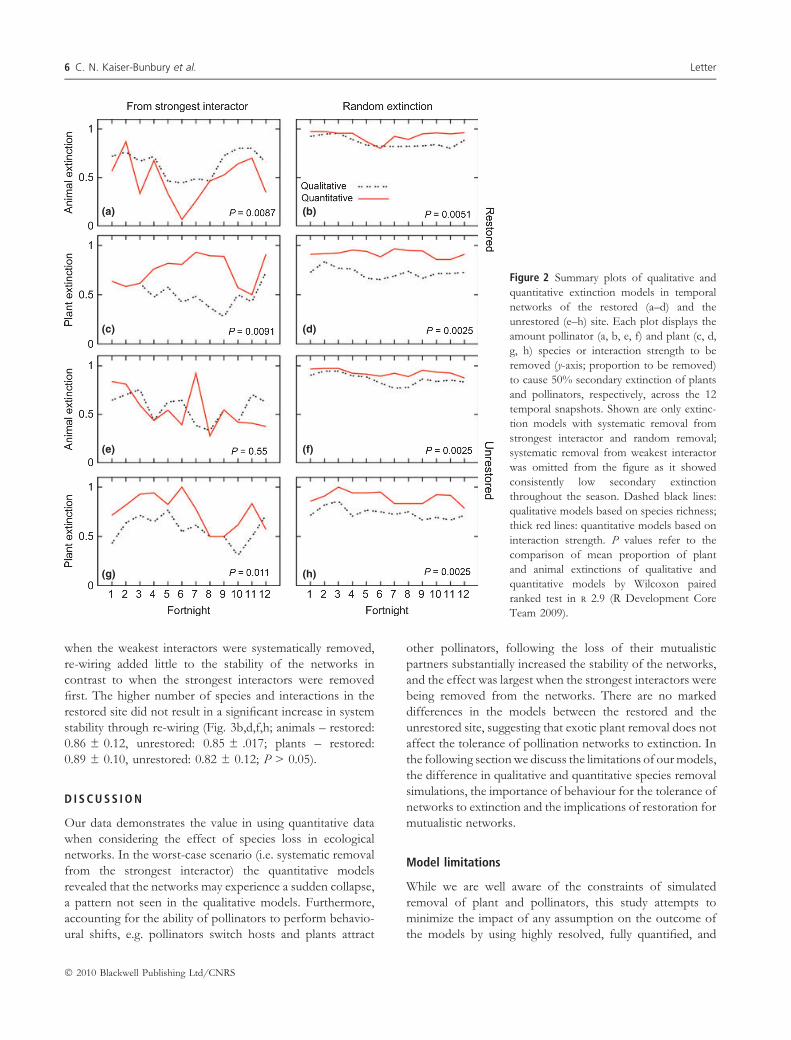
for animals and plants (Fig. 2b,d–f). During the systematic
removal of the strongest interactors, however, quantitative
models showed an inconsistent pattern (Fig. 2a,c,e,g). For
plant species, quantitative models suggested significantly
greater robustness than qualitative models (restored:
0.74 ± 0.15 vs. 0.51 ± 0.13 mean ± SD; unrestored:
0.75 ± 0.17 vs. 0.57 ± 0.13), while this pattern was reversed
when pollinators were systematically removed (restored:
0.48 ± 0.22 vs. 0.64 ± 0.14; unrestored = non-significant;
Fig. 2a,e). Thus, pollinators appeared to react less sensitively
to secondary extinction than plant species.
The quantitative models indicated that the effects of
targeted extinctions may be exacerbated by within-season
fluctuations in network susceptibility to secondary extinc-
tions. Simulated random loss of mutualists showed a low
level of within-season fluctuation [coefficient of variation
(CV) = 0.06 ± 0.015 SD] in comparison to the systematic
removal of species and interactions (CV = 0.28 ± 0.09
SD). There was no indication for greater network stability
in the middle of the flowering season in comparison to the
beginning or the end of the season, when community
assembly and disassembly could reduce network stability.
The restored and the unrestored site showed similar
extinction patterns in the full-season networks (Fig. 1), and
inconsistent or marginal differences in the temporal
networks (Fig. 2; Appendices S1–S4). For example, mod-
elled animal extinction resulted in a similar secondary
extinction of plant species interactions in six of the 12
temporal snapshots (quantitative data; Appendix S2, plots 2,
5, 8–10, 12), while in four snapshots plant species
interactions started to decay at lower levels of pollinator
extinction in the restored site compared with the unrestored
site (Appendix S2, plots 1, 3, 6–7).
Adding behaviour to the networks
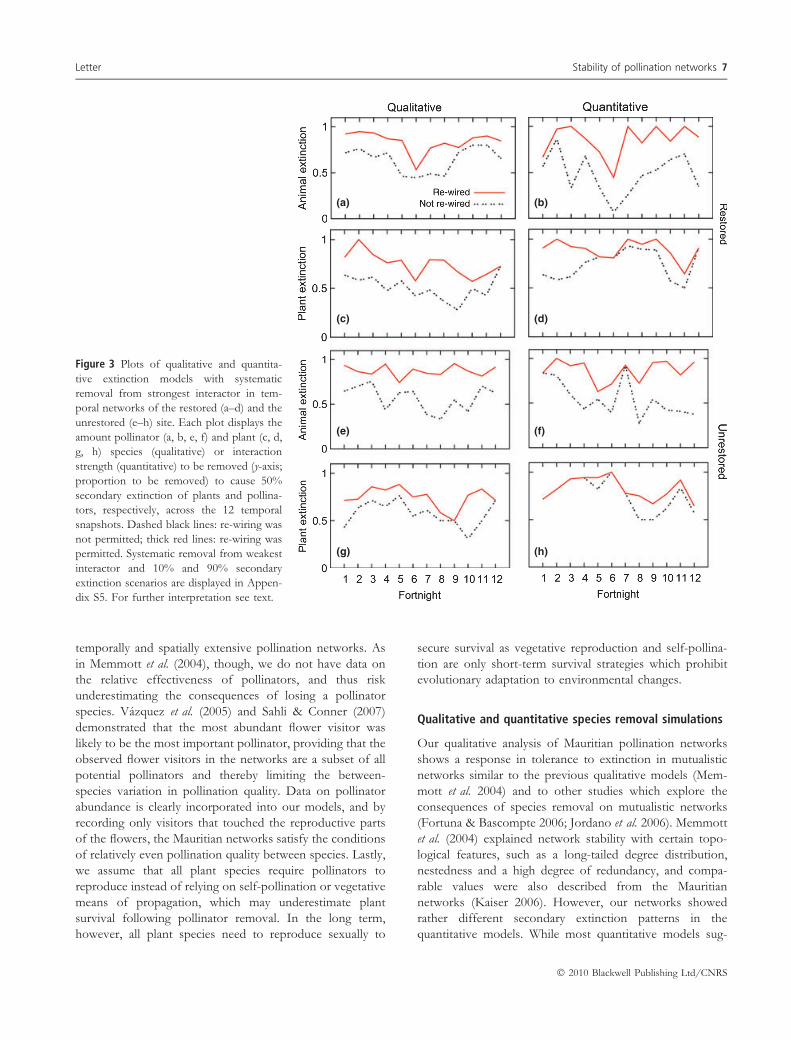
Re-wiring consistently increased the stability of networks
when strong interactors were systematically removed, both
in qualitative and quantitative models (Fig. 3; P < 0.05,
Wilcoxon paired signed-rank test). Stability, expressed as the
percentage of species and interactions removed to cause a
50% secondary extinction, increased on average by 22.7% in
qualitative and quantitative models. The relative change in
stability through re-wiring between both models was equal
because species interaction strength remained the same
throughout the modelling, and species or interactions were
removed from the model at once when the last link was lost.
The degree of increase in stability, however, fluctuated
depending on the type of data and removal scheme. An
increase in stability due to re-wiring in qualitative networks
did not generally correspond to patterns observed in the
quantitative networks; there was no significant relationship
between the changes over time in the qualitative and the
quantitative models with re-wiring (Spearman rank correla-
tion, P > 0.05; see Fig. 3e,f, snapshots 1–3,6–7; Fig. 3a,b,
snapshots 7–8; Appendix S5: compare black and red lines in
the plot showing 90% secondary plant extinction risk). Also,
Letter Stability of pollination networks 5
� 2010 Blackwell Publishing Ltd/CNRS
when the weakest interactors were systematically removed,
re-wiring added little to the stability of the networks in
contrast to when the strongest interactors were removed
first. The higher number of species and interactions in the
restored site did not result in a significant increase in system
stability through re-wiring (Fig. 3b,d,f,h; animals – restored:
0.86 ± 0.12, unrestored: 0.85 ± .017; plants – restored:
0.89 ± 0.10, unrestored: 0.82 ± 0.12; P > 0.05).
D I S C U S S I O N
Our data demonstrates the value in using quantitative data
when considering the effect of species loss in ecological
networks. In the worst-case scenario (i.e. systematic removal
from the strongest interactor) the quantitative models
revealed that the networks may experience a sudden collapse,
a pattern not seen in the qualitative models. Furthermore,
accounting for the ability of pollinators to perform behavio-
ural shifts, e.g. pollinators switch hosts and plants attract
other pollinators, following the loss of their mutualistic
partners substantially increased the stability of the networks,
and the effect was largest when the strongest interactors were
being removed from the networks. There are no marked
differences in the models between the restored and the
unrestored site, suggesting that exotic plant removal does not
affect the tolerance of pollination networks to extinction. In
the following section we discuss the limitations of our models,
the difference in qualitative and quantitative species removal
simulations, the importance of behaviour for the tolerance of
networks to extinction and the implications of restoration for
mutualistic networks.
Model limitations
While we are well aware of the constraints of simulated
removal of plant and pollinators, this study attempts to
minimize the impact of any assumption on the outcome of
the models by using highly resolved, fully quantified, and
(a) (b)
(c) (d)
(e) (f)
(g) (h)
Figure 2 Summary plots of qualitative and
quantitative extinction models in temporal
networks of the restored (a–d) and the
unrestored (e–h) site. Each plot displays the
amount pollinator (a, b, e, f) and plant (c, d,
g, h) species or interaction strength to be
removed (y-axis; proportion to be removed)
to cause 50% secondary extinction of plants
and pollinators, respectively, across the 12
temporal snapshots. Shown are only extinc-
tion models with systematic removal from
strongest interactor and random removal;
systematic removal from weakest interactor
was omitted from the figure as it showed
consistently low secondary extinction
throughout the season. Dashed black lines:
qualitative models based on species richness;
thick red lines: quantitative models based on
interaction strength. P values refer to the
comparison of mean proportion of plant
and animal extinctions of qualitative and
quantitative models by Wilcoxon paired
ranked test in R 2.9 (R Development Core
Team 2009).
6 C. N. Kaiser-Bunbury et al. Letter
� 2010 Blackwell Publishing Ltd/CNRS
temporally and spatially extensive pollination networks. As
in Memmott et al. (2004), though, we do not have data on
the relative effectiveness of pollinators, and thus risk
underestimating the consequences of losing a pollinator
species. Vazquez et al. (2005) and Sahli & Conner (2007)
demonstrated that the most abundant flower visitor was
likely to be the most important pollinator, providing that the
observed flower visitors in the networks are a subset of all
potential pollinators and thereby limiting the between-
species variation in pollination quality. Data on pollinator
abundance is clearly incorporated into our models, and by
recording only visitors that touched the reproductive parts
of the flowers, the Mauritian networks satisfy the conditions
of relatively even pollination quality between species. Lastly,
we assume that all plant species require pollinators to
reproduce instead of relying on self-pollination or vegetative
means of propagation, which may underestimate plant
survival following pollinator removal. In the long term,
however, all plant species need to reproduce sexually to
secure survival as vegetative reproduction and self-pollina-
tion are only short-term survival strategies which prohibit
evolutionary adaptation to environmental changes.
Qualitative and quantitative species removal simulations
Our qualitative analysis of Mauritian pollination networks
shows a response in tolerance to extinction in mutualistic
networks similar to the previous qualitative models (Mem-
mott et al. 2004) and to other studies which explore the
consequences of species removal on mutualistic networks
(Fortuna & Bascompte 2006; Jordano et al. 2006). Memmott
et al. (2004) explained network stability with certain topo-
logical features, such as a long-tailed degree distribution,
nestedness and a high degree of redundancy, and compa-
rable values were also described from the Mauritian
networks (Kaiser 2006). However, our networks showed
rather different secondary extinction patterns in the
quantitative models. While most quantitative models sug-
(a) (b)
(c) (d)
(e) (f)
(g) (h)
Figure 3 Plots of qualitative and quantita-
tive extinction models with systematic
removal from strongest interactor in tem-
poral networks of the restored (a–d) and the
unrestored (e–h) site. Each plot displays the
amount pollinator (a, b, e, f) and plant (c, d,
g, h) species (qualitative) or interaction
strength (quantitative) to be removed (y-axis;
proportion to be removed) to cause 50%
secondary extinction of plants and pollina-
tors, respectively, across the 12 temporal
snapshots. Dashed black lines: re-wiring was
not permitted; thick red lines: re-wiring was
permitted. Systematic removal from weakest
interactor and 10% and 90% secondary
extinction scenarios are displayed in Appen-
dix S5. For further interpretation see text.
Letter Stability of pollination networks 7
� 2010 Blackwell Publishing Ltd/CNRS

gested a higher degree of stability compared with the
qualitative models, one scenario in particular, systematic
removal of the most frequently visiting pollinator species,
triggered a sharp drop in plant visitations when 50–60% of
pollinator species were removed from the system. The lack
of quantitative information is likely to have been the reason
why Memmott et al. (2004) did not observe the collapse of
the system, which had previously been described in food
web studies (Sole & Montoya 2001; Dunne et al. 2002). One
possible explanation for this pattern is that many mutualistic
interactions are highly asymmetrical (Bascompte & Jordano
2007; Kaiser-Bunbury et al. 2009). Our models suggest that
under random removal scenarios, interaction asymmetry
contributes substantially to the stability of systems. For
example, the qualitative model of the full-season network
(Fig. 1b) shows that for 45% of animal species to be
affected by secondary extinction 75% of plant species need
to go extinct. In comparison, for 45% animal extinction in
the quantitative model, 98% of plants must be lost (Fig. 1d).
In contrast to qualitative data, which assume that observed
interactions are equally important, quantitative data account
for asymmetries in mutualist dependence measured as
interaction strength. Although it was suggested that strong
asymmetrical interactions in food webs can destabilize
networks (May 1973; McCann et al. 1998; Albert et al. 2000;
but see Rooney et al. 2006), it is now widely considered that
asymmetry in fact contributes to the stability of mutualistic
systems (Vazquez & Aizen 2004; Bascompte et al. 2006;
Vazquez et al. 2007). This can also be seen in the higher
sensitivity of plants to secondary extinction compared with
pollinators (see Fig. 1). Abundant and highly linked pollin-
ators interacted both with a few dominant and many rare
plant species, while dominant plant species were visited to a
higher degree by equally dominant pollinator species (see
also Kaiser 2006). Consequently, the systematic removal of
the strongest interactors affected the plant community more
severely than pollinator community. Thus, neglecting
quantitative data on interaction frequency is likely to result
in an underestimate of network stability when extinction
acts at random, over evolutionary timescales, and an
overestimate when key pollinators die out selectively, either
induced by humans or through rare natural catastrophes.
In natural communities, the systematic removal of the
strongest animal mutualist is less probable than random or
selective extinctions of rare and specialized mutualists.
Nevertheless, anthropogenic actions and ecological pro-
cesses can indeed result in the selective decline and local
extinction of the most abundant species in the system.
Bumble bees, for example, which are important pollinators
of many crops and wildflowers, have declined rapidly in
many parts of Europe and North America (Williams 1982;
Goulson et al. 2008 and reference therein), causing associ-
ated plant species to decline in the Netherlands and the UK
(Biesmeijer et al. 2006). Although those scenarios are likely
to be rare events, the modelling of such worst-case scenarios
furthers our understanding of complex network structure
and clearly demonstrates that quantitative data is crucial for
modelling species loss in ecological networks.
Rather predictable was the insignificant impact of the
systematic removal of weakest interactors on secondary
extinction in qualitative and quantitative models of the full-
season networks. The qualitative models of the temporal
snapshots, however, depicted a pattern similar to that
described by Dunne et al. (2002); a quarter of the snapshots
showed relatively high secondary extinctions (Appendi-
ces S1 and S3; plot 7 and plots 1, 6, 8–9, 11 respectively)
indicating a disproportionately large negative effect caused
by topologically insignificant species. Such patterns were
absent in the quantitative models (Appendices S2 and S4),
which suggests that the impact of rare and specialized
species on secondary extinction was overrated in the
qualitative models, and that natural systems are relatively
resistant to the systematic removal of weak interactors.
Adding behaviour to the networks
In our models, we made use of the extensive information on
pair-wise interactions provided by the full-season networks
and used this information to incorporate behaviour
(re-wiring) into the temporal networks. Although pollinator
behaviour is not accounting for the only potential shift in
mutualistic networks, e.g. a change in plant phenology due
to global warming can result in temporal shifts within
networks, such shifts are far less likely to occur and happen
on a larger temporal scale than re-wiring processes due to
changes in pollinator behaviour. Along with behavioural and
phenological shifts in pollinators and plants respectively,
changes in abundance can increase absolute morphological
and phenological variability of both plants and pollinators,
which can further result in alterations in mutualistic
interactions on a relatively short temporal scale. While
these temporal fluctuations may play a role in the stability of
pollination networks, we focus here primarily on the
behavioural changes of pollinators which can, due to their
mobility, react quickly to alterations in resource availability.
Our results suggest that re-wiring buffers the impact of
species loss by indirectly increasing connectance and,
thereby, adds to the stability of the system (Dunne et al.
2002). Re-wiring relies heavily on the presence of a
sufficient diversity of species and interactions to create a
pool for potential re-wiring options. For example, Mauritian
pollinators appeared to be more vulnerable to secondary
extinction at times when few plant species were flowering in
the community (e.g. Appendix S3, plots 1, 9). Such
fluctuations in flowering species can occur naturally at the
beginning and the end of the season or they can be human-
8 C. N. Kaiser-Bunbury et al. Letter
� 2010 Blackwell Publishing Ltd/CNRS

induced through, e.g. regular mowing of meadows, habitat
destruction, or logging.
Re-wiring processes may be easier in generalized systems
with fewer forbidden links due to long overlapping pheno-
phases in plants and the presence of pollinators with broad
diets. Re-wiring allows species to change their tolerance to
perturbations in the systems and consequently modifies the
order of secondary extinction. Rare species and specialists are
at greater risk of extinction (e.g. Gilbert et al. 1998), but
through re-wiring they may become more important to the
system after other species go extinct. Those species may
ameliorate the stability of the networks and may have
contributed to the greater robustness of the models in which
behavioural shifts were permitted (see Fig. 3).
Comparison of the two networks
There was no consistent difference between the response of
the restored and control plot to simulated species loss.
Forup et al. (2008) reported a trend towards increased
robustness in restored plots, but they were limited in their
analysis by a small sample size, a limitation even more
apparent here. In reality, the only way to determine the
impact of restoration on network structure is to have a
sample size sufficient for a robust statistical analysis (e.g. see
Henson et al. 2009). There is a trade-off between network
quality and network quantity, and it is simply time- and cost-
prohibitive to construct a large number of detailed biotic
networks. However, there are ways around this problem.
For example, Tylianakis et al. (2007) solved it by using a
simple, replicable method of bioassaying the local parasitoid
community at 48 sites. While their method entailed intensive
rearing of natural enemies, it did not require long hours of
observation in the field.
C O N C L U S I O N
We used quantitative interaction data to investigate the
effects of the loss of species and interactions at the
community level on pollination networks in Mauritius.
These data revealed that species loss had a strong impact on
the networks, with the loss of 50–60% of the 24 most
connected animals (but not plants) causing a sudden and
rapid collapse of the total interaction strength, a pattern
which was not seen using the qualitative models. While this
is an extreme scenario, anthropogenic modifications and
disturbances to natural systems may create the conditions
that increase the probability of these worst-case scenarios,
for example the simultaneous declines of bumble bees and
honey bees (e.g. Williams 1982; Oldroyd 2007). Our work
has shown that having detailed qualitative networks is not
necessarily sufficient when predicting the effects of species
loss on network structure. Including quantitative informa-
tion on the frequency of interactions in our simulations
significantly changed the impact of species loss on the
networks. Moreover, adding behaviour to the networks also
affected the simulation output, substantually ameliorating
the impact of species loss. Increasing the realism of the
ecological networks we use when predicting the expected
impacts of environmental changes is likely to amplify our
prediction powers and thereby our understanding of natural
ecosystems.
A C K N O W L E D G E M E N T S
We are grateful to the National Parks and Conservation
Service Mauritius and the Mauritian Wildlife Foundation for
permission to work in the National Park and for logistic
support. We thank D. Hansen, N. Bunbury and four
anonymous reviewers for their thoughtful comments on
earlier drafts of the manuscript. Funding was partly
provided to CNKB (PBZHA3-117022), CBM (631-
065950) and AC by the Swiss National Science Foundation.
R E F E R E N C E S
Aizen, M.A., Morales, C.L. & Morales, J.M. (2008). Invasive mu-
tualists erode native pollination webs. PLoS Biol., 6, 396–403.
Albert, R., Jeong, H. & Barabasi, A.L. (2000). Attack and error
tolerance of complex networks. Nature, 406, 378–382.
Bartomeus, I., Vila, M. & Santamarıa, L. (2008). Contrasting effects
of invasive plants in plant–pollinator networks. Oecologia, 155,
761–770.
Bascompte, J. & Jordano, P. (2007). Plant-animal mutualistic net-
works: the architecture of biodiversity. Ann. Rev. Ecol. Evol. Syst.,
38, 567–593.
Bascompte, J., Jordano, P. & Olesen, J.M. (2006). Asymmetric
coevolutionary networks facilitate biodiversity maintenance. Sci-
ence, 312, 431–433.
Basilio, A.M., Medan, D., Torretta, J.P. & Bartoloni, N.J. (2006).
A year-long plant-pollinator network. Austral Ecol., 31, 975–983.
Biesmeijer, J.C., Roberts, S.P.M., Reemer, M., Ohlemuller, R.,
Edwards, M., Peeters, T. et al. (2006). Parallel declines in poll-
inators and insect-pollinated plants in Britain and the Nether-
lands. Science, 313, 351–354.
Carvalheiro, L.G., Barbosa, E.R.M. & Memmott, J. (2008). Polli-
nator networks, alien species and the conservation of rare plants:
Trinia glauca as a case study. J. Appl. Ecol., 45, 1419–1427.
Dixon, K.W. (2009). Pollination and Restoration. Science, 325, 571–
573.
Dunne, J.A., Williams, R.J. & Martinez, N.D. (2002). Network
structure and biodiversity loss in food webs: robustness
increases with connectance. Ecol. Lett., 5, 558–567.
Fortuna, M.A. & Bascompte, J. (2006). Habitat loss and the
structure of plant-animal mutualistic networks. Ecol. Lett., 9,
278–283.
Forup, M.L., Henson, K.S.E., Craze, P.G. & Memmott, J. (2008).
The restoration of ecological interactions: plant-pollinator net-
works on ancient and restored heathlands. J. Appl. Ecol., 45,
742–752.
Letter Stability of pollination networks 9
� 2010 Blackwell Publishing Ltd/CNRS
Gilbert, F., Gonzalez, A. & Evans-Freke, I. (1998). Corridors
maintain species richness in the fragmented landscapes of a
microecosystem. Proc. R. Soc. Lond. B Biol. Sci., 265, 577–582.
Goulson, D., Lye, G.C. & Darvill, B. (2008). Decline and con-
servation of Bumble bees. Annu. Rev. Entomol., 53, 191–208.
Henson, K.S.E., Grace, P.G. & Memmott, J. (2009). The restora-
tion of parasites, parasitoids, and pathogens to heathland com-
munities. Ecology, Vol 90, 1840–1851.
Hughes, J.B., Daily, G.C. & Ehrlich, P.R. (1997). Population
diversity: its extent and extinction. Science, 278, 689–692.
Ives, A.R. & Cardinale, B.J. (2004). Food-web interactions govern
the resistance of communities after non-random extinctions.
Nature, 429, 174–177.
Jordano, P., Bascompte, J. & Olesen, J.M. (2006). The ecological
consequences of complex topology and nested structure in
pollination webs. In: Plant-Pollinator Interactions: From Specialization
to Generalization (eds Waser, N.M. & Ollerton, J.). The University
of Chicago Press, Chicago, pp. 173–199.
Kaiser, C.N. (2006). Functional integrity of plant-pollinator communities in
restored habitats in Mauritius. PhD Dissertation, Institute of Envi-
ronmental Sciences. University of Zurich, Zurich, Switzerland.
Kaiser-Bunbury, C.N., Memmott, J. & Muller, C.B. (2009). Com-
munity structure of pollination webs of Mauritian heathland
habitats. Perspect. Plant Ecol. Evol. Syst., 11, 241–254.
Kondoh, M. (2003). Foraging adaptation and the relationship be-
tween food-web complexity and stability. Science, 299, 1388–
1391.
Lopezaraiza-Mikel, M.E., Hayes, R.B., Whalley, M.R. & Memmott, J.
(2007). The impact of an alien plant on a native plant pollinator
network: an experimental approach. Ecol. Lett., 10, 539–550.
Lundgren, R. & Olesen, J.M. (2005). The dense and highly con-
nected world of Greenland�s plants and their pollinators. Arct.
Antarct. Alp. Res., 37, 514–520.
May, R.M. (1973). Stability and Complexity in Model Ecosystems.
Princeton University Press, Princeton, NJ.
McCann, K., Hastings, A. & Huxel, G.R. (1998). Weak trophic
interactions and the balance of nature. Nature, 395, 794–798.
Medan, D., Montaldo, N.H., Devoto, M., Mantese, A., Vasellati, V.
& Bartoloni, N.H. (2002). Plant–pollinator relationships at two
altitudes in the Andes of Mendoza, Argentina. Arct. Antarct. Alp.
Res., 34, 233–241.
Medan, D., Basilio, A.M., Devoto, M., Bartoloni, N.J., Torretta, J.P.
& Petanidou, T. (2006). Measuring generalization and connec-
tance in temperate, year-long active systems. In: Plant-Pollinator
Interactions: From Specialization to Generalization (eds Waser, N.M. &
Ollerton, J.). The University of Chicago Press, Chicago, pp. 245–
259.
Memmott, J., Waser, N.M. & Price, M.V. (2004). Tolerance of
pollination networks to species extinctions. Proc. R. Soc. Lond.
B, 271, 2605–2611.
Montoya, J.M., Pimm, S.L. & Sole, R.V. (2006). Ecological net-
works and their fragility. Nature, 442, 259–264.
Morales, C.L. & Aizen, M.A. (2006). Invasive mutualisms and the
structure of plant-pollinator interactions in the temperate forests
of north-west Patagonia, Argentina. J. Ecol., 94, 171–180.
Oldroyd, B.P. (2007). What�s killing American honey bees? PLoS
Biol., 5, e168.
Olesen, J.M. & Jain, S.K. (1994). Fragmented plant populations and
their lost interactions. In: Conservation Genetics (eds Loeschcke, V.,
Tomiuk, J. & Jain, S.K.). Birkhauser Verlag, Basel, pp. 417–426.
Olesen, J.M. & Jordano, P. (2002). Geographic patterns in plant-
pollinator mutualistic networks. Ecology, 83, 2416–2424.
Olesen, J.M., Bascompte, J., Elberling, H. & Jordano, P. (2008).
Temporal dynamics in a pollination network. Ecology, 89, 1573–
1582.
Petanidou, T. (1991). Pollination Ecology in a Phryganic Ecosystem. PhD
Dissertation, Aristotelian University Thessaloniki, Thessaloniki,
Greece.
Petanidou, T., Kallimanis, A.S., Tzanopoulos, J., Sgardelis, S.P. &
Pantis, J.D. (2008). Long-term observation of a pollination
network: fluctuation in species and interactions, relative invari-
ance of network structure and implications for estimates of
specialization. Ecol. Lett., 11, 564–575.
Polis, G.A. (1998). Stability is woven by complex webs. Nature, 395,
744–745.
R Development Core Team (2009). R: A Language and Environment
for Statistical Computing. R Foundation for Statistical Computing,
Vienna.
Rathcke, B.J. & Jules, E.S. (1993). Habitat fragmentation and plant-
pollinator interactions. Curr. Sci., 65, 273–277.
Rooney, N., McCann, K., Gellner, G. & Moore, J.C. (2006).
Structural asymmetry and the stability of diverse food webs.
Nature, 442, 265–269.
Sahli, H.F. & Conner, J.K. (2007). Visitation, effectiveness, and
efficiency of 15 genera of visitors to wild radish, Raphanus
raphanistrum (Brassicaceae). Am. J. Bot., 94, 203–209.
Sala, O.E., Chapin, F.S. III, Armesto, J.J., Berlow, E., Bloomfield,
J., Dirzo, R. et al. (2000). Global biodiversity scenarios for the
year 2100. Science, 287, 1770–1774.
Sole, R.V. & Montoya, M. (2001). Complexity and fragility in eco-
logical networks. Proc. R. Soc. Lond. B Biol. Sci., 268, 2039–2045.
Tylianakis, J.M. (2008). Understanding the web of life: the birds,
the bees, and sex with aliens. PLoS Biol., 6, e47.
Tylianakis, J.M., Tscharntke, T. & Lewis, O.T. (2007). Habitat
modification alters the structure of tropical host-parasitoid food
webs. Nature, 445, 202–205.
Vaughan, R.E. & Wiehe, P.O. (1937). Studies on the vegetation of
Mauritius: I. A preliminary survey of the plant communities.
J. Ecol., 25, 289–343.
Vazquez, D.P. (2005). Degree distribution in plant-animal mutu-
alistic networks: forbidden links or random interactions? Oikos,
108, 421–426.
Vazquez, D.P. & Aizen, M.A. (2004). Asymmetric specialization: a
pervasive feature of plant-pollinator interactions. Ecology, 85,
1251–1257.
Vazquez, D.P., Morris, W.F. & Jordano, P. (2005). Interaction
frequency as a surrogate for the total effect of animal mutualists
on plants. Ecol. Lett., 8, 1088–1094.
Vazquez, D.P., Melian, C.J., Williams, N.M., Bluthgen, N., Kras-
nov, B.R. & Poulin, R. (2007). Species abundance and asym-
metric interaction strength in ecological networks. Oikos, 116,
1120–1127.
Williams, P.H. (1982). The distribution and decline of British
bumble bees (Bombus Latr.). J. Apic. Res., 21, 236–245.
S U P P O R T I N G I N F O R M A T I O N
Additional Supporting Information may be found in the
online version of this article:
10 C. N. Kaiser-Bunbury et al. Letter
� 2010 Blackwell Publishing Ltd/CNRS

Appendix S1 Plant species extinction patterns following
animal extinction scenarios of systematic removal from
the strongest interactor and systematic removal from the
weakest interactor of 12 consecutive temporal snapshots.
Appendix S2 Same as Appendix S1. The quantitative models
are based on interaction strength data.
Appendix S3 Same as Appendix S1 for animal species
extinction patterns following plant extinction scenarios.
Appendix S4 Same as Appendix S2 for animal species
extinction patterns following plant extinction scenarios
and quantitative models are based on interaction strength
data.
Appendix S5 Summary plots of extinction models in tem-
poral networks of the restored and the unrestored site
without and with re-wiring.
Appendix S6 Data of 12 temporal networks for qualitative
and quantitative extinction models.
As a service to our authors and readers, this journal provides
supporting information supplied by the authors. Such
materials are peer-reviewed and may be re-organized for
online delivery, but are not copy-edited or typeset. Technical
support issues arising from supporting information (other
than missing files) should be addressed to the authors.
Editor, James Grace
Manuscript received 9 November 2009
First decision made 7 December 2009
Manuscript accepted 14 December 2009
Letter Stability of pollination networks 11
� 2010 Blackwell Publishing Ltd/CNRS
Related Documents


