The risk-taking channel of monetary policy: exploring all avenues * Diana Bonfim Banco de Portugal and Cat´ olica Lisbon School of Business and Economics Carla Soares Banco de Portugal and Nova SBE August 2017 Abstract It is well established that when monetary policy is accommodative, banks grant more credit. However, only recently has the quality of credit granted been given attention. This literature on the so-called risk-taking channel of monetary policy has been growing quickly, leading to scattered evidence. In this paper we examine through different angles how this channel works. We explore detailed bank and borrower information to look at loan origination and performance over time. We find that ex- ante riskier borrowers have more access to bank funding when interest rates are lower at the extensive margin. Ex-post, overall performance of bank loans is independent of the level of interest rates prevailing when loans were granted. Still, loans granted in periods of low and stable interest rates show higher default rates once interest rates start to increase. Risk-taking behaviors are more prevalent among banks with lower capital ratios, thus suggesting that they may be anchored to managerial incentives for risk-shifting. * We are much indebted to Isabel Gameiro and Jo˜ ao Sousa, who were actively involved in earlier stages of this project, which would not have been possible without their support. The authors would also like to thank Rui Albuquerque, Nuno Alves, Ant´ onio Antunes, Francesco Carli, Dean Corbae, Isabel Horta Correia, Sandra Gomes, Oliver de Groot, Filippo Ippolito, Sudipto Karmakar, Ana Cristina Leal, Robert Marquez, Steven Ongena, Pedro Portugal, Nuno Ribeiro, participants of the 2013 meeting of the Portuguese Economic Journal, OFCE 2013 workshop on Empirical Monetary Economics, 2014 IFABS conference, 2014 PFN conference, 2014 EEA congress, 2014 CompNet meeting, 2014 European Winter Meeting of the Econo- metric Association, 2015 ASSA/IBEFA annual meeting and IX Lubrafin meeting, and seminar participants at the Bank of Portugal and of the Nova SBE Research Group. The views expressed in this paper are those of the authors and do not reflect the views of the Banco de Portugal or the Eurosystem. E-mails: dbonfi[email protected] and [email protected]. 1

Welcome message from author
This document is posted to help you gain knowledge. Please leave a comment to let me know what you think about it! Share it to your friends and learn new things together.
Transcript
The risk-taking channel of monetary policy:
exploring all avenues ∗
Diana Bonfim
Banco de Portugal and
Catolica Lisbon School of
Business and Economics
Carla Soares
Banco de Portugal and
Nova SBE
August 2017
Abstract
It is well established that when monetary policy is accommodative, banks grant
more credit. However, only recently has the quality of credit granted been given
attention. This literature on the so-called risk-taking channel of monetary policy has
been growing quickly, leading to scattered evidence. In this paper we examine through
different angles how this channel works. We explore detailed bank and borrower
information to look at loan origination and performance over time. We find that ex-
ante riskier borrowers have more access to bank funding when interest rates are lower
at the extensive margin. Ex-post, overall performance of bank loans is independent of
the level of interest rates prevailing when loans were granted. Still, loans granted in
periods of low and stable interest rates show higher default rates once interest rates
start to increase. Risk-taking behaviors are more prevalent among banks with lower
capital ratios, thus suggesting that they may be anchored to managerial incentives for
risk-shifting.
∗We are much indebted to Isabel Gameiro and Joao Sousa, who were actively involved in earlier stagesof this project, which would not have been possible without their support. The authors would also liketo thank Rui Albuquerque, Nuno Alves, Antonio Antunes, Francesco Carli, Dean Corbae, Isabel HortaCorreia, Sandra Gomes, Oliver de Groot, Filippo Ippolito, Sudipto Karmakar, Ana Cristina Leal, RobertMarquez, Steven Ongena, Pedro Portugal, Nuno Ribeiro, participants of the 2013 meeting of the PortugueseEconomic Journal, OFCE 2013 workshop on Empirical Monetary Economics, 2014 IFABS conference, 2014PFN conference, 2014 EEA congress, 2014 CompNet meeting, 2014 European Winter Meeting of the Econo-metric Association, 2015 ASSA/IBEFA annual meeting and IX Lubrafin meeting, and seminar participantsat the Bank of Portugal and of the Nova SBE Research Group. The views expressed in this paper arethose of the authors and do not reflect the views of the Banco de Portugal or the Eurosystem. E-mails:[email protected] and [email protected].
1

JEL Codes: E44, E5, G21.
Keywords: risk-taking channel, monetary policy transmission, credit risk.
2
1 Introduction
Since the onset of the financial crisis, there has been an increasing interest on the links
between the financial system and monetary policy. One of the recent avenues of research
has focused on the transmission of monetary policy through banks’ risk-taking behavior,
usually labeled as the risk-taking channel (Adrian and Shin, 2008, 2010a and b, Jimenez,
Ongena, Peydro and Saurina, 2014). The basic idea is that in an environment of low policy
interest rates, the incentive for banks to take more risk into their balance sheets increases.
In the last few years, the literature on this channel has flourished (Dell’Ariccia et al., 2017,
Delis et al., 2017, Morais et al., 2017, Paligorova and Santos, 2017). Several authors have
found a negative relationship between the level of monetary policy interest rates and bank
risk-taking. Generally, the results suggest that, in the short-run, lower policy interest rates
decrease the total credit risk of the banking sector, since the impact via the increase in
borrowers’ repayment capacity for outstanding loans is more significant. However, in the
medium-term, the higher risk-taking may eventually materialize in a deterioration of banks’
asset quality, especially when a period of low policy interest rates is followed by a recession
or by a severe monetary policy contraction.
The existence of a risk-taking channel is thus well-documented. However, given the fast
expansion of this literature during a very short period, the available evidence is scattered
and anchored on many different methodologies, datasets and definitions. Our goal in this
paper is to examine how this channel works through different angles. To do so, we explore
detailed bank and borrower information to look at loan origination and performance over
time. We use a loan level Portuguese dataset with universal coverage on loan, firm and
bank information to provide a thorough and comprehensive assessment of the different ways
through which the risk-taking channel of monetary policy may operate.
This allows us to obtain consistent answers to many of the questions previously addressed
in the literature on this topic, while also addressing new ones. We first test whether the
risk-taking channel exists when we consider the ex-ante riskiness of borrowers. This allows
us to understand if banks were making risky choices based on observable firm characteristics.
We consider different risk measures and different lending choices. We also test the impact
of the level of policy rates at the moment loans are granted on ex-post risk. Further, we
test whether loans granted when rates are low and stable are more sensitive to a tightening
in monetary policy, thus assessing the role of banks’ expectations on risk-taking behaviors.
Moreover, the richness of our dataset allows us to explore the heterogeneity underlying
the different ways in which the risk-taking channel operates, taking into account the role
of firm and, more importantly, bank characteristics. This allows us to improve the link
3
between theoretical and empirical evidence on the transmission of monetary policy through
the risk-taking channel.
Testing all of these hypotheses requires an adequate identification strategy. It is possible
to argue that there may be common (unobservable) effects that simultaneously influence the
monetary policy stance and banks’ risk-taking decisions. If that is the case, it is not possible
to infer causality, thereby hindering the correct identification of the risk-taking channel. Our
setup overcomes this challenging identification problem given that monetary policy decisions
can be considered as fully exogenous during the period analyzed (1999-2007). The influence
of Portuguese monetary and economic conditions on the decisions taken by the ECB should
be negligible. This is the same argument used by Jimenez et al. (2012, 2014) and, to some
extent, by Ioannidou et al. (2015) and Gersl et al. (2015).
Our empirical results partly support the existence of a risk-taking channel. When mone-
tary policy interest rates are lower, banks are more likely to lend to ex-ante riskier borrowers.
However, the average exposure to existing risky borrowers does not increase. In other words,
we find results for the extensive margin, but not for the intensive margin. When we track
loan performance over time, we see that loans granted when monetary policy rates were low
are not generally more likely to default ex-post. However, one crucial exception occurs when
interest rates increase after having been low for a long period. In this case, loans granted
in low interest rates periods are significantly more likely to default when monetary policy
tightens due to sudden changes in expectations. This result may be specially relevant for
supervisors and other policymakers when interest rates increase after prolonged periods of
loose monetary conditions.
Regarding bank heterogeneity, we find that risk-taking behaviors are stronger for banks
with less capital. There is evidence that banks closer to minimum regulatory ratios take
more risk because they do not fully internalize the potential consequences of the risks taken
(Jimenez et al., 2014, Diamond and Rajan, 2012). Though less consistently, we also find
some evidence that banks with larger liquidity buffers are more prone to risk-taking be-
haviors. Taking the results for liquidity and capital together, we are able to conclude
that risk-taking behaviors in a low interest rate environment may be associated with poor
managerial incentives, which encourage risk-shifting strategies (Acharya and Naqvi, 2012,
Altunbas et al., 2010). Indeed, banks with more liquidity have more incentives to engage in
risk-shifting when interest rates are lower, given that liquid assets usually offer null or very
small remunerations. In a low interest rate environment, banks with many liquid assets may
divert some of these resources to grant riskier loans, in a search for yield strategy.
In sum, our paper contributes to the expanding empirical literature on the risk-taking
channel of monetary policy by looking simultaneously at different dimensions of the trans-
4
mission mechanism. By exploring a rich and detailed dataset, with loan, firm and bank
information, and by taking advantage of a quasi-experimental setting in which monetary
policy decisions can be considered as fully exogenous, we explore the effect of interest rates
on banks’ risk-taking behaviors through different angles. As such, the paper offers an en-
compassing analysis of the risk-taking channel, thereby helping to bring some consistency
to this fast growing literature, while providing additional evidence supporting the existence
of the channel.
The paper is organized as follows: In section 2 we briefly summarize the theoretical and
empirical discussions in the literature on the risk-taking channel. Section 3 describes the
dataset used and section 4 details the identification strategy and methodologies followed. In
sections 5 and 6, we present our main results. The analysis is built around two blocks. First,
in section 5, we assess the risk-taking channel at the moment a lending decision is taken,
both at the extensive and intensive margins. We focus on the effects of policy interest rates
on lending by testing two hypotheses: (1) Do riskier firms get more credit when policy rates
are lower? (section 5.1) and (2) Are riskier firms more likely than other firms to obtain a
loan when interest rates decrease? (section 5.2). Second, in section 6, we assess the risk-
taking channel through ex-post changes in loan portfolio quality. Again, two hypotheses are
tested: (1) Does the level of the policy rate when loans are granted influence the (ex-post)
probability of default? (section 6.1) and (2) Are loans granted when policy rates are low
and stable more likely to default when interest rates increase? (section 6.2). Section 7
summarizes our main findings.
2 An overview of the literature
The theoretical research on the risk-taking channel has been expanding significantly during
the last few years (Adrian and Shin, 2008, 2010a and b, Afanasyeva and Guntner, 2015,
Borio and Zhu, 2012, Cesa-Bianchi and Rebucci, 2017, Dell’Ariccia et al., 2011, De Nicolo et
al., 2010, Gonzalez-Aguado and Suarez, 2015, Morris and Shin, 2014). These authors have
identified some mechanisms through which this channel operates. One of these mechanisms
is the search for yield, which occurs mainly through the asset side of financial institutions’
balance sheet. A decrease in policy rates decreases their portfolio income and then de-
creases the incentive to monitor, or similarly, increases search for yield and then risk-taking
(Dell’Ariccia et al., 2011).
The risk-taking channel may also operate through risk-shifting, occurring mainly via the
liability side of financial institutions’ balance sheet. A decrease in policy rates decreases the
cost of banks’ liabilities. Given the evidence that banks target a leverage ratio (Adrian and
5
Shin, 2008, 2010a and b, Bruno and Shin, 2015), they get back to their target by increasing
market funding, especially in shorter maturities, and by expanding credit to cover riskier
projects. Both changes imply an increase in the risk banks assume (Dell’Ariccia et al.,
2011, Valencia, 2014). This mechanism reinforces itself, since banks increase demand for
assets, increasing their price and consequently further expanding their balance sheet and
increasing their leverage. Moreover, a prolonged period of low interest rates can affect asset
and collateral valuations, as it is associated with lower market volatility, thus reducing risk
perception (Gambacorta, 2009).
Other authors highlight a distortion of incentives in an environment of very low interest
rates. In Acharya and Naqvi (2012), an agency problem between the bank manager and
the principal induces the bank manager to take excessive risk when the bank is awash with
liquidity. This usually occurs in situations of high macroeconomic risk, when the central
bank tends to loosen its monetary policy.
During the last few years, there were several relevant empirical contributions to the
literature on the risk-taking channel, most of them finding evidence in favor of the existence
of this channel. One important strand of the literature uses loan-level datasets on individual
countries (Dell’Aricia et al., 2017, Gaggl and Valderrama, 2011, Ioannidou et al., 2015,
Jimenez et al., 2014, Morais et al., 2017). Other authors use less granular data, at the
bank or country level (Altunbas et al., 2010, Angeloni et al., 2015, Bruno and Shin, 2015,
Maddaloni and Peydro, 2011, Paligorova and Santos, 2017). Generally, these studies find
a negative relationship between the level of policy rates and the risk of the loan portfolio
of the banks. However, the evidence for the US seems to be milder. For instance, Delis
et al. (2017) find that low policy rates decrease the risk of banks’ loan portfolios in the
short-term but significantly increase it in the medium run, while Buch et al. (2014) do not
find favorable evidence for the overall banking system, finding however important differences
between different types of banks.
Available empirical evidence suggests that there is some heterogeneity in bank risk-taking
behaviors, in line with agency theories (Kashyap and Stein, 2000, Freixas and Rochet, 2008).
Indeed, there seems to be some evidence that the risk-taking channel is stronger for poorly
capitalized banks (Jimenez et al., 2014, Dell’Ariccia et al, 2017, Delis and Kouretas, 2011,
Ioannidou et al., 2015), for banks with less liquidity (Brissimis and Delis, 2010) and for
smaller banks (Buch et al., 2014). Altunbas et al. (2010) also find that banks more involved
in non-traditional banking activities take more risk. Finally, Maddaloni and Peydro (2011)
find evidence of agency problems in excessive risk-taking, given that the impact of low
monetary policy rates on lending standards is amplified when supervision standards for
bank capital are weaker.
6
Financial innovation also seems to impact on banks’ lending standards. Maddaloni and
Peydro (2011) find that securitization leads to softer lending standards in both the euro
area and the US, amplifying the effects coming from low policy rates (Delis and Kouretas,
2011).
Our paper contributes to the expanding empirical literature on the risk-taking channel
of monetary policy by looking at the risk-taking channel through different angles. By
exploring a rich and detailed dataset and by taking advantage of the exogeneity of monetary
policy decisions, we test the effect of policy rates on banks’ risk-taking behaviors. We do
this through several different perspectives, thereby providing a thorough analysis of this
transmission channel. In line with most literature, our results support the existence of a
risk-taking channel along some dimensions and especially for banks with less capital.
3 Data
We collect data for the period between 1999 and 2007. As discussed below, the identification
strategy relies on the exogeneity of monetary policy, thus we only use data for the period
after Portugal joined the euro area. We chose to use data only up to 2007 since the trans-
mission of monetary policy has been severely impaired by the global financial crisis (and,
more importantly, by the euro area sovereign crisis). As such, we want to test the existence
of a risk-taking channel of monetary policy in “normal” conditions exploiting the exogeneity
of the interest rates set by the ECB Governing Council. The period under analysis allows
us to cover a full business cycle.
The most important data source is the Portuguese Central Credit Register (CRC), which
is a database managed by Banco de Portugal, covering virtually all bank loans granted in
Portugal (all financial institutions granting credit in Portugal are required to report on a
monthly basis all loans granted above 50 euros). The register includes outstanding loans
to firms, as well as potential credit liabilities associated with irrevocable commitments. All
financial institutions are allowed to consult information on their current and prospective
borrowers, with their previous consent, thus making the CRC a key information-sharing
mechanism between banks. The CRC has information on the type of loan, the debtor and
the amount, while also including information on loan defaults and renegotiations.
To address our research question, we have to identify episodes of default. We consider
that there is a default when a loan is overdue or in litigation during an entire semester. This
avoids mining the data with very short-lived episodes, possibly related to reporting errors
or problems in bank payments, for instance.
7
We also use information on banks’ characteristics coming from supervisory quarterly
balance sheet data. From all monetary financial institutions with activity during at least
one year between 1999 and 2007, we select institutions with a market share of at least 0.1
per cent in the corporate loan market. After this selection, we have a sample of 52 credit
institutions: 30 banks, 10 mutual agricultural credit banks (”caixas de credito agrıcola
mutuo”), 1 savings bank (”caixa economica”) and 11 branches of credit institutions with
head office in the EU.
Our unit of observation is a firm-bank relationship in a given quarter. We consider that
there is a new loan when there is an increase in the amount of credit granted by a bank to
a firm or when there is a new firm-bank relationship.1 Using quarterly data for the period
1999-2007, we have almost 12 million observations, representing 933,611 different firm-bank
relationships. Default episodes account for 8 per cent of total observations. On average,
each firm has a relationship with three banks and has credit history for 24 quarters.2 The
average amount of each firm’s loan per bank is around 234 thousand euros, thus suggesting
that we are dealing mainly with micro and small enterprises.
Table 1 presents the definitions of all the explanatory variables considered in the analysis,
as well as some descriptive statistics. As discussed below, our analysis relies on different
methodologies to look at different dimensions of the risk-taking channel. Depending on the
methodology being used, we can use different measures of borrower’s credit quality: having
recent default history (for two consecutive quarters) (bad hist), currently being in default
with that specific bank (D default bank) or obtaining a loan for the first time ever (new bor).
For robustness, we considered different measures of credit quality (currently being in default
in any loan, being in default for 4 consecutive quarters or for 4 consecutive years or having
a default in the future) and the results remain broadly robust.
We analyze lending at the intensive margin using two different quarterly firm-bank loan
growth measures: the log change in loans (loan growth) and the log change in loans including
the unused amount of committed credit lines (loan growth cl). To study the extensive
margin, we consider two dummy variables that take the value one if i) there is an increase
in loan exposure (new loan) or ii) if there is a new lending relationship (new bor). In both
cases we consider an alternative definition that takes into account unused committed credit
lines (new loan cl and new bor cl, respectively).
1Unlike Jimenez et al. (2012, 2014), we do not have individual loans data, i.e., we cannot exactly identifywhen a new loan contract is established or when an old one matures. Nevertheless, we consider that therelevant unit of analysis would still be the relationship between the bank and the firm and not strictly theloan contract.
2To compute the duration of credit histories we used data since 1995.
8
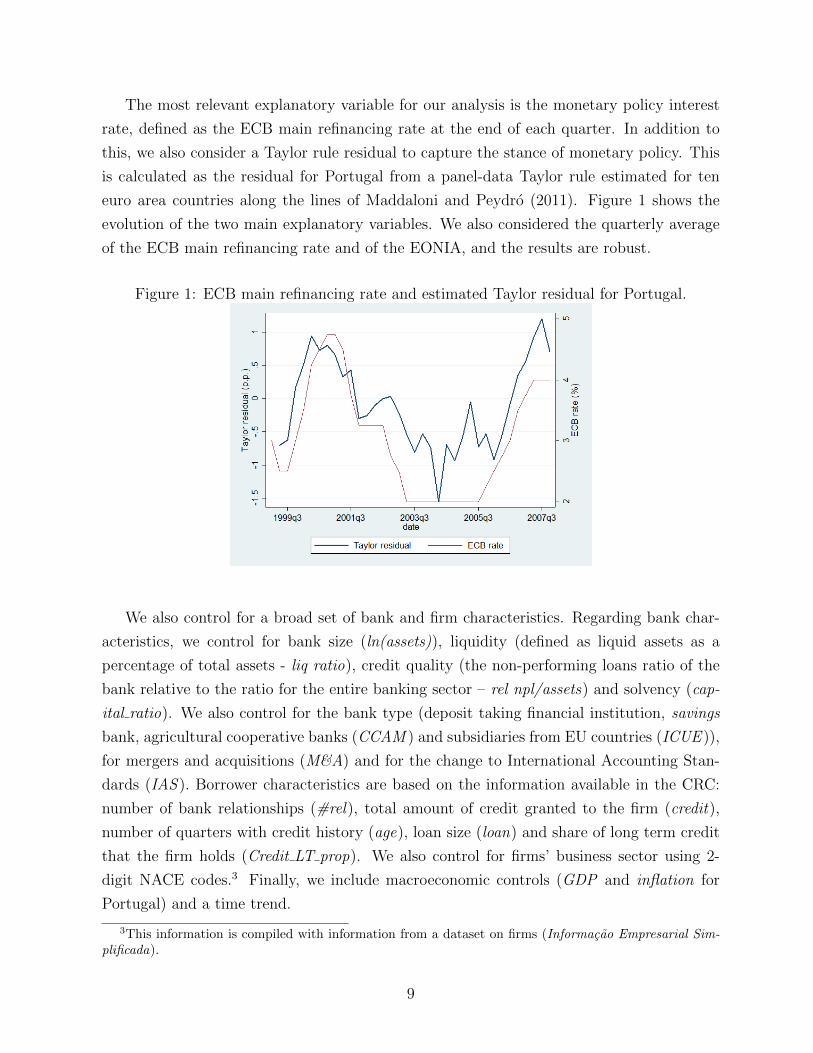
The most relevant explanatory variable for our analysis is the monetary policy interest
rate, defined as the ECB main refinancing rate at the end of each quarter. In addition to
this, we also consider a Taylor rule residual to capture the stance of monetary policy. This
is calculated as the residual for Portugal from a panel-data Taylor rule estimated for ten
euro area countries along the lines of Maddaloni and Peydro (2011). Figure 1 shows the
evolution of the two main explanatory variables. We also considered the quarterly average
of the ECB main refinancing rate and of the EONIA, and the results are robust.
Figure 1: ECB main refinancing rate and estimated Taylor residual for Portugal.
We also control for a broad set of bank and firm characteristics. Regarding bank char-
acteristics, we control for bank size (ln(assets)), liquidity (defined as liquid assets as a
percentage of total assets - liq ratio), credit quality (the non-performing loans ratio of the
bank relative to the ratio for the entire banking sector – rel npl/assets) and solvency (cap-
ital ratio). We also control for the bank type (deposit taking financial institution, savings
bank, agricultural cooperative banks (CCAM ) and subsidiaries from EU countries (ICUE )),
for mergers and acquisitions (M&A) and for the change to International Accounting Stan-
dards (IAS ). Borrower characteristics are based on the information available in the CRC:
number of bank relationships (#rel), total amount of credit granted to the firm (credit),
number of quarters with credit history (age), loan size (loan) and share of long term credit
that the firm holds (Credit LT prop). We also control for firms’ business sector using 2-
digit NACE codes.3 Finally, we include macroeconomic controls (GDP and inflation for
Portugal) and a time trend.
3This information is compiled with information from a dataset on firms (Informacao Empresarial Sim-plificada).
9
4 Identification strategy and methodology
Our primary objective is to test the existence of a risk-taking channel in a bank-based
financial system. In other words, we want to assess whether banks grant riskier credit
when policy interest rates are lower. Taken at face value, this would mean regressing
variables that capture bank risk-taking on interest rates. However, to correctly identify the
causal effect of monetary policy on bank risk-taking, monetary policy decisions need to be
exogenous. Otherwise, it is possible that there are (omitted) variables that simultaneously
affect monetary policy and bank risk-taking decisions. Our setup allows us to avoid this
potentially serious endogeneity problem, as monetary policy is fully exogenous during the
period analyzed. Portugal is a small open economy that joined the euro area in 1999. The
impact of macroeconomic and financial conditions specific to the Portuguese economy on
euro area interest rates should be negligible. Moreover, the correlation of the Portuguese
economic cycle with that of the euro area was relatively low. For instance, the correlation
for inflation, which is at the core of the primary objective of the ECB, was 0.3 during the
sample period. Euro area monetary policy can thus be considered exogenous, allowing for the
correct identification of this causal effect. This is the same argument used by Jimenez et al.
(2012, 2014) and, to some extent, by Ioannidou et al. (2015) and Gersl et al. (2015). Indeed,
this article follows to some extent part of their empirical strategy but includes additional
layers of analysis, with the objective of testing from different perspectives whether there is
a risk-taking channel.
Our methodological strategy is anchored in two blocks. In the first block, we assess the
risk-taking channel at the intensive and extensive margins using ex-ante information. In
other words, we assess loan growth to risky borrowers and the probability of granting new
loans to these borrowers, respectively. As such, we focus on the effects of policy interest
rates on lending by testing two hypotheses: (1) Do riskier firms get more credit when policy
rates are lower? (section 5.1) and (2) Are riskier firms more likely than other firms to obtain
a loan when interest rates decrease? (section 5.2). To answer the first question, we run the
following panel regression:
loan growthijt = cij + αiECBt−1 × bad histit−1 + βiECBt−1 + γbad histit−1 + δ′Xijt−1 + εijt (1)
Where the index i stands for firm, the index j stands for bank and the index t for quarter.
We include firm-bank fixed effects (cij) and α is the main coefficient of interest, capturing
the (additional) effect of the policy rate (iECB or Taylor) on the loan growth of firms with
recent bad credit history (bad hist). A negative α would provide evidence in favor of the
10
risk-taking channel. The vector of controls Xij includes the bank and firm characteristics
and macro conditions described in section 3.
In order to test the second hypothesis, we use discrete choice models to assess the
probability of borrowers with recent episodes of default or no credit history being granted
loans4. The following probit model is estimated:
Pr (riskyit = 1|new loanijt = 1) = Φ(αiECBt−1 + δ′Xijt−1 + εijt
)(2)
This approach allows us to test whether banks grant more loans to risky borrowers during
periods of lower policy interest rates. Our dependent variable takes the value one when a
new loan is granted to a borrower defined as risky (and zero when a new loan is granted to
any other borrower). A negative α would imply that when policy rates are lower (or when
monetary policy stance is more accomodative than what is foreseen in a Taylor rule), it is
more likely to grant a new loan to a riskier borrower. We consider two definitions of risky
borrowers: when borrowers are in default with any bank in the last two quarters (bad hist)
or when borrowers obtain a loan for the first time (new bor).
Positive answers to the above two questions would mean that there is more expansion of
credit to riskier borrowers when interest rates are lower. But will the ex-ante risky borrowers
reveal themselves as riskier ex-post? What is the impact in the overall risk assumed by banks
and, in the end, what are the consequences in terms of financial stability? Based on previous
evidence that shows that firms that have defaulted are more likely to default in the future
(Bonfim et al., 2012), we assess the ex-post performance of the loans granted during periods
of low interest rates. Again, two hypotheses are tested here: (1) Does the level of the policy
rate when loans are granted influence the (ex-post) probability of default? (section 6.1)
and (2) Are loans granted when policy rates are low and stable more likely to default when
interest rates increase? (section 6.2).
In order to test the first hypothesis, we use duration analysis to assess the impact of
monetary policy rates when loans are granted on the time until a firm defaults. We model
the hazard rate of the loans granted to the firms, considering that the failure event is the
occurrence of default. The hazard function is defined as the instantaneous probability of a
firm defaulting on the bank, conditional on having no default up to time t. The time at risk
is defined as the time elapsed between the moment a new loan is granted and the moment
the firm (eventually) defaults with that bank. Taking into account the shape of the hazard
function of the sample, we estimate a parametric model with a Weibull distribution, which
allows for a monotonic hazard function, i.e., the hazard rate either increases or decreases
4Granting loans to borrowers with limited historical data increases the expected profitability of banks,while fostering innovation, as shown by Thakor (2013). However, it also increases the risk held by banks.
11
over time according to the Weibull distribution parameter. In this estimation, p is the
distribution parameter that indicates whether the Weibull hazard function is monotonically
increasing (p>1) or decreasing (p<1). The following Weibull hazard function is estimated:
hij (t) = p exp(αiECBτ−1 + γbad histiτ−1 + δ′Xijτ−1
)tp−1 (3)
where again we could interpret a negative α as an indication of a risk-taking channel at
work. The explanatory variables are considered at the moment the loan was granted (τ).
For the second hypothesis, we use a differences-in-differences (DID) analysis, where we
define the loans ”treated” as the ones that were granted during a period of low interest rates
(treatmentijt = 1). We want to understand if these loans are relatively more likely to default
once interest rates start to increase (after tt = 1), revealing themselves as riskier ex-post.
To be sure that the treatment and control groups are comparable we focus our analysis on
a very short window: we consider that treated loans are those granted immediately before
interest rates began to increase in December 2005, when interest rate expectations were
still anchored at low levels (2005Q1 to 2005Q3). The loans in the control group are those
granted in the period when interest rates were still low, but interest rate expectations had
increased markedly, as illustrated in Figure 2 (2005Q4 to 2006Q1).
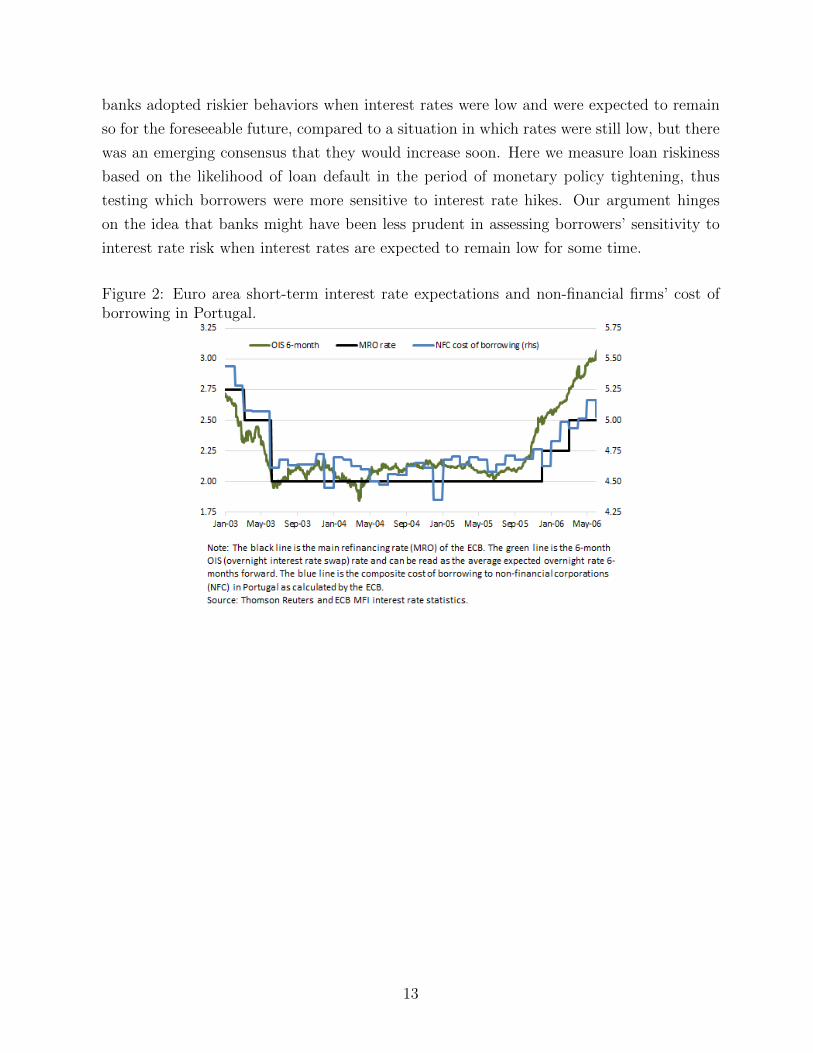
The ECB had kept monetary policy interest rates stable at 2% since June 2003. In
December 2005, the ECB increased rates for the first time since October 2000. This was
a minor 25 basis points upward revision in the interest rate, which was not immediately
reflected in firms’ borrowing costs, as shown in Figure 2. The tightening trend of monetary
policy only became clear during 2006, with interest rates reaching 4.25% in the summer of
2007. As such, the effective interest rates set by banks on loans granted to firms between
January 2005 and March 2006 were very similar, as shown in Figure 2. The borrowing costs
of Portuguese non-financial corporations oscillated in a narrow interval between 4.7 and 5%
during this period.
The main difference between the loans granted in January-September 2005 and those
granted in October 2005-March 2006 relates to the level of interest rate expectations. The
chart shows that market participants’ expectations on future interest rates (proxied by the
6-month overnight interest rate swap) increased markedly in October 2005, decoupling from
monetary policy rates and bank interest rates on loans to firms. This change in expectations
was very sudden and was underpinned by a change in the communication of the ECB,
signalling that monetary policy could be tightened in the near future.
This setting allows us to test the risk-taking channel in a unique scenario. With our DID
approach, we are comparing loans granted with similar levels of prevailing interest rates,
but with quite different expectations regarding future rates. We are thus able to test if
12
banks adopted riskier behaviors when interest rates were low and were expected to remain
so for the foreseeable future, compared to a situation in which rates were still low, but there
was an emerging consensus that they would increase soon. Here we measure loan riskiness
based on the likelihood of loan default in the period of monetary policy tightening, thus
testing which borrowers were more sensitive to interest rate hikes. Our argument hinges
on the idea that banks might have been less prudent in assessing borrowers’ sensitivity to
interest rate risk when interest rates are expected to remain low for some time.
Figure 2: Euro area short-term interest rate expectations and non-financial firms’ cost ofborrowing in Portugal.
13
We estimate the following equation:
Pr (bad histit = 1) = Φ (αtreatmentijt × aftert + γtreatmentijt + βaftert + δ′Xijt−1 + εijt)
(4)
In order to prove the existence of a risk-taking channel, we would need to find that loans
granted when policy rates were low would have a higher probability of default when interest
rates increase, which would imply a positive α.
One important dimension of our analysis is to understand which banks are more prone
to risk-taking. To test this, we interact the risk-taking coefficient (α) with banks’ liquidity,
capital and total assets in all the approaches described above. Furthermore, for all identifi-
cation strategies, we look separately at small and large firms and at small and large banks.
This allows us to draw important insights about the role of bank and firm characteristics
in the transmission of monetary policy through the risk-taking channel.
5 The risk-taking channel assessed with ex-ante infor-
mation
5.1 Do riskier firms get more credit when policy rates are lower?
To answer this question, Table 2 presents the results of a panel regression with fixed effects
on firm loan growth against the monetary policy rate, the recent credit history of the
firm (bad hist) and an interaction term between these two, controlling for bank and firm
characteristics and macro conditions (equation 1). Given that borrowers’ credit situation
can be verified by any bank through the CRC, we consider that there is bad credit history
when the firm is defaulting on any bank loan, i.e., not only on the bank offering the new
loan.
The coefficient on the interaction term i ∗ bad hist captures risk-taking. A negative
coefficient would mean that when interest rates are lower, firms with a recent bad credit
history show stronger loan growth than other firms. Looking across the several columns
of Table 2, we find that this coefficient is generally non-significant, implying that, at the
intensive margin, there seems to be no evidence of a risk-taking channel.
Let us analyze in more detail the different columns of Table 2. In the first column, we
show the results of an estimation with relationship fixed effects, standard errors clustered at
the quarter level, and bank, borrower and macroeconomic controls. Using this specification
we find statistically significant results to support the risk-taking channel. Nevertheless, the
14
result is not strong enough to survive an estimation with standard errors clustered at the
quarter and bank level (instead of only at the quarter level), as shown in column II.
The same is true when we consider unused credit lines as part of our dependent variable.
As mentioned before, in our ex-ante assessment of the risk-taking channel, we consider that
there may be two ways to capture banks’ increased exposure to a given firm. On one hand,
we can consider, as in columns I and II, that the bank increases its exposure to the firm
every time there is an increase in effective loan amounts. On the other hand, part of this
effective loan amount increase may reflect the drawing down of credit lines by firms. As
such, we consider that it might be important to also consider changes in the total exposure
of a bank to a firm, including also the unused amount of committed credit lines. From
column III onwards we consider this latter definition of the dependent variable.
In column IV, we impose an even more demanding structure on the data, setting a three-
way multi-clustering of errors (quarter, bank and firm) and, as it would be expected, the
no-significance result also shows up.5 However, we consider that the most critical clustering
level should be at the quarter and bank level and we adopt this throughout our analysis of
the intensive margin.6 The reason for this is that (i) monetary policy interest rates, which
play a key role in our analysis, vary simultaneously for every bank and firm at a quarterly
frequency (Petersen, 2009), and (ii) banks’ internal pratices and the relatively low number
of banks in the Portuguese economy justify grouping the errors by bank.
In columns VI to VIII we add another layer of analysis. The goal is to understand
if the risk-taking channel works differently depending on bank characteristics. To answer
this question, we add a triple interaction term to the regressions. More specifically, we
consider the interaction between monetary policy interest rates, the dummy for bad quality
borrowers and banks’ liquidity ratio (column VI), capital ratio (column VII), and log of
total assets (column VIII), respectively. We cannot find any differential effect from these
bank characteristics.
To better understand how the risk-taking channel works at the intensive margin, we
estimate our regression separately for small and large firms (columns IX and X, respectively).
Small firms are those below the median of the empirical distribution of total assets, while
large firms are those in the 90th percentile. The results show no statistically significant
interaction effects of the level of the interest rate and the credit history of the firm.
Finally, we run a similar exercise for bank size, estimating the regression separately for
small and large banks (columns XI and XII, respectively), where the latter are the five largest
5We computed multi-way clustering following Correia (2017).6The only exception are the results displayed in column V, where we have to go back to clustering only at
the quarterly level when we add sectoral dummies, with the goal of better controlling for firm heterogeneity.The results remain non-significant when we do this.
15
banks (accounting for more than half of the corporate loan market). Again, no difference
is to be mentioned and, contrary to some studies that find riskier behaviors by small banks
(Buch et al., 2014, Kashyap and Stein, 2000), we do not find evidence of risk-taking at the
intensive margin for all types of banks.
Until now, we focused our analysis on the coefficients associated with the identification
of the risk-taking channel. However, the results concerning some of the remaining control
variables deserve a few words. The effect of interest rates on loan growth at the firm level
is generally not statistically significant when we also control for banks’ risk-taking.
The coefficient on the bad hist variable in columns I and II is somehow puzzling. It seems
to suggest that borrowers with recent poor recent credit history show stronger loan growth
than other firms. Given that we are using relationship fixed effects, this is happening when
firms get into distress. Using a similar dataset, Bonfim et al (2012) showed that in Portugal
firms regain access to credit very easily after default. These two results taken together might
be supportive of the existence of evergreening (Peek and Rosengren, 2005). Banks may be
extending loans to distressed borrowers to avoid recording losses on their loans. However,
it is important to note that this result is only obtained when using effective loan growth as
the dependent variable. When we include total loan exposure growth, i.e., including unused
credit lines (column III onwards), the coefficient is no longer significant. Therefore, this
result seems to be more in line with the argument that firms tend to increase their funds
by withdrawing on pre-existing commitments when they enter into default in a loan, in line
with what Ivashina and Scharfstein (2010) find for the crisis period.
Using the residuals of a Taylor rule for the Portuguese economy as explanatory variable
instead of the monetary policy interest rate does not change our conclusions. The results for
our baseline regression with this alternative explanatory variable are presented in Table 3.
In columns I and II we consider, respectively, loan growth without and with unused credit
lines.
The interaction term between monetary policy and the credit history of the firm contin-
ues to be non-significant. The main difference relates to the bad hist variable. We find that
firms with a bad credit history indeed have a stronger effective loan growth, but a weaker
potential loan growth. This reinforces the previous argument that firms make more use of
pre-existing commitments when they enter distress, though this does not correspond to an
increase of the exposure of the bank to that firm.
In sum, we find no consistent evidence of a risk-taking channel of monetary policy
working at the intensive margin: the level of interest rates or the monetary policy stance
do not seem to be relevant for the expansion of credit by banks to riskier firms.
16
5.2 Are riskier firms more likely than other firms to obtain a loan
when interest rates decrease?
In this section we consider the extensive margin of loan dynamics: are riskier firms more
likely than other firms to get new loans when interest rates are lower? Our analysis is based
on the estimation of discrete choice models for new bank loans. Given that a new loan is
being granted, we evaluate the probability that the borrower has a recent bad credit history
or has no credit history (equation 2). We are interested in studying how monetary policy
rates in the quarter prior to loan origination influence the probability of granting loans to
these higher risk borrowers.
Table 4 presents the results of the estimation for borrowers with recent default (bad hist).
Overall, we find that lower short-term interest rates increase the probability of banks grant-
ing a loan to a borrower with recent episodes of loan default vis--vis that of a healthy
borrower, thus supporting the existence of a risk-taking channel at the extensive margin.7
This result holds in most specifications. The results are similar regardless of whether
standard errors are clustered at the quarter level or multi-clustered at the quarter and bank
or at the quarter, bank and firm level (columns I to IV). Moreover, adapting the dependent
variable to include unused credit lines yields similar results (column III). However, the
coefficient on the policy rate lacks statistical significance when we control for sectoral effects
(column V).
As in the previous sub-section, we try to determine whether bank characteristics play
a role in the way the risk-taking channel operates. Again, there are interesting differences
between the intensive and extensive margin. While at the intensive margin bank character-
istics did not seem to play a role, at the extensive margin we find that risk-taking behaviors
are more relevant for banks with more liquidity and, especially, less capital (columns VI to
VIII).
On one hand, banks with more liquidity will possibly be more interested in doing some
risk-shifting when interest rates are lower. Given that liquid assets usually offer null or
very small remunerations, in a low interest rate environment banks with more liquid assets
may divert some of these resources to grant riskier loans, in a search for yield strategy.
Furthermore, banks with more liquidity may show a riskier behavior because managers’
incentives to monitor risks decrease (Acharya and Naqvi, 2012, Altunbas et al., 2010).
7The absence of loan application data does not allow us to fully separate demand from supply effects,i.e., we cannot clearly distinguish the effect coming from the possible higher number of loan applicationsfrom risky borrowers in periods of low interest rates from the effect of an increased probability of grantinga loan to a risky borrower, for the same pool of loan applications. Nonetheless, the effect is favorable torisk-taking, since a higher proportion of new loans is granted to risky firms.
17
On the other hand, banks with less capital are usually more prone to risk-taking behav-
iors. There is evidence that banks closer to minimum regulatory ratios take more risk, as
they do not fully internalize the potential consequences of the risks taken (Jimenez et al.,
2014, Diamond and Rajan, 2012). Our results do not support the hypothesis that banks
with higher capital buffers take more risk (Dell’Ariccia et al., 2011).
Following again the same steps taken in the analysis of the intensive margin, we look
separately at small and large firms (columns IX and X) and at small and large banks
(columns XI and XII). We find evidence of risk-taking at the extensive margin only for
large firms, which are arguably less risky than smaller firms. In terms of bank size, risk-
taking exists both for small and large banks.8
Finally, in column XIII we show the results of our estimations with a linear probability
model. We do this because in the probit specifications we are not able to use relationship
fixed effects. When we add these fixed effects, we still find evidence that there is risk-taking
on the extensive margin9.
In Table 5 we replicate all the estimations reported in Table 4. The only difference is
the dependent variable: while in Table 4 the dependent variable was bad hist, taking the
value one if the firm was in default in this quarter and in the previous one, in this new table
the dependent variable takes the value one if the firm is a first time borrower (new bor).
We consider that this is also a form of risk-taking, as information asymmetries are more
acute when giving a loan to a firm without credit history (Diamond, 1991, Thakor, 2013).
Note that at the intensive margin we are only able to explore risk-taking within ongoing
relationships. Adding this dimension of analysis at the extensive margin provides new
insights on the workings of the risk-taking channel through different angles.
The results regarding the effect of monetary policy interest rates on risk-taking are
entirely consistent: when interest rates are lower, banks become more likely to grant loans
to new borrowers than to existing ones.
When we interact interest rates with bank characteristics, we do not find any statistically
significant results in this case (columns VI to VIII). When we run sample splits by firm size
we get an interesting difference: risk-taking through new borrowers occurs mainly through
small firms (which are more likely to be first time borrowers), while we had found that for
bad quality borrowers the effect was coming mainly from large firms. The results of splitting
8In column XII, it is not possible to calculate the standard error for the interest rate coefficient, likelydue to the high demanding multi-clustering structure imposed. Indeed, when we cluster standard errors byquarter only (not reported, available at request) we get a strongly negative significant coefficient.
9To be sure that the results are not being driven by the change in estimation methodology, we also esti-mate a linear probability model without relationship fixed effects. The results for the coefficient associatedwith risk-taking are entirely consistent.
18
the sample by bank size are consistent with what we found for borrowers in default, given
that risk-taking through new borrowers exists for both small and large banks.
As in the previous section, we also conduct the same analysis but using the Taylor
residuals as the main explanatory variable, instead of the monetary policy rate (Table 6).
In this case, we find an increase in ex-ante banks’ risk-taking at the extensive margin for
new borrowers (columns III and IV) but not for existing borrowers (columns I and II). This
may signal that banks’ risk-taking behaviors are associated mainly with environments of
low monetary policy interest rates, rather than by periods in which monetary policy is too
accommodative.
Summing up, our results consistently show that there is a risk-taking channel working
at the extensive margin. Riskier borrowers are more likely to get new loans when interest
rates are lower. These effects are stronger for banks with less capital.
6 The risk-taking channel assessed ex-post
In the previous section we found evidence supporting the risk-taking channel at the extensive
margin, based on banks’ assessment when granting a loan. But what happens to the loans
granted when interest rates are low? Even if bad quality borrowers get more loans, does that
imply an overall deterioration on loan portfolio quality ex-post? To answer these questions,
in this section we turn our attention to the assessment of the effect of policy rates on credit
portfolio quality. We do that in two parts. First, we examine the ex-post performance of
loans granted to firms, taking into account the level of policy rates when loans are granted,
using a duration analysis framework. Our goal is to test to what extent the level of policy
rates when a new loan is granted influences the ex-post probability of default of the loan.
Second, we distinguish the loans granted when policy rates were low from all the others and
analyze what happens to these loans when interest rates increase. We do this by relying on
a differences-in-differences approach. Our goal is to understand if loans granted when rates
are low and stable are riskier in the sense of showing heightened sensitivity to interest rate
increases.
6.1 Does the level of the policy rate when loans are granted in-
fluence the (ex-post) probability of default?
Table 7 presents the results of the survival estimation (equation 3). A brief inspection of the
first line of the table shows that there is no evidence of an ex-post risk-taking channel. The
level of monetary policy interest rates in the moment loans are granted does not affect the
19
ex-post default performance of the loans. The only exception is reported in column X, where
we show our baseline results estimated with time-varying covariates. In this case, we find
evidence supporting the risk-taking channel ex-post. However, in this specification, we are
explicitly considering the role of changing firm, bank and macro characteristics over the life
of the loan, while considering only the interest rate at the moment of concession. As these
changes could not be fully anticipated by the bank when deciding to grant a loan, it is not
reasonable to argue that banks were taking more risk based solely on this specification. As
such, this latter result should be interpreted with caution. In sum, we cannot find consistent
evidence to support the hypothesis that the level of interest rates when loans are granted
matters for their ex-post default probability.
It is important to note that these results are not in contradiction with the previous anal-
ysis. In the first part of our analysis, we wanted to assess how monetary conditions influence
lending to ex-ante riskier borrowers (i.e., their riskiness was to some extent verifiable). In
this section, we are evaluating how monetary policy rates when loans are granted affect bor-
rowers’ ex-post probability of default, increasing the credit risk implicit in banks’ balance
sheet. As banks do not have perfect foresight on borrower quality, the risk-taking behavior
on these two situations is quite different: whereas in the former banks were granting loans
to borrowers which had verifiably poor quality, in the latter case the results reflect more
than just the decision of the bank. A possible interpretation is that even though when mon-
etary policy rates are lower banks grant credit to riskier borrowers, which are more likely to
default in the future, the overall risk of banks’ loan portfolio does not increase significantly.
Thus, these arguments are in favor of the existence of a risk-taking channel in Portugal, but
with limited impact in terms of financial stability. Moreover, we are assessing the entire
interest rate cycle, while this channel may operate only in low interest rate periods, possibly
undermining the results. To better capture this, in the next section we will focus specifically
on these periods.
Besides the main results reported in the first line of Table 7, there are other results worth
highlighting. We find that borrowers with recent defaults take less time to default again
than other borrowers. This recidivist behavior is consistent with previous results found for
Portuguese firms by Bonfim et al (2012). However, when we interact this variable with the
interest rate in the moment loans were granted (column III), we do not find any statistically
significant effect. Recidivism is independent of the level of interest rates when loans are
granted.
Looking across the board at the role of bank characteristics shown at the bottom of
the table, we find that ex-post default probabilities are higher for loans granted by larger
banks, as well as for banks with more capital and less liquidity. When we interact these bank
20
characteristics with the level of interest rates at loan origination (columns IV to VI), the
only significant results refer to capital ratios. This means that the previous result stating
that banks with more capital grant loans with a higher default probability is mitigated
when interest rates are lower. Bank size and liquidity do not play a role. When we further
interact these variables with the dummy proxing for loan quality, in order to get closer to
the specifications implemented for the ex-ante analysis, we do not obtain any additional
result (columns VII to IX).
To be consistent with the analysis of ex-ante risk-taking, we run sample splits by firm and
bank size. Regarding firm size, the ex-post risk-taking channel does not work independently
of the size of the firm (columns XI and XII). In turn, regarding bank size we find some
interesting differences (columns XIII and XIV). There is evidence supporting the existence
of ex-post effects of risk-taking when interest rates are low especially for large banks. Finally,
the lack of evidence of a risk-taking channel working ex-post across all firms and banks does
not depend on the way we measure monetary policy stance, given that the results are similar
when we consider Taylor residuals instead of monetary policy rates (column XV).
We conclude that the results from the survival analysis show that the risk-taking channel
does not have relevant ex-post consequences in terms of financial stability. In the next
subsection we look at another possible way to identify the impact of the risk-taking channel
on ex-post loan performance.
6.2 Are loans granted when policy rates are lower more likely to
default when interest rates increase?
The results of the previous sub-section suggest that loans granted during periods of lower
interest rates do not contribute to a significant deterioration in the overall loan portfolio
quality. In this section, we explore a related issue. Instead of analyzing how default prob-
abilities evolve in general, taking the level of interest rates at loan approval as given, we
focus our attention specifically on what happens to loans granted during low interest rates
periods when rates increase. It should be expected that riskier borrowers are more sensitive
to interest rate hikes, which may stretch their debt servicing capacity.
Instead of looking at the whole interest rate cycle, we zoom in a particularly interesting
period for analysis. Monetary policy interest rates in the euro area began to increase
in December 2005, after a prolonged period of low and stable interest rates. The ECB
maintained the main policy interest rate fixed at the historical minimum of 2 per cent
during a period of more than two years (between June 2003 and December 2005). Around
October 2005 the ECB communication changed, signaling a possible increase in interest
21
rates. This lead to a substantial revision of interest rate expectations, as illustrated in
Figure 2. This revision was fast and sizeable. We believe that focusing on this period
provides a great framework to address the interaction between risk-taking behaviors in low
interest rate periods and the ex-post performance of the loans.
We implement a differences-in-differences approach (DID). To grasp the effect of an
increase in interest rates after a relatively long period of accommodative monetary policy,
we compare two groups of loans: the treatment group includes the loans granted immediately
before interest rates began to increase in December 2005, when interest rate expectations
were still anchored at low levels (January to September 2005). The loans in the control
group are those granted in the period when interest rates were still low, but interest rate
expectations had increased markedly (October 2005 to March 2006). The main difference
between the loans granted in the treatment and control groups is related to the level of
interest rate expectations, as the level of interest rates in itself remained low in both periods.
Furthermore, the effective interest rates charged by banks on loans granted to firms between
January 2005 and March 2006 was very similar, as illustrated in Figure 2.
The performance of these two groups of loans is then compared in two different moments:
we consider the probability of default before and after the monetary policy interest rate
starts to increase (after = 0 and after = 1, respectively). This setting provides a unique
opportunity to identify risk-taking behaviors. We are able to compare loans granted with
similar levels of effective interest rates, but with underlying different expectations regarding
the future path of monetary policy. We are thus able to test whether banks take more risk
when they believe that interest rates will remain low for a long period. In this setting, risk
is measured by borrowers’ sensitivity to interest rate hikes.
Our analysis would support the existence of a risk-taking channel if loans granted during
the period of low and stable interest rate expectations show a higher default probability when
interest rates increase.
Table 8 presents the results of the DID estimation, where we estimate a probit model
for the probability of default of the firm (equation 4).10 We obtain a negative coefficient on
the treatment variable. This means that loans granted when interest rate expectations are
low are generally less likely to default. The coefficient on the after variable is also negative
in most specifications, suggesting that when interest rates increase, default probabilities are
actually lower. However, this result is slightly less consistent than the previous one.
The coefficient on the interaction term provides the main test to our hypothesis. The
coefficient is positive and significant in most of the specifications considered, meaning that
10For consistency reasons with previous sections, we considered default episodes in two consecutive quar-ters. The results are robust to the consideration of default in only one quarter.
22
loans granted in the period of low and stable interest rates are more likely to default when
interest rates increase relative to the loans granted when policy interest rate rises were
already expected. This result provides new evidence on an important dimension of the risk-
taking channel. Banks take more credit risk when policy rates are expected to remain low
for a considerable horizon, though this risk only materializes when interest rates increase.
As already mentioned, this result holds across many specifications. We should thus
briefly summarize the reasoning behind each specification presented in Table 8. In the first
column we show the results for the main variables of interest (treatment, after and the in-
teraction term), controlling for bank, borrower and macroeconomic variables. In columns II
and III we present the results using standard errors multi-clustered at the quarter and bank
and at the quarter, bank and firm level respectively, instead of only at the quarter level.
In column IV we go back to clustering at the quarter level and add sectoral controls. The
interaction term that captures risk-taking remains almost unchanged across these specifica-
tions.
In columns V to VII we analyze the role of bank characteristics in the transmission
of the risk-taking channel, as we did in the previous tables.11 Again, we find evidence in
favor of greater risk-taking by larger banks and especially by banks with higher liquidity
ratios. This provides further support of the hypothesis of risk-shifting for banks with poor
managerial incentives. In columns VIII and XI we run again sample splits according to
firm and bank size. We find that there is risk-taking across all firm size categories, though
slightly stronger for smaller firms, and across all bank size categories.
All in all, the results presented in this section provide support to the existence of a risk-
taking channel in prolonged periods of low interest rates, which materializes once interest
rates start to increase.
7 Concluding remarks
Banks play a key role in the transmission of monetary policy. Banks’ lending decisions
are shaped by the stance of monetary policy. While most of the classic literature on the
transmission of monetary policy focused on volumes, more recently the quality of credit
granted has also deserved a lot of attention. The more recent literature on the risk-taking
channel thus asks whether loans granted when monetary policy is more accommodative are
generally riskier.
11Unlike what we did in previous tables, from these columns onwards the results use only quarterlyclustering, as the multi-clustering procedure is excessively demanding for the narrow estimation windowbehind this identification strategy.
23
Many recent papers offer evidence supporting the existence of this channel. However,
the fast expansion of this literature led to scattered evidence, obtained under inconsistent
analytical frameworks and methodologies. In this paper we analyze the risk-taking channel
through different angles, using detailed bank and borrower information over time. We looked
at the risk-taking channel from an ex-ante and an ex-post perspective and considered both
intensive and extensive margins. We tracked loan performance over time and we analyzed
what happens to loans granted when interest rates were low for a long time once rates
increase.
We obtain evidence supporting the existence of the risk-taking channel along different
dimensions. When we consider the information that banks have when granting a loan, we
find that banks take more risk when interest rates are lower, but only at the extensive
margin. When we track loan performance over time, we find that the level of policy interest
rates does not have a significant impact on the overall loan portfolio quality, when looking
at a full interest rate cycle. However, when we zoom in into the period of low policy rates,
we find a higher sensitivity to interest rate hikes from loans granted in a period of low
and stable interest rates. These loans are being compared with loans with very similar
conditions, with the only relevant difference being the prevailing expectations about the
future path of interest rates. Banks take more credit risk when policy rates are expected
to remain low for a considerable horizon, though this risk only materializes when interest
rates increase.
We also explore the role of firms’ and banks’ heterogeneity in the risk-taking channel.
The results regarding firm size are mixed, depending on the way we look at the risk-taking
channel. At the extensive margin, risk-taking is stronger for large firms when we consider
being in default as the measure of riskiness. In contrast, when we proxy riskiness by lending
to first time borrowers, we find that risk-taking is more concentrated in loans to the smallest
firms. We also find that smaller firms are more sensitive to interest rate hikes.
Regarding bank size, our results suggest that risk-taking behaviors are common across
all bank-size categories, despite some differences in intensity. The results seem to point to
higher intensity of risk-taking by large banks.
These heterogeneous results on firm and bank size highlight the relevance of looking at
the risk-taking channel through different angles. To further explore this heterogeneity, we
also consider the role of banks’ capital and liquidity. We find that risk-taking is stronger
for less capitalized banks. This is consistent with previous empirical and theoretical evi-
dence (Jimenez et al. 2014, Diamond and Rajan, 2012). Banks closer to minimum capital
requirements are less likely to fully internalize the potential consequences of the risks taken.
Moreover, there is also some evidence that banks with more liquidity may also take more
24
risk, in line with the literature of risk-shifting strategies for banks with poor managerial
incentives (Acharya and Naqvi, 2012).
These results have important policy implications. Interactions between monetary policy
and financial stability should be especially taken into account during prolonged periods
of accommodative monetary policy. While for monetary policy purposes, an expansion of
credit would be desirable in times of high macroeconomic risk, this could have undesired
effects on banks’ soundness. Thus, this may call for an active role of macroprudential policy
in taming possible undesirable effects of monetary policy.
This may be especially important after a decade during which central banks in advanced
economies promoted a huge expansion of liquidity to fight the lasting consequences of the
global financial crisis. This prolonged environment of very low interest rates and ample
liquidity may have offered incentives for some banks to engage in risk-taking strategies,
lending to riskier borrowers as a way to boost short term profitability. Our results show
that this behavior was possibly more prevalent among banks with weaker capital ratios.
Crucially, our analysis also suggests that the effects of these risky strategies will become
apparent only when interest rates increase again.
25
References
Acharya, V. and H. Naqvi (2012), “The seeds of a crisis: A theory of bank liquidity and
risk-taking over the business cycle”, Journal of Financial Economics, 106(2), 349-366
Adrian, T. and H.S. Shin (2008), “Financial intermediaries, financial stability and mon-
etary policy”, Proceedings of the Economic Policy Symposium - Jackson Hole, Federal
Reserve Bank of Kansas City, 287-334
Adrian, T. and H.S. Shin (2010a), “Liquidity and leverage”, Journal of Financial
Intermediation, 19(3), 418-437
Adrian, T. and H.S. Shin (2010b), ”Financial intermediaries and monetary economics”,
in Friedman, B. M. and M. Woodford (Ed.), Handbook of Monetary Economics, Elsevier,
New York, 601–650
Afanasyeva, E. and J. Guntner (2015), “Lending Standards, Credit Booms, and Mone-
tary Policy”, Hoover Institution Economics working papers 15115
Altunbas, Y., L. Gambacorta and D. Marquez-Ibanez (2010), ”Does monetary policy
affect bank risk-taking?”, International Journal of Central Banking, 10, 95–135
Angeloni, I., E. Faia and M. Lo Duca (2015), “Monetary policy and risk-taking”, Jour-
nal of Economic Dynamics and Control, 52(C), 285-307
Bonfim, D., D. Dias and C. Richmond (2012), “What happens after default? Stylized
facts on access to credit”, Journal of Banking and Finance, 36(7), 2007-2025.
Borio, C. and H. Zhu (2012), “Capital regulation, risk-taking and monetary policy: a
missing link in the transmission mechanism”, Journal of Financial Stability, 8, 236-251
Brissimis, S.N., and M.D. Delis (2010), “Bank heterogeneity and monetary policy trans-
mission”, ECB Working Paper no 1233
Bruno, V. and H. S. Shin (2015), “Capital flows and the risk-taking channel of monetary
policy”, Journal of Monetary Economics, 71: 119-132
Buch, C. M., S. Eickmeier and E. Prieto (2014), ”In search for yield? Survey-based
evidence on bank risk taking”, Journal of Economic Dynamics and Control, Elsevier,
vol. 43(C), 12-30
Cameron, C., J. Gelbach and D. L. Miller (2011), “Robust Inference with Multi-way
Clustering”, Journal of Business and Economic Statistics, 29 (2), 238-249
Cameron, C., and D. L. Miller (2015), “A Practitioner’s Guide to Cluster-Robust Infer-
ence”, Journal of Human Resources, 50, 2: 317-372
Cesa-Bianchi, A. and A. Rebucci (2017), “Does Easing Monetary Policy Increase Finan-
cial Instability?”, Journal of Financial Stability, 30, 111-125.
26
Correia, S. (2017), “Linear Models with High-Dimensional Fixed Effects: An Efficient
and Feasible Estimator”, Working Paper. http://scorreia.com/research/hdfe.pdf
De Nicolo, G., G. Dell’Ariccia, L. Laeven and F. Valencia (2010), “Monetary policy and
bank risk-taking”, IMF Staff Position Note 10/09
Delis, M. D., I. Hasan and N. Mylonidis (2017), “The risk-taking channel of monetary
policy in the U.S.: Evidence from corporate loan data”, Journal of Money Credit and
Banking, 49(1), 187213
Delis, M.D. and G.P. Kouretas (2011), “Interest rates and bank risk-taking”, Journal
of Banking and Finance, 35, 840-855
Dell’Ariccia, G.D., L. Laeven and R. Marquez (2011), “Monetary policy, leverage and
bank risk-taking”, Journal of Economic Theory, 149, 65-99
Dell’Ariccia, G., L. Laeven and G. Suarez (2017), “Bank leverage and monetary policy’s
risk-taking channel: evidence from the United States”, Journal of Finance, 72(2), 613-654
Diamond, D. W. (1991), ”Monitoring and Reputation: The Choice between Bank Loans
and Directly Placed Debt”, Journal of Political Economy, 9 (4), 689-721
Diamond, D.W. and R.G. Rajan (2012), “Illiquid banks, financial stability and interest
rate policy”, Journal of Political Economy, 120(3), 552-591
Freixas, X. and J. C. Rochet (2008), Microeconomics of banking, MIT Press, second
edition
Gaggl, P. and M.T. Valderrama (2011), “Do banks take more risk in extended periods
of expansive monetary policy? Evidence from a natural experiment”, unpublished
Gambacorta, L. (2009), “Monetary policy and the risk-taking channel”, BIS Quarterly
Review, December 2009
Gersl, A., P. Jakubık, D. Kowalczyk, S. Ongena and J.L. Peydro (2015), “Monetary
Conditions and Banks´ Behaviour in the Czech Republic”, Open Economies Review,
Springer, vol. 26(3), 407-445
Gonzalez-Aguado, C. and J. Suarez (2015), “Interest rates and credit risk”, Journal of
Money, Credit and Banking, Vol. 47, No. 2–3: 445-480
Ioannidou, V., S. Ongena and J.L. Peydro (2015), “Monetary policy, risk-taking and
pricing: Evidence from a quasi-natural experiment”, Review of Finance, European Fi-
nance Association, vol. 19(1), 95-144
Ivashina, V. and D. Scharfstein (2010), “Bank lending during the financial crisis of 2008”,
Journal of Financial Economics, vol. 97(3), 319-338
Jimenez, G., S. Ongena, J.L. Peydro and J. Saurina (2014), “Hazardous Times for Mon-
etary Policy: What Do Twenty-Three Million Bank Loans Say About the Effects of Mone-
27
tary Policy on Credit Risk-Taking? Entropic Latent Variable Integration via Simulation”,
Econometrica, 82(2), 463-505
Jimenez, G., S. Ongena, J.L. Peydro and J. Saurina (2012), ”Credit supply and mone-
tary policy: identifying the bank balance-sheet channel with loan applications”, American
Economic Review, 102(5): 2301-2326
Kashyap, A. and J. Stein (2000), ”What do a million observations on banks say about
the transmission of monetary policy?”, American Economic Review, 90:3, 407-428
Maddaloni, A. and J.L. Peydro (2011), “Bank risk-taking, securitization, supervision and
low interest rates – Evidence from the Euro area and the US lending standards”, Review
of Financial Studies, 24, 2121-2165
Morais, B, J.L. Peydro and C. Ruiz (2017), “The International Bank Lending Chan-
nel of Monetary Policy Rates and QE: Credit Supply, Reach-for-Yield, and Real Effects”,
forthcoming in Journal of Finance
Morris, S. and H.S. Shin (2014), “Risk-Taking Channel of Monetary Policy: A Global
Game Approach”, working paper, Princeton University
Paligorova, T. and J. A. C. Santos (2017), “Monetary policy and bank risk-taking:
Evidence from the corporate loan market, ”, Journal of Financial Intermediation, 30,
35-49
Peek J. and E. Rosengren (2005), ”Unnatural Selection: Perverse Incentives and the
Misallocation of Credit in Japan”, American Economic Review, vol. 95(4), 1144-1166
Petersen, M. (2009), ”Estimating Standard Errors in Finance Panel Data Sets: Com-
paring Approaches”, Review of Financial Studies, 22(1), 435-480.
Thakor, A. (2013), ”Incentives to innovate and financial crises”, Journal of Financial
Economics, 103(1), 130-148
Valencia, F. (2014), “Monetary policy, bank leverage and financial stability”, Journal
of Economic Dynamics and Control, Elsevier, vol. 47(C), pages 20-38.
28
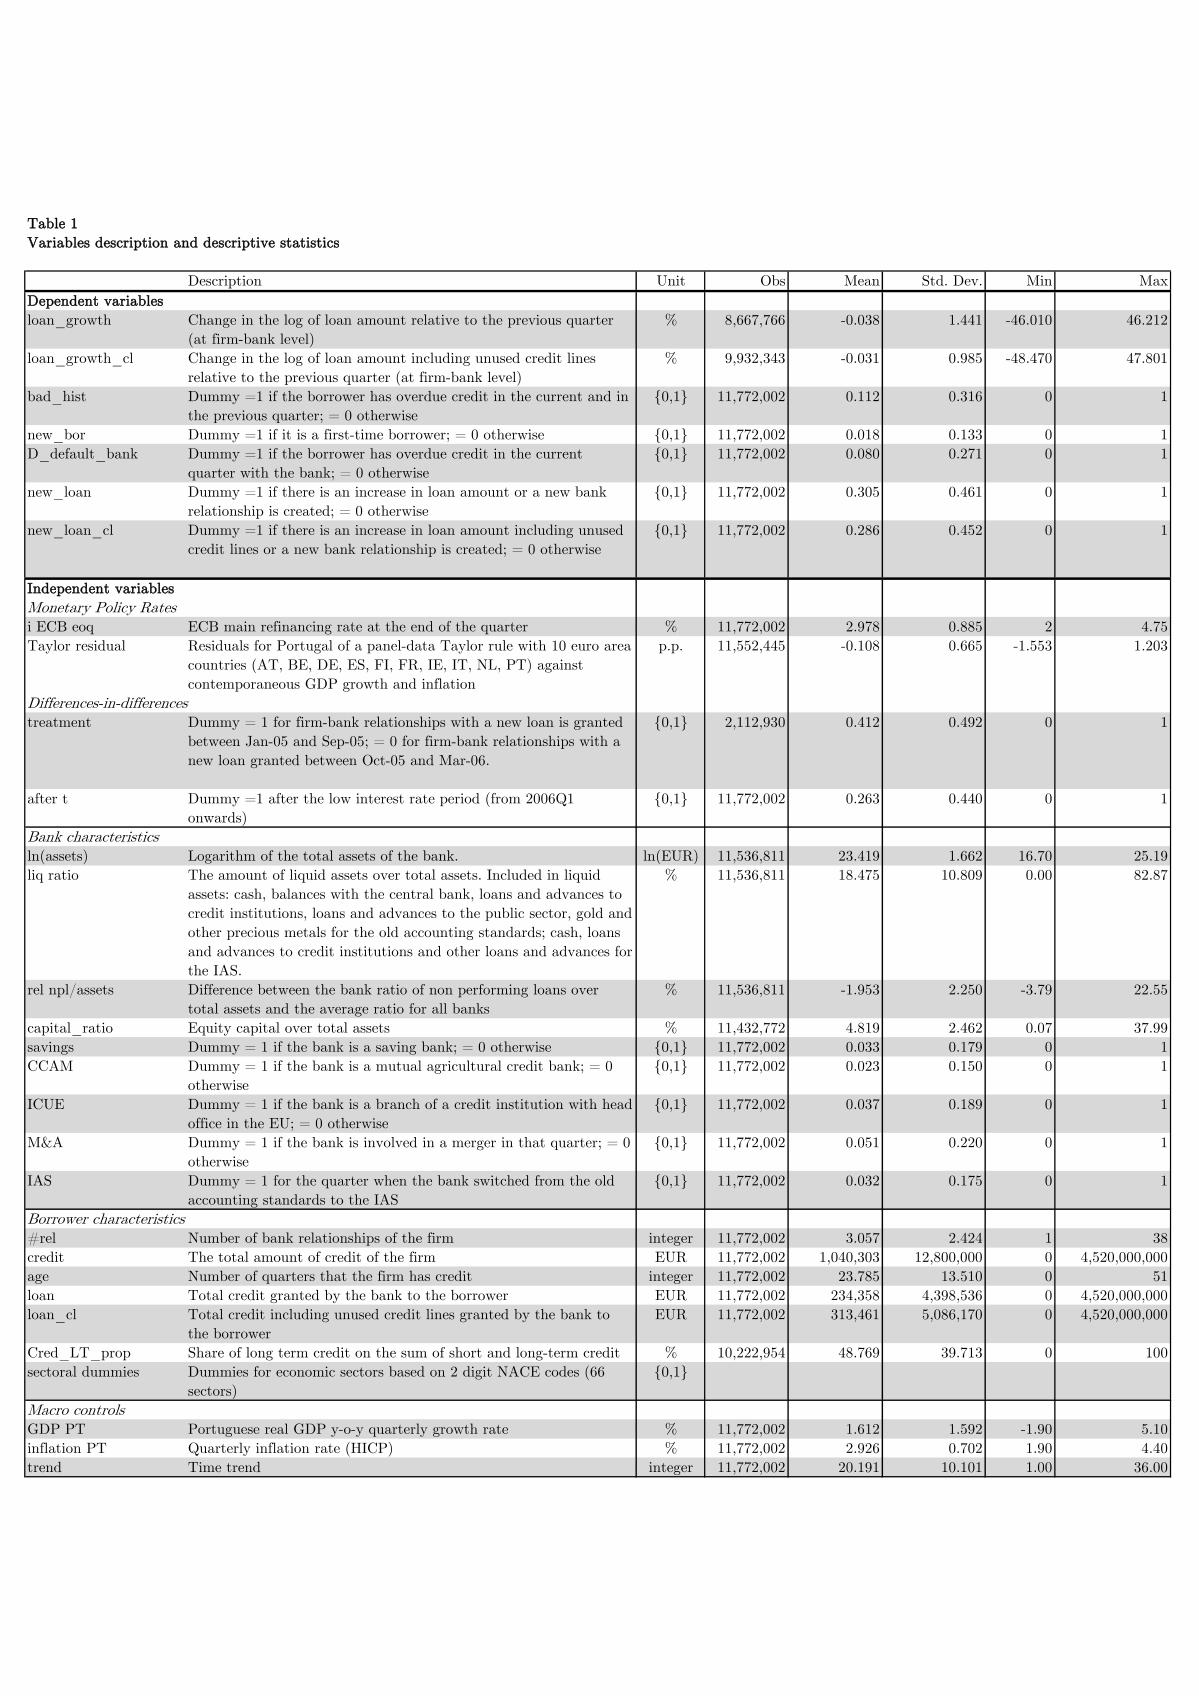
Table 1
Variables description and descriptive statistics
Description Unit Obs Mean Std. Dev. Min Max
Dependent variables
loan_growth Change in the log of loan amount relative to the previous quarter
(at firm-bank level)
% 8,667,766 -0.038 1.441 -46.010 46.212
loan_growth_cl Change in the log of loan amount including unused credit lines
relative to the previous quarter (at firm-bank level)
% 9,932,343 -0.031 0.985 -48.470 47.801
bad_hist Dummy =1 if the borrower has overdue credit in the current and in
the previous quarter; = 0 otherwise
{0,1} 11,772,002 0.112 0.316 0 1
new_bor Dummy =1 if it is a first-time borrower; = 0 otherwise {0,1} 11,772,002 0.018 0.133 0 1
D_default_bank Dummy =1 if the borrower has overdue credit in the current
quarter with the bank; = 0 otherwise
{0,1} 11,772,002 0.080 0.271 0 1
new_loan Dummy =1 if there is an increase in loan amount or a new bank
relationship is created; = 0 otherwise
{0,1} 11,772,002 0.305 0.461 0 1
new_loan_cl Dummy =1 if there is an increase in loan amount including unused
credit lines or a new bank relationship is created; = 0 otherwise
{0,1} 11,772,002 0.286 0.452 0 1
Independent variables
Monetary Policy Rates
i ECB eoq ECB main refinancing rate at the end of the quarter % 11,772,002 2.978 0.885 2 4.75
Taylor residual Residuals for Portugal of a panel-data Taylor rule with 10 euro area
countries (AT, BE, DE, ES, FI, FR, IE, IT, NL, PT) against
contemporaneous GDP growth and inflation
p.p. 11,552,445 -0.108 0.665 -1.553 1.203
Differences-in-differences
treatment Dummy = 1 for firm-bank relationships with a new loan is granted
between Jan-05 and Sep-05; = 0 for firm-bank relationships with a
new loan granted between Oct-05 and Mar-06.
{0,1} 2,112,930 0.412 0.492 0 1
after t Dummy =1 after the low interest rate period (from 2006Q1
onwards)
{0,1} 11,772,002 0.263 0.440 0 1
Bank characteristics
ln(assets) Logarithm of the total assets of the bank. ln(EUR) 11,536,811 23.419 1.662 16.70 25.19
liq ratio The amount of liquid assets over total assets. Included in liquid
assets: cash, balances with the central bank, loans and advances to
credit institutions, loans and advances to the public sector, gold and
other precious metals for the old accounting standards; cash, loans
and advances to credit institutions and other loans and advances for
the IAS.
% 11,536,811 18.475 10.809 0.00 82.87
rel npl/assets Difference between the bank ratio of non performing loans over
total assets and the average ratio for all banks
% 11,536,811 -1.953 2.250 -3.79 22.55
capital_ratio Equity capital over total assets % 11,432,772 4.819 2.462 0.07 37.99
savings Dummy = 1 if the bank is a saving bank; = 0 otherwise {0,1} 11,772,002 0.033 0.179 0 1
CCAM Dummy = 1 if the bank is a mutual agricultural credit bank; = 0
otherwise
{0,1} 11,772,002 0.023 0.150 0 1
ICUE Dummy = 1 if the bank is a branch of a credit institution with head
office in the EU; = 0 otherwise
{0,1} 11,772,002 0.037 0.189 0 1
M&A Dummy = 1 if the bank is involved in a merger in that quarter; = 0
otherwise
{0,1} 11,772,002 0.051 0.220 0 1
IAS Dummy = 1 for the quarter when the bank switched from the old
accounting standards to the IAS
{0,1} 11,772,002 0.032 0.175 0 1
Borrower characteristics
#rel Number of bank relationships of the firm integer 11,772,002 3.057 2.424 1 38
credit The total amount of credit of the firm EUR 11,772,002 1,040,303 12,800,000 0 4,520,000,000
age Number of quarters that the firm has credit integer 11,772,002 23.785 13.510 0 51
loan Total credit granted by the bank to the borrower EUR 11,772,002 234,358 4,398,536 0 4,520,000,000
loan_cl Total credit including unused credit lines granted by the bank to
the borrower
EUR 11,772,002 313,461 5,086,170 0 4,520,000,000
Cred_LT_prop Share of long term credit on the sum of short and long-term credit % 10,222,954 48.769 39.713 0 100
sectoral dummies Dummies for economic sectors based on 2 digit NACE codes (66
sectors)
{0,1}
Macro controls
GDP PT Portuguese real GDP y-o-y quarterly growth rate % 11,772,002 1.612 1.592 -1.90 5.10
inflation PT Quarterly inflation rate (HICP) % 11,772,002 2.926 0.702 1.90 4.40
trend Time trend integer 11,772,002 20.191 10.101 1.00 36.00

Table 2
Risk-taking at the intensive margin: loan growth and interest rates
I II III IV V VI VII VIII IX X XI XII
Coef. Coef. Coef. Coef. Coef. Coef. Coef. Coef. Coef. Coef. Coef. Coef.
S.e. S.e. S.e. S.e. S.e. S.e. S.e. S.e. S.e. S.e. S.e. S.e.
i*bad_hist t-1 -0.018** -0.018 0.001 0.001 -0.001 -0.001 0.001 -0.002 0.005 0.004 -0.003 0.002
(0.009) (0.014) (0.005) (0.005) (0.005) (0.006) (0.007) (0.016) (0.007) (0.006) (0.006) (0.007)
i*bad_hist t-1 * liq_ratio t-1 0.000
(0.000)
i*bad_hist t-1 * capital_ratio t-1 -0.000
(0.001)
i*bad_hist t-1 * ln(assets) t-1 0.000
(0.001)
i ECB eoq t-1 0.016 0.016 -0.006 -0.006 -0.008 -0.006 -0.006 -0.006 0.015 -0.019 0.024 -0.037
(0.014) (0.018) (0.030) (0.030) (0.025) (0.030) (0.031) (0.030) (0.044) (0.019) (0.045) (0.038)
bad_hist t-1 0.112*** 0.112** -0.026 -0.026 -0.023 -0.025 -0.026 -0.026 0.002 -0.055*** -0.015 -0.032
(0.026) (0.051) (0.016) (0.016) (0.014) (0.016) (0.015) (0.016) (0.021) (0.013) (0.018) (0.023)
liq_ratio t-1 -0.002*** -0.002 -0.000 -0.000 -0.000 -0.000 -0.000 -0.000 -0.000 -0.000 -0.001 0.001
(0.001) (0.001) (0.001) (0.001) (0.001) (0.001) (0.001) (0.001) (0.001) (0.001) (0.001) (0.002)
capital_ratio t-1 0.003 0.003 -0.000 -0.000 -0.000 -0.000 -0.000 -0.000 -0.001 -0.000 -0.001 0.001
(0.004) (0.005) (0.003) (0.003) (0.002) (0.003) (0.003) (0.003) (0.003) (0.004) (0.001) (0.013)
ln(assets) t-1 0.139*** 0.139** 0.038 0.038 0.037 0.038 0.038 0.038 0.003 0.046 -0.038** 0.147
(0.043) (0.060) (0.042) (0.042) (0.037) (0.042) (0.042) (0.042) (0.039) (0.048) (0.017) (0.073)
bank variables yes yes yes yes yes yes yes yes yes yes yes yes
borrower variables yes yes yes yes yes yes yes yes yes yes yes yes
inc. unused credit lines no no yes yes yes yes yes yes yes yes yes yes
sectoral dummies no no no no yes no no no no no no no
macro variables yes yes yes yes yes yes yes yes yes yes yes yes
fixed effects relationship relationship relationship relationship relationship relationship relationship relationship relationshiprelationshiprelationship relationship
Clustered s.e. quarter
Nº obs. 6,427,685 6,427,685 6,927,838 6,927,838 5,919,775 6,927,838 6,927,838 6,927,838 2,690,267 904,414 2,568,837 4,359,001
Dependent variable: loan_growth
Small
firms
Large
firms
Small
banks
Large
banks
quarter &
bank
quarter &
bank
quarter &
bank
Note: All variables defined in Table 1. Results of panel data regressions on the dependent variable loan_growth (or loan_growth_cl ) defined as the quarterly growth (log difference) of the loan
amount (or including unused credit lines) at the firm-bank level. Bank variables included and not reported: rel npl/assets, M&A and IAS. Borrower variables included and not reported:
ln(1+#rel), ln(credit), ln(2+age), ln(1+loan) and Cred_LT_prop . Macro variables included and not reported: GDP PT (4 lags) and π PT . A constant and a quadratic trend are also included
but their coefficients are not reported. Columns IX to XII report the results of the regression for sub-samples according to criteria defined in the top of the column. Small (large) firms proxied by
the size of the total credit of the firm: Small firms are below the median, large firms are in the top-10 percentile. Large banks are the 5 largest banks in Portugal, representing around half of the
total corporate loan market; small banks are the remaining ones. Multi-way clustering computed using reghdfe (Correia, 2017). For each variable, we report the coefficient, the standard
deviation (below in italics) and the significance level (* significance at 10 per cent, ** significance at 5 per cent, *** significance at 1 per cent).
quarter &
bank & firm
quarter &
bank
quarter &
bank
quarter quarter &
bank
quarter &
bank
quarter &
bank
quarter &
bank
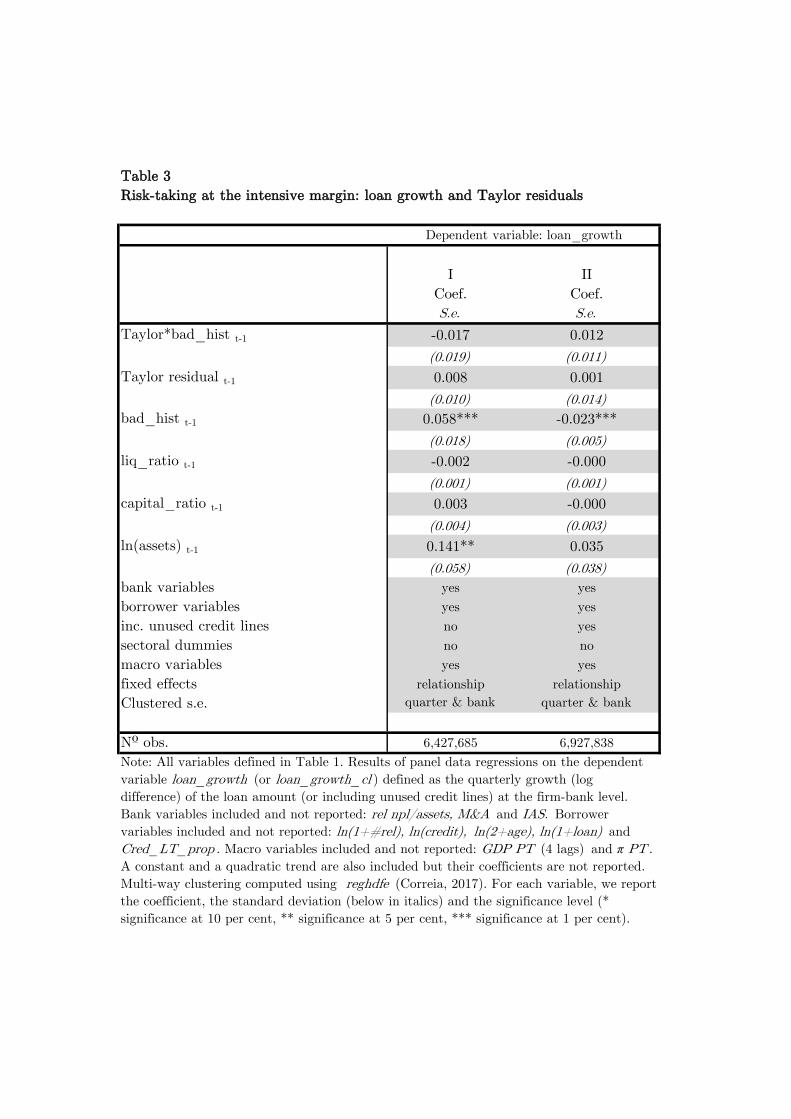
Table 3
Risk-taking at the intensive margin: loan growth and Taylor residuals
I II
Coef. Coef.
S.e. S.e.
Taylor*bad_hist t-1 -0.017 0.012
(0.019) (0.011)
Taylor residual t-1 0.008 0.001
(0.010) (0.014)
bad_hist t-1 0.058*** -0.023***
(0.018) (0.005)
liq_ratio t-1 -0.002 -0.000
(0.001) (0.001)
capital_ratio t-1 0.003 -0.000
(0.004) (0.003)
ln(assets) t-1 0.141** 0.035
(0.058) (0.038)
bank variables yes yes
borrower variables yes yes
inc. unused credit lines no yes
sectoral dummies no no
macro variables yes yes
fixed effects relationship relationship
Clustered s.e.
Nº obs. 6,427,685 6,927,838
Note: All variables defined in Table 1. Results of panel data regressions on the dependent
variable loan_growth (or loan_growth_cl ) defined as the quarterly growth (log
difference) of the loan amount (or including unused credit lines) at the firm-bank level.
Bank variables included and not reported: rel npl/assets, M&A and IAS. Borrower
variables included and not reported: ln(1+#rel), ln(credit), ln(2+age), ln(1+loan) and
Cred_LT_prop . Macro variables included and not reported: GDP PT (4 lags) and π PT .
A constant and a quadratic trend are also included but their coefficients are not reported.
Multi-way clustering computed using reghdfe (Correia, 2017). For each variable, we report
the coefficient, the standard deviation (below in italics) and the significance level (*
significance at 10 per cent, ** significance at 5 per cent, *** significance at 1 per cent).
quarter & bank quarter & bank
Dependent variable: loan_growth
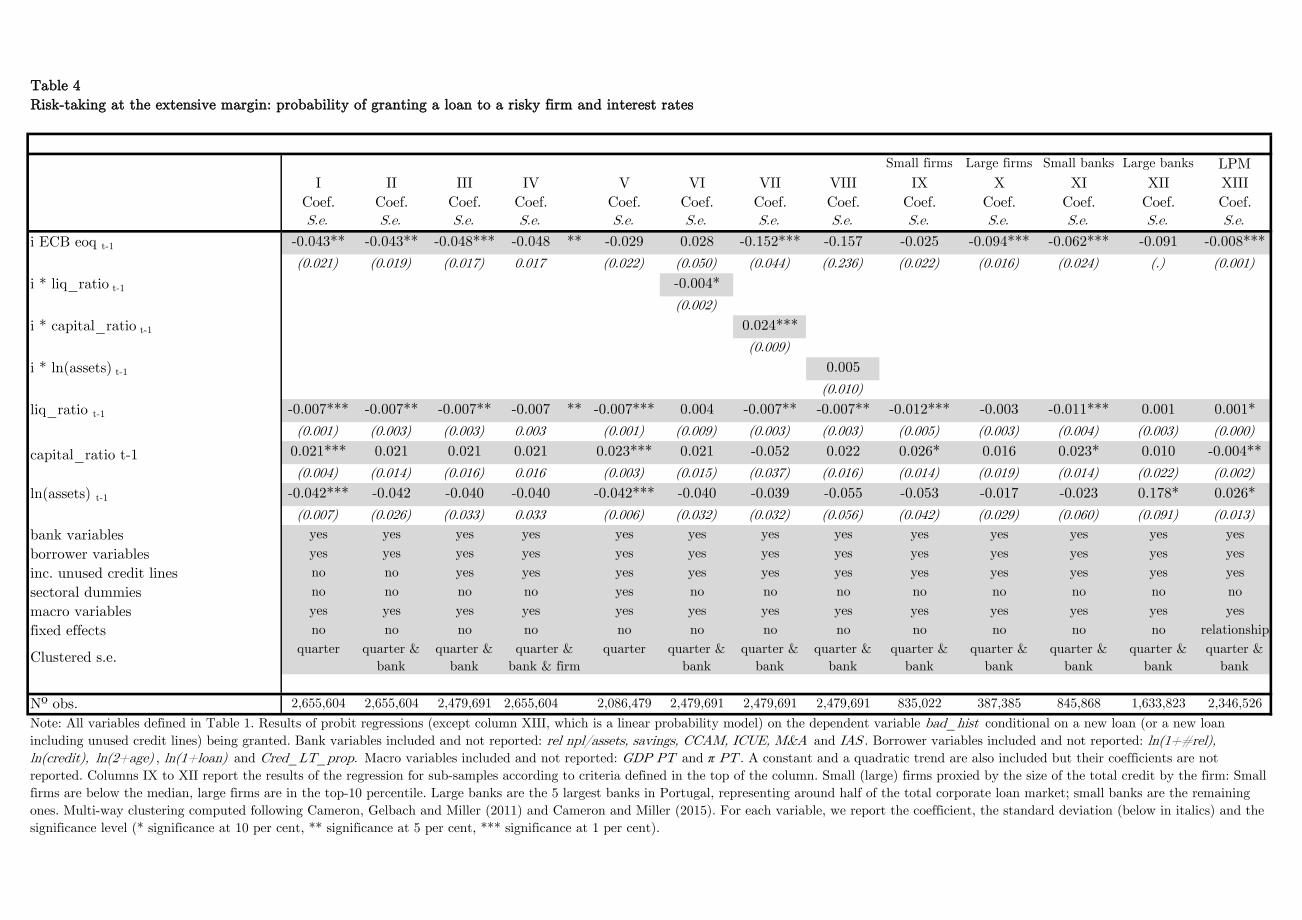
Table 4
Risk-taking at the extensive margin: probability of granting a loan to a risky firm and interest rates
Small firms Large firms Small banks Large banks LPM
I II III IV V VI VII VIII IX X XI XII XIII
Coef. Coef. Coef. Coef. Coef. Coef. Coef. Coef. Coef. Coef. Coef. Coef. Coef.
S.e. S.e. S.e. S.e. S.e. S.e. S.e. S.e. S.e. S.e. S.e. S.e. S.e.
i ECB eoq t-1 -0.043** -0.043** -0.048*** -0.048 ** -0.029 0.028 -0.152*** -0.157 -0.025 -0.094*** -0.062*** -0.091 -0.008***
(0.021) (0.019) (0.017) 0.017 (0.022) (0.050) (0.044) (0.236) (0.022) (0.016) (0.024) (.) (0.001)
i * liq_ratio t-1 -0.004*
(0.002)
i * capital_ratio t-1 0.024***
(0.009)
i * ln(assets) t-1 0.005
(0.010)
liq_ratio t-1 -0.007*** -0.007** -0.007** -0.007 ** -0.007*** 0.004 -0.007** -0.007** -0.012*** -0.003 -0.011*** 0.001 0.001*
(0.001) (0.003) (0.003) 0.003 (0.001) (0.009) (0.003) (0.003) (0.005) (0.003) (0.004) (0.003) (0.000)
capital_ratio t-1 0.021*** 0.021 0.021 0.021 0.023*** 0.021 -0.052 0.022 0.026* 0.016 0.023* 0.010 -0.004**
(0.004) (0.014) (0.016) 0.016 (0.003) (0.015) (0.037) (0.016) (0.014) (0.019) (0.014) (0.022) (0.002)
ln(assets) t-1 -0.042*** -0.042 -0.040 -0.040 -0.042*** -0.040 -0.039 -0.055 -0.053 -0.017 -0.023 0.178* 0.026*
(0.007) (0.026) (0.033) 0.033 (0.006) (0.032) (0.032) (0.056) (0.042) (0.029) (0.060) (0.091) (0.013)
bank variables yes yes yes yes yes yes yes yes yes yes yes yes yes
borrower variables yes yes yes yes yes yes yes yes yes yes yes yes yes
inc. unused credit lines no no yes yes yes yes yes yes yes yes yes yes yes
sectoral dummies no no no no yes no no no no no no no no
macro variables yes yes yes yes yes yes yes yes yes yes yes yes yes
fixed effects no no no no no no no no no no no no relationship
Clustered s.e.quarter quarter &
bank
quarter &
bank
quarter quarter &
bank
quarter &
bank
quarter &
bank
quarter &
bank
quarter &
bank
quarter &
bank
quarter &
bank
quarter &
bank
Nº obs. 2,655,604 2,655,604 2,479,691 2,655,604 2,086,479 2,479,691 2,479,691 2,479,691 835,022 387,385 845,868 1,633,823 2,346,526
Note: All variables defined in Table 1. Results of probit regressions (except column XIII, which is a linear probability model) on the dependent variable bad_hist conditional on a new loan (or a new loan
including unused credit lines) being granted. Bank variables included and not reported: rel npl/assets, savings, CCAM, ICUE, M&A and IAS . Borrower variables included and not reported: ln(1+#rel),
ln(credit), ln(2+age) , ln(1+loan) and Cred_LT_prop. Macro variables included and not reported: GDP PT and π PT . A constant and a quadratic trend are also included but their coefficients are not
reported. Columns IX to XII report the results of the regression for sub-samples according to criteria defined in the top of the column. Small (large) firms proxied by the size of the total credit by the firm: Small
firms are below the median, large firms are in the top-10 percentile. Large banks are the 5 largest banks in Portugal, representing around half of the total corporate loan market; small banks are the remaining
ones. Multi-way clustering computed following Cameron, Gelbach and Miller (2011) and Cameron and Miller (2015). For each variable, we report the coefficient, the standard deviation (below in italics) and the
significance level (* significance at 10 per cent, ** significance at 5 per cent, *** significance at 1 per cent).
quarter &
bank & firm
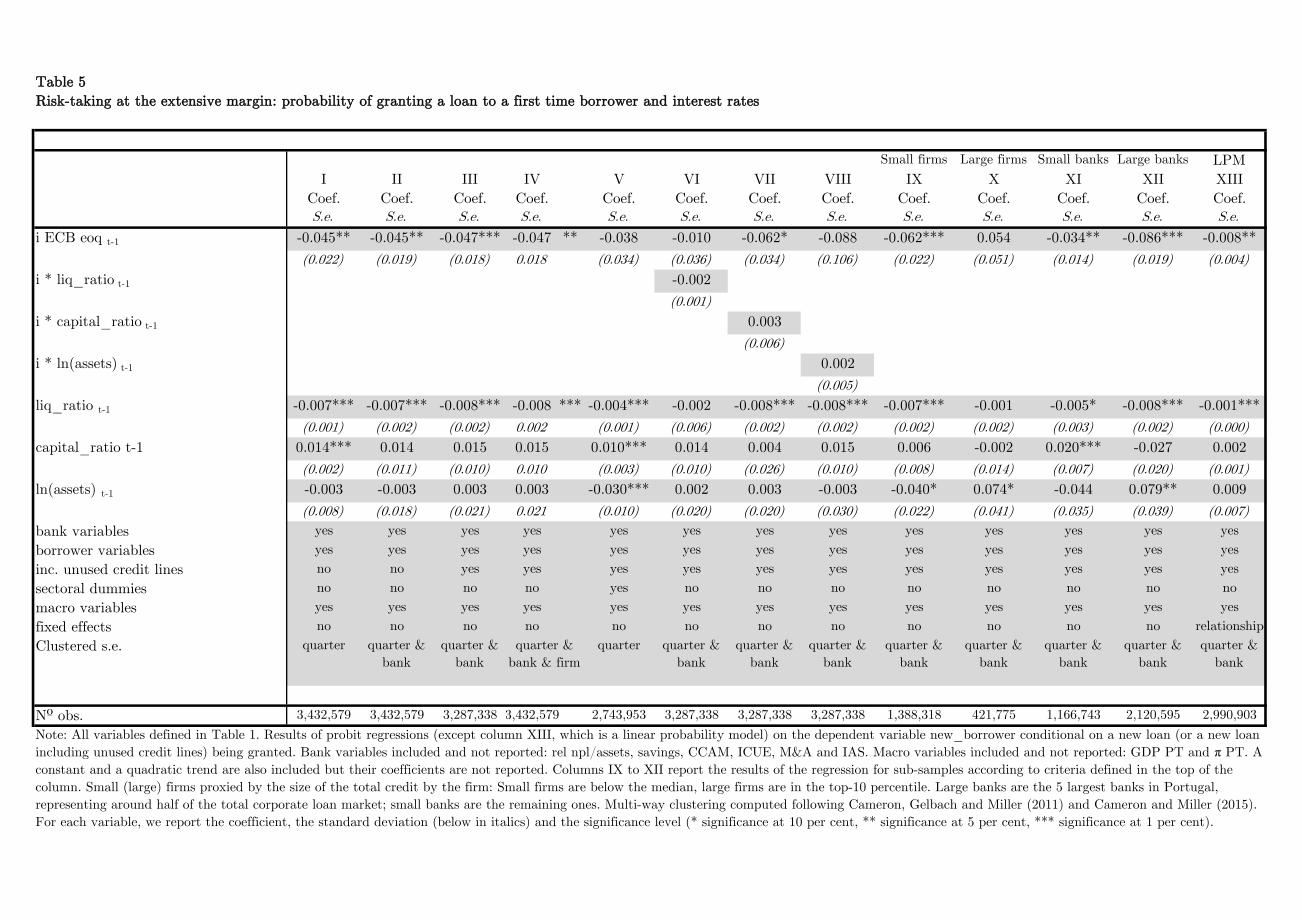
Table 5
Risk-taking at the extensive margin: probability of granting a loan to a first time borrower and interest rates
Small firms Large firms Small banks Large banks LPM
I II III IV V VI VII VIII IX X XI XII XIII
Coef. Coef. Coef. Coef. Coef. Coef. Coef. Coef. Coef. Coef. Coef. Coef. Coef.
S.e. S.e. S.e. S.e. S.e. S.e. S.e. S.e. S.e. S.e. S.e. S.e. S.e.
i ECB eoq t-1 -0.045** -0.045** -0.047*** -0.047 ** -0.038 -0.010 -0.062* -0.088 -0.062*** 0.054 -0.034** -0.086*** -0.008**
(0.022) (0.019) (0.018) 0.018 (0.034) (0.036) (0.034) (0.106) (0.022) (0.051) (0.014) (0.019) (0.004)
i * liq_ratio t-1 -0.002
(0.001)
i * capital_ratio t-1 0.003
(0.006)
i * ln(assets) t-1 0.002
(0.005)
liq_ratio t-1 -0.007*** -0.007*** -0.008*** -0.008 *** -0.004*** -0.002 -0.008*** -0.008*** -0.007*** -0.001 -0.005* -0.008*** -0.001***
(0.001) (0.002) (0.002) 0.002 (0.001) (0.006) (0.002) (0.002) (0.002) (0.002) (0.003) (0.002) (0.000)
capital_ratio t-1 0.014*** 0.014 0.015 0.015 0.010*** 0.014 0.004 0.015 0.006 -0.002 0.020*** -0.027 0.002
(0.002) (0.011) (0.010) 0.010 (0.003) (0.010) (0.026) (0.010) (0.008) (0.014) (0.007) (0.020) (0.001)
ln(assets) t-1 -0.003 -0.003 0.003 0.003 -0.030*** 0.002 0.003 -0.003 -0.040* 0.074* -0.044 0.079** 0.009
(0.008) (0.018) (0.021) 0.021 (0.010) (0.020) (0.020) (0.030) (0.022) (0.041) (0.035) (0.039) (0.007)
bank variables yes yes yes yes yes yes yes yes yes yes yes yes yes
borrower variables yes yes yes yes yes yes yes yes yes yes yes yes yes
inc. unused credit lines no no yes yes yes yes yes yes yes yes yes yes yes
sectoral dummies no no no no yes no no no no no no no no
macro variables yes yes yes yes yes yes yes yes yes yes yes yes yes
fixed effects no no no no no no no no no no no no relationship
Clustered s.e. quarter quarter &
bank
quarter &
bank
quarter quarter &
bank
quarter &
bank
quarter &
bank
quarter &
bank
quarter &
bank
quarter &
bank
quarter &
bank
quarter &
bank
Nº obs. 3,432,579 3,432,579 3,287,338 3,432,579 2,743,953 3,287,338 3,287,338 3,287,338 1,388,318 421,775 1,166,743 2,120,595 2,990,903
Note: All variables defined in Table 1. Results of probit regressions (except column XIII, which is a linear probability model) on the dependent variable new_borrower conditional on a new loan (or a new loan
including unused credit lines) being granted. Bank variables included and not reported: rel npl/assets, savings, CCAM, ICUE, M&A and IAS. Macro variables included and not reported: GDP PT and π PT. A
constant and a quadratic trend are also included but their coefficients are not reported. Columns IX to XII report the results of the regression for sub-samples according to criteria defined in the top of the
column. Small (large) firms proxied by the size of the total credit by the firm: Small firms are below the median, large firms are in the top-10 percentile. Large banks are the 5 largest banks in Portugal,
representing around half of the total corporate loan market; small banks are the remaining ones. Multi-way clustering computed following Cameron, Gelbach and Miller (2011) and Cameron and Miller (2015).
For each variable, we report the coefficient, the standard deviation (below in italics) and the significance level (* significance at 10 per cent, ** significance at 5 per cent, *** significance at 1 per cent).
quarter &
bank & firm
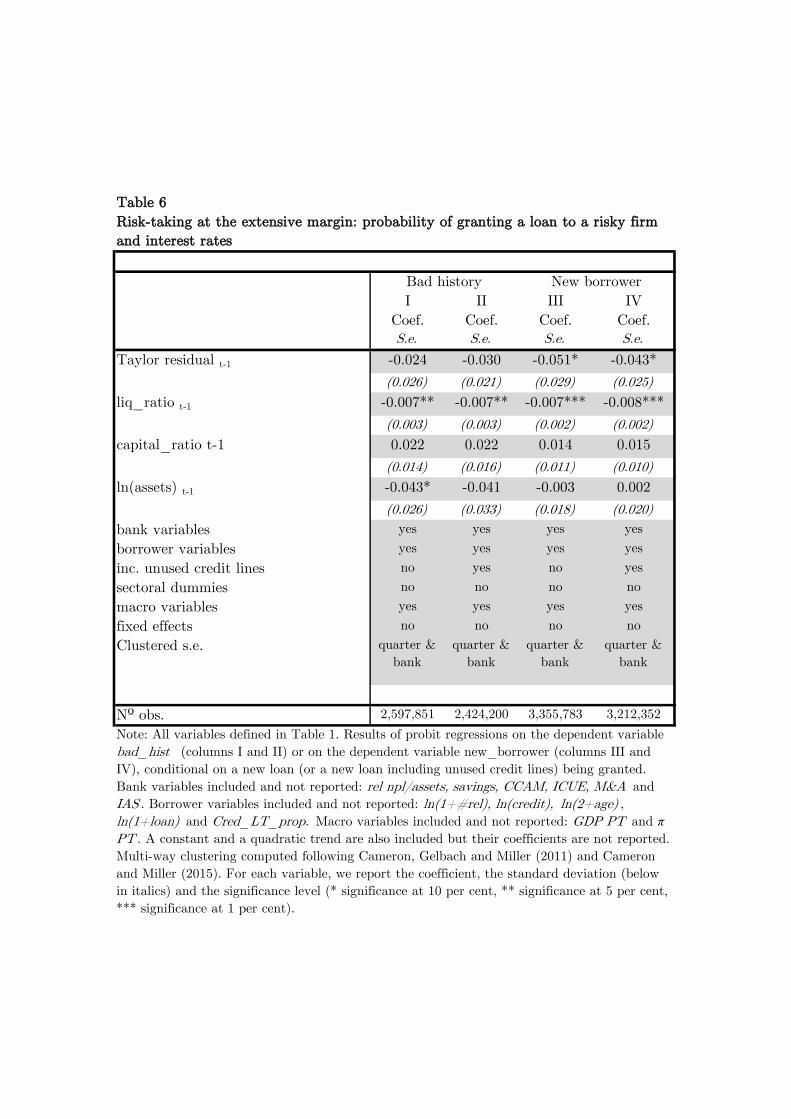
Table 6
I II III IV
Coef. Coef. Coef. Coef.
S.e. S.e. S.e. S.e.
Taylor residual t-1 -0.024 -0.030 -0.051* -0.043*
(0.026) (0.021) (0.029) (0.025)
liq_ratio t-1 -0.007** -0.007** -0.007*** -0.008***
(0.003) (0.003) (0.002) (0.002)
capital_ratio t-1 0.022 0.022 0.014 0.015
(0.014) (0.016) (0.011) (0.010)
ln(assets) t-1 -0.043* -0.041 -0.003 0.002
(0.026) (0.033) (0.018) (0.020)
bank variables yes yes yes yes
borrower variables yes yes yes yes
inc. unused credit lines no yes no yes
sectoral dummies no no no no
macro variables yes yes yes yes
fixed effects no no no no
Clustered s.e. quarter &
bank
quarter &
bank
quarter &
bank
quarter &
bank
Nº obs. 2,597,851 2,424,200 3,355,783 3,212,352
Note: All variables defined in Table 1. Results of probit regressions on the dependent variable
bad_hist (columns I and II) or on the dependent variable new_borrower (columns III and
IV), conditional on a new loan (or a new loan including unused credit lines) being granted.
Bank variables included and not reported: rel npl/assets, savings, CCAM, ICUE, M&A and
IAS . Borrower variables included and not reported: ln(1+#rel), ln(credit), ln(2+age) ,
ln(1+loan) and Cred_LT_prop. Macro variables included and not reported: GDP PT and π
PT . A constant and a quadratic trend are also included but their coefficients are not reported.
Multi-way clustering computed following Cameron, Gelbach and Miller (2011) and Cameron
and Miller (2015). For each variable, we report the coefficient, the standard deviation (below
in italics) and the significance level (* significance at 10 per cent, ** significance at 5 per cent,
*** significance at 1 per cent).
Bad history New borrower
Risk-taking at the extensive margin: probability of granting a loan to a risky firm
and interest rates
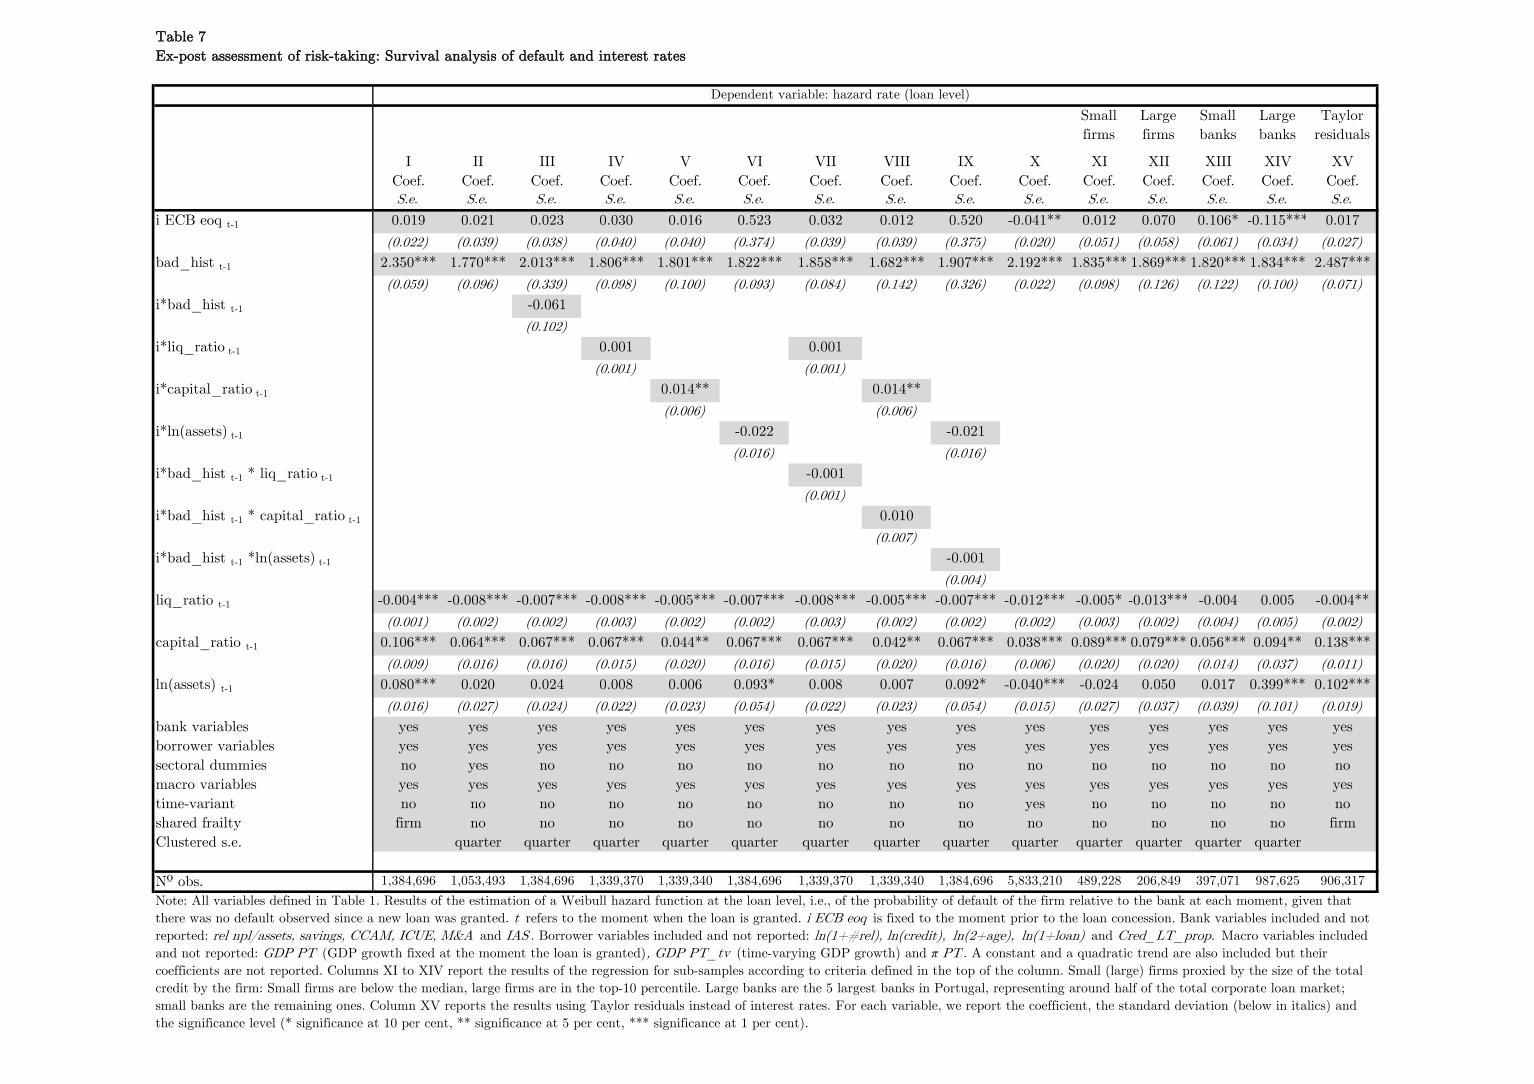
Table 7
Ex-post assessment of risk-taking: Survival analysis of default and interest rates
Small
firms
Large
firms
Small
banks
Large
banks
Taylor
residuals
I II III IV V VI VII VIII IX X XI XII XIII XIV XV
Coef. Coef. Coef. Coef. Coef. Coef. Coef. Coef. Coef. Coef. Coef. Coef. Coef. Coef. Coef.
S.e. S.e. S.e. S.e. S.e. S.e. S.e. S.e. S.e. S.e. S.e. S.e. S.e. S.e. S.e.
i ECB eoq t-1 0.019 0.021 0.023 0.030 0.016 0.523 0.032 0.012 0.520 -0.041** 0.012 0.070 0.106* -0.115*** 0.017
(0.022) (0.039) (0.038) (0.040) (0.040) (0.374) (0.039) (0.039) (0.375) (0.020) (0.051) (0.058) (0.061) (0.034) (0.027)
bad_hist t-1 2.350*** 1.770*** 2.013*** 1.806*** 1.801*** 1.822*** 1.858*** 1.682*** 1.907*** 2.192*** 1.835*** 1.869*** 1.820*** 1.834*** 2.487***
(0.059) (0.096) (0.339) (0.098) (0.100) (0.093) (0.084) (0.142) (0.326) (0.022) (0.098) (0.126) (0.122) (0.100) (0.071)
i*bad_hist t-1 -0.061
(0.102)
i*liq_ratio t-1 0.001 0.001
(0.001) (0.001)
i*capital_ratio t-1 0.014** 0.014**
(0.006) (0.006)
i*ln(assets) t-1 -0.022 -0.021
(0.016) (0.016)
i*bad_hist t-1 * liq_ratio t-1 -0.001
(0.001)
i*bad_hist t-1 * capital_ratio t-1 0.010
(0.007)
i*bad_hist t-1 *ln(assets) t-1 -0.001
(0.004)
liq_ratio t-1 -0.004*** -0.008*** -0.007*** -0.008*** -0.005*** -0.007*** -0.008*** -0.005*** -0.007*** -0.012*** -0.005* -0.013*** -0.004 0.005 -0.004**
(0.001) (0.002) (0.002) (0.003) (0.002) (0.002) (0.003) (0.002) (0.002) (0.002) (0.003) (0.002) (0.004) (0.005) (0.002)
capital_ratio t-1 0.106*** 0.064*** 0.067*** 0.067*** 0.044** 0.067*** 0.067*** 0.042** 0.067*** 0.038*** 0.089*** 0.079*** 0.056*** 0.094** 0.138***
(0.009) (0.016) (0.016) (0.015) (0.020) (0.016) (0.015) (0.020) (0.016) (0.006) (0.020) (0.020) (0.014) (0.037) (0.011)
ln(assets) t-1 0.080*** 0.020 0.024 0.008 0.006 0.093* 0.008 0.007 0.092* -0.040*** -0.024 0.050 0.017 0.399*** 0.102***
(0.016) (0.027) (0.024) (0.022) (0.023) (0.054) (0.022) (0.023) (0.054) (0.015) (0.027) (0.037) (0.039) (0.101) (0.019)
bank variables yes yes yes yes yes yes yes yes yes yes yes yes yes yes yes
borrower variables yes yes yes yes yes yes yes yes yes yes yes yes yes yes yes
sectoral dummies no yes no no no no no no no no no no no no no
macro variables yes yes yes yes yes yes yes yes yes yes yes yes yes yes yes
time-variant no no no no no no no no no yes no no no no no
shared frailty firm no no no no no no no no no no no no no firm
Clustered s.e. quarter quarter quarter quarter quarter quarter quarter quarter quarter quarter quarter quarter quarter
Nº obs. 1,384,696 1,053,493 1,384,696 1,339,370 1,339,340 1,384,696 1,339,370 1,339,340 1,384,696 5,833,210 489,228 206,849 397,071 987,625 906,317
Dependent variable: hazard rate (loan level)
Note: All variables defined in Table 1. Results of the estimation of a Weibull hazard function at the loan level, i.e., of the probability of default of the firm relative to the bank at each moment, given that
there was no default observed since a new loan was granted. t refers to the moment when the loan is granted. i ECB eoq is fixed to the moment prior to the loan concession. Bank variables included and not
reported: rel npl/assets, savings, CCAM, ICUE, M&A and IAS . Borrower variables included and not reported: ln(1+#rel), ln(credit), ln(2+age), ln(1+loan) and Cred_LT_prop. Macro variables included
and not reported: GDP PT (GDP growth fixed at the moment the loan is granted), GDP PT_tv (time-varying GDP growth) and π PT . A constant and a quadratic trend are also included but their
coefficients are not reported. Columns XI to XIV report the results of the regression for sub-samples according to criteria defined in the top of the column. Small (large) firms proxied by the size of the total
credit by the firm: Small firms are below the median, large firms are in the top-10 percentile. Large banks are the 5 largest banks in Portugal, representing around half of the total corporate loan market;
small banks are the remaining ones. Column XV reports the results using Taylor residuals instead of interest rates. For each variable, we report the coefficient, the standard deviation (below in italics) and
the significance level (* significance at 10 per cent, ** significance at 5 per cent, *** significance at 1 per cent).
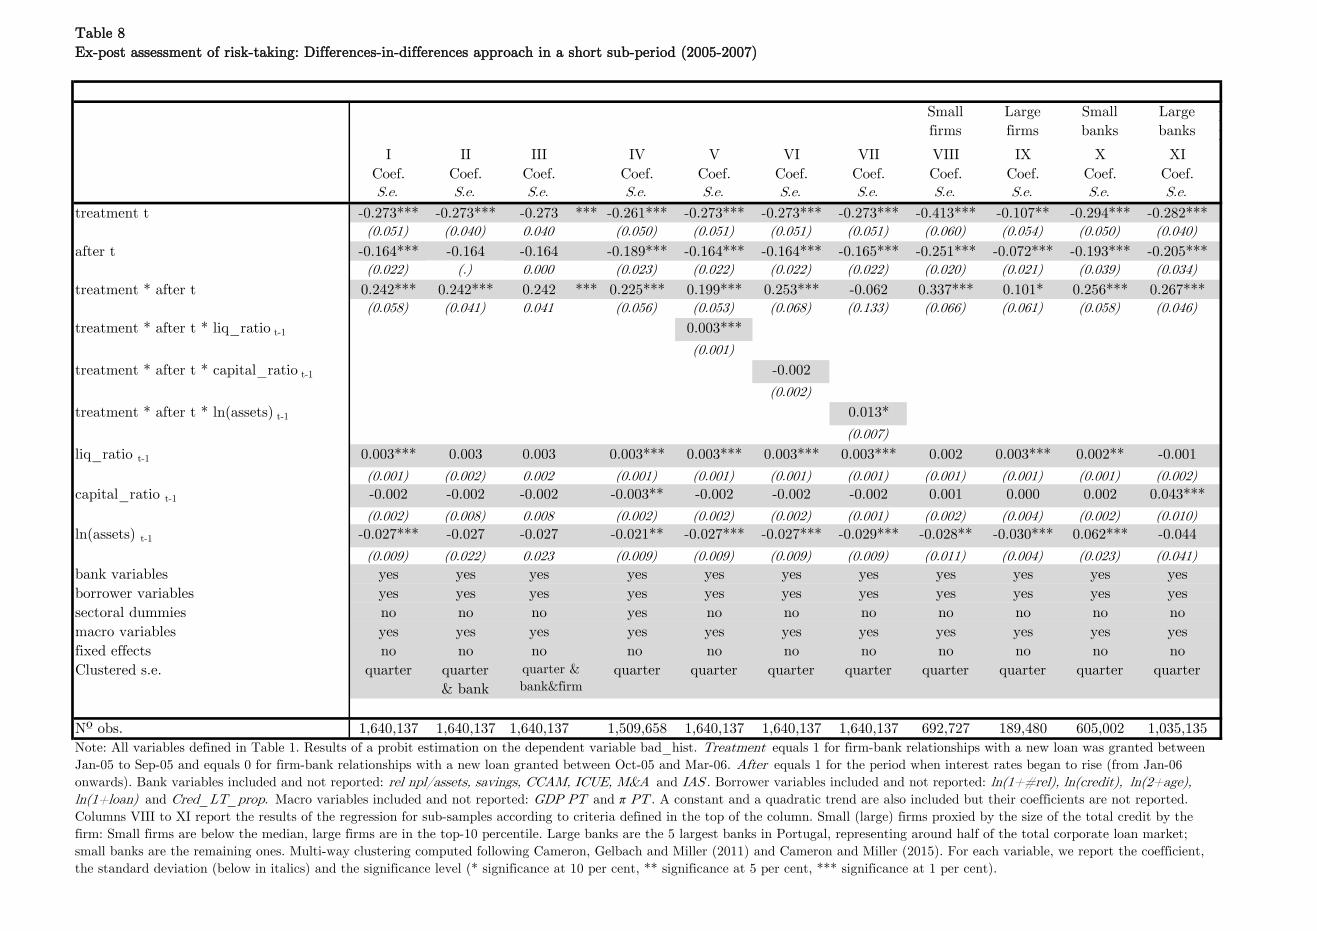
Table 8
Ex-post assessment of risk-taking: Differences-in-differences approach in a short sub-period (2005-2007)
I II III IV V VI VII VIII IX X XI
Coef. Coef. Coef. Coef. Coef. Coef. Coef. Coef. Coef. Coef. Coef.
S.e. S.e. S.e. S.e. S.e. S.e. S.e. S.e. S.e. S.e. S.e.
treatment t -0.273*** -0.273*** -0.273 *** -0.261*** -0.273*** -0.273*** -0.273*** -0.413*** -0.107** -0.294*** -0.282***
(0.051) (0.040) 0.040 (0.050) (0.051) (0.051) (0.051) (0.060) (0.054) (0.050) (0.040)
after t -0.164*** -0.164 -0.164 -0.189*** -0.164*** -0.164*** -0.165*** -0.251*** -0.072*** -0.193*** -0.205***
(0.022) (.) 0.000 (0.023) (0.022) (0.022) (0.022) (0.020) (0.021) (0.039) (0.034)
treatment * after t 0.242*** 0.242*** 0.242 *** 0.225*** 0.199*** 0.253*** -0.062 0.337*** 0.101* 0.256*** 0.267***
(0.058) (0.041) 0.041 (0.056) (0.053) (0.068) (0.133) (0.066) (0.061) (0.058) (0.046)
treatment * after t * liq_ratio t-1 0.003***
(0.001)
treatment * after t * capital_ratio t-1 -0.002
(0.002)
treatment * after t * ln(assets) t-1 0.013*
(0.007)
liq_ratio t-1 0.003*** 0.003 0.003 0.003*** 0.003*** 0.003*** 0.003*** 0.002 0.003*** 0.002** -0.001
(0.001) (0.002) 0.002 (0.001) (0.001) (0.001) (0.001) (0.001) (0.001) (0.001) (0.002)
capital_ratio t-1 -0.002 -0.002 -0.002 -0.003** -0.002 -0.002 -0.002 0.001 0.000 0.002 0.043***
(0.002) (0.008) 0.008 (0.002) (0.002) (0.002) (0.001) (0.002) (0.004) (0.002) (0.010)
ln(assets) t-1 -0.027*** -0.027 -0.027 -0.021** -0.027*** -0.027*** -0.029*** -0.028** -0.030*** 0.062*** -0.044
(0.009) (0.022) 0.023 (0.009) (0.009) (0.009) (0.009) (0.011) (0.004) (0.023) (0.041)
bank variables yes yes yes yes yes yes yes yes yes yes yes
borrower variables yes yes yes yes yes yes yes yes yes yes yes
sectoral dummies no no no yes no no no no no no no
macro variables yes yes yes yes yes yes yes yes yes yes yes
fixed effects no no no no no no no no no no no
Clustered s.e. quarter quarter
Nº obs. 1,640,137 1,640,137 1,640,137 1,509,658 1,640,137 1,640,137 1,640,137 692,727 189,480 605,002 1,035,135
Small
firms
Large
firms
Small
banks
Large
banks
L
P
M
quarter quarter quarter quarter
Note: All variables defined in Table 1. Results of a probit estimation on the dependent variable bad_hist. Treatment equals 1 for firm-bank relationships with a new loan was granted between
Jan-05 to Sep-05 and equals 0 for firm-bank relationships with a new loan granted between Oct-05 and Mar-06. After equals 1 for the period when interest rates began to rise (from Jan-06
onwards). Bank variables included and not reported: rel npl/assets, savings, CCAM, ICUE, M&A and IAS . Borrower variables included and not reported: ln(1+#rel), ln(credit), ln(2+age),
ln(1+loan) and Cred_LT_prop. Macro variables included and not reported: GDP PT and π PT . A constant and a quadratic trend are also included but their coefficients are not reported.
Columns VIII to XI report the results of the regression for sub-samples according to criteria defined in the top of the column. Small (large) firms proxied by the size of the total credit by the
firm: Small firms are below the median, large firms are in the top-10 percentile. Large banks are the 5 largest banks in Portugal, representing around half of the total corporate loan market;
small banks are the remaining ones. Multi-way clustering computed following Cameron, Gelbach and Miller (2011) and Cameron and Miller (2015). For each variable, we report the coefficient,
the standard deviation (below in italics) and the significance level (* significance at 10 per cent, ** significance at 5 per cent, *** significance at 1 per cent).
quarter
& bank
quarter &
bank&firm
quarter quarter quarter
Related Documents