UBS Investment Research Food Images The Rise of Greek A Deep Dive into Greek Yogurt In this report, we take a deep dive look into the Greek yogurt segment and its implications for companies such as General Mills. The report includes proprietary and detailed analysis of the Greek yogurt segment, including in-store selling dynamics, consumption by demographic group, and attitudes about Greek yogurt. Greek Yogurt—The Fastest Growth Segment Ever? Greek yogurt brands such as Chobani and Fage have captured market share more quickly than almost any segment in a major food category ever (13 points in the last 3 years). To put this in perspective, this is more than energy drinks have captured of carbonated soft drinks in the last 6 years. Sales growth continues to be over 100%, and Greek brands are driving the vast majority of yogurt category growth, with the velocity of Greek yogurt suggesting ongoing share gains ahead. Who and Why? Consumer data suggests that the wealthy and educated consumers—often female— are switching to Greek yogurt. These consumers seek out Greek yogurt for health qualities (high protein, low fat, natural) and because it is more filling. Greek yogurt is convincing consumers that yogurt can be a healthy and convenient meal option. Implications Time will tell if newly General Mills’ reformulated Yoplait Greek will slow market share losses. Our worry is that market share losses will turn into sales declines as Greek brands gain scale. Additionally, ongoing Greek yogurt strength may ultimately have negative implications for other breakfast meal options like cereal. Global Equity Research Americas Food Products Sector Comment 22 March 2011 www.ubs.com/investmentresearch David Palmer Analyst [email protected] +1-212-713 9315 Mineo Sakan Associate Analyst [email protected] +1 212 713 3211 This report has been prepared by UBS Securities LLC ANALYST CERTIFICATION AND REQUIRED DISCLOSURES BEGIN ON PAGE 22. UBS does and seeks to do business with companies covered in its research reports. As a result, investors should be aware that the firm may have a conflict of interest that could affect the objectivity of this report. Investors should consider this report as only a single factor in making their investment decision. ab

Welcome message from author
This document is posted to help you gain knowledge. Please leave a comment to let me know what you think about it! Share it to your friends and learn new things together.
Transcript
UBS Investment Research
Food Images
The Rise of Greek
A Deep Dive into Greek Yogurt In this report, we take a deep dive look into the Greek yogurt segment and itsimplications for companies such as General Mills. The report includes proprietary and detailed analysis of the Greek yogurt segment, including in-store selling dynamics, consumption by demographic group, and attitudes about Greek yogurt.
Greek Yogurt—The Fastest Growth Segment Ever? Greek yogurt brands such as Chobani and Fage have captured market share morequickly than almost any segment in a major food category ever (13 points in thelast 3 years). To put this in perspective, this is more than energy drinks havecaptured of carbonated soft drinks in the last 6 years. Sales growth continues to beover 100%, and Greek brands are driving the vast majority of yogurt categorygrowth, with the velocity of Greek yogurt suggesting ongoing share gains ahead.
Who and Why? Consumer data suggests that the wealthy and educated consumers—often female—are switching to Greek yogurt. These consumers seek out Greek yogurt for healthqualities (high protein, low fat, natural) and because it is more filling. Greek yogurtis convincing consumers that yogurt can be a healthy and convenient meal option.
Implications Time will tell if newly General Mills’ reformulated Yoplait Greek will slow marketshare losses. Our worry is that market share losses will turn into sales declines asGreek brands gain scale. Additionally, ongoing Greek yogurt strength mayultimately have negative implications for other breakfast meal options like cereal.
Global Equity Research
Americas
Food Products
Sector Comment
22 March 2011
www.ubs.com/investmentresearch
David Palmer
+1-212-713 9315
Mineo SakanAssociate Analyst
[email protected]+1 212 713 3211
This report has been prepared by UBS Securities LLCANALYST CERTIFICATION AND REQUIRED DISCLOSURES BEGIN ON PAGE 22. UBS does and seeks to do business with companies covered in its research reports. As a result, investors should be aware that the firm may have a conflict of interest that could affect the objectivity of this report. Investors should consider this report as only a single factor in making their investment decision.
ab

Food Images 22 March 2011
UBS 2
Contents page
Key Points 3 Introduction 5
— Chobani and Fage are Driving Yogurt Growth ......................................................6 Why Are People Going Greek? 9 Who is Eating Greek? 12 Runway for Greek Growth Remains 13
— Relatively Low Shelf Space and Distribution.......................................................13 — Strong Base Trends ...........................................................................................15 — Chobani and Fage Seem to be Best Positioned .................................................16
What Greek Means for General Mills 18 — Yoplait Greek .....................................................................................................18
Appendix: Changing Breakfast Eating Habits 21
David Palmer
+1-212-713 9315
Mineo SakanAssociate Analyst
[email protected]+1 212 713 3211

Food Images 22 March 2011
UBS 3
Key Points (1) The Greek yogurt segment is now driving the vast majority of yogurt
growth as the yogurt category has accelerated its share gains of total breakfast and meal occasions. In 2008, overall yogurt category sales were dominated by traditional (non-Greek) yogurt, which represented 98% of category sales. Since that time Greek yogurt sales have increased at a 130% CAGR and now represents 19% of the overall yogurt category. To put this in perspective, in the latest 52 weeks ending 2/19/11, overall yogurt category sales have increased 12% YOY, of which 85% was driven by a 146% increase in Greek yogurt sales, while a 2% increase in traditional yogurt sales accounted for only 15% of category growth.
(2) Chobani and Fage are driving most of Greek yogurt growth—not Dannon (Group Danone) or Yoplait (General Mills). Although major yogurt producers such as General Mills (Buy Rated; $41 PT) and Danone (Buy Rated; €50 PT, UBS Analyst: Alan Erskine) have Greek yogurt offerings, the clear beneficiaries of the rising popularity of Greek yogurt are the two major Greek yogurt producers in the US—Chobani and Fage. Chobani, in particular, has become a game changing force in the last few years, drastically altering the competitive landscape by successfully capturing 48% of the Greek yogurt segment, and 9% of the overall yogurt category in just over three years. Together, Chobani and Fage represent 13% of overall yogurt sales and almost 70% of yogurt category growth.
(3) Deeper analysis of regional and sell-through data suggests that Greek brands have sustainable growth. Our analysis of Nielsen data strongly suggests that Greek yogurt has sustainable growth ahead from increasing shelf space at retail, geographic expansion (especially beyond the northeast US), and increased in-store promotion activity. Chobani and Fage already have captured a combined 22% share of northeast market share (vs. General Mills’ 23% share) and may be able to replicate this success in other regions (where market share is only 9%). Our in-depth analysis of Greek yogurt “velocity” suggest that Greek brands like Chobani and Fage have over 50% higher sales per point of distribution than traditional yogurt—and this velocity is not slowing in spite of distribution gains. This implies that market share gains are sustainable. General Mills and Danone may find it hard to capture a greater share of the Greek segment unless new Greek efforts prove significantly more compelling than past efforts.
(4) Consumer segmentation analysis suggests that high-end consumers—often female—are driving the growth of Greek yogurt. Consumer data from The NPD Group shows that high end consumers are moving Greek yogurt. These consumers are willing to pay more—almost double conventional yogurt—for the attributes of Greek brands. We believe the loss of the best potential consumers is a concerning development for General Mills and Danone.
(5) It is more than just protein. Consumer surveys by The NPD Group show that Greek yogurt consumers are finding Greek varieties more filling—and that this reason ranks above “better for you” reasons. We believe that traditional yogurt has increasingly been relegated to a snack or side dish at
Food Images 22 March 2011
UBS 4
during breakfast. Greek yogurt is more filling and often comes in larger 32 ounce size—allowing portion-size flexibility.
(6) We believe General Mills will need to figure out how they will participate in the growth of Greek yogurt before market share losses start translating into sales declines. So far, General Mills has continued to reach new record sales—even with the rise of Chobani. Eventually, we worry that Chobani’s share gains may come increasingly at the expense of Yoplait—which accounts for ~10% of General Mills’ revenues and 13% of revenue growth (2006-2010). This could occur as Chobani increases its distribution across the US, and starts to promote more heavily.
(7) For Group Danone, market share trends have been better in the last year—largely as a result of Activia, its yogurt with probiotics. Going forward, Danone will need to determine if Activia and its current Greek offering will be enough to maintain market share.
(8) If Greek yogurt continues its multi-year run, its growth may start to impact other categories such as cereal. This is particularly true since Greek yogurt is being consumed more often as a meal than traditional yogurt. (See Appendix)

Food Images 22 March 2011
UBS 5
Introduction The pace of share gains of the Greek yogurt segment is virtually unprecedented in at-home food. Greek yogurt has grabbed 13 percentage points of market share in the last three years, and eight percentage points of market share in the last year alone. As a point of comparison, energy drinks needed six years to gain 13 points of share, and never had market share gains of over three percentage points in any given year.
During the last three years, Greek yogurt has evolved from relative obscurity (and 1% market share) to the segment driving the vast majority of category growth. We believe the growth and momentum of Greek yogurt brands has significant implications to the balance of power within the yogurt category—and among breakfast foods overall.
The magnitude of this phenomenon is most evident in the rapidly evolving market share dynamics of the yogurt category.
Table 1: Greek Yogurt Market Share Gains YOY
2008 2009 2010 2011 YTDGreek 2pp 3pp 8pp 4ppDanone 0pp 1pp 1pp 0ppGeneral Mills 0pp 0pp 1pp 0ppChobani 0pp 2pp 4pp 3ppFage 1pp 0pp 1pp 0pp
Source: The Nielsen Company, UBS; Measured Channels
Table 2: Annual Sales Growth
2008 2009 20102009-2010
CAGRGreek 142% 113% 150% 130%Danone 581% 219% 129% 170%General Mills N/A N/A N/A N/AChobani 2812% 396% 231% 305%Fage 81% 30% 57% 43%
Source: The Nielsen Company, UBS; Measured Channels
The Greek yogurt segment has grown over 100% per year over the last three years
Food Images 22 March 2011
UBS 6
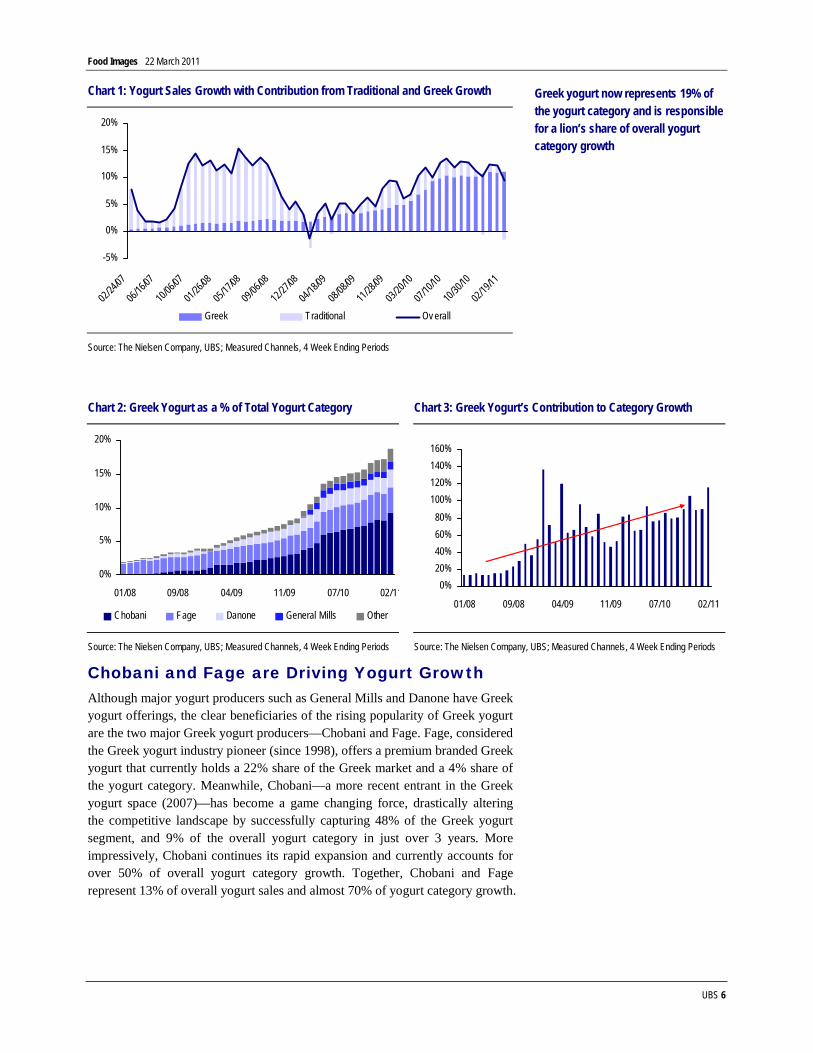
Chart 1: Yogurt Sales Growth with Contribution from Traditional and Greek Growth
-5%
0%
5%
10%
15%
20%
02/24/
07
06/16/
07
10/06/
07
01/26/
08
05/17/
08
09/06/
08
12/27/
08
04/18/
09
08/08/
09
11/28/
09
03/20/
10
07/10/
10
10/30/
10
02/19/
11
Greek Traditional Ov erall
Source: The Nielsen Company, UBS; Measured Channels, 4 Week Ending Periods
Chart 2: Greek Yogurt as a % of Total Yogurt Category Chart 3: Greek Yogurt’s Contribution to Category Growth
0%
5%
10%
15%
20%
01/08 09/08 04/09 11/09 07/10 02/11
Chobani Fage Danone General Mills Other
0%20%40%60%80%
100%120%140%160%
01/08 09/08 04/09 11/09 07/10 02/11
Source: The Nielsen Company, UBS; Measured Channels, 4 Week Ending Periods Source: The Nielsen Company, UBS; Measured Channels, 4 Week Ending Periods
Chobani and Fage are Driving Yogurt Growth Although major yogurt producers such as General Mills and Danone have Greek yogurt offerings, the clear beneficiaries of the rising popularity of Greek yogurt are the two major Greek yogurt producers—Chobani and Fage. Fage, considered the Greek yogurt industry pioneer (since 1998), offers a premium branded Greek yogurt that currently holds a 22% share of the Greek market and a 4% share of the yogurt category. Meanwhile, Chobani—a more recent entrant in the Greek yogurt space (2007)—has become a game changing force, drastically altering the competitive landscape by successfully capturing 48% of the Greek yogurt segment, and 9% of the overall yogurt category in just over 3 years. More impressively, Chobani continues its rapid expansion and currently accounts for over 50% of overall yogurt category growth. Together, Chobani and Fage represent 13% of overall yogurt sales and almost 70% of yogurt category growth.
Greek yogurt now represents 19% of the yogurt category and is responsible for a lion’s share of overall yogurt category growth

Food Images 22 March 2011
UBS 7
Chart 4: Yogurt Category Share Chart 5: Greek Yogurt Segment Market Share
Chobani, 9%
Fage, 4%
Danone, 32%
General Mills, 34%
Other, 22%
Chobani, 48%
Fage, 22%
Danone, 14%
General Mills, 5%
Other, 10%
Source: The Nielsen Company, UBS; Measured Channels, Latest 12 Weeks Source: The Nielsen Company, UBS; Measured Channels, Latest 12 Weeks
Chart 6: Contribution to Yogurt Category Growth Chart 7: Contribution to Greek Yogurt Category Growth
9% 9%
54%
14%
98%
Greek Danone General Mills Chobani Fage
9% 9%
56%
14%
Danone General Mills Chobani Fage
Source: The Nielsen Company, UBS; Measured Channels, Latest 12 Weeks Source: The Nielsen Company, UBS; Measured Channels, Latest 12 Weeks

Food Images 22 March 2011
UBS 8
Chart 8: Chobani Market Share Trends Chart 9: Fage Market Share Trends
0%
10%
20%
30%
40%
50%
60%
01/08 09/08 04/09 11/09 07/10 02/11
0%
2%
4%
6%
8%
10%
Share of Greek (Left) Share of Total (Right)
0%
20%
40%
60%
80%
100%
01/08 09/08 04/09 11/09 07/10 02/11
0%
1%
2%
3%
4%
5%
Share of Greek (Left) Share of Total (Right)
Source: The Nielsen Company, UBS; Measured Channels, 4 Week Ending Periods Source: The Nielsen Company, UBS; Measured Channels, 4 Week Ending Periods
Chart 10: General Mills Market Share Trends Chart 11: Danone Market Share Trends
0%1%2%3%4%5%6%7%8%
01/08 09/08 04/09 11/09 07/10 02/11
0%
10%
20%
30%
40%
50%
Share of Greek (Left) Share of Total (Right)
0%
5%
10%
15%
20%
25%
01/08 09/08 04/09 11/09 07/10 02/11
0%5%10%15%20%25%30%35%40%
Share of Greek (Left) Share of Total (Right)
Source: The Nielsen Company, UBS; Measured Channels, 4 Week Ending Periods Source: The Nielsen Company, UBS; Measured Channels, 4 Week Ending Periods
Chart 12: Greek Yogurt Market Share Trends (4 Week Ending Periods)
0%10%20%30%40%50%60%70%80%90%
100%
01/27/
07
05/19/
07
09/08/
07
12/29/
07
04/19/
08
08/09/
08
11/29/
08
03/21/
09
07/11/
09
10/31/
09
02/20/
10
06/12/
10
10/02/
10
01/22/
11
Chobani Fage General Mills Danone Other
Source: The Nielsen company, UBS; Measured Channels
Chobani has steadily taken control of the Greek yogurt segment, while General Mills and Danone have been unsuccessful in meaningfully gaining share

Food Images 22 March 2011
UBS 9
Why Are People Going Greek? Our analysis of the Greek yogurt segment and consumption motivation seems to indicate that consumers are looking to Greek yogurt as a convenient, filling and healthy meal. In order to understand the drivers of Greek yogurt’s rising popularity we have conducted a proprietary analysis in conjunction with the NPD group which includes a deep dive into Greek yogurt consumer demographics, eating occasions, and motivations for Greek yogurt consumption. Below we provide a comprehensive list of traits that may be linked to the recent surge in Greek yogurt’s popularity.
Chart 13: Greek Yogurt—Best Reason for Consumption (Indexed to Traditional Yogurt; >100 = More of a Motivator)
0 50 100 150 200 250
Had a crav ing for it
Fav orite snack
Like the taste
Was hungry
To keep from eating somthing else
Nutritious/ health benefit
Better for y ou than other choices
Wanted something filling
Source: The NPD Group, UBS
(1) Nutrition and health: According to NPD data, “nutrition/health benefits” is the main motivation for both traditional and Greek yogurt consumption. However Greek yogurt consumers tend to emphasize the importance of health benefits more than traditional consumers as is evidenced by the higher relative importance of the characteristic. Additionally, more Greek yogurt consumers cited “Better for you than other choices” as a motivator for Greek yogurt consumption.
(2) High protein and no fat: Greek yogurt offers twice the protein of traditional yogurts with no fat and relatively low calories. These nutritional properties bode well for Greek yogurt consumption as the percentage of adults indicating an interest in adding more protein and probiotics to their diets has increased steadily over the last five years. We believe that increased protein content and probiotics (and low fat) are properties that cater to the aforementioned healthier eating aspirations, and are helping to drive Greek yogurt growth.

Food Images 22 March 2011
UBS 10
Chart 14: Percentage of Adults Seeking More Protein and Probiotics in Their Diets
0%
10%
20%
30%
40%
50%
60%
2006 2007 2008 2009 2010
Protein Probiotics
Source: The NPD Group, UBS
(3) More filling: Greek yogurt is specially strained to create a creamier yogurt with higher protein content, which seems to be more filling than traditional yogurt. Indeed, more than twice as many people consumed Greek yogurt because they “wanted something filling”, and to a lesser degree, Greek yogurt was more likely to be consumed than traditional yogurt “to keep from consuming something else”.
(4) Meal Replacement: Given its satiating quality, it is no surprise that Greek yogurt is more likely than traditional yogurt to be consumed as a meal replacement. In fact, our data suggest that Greek yogurt is 76% more likely to be consumed as a meal replacement than traditional yogurt. Although breakfast remains the number one meal in which both traditional and Greek yogurt is consumed as a meal replacement, Greek yogurt consumption as a meal replacement has seen the greatest day-part increase at lunch.
Chart 15:Greek Yogurt Consumption as a Meal Replacement (Indexed to Traditional)
0
50
100
150
200
250
Breakfast Lunch Dinner Total MealReplacement
Source: The NPD Group, UBS
Food Images 22 March 2011
UBS 11
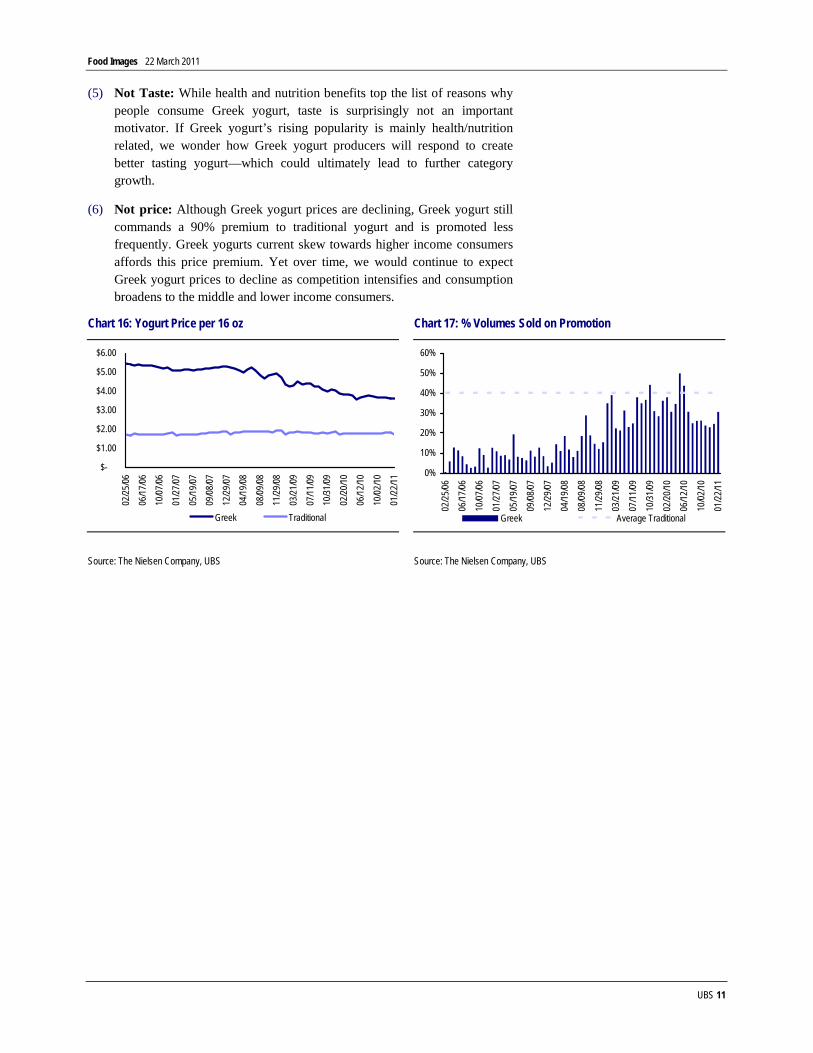
(5) Not Taste: While health and nutrition benefits top the list of reasons why people consume Greek yogurt, taste is surprisingly not an important motivator. If Greek yogurt’s rising popularity is mainly health/nutrition related, we wonder how Greek yogurt producers will respond to create better tasting yogurt—which could ultimately lead to further category growth.
(6) Not price: Although Greek yogurt prices are declining, Greek yogurt still commands a 90% premium to traditional yogurt and is promoted less frequently. Greek yogurts current skew towards higher income consumers affords this price premium. Yet over time, we would continue to expect Greek yogurt prices to decline as competition intensifies and consumption broadens to the middle and lower income consumers.
Chart 16: Yogurt Price per 16 oz Chart 17: % Volumes Sold on Promotion
$-
$1.00
$2.00
$3.00
$4.00
$5.00
$6.00
02/25
/0606
/17/06
10/07
/0601
/27/07
05/19
/0709
/08/07
12/29
/0704
/19/08
08/09
/0811
/29/08
03/21
/09
07/11
/0910
/31/09
02/20
/1006
/12/10
10/02
/1001
/22/11
Greek Traditional
0%
10%
20%
30%
40%
50%
60%
02/2
5/06
06/1
7/06
10/0
7/06
01/2
7/07
05/1
9/07
09/0
8/07
12/2
9/07
04/1
9/08
08/0
9/08
11/2
9/08
03/2
1/09
07/1
1/09
10/3
1/09
02/2
0/10
06/1
2/10
10/0
2/10
01/2
2/11
Greek Average Traditional
Source: The Nielsen Company, UBS Source: The Nielsen Company, UBS
Food Images 22 March 2011
UBS 12
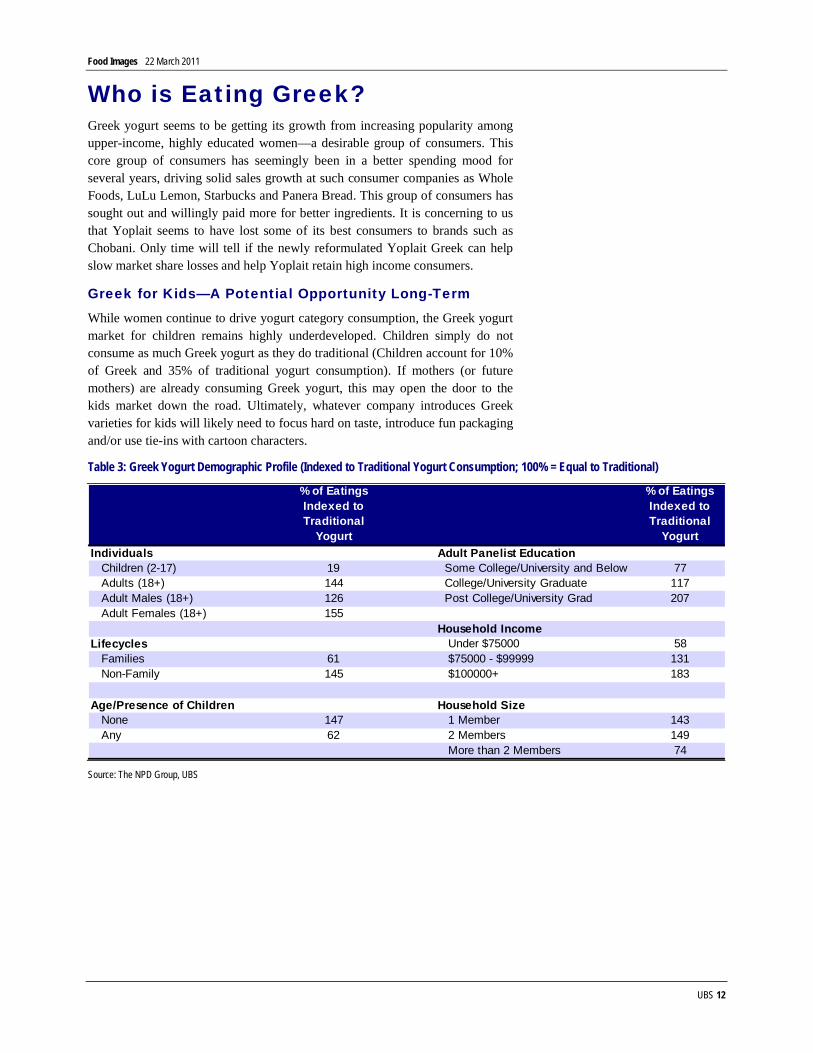
Who is Eating Greek? Greek yogurt seems to be getting its growth from increasing popularity among upper-income, highly educated women—a desirable group of consumers. This core group of consumers has seemingly been in a better spending mood for several years, driving solid sales growth at such consumer companies as Whole Foods, LuLu Lemon, Starbucks and Panera Bread. This group of consumers has sought out and willingly paid more for better ingredients. It is concerning to us that Yoplait seems to have lost some of its best consumers to brands such as Chobani. Only time will tell if the newly reformulated Yoplait Greek can help slow market share losses and help Yoplait retain high income consumers.
Greek for Kids—A Potential Opportunity Long-Term While women continue to drive yogurt category consumption, the Greek yogurt market for children remains highly underdeveloped. Children simply do not consume as much Greek yogurt as they do traditional (Children account for 10% of Greek and 35% of traditional yogurt consumption). If mothers (or future mothers) are already consuming Greek yogurt, this may open the door to the kids market down the road. Ultimately, whatever company introduces Greek varieties for kids will likely need to focus hard on taste, introduce fun packaging and/or use tie-ins with cartoon characters.
Table 3: Greek Yogurt Demographic Profile (Indexed to Traditional Yogurt Consumption; 100% = Equal to Traditional)
% of Eatings Indexed to Traditional
Yogurt
% of Eatings Indexed to Traditional
YogurtIndividuals Adult Panelist Education
Children (2-17) 19 Some College/University and Below 77Adults (18+) 144 College/University Graduate 117Adult Males (18+) 126 Post College/University Grad 207Adult Females (18+) 155
Household IncomeLifecycles Under $75000 58
Families 61 $75000 - $99999 131Non-Family 145 $100000+ 183
Age/Presence of Children Household SizeNone 147 1 Member 143Any 62 2 Members 149
More than 2 Members 74
Source: The NPD Group, UBS

Food Images 22 March 2011
UBS 13
Runway for Greek Growth Remains Our analysis of Nielsen data strongly suggests that Greek yogurt has sustainable growth ahead from increasing shelf space at retail, geographic expansion (especially beyond the northeast US), and increased in-store promotion activity. Our in-depth analysis of Greek yogurt “velocity”, shelf space and geographic coverage suggest that Greek brands like Chobani and Fage stand to benefit the most from the growth potential. General Mills and Danone may find it hard to capture a greater share of the Greek segment unless new Greek efforts prove compelling to consumers.
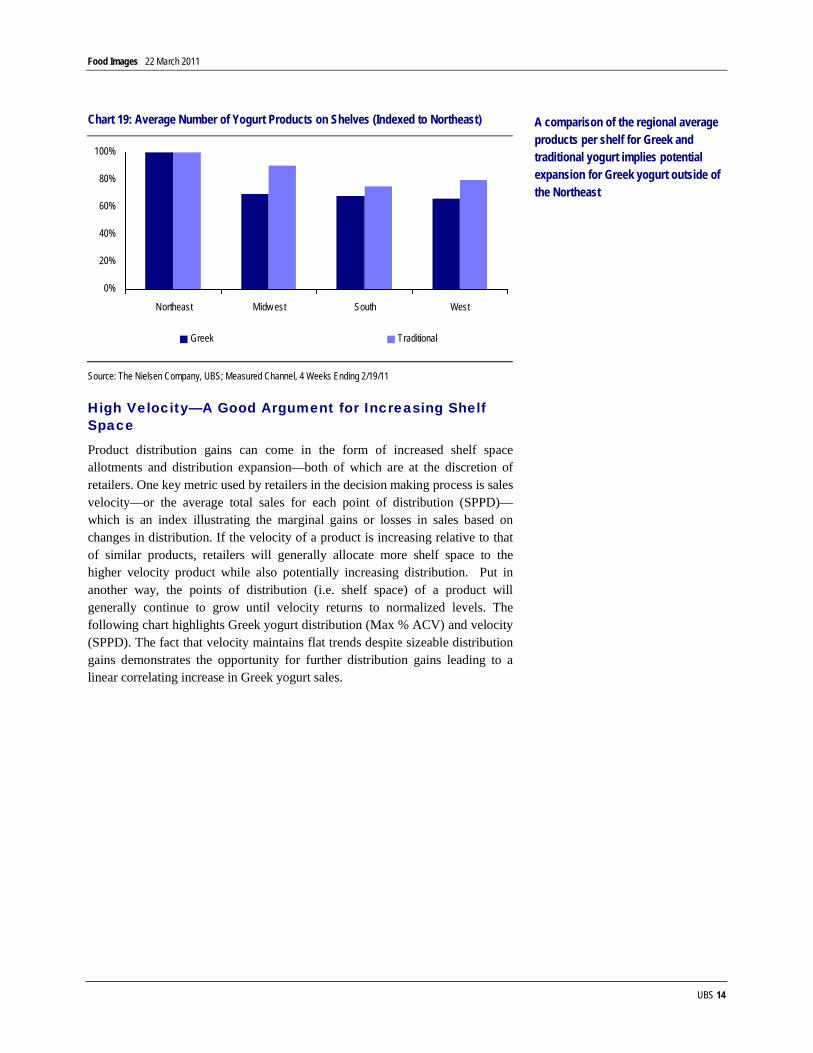
Relatively Low Shelf Space and Distribution At the most basic level, a look at sales, distribution—measured by All Commodity Volume (ACV)—and average number of products on the shelf seems to indicate that distribution gains have yet to play out. According to measured channel data, Greek yogurt distribution lags overall yogurt distribution by 24 percentage points. Meanwhile a regional analysis of the average number of Greek yogurt products on shelves per store shows an average of eight more Greek yogurt products on shelves in the northeast compared to other US regions.
Chart 18: Regional Sales as % of Total Sales
0%
10%
20%
30%
40%
50%
60%
Northeast Midw est South West
Chobani Fage Greek Traditional
Source: The Nielsen Company, UBS; Measured Channels, 14 Weeks Ending 2/19/11
Table 4: Measured Channel Yogurt Distribution (4 Weeks Ending 2/19/11)
Overall Yogurt Greek Chobani Fage
General Mills
(Greek)Danone (Greek)
Northeast 84% 68% 68% 60% 46% 51%Midwest 84% 54% 49% 44% 54% 43%South 84% 48% 48% 42% 41% 33%West 93% 56% 49% 56% 44% 28%Total US 86% 52% 52% 49% 45% 34%
Yogurt Distribution (% Max ACV)
Source: The Nielsen Company, UBS
Traditional yogurt sales are fairly evenly split across regions. If Greek yogurt can replicate this distribution, the Midwest and Western regions are poised for significant growth.
Greek yogurt’s 52% ACV (compared to 86% for the overall category) implies significant distribution expansion capacity
Food Images 22 March 2011
UBS 14
Chart 19: Average Number of Yogurt Products on Shelves (Indexed to Northeast)
0%
20%
40%
60%
80%
100%
Northeast Midw est South West
Greek Traditional
Source: The Nielsen Company, UBS; Measured Channel, 4 Weeks Ending 2/19/11
High Velocity—A Good Argument for Increasing Shelf Space
Product distribution gains can come in the form of increased shelf space allotments and distribution expansion—both of which are at the discretion of retailers. One key metric used by retailers in the decision making process is sales velocity—or the average total sales for each point of distribution (SPPD)—which is an index illustrating the marginal gains or losses in sales based on changes in distribution. If the velocity of a product is increasing relative to that of similar products, retailers will generally allocate more shelf space to the higher velocity product while also potentially increasing distribution. Put in another way, the points of distribution (i.e. shelf space) of a product will generally continue to grow until velocity returns to normalized levels. The following chart highlights Greek yogurt distribution (Max % ACV) and velocity (SPPD). The fact that velocity maintains flat trends despite sizeable distribution gains demonstrates the opportunity for further distribution gains leading to a linear correlating increase in Greek yogurt sales.
A comparison of the regional average products per shelf for Greek and traditional yogurt implies potential expansion for Greek yogurt outside of the Northeast

Food Images 22 March 2011
UBS 15
Chart 20: Greek Yogurt Velocity vs. Distribution
-5,000
10,00015,00020,00025,00030,00035,00040,000
02/25/
06
07/15/
06
12/02/
06
04/21/
07
09/08/
07
01/26/
08
06/14/
08
11/01/
08
03/21/
09
08/08/
09
12/26/
09
05/15/
10
10/02/
10
02/19/
11
Sale
s pe
r Pt o
f Dis
tribu
tion
0102030405060708090100
% M
ax A
CV
Velocity %Max ACV
Source: The Nielsen Company, UBS; Measured Channels, 4 Week Ending Periods
Furthermore, Greek yogurt category velocity continues to outpace that of traditional yogurt. This is a compelling reason for retailers to increase Greek yogurt distribution (potentially at the expense of traditional yogurt) and is further evidence that the category will most likely continue to gain shelf space and distribution.
Chart 21: Yogurt Velocity (52 Weeks Ending 2/19/11)
0
5,000
10,000
15,000
20,000
25,000
30,000
35,000
Traditional Greek
Velocity (Sales per Pt of Distribution)
Source: The Nielsen Company, UBS; Measured Channels
Strong Base Trends Our analysis shows that Greek yogurt’s growth has come with limited contribution from increased promotions:
Measured channel baseline sales: Baseline sales—a measure of theoretical non-promoted sales—comprise 90% of total Greek yogurt sales. This figure is three percentage points higher than that of traditional yogurt, which may indicate stronger consumer pull. Furthermore, Greek yogurt category baseline sales growth has largely trended in line with actual sales growth, suggesting that promotional activity has been a relatively minor factor in driving recent Greek yogurt sales.
Sales per point of distribution (a.k.a. sales velocity) has not slowed for Greek yogurt –even after rapid gains in distribution
Greek yogurt continues to have relatively strong sales velocity—which augurs well for continued shelf space gains

Food Images 22 March 2011
UBS 16
Chart 22: Greek Yogurt Actual and Baseline Sales Trend Comparison
0%
50%
100%
150%
200%
250%
02/24/
07
06/16/
07
10/06/
07
01/26/
08
05/17/
08
09/06/
08
12/27/
08
04/18/
09
08/08/
09
11/28/
09
03/20/
10
07/10/
10
10/30/
10
02/19/
11
Greek Sales Grow th Greek Baseline Sales Grow th
Source: The Nielsen Company, UBS; Measured Channels, 4 Week Ending Periods
Shelf space versus distribution: Shelf space—as measured by changes in total points of distribution (TPD)—is growing faster than distribution (measured by % max ACV). This trend generally coincides with organic growth as it suggests that increasing shelf space allocation is playing a larger roll than distribution expansion in driving category sales.
Chart 23: Greek Yogurt Shelf Space Growth (TPD) vs. Distribution Growth (% Max ACV)
0%
50%
100%
150%
200%
250%
300%
02/24/
07
06/16/
07
10/06/
07
01/26/
08
05/17/
08
09/06/
08
12/27/
08
04/18/
09
08/08/
09
11/28/
09
03/20/
10
07/10/
10
10/30/
10
02/19/
11
Greek TPD Greek Max ACV
Source: The Nielsen Company, UBS
Chobani and Fage Seem to be Best Positioned The competitive dynamics of the category suggests that based on a combination of strong top line growth and best in class distribution momentum, Chobani—and to a lesser extent Fage—are best positioned to be the main beneficiaries of further Greek yogurt expansion. There are several factors that lead us to believe that Chobani will continue to drive solid top line growth, including industry leading sales momentum and strong consumer pull as indicated by robust growth despite a lack of promotional activity (See Table 5).
However we continue to believe that velocity will be the major determinant of distribution and ultimately growth potential. In the context of the individual Greek yogurt players, both Chobani and Fage generate more SPPD than any

Food Images 22 March 2011
UBS 17
other major producer, with Chobani in particular more than doubling the SPPD of both General Mills and Danone. Furthermore, both Chobani and Fage continue to have high SPPD despite rapid distribution (% Max ACV) expansion, which implies robust demand for their Greek yogurt products. In our view, retailers are most likely keenly aware of this dynamic and will therefore continue to prefer expanding shelving and distribution for Chobani, with Fage becoming the secondary beneficiary of the rising popularity of Greek yogurt.
Table 5: Greek Yogurt Competitive Landscape
Traditional GreekDanone (Greek)
General Mills (Greek) Chobani Fage
Sales Growth (YOY) 2% 146% 98% 4872% 220% 60%
Average Price (16 oz) 1.66 3.44 4.44 2.86 3.26 4.60Temporary Price Reduction as % of Sales 19% 18% 13% 15% 13% 28%
Depth of Discount 15% 14% 22% 12% 8% 17%
Feature Only as % of Sales 15% 7% 4% 27% 8% 4%
Velocity (SPPD) 18,951 31,384 19,515 16,063 50,755 30,868
Distribution (%MAX ACV) 81 52 34 47 52 49
Shelf Space Growth 2% 134% 110% 1474% 166% 63%
Source: The Nielsen Company, UBS; Measured Channel, 52 Weeks Ending 2/19/11
Food Images 22 March 2011
UBS 18
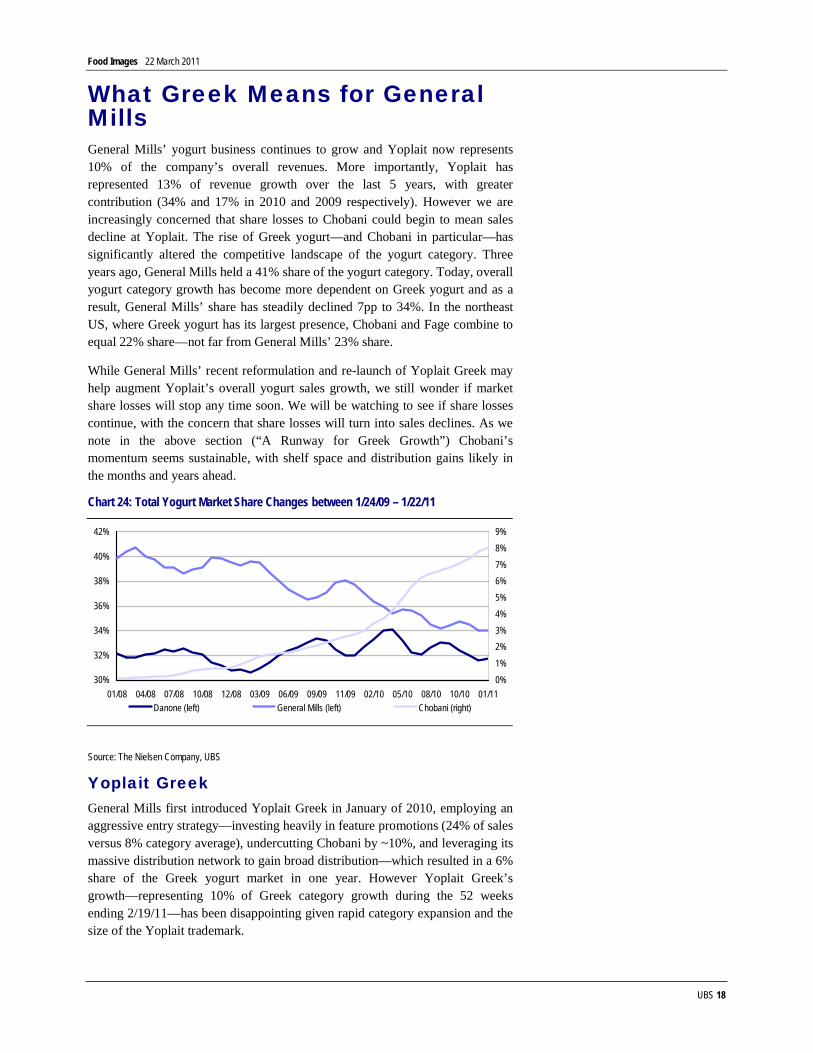
What Greek Means for General Mills General Mills’ yogurt business continues to grow and Yoplait now represents 10% of the company’s overall revenues. More importantly, Yoplait has represented 13% of revenue growth over the last 5 years, with greater contribution (34% and 17% in 2010 and 2009 respectively). However we are increasingly concerned that share losses to Chobani could begin to mean sales decline at Yoplait. The rise of Greek yogurt—and Chobani in particular—has significantly altered the competitive landscape of the yogurt category. Three years ago, General Mills held a 41% share of the yogurt category. Today, overall yogurt category growth has become more dependent on Greek yogurt and as a result, General Mills’ share has steadily declined 7pp to 34%. In the northeast US, where Greek yogurt has its largest presence, Chobani and Fage combine to equal 22% share—not far from General Mills’ 23% share.
While General Mills’ recent reformulation and re-launch of Yoplait Greek may help augment Yoplait’s overall yogurt sales growth, we still wonder if market share losses will stop any time soon. We will be watching to see if share losses continue, with the concern that share losses will turn into sales declines. As we note in the above section (“A Runway for Greek Growth”) Chobani’s momentum seems sustainable, with shelf space and distribution gains likely in the months and years ahead.
Chart 24: Total Yogurt Market Share Changes between 1/24/09 – 1/22/11
30%
32%
34%
36%
38%
40%
42%
01/08 04/08 07/08 10/08 12/08 03/09 06/09 09/09 11/09 02/10 05/10 08/10 10/10 01/110%1%2%3%4%5%6%7%8%9%
Danone (left) General Mills (left) Chobani (right)
Source: The Nielsen Company, UBS
Yoplait Greek General Mills first introduced Yoplait Greek in January of 2010, employing an aggressive entry strategy—investing heavily in feature promotions (24% of sales versus 8% category average), undercutting Chobani by ~10%, and leveraging its massive distribution network to gain broad distribution—which resulted in a 6% share of the Greek yogurt market in one year. However Yoplait Greek’s growth—representing 10% of Greek category growth during the 52 weeks ending 2/19/11—has been disappointing given rapid category expansion and the size of the Yoplait trademark.
Food Images 22 March 2011
UBS 19
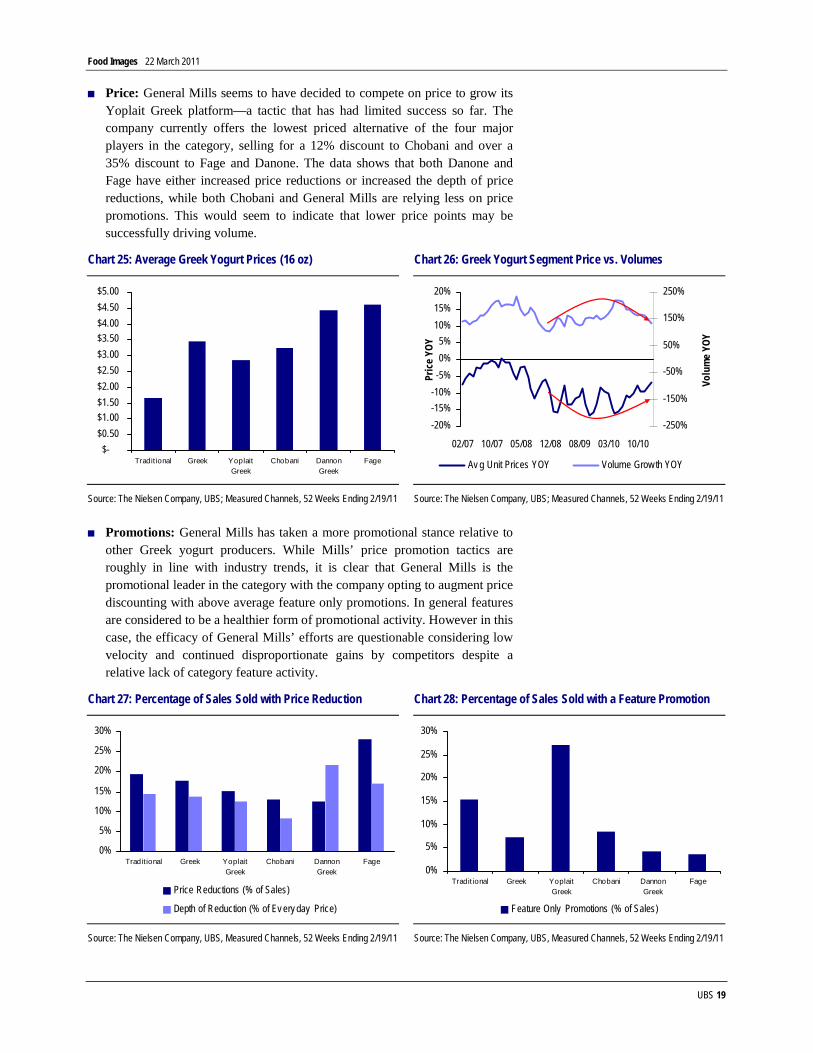
Price: General Mills seems to have decided to compete on price to grow its Yoplait Greek platform—a tactic that has had limited success so far. The company currently offers the lowest priced alternative of the four major players in the category, selling for a 12% discount to Chobani and over a 35% discount to Fage and Danone. The data shows that both Danone and Fage have either increased price reductions or increased the depth of price reductions, while both Chobani and General Mills are relying less on price promotions. This would seem to indicate that lower price points may be successfully driving volume.
Chart 25: Average Greek Yogurt Prices (16 oz) Chart 26: Greek Yogurt Segment Price vs. Volumes
$-$0.50$1.00$1.50$2.00$2.50$3.00$3.50$4.00$4.50$5.00
Traditional Greek YoplaitGreek
Chobani DannonGreek
Fage
-20%-15%-10%
-5%0%5%
10%15%20%
02/07 10/07 05/08 12/08 08/09 03/10 10/10Pr
ice
YOY
-250%
-150%
-50%
50%
150%
250%
Volu
me
YOY
Av g Unit Prices YOY Volume Grow th YOY
Source: The Nielsen Company, UBS; Measured Channels, 52 Weeks Ending 2/19/11 Source: The Nielsen Company, UBS; Measured Channels, 52 Weeks Ending 2/19/11
Promotions: General Mills has taken a more promotional stance relative to other Greek yogurt producers. While Mills’ price promotion tactics are roughly in line with industry trends, it is clear that General Mills is the promotional leader in the category with the company opting to augment price discounting with above average feature only promotions. In general features are considered to be a healthier form of promotional activity. However in this case, the efficacy of General Mills’ efforts are questionable considering low velocity and continued disproportionate gains by competitors despite a relative lack of category feature activity.
Chart 27: Percentage of Sales Sold with Price Reduction Chart 28: Percentage of Sales Sold with a Feature Promotion
0%
5%
10%
15%
20%
25%
30%
Traditional Greek YoplaitGreek
Chobani DannonGreek
Fage
Price Reductions (% of Sales)
Depth of Reduction (% of Ev ery day Price)
0%
5%
10%
15%
20%
25%
30%
Tradit ional Greek YoplaitGreek
Chobani DannonGreek
Fage
Feature Only Promotions (% of Sales)
Source: The Nielsen Company, UBS, Measured Channels, 52 Weeks Ending 2/19/11 Source: The Nielsen Company, UBS, Measured Channels, 52 Weeks Ending 2/19/11

Food Images 22 March 2011
UBS 20
Shelving/Distribution: Sales and distribution trends also confirm weak Yoplait Greek performance. General Mills’ lackluster Greek yogurt velocity is not only the lowest of the major segment players, but is also lower than that of Yoplait’s traditional offerings. This suggests that despite a lower price point and heavy brand building efforts, Yoplait Greek’s sales indexed to distribution is falling short of Chobani and Fage. If Yoplait Greek’s velocity does not increase, Chobani and Fage will continue to gain shelf space and distribution. In fact, at current levels, retailers may even be reluctant to push Yoplait Greek over traditional Yoplait, as the latter generates more sales per point of distribution.
Recent trends may already be reflecting the disappointing performance of Yoplait Greek. Distribution (as measured by % Max ACV) expansion has lagged category growth and even declined lately, despite the advantages of General Mills’ existing distribution network. As such, while General Mills’ Greek yogurt is undoubtedly growing, the reality is that General Mills continues to cede share to Chobani.
Chart 29: Yoplait Velocity (52 Weeks Ending 2/19/11) Chart 30: Distribution Trends (% Max ACV)
0
10000
20000
30000
40000
50000
60000
YoplaitTraditional
YoplaitGreek
DannonGreek
Chobani Fage
-
10
20
30
40
50
60
01/23/
10
03/20/
10
05/15/
10
07/10/
10
09/04/
10
10/30/
10
12/25/
10
02/19/
11
Greek Yogurt Yoplait Greek
Source: The Nielsen Company, UBS; Measured Channels Source: The Nielsen Company, UBS; Measured Channels, 4 Week Ending Periods

Food Images 22 March 2011
UBS 21
Appendix: Changing Breakfast Eating Habits
Chart 31: Percent of In-Home Breakfasts that Include Ready-to-Eat Cereal
30
35
40
'95 '96 '97 '98 '99 '00 '01 '02 '03 '04 '05 '06 '07 '08 '09 '10
Source: The NPD Group's National Eating Trends® service; years ending Feb
Chart 32: Percent of Segment's In-Home Breakfasts Including RTE Cereal
25%
30%
35%
40%
45%
50%
'95 '96 '97 '98 '99 '00 '01 '02 '03 '04 '05 '06 '07 '08 '09 '10
Child (<18) Male Female
Source: The NPD Group's National Eating Trends® service; years ending Feb
RTE cereal consumption has once again fallen to 5-year lows as consumers move to other breakfast options
This is true across all segments…

Food Images 22 March 2011
UBS 22
Chart 33: Percent of In-Home Breakfasts Including Yogurt
0.0%
2.5%
5.0%
'95 '96 '97 '98 '99 '00 '01 '02 '03 '04 '05 '06 '07 '08 '09 '10
Kids Men Women
Source: The NPD Group's National Eating Trends® service; years ending Feb
Statement of Risk
Risks associated with the U.S. food industry are commodity costs, competitive activity with respect to innovation and pricing, threat from private label, and a tough retail environment.
Analyst Certification
Each research analyst primarily responsible for the content of this research report, in whole or in part, certifies that with respect to each security or issuer that the analyst covered in this report: (1) all of the views expressed accurately reflect his or her personal views about those securities or issuers and were prepared in an independent manner, including with respect to UBS, and (2) no part of his or her compensation was, is, or will be, directly or indirectly, related to the specific recommendations or views expressed by that research analyst in the research report.
Men and children are increasingly consuming yogurt at breakfast, while women—the more prolific consumer of yogurt at breakfast—have cut back slightly

Food Images 22 March 2011
UBS 23
Required Disclosures This report has been prepared by UBS Securities LLC, an affiliate of UBS AG. UBS AG, its subsidiaries, branches and affiliates are referred to herein as UBS.
For information on the ways in which UBS manages conflicts and maintains independence of its research product; historical performance information; and certain additional disclosures concerning UBS research recommendations, please visit www.ubs.com/disclosures. The figures contained in performance charts refer to the past; past performance is not a reliable indicator of future results. Additional information will be made available upon request. UBS Securities Co. Limited is licensed to conduct securities investment consultancy businesses by the China Securities Regulatory Commission.
UBS Investment Research: Global Equity Rating Allocations
UBS 12-Month Rating Rating Category Coverage1 IB Services2
Buy Buy 49% 40%Neutral Hold/Neutral 42% 35%Sell Sell 8% 21%UBS Short-Term Rating Rating Category Coverage3 IB Services4
Buy Buy less than 1% 14%Sell Sell less than 1% 0%
1:Percentage of companies under coverage globally within the 12-month rating category. 2:Percentage of companies within the 12-month rating category for which investment banking (IB) services were provided within the past 12 months. 3:Percentage of companies under coverage globally within the Short-Term rating category. 4:Percentage of companies within the Short-Term rating category for which investment banking (IB) services were provided within the past 12 months. Source: UBS. Rating allocations are as of 31 December 2010. UBS Investment Research: Global Equity Rating Definitions
UBS 12-Month Rating Definition Buy FSR is > 6% above the MRA. Neutral FSR is between -6% and 6% of the MRA. Sell FSR is > 6% below the MRA. UBS Short-Term Rating Definition
Buy Buy: Stock price expected to rise within three months from the time the rating was assigned because of a specific catalyst or event.
Sell Sell: Stock price expected to fall within three months from the time the rating was assigned because of a specific catalyst or event.
Food Images 22 March 2011
UBS 24
KEY DEFINITIONS Forecast Stock Return (FSR) is defined as expected percentage price appreciation plus gross dividend yield over the next 12 months. Market Return Assumption (MRA) is defined as the one-year local market interest rate plus 5% (a proxy for, and not a forecast of, the equity risk premium). Under Review (UR) Stocks may be flagged as UR by the analyst, indicating that the stock's price target and/or rating are subject to possible change in the near term, usually in response to an event that may affect the investment case or valuation. Short-Term Ratings reflect the expected near-term (up to three months) performance of the stock and do not reflect any change in the fundamental view or investment case. Equity Price Targets have an investment horizon of 12 months. EXCEPTIONS AND SPECIAL CASES UK and European Investment Fund ratings and definitions are: Buy: Positive on factors such as structure, management, performance record, discount; Neutral: Neutral on factors such as structure, management, performance record, discount; Sell: Negative on factors such as structure, management, performance record, discount. Core Banding Exceptions (CBE): Exceptions to the standard +/-6% bands may be granted by the Investment Review Committee (IRC). Factors considered by the IRC include the stock's volatility and the credit spread of the respective company's debt. As a result, stocks deemed to be very high or low risk may be subject to higher or lower bands as they relate to the rating. When such exceptions apply, they will be identified in the Company Disclosures table in the relevant research piece. Research analysts contributing to this report who are employed by any non-US affiliate of UBS Securities LLC are not registered/qualified as research analysts with the NASD and NYSE and therefore are not subject to the restrictions contained in the NASD and NYSE rules on communications with a subject company, public appearances, and trading securities held by a research analyst account. The name of each affiliate and analyst employed by that affiliate contributing to this report, if any, follows. UBS Securities LLC: David Palmer; Mineo Sakan. Company Disclosures
Company Name Reuters 12-mo rating Short-term rating Price Price date Danone16 DANO.PA Buy N/A €43.98 21 Mar 2011 General Mills Inc.6, 7, 16 GIS.N Buy N/A US$37.12 21 Mar 2011
Source: UBS. All prices as of local market close. Ratings in this table are the most current published ratings prior to this report. They may be more recent than the stock pricing date 6. This company/entity is, or within the past 12 months has been, a client of UBS Securities LLC, and non-investment
banking securities-related services are being, or have been, provided. 7. Within the past 12 months, UBS Securities LLC has received compensation for products and services other than
investment banking services from this company/entity. 16. UBS Securities LLC makes a market in the securities and/or ADRs of this company. Unless otherwise indicated, please refer to the Valuation and Risk sections within the body of this report.

Food Images 22 March 2011
UBS 25
Danone (€)
01-Jan-0
601-A
pr-06 01-Jul-06
01-Oct-06
01-Jan-0
701-A
pr-07 01-Jul-07
01-Oct-07
01-Jan-0
801-A
pr-08 01-Jul-08
01-Oct-08
01-Jan-0
901-A
pr-09 01-Jul-09
01-Oct-09
01-Jan-1
001-A
pr-10 01-Jul-10
01-Oct-10
01-Jan-1
10.0
20.0
40.0
60.0
80.0
Price Target (€) Stock Price (€)
Neutral 1Neutral 2
BuyNeutral
SellNo Rating
Source: UBS; as of 21 Mar 2011 General Mills Inc. (US$)
01-Jan-0
601-A
pr-06 01-Jul-06
01-Oct-06
01-Jan-0
701-A
pr-07 01-Jul-07
01-Oct-07
01-Jan-0
801-A
pr-08 01-Jul-08
01-Oct-08
01-Jan-0
901-A
pr-09 01-Jul-09
01-Oct-09
01-Jan-1
001-A
pr-10 01-Jul-10
01-Oct-10
01-Jan-1
10.0
10.0
20.0
30.0
40.0
50.0
Price Target (US$) Stock Price (US$)
Neutral 2Buy
Neutral
Source: UBS; as of 21 Mar 2011 Note: On August 4, 2007 UBS revised its rating system. (See 'UBS Investment Research: Global Equity Rating Definitions' table for details). From September 9, 2006 through August 3, 2007 the UBS ratings and their definitions were: Buy 1 = FSR is > 6% above the MRA, higher degree of predictability; Buy 2 = FSR is > 6% above the MRA, lower degree of predictability; Neutral 1 = FSR is between -6% and 6% of the MRA, higher degree of predictability; Neutral 2 = FSR is between -6% and 6% of the MRA, lower degree of predictability; Reduce 1 = FSR is > 6% below the MRA, higher degree of predictability; Reduce 2 = FSR is > 6% below the MRA, lower degree of predictability. The predictability level indicates an analyst's conviction in the FSR. A predictability level of '1' means that the analyst's estimate of FSR is in the middle of a narrower, or smaller, range of possibilities. A predictability level of '2' means that the analyst's estimate of FSR is in the middle of a broader, or larger, range of possibilities. From October 13, 2003 through September 8, 2006 the percentage band criteria used in the rating system was 10%.

Food Images 22 March 2011
UBS 26
Global Disclaimer This report has been prepared by UBS Securities LLC, an affiliate of UBS AG. UBS AG, its subsidiaries, branches and affiliates are referred to herein as UBS. In certain countries, UBS AG is referred to as UBS SA. This report is for distribution only under such circumstances as may be permitted by applicable law. Nothing in this report constitutes a representation that any investment strategy or recommendation contained herein is suitable or appropriate to a recipient’s individual circumstances or otherwise constitutes a personal recommendation. It is published solely for information purposes, it does not constitute an advertisement and is not to be construed as a solicitation or an offer to buy or sell any securities or related financial instruments in any jurisdiction. No representation or warranty, either express or implied, is provided in relation to the accuracy, completeness or reliability of the information contained herein, except with respect to information concerning UBS AG, its subsidiaries and affiliates, nor is it intended to be a complete statement or summary of the securities, markets or developments referred to in the report. UBS does not undertake that investors will obtain profits, nor will it share with investors any investment profits nor accept any liability for any investment losses. Investments involve risks and investors should exercise prudence in making their investment decisions. The report should not be regarded by recipients as a substitute for the exercise of their own judgement. Past performance is not necessarily a guide to future performance. The value of any investment or income may go down as well as up and you may not get back the full amount invested. Any opinions expressed in this report are subject to change without notice and may differ or be contrary to opinions expressed by other business areas or groups of UBS as a result of using different assumptions and criteria. Research will initiate, update and cease coverage solely at the discretion of UBS Investment Bank Research Management. The analysis contained herein is based on numerous assumptions. Different assumptions could result in materially different results. The analyst(s) responsible for the preparation of this report may interact with trading desk personnel, sales personnel and other constituencies for the purpose of gathering, synthesizing and interpreting market information. UBS is under no obligation to update or keep current the information contained herein. UBS relies on information barriers to control the flow of information contained in one or more areas within UBS, into other areas, units, groups or affiliates of UBS. The compensation of the analyst who prepared this report is determined exclusively by research management and senior management (not including investment banking). Analyst compensation is not based on investment banking revenues, however, compensation may relate to the revenues of UBS Investment Bank as a whole, of which investment banking, sales and trading are a part. The securities described herein may not be eligible for sale in all jurisdictions or to certain categories of investors. Options, derivative products and futures are not suitable for all investors, and trading in these instruments is considered risky. Mortgage and asset-backed securities may involve a high degree of risk and may be highly volatile in response to fluctuations in interest rates and other market conditions. Past performance is not necessarily indicative of future results. Foreign currency rates of exchange may adversely affect the value, price or income of any security or related instrument mentioned in this report. For investment advice, trade execution or other enquiries, clients should contact their local sales representative. Neither UBS nor any of its affiliates, nor any of UBS' or any of its affiliates, directors, employees or agents accepts any liability for any loss or damage arising out of the use of all or any part of this report. For financial instruments admitted to trading on an EU regulated market: UBS AG, its affiliates or subsidiaries (excluding UBS Securities LLC and/or UBS Capital Markets LP) acts as a market maker or liquidity provider (in accordance with the interpretation of these terms in the UK) in the financial instruments of the issuer save that where the activity of liquidity provider is carried out in accordance with the definition given to it by the laws and regulations of any other EU jurisdictions, such information is separately disclosed in this research report. UBS and its affiliates and employees may have long or short positions, trade as principal and buy and sell in instruments or derivatives identified herein.
Any prices stated in this report are for information purposes only and do not represent valuations for individual securities or other instruments. There is no representation that any transaction can or could have been effected at those prices and any prices do not necessarily reflect UBS's internal books and records or theoretical model-based valuations and may be based on certain assumptions. Different assumptions, by UBS or any other source, may yield substantially different results. United Kingdom and the rest of Europe: Except as otherwise specified herein, this material is communicated by UBS Limited, a subsidiary of UBS AG, to persons who are eligible counterparties or professional clients and is only available to such persons. The information contained herein does not apply to, and should not be relied upon by, retail clients. UBS Limited is authorised and regulated by the Financial Services Authority (FSA). UBS research complies with all the FSA requirements and laws concerning disclosures and these are indicated on the research where applicable. France: Prepared by UBS Limited and distributed by UBS Limited and UBS Securities France SA. UBS Securities France S.A. is regulated by the Autorité des Marchés Financiers (AMF). Where an analyst of UBS Securities France S.A. has contributed to this report, the report is also deemed to have been prepared by UBS Securities France S.A. Germany: Prepared by UBS Limited and distributed by UBS Limited and UBS Deutschland AG. UBS Deutschland AG is regulated by the Bundesanstalt fur Finanzdienstleistungsaufsicht (BaFin). Spain: Prepared by UBS Limited and distributed by UBS Limited and UBS Securities España SV, SA. UBS Securities España SV, SA is regulated by the Comisión Nacional del Mercado de Valores (CNMV). Turkey: Prepared by UBS Menkul Degerler AS on behalf of and distributed by UBS Limited. Russia: Prepared and distributed by UBS Securities CJSC. Switzerland: Distributed by UBS AG to persons who are institutional investors only. Italy: Prepared by UBS Limited and distributed by UBS Limited and UBS Italia Sim S.p.A.. UBS Italia Sim S.p.A. is regulated by the Bank of Italy and by the Commissione Nazionale per le Società e la Borsa (CONSOB). Where an analyst of UBS Italia Sim S.p.A. has contributed to this report, the report is also deemed to have been prepared by UBS Italia Sim S.p.A.. South Africa: UBS South Africa (Pty) Limited (Registration No. 1995/011140/07) is a member of the JSE Limited, the South African Futures Exchange and the Bond Exchange of South Africa. UBS South Africa (Pty) Limited is an authorised Financial Services Provider. Details of its postal and physical address and a list of its directors are available on request or may be accessed at http:www.ubs.co.za. United States: Distributed to US persons by either UBS Securities LLC or by UBS Financial Services Inc., subsidiaries of UBS AG; or by a group, subsidiary or affiliate of UBS AG that is not registered as a US broker-dealer (a 'non-US affiliate'), to major US institutional investors only. UBS Securities LLC or UBS Financial Services Inc. accepts responsibility for the content of a report prepared by another non-US affiliate when distributed to US persons by UBS Securities LLC or UBS Financial Services Inc. All transactions by a US person in the securities mentioned in this report must be effected through UBS Securities LLC or UBS Financial Services Inc., and not through a non-US affiliate. Canada: Distributed by UBS Securities Canada Inc., a subsidiary of UBS AG and a member of the principal Canadian stock exchanges & CIPF. A statement of its financial condition and a list of its directors and senior officers will be provided upon request. Hong Kong: Distributed by UBS Securities Asia Limited. Singapore: Distributed by UBS Securities Pte. Ltd [mica (p) 039/11/2009 and Co. Reg. No.: 198500648C] or UBS AG, Singapore Branch. Please contact UBS Securities Pte Ltd, an exempt financial advisor under the Singapore Financial Advisers Act (Cap. 110); or UBS AG Singapore branch, an exempt financial adviser under the Singapore Financial Advisers Act (Cap. 110) and a wholesale bank licensed under the Singapore Banking Act (Cap. 19) regulated by the Monetary Authority of Singapore, in respect of any matters arising from, or in connection with, the analysis or report. The recipient of this report represent and warrant that they are accredited and institutional investors as defined in the Securities and Futures Act (Cap. 289). Japan: Distributed by UBS Securities Japan Ltd to institutional investors only. Where this report has been prepared by UBS Securities Japan Ltd, UBS Securities Japan Ltd is the author, publisher and distributor of the report. Australia: Distributed by UBS AG (Holder of Australian Financial Services License No. 231087) and UBS Securities Australia Ltd (Holder of Australian Financial Services License No. 231098) only to 'Wholesale' clients as defined by s761G of the Corporations Act 2001. New Zealand: Distributed by UBS New Zealand Ltd. An investment adviser and investment broker disclosure statement is available on request and free of charge by writing to PO Box 45, Auckland, NZ. Dubai: The research prepared and distributed by UBS AG Dubai Branch, is intended for Professional Clients only and is not for further distribution within the United Arab Emirates. Korea: Distributed in Korea by UBS Securities Pte. Ltd., Seoul Branch. This report may have been edited or contributed to from time to time by affiliates of UBS Securities Pte. Ltd., Seoul Branch. Malaysia: This material is authorized to be distributed in Malaysia by UBS Securities Malaysia Sdn. Bhd (253825-x).India : Prepared by UBS Securities India Private Ltd. 2/F,2 North Avenue, Maker Maxity, Bandra Kurla Complex, Bandra (East), Mumbai (India) 400051. Phone: +912261556000 SEBI Registration Numbers: NSE (Capital Market Segment): INB230951431 , NSE (F&O Segment) INF230951431, BSE (Capital Market Segment) INB010951437. The disclosures contained in research reports produced by UBS Limited shall be governed by and construed in accordance with English law. UBS specifically prohibits the redistribution of this material in whole or in part without the written permission of UBS and UBS accepts no liability whatsoever for the actions of third parties in this respect. Images may depict objects or elements which are protected by third party copyright, trademarks and other intellectual property rights. © UBS 2011. The key symbol and UBS are among the registered and unregistered trademarks of UBS. All rights reserved.
ab
Related Documents