THE RISE AND COMPETITIVENESS OF SOUTH KOREAN AUTOMOBILE MANUFACTURERS – A COMPARATIVE STUDY WITH GERMAN AUTO PRODUCERS By Larissa Ritter A dissertation submitted to Auckland University of Technology in partial fulfillment of the requirements for the degree of Master of Business (MBus) 2010 School of Business Supervisor: Peter Enderwick

Welcome message from author
This document is posted to help you gain knowledge. Please leave a comment to let me know what you think about it! Share it to your friends and learn new things together.
Transcript
THE RISE AND COMPETITIVENESS OF SOUTH KOREAN
AUTOMOBILE MANUFACTURERS –
A COMPARATIVE STUDY WITH GERMAN AUTO
PRODUCERS
By
Larissa Ritter
A dissertation submitted to Auckland University of Technology in partial
fulfillment of the requirements for the degree of Master of Business
(MBus)
2010
School of Business
Supervisor: Peter Enderwick
i
TABLE OF CONTENT
LIST OF FIGURES AND TABLES iii
ATTESTATION OF AUTHORSHIP iv
ACKNOWLEDGEMENTS v
ABSTRACT vi
I. INTRODUCTION 1
I.1. Current success of South Korean carmakers 1
I.2. Why is the comparison with Germany useful? 2
I.3. Purpose and organisation of the dissertation 3
II. LITERATURE REVIEW 5
II.1. The competitiveness theory 5
II.1.1. Definitions of competitiveness 5
II.1.2. Theoretical foundations 6
II.1.2.1. The industry-based view 7
II.1.2.2. The resource-based view 9
II.1.2.3. The institution-based view 11
II.1.2.4. An integrative multiple theory approach 13
II.2. Late industrialisation 16
II.2.1. Korea’s late industrialisation 18
II.2.2. The emergence of the Korean automobile industry 19
II.2.3. Implications for latecomer strategies 21
III. ANALYTICAL TOOLS FOR THE ASSESSMENT OF COMPETITIVENESS 25
III.1. Macro-environmental analysis 25
III.2. Value chain analysis 27
III.3. Application to the global automobile industry 29
III.3.1. Macro-environmental analysis 29
III.3.1.1. Industry structure 29
III.3.1.2. STEEP analysis 31
III.3.2. Derivation of critical factors for future competitiveness 34
ii
IV. METHODOLOGY 36
V. CASE STUDY ANALYSES 38
V.1. Case one: Hyundai-KIA Automotive Group 38
V.1.1. Company overview 38
V.1.2. Excursion: Hyundai’s catch-up 40
V.1.3. Value chain analysis. 42
V.1.3.1. Suppliers 42
V.1.3.2. Technological innovation 43
V.1.3.3. New product development 47
V.1.3.4. Production 49
V.1.3.5. Marketing & Sales 49
V.1.3.6. Organisational structure 52
V.2. Case two: Volkswagen Group 53
V.2.1. Company overview 53
V.2.2. Value chain analysis 54
V.2.2.1. Suppliers 54
V.2.2.2. Technological innovation 55
V.2.2.3. New product development 59
V.2.2.4. Production 61
V.2.2.5. Marketing & Sales 61
V.2.2.6. Organisational structure 63
VI. DISCUSSION 64
VII. CONCLUSIONS 69
VIII. LIMITATIONS AND FURTHER RESEARCH 73
REFERENCES 76
iii
LIST OF FIGURES AND TABLES
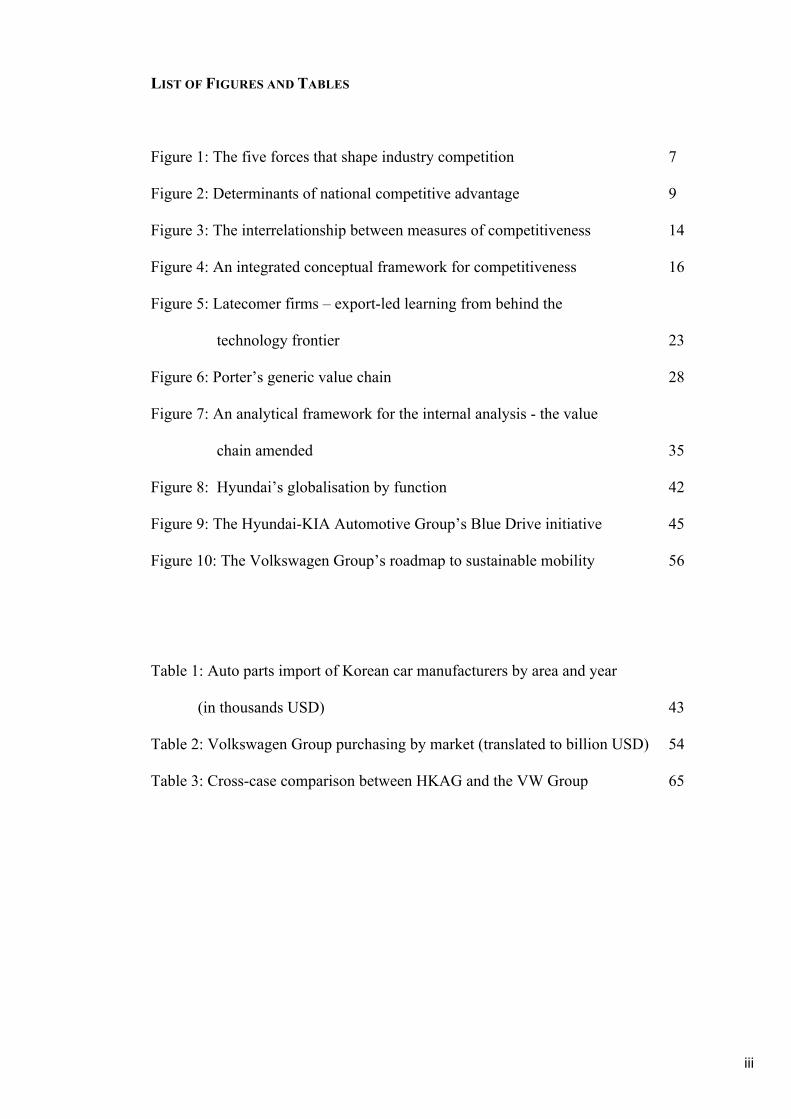
Figure 1: The five forces that shape industry competition 7
Figure 2: Determinants of national competitive advantage 9
Figure 3: The interrelationship between measures of competitiveness 14
Figure 4: An integrated conceptual framework for competitiveness 16
Figure 5: Latecomer firms – export-led learning from behind the
technology frontier 23
Figure 6: Porter’s generic value chain 28
Figure 7: An analytical framework for the internal analysis - the value
chain amended 35
Figure 8: Hyundai’s globalisation by function 42
Figure 9: The Hyundai-KIA Automotive Group’s Blue Drive initiative 45
Figure 10: The Volkswagen Group’s roadmap to sustainable mobility 56
Table 1: Auto parts import of Korean car manufacturers by area and year
(in thousands USD) 43
Table 2: Volkswagen Group purchasing by market (translated to billion USD) 54
Table 3: Cross-case comparison between HKAG and the VW Group 65
iv
ATTESTATION OF AUTHORSHIP
I hereby declare that this submission is my own work and that, to the best of my
knowledge and belief, it contains no material previously published or written by another
person (except where explicitly defined in the acknowledgements), nor material which
to a substantial extent has been submitted for the award of any other degree or diploma
of a university or other institution of higher learning.
Larissa Ritter
v
ACKNOWLEDGEMENTS
I would like to express my gratitude to my supervisor Peter Enderwick for his guidance
and tireless support throughout the past months. Furthermore, I would like to thank my
friends and family who were always at hand with help and advice and gave me strength,
especially in the past two years while being so far away from home. A special thanks
goes to my parents without whom I would have never been able to realise my dream of
living and studying in New Zealand. I cannot express in words how grateful I am for all
their love and support.
Auckland
June 2010
vi
ABSTRACT
With the recent ascend of Korean car manufacturers to major competitors in the global
automobile market in less than three decades, questions arise how these car producers
succeeded to rise in such a mature industry and what competitive strategies they follow.
It furthermore shows a change in direction from late entrants impelled to catch-up with
established firms in terms of technology, design and other inalienable business skills, to
threatening innovative rivals. By analysing the pre-conditions for the rise and the
competitive strategies applied by Korean car manufacturers in comparison to their
German counterparts, this dissertation provides suggestions in mainly three areas: the
continuing competitiveness of Korean car manufactures; the future survival of European
car producers and last but not least for the rise of new competitors from emerging
markets.
1
I. INTRODUCTION
I.1. The rise of Korean automobile manufacturers
The Republic of Korea (in the following referred to as Korea) is one of the most
prosperous economies in the world and has enjoyed remarkable growth from one of the
poorest countries in the world to an industrialised economy in less than 50 years. In the
literature, a large part of Korea’s economic success is ascribed to the huge Japanese-like
business conglomerates (Chang, 2006; Choe & Pattnaik, 2007). With strong
governmental support since the 1960s, these so-called chaebols,1 such as Samsung, LG
and Hyundai, succeeded in establishing themselves in the international business
environment (Green, 1992). In 2009 fourteen of these firms ranked among the world’s
top 500 Fortune companies (Fortune, 2010).
South Korea is considered a key global player in steel, shipbuilding, textiles and
consumer electronics. Another major economic pillar is the automobile industry
(Central Intelligence Agency, 2009). As of 2004, the industry including supporting
industries employed 250,000 employees and generated a turnover of USD 78 billion2
(International Organization of Motor Vehicle Manufacturers [OICA], 2006). Despite the
emergence of the Korean automobile industry over the last 40 years, the country quickly
became one of the leading auto producers in the world and is currently ranked fifth
behind Japan, China, Germany and the USA (OICA, 2009). The South Korean car
manufacturers comprise Hyundai, Kia, GM Daewoo, SsanYong Motor Company and
Renault Samsung Vehicles, with the Hyundai-KIA Automotive Group being the largest
producer and dominator of the domestic market (Economist Intelligence Unit [EIU],
2009b). The total annual output of the industry in 2009 added up to 3.2 million
passenger vehicles of which 2 million were exported (Korea Automobile Manufacturers
Association, 2010). The main export markets are the US, Europe and increasingly
emerging markets such as India and China (EIU, 2009b). Together Hyundai Motors and
its affiliate KIA accounted for 4.6 per cent of Korea’s total exports in 2006 (Economist,
2007b).
The specialty of South Korean auto producers is to provide affordable entry-
level cars, which are considerably cheaper than their competitors’ offerings (Greenlees,
2004). Recently Korean car producers have started to move upmarket. With the launch
1 Korean chaebols are defined as large diversified business groups that consist of formally independent firms and are controlled by the family members of the founder (Lee & Yoo, 1987). 2 All foreign currency amounts in this document have been translated at the USD exchange rates ruling at 27 June 2010.
2
of the Hyundai Genesis - the first Asian luxury sedan to be awarded ‘The North
American Car of the Year’ in 2008, Hyundai introduced its very first luxury model after
four years of development time, aiming to compete against the dominant European
brands in this market segment (Choi & Bok, 2009). In addition, the immense problems
with the poor quality reputation of Korean cars have also gradually dissipated.
According to the U.S. J.D. Power Initial Quality survey that rates the satisfaction of
customers with their newly purchased cars, Hyundai has ranked among the top three
brands in 2006 ahead of Toyota for the second time in three years (Economist, 2007b).
As a result, Korean car manufacturers increase their sales and market share
globally and enjoy record profits in recent years, even during the latest recession, while
competitors from the US, Japan and Europe are concerned with declining sales
(Economist, 2009c). Hyundai, for example, was able to increase its market share in the
US market to 4.4 per cent up from 3.1 per cent in the previous year and hit new sales
records by September 2009. Though, some experts argue that the company’s success
was mainly attributed to governmental scrappage incentives in many developed
countries, as well as a weak Korean won, industry insiders see South Korean carmakers
prosper further (Song & Simon, 2009). According to the Global Auto Executive Survey
2010 conducted by KPMG, over 73 per cent of the respondents (mainly middle to top-
level managers) see Hyundai and KIA’s market share further increasing over the next
few years. Prospects for Chinese and Indian brands, as well as for Toyota and
Volkswagen are perceived as similarly positive, while market shares of other European
competitors’ are expected to be stable and US competitors’ to significantly decrease
(KPMG, 2009b).
All these recent developments and events are indicators of the rise of the Korean
car manufacturers to major competitors in the future global automobile market.
Moreover, they show a change in direction from late entrants impelled to catch-up with
established firms in terms of technology, design and other inalienable business skills, to
threatening innovative rivals.
I. 2. Why is the comparison with Germany useful?
Despite the author’s sound knowledge and ongoing interest in the German car industry,
a benchmark with German competitors is useful for several reasons.
First, similarly important as to South Korea’s national economy, is the German
automobile industry for the German economy. In 2008, the German automobile industry
employed around 750,000 employees and generated revenues over USD 400 billion.
3
Germany constitutes the fourth largest auto producer in the world ahead of South Korea
and produced over ten million cars worldwide in 2008, which is equivalent to 17,4 per
cent of the world automobile production. Of the six million vehicles produced in
Germany almost 75 per cent were exported. The major producers in Germany are
Volkswagen AG (including Audi), BMW, Daimler AG and Porsche AG. The main
export markets represent Western Europe, the US and China (EIU, 2009a; German
Association of the Automotive Industry [VDA], 2010b). Hence, German carmakers
represent a major competition for Koreans in most markets. Second, there is evidence of
South Korean car manufacturers increasingly encroaching on the competitive space of
larger German car manufacturers. With Hyundai’s move upmarket and the refocusing
on its mainstream business with less expensive, small and fuel efficient models
characterising the future trend in demand, the company provides fierce competition to
German car manufacturers that are dominating these two market segments (premium
and small compact models) (Economist, 2007a, 2009e). Moreover, South Korea’s
biggest auto manufacturer Hyundai is also planning to foster its market presence in the
German car manufacturers stronghold, the European market, where Hyundai’s market
share so far has been a mere 2.2 per cent (Ihlwan, 2008b; Warburton & Pretorius, 2009).
At the same time, its latest efforts in the development of clean diesel technologies will
increase its competitiveness against German competitors who are committed to these
technologies (Frink, 2008; Hyundai Motor Company, 2009a). German car producers are
furthermore aiming to get a foothold in the emerging markets where the Koreans have a
strong market presence (EIU, 2009a; Ihlwan, 2008a).
Last but not least, with Korean Hyundai surpassing Ford’s global sales in the
first half of 2009, the company will consequently strive to overtake Volkswagen’s third
place in the near future (Song & Simon, 2009).
I.3. Purpose and organisation of the dissertation
Given the remarkable achievements over a short period of time, the question inevitably
arises how Korean car manufacturers succeeded to rise in such a mature and highly
competitive environment where until recently consolidation was imperative in order to
deal with ever falling profit margins and increasing costs (Economist, 2005). A lot of
research was conducted on the late industrialisation of Korea (e.g. Amsden, 1989, 1991,
1995; Thompson, 1996; Kang, 2002) and its successful late entry into various
industries, in particular semiconductors and electronics (e.g. Cho & Rhee, 1998;
KunMo & KongRae, 1999; Choung & Hwang, 2000; Gil, Bong & Lee, 2003; Lee,
4
2005). However, literature on the late entry of Korean automobile firms and their
competitive strategies used to establish themselves internationally is rather sparse. With
the aim to provide a more complete picture on the rise and competitiveness of the
Korean automobile industry, this dissertation analyses the competitive strategies applied
by Korean car manufacturers in comparison to their German competitors. An interesting
point beyond that will be the role of governments with many governments around the
world setting ever more stringent emission standards (KPMG, 2009a) and signalling
their willingness to safeguard their national car industries through protectionist
measures in light of the recent recession (Chaffin, 2009).
In the end, this dissertation aims at answering the following questions:
-‐ What were the driving forces behind the growth of the South Korean automobile
industry?
-‐ What kind of strategies do the Korean car manufacturers pursue in order to increase
their competitiveness and catch-up with established firms? Hereby special emphasis
will be given to the technology strategy.
-‐ Are Korean car producers following the same or divergent strategic paths in
comparison to their German competitors?
-‐ What present and future impacts will governments have on the competitive
environment and the competitiveness of firms and industries?
-‐ What implications does the rise and growth of the Korean automobile producers
have on the rise of new competitors from emerging economies like China and
India?
This dissertation will thereby contribute to three main areas by deriving tentative
recommendations and implications for the continuing competitiveness of Korean car
manufacturers, for the future survival of European car producers, and for the rise of new
competitors from emerging economies like China and India.
By reviewing the literature on the concepts of competitiveness theory, late
industrialisation paradigm, as well as general strategic implications of late entry; a
theoretical foundation for the analysis will be presented. Moreover, the development of
the Korean automobile industry and its peculiarities will be depicted. Since the Korean
car manufacturers are latecomers, whereas German firms have been established in the
industry far longer, it is necessary to understand the pre-conditions for the rise. In the
next step, an analytical framework will be proposed for the subsequent case study
analyses, followed by the methodology used. In the main part of the dissertation, the
5
competitive strategies of the Hyundai-KIA Automotive and Volkswagen Group will be
analysed individually. The findings will then be synthesised and evaluated. In the
concluding part, findings will be summarised and implications for the future of the
automobile industry and other emerging latecomer firms will be derived. It should be
noted hereby that the focus of this dissertation is solely directed towards the passenger
vehicle segment without the consideration of light trucks or commercial vehicles. Last
but not least, the dissertation will conclude with the account of limitations encountered
during this study and their implications for further research.
II. LITERATURE REVIEW
II.1. The competitiveness theory
A great body of research is available dealing with the theory of competitiveness and
competitive advantage of nations, industries and firms (e.g. Barney, 1986; 1991, 1995;
Buckley, Pass, & Prescott, 1988; Moon & Peery Jr., 1995; Moon, Rugman, & Verbeke,
1998; Porter, 1990; Prahalad & Hamel, 1990; Schuller & Lidbom, 2009). In order to
gain a more comprehensive understanding of competitiveness, this chapter introduces
different definitions of competitiveness, followed by a description of different
theoretical approaches to conceptualise and measure competitiveness. In the end, the
multiple theories are combined and incorporated into one framework, which builds the
foundation for the analytical framework and the subsequent case study analyses. It
should be noted here that the integrative framework is solely focusing on the analysis at
the firm level, since the two case studies involved in this dissertation refer to two
organisations.
II.1.1. Definitions of competitiveness
Despite the common use of the term competitiveness, it is rarely defined in literature
and varies depending on the level-of analysis at the country, industry or firm level.
Thus, any analysis dealing with competitiveness has to clearly state at which level
measurement is taking place (Buckley, et al., 1988; Moon & Peery Jr., 1995; Snowdon
& Stonehouse, 2006).
In the Report from the Select Committee of the House of Commons on Overseas
Trade (1985), commonly known as the Aldington Report, national competitiveness is
described as “the degree to which [a nation] can, under free and fair market conditions,
produce goods and services that meet the test of international markets while
6
simultaneously expanding the real incomes of its citizen. Competitiveness at the
national level is based on superior productivity performance“ (Buckley, et al., 1988, p.
176). Put differently, “national competitiveness refers to a country’s ability to create,
produce, distribute and/or service products in international trade while earning rising
returns on its resources” (Scott, Lodge, & Bower, 1985, p. 3).
While national competitiveness encompasses the entire economy of a country,
Porter, one of the greatest advocates of the competitiveness of nations, claims that the
basic unit of analysis for the competitiveness of a nation is the industry seeing that
nations as a whole do not compete in international markets, but their firms (Moon &
Peery Jr., 1995). He further adds that it is rather unlikely that a country can compete
successfully in all industries. Instead countries gain international success in different
industries or segments (Porter, 1990), which in turn depends on firms’ “competitive
advantage relative to the best worldwide competitors” (Porter, 1990, p. 76).
Since the competitiveness of nations and industries ultimately depends upon
firms; the field of strategic management traditionally focuses on the analysis at the firm
level. In general, a firm’s competitiveness relates to “the ability to increase in size,
market share and profitability” (Clark & Guy, 1998, p. 364). Other definitions
emphasise the means to gain competitiveness, which are the firms’ capabilities to
produce and market goods whose price and non-price qualities exceed the offers of
domestic or foreign competitors. The concept of competitiveness is thereby closely
related to the concept of efficiency (i.e. achieving desired goals at a minimum possible
cost), but further encompasses the concept of effectiveness, which involves the
configuration of the most appropriate objectives (Buckley, et al., 1988). Moreover,
competitiveness is also often confounded with the term productivity. While the latter
alludes to internal capabilities of organisations, the term competitiveness refers to the
relative position of an organisation in comparison to its competitors. Hence,
competitiveness is a relative concept whose analysis always requires a competitor as a
benchmark (Moon & Peery Jr., 1995).
II. 1.2. Theoretical foundations
Given the tremendous complexity and the lack of a universal conceptual framework for
competitiveness, different theoretical approaches identify distinct determinants and
measures for competitiveness. In general, literature can be divided into three different
streams to conceptualise competitiveness: the industry-based, the resource-based and
the institution-based view. These concepts are not rationally contradictory and
7
combining them allows for a more complete picture of the competitive forces shaping
the competitive environment firms are confronted with (Barney, 1986; Peng, Sunny Li,
Pinkham, & Hao, 2009).
II. 1.2.1. The Industry-based view
The first approach, which was mainly popularized by Michael Porter since the 1980s, is
Industrial Organisation theory. According to this concept, returns of a firm are
determined by the structure of an industry, which in turn is shaped by several forces like
the existence and value of barriers of entry, the number and size of competitors in the
industry, the existence and degree of product differentiation and the overall demand
elasticity in the industry (Barney, 1986). By terming the industry’s structural attributes
slightly differently and adding the bargaining power of suppliers, Porter (1980, 2008)
developed the model of five forces that shape the competition in an industry (see Figure
1). According to this model, industries that demonstrate large entry-barriers (i.e. the
threat of new entrants is low), small number of competing firms, a large degree of
product differentiation (meaning few substitutes for a product or service are available),
or low demand elasticity (i.e. low bargaining power of buyers), are characterised by
higher returns and less competition. Alternatively, industries with low-entry barriers, a
high number of competing firms, low differentiation potential and high demand
elasticity tend to imbed fierce competition (Barney, 1986; Porter, 1980; 2008).
Figure 1: The five forces that shape industry competition
-‐ This image has been removed by the author of this thesis for copyright reasons -‐
(Source: Porter, 2008, p. 80)
8
As a result, these forces determine firms’ conduct (i.e. its strategy) and
performance, leading to a structure, conduct and performance paradigm. The strategy or
conduct of a firm defines the means the firm uses to achieve their goals or the
maximisation of the firms economic returns and performance (Porter, 1980). Industrial
Organisation theory urges firms to exploit, create and alter the structural attributes in
order to increase their returns and to protect themselves from return-reducing
competitive entry (Barney, 1986).
In his work “The competitive advantage of nations”, Porter (1990, 1998)
extends his five forces model, by introducing a diamond model with four determinants
of national competitive advantage (see figure 2). According to this approach, the most
important attributes influencing the competitive environment in which companies
operate, are factor conditions (e.g. labour, resources, infrastructure etc.), demand
conditions (i.e. powerful and sophisticated buyers that force innovation and set
standards worldwide), related and supporting industries (e.g. R&D institutes, globally
competitive suppliers) and firm strategy, structure and rivalry (i.e. conditions
influencing how the organisations in a country are formed, structured and managed).
While a nation does not necessarily inherit these important factors, it is argued that
nations have to create, enhance and continuously upgrade each of those factors in order
for their firms to gain and sustain their competitive advantages. Likewise Porter states
that the diamond constitutes a system where every factor is self-reinforcing. A good
example for the systemic nature of the diamond constitutes vital domestic rivalry.
Rivalry, not only encourages the development of unique specialised factors such as
highly-skilled labour, but also the formation of high-class suppliers which in turn leads
to more sophisticated products and customers on the demand side. This phenomenon,
for example, can be observed in the Italian furniture and footwear industry or the
Japanese semiconductor industry. On the other hand, Porter argues that the diamond
promotes the formation of clusters of competitive industries with firms from the same
industry being linked together through vertical or horizontal relationships, and which
are usually geographically agglomerated (e.g. Silicon Valley, Hollywood etc.) (Porter,
1990).
9
Figure 2: Determinants of national competitive advantage
-‐ This image has been removed by the author of this thesis for copyright reason
(Source: Porter, 1990, p. 77)
While Porter’s diamond model finds approval among many scholars; several
researchers (e.g. Cartwright, 1993; Dunning, 1993; Grant, 1991a) criticise its narrow
scope. One of its greatest weaknesses, especially in times of globalisation, is the home-
based perspective. The model neglects multinational activities that mainly elucidate the
success of small-scale economies such as Korea and Canada in previous empirical
studies. Instead Porter’s global firm functions just as an exporter and underestimates the
organisational complexities of multinational firms. To deal with this shortcoming
Rugman and D’Cruz (1993) and later Moon, Rugman and Verbeke (1995) introduced
the double diamond by adding an outside layer to the diamond, which represents the
global competitiveness in the form of multinational activities (Moon, et al., 1998).
Another deficiency of the model is the treatment of the exogenous variable
government as a secondary driver (Ketels, 2006). Even though Porter acknowledges the
role of the government, he argues that its role is rather menial, as it cannot generate a
competitive advantage for a nation (Porter, 1980). In this point many scholars disagree,
often pointing to the important role that governments play in emerging economies (e.g.
Peng, Wang, & Jiang, 2009; Peng, et al., 2008).
II.1.2.2. The resource-based view
In contrast to Industrial Organisation theorists, favourers of the Chamberlinian concept
or resource-based view (RBV) focus on the firms’ assets and unique capabilities as the
defining factors of their pursued strategies and competitiveness (e.g. Barney, 1991;
1995; Barney, Wright, & Ketchen, 2001; Grant, 1991b; Hamel & Prahalad, 2005;
10
Prahalad & Hamel, 1990; Teece, Pisano, & Shuen, 1997; Wernerfelt, 1984). While
similar and overlapping resources and capabilities enhance competition among firms,
firm heterogeneity may be an important source of firms’ competitive advantages.
Consequently, differences in assets and resources allow firms to employ strategies that
alter the industry structure and exploit their individuality and uniqueness. Differences in
firms’ assets and resources evolve through e.g. different levels of technical know-how,
diverse skills of their human resources, differences in brand images and reputations, as
well as patents and trademarks (Barney, 1986). In order to create a sustainable
competitive advantage it is argued that firm resources must be rare, valuable,
imperfectly imitable, durable, immobile, little transparent and transferable, as well as
non-substitutable (Barney, 1991; Grant, 1991b).
Resources can be either classified as tangible (explicit; codified and can be
easily transferred) or intangible (tacit; uncodified and difficult to transfer) (Barney et al.,
2001; Lu, Tsang, & Peng, 2008). Although Barney (1991) considers all assets,
attributes, capabilities, organisational processes, knowledge and information of a firm as
their resources; many scholars plead for the distinction between resources and
capabilities (e.g. Amit & Shoemaker, 1993; Grant, 1991b; Prahalad & Hamel, 1990;
Teece, et al., 1997). In their view resources form the source of firm’s capabilities, while
the latter represent the firm’s ability to deploy those resources in the most efficient and
effective way (Amit & Shoemaker, 1993; Grant, 1991b; Moon & Peery Jr., 1995). In
other words, resources are rarely productive on their own, but organisations have to
transform them through productive activities using their capabilities or competences
(Grant, 1991b).
Given the fast changing business environment in the past decades, scholars more
recently extended the capabilities concept by adding a dynamic component to it.
Dynamic capabilities are defined as the firm’s ability to adjust, integrate and
reconfigure its internal and external competences in congruence with the changing
business environment (Ambrosini & Bowman, 2009; Teece, et al., 1997). In a broader
sense dynamic capabilities encompass the concepts of core competences (Prahalad &
Hamel, 1990), combinative capabilities (Kogut & Zander, 1992), distinctive capabilities
(Snow & Hrebiniak, 1980), organisational capabilities (Collis, 1994), as well as the
knowledge-based view of a firm3 (Grant, 1996). This approach is further closely linked
to the Schumpeterian view of economics in which creative destruction in the form of
revolutionary product, market or technological innovations shapes the industry’s 3 Grant (1996), for example, refers to organisational capabilities as the outcome of knowledge integration.
11
competition as it defines which organisational resources, capabilities and knowledge are
strategically valuable (Barney, 1986). Accordingly, “the value of a particular set of
capabilities must be evaluated in the market context within which a firm is operating”
(Barney, et al., 2001, p. 631). Firms who inherit the required competences and resources
are likely to succeed from early on, whilst firms lacking those resources and skills have
to respond by modifying their capabilities and assets. In the same context, Nonaka
(1994), Nonaka and Takeuchi (1995) and Barney et al. (2001), point out that in a
dynamic business environment the organisation’s ability to learn and adapt constitutes
one of the most important capabilities or competences in order to gain competitive
advantage. However, despite the theoretical assumption of firm’s having the possibility
to choose any strategic option, they are yet bound to past strategic choices that form the
basis for future decisions (Teece, et al., 1997). The path dependency of firms can be
best illustrated with the example of Canon. With Canon’s initial core competences in
optics, imaging and microprocessor controls, the company was able to diversify its
product portfolio into areas related to their core competences such as laser printers,
copiers and image scanners. Without their previous competences, this decision would
have rather been unlikely (Prahalad & Hamel, 1990).
II.1.2.3. The institution-based view
Given the rise of emerging economies from Southeast Asia in the 1990s, which was
facilitated by favourable institutional policies, Peng (2009) suggests the consideration of
a third determinant of competitiveness – namely the institution-based view. Indeed,
many scholars acknowledge the impact of external institutions on the competitive
environment (e.g. North, 1990; Oliver, 1997; Scott, 1995). Protectionist policies in
favour of domestic firms or the lack of appropriate institutional systems to protect
intellectual property rights encouraging piracy, are just a few examples showing how
institutions (or their absence) can improve or deteriorate the competitive advantages of
firms (Chao, 1998; Lu, et al., 2008).
Institutions can be either formal (e.g. laws, public policies and regulations like
antidumping) or informal (e.g. norms, cultures, ethics or interpersonal relations) with
formal institutions being regulative and the latter being cognitive and normative. Put
differently, Institutions (formal or informal) create rules and guidelines for
organisations to follow and signify which actions of an organisation are appropriate,
desirable and legitimate (North, 1990; Peng, et al., 2009; Scott, 1995).
12
In most of the previous literature formal market-based institutions are taken for
granted since they are almost invisible in developed countries where most of the
strategy literature originates from. Informal institutions such as cultures and norms, on
the other hand, are treated as background variables. However when dealing with
emerging economies, informal institutions such as interpersonal networks and
relationships, for example, become more important as they compensate for the lack of
well-functioning, consistent and efficient formal institutions, thus reducing uncertainty
and offering constancy and predictability (Peng, 2002; Peng, et al., 2009). It is
commonly agreed that compliance with laws and regulations set by formal institutions
on the micro and macro level may impose higher transaction costs on firms (Hill, 1995;
Peng, et al., 2008). In some cases informal institutions can constitute one form of
circumventing those costs. Considering China or India, for example, red tape can
constitute a severe threat for a company’s business operations. In order to reduce
uncertainty, most companies therefore rely on favourable external connections with
government officials, which often imply the exchange of gifts and favours. However,
the preference of informal constraints over formal ones can also be observed in many
developed countries. Japanese supplier relations, for example, are often based on
consensus-building and trust rather than formal contracts (Peng, 2002). Likewise, some
firms in developed countries that lack a competitive advantage use their informal
relationships in the form of lobbying to fight competitors (Peng, et al., 2009).
In summary, strategic choices of firms are not just based on firms’ capabilities
and industry conditions, but reflect the institutional framework managers are confronted
with. They are further the outcome of the dynamic interaction between organisations
and institutions (Oliver, 1997; Peng, 2002; Scott, 1995). Given the fact that all
organisational actions, goals and outputs must conform to institutional rules, norms,
beliefs, cultures and expectations that vary across countries, one of the key resources for
building a competitive advantage constitutes the institution-based knowledge of the
international markets they operate within (Lu, et al., 2008; Peng, et al., 2009). The
failed attempt of Indian Tata Motors to establish a new automobile production plant in
West Bengal is a key example to show that firms have to do their homework and be
familiar with the institutional environment of the markets they operate within. Despite
the fact that the plant would have created thousands of new jobs in the region, the state
government and local farmers reacted hostile to Tata’s plans, as they were concerned
about the loss of farmland in favour of the new factory (Economist, 2008; Peng, et al.,
2009).
13
II.1.3. An integrative multiple theory approach
Despite the abundance of concepts and frameworks for measuring competitiveness, a
general comprehensive model that combines multiple theories and is applicable in
practice is not readily available (Ambastha & Momaya, 2004; Buckley, et al., 1988).
Most empirical studies are preoccupied with measuring and comparing the performance
of firms. However performance measures reflect the outcome (i.e. past and present
competitiveness factors) but not the sources of future competitiveness (Buckley, et al.,
1988; Daniel, 1961). In many Asian companies, for example, profitability or
performance measures might not depict the company’s actual position due to
differences in financial markets and the resulting strategic long-term orientation.
Conversely, the prevalent shareholder capitalism in many Western countries works in
favour of short-term profits (Peng, et al., 2009)4. In this context it becomes important to
look beyond financial ratios, market shares and other profitability parameters in order to
identify and evaluate the underlying resources, capabilities and knowledge of a firm that
determine its performance (Buckley, et al., 1988). In this regard the inevitable question
arises how to measure the resources and capabilities of an organisation? Due to the vast
diversity and complexity of concepts, most researchers consider different variables and
indicators to measure competitiveness often applying archival and quantitative proxies,
which raise concerns about the construct validity of measures. Meanwhile, researchers
struggle with the assessment and measurement of intangible resources and capabilities.
It is therefore often argued that intangible resources call for qualitative approaches
(Barney et al., 2001; Buckley, et al., 1988; Rouse & Daellenbach, 1999).
Buckley, Pass and Prescott (1988) categorize measures into three general groups
consisting of competitive performance, potential and processes. In this interrelated
model (see figure 3), potential5 represents the inputs (i.e. resources, assets, knowledge),
processes the management (i.e. capabilities and competences) and performance the
outcome of a firm’s operations. From this point of view, competitiveness is a dynamic –
rather than static process, where measures must be considered jointly and not
individually. Potential alone, for example, does not guarantee that management
processes will turn them into a successful performance. Concurrently it is the managers’
responsibility to create and build new potential. The authors therefore suggest the
combined analysis of these categories, with quantitative performance measures
4 Note from the author: This example also illustrates the importance of determining the applied time horizon in an analysis. 5 Instead of the term ‘potential’ Ambastha & Momaya (2004) use the term ‘assets’.
14
identifying the relative competitive position of a firm, followed by a qualitative
investigation of the firm’s potential and processes.
Figure 3: The interrelationship between measures of competitiveness
-‐ This image has been removed by the author of this thesis for copyright reasons -‐
(Source: Buckley, et al., 1988, p. 178)
As previously mentioned, the operationalisation of measures in literature is not
uniform and depends on the scholars’ research area, objectives and the level of analysis.
In an attempt to facilitate the evaluation and assessment of resources and capabilities
(i.e. potential and process measures), Grant (1991) proposes a general classification into
six major categories, which are financial, physical, technological, organisational, and
human resources, as well as reputation. Nevertheless, this classification is very broad
and gives a lot of leeway for the conceptualisation of measurements. Buckley et al.
(1988) therefore list more specifically cost, price and quality competitiveness;
productivity; technological activities (i.e. R&D expenditures, patents etc.); and the
endowment of or access to capital, skilled labour and raw materials as possible
measures for the potential of a firm with technological development and price/cost
competitiveness being the most pivotal ones. In regards to processes, Buckley et al.
identify a firm’s commitment to international business, ownership advantages6,
investment strategy, commercialisation of technologies, marketing aptitude, internal and 6 With ownership advantages the authors refer to Dunning’s eclectic theory or OLI paradigm that helps to explain the advantages of different types of foreign direct investments over exports based on three criteria: ownership (or firms-specific advantage), location (or country specific advantage) and internalization. For further information please see Dunning (1980).
15
external management relations (i.e. relations to workforce, customers, suppliers,
retailers, distributer, strategic partners, host and foreign governments), economies of
scale and scope7, innovative product management, as well as firms’ experience as
important measures of competitiveness. Some literature also highlights the importance
of operational management practices including manufacturing and process technology,
as well as quality management amongst others (Sirikrai & Tang, 2006). Ambastah and
Momaya (2004) probably offer the most extensive list of competitiveness measures.
Nonetheless, while the aforementioned measures describe an internal analysis of
an organisation, most researchers recognise the need to combine the internal analysis,
with the analysis of external competitiveness factors in order to gain a more complete
picture (e.g. Barney, 1991; Hansen & Wernerfelt, 1989; Sirikrai & Tang, 2006).
Two key tools for strategy formulation – the so-called SWOT or WOTS-UP
(‘weakness, opportunities, threats, and strengths underlying planning’) analysis, are
examples of the integration of the internal and external analysis of competitiveness.
While the former representing strengths and weaknesses emphasises the resource-based
view, the latter focusing on opportunities and threats underlines the industrial
organisation and institution-based-view (Barney, 1991).
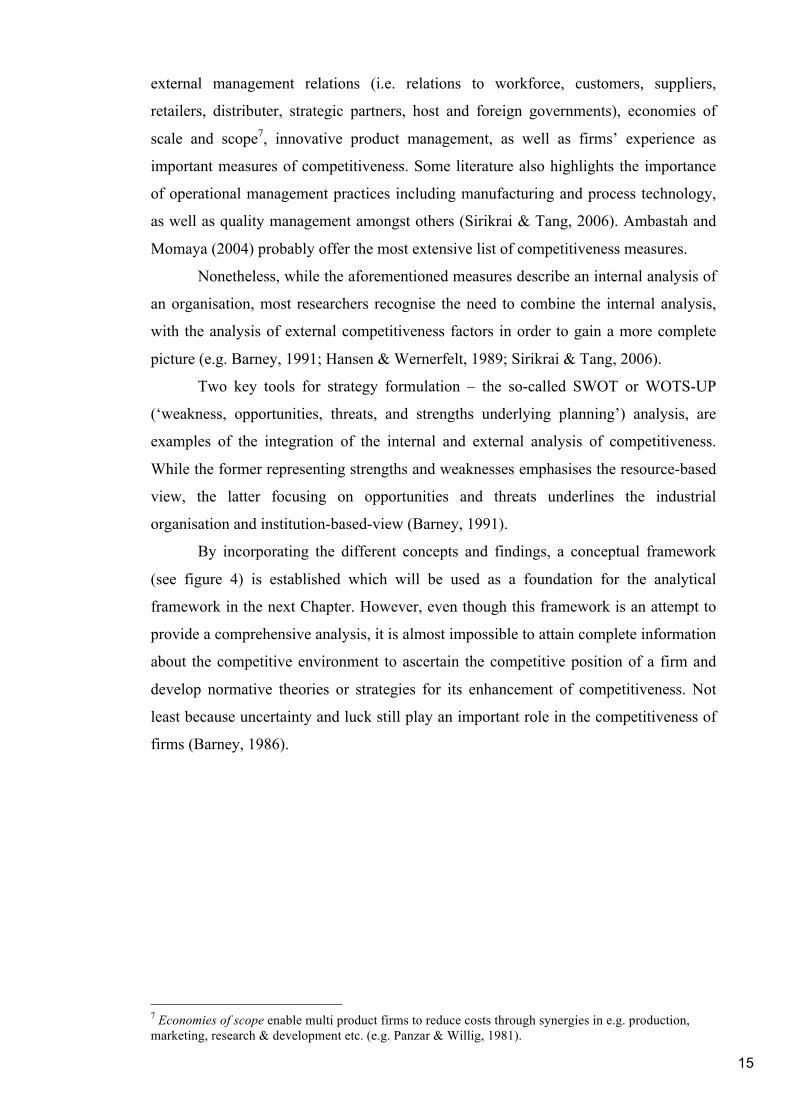
By incorporating the different concepts and findings, a conceptual framework
(see figure 4) is established which will be used as a foundation for the analytical
framework in the next Chapter. However, even though this framework is an attempt to
provide a comprehensive analysis, it is almost impossible to attain complete information
about the competitive environment to ascertain the competitive position of a firm and
develop normative theories or strategies for its enhancement of competitiveness. Not
least because uncertainty and luck still play an important role in the competitiveness of
firms (Barney, 1986).
7 Economies of scope enable multi product firms to reduce costs through synergies in e.g. production, marketing, research & development etc. (e.g. Panzar & Willig, 1981).
16
Figure 4: An integrated conceptual framework for competitiveness
(Source: Kumar & Chadee, 2002, p. 5; adapted and modified by author)
II.2. Late industrialisation
In the context of the competitiveness theory, the late industrialisation paradigm
becomes highly interesting. Given the lack of proprietary technology, late
industrialising countries usually tend to diversify into various technologically unrelated
industries while focussing on the production of goods rather than R&D or basic
research. Consequently, the late industrialisation of countries occurs on the basis of
‘pure’ learning or borrowing of already commercialized technologies from other
countries in order to catch-up with the rest. Nevertheless, in their race to catch-up, the
productivity deficit of late industrialising countries still constitutes a huge problem.
Another challenge faced by late industrialising economies constitutes upgrading, since
the access to foreign technologies becomes more and more difficult as they move up the
value chain (Amsden, 1995).
After WWII, mainly Latin American and South-East Asian countries began to
industrialise without the competitive advantages of new products and processes, but
with a seemingly unlimited supply of cheap labour (compared to advanced economies)
and similarly important, the active interventions of government. According to historian
Gerschenkron (1962), the role of the government augments the later a country starts to
industrialise and the larger its technological gap is, that divides the country from other
industrialised nations. German and American industries, for example, overtook the
British outriders of the Industrial Revolution grounded on new technologies, products
and processes and organisational skills. Thus, government interventions during the
Second Industrial revolution were limited to infant industry protection.
17
However, in the case of East Asian economies the role of the government was
far more intrusive in order to promote development and enhance the country’s
productivity. Even though the order of industrial growth among latecomers in
relationship to an increase in governmental action does not confirm Gershenkron’s
thesis, it can be generally assumed, that the greater the assets a country possesses, the
less governmental intervention is necessary.
As the pioneer of the late-industrialising paradigm Japan inspired governments
of its neighbouring countries to promote a systematic accumulation of capital and
augmentation of productivity instead of pure rent seeking and wealth redistribution.
Consequently, governments established state led development agencies to guide and
support the creation of new industries through beneficiary policies and financial aid and
channelized further investments into education and infrastructure.
Although the way of financing growth in East Asia (through FDI, foreign loans
etc.) varied, governments tended to discipline labour and capital by just subsidising
firms meeting established export targets. In addition, governments protected the
domestic market from foreign entrants, thus imposing an import substitution policy. As
a result, trade became a powerful growth engine. However, with rising trade surpluses
and the need for more sophisticated technologies, governments increasingly had to rely
on FDI from the 1980s onwards. In this phase, the government intervention shifted
towards the promotion of knowledge and technology including the liberalization of
entry conditions for foreign firms (Amsden, 1995).
All in all, the process of industrial development takes place in disequilibrium,
where late industrialising countries try to catch-up through industrial upgrading with an
emphasis on manufacturing (Mathews, 2006a). In this context, Akamatsu’s (1962)
‘flying geese’ paradigm helps to explain the patterns of the upgrading process. The
paradigm, which was developed to describe economic development in South East Asia,
postulates that the catch-up process of countries follows a regional hierarchy with a
continuous relocation of industries from more advanced to developing countries due to
the shift in competitive advantages. With Japan being the lead goose, followed by the
tiger states Korea, Taiwan, Singapore, Hong Kong and nowadays emerging economies
such as China, Thailand, Vietnam and India. Being in the rear position, China for
example, is currently resuming manufacturing activities that were previously undertaken
by Taiwan and Korea (Mathews, 2006a).
18
II.2.1. Korea’s late industrialisation
The industrialisation of Korea followed similar patterns as described in the previous
section, with the government intervening on the micro-and macro-level in order to
promote the industrial development.
With the control of the banking sector, the government reigned over the
direction of capital flows in various industries. Loans, long-term investment credits, tax
concessions and other fiscal incentives were granted on the basis of the firms’ export
performance and favouritism of certain industries and firms, which led to the onset of
strong industrial conglomerates, the so-called chaebols that were able to enter new
markets and a wide array of industries (Amsden, 1995; Choe & Pattnaik, 2007; Kim,
1997; Mathews, 1998; Wang, 2007). LG, Samsung, Hyundai and alike, for example,
were involved in consumer electronics, semiconductors, shipbuilding, construction and
trading services. And by 1996, the 30 largest conglomerates were responsible for 40 per
cent of the country’s total output (Chang & Hong, 2000). The so-called ‘Korea Inc.’
played (and still plays) a very important role in Korean economy, where entrepreneurs
and businesses operate under a comprehensive system of government guidance.
Frequently, government also intervened in firm affairs and manipulated the industries’
structure of competition (Green, 1992).
In addition to the developmentally oriented fiscal policies and due to the lack of
natural resources, the Korean government also invested heavily in infrastructure,
especially education, thereby creating a physical and administrative framework for
industrial promotion (Kim, 1997). It also encouraged the creation of knowledge and
technological capabilities through the establishment of industrial R&D institutes since
1966 in areas such as electronics, telecommunications, machinery and shipbuilding at a
time when the private sector did not have the scope of resources to invest in R&D
(Wang, 2007; Yang, Kim, & Han, 2006). Until the late 1980s, most Korean firms were
engaged in OEM8 manufacturing, when many Korean export industries skipped the
Original Design Manufacturing stage shifting directly to Original Brand Manufacturing.
Although goods were still standardized, of low quality and cheap, Korean firms
understood the importance of differentiation and quality improvement (Lee, 2005).
Moreover, the chaebols gradually replaced the state as the major engine for the
accumulation of knowledge (Kim, 1997).
8 An Original Equipment Manufacturer is contracted to produce a good to the exact specifications of a buyer that in turn markets the product under its own brand name. OEM allows the manufacturer to focus on the production while neglecting marketing and distribution skills (Hobday, 1998).
19
However, with the opening of Korea for foreign investments in the late 80s, the
chaebols financed their aggressive growth through foreign loans and cross-divisional
debt guarantees among affiliates, in favour of scale and reckless diversification rather
than productivity and efficiency. But along with the liberalization of the Korean
markets, the highly-debt burdened chaebols could not rely on the protective hand of the
government any longer. This ignorant stance took revenge on the conglomerates when
the Asian financial crisis struck in 1997, putting the majority of chaebols into financial
distress and in some cases even on the edge of bankruptcy. Yet, the highly debt-
burdened conglomerates often criticized for their habits of crony capitalism and
questionable corporate governance eventually became too powerful and too large to let
them fail (Choe & Pattnaik, 2007; Economist, 2010a; Wang, 2007). What followed
where a long needed restructuring of chaebol practices imposed by the International
Monetary Fund and the Korean government. In brief, these reforms required chaebols to
divest unprofitable businesses, promote partnerships with small and medium-sized
Korean enterprises and increase their transparency of their murky ownership and
finance structures by producing consolidated balance sheets according to international
accounting practices (Mathews, 1998). Given the refocus on their most profitable
businesses, the increased transparency and the improved corporate governance, the
Korean chaebols nowadays are prospering again (Economist, 2010a).
In spite of this, Wang notes (2007) that at this stage of the globalisation the
Korean development model would hardly be viable anymore, as such heavy state
interventions and subsidies would violate the regulations of free trade.
Last but not least, regardless of state led development, another particular factor
often cited to have significantly contributed to the nation’s rise, is the hard working
Korean workforce. Despite common labour oppressions by the government and the
conditioning of children already during school days, this Korean hard-working morale
is partially derived from neo-Confucian values and traits such as tenacity and
obedience, as well as the historical experience of deprivation during the Japanese
occupation, that furthermore nourished a ‘beat Japan’ mind-set (Kim, 1997).
II.2.2. The emergence of the Korean automobile industry
While Germany is considered the birthplace of the automobile with the Germans being
already involved in the mass-production of cars in the 1930s (Business Monitor
International [BMI], 2010), the automobile production in South Korea did not exist until
1962 when the Automobile Industry Protection Law was implemented. In 1974, the
20
Long-Term Automobile Production Plan promoted the development of the industry
through an import substitution policy. The industry retained its focus on the domestic
market until the late 1970s, but with the espousal of the second oil shock in 1980
coupled with the on-going political restlessness due to the assassination of former
president Park Chung Hee in 1979, domestic demand collapsed putting the Korean car
manufacturers under tremendous financial distress. The government’s response was to
extend the production to the point of economies-of-scale, hence shifting the focus from
import substitution to export promotion. Yet, the government still maintained import
restrictions in order to build up volume and enhance the domestic learning process
while import liberalization did not occur until 1988. Moreover, similar to the Chinese
policy, the governments strictly controlled foreign equity and just allowed foreign
investments where assistance was essential to overcome the technological deficiencies
faced. In 1982 Hyundai, for example, went into an agreement with Mitsubishi for
engines, power trains and transmissions. The same year, Daewoo formed a joint venture
with General Motors. Nonetheless, the automobile industry was still under local control,
as the car manufacturers tend to finance everything themselves with the support of the
government rather than depending on their foreign partners. In general, all government
policies were aimed at making the industry more efficient and competitive. In this
context, government also tried to manipulate the industrial organisation by reducing the
number of competing firms in order to avoid overcapacity. In 1976, for example, the
government forced KIA to take over Asia Motors meanwhile excluding the company
from the passenger vehicle market. In the same way, it stopped the plans for a joint
venture between Samsung and Chrysler. Other instruments used by the state to enhance
the competitiveness of the Korean auto producers included subsidised loans, access to
foreign currency, licenses to import scarce consumer goods, as well as financial
incentives which were tied to the companies’ export performances.
Overall, it is unlikely that Korea’s automobile industry would have been
similarly flourishing without the extensive interventions of the government on the
micro-and macro-level. Korean car manufacturers could further profit from synergistic
relationships of the very diverse chaebol organisation where companies source for
resources among their own ranks and adjust prices, as well as cross-subsidise among the
diverse businesses. At the same time, the Korean car manufacturers were also fortunate
with the external market conditions. In the 1980s Korean car manufacturers profited
from the import restriction for Japanese cars in the US. As offerings in the low-end
segment were sparse, Hyundai was able to gain a foothold in the American market in
21
1986. The rise of internationalisation and the increase in global competition made
foreign firms also more ready to transfer knowledge to other countries. Lastly, the shift
to trading components rather than completely assembled cars, allowed Korean car
manufacturers to get certain missing parts they needed to build cars for the international
market (Green, 1992).
Nevertheless, with the country’s ongoing liberalization in the early 90s and the
rapid expansion of production capacity mainly financed through heavy foreign
borrowing and the accumulation of debt9, the Asian financial crisis in 1997 hit the
Korean carmakers hard and led to a complete restructuring of the national automotive
landscape. While Hyundai took over the financially distressed KIA Motors, Daewoo
Motors acquired Ssangyong to be later absorbed by American General Motors, and
Samsung Motors went out of necessity into a partnership with French Renault, thus
leaving the Hyundai-KIA Automotive Group as the only autonomous Korean carmaker
after all (Ravenhill, 2001; Ward, 2002).
II.2.3. Implications for latecomer strategies
Late industrialisation of countries in most cases also implies the late entry into
industries. Although many researchers have studied the advantages and disadvantages
of late entrant or late follower strategies of firms (e.g. Gal-Or, 1985; Lieberman &
Montgomery, 1998; Bryman, 1997), the same perspective cannot be obtained for firms
from late industrialising countries. As Mathews (2002) notes, the latecomer firm is not a
‘late entrant’ by choice as a matter of strategy rather “it is condemned to be a follower
by history” (Mathews, 2002, p. 471). Other peculiarities of latecomer firms are their
lack of resources and the primary ‘strategic intent’ (see Hamel & Prahalad, 2005) to
quickly catch up with the established competitors in the industry. While forerunner
firms maintain certain competitive advantages in terms of brands, reputation,
technological skills etc., the only competitive advantage of latecomers usually lies in
lower costs due to a cheap labour supply (Hobday, 1998; Mathews, 2002). However, as
labour costs rise with the economic development of countries through enhanced
productivity and the advancement of industries, firms have to overcome their severe
resource constraints in order to stay competitive (Green, 1992; Mathews, 2002).
Given the lack of resources and involvement in R&D, learning from linkages
with advanced firms and leveraging resources from such linkages constitutes one of the
9 The average debt ration for Korean car manufacturers by 1996 amounted to tremendous 530 per cent with the most extreme example being Ssyangyong with a debt ratio of 10,496 per cent (Ravenhill, 2001)
22
main strategies for latecomer firms to surmount their resource weaknesses. By
integrating themselves into existing value chains of advanced firms and MNCs10 in the
form of joint ventures, licenses, contract manufacturing services or other kinds of
business agreements, latecomer firms can leverage the resources of their advanced
collaborating partners and may gain new knowledge, technological and organisational
skills, as well as market access (Hobday, 1998; Mathews, 2002). Indeed, latecomer
firms may even be capable of accelerating their uptake by tapping into already advanced
technologies, thus skipping some stages of the traditional technological trajectory (Lee,
2005; Mathews, 2006a). However, this also depends on the firms ‘absorptive capacity’
(i.e. how well a firm can absorb and integrate the leveraged resources or skills such as
product and process technologies, tacit and explicit knowledge) (see Cohen &
Levinthal, 1990) and their combinative capabilities (see Kogut & Zander, 1992)
meaning not just to absorb the resources, but also to further exploit their unexplored
potential (Mathews, 2002).
What kind of resources latecomer firms leverage, depends on their competitive
strategy but even more on their accessibility and feasibility. According to Matthews
(2002), the types of resources latecomer firms leverage can be characterised as the least
rare because firms will try to protect their rare and valuable resources from competing
firms, the most imitable (e.g. through reverse engineering) and most transferable. In any
case, latecomer firms have to create linkage strategies that complement or match the
incumbents’ needs in order to leverage and learn through spillovers or externalities. On
the other hand, globalisation shapes a favourable environment for latecomer firms’
quest of catching-up since it multiplies inter-firm linkages and networks (Mathews,
2002). Conversely, supporters of the late industrialisation paradigm argue that access to
new technologies and resources becomes increasingly difficult along the
industrialisation progress of industries (Amsden, 1995).
In conclusion, “latecomer firms go through several iterations of this linkage and
leverage process, each time enhancing their capabilities and technological
competencies, in a process best described as learning” (Mathews, 2002, p. 468). Often
this process leads firms to pass through the stages from simple OEM manufacturing, to
Original Design Manufacturing11 and lastly to fully developed Original Brand
Manufacturers, with the complexity of activities continuously increasing along the
development curve (see figure 5). In this sense, latecoming firms move backwards 10 Multinational Corporation 11An Original Design Manufacturer produces partly self-developed and designed goods for a client that will sell the product under its own brand name (Hobday, 1998).
23
along the normal stages of the product life cycle as they start with the mere assembly of
mature products passing through incremental production changes and lastly engage in
their own R&D activities. At the same time, the growth and development of latecomer
firms is usually based on exports closely linked to import substitution policies
established by governments (Hobday, 1995; 1998; Mathews, 2006a).
Figure 5: Latecomer firms – export-led learning from behind the technology
frontier
-‐ This image has been removed by the author of this thesis for copyright reasons -‐ (Source: Hobday, 1995, p. 1184) By offering OEM or ODM services to foreign buyers, latecomers can overcome
the entry barriers in advanced markets and insert themselves into the global value chain
of foreign firms, meanwhile assimilating technologies and enabling economies of scale.
However, this strategy impedes the creation of a strong brand needed to compete in the
24
global market place (Hobday, 1998). Once late coming firms have established
themselves as OBM manufacturers they need to acquire supporting competences such
as marketing and sales skills vis-à-vis customers (Fleury & Leme Fleury, 2009).
Despite organisational efforts to leverage resources, capabilities and knowledge
from linkages with foreign firms, late coming firms also highly depend on the
institutional support provided by governments, development agencies and networks as
they seek to compensate their shortcomings in technology and market sophistication
(Lu, et al., 2008; Mathews, 2006a; Wang, 2007). Nonetheless, Wang (2006) points out
that the institutional reliance can take on different forms. While Korean state
interventions, for example, worked in favour of a centralised industrial structure with a
few large and highly indebted chaebols centring their catch-up strategies on scale, a
decentralised industrial structure dominated by SMEs12 forced Taiwanese firms, for
example, to rely more on trustworthy personal networks and public R&D institutes to
induce technological learning and upgrading.
The example of Korean chaebols or Japanese keiretsus furthermore highlights
the proclivity of late coming firms to diversify into various businesses, as it enables
firms to exploit scale, as well as network and scope economies meanwhile facilitating
the monitoring process for governments (Abegaz, 2005). Khanna and Palepu (1997) and
Lee and Lee (2007) furthermore state that diversification allows firms to overcome
market imperfections through the creation of internal capital and labour pools and to
exploit synergies through the creation of credible group brands later on.
Another important component in the catch-up process for latecoming firms
constitutes accelerated internationalisation. With domestic markets often too small to
offer real growth or scale opportunities and the primal urge to leverage the global value
chains of foreign firms, latecomers are forced to internationalise much faster than their
predecessors (Cho, Kim, & Rhee, 1998; Mathews, 2006b). According to Child and
Rodrigues (2005), outward FDI13 can be a chance to narrow the gap between leading
and latecoming firms through the acquisition of appropriate assets and resources. They
furthermore add, that in some cases governmental growth policies with the promotion
and financial support of so-called ‘national champions’ may drive internationalisation
of latecoming firms. Put differently, latecomers internationalisation is not based on
technological innovation, but on organisational and strategic innovation that is adapted
to their specific circumstances (Mathews, 2006b).
12 Small and Medium Enterprises 13 Foreign Direct Investment
25
Overall, overcoming the latecomer’s disadvantages and converting them into
competitive advantages constitutes one of the main strategic goals of latecomer firms,
while the ultimate strategic intent is to become a leading player in the industry shifting
from being an imitator to an innovator (Hamel & Prahalad, 2005; Kim, 1997; Mathews,
2002).
However, Forbes and Wield (2000) point out that the technological frontier is
moving at different paces in industries. Thus, in order to become an innovator,
latecoming firms have to move even faster than its competitors. Whether a latecoming
firm is successful or not, not least depends on its organisational leadership. Empirical
evidence shows that successful catch-up usually involves other factors such as long-
term vision, bold decision making, extreme risk-taking, speed, tenacity and trial and
error learning as firms seek to systematically exploit foreign channels to upgrade their
technology (Hobday, 1998).
III. ANALYTICAL TOOLS FOR THE ASSESSMENT OF COMPETITIVENESS
The review of the literature revealed that the analysis of competitiveness of an
organisational entity requires the consideration of external factors, which are beyond
firms direct influence, as well as the firm’s internal strengths and weaknesses. Two
common tools mainly used to perform such analyses are the STEEP (or PEST)14
analysis for macro-environmental factors in combination with the value chain analysis,
which are presented in further detail in the following (Bensoussan & Fleisher, 2009;
Grant, 2008).
III.1. Macro-environmental analysis
Since organisations do not operate in a vacuum, various environmental conditions have
a great impact on firms’ resources, capabilities and actions. Similar to the traditional
SWOT analysis, the STEEP analysis provides a helpful tool for identifying, filtering
and systematically assessing the most relevant environmental changes and trends that
will likely have the greatest impact on the competitive position of an organisational
entity. The most important questions to raise thereby are, which trends suggest a change
or redefinition of the evolutionary path of the organisation and what kind of impact will
14 The PEST analysis is equivalent to the STEEP analysis, but limits the analysis to political, economical, social and technological factors. With the inclusion of environmental factors, the STEEP analysis is more comprehensive and suitable for the purposes of this dissertation given the current trends towards sustainability and the legislatory pressures in this area.
26
these trends have on the organisation; either positive, negative or neutral. Analysts are
thus forced to look beyond just symptoms in order to understand the underlying causes,
future developments and implications for the organisation.
The key goal of the analysis constitutes the identification of competitive
implications for organisations in order to match the firms’ resources and capabilities
positively with the environmental conditions.
According to the STEEP analysis, the main criteria for the environmental
analysis can be categorised into:
- Social environment (e.g. value systems, income distribution, labour unions etc.)
- Technological environment (e.g. pace of technological change, patent, clusters,
universities, pace of product and process development etc.)
- Economic environment (e.g. exchange and interest rates, leveraging and funding
etc.)
- Ecological environment (e.g. environmental regulations etc.)
- Political/legal environment (e.g. laws, governmental regulations, intellectual
property rights protection, public opinion etc.)
These factors are not mutually exclusive and the lines between those categories
can blend into each other. The ecological environment, for example, can be influenced
through the political environment in the form of environmental regulations set by
governments. Similarly, environmental regulations can have deep impacts on the
technological environment with car manufacturers, for example, having to meet new
emission standards through the development of new environmental-friendly power
trains. Given these interrelations among categories, cross-functional teams of analysts
may perform an analysis of environmental conditions more effectively.
One of the major strengths of the macro-environmental STEEP analysis
constitutes the long-term perspective that links expected future developments and trends
to the current planning operations, which allows timely responses in order to reap future
gains. On the other hand, the same strategic orientation towards the future can be one of
its greatest weaknesses, since certain ambiguities and uncertainties cannot be ruled out
during the analysis (Bensoussan & Fleisher, 2009)
Combined with the industry structure analysis along Porter’s five forces, this
technique is nevertheless a helpful tool to detect the most critical success factors for a
firm in order to stay competitive in the future.
27
III.2. Value chain analysis
In order to analyse the competitive position of an organisation, the Value Chain
Analysis (VCA) popularized by Michael Porter in 1985, provides a useful analytical
tool. According to Porter, every organisation consists of a bundle of value adding
activities performed to design, produce, market, distribute and support its product. The
way a firm performs and coordinates these interdependent value-adding activities
determines its cost position relative to its competitors, as well as the customer value
created. Even though firms from the same industries may share similar value chains, it
is the differences in firms’ value chains that build the sources for competitive
advantage. In addition, firms’ value chain form a part of a larger industry value system
that comprises the value chains of all industry participants from suppliers to final
consumers. Through the optimization of firms’ vertical linkages with other independent
industry participants, firms can create synergies that may also lead to competitive
advantage. For example, firms can decrease their technology development costs through
conjoint developments with suppliers. Similarly, firms can reduce the number of
erroneous products due to faulty inputs, when suppliers implement a zero defect policy
implying a quality inspection of the total output.
By disaggregating and linking the overall processes and activities of a firm into
strategically relevant value adding activities, the VCA allows a systematic and holistic
cost/value analysis of organisations that is superior to the traditional strengths and
weaknesses analysis included in a SWOT analysis, as the VCA embeds the industry and
external customers into the analysis.
Porter identified nine generic categories of activities, which are classified into
primary and supporting activities (see figure 6). While primary activities describe the
physical creation up to the transfer of the product to the purchaser, supporting activities
are needed along the entire value chain for the fulfilment of the primary activities.
28
Figure 6: Porter’s generic value chain
-‐ This image has been removed by the author of this thesis for copyright reasons -‐
(Source: Porter, 1985, p. 37)
The primary activities included in the generic value chain are:
- Inbound logistics (i.e. receiving of inputs, inventory control etc.)
- Operations (i.e. transformation of inputs into end product)
- Outbound logistics (i.e. warehousing, distribution, order fulfilment etc.)
- Marketing & Sales (i.e. pricing, placement, promotion etc.)
- Services (i.e. customer support, maintenance and repair etc.)
The supporting activities of the value chain consist of:
-‐ Technology development (i.e. research and development, process automation
etc.)
-‐ Human resource management (i.e. recruitment, training, employee compensation
etc.)
-‐ Procurement (i.e. purchasing of raw materials and other inputs)
-‐ Organisational infrastructure (i.e. administration, finances etc.)
Each of those categories can be divided into numerous distinct activities specific
to particular industries or firms’ strategies (Porter, 1985).
Even though the generic value chain can be applied to almost every organisation,
new types of value chains such as virtual value chains and virtual web management
evolved with the availability of modern information technologies (Bensoussan &
Fleisher, 2009).
The ultimate goal of the VCA consists in the identification of strategies that
maximise the customer value while minimising the costs in delivering the value. The
difference between the created value and the originated costs is also known as the
29
margin. By reviewing and reconfiguring their value chains, companies can reduce the
overall costs or the costs of single activities along the chain. Amazon, for example,
succeeded in slashing down distribution costs by implementing a virtual retailing
platform rather than using conventional distribution channels. Another possibility lies in
the exploration of differentiation potentials that will increase the profit margin of a firm.
Besides companies’ efforts to increase their profit margins, the industry structure
determines the share of industry profit of each participant, meaning if the bargaining
power of suppliers is high, the suppliers’ share is likely to be higher. At the same time, a
high bargaining power of buyers will most likely lead to lower profit margins of firms
(Porter, 1985).
However, as Stabell and Fjeldstad (1998) note, one of the main challenges of the
value chain analysis represents the difficulty to obtain accurate and reliable cost and
value data for the analysis due to a mismatch of traditional accounting practices and the
needs of the value chain analysis. Moreover, for an effective analysis for diagnosis of
competitive advantage not only historical data is needed, but also the projection of
trends and comparable data from competitors.
III.3. Application to the global automobile industry
III.3.1. Macro-environmental analysis
Given the necessity to assess the value of firms’ internal competitive factors in a market
context, this chapter introduces the global automobile industry along with its greatest
future challenges and prospects revealing the most important categories for the
competitiveness analysis, and thus raising the construct validity of measures (see
Chapter IV). Starting with the industry structure analysis, the dissertation proceeds with
the STEEP analysis. At this point however, it should be noted that the author refrained
from a strictly categorized STEEP analysis due to the intertwining character of
categories. Nevertheless, all categories are taken into consideration during the analysis.
Beyond that, the analysis on a global level is due to the globally integrated and complex
value chains of automobile producers with production, supplier and customer bases
spanned around the world (Haugh, Mourougane, & Chatal, 2010).
III.3.1.1. Industry structure
The current structure of the automobile industry is the product of a long process of
structural change. It is known for being capital intensive and having a high capital-to-
labour ratio. Moreover, most of the countries involved in the automobile production are
30
highly export dependent. Even though domestic production remains important in many
countries, production increasingly shifts towards non-OECD countries in particular
Asia, due to a high market saturation in the OECD region, high shipping costs and the
growing market opportunities in emerging countries such as: Brazil, Russia, India and
China (the so-called BRICs), Eastern Europe and South East Asia. More and more, car
manufacturers also outsource parts of their manufacturing processes. Another trend
observable in the industry constitutes consolidation through mergers and acquisitions in
order to amplify the product portfolio, nurture economies of scale, and reduce excess
capacity. All these developments fuelled a complex geography on a global scale, which
is often constrained by political and operational matters. Despite the complexity of
business operations, the industry is still highly concentrated in clusters within countries
(Grant, 2008; Haugh, et al., 2010).
Given the prevalence of a high brand loyalty in the industry, the buyer power of
dealers and distributors can be described as moderate. Moreover, franchised dealerships
and the automakers forward integration of sales channels further reduces the bargaining
power of buyers.
On the other hand, automobile producers are highly reliant on supplier inputs
such as raw materials, components, energy, freight and transportation; leaving suppliers
with a strong bargaining position. However, carmakers rarely use single suppliers thus
reducing the bargaining power of their suppliers.
Due to the high capital intensity and the degree of intellectual property required
to enter the industry, the threat of new entries is relatively weak. The enforcement of
tighter safety and environmental regulations, coupled with the recent decline of the
industry value, further decrease the appeal of the industry for new entrants.
Nevertheless, more and more car manufacturers from late industrialising countries are
finding their way into the industry.
The main substitution threats for the industry represent used cars and the
growing environmental awareness of consumers, which may entice people to use other
vehicles of transport such as public busses or bikes.
Several multinational companies dominate the global industry with Toyota, Ford
and Volkswagen being the leading players. In 2009 Toyota held 10.9 per cent of the
global market share in terms of volume, while Volkswagen and Ford held 7.2 and 9.2
per cent, respectively (Datamonitor, 2010a). In addition, the upstreaming competition
from emerging markets is expected to further intensify the rivalry in the industry
(European Communities Commission, 2009b). Therefore, rivalry in the industry is
31
fierce with some producers trying to negate their sole reliance on car sales by
diversifying into other sectors. Honda, for example, also produces water craft and jet
engines amongst others (Datamonitor, 2010a).
III.3.1.2. STEEP analysis
With the recent economic downturn initiated by the U.S. subprime crisis in 2007 and
the following collapse of financial markets, the automobile industry worldwide
experienced one of its most severe crises in its entire history. As a result, demand
dropped sharply stressing the existing overcapacity problems and leading many
companies into financial distress or even insolvency (VDA, 2010a; Haugh, et al., 2010).
In some cases like Detroit’s General Motors and Chrysler LLC, companies were only
able to secure their existence through governmental bailouts (Terlep & Bennett, 2010).
In addition governments in many Western countries introduced temporary car-scrapping
schemes and incentives in an attempt to boost sales and cushion the economic
downturn. While these interventions proved successful in the short-term, they brought
future purchases forward to the present likely causing a ‘payback effect’ with the climb
in sales being reversed as soon as the incentive schemes end.
In combination with economic uncertainty, tightened environmental regulations
for carbon dioxide emissions and fuel-efficiency standards, the scrappage allowances
also led to a dramatic shift in consumer demand favouring smaller, inexpensive and
fuel-efficient cars (VDA, 2010a; Haugh, et al., 2010). Given the appetite of developing
and emerging countries for low cost cars, as well as the increasing environmental
awareness of customers, the lack of cheap lease financing, higher fuel and auto taxes
and demographic shifts with elder people preferring cheaper small vehicles in
developed countries; the demand for small and fuel efficient cars is likely to last
(Economist, 2007a, 2009b, 2009e; VDA, 2010a). One major problem of small cars
however constitute their lower profit margins which automakers tend to compensate
through superior profit margins of larger premium vehicles (Dolan, 2009; Economist,
2009e).
Despite the demand shift towards small and low cost cars, the individualisation
of customer preferences is also expected to rise due to differences in local tastes and
technological requirements in various regions calling for adaptation and differentiation
of products and leading to shorter product life cycles. In Western Europe, for example,
over 53 per cent of registered new cars 2008 were equipped with diesel power trains
while US customers still prefer gasoline engines (VDA, Flint, 2008; 2010a). Serving the
32
mobility needs of the majority of customers in the emerging markets like India and
China will furthermore require cheaper and less sophisticated cars than in Western
markets (Edmondson, Rowley, Lakshman, Welch, & Roberts, 2007).
Other than that, a new value-for-money mantra is evolving among customers.
Accordingly, customers expect cars not only to be cheap but also of high quality (VDA,
2010a). In this context, the upcoming competition from low cost countries like China,
India and South Korea may constitute a major threat for the established players
(Bremner, Kerwin, Roberts, & Edmondson, 2005; European Communities Commission,
2009b).
Macroeconomic threats for carmakers constitute a high exchange rate volatility,
as well as protectionist measures of countries, since most of the car manufacturers are
still highly dependent on exports (Chaffin, 2009; PricewaterhouseCoopers, 2010a). First
protectionist actions were already taken in Argentina, Brazil and Russia with the former
requiring new import licenses from European car manufacturers and the latter raising
their import duties for European vehicles. Thus one of the main aims of the European
Union consists in the promotion of free trade and fair competition (European
Communities Commission, 2009a, 2009b)
Moreover, raw material prices, in particular steel and aluminium, are expected to
rise over the next couple of years, which will elevate the components and production
costs of automobile manufacturers and their suppliers (VDA, 2010a).
The obligation to meet the tightened environmental regulations in the US,
Europe and China will put further pressure on automobile producers. In 2008, China for
example, introduced a ‘green tax’, which imposes additional sales taxes on vehicles
with engines larger than three litres. In the European Union a new norm (Euro-6) was
passed in 2008 restricting the CO2 emissions of new cars to 130 grams per kilometre by
2015 compared to a current average of 160 grams per km with the plan to further reduce
the emission allowance to 105 grams per km by 2020. These regulations imply an
improved mileage of future cars to 58 miles per gallon with diesel engines and 52 miles
per gallon with gasoline-powered engines by 2015. Likewise, US president Barack
Obama signalled his disposition for more stringent regulations in the US with his
solicitation to the Environmental Protection Agency to rethink its refusal of California’s
emission standards, which are more stringent than the federal restrictions (KPMG,
2009a). In May 2009, the administration of Barack Obama also enforced a new deadline
for meeting the new requirements of the Corporate Average Fuel Economy (CAFÉ)
from 2020 to 2016. This legislation foresees an increase of mileage for passenger cars to
33
39 miles per gallon by 2016 (Foster & Klier, 2009). All these measures inevitably
impose additional costs on car producers and lower their profitability. According to
estimates of IHS Global Insight, president Obama’s green initiatives could add up to
10,000 US dollars to the price of a car (KPMG, 2009a). Moreover, failure to meet those
standards implies expensive penalties imposed by governments (European Automobile
Manufacturers Association [ACEA], 2009).
On the contrary, these legislations can prove to be a sales opportunity for
carmakers as they promote the renewal of older vehicles with new fuel–efficient and
environmental friendly cars thereby reducing the substitutional threat of used cars to
new car sales (Datamonitor, 2010a; KPMG, 2009a). Most importantly, they promote
innovation, which is considered to be key to competitiveness (e.g. Triebswetter &
Wackerbauer, 2008)15. Automobile manufacturers around the globe already work with
full speed on the eco-friendliness and fuel-efficiency of cars running on fossil fuels, as
well as hybrids, electric cars, fuel cell technologies and other renewable alternative
combustibles (Schweinsberg & Winter, 2008; Winter, 2009).
Nevertheless, the development of new technologies and products requires
immense investments in R&D and production plants, which might be hindered by the
current credit crunch induced by the recession. The lack of capital also deeply impacts
the carmakers investments in prospering emerging markets and thus their growth
opportunities in these regions (VDA, 2010a). The imperatives to develop new
technologies and reduce debt and bankruptcy risks are also seen as the main drivers for
an increase in mergers and acquisitions in the industry (PricewaterhouseCoopers,
2010b).
Likewise, consumers are not spared of high capital costs. With the decreased
availability of consumer credit, consumers may likely be more reluctant to purchase
new vehicles (Economist, 2009e; VDA, 2010a).
Without any doubt the recession and current developments in the industry
confronted automobile producers and their suppliers with new challenges that imply
even fiercer competition and a restructuring of the sector (VDA, 2010a; Haugh, et al.,
2010).
However, recent forecasts indicate an end of the downtrend by 2010 and a rather
positive outlook for the future with emerging economies being the greatest catalyst for
15 The empirical study for German automotive companies in the cluster around Munich conducted by Triebswetter & Wackerbauer (2008) supports Porters assumptions of environmental legislation leading to innovation. The results yielded thereby showed that innovation driven by regulatory pressures produces similar competitiveness impacts as “voluntary” innovations.
34
growth since car ownership is still relatively low in these countries (Datamonitor,
2010a). In comparison to 2009 the Chinese market volume, for example, is expected to
rise by 92.6 per cent from seven million to a total volume of 13.5 million units by 2014
equalling a total value of USD 177.6 billion (Datamonitor, 2009a). The Indian market
promises to be not less attractive during the same period with an expected growth to two
million vehicles and a total value of USD 41.6 billion meaning an increase of 60.4 per
cent in volume and 24.8 per cent in value (Datamonitor, 2009b). In contrast, experts
expect markets in Western Europe, Japan and the US to rather stagnate or slightly
decline. According to Datamonitor, the industry will grow at a compounded annual
growth rate of 11.5 per cent from 2009 to 2014 reaching a total value of approximately
USD 2.5 trillion in comparison to a value of USD 1.5 trillion in 2009 representing an
increase of 72 per cent. The market volume is expected to increase from 65 million
vehicles to 96.5 million for the same period reflecting an increase of almost 50 per cent
at a compounded annual growth rate of 8.2 per cent (Datamonitor, 2010a).
III.3.2 Derivation of critical factors for future competitiveness
Given the interrelation between external environmental and internal organisational
factors (see Chapter II.1.2.4), critical success factors for the internal analysis of
companies are derived from the preceding analysis of the external global environment.
The critical success factor approach was coined by Daniel (1961) and later Rockart
(1979) with the main aim to curtail the information overload for managers by reducing
information to the most important criteria for a successful strategy development.
“Critical Success factors thus are, for any business, the limited number of areas in
which results, if they are satisfactory, will ensure successful competitive performance
for the organization” (Rockart, 1979, p. 85). Nonetheless, it would be wrong to deny
the importance of other factors, but given the limited scope of this dissertation, the
analysis is confined to the most pivotal success factors in the automobile industry. Thus,
the most crucial factors and capabilities identified are:
a) Technological innovation and commercialisation; meeting new environmental
standards and reducing the amount of resources needed
b) New product development meeting changing consumer preferences while
improving affordability and quality
c) Cost competitiveness and cost efficiencies along the whole value chain due to
higher costs imposed on carmakers
d) Capture and maintain customer proximity and loyalty
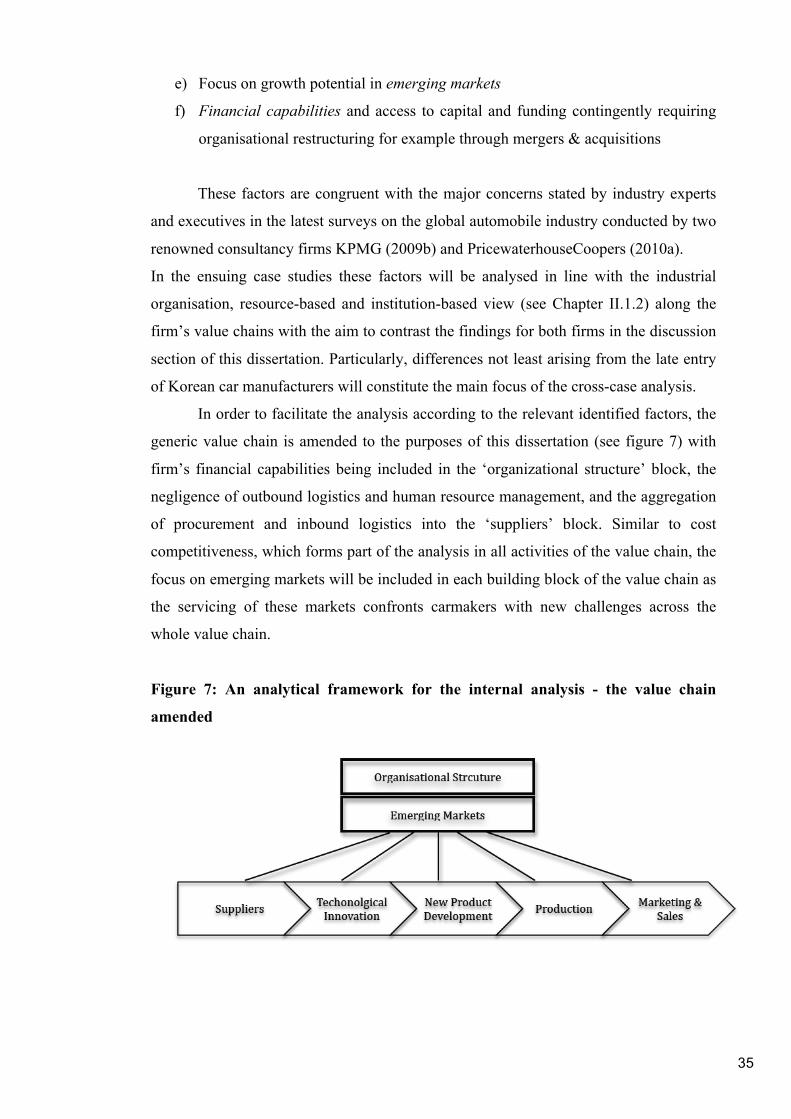
35
e) Focus on growth potential in emerging markets
f) Financial capabilities and access to capital and funding contingently requiring
organisational restructuring for example through mergers & acquisitions
These factors are congruent with the major concerns stated by industry experts
and executives in the latest surveys on the global automobile industry conducted by two
renowned consultancy firms KPMG (2009b) and PricewaterhouseCoopers (2010a).
In the ensuing case studies these factors will be analysed in line with the industrial
organisation, resource-based and institution-based view (see Chapter II.1.2) along the
firm’s value chains with the aim to contrast the findings for both firms in the discussion
section of this dissertation. Particularly, differences not least arising from the late entry
of Korean car manufacturers will constitute the main focus of the cross-case analysis.
In order to facilitate the analysis according to the relevant identified factors, the
generic value chain is amended to the purposes of this dissertation (see figure 7) with
firm’s financial capabilities being included in the ‘organizational structure’ block, the
negligence of outbound logistics and human resource management, and the aggregation
of procurement and inbound logistics into the ‘suppliers’ block. Similar to cost
competitiveness, which forms part of the analysis in all activities of the value chain, the
focus on emerging markets will be included in each building block of the value chain as
the servicing of these markets confronts carmakers with new challenges across the
whole value chain.
Figure 7: An analytical framework for the internal analysis - the value chain
amended
36
IV. METHODOLOGY
In this dissertation, in-depth case studies are used to depict the competitiveness of the
car manufacturers from the said countries.
Case study research is generally considered as an inductive method16 for theory
building where the evidence collected according to theoretical propositions leads to a
generalisation of results (Bryman & Bell, 2007). Case study research can be based
either on a single or multiple cases (also often referred to as comparative case studies)
and can include various levels of analysis (Yin, 2003).
According to Yin (2003), the case study is the preferred method to study
contemporary phenomena in a real-life context where the investigator has no control
about relevant behaviours and where the boundaries between phenomena and context
are not obvious. Case studies thereby test assumptions by directly relating them to
phenomena as they unfold in practice (Flyvbjerg, 2006). Similarly, Eisenhardt (1989)
notes that the main aim of the case study lies in the “understanding of the dynamics
present within a single setting” (Eisenhardt, 1989, p. 534).
Case studies allow the investigation of broad and complex research topics with a
large amount of variables of interest, which often require an analysis of multiple sources
of evidence. The coalescence of the data in a triangulating17 fashion is assumed to
increase the validity of results.
Against the common belief of case study research being a qualitative research
approach, data can be either quantitative, qualitative or even a mix of the two (Yin,
2003). Jick (1979), for example, emphasises that the combination of quantitative and
qualitative data can be more effective as the strengths of one method can counter-
balance weaknesses of the other. In this context, quantitative data can support the
generalisability of qualitative findings and detain researchers from following biased and
misguided perceptions. Qualitative data, on the other hand, can provide deeper insights
and clarity about relationships among data and lead to theoretical propositions that can
be tested by quantitative methods. However, despite some quantitative performance
measures, mostly qualitative data from documents and archival records such as annual
reports, press releases, consultancy reports and so forth, will be considered in this
dissertation. A qualitative approach seems more feasible for this study due to the
16 Although case studies tend to be thought of as an inductive research approach, it can be also used in a deductive manner for theory testing (Bryman & Bell, 2007). 17 Triangulation describes “the combination of methodologies in the study of the same phenomenon” (Denzin, 1978, p. 291).
37
importance of intangible resources and capabilities, the market context-dependence of
firms’ internal competitiveness factors, and the particular interest in reasons behind
existent differences in the competitiveness of the two cases. Additionally, documentary
sources are advantageous in their stability (can be reviewed), exactitude with references,
public availability, and their broad coverage over an extended time period. Nonetheless,
certain information processing bias in the selectivity and reporting of data or results
cannot be ruled out completely (see Yin, 2003, p. 86ff.).
In the literature several typologies for case studies have been developed. While
Yin (2003) distinguishes between exploratory (no hypothesis beforehand), explanatory
(causal studies) and descriptive cases (describing; theory description beforehand
necessary); Stake (1995) differentiates between three types of case studies:
-‐ Intrinsic case study aims at studying a unique phenomenon without the attempt to
generalise the findings
-‐ Instrumental case study aims at providing insight into or revising a general
phenomena by using a typical case
-‐ Collective case study where several cases are used to study a general phenomena
In the case study analyses of this dissertation, two instrumental cases are used in
order to describe the differences in competitiveness among late coming automobile
producers from South Korea and their early entrant counterparts from Germany in an
exploratory approach.
The common rationale of conducting multiple-case studies lies in the replication
logic18 that strengthens the generalisabilty of results and hence the generation of
theories (Eisenhardt, 1989; Yin, 2003). If the rationale for a multiple-case design lies in
contrasting different conditions for cases (as it is the case in this dissertation with
latecomer versus early entrant), Yin (2003) notes that still at least two cases for each
side would be desirable in order to allow for replication logic. However, due to time
constraints and the limited amplitude of this dissertation this study will be confined to
the investigation and cross-case comparison of the two largest and most important
national automobile producers of both countries – namely the Hyundai-KIA
Automotive Group and the Volkswagen Group. The common procedure for such
multiple-case designs consists in the individual in-depth analysis of each single case
followed by an analysis across the cases (Yin, 2003).
18 Replication refers to either the literal replication of results in multiple cases or the theoretical replication, where contrasting results are found, but for predictable reasons (Yin, 2003, p. 47).
38
The before mentioned generalisability of results constitutes one of the main
controversies in case study research. However, Flyvbjerg (2006) argues that the
generalisation potential of cases can be increased through the strategic selection of cases
based on the expectations about their information content. Yin (2003) furthermore adds
that the main aim of the case study lies in the analytical generalisation (i.e. to expand
and generalise theories), rather than the statistical generalisation (i.e. enumerating
frequencies). In addition, researchers highlight the importance of developing concepts
for the case aspects studied in order to produce generalisable results (Punch, 2005).
Other common criticisms towards case studies include the lack of rigor of case
study research, with scholars often complaining about the lack of systematic procedures,
equivocal evidence, results that are influenced by biased views of researchers and
inexhaustible, unreadable documents. To prevent these shortcomings, Yin (2003)
emphasises the importance of a carefully developed, systematic case study design,
which allows an understanding of every single step of the analysis following the
theoretical propositions of the study. He furthermore addresses the common concerns
about the construct validity (i.e. correct operational measures for the concepts studied),
external validity (i.e. deals with the generalisation potential of case studies) and
reliability (i.e. possibility to replicate operations and results) of case study designs and
recommends several tactics to enhance the quality of the study. Construct validity, for
example can be increased through the consideration of multiple sources of evidence and
the establishment of chains of evidence. Documenting the operational steps and
eliminating possible bias on the other hand raises reliability. Despite the criticisms,
Flyvbjerg (2006) advocates the case study research as the appropriate research approach
when depth instead of breadth is the focal point of the study.
V. CASE STUDY ANALYSES
V.1. Case one: Hyundai-KIA Automotive Group
V.1.1. Company overview
Founded in 1967 the Hyundai Motor Company started off as an OEM
manufacturer for Ford. In 1976 the company launched the first Korean car in the
domestic market with the ‘Pony’. Although most of the components where sourced
from abroad, the car was a domestic success and led the foundation for the company’s
dominant position in the domestic market until present. In 1987, Hyundai exported its
first model, the ‘Excel’, to the US market and by 1991 the company passed into
39
technological independence with the development of its first proprietary gasoline engine
and transmission. After the Asian financial crisis in 1997, Hyundai acquired a major
stake in KIA Motors forming the Hyundai-KIA Automotive Group (hereafter HKAG)
in 1998 (Hyundai Motor Company, 2009a). Nevertheless, besides sharing R&D and
production facilities, the HKAG insists on clearly separating these two brands, with
KIA targeting younger and active consumers with a strong focus on design (Hyundai
Motor Company, 2009g; KIA Motors, 2010a).
Nowadays, HKAG consists of a financial division that offers customer credits
and leasing possibilities and a non-financial automotive division including several
subsidiaries with suppliers like Hyundai Steel, Hyundai Rotem and Hyundai Mobis
amongst others (Hyundai Motor Company, 2009a). With its headquarters in Seoul, the
HKAG altogether employs over 120,000 employees worldwide and has operations in
more than 15 countries including the US, Japan, Australia, China, Russia, India, Turkey,
Hungary, Poland, the Czech Republic, UK, Norway, Germany and Slovakia. Its market
presence spans over 196 countries with more than 6,000 dealers (Hyundai Motor
Company, n.d.). In 2009, the company expanded their global market share to 7,8 per
cent with Hyundai holding 5.2 per cent up from 4.3 per cent in 2008 (Hyundai Motor
Company, 2010n) and KIA 2,6 per cent in comparison to 2,1 per cent in the previous
year, respectively. At the same time, the HKAG strongly dominates the domestic
market with a combined market share of more than 75 per cent19 in 2009 (KIA Motors,
2010a).
In 2009, the HKAG sold more than 4.75 million vehicles worldwide and
overtook Ford as the fourth largest automobile producer in the world in terms of
passenger car output. The company’s main export markets hereby constitute the US,
Western Europe, China and India (Hyundai Motor Company, 2010n; Song & Simon,
2009).
HKAG’s product range encompasses all segments from small compact to
large/mid-sized sedans, SUVs20 and more recently the premium and luxury segment
with the introduction of the Hyundai Genesis and the Equus. Nevertheless, the main
focus of both brands remains on the small to mid-sized range (Hyundai Motor
Company, 2009a; KIA Motors, 2010a).
In 2008, the HKAG generated net revenues of 79,736 billion Korean Won
(approximately 66 million USD) (Hyundai Motor Company, 2009a). 19 Hyundai’s market share amounted to 47.7 per cent, while KIA’s market share added up to 28.2 per cent in 2009. 20 Sports Utility Vehicle
40
V.1.2. Excursion: Hyundai’s catch-up
Being a latecomer, it took Hyundai around 30 years to catch-up with its competitors
from the US, Europe and Japan. The company’s catch –up process can be thereby
divided into four phases: the mastery of production capabilities, local content
production, export orientation and technological independence, which will be described
in further detail in the following.
Starting its operations from scratch with no supporting industries around in
1967, the company recruited outside engineers and built task forces in order to increase
its knowledge in automobile manufacturing. By 1968 it went into an OEM
manufacturing agreement with Ford, which induced the first transfer of explicit
knowledge to the company. At this stage, the company’s main focus constituted the
mastery of production capabilities in an attempt to meet Ford’s technical requirements.
Catalysed by the government’s long-term plan for Promotion of the Automobile
industry and after the dissolution of the agreement with Ford, the company was forced
to source knowledge from abroad in order to built the first Korean car. In this context,
Hyundai approached 26 foreign firms to obtain further foreign knowledge. The
company though preferred to import ‘unpackaged’ knowledge from multiple sources
like observation tours at leading automobile manufactures, so they could integrate the
newly acquired knowledge themselves into their production systems to retain
managerial autonomy. The company also established licensing agreements with
Italdesign and Mitsubishi, which provided them with crucial auto parts such as engines
and transmissions. With a local content of 90 per cent and technical assistance from
British engineers, the ‘Pony’ was the first indigenous car to be introduced in 1974. The
company furthermore hired moonlighting Japanese engineers who helped to detect
problems in the post-developmental phase.
The occurrence of the second oil crisis in the early 1980s followed by the plunge
in domestic sales and new governmental requirements forced the company to shift its
focus to exports and thus the development of a car that meets the more stringent safety
and environmental regulations of export markets. Again Mitsubishi provided Hyundai
with pivotal components in return for a ten per cent equity share in the Hyundai Motor
Company. Hyundai also extended its licensing agreements with foreign suppliers. By
1985 Hyundai counted 54 licenses with suppliers from Europe, Japan and the US (Kim,
1997; 1998). Moreover, the company fully computerized its design, manufacturing and
parts handling processes and established its first proving ground. By 1986, the company
41
could finally export its first front-wheel drive model – the ‘Excel’, selling more than
260,000 units in the US by 1987.
While the company advanced technologically, it faced more and more
difficulties in the acquisition of foreign technologies. As a result, Hyundai stepped up
its own R&D efforts and increased the number of researchers to 2.247 by 1986 in
comparison to 147 in 1975 (Forbes & Wield, 2002). By 1991, the company gained full
technological independence with the development of its first proprietary engine and
transmission system (Hyundai Motor Company, 2009a; Kim, 1998). In its quest for
technological independence, the company not least profited from its affiliation to the
larger conglomerate Hyundai Group, which provided Hyundai with the necessary
resources and a pool of talent (Kim & Lee, 2001).
In the meantime, the company also began its internationalisation push. First with
the expansion through sales offices overseas until 1994, followed by knock down
assembly until 1998 and the establishment of full production systems abroad from 1999
onwards, even though it still lacked a significant competitive advantage. In fact,
Hyundai gained its competitive edge through its experiences and learning processes in
international markets (Wright, Suh, & Leggett, 2009). Driven by the aim to become a
managerial and technologically independent automobile producer, a key distinction in
Hyundai’s internationalisation process represents the export focus on developed
countries rather than developing countries from early on, in particular North America,
while manufacturing was and still is highly concentrated in lower cost countries of the
developing world (see figure 8) (Kim & Lee, 2001; McDermott, 1997). Nowadays,
Hyundai Motors ranks among the world’s top 100 Transnational Corporations with a
Transnationality Index (TNI)21 of 38.6 per cent in 2008 according to the United Nations
Conference on Trade and Development (UNCTAD, 2009).
21 The Transationality Index is a means to measure multinational’s degree of internationalisation calculated by the United Nations Conference on Trade and Development The TNI is thereby based on the ratios foreign assets to total assets, foreign sales to total sales and foreign employment to total employment (UNCTAD, 2009).
42
Figure 8: Hyundai’s globalisation by function
-‐ This image has been removed by the author of this thesis for copyright reasons -‐
(Source: Kim & Lee, 2001, p. 314)
V.1.3. Value chain analysis
V.1.3.1. Suppliers
Besides a local sourcing strategy which aims at lowering input and reducing transport
and tariff costs, HKAG reacts to surging raw material prices with the establishment of a
second in-house steel mill at Hyundai Steel, thereby increasing the capacity to eight
tons a year. By these means, HKAG can assure its supply of high-quality tensile steel at
stable prices, while simultaneously boosting synergies among the two affiliates through
the implementation of circular production and recycling links (Hyundai Motor
Company, 2010n). In the same vein, HKAG is constantly striving to improve the
recyclability and end of life dismantling of its vehicles (Hyundai Motor Company,
2010o).
Regarding its parts suppliers HKAG is known for arms-length transactions and
being a harsh price-negotiator (Noble, 2010). In 2006, HKAG squeezed its suppliers for
substantial cost cuts, which even caused investigations of the Fair Trade Commission
for unfair practices (Courtenay, 2006). Moreover, Hyundai sources many parts among
its own ranks, which may further deepen HKAG’s cost advantage. For example,
Hyundai MOBIS is the country’s largest domestic supplier and subsidiary Hyundai
Rotem provides the electric motor for HKAGs’ hybrid systems (Jackson, 2008). In a
recent publication the Korean Institute for Economic Trade confirmed that the overall
ratio of outsourced auto parts in Korea decreased as a result of the vertical integration of
core auto parts suppliers by Korean car manufacturers in recent years. However, import
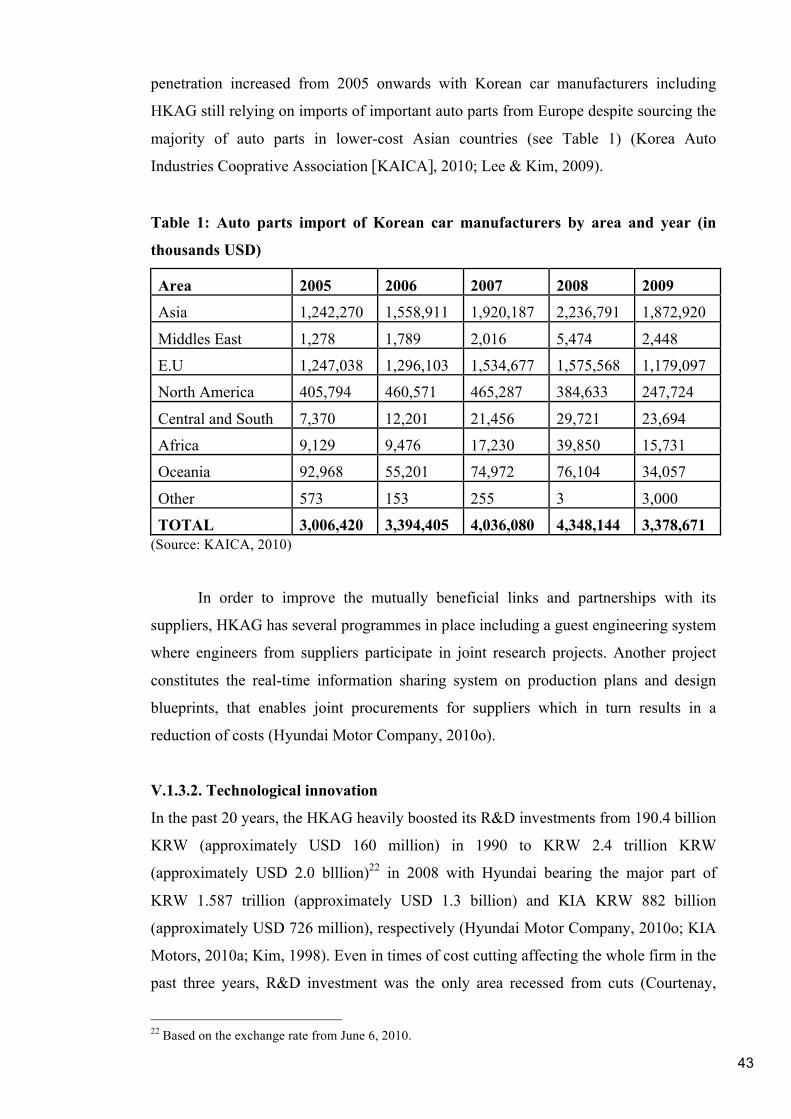
43
penetration increased from 2005 onwards with Korean car manufacturers including
HKAG still relying on imports of important auto parts from Europe despite sourcing the
majority of auto parts in lower-cost Asian countries (see Table 1) (Korea Auto
Industries Cooprative Association [KAICA], 2010; Lee & Kim, 2009).
Table 1: Auto parts import of Korean car manufacturers by area and year (in
thousands USD)
Area 2005 2006 2007 2008 2009
Asia 1,242,270 1,558,911 1,920,187 2,236,791 1,872,920
Middles East 1,278 1,789 2,016 5,474 2,448
E.U 1,247,038 1,296,103 1,534,677 1,575,568 1,179,097
North America 405,794 460,571 465,287 384,633 247,724
Central and South 7,370 12,201 21,456 29,721 23,694
Africa 9,129 9,476 17,230 39,850 15,731
Oceania 92,968 55,201 74,972 76,104 34,057
Other 573 153 255 3 3,000
TOTAL 3,006,420 3,394,405 4,036,080 4,348,144 3,378,671 (Source: KAICA, 2010)
In order to improve the mutually beneficial links and partnerships with its
suppliers, HKAG has several programmes in place including a guest engineering system
where engineers from suppliers participate in joint research projects. Another project
constitutes the real-time information sharing system on production plans and design
blueprints, that enables joint procurements for suppliers which in turn results in a
reduction of costs (Hyundai Motor Company, 2010o).
V.1.3.2. Technological innovation
In the past 20 years, the HKAG heavily boosted its R&D investments from 190.4 billion
KRW (approximately USD 160 million) in 1990 to KRW 2.4 trillion KRW
(approximately USD 2.0 blllion)22 in 2008 with Hyundai bearing the major part of
KRW 1.587 trillion (approximately USD 1.3 billion) and KIA KRW 882 billion
(approximately USD 726 million), respectively (Hyundai Motor Company, 2010o; KIA
Motors, 2010a; Kim, 1998). Even in times of cost cutting affecting the whole firm in the
past three years, R&D investment was the only area recessed from cuts (Courtenay,
22 Based on the exchange rate from June 6, 2010.
44
2006; Ohnsman & Cha, 2009). The company further plans to keep its annual R&D
spending around five per cent of its sales value, which is comparable to its major
competitors (Ihlwan & Kiley, 2009; UK Department for Business Innovation and Skills,
2010). The strong emphasis on R&D is also reflected in the number of patents. HKAG
is among the top three patent applicants in Korea and the number of patents in the US
rose to 1588 in May 2010 since its first patent filing in 1986 (Thomson Reuters, 2009;
United States Patent and Trademark Office, 2010).
In the same vein, the HKAG invested heavily in the expansion of its global R&D
network. By 2009, the company maintained seven up-to-date R&D and design centres
together with three proving grounds across Korea, Japan, the US, Germany and India.
The main advantage of a global R&D network constitutes the proximity to customers,
which enables the company to develop and adjust key technologies and products to the
needs of local markets. It furthermore allows HKAG to leverage resources and
technologies globally, while increasing the local contents of its products and thereby
lowering costs (Hyundai Motor Company, 2009a; KIA Motors, 2010c). With the newly
established R&D centre in Bangalore in 2009, the company reacts to the surging
demand for smaller cars since India offers a huge pool of excellent engineers with
expertise in the development of compact vehicles. HKAG has further planned to
gradually expand its operations in India (Edmondson, et al., 2007; Hyundai Motor
Company, 2009h; Mitra, 2008). Yet, the HKAG maintains most of its engineering work
in Korea and uses its operations overseas to tap latest technologies, e.g. diesel
technology and design from Europe for its HED23 cars (Eppinger & Chitkara, 2006).
More recently, HKAG committed itself to become the industry’s global eco-
leader with its Blue Drive initiative (Hyundai Motor Company, 2010f). This strategy
foresees the minimisation of greenhouse gas emissions by lowering the carbon
emissions of internal combustion engines, the implementation of bio-fuels, hybrid
vehicles24, plug-in25 electric vehicle and last but not least fuel cell electric vehicles (see
figure 9). While competitors started years ahead of HKAG with the development of
such green technologies, the company did not have any programmes in place until 1995
for the development of the first hybrid concept car and in 1998 for its fuel cell concepts,
resulting in a slight disadvantage for the company since many competitors already
23 Hyundai European Design 24 A hybrid vehicle combines two or more sources to power the vehicle, e.g. an internal combustion engine and electric motor. 25 A plug-in vehicle can have its battery recharged at home.
45
started to commercialise some of theses new technologies (Hyundai Motor Company,
2010o).
Figure 9: The Hyundai-KIA Automotive Group’s Blue Drive initiative
-‐ This image has been removed by the author of this thesis for copyright reasons -‐ (Source: Hyundai Motor Company, 2010o, p. 30)
Nevertheless, HKAG made some remarkable progress in these areas with the
development of its proprietary hybrid and fuel cell systems, that promise the company
cost advantages compared to its competitors. The HKAG hybrid system, for example,
is made of fewer parts using lighter materials, which makes “their hybrids lighter and
cheaper than the [pioneering] Toyota system” according to Lee Ki Sang, director of the
hybrid system development at the HKAG (Ihlwan, 2008d). Moreover, HKAG is the first
auto producer to implement lithium-ion polymer batteries in its vehicles, which were
conjointly developed by HKAG and LG Chem, who will also provide HKAG with
batteries in the future. Li-ion polymer batteries are smaller, lighter and more durable in
comparison to the nickel-metal hydride batteries currently used by most of its
competitors (Hyundai Motor Company, 2010f). The first hybrid vehicle was the Elantra
HEV LPI26 launched by HKAG in Korea in 2009 and the world’s first hybrid powered
by liquefied petroleum gas (Hyundai Motor Company, 2009f). This year, the company
will introduce a hybrid version of its success model, the Hyundai Sonata and the hybrid
KIA Optima for the first time in the US market (Hyundai Motor Company, 2010f; KIA
Motors, 2010a). The same year, HKAG plans to introduce its first electric vehicle with
the small model i10 that will be sold initially to government and state agencies before it
will hit the mass markets (Hyundai Motor Company, 2010n). Currently HKAG is also
working on plug-in hybrid models, the Blue Will and KIA Ray (Hyundai Motor
Company, 2010c; KIA Motors, 2010b). Thereby HKAG profits from close links with
the Korean government that granted its support to a few selected ‘green growth’ sectors
26 Liquid Propane Injection uses liquefied petroleum gas.
46
such as renewable energy and hybrid vehicle systems (Financial Times, 2009; Lerner,
2009).
Recently, HKAG also revealed a new concept car with the i-flow HED-7. This
hybrid features a diesel engine and aims at strengthening the company’s market
presence in Europe. Close cooperation with BASF allowed the incorporation of various
new technologies and next-generation materials reducing vehicle weight and volume,
thus lowering the fuel consumption of the car (Hyundai Motor Company, 2010i).
Regarding fuel cell technology27, the company is not expecting to commercialise
this technology before 2012 starting with a limited series production (Hyundai Motor
Company, 2010o). One difficulty in the commercialisation of fuel cell vehicles remains
the lack of refuelling infrastructure. Therefore, HKAG joined forces with leading
competitors to urge governments and energy agencies to build up a sufficient hydrogen
infrastructure by 2015 (Hyundai Motor Company, 2009e).
Meanwhile, HKAG speeds up their research efforts in maximising the fuel
efficiency of their fleet. Since the development of their first engine in 1991, HKAG
successfully developed an entire range encompassing diesel and rear-wheel drive
engines (Hyundai Motor Company, 2009a). One of its newest inventions the Tau
4.6litre engine was even awarded as one of Ward’s 10 best engines (Hyundai Motor
Company, 2008).
More than a decade after most of its competitors, the company introduced its
first gasoline direct injection engine with the 2.4 Theta II GDI in 2009. This engine
supposedly increases vehicles’ fuel efficiency by ten per cent compared to conventional
multi-point fuel injected engines (Hyundai Motor Company, 2009c).
While diesel engines do not represent an integral part of HKAG’s technology
strategy according to discreet company sources stated in an article in the Automotive
News, HKAG is prudently working on the development of bioethanol vehicles and a
diesel engine that runs on a higher blend-biodiesel rather than the current blend
containing five per cent biodiesel (Hyundai Motor Company, 2010o; Jackson, 2008).
Further efforts to maximise the fuel efficiency of its vehicles include the
downsizing of engines and car features, the development of an eight-gear automatic-
transmission and the reduction of vehicle weight and friction through the
implementation of lighter materials such as high-strength steel, aluminum or
magnesium, and other innovative technologies (Hyundai Motor Company, 2010o). So 27 Fuel cells are big batteries that produce electricity to power a vehicle through a chemical reaction of hydrogen with oxygen. Their main advantage lies in their zero emission while they only discharge water vapours. Any primary source such as coal, natural gas etc. can be used to produce hydrogen.
47
far, HKAG has been quite successful with Hyundai being named the fuel efficiency
leader in the US by the Environmental Protection Agency with an average fleet mileage
of 30.1 miles per gallon in 2009 ahead of Honda (29.7 mpg) and Volkswagen (29.6
mpg)28. With a fleet average of 28 mpg KIA fares slightly worse. Nonetheless, this
achievement puts HKAG in a good position to meet the new CAFÉ mandated standards
of 35.5 mpg by 2015 (Hyundai Motor Company, 2010n) .
While electronic system parts currently amount to 25 per cent of a car’s total
cost, this ratio is expected to increase to 40 per cent by 2015 due to technological
advancements, tighter legal requirements and safety standards, as well as changing
customer tastes (Hyundai Motor Company, n.d.). In order to reduce the development
costs and benefit from synergies, HKAG formed a joint venture with Infineon
Technologies. HKAG can thereby profit from Infineon’s broad technology portfolio
such as chipset solutions, sensor and power semiconductors and microcontrollers
(Hyundai Motor Company, 2007). Together with Microsoft and the Korean Institute for
Information Technology (UTA), HKAG furthermore established a Centre for Advanced
Technologies in 2009, which aims at developing synergies with electronics companies
that will receive grants from the Korean government. Furthermore, HKAG went into a
long-term agreement with Microsoft for the development of next-generation car-
infotainment systems (Jackson, 2008; KIA Motors, 2008).
Overall, HKAG is still lagging behind in some technologies, but is moving up
the learning curve at an immense speed. Additionally HKAG is always anxious to find
simple, innovative but more cost-efficient solutions rather than overwhelmingly
complex and sophisticated ones, as for example the overall cheaper hybrid system and
cheaper Li-ion polymer batteries compared to Li-ion counterparts, leading to cost
advantages over competitors. Thereby, the company not least profits from its latecomer
status that allows a focus on improvements of already existing technologies rather than
pioneering engineering (Hyundai Motor Company, 2010f; Ihlwan, 2008d).
V.1.3.3. New product development
Responding to new customer preferences, HKAG plans to aggressively revamp its
product line-up. Hyundai’s 24/7 version 2.0 initiative thereby foresees the introduction
of seven new or face lifted models in just 24 months, while KIA is planning a similar
28 It should be noted here that the average fuel-economy mandated by CAFE refers to the fleet average, which favours automobile producers with more offerings in the compact or subcompact segment. HKAG, for example, does not have any pick-ups in their US assortment, leading to a higher average in fuel economy than many of its competitors.
48
boost of models that feature new eco-friendly technologies and higher fuel-efficiency
(Hyundai Motor Company, 2010a; KIA Motors, 2010c).
Moreover, Hyundai is currently working on the development of a small and
inexpensive entry-level car especially designed for the Indian market, which might give
the company a further competitive edge in emerging markets. Nevertheless, Hyundai
does not expect a launch before 2012 (Businessline, 2009, 2010). For the Chinese
market, Hyundai also plans the introduction of a third exclusive model for the Chinese
market this year, with the all-new sub-compact model ‘Verna’ (Hyundai Motor
Company, 2010j).
While HKAG, in particular Hyundai, tries to move upmarket with the
introduction of its first rear-wheel drive vehicle Genesis, the focus of HKAG moves
back to smaller and less expensive models according to Hyundai strategist Yoon
(Ihlwan, 2008c). However, with development costs of approximately USD 338 million
over a three-year period, HKAG introduced a new version of its luxury sedan Equus in
the domestic market in 2009 and has plans to launch it in overseas markets by 2011.
According to HKAG chairman Chung, the Equus “will elevate the Hyundai brand to
the highest level” and constitutes the company’s assault on premium brands such as
Mercedes, Lexus and BMW (Hyundai Motor Company, 2009b). For the development of
the new premium models, HKAG even adjusted its product development system from a
sequential to a cross-functional approach where members from various departments
work simultaneously together thereby speeding up the development and time-to-market.
Furthermore, HKAG relied on careful analyses of customer preferences and constantly
sought their feedback during the development process (Choi & Bok, 2009).
As most of the car manufacturers around the globe, HKAG also pursues a
platform strategy29, thus benefiting from cost synergies among Hyundai and KIA
models, while also adding production flexibility (Ohnsman & Cha, 2009; Veloso &
Kumar, 2002).
Moreover, the two brands are brushing up their designs to increase their appeal
to consumers. While KIA obliged former Audi designer Peter Schreyer to create its
signature design, Hyundai’s designs are based around a ‘fluidic sculpture’ design, that is
more flowing and emotional than KIA’s (Hyundai Motor Company, 2010b; Patton,
2010). 29 The strategy of “Common platforms” aims to enhance firms’ profitability by using the same parts in various vehicles sharing today’s massive R&D costs across several models, leading to fewer prototypes and thus reduced costs. Other cost savings can be achieved through better pricing from suppliers due to higher volumes, higher plant utilization and the use of common tools (Grant, 2008).
49
V.1.3.4. Production
HKAG maintains several production plants across the world including Korea, the US,
and mainly lower-cost countries such as India, China, Slovakia, Czech Republic and
Turkey (Hyundai Motor Company, 2009a; KIA Motors, 2010a). Another plant is
scheduled to open by the end of 2010 in Russia (Hyundai Motor Company, 2010l).
Additionally, the company plans to set up a third production plant in China and a plant
in Brazil by 2011 (Alberts, 2009; Reuters, 2008).
With such an extensive production network in Eastern Europe and the emerging
markets, HKAG can benefit from lower production costs due to cheap labour and less
expensive local inputs (Berret, 2005; Farrell, 2004). With India being HKAG’s
manufacturing hub for the export of small cars, the company can offer its cars at a lower
price even given the higher transport costs (Yee, 2008). At the same time a global
production network minimises a company’s exposure to exchange rate volatility (e.g.
Miller & Reuer, 1998).
According to HKAG, the company’s total production capacities currently
amounts to 5.8 million cars and trucks. The plan is to increase the capacity to 6.5
million units until 2011, which is an ambitious plan given the overcapacity problems in
the industry (Taylor III, 2010).
Regarding its production systems HKAG recognises the need to keep its
production systems as flexible as possible through improvements in process
technologies and the previously mentioned platform strategy. Flexible production
systems enable HKAG to shift production around in order to meet fluctuating market
demand (Buckley, 2009). Just recently HKAG, for example, announced to move part of
the i20 production from India to Turkey (Businessline, 2010).
Despite cost advantages at home due to cheaper labour and material costs
compared to other OECD countries, Hyundai constantly tries to lower its manufacturing
costs by improving and applying simpler and cost-efficient solutions in their vehicles
(see Chapter V.1.3.2) (Ohnsman & Cha, 2009).
V.1.3.5. Marketing & Sales
While early entrants in the automobile industry have the advantage of already well-
established brands, HKAG is ramping up its marketing activities in order get rid of its
poor quality image and to raise the brand awareness of its two brands. With its ‘big
voices in big places’ strategy HKAG pours millions in high-profile advertising during
big sport events, entertainment awards shows and in outdoor placements such as the
50
video billboard on Times Square (New York) (Hyundai Motor Company, 2010g). In the
past year, HKAGs’ advertisements thus could be seen during the commercial breaks of
the Super Bowl and the Academy Awards, each of which cost HKAG an estimated
USD 7 million (Ihlwan & Kiley, 2009). With the consolidation of Hyundais’ and KIAs’
media planning and buying activities through the appointment of Havas Media, HKAG
hopes for cost synergies through the maximisation of operation scale (Hyundai Motor
Company, 2009g).
This year HKAG continues its partnership with FIFA being the main sponsor of
the 2010 Soccer World Cup hosted by South Africa. It furthermore extended its
sponsorship commitment for the World Cup 2014 as well as the UEFA European
Football Championships up to 2017 (Hyundai Motor Company, 2010e, 2010h).
Besides its great emphasis on sports marketing, HKAG is also stepping up its
global social contribution activities with donations supporting humanitarian relief
efforts in Haiti and earthquake-stricken Chile, as well as volunteering programs in
Brazil that range from cultural exchange activities to building houses, just to name a
few (Hyundai Motor Company, 2010d, 2010m).
So far HKAGs’ efforts paid off. Since its entry in 2005, Hyundai continued its
upward move in Interbrand’s Best Global Brands survey and ranks currently 69th with a
brand value of USD 4.6 billion surpassing Porsche, Ferrari and Lexus (Hyundai Motor
Company, 2009i).
Thanks to a new quality imperative devouring over USD 6.5 billion since 2004
in this area, Hyundai was named top non-luxury brand in J.D. Power’s Initial Quality
Study in 2009 for the second time since 2006 and ranks fourth among all car
manufacturers only surpassed by Lexus, Porsche and Cadillac. In this survey US
customers rate their overall satisfaction with the quality of their newly purchased
vehicles (Hyundai Motor Company, 2009d; Ihlwan & Kiley, 2009). The American
magazine consumer reports, which tests performance, comfort, utility, and reliability of
vehicles, affirms the good quality of HKAGs’ cars ranking fourth best among all
carmakers in 2010 (Consumer Reports, 2010).
With the enhancement of dealership facilities and services, HKAG tries to boost
their image even further (Hyundai Motor Company, 2009a). In 2008, for example,
HKAG spend approximately USD 74.3 million on the refurbishment of its European
dealerships (Revill, 2008) and is offering customers extended five years bumper-to-
bumper warranties, five years’ roadside assistance plus annual vehicle health checks
with its so-called ‘Triple 5’ package (Hyundai Motor Company, 2010i).
51
Genuine promotions such as the US assurance programme, where customers can
return their new car within a year if they loose their job, the ‘assurance gas lock’
programme guaranteeing buyers a fuel-price of USD 1.49 per gallon for a year and
more recently the incentives for trading-in Toyota cars when customers purchase a new
Hyundai or Kia car, were reflected in the increase of the company’s market share in the
US (Halliday, 2009; Woodall & Kim, 2010). The major push in sales promotions is also
notable in the jump of HKAGs’ promotional expenses from USD 1.9 billion in 2007 to
USD 3.25 billion in 2008. The overall selling expenses30 thereby accounted to 18.6 per
cent of total sales in 2008 slightly increasing from 16.2 per cent in the previous year
(Hyundai Motor Company, 2009a).
With a quantum leap in quality and priced far below its competitors, HKAG
offers customers good value-for-money, which seems to be a continuing trend on
demand side. The luxury sedan Equus, for example, will be priced about USD 20,000
below European equivalents offered by Audi, BMW and Mercedes. However, unlike
most of its competitors, Hyundai is launching its luxury vehicles under the same brand
rather than creating a new brand umbrella, which may hamper its quest for brand
repositioning, as consumers still do not associate HKAG with a prestigious brand.
Nonetheless, the transformation from a cheap brand to a smart buy already led to a
change in the demographics of Hyundai/KIA car owners with 49 per cent holding a
college degree in 2009. This reflects an increase of 13 per cent since 1999, whereas
Toyotas increase during the same period was a mere two per cent (Taylor III, 2010).
In result, HKAG was able to constantly increase its overall market share in 2009
(Hyundai Motor Company, 2010k). The company not least profited from an extremely
strong performance in the Chinese market since its entry in 2002 through a Joint
Venture with Beijing Automotive Industry Holding Corporation. HKAG’s success can
thereby be attributed to a strong line-up of compact cars, while other international
competitors rather target the top-end of the market (Bhattacharya & Michael, 2008;
Hyundai Motor Company, 2010n). HKAG now holds the second biggest market share
in India and fourth biggest in China (Datamonitor, 2009b; Hyundai Motor Company,
2010k).
The Group’s aggressive selling strategy in the US and its desire to further
penetrate the European market may be facilitated through the closure of South Korea’s
Free Trade Agreements (FTA) with the US and the European Union. Both agreements,
30 The selling expenses include all personnel and non-personnel operating costs of sales and marketing activities, advertising, sales promotions, customer service etc. of a firm
52
which are still under review by the authorities, would increase the competitiveness of
Korean automobile manufacturers through the removal of import duties and other trade
barriers. In fact, the FTA could lower the vehicle price for a Korean car in the European
market around USD 1,900 according to estimates of the European Automobile
Manufacturers Association while arguing that benefits for European car manufacturers
under the current FTA conditions are marginal (ACEA, 2010; United States Trade
Representative Office, 2010).
V.1.3.6. Organisational structure
One of HKAG’s greatest competitive advantages constitutes its speed and agility to
quickly adapt to changing market conditions. According to Krafcik, president and CEO
of Hyundai Motor America, the company’s lean and flat organisational structure
constitutes one of its core strengths (Halliday, 2009). With less people and bureaucracy,
the company is more flexible allowing it to move faster than its competitors. The
implementation of the US Assurance marketing program from the conception to
realisation, for example, took just 37 days, which would require months in other
companies. With its Global Command and Control Centre in Seoul, HKAG also
overviews its entire operations worldwide in real-time. By doing so, HKAG is able to
instantly identify and react to problems.
Another peculiarity of the company represents its boldness and ambition driven
by a strong and visionary leader, thereby always benchmarking the company with the
leading auto manufacturer Toyota. Despite HKAG is also well known for the
determination of impossible business targets without concrete action plans. This open
and aggressive approach makes the company more flexible to adjustments, which is also
reflected in the companies’ decision-making. HKAG tries to defer its decisions to the
last possible minute in order to respond to latest developments and requirements (Taylor
III, 2010).
One of the company’s greatest disadvantages represents its high debt burden.
Even though, HKAG could slightly improve its debt to equity ratio over the past years,
with total liabilities of USD 61.91 billions and a shareholder’s equity of USD 20.16
billion in 2008, its debt to equity ratio of 3.0 is far higher than most of its competitors.
The high debt burden is also reflected in its relatively poor international credit ratings
53
with Moody’s and S&P rating31 the company below average in 2008 with Baa3 and
BBB-, respectively (Hyundai Motor Company, 2009a). This may negatively affect the
company’s ability to raise further funds, especially in light of current credit restrictions
induced by the latest recession.
V.2. Case two: Volkswagen Group
V.2.1. Company overview
With the initial aim to build a ‘people’s car’ (English translation for ‘Volkswagen’)
designed by Ferdinand Porsche before WWII in 1933, reorganised Volkswagen
(hereafter VW) soon became the producer of some of the most iconic vehicles in
automobile history with the Beetle and the VW Van. Propelled by the great success of
the VW ‘bug’, the company started its expansion with the acquisition of the Auto Union
and NSU Motorenwerke in 1969 merging them into its modern-day premium brand
Audi. With the introduction of its Golf (or Rabbit in the US), Jetta and Passat, the
company continued its success story. Further acquisitions followed with the purchase of
Spanish SEAT in 1986 and Czech Skoda in 1991. In 1998 three luxury brands with
Bentley, Bugatti and Lamborghini joined the Group portfolio and another luxury brand
is about to follow with the planned integration of Porsche into the family by 2011
(Volkswagen AG, 2010c).
Headquartered in Wolfsburg (Germany), the Group employs almost 370,000
employees worldwide and has operations in more than 150 countries. In 2009 the Group
delivered more than 6.3 million vehicles to its customers and thus represents the biggest
European and third biggest automobile producer in the world with a world market share
of 11.3 per cent. The main markets constitute Europe, China and South America (in
particular Brazil), with China for the first time displacing Germany as the biggest sales
market for the Group in 2009.
With its ever-growing brand portfolio the Group serves all market segments
from economic compact models to high-end luxury vehicles. Each brand is thereby
independent and managed autonomously, thus maintaining its own character.
With its tailored customer services beyond just auto sales, the Group is also the
largest automotive financial service provider in Europe.
In 2009 the Group generated revenues over USD 131.1 billion representing a
slight decrease from USD 141 billion in the previous year. Nevertheless, the strong 31 Moody’s and S&P are two of the most renowned international credit rating agencies that evaluate companies’ creditworthiness i.e. ability to pay interests, dividends, principal on securities and so on. Lower credit ratings thereby imply higher borrowing costs and restricted capital access.
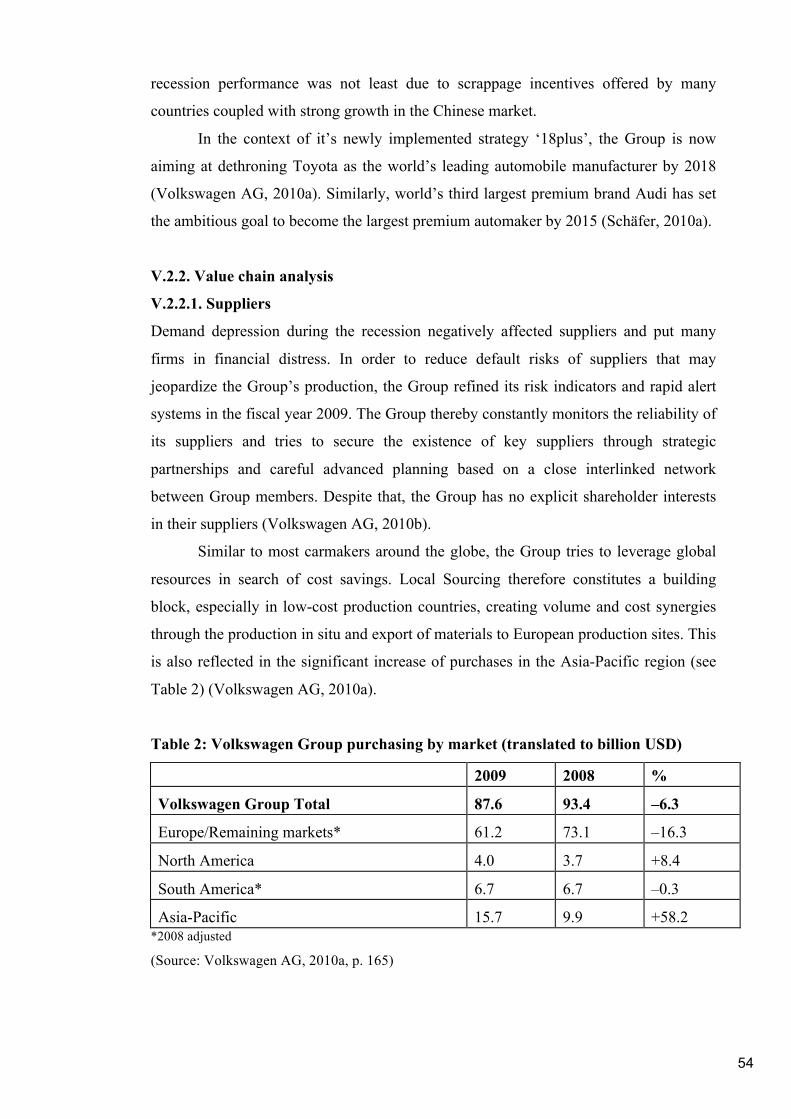
54
recession performance was not least due to scrappage incentives offered by many
countries coupled with strong growth in the Chinese market.
In the context of it’s newly implemented strategy ‘18plus’, the Group is now
aiming at dethroning Toyota as the world’s leading automobile manufacturer by 2018
(Volkswagen AG, 2010a). Similarly, world’s third largest premium brand Audi has set
the ambitious goal to become the largest premium automaker by 2015 (Schäfer, 2010a).
V.2.2. Value chain analysis
V.2.2.1. Suppliers
Demand depression during the recession negatively affected suppliers and put many
firms in financial distress. In order to reduce default risks of suppliers that may
jeopardize the Group’s production, the Group refined its risk indicators and rapid alert
systems in the fiscal year 2009. The Group thereby constantly monitors the reliability of
its suppliers and tries to secure the existence of key suppliers through strategic
partnerships and careful advanced planning based on a close interlinked network
between Group members. Despite that, the Group has no explicit shareholder interests
in their suppliers (Volkswagen AG, 2010b).
Similar to most carmakers around the globe, the Group tries to leverage global
resources in search of cost savings. Local Sourcing therefore constitutes a building
block, especially in low-cost production countries, creating volume and cost synergies
through the production in situ and export of materials to European production sites. This
is also reflected in the significant increase of purchases in the Asia-Pacific region (see
Table 2) (Volkswagen AG, 2010a).
Table 2: Volkswagen Group purchasing by market (translated to billion USD)
2009 2008 %
Volkswagen Group Total 87.6 93.4 –6.3
Europe/Remaining markets* 61.2 73.1 –16.3
North America 4.0 3.7 +8.4
South America* 6.7 6.7 –0.3
Asia-Pacific 15.7 9.9 +58.2 *2008 adjusted
(Source: Volkswagen AG, 2010a, p. 165)
55
V.2.2.2. Technological innovation
With its seven passenger car brands, the Volkswagen Group disposes over an extensive
R&D network worldwide. The main Group Research Centre that bundles research
activities for all brands is located in Wolfsburg while the company also maintains
Group Research centres in China and Japan, as well as an Electronics research Lab in
Palo Alto (CA, USA) (Volkswagen AG, 2010d).
In 2009 the Group’s automobile R&D departments counted almost 26,000
people with total R&D expenditures amounting to USD 7.1 billion, thus equalling 5.8
per cent of total sales revenues. At the same time, the R&D capitalisation rate was
similar to previous years accounting for 33.6 per cent of total R&D expenditures. The
Group’s stronghold in this area is also reflected in the 1790 patents filed worldwide in
2009 whereupon the majority concerned hybrid and auto body technologies, as well as
driving assistance and infotainment systems.
Yet, the Group’s main research focus constitutes the development of innovative
vehicle and mobility concepts that maximise fuel economy and minimise the emissions
of their vehicles. Of its current line-up, 176 models comply with current European
emission standards not surpassing 140 g/km, 60 models undercut 120 g/km and six
models emit even less than 100 g/km. Especially eco-friendly models thereby bear the
company’s eco-labels like the prefix ‘e’ in the case of Audi, Seat’s ‘ecomotive’,
Skoda’s ‘Greenline’ and VW’s ‘BlueMotion’. Similar to other carmakers the VW
Group is following a three-step approach in the development of ‘green’ vehicles (see
figure 10) with the current main priority constituting the optimization of conventional
combustion engines and the reduction of vehicle fuel consumption and emission
through clean-efficient engines and the implementation of lighter materials, reduction of
friction and aerodynamic improvements.
56
Figure 10: The Volkswagen Group’s roadmap to sustainable mobility
-‐ This image has been removed by the author of this thesis for copyright reasons -‐
(Source: Volkswagen AG, 2010b, p. 23)
Audi, for example, has pioneered lightweight construction of vehicles since 1985 with
the development of the Audi Space Frame made almost entirely from aluminium. This
type of body frame reduces the weight of an A8 by around 40 per cent in comparison to
a conventional steel auto body. Moreover, the Group constantly explores parts built
from magnesium or fiber-reinforced plastics with the aim to make them more
affordable. Lamborghini also works closely with Boeing and the university of
Washington (Seattle) on the exploration of weight-reducing carbon-fibre. Meanwhile
VW is using affordable lightweight solutions like (ultra) high-strength steels in the
volume segment. The VW Group also joined forces with 37 partners in the
‘SuperLIGHT car project’ funded by the European Commission.
In its research efforts, the Group can also profit from its involvement in
motorsports activities that allow the transfer of newly proved technologies into the series
production of cars. Audi’s all-wheel drive ‘Quattro’ was first implemented in its race
cars, so was the gasoline direct injection engine in 2001 (Volkswagen AG, 2010a).
Recognising that drivers can improve the fuel economy of their vehicles through
more economical driving habits, the Group makes use of advanced auto electronics to
develop driver assistance and automated driving systems to lower future fuel
consumption even more. Despite, the company also attempts to educate drivers around
the world through customized driving trainings (Amend, 2008; Vasilash, 2008a;
Volkswagen AG, 2010a).
Nonetheless, the major focus still remains the optimization of power trains.
Despite improving existent direct-injection gasoline (TSI) and diesel engines (TDI) and
57
innovative transmissions, the company works on advancing the TSI technology to
natural gas and flexfuel32 drive-trains (Volkswagen AG, 2010b). Vehicles already
available with such options include the VW Golf and Passat, as well as the Audi A4
(Volkswagen AG, 2010a).
Yet, the company places its highest emphasis on clean diesel technologies like
most of the other European car manufacturers and even reintroduced them into the diesel
weary American market after their withdrawal in 2006 due to the failure to meet the
regulation requirements back then (Patton, 2008; Volkswagen AG, 2010a).
According to VW, the main advantage of clean diesel is the high fuel efficiency
in the city and on the highway, while hybrids’ fuel savings are confined to urban driving.
The Golf and A3 TDI, which was awarded green car of the year in 2010, for example,
achieve a fuel economy of 42 mpg on the highway and 30 mpg in the city, while many
hybrids do not even surpass the 30-mpg threshold (Stewart, 2010). Last year’s winner,
the Jetta TDI also meets the world’s most stringent emission requirements compliant
with all 50 US states. While diesel vehicles save up to 30 per cent fuel in comparison to
gasoline vehicles, one of their major disadvantages represents their price. A similar price
tag as for hybrid vehicles and a higher gallon price in the US undo the cost savings
through lower fuel consumption. Even in Europe, a stronghold of diesel vehicles, the
once cheaper diesel fuel is now as expensive as gas, although car tax benefits for diesel
models remain unlike in the US where car tax for gasoline vehicles is lower than for
diesel (Flint, 2008; Vasilash, 2008b). Another problem with diesel engines constitutes
their higher emission of nitrogen oxides requiring costly filters and catalysers, even
tough their carbon foot print otherwise outrivals gas engines (Patton, 2008).
Given the increased popularity of hybrid vehicles, the VW Group is currently
expanding its line up of hybrids and plug-in-hybrids - so-called TwinDrives. The plug-in
hybrids combine a TSI engine with an electric motor leading to fuel savings of up to 15
per cent. In 2008 VW already introduced the Golf TwinDrive. This year VW and Audi
plan to launch hybrid versions of their SUVs Touareg and Q5. The company presented
also the world’s smallest and most fuel-efficient hybrid car at the Frankfurt Auto show
with the L1. Equipped with a high-tech TDI engine and offering space for two adults, the
L1 merely needs 1.38 litres diesel per 100 km and emits just 36g/km of carbon-dioxide
(Volkswagen AG, 2010a). Moreover, the Group plans to implement the new stop-start
technology across all brands and models, which shuts off the vehicle’s engine when idle
and hence operates like a micro hybrid system (Schweinsberg & Zoia, 2009).
32 Flexfuel vehicles can run on gasoline, ethanol and methanol or any combination of these.
58
In addition, the Group is following the current demand trend by downsizing their
vehicles and engines. With the introduction of the next generation Polo BlueMotion
equipped with a 1.2 liter three-cylinder-TDI engine, the company expanded its direct
injection technology into the segment of small cars. With a carbon-dioxide emission of
87 g/km and fuel consumption of 3.3 liters per 100 km it is also one of the most
economical vehicles in the world (Volkswagen AG, 2010a). The company is also
planning on implementing its innovative seven speed direct shift gears box in the
compact segment, which will lower fuel consumption further (Volkswagen AG, 2010b).
In the medium-term, the Group focuses on alternative fuels attained from
renewable primary sources such as bio-fuels in order to reduce the dependence on
exhaustible fossil fuels. In close cooperation with German CHOREN Industries and
IOGEN, the Group is constantly working on the development of new environmental-
friendly fuels such as SynFuel33, SunFuel34 and SunGas35 that can be attained using
renewable resources (Volkswagen AG, 2010a).
In the long run, electric vehicles and fuel-cell technologies represent the Group’s
focal point. In this context, the Group is engaged in the development of high-temperature
fuel cells in contrast to most of its competitors who are concentrating on low-
temperature fuel cells. Although these types of fuel cells are more complex and thus
more expensive, they do not require additional cooling systems during operation
(Vasilash, 2007). Nevertheless, according to Jürgen Leohold, head of the group’s
research department, a mass series production of fuel cell vehicles is not to be expected
before 2025 and therefore the Group is concentrating its efforts on electric power trains
(Volkswagen AG, 2010a, 2010b).
In combination with the new small family, which was introduced in 2007 and
whose major characteristics are lightweight, compactness and eco-friendliness, VW
introduced its study E-Up! in September 2009. This fully electric vehicle with zero-
emission reaches a maximum speed of 135 km/hr and a range of 140 km on one charge.
The launch of the E-Up! is planned for 2013, while an Up! version with conventional
drive trains will be available by 2010. In addition, Audi showed its new innovative
concept car e-tron. This high-performance sports car is equipped with four electric
motors leading to a total engine power of 230 kwh36 or 308 hp37 and a total range of 248
33 SynFuel is a synthetic diesel extracted from natural gas (Vasilash, 2007). 34 SunFuels can be produced synthetically using any type of biomass such as energy crops or other biogenic resources (Volkswagen AG, 2010b). 35 SunGas is an innovative biogas extracted from renewable resources like corn or silage (Volkswagen AG, 2010b). 36 Kilowatt hour
59
km on one charge (Volkswagen AG, 2010a). The production start for the e-tron is
scheduled for the end of 2012 (Reiter, 2009).
For its hybrid and electric vehicles, the Group is relying on Li-ion batteries,
where its main challenge still constitutes in making them more affordable. Therefore, the
Group further enforced its partnerships with several battery producers and the institute
for physical chemistry at the University of Münster (Germany) (Volkswagen AG,
2010a).
Other strategic research alliances exist with Daimler, the Chrysler Group, the
International Energy Agency and several universities and scientific institutes worldwide
in order to push basic and applied research for the automobile industry forward. The
Group is also working closely with suppliers and tries to integrate them into the
development process as early as possible (Volkswagen AG, 2010b).
The VW Group formed a partnership with German power supplier LichtBlick
and will produce their combined heat and power plants EcoBlue, which are powered by
Volkswagen’s state-of-the-art natural gas turbines (Volkswagen AG, 2010a).
Moreover, the European Union expressed its support to the automobile industry
with the establishment of CARS21 (Competitive Automotive Regulatory System for the
21st century) in 2005 that provides public policy and regulatory recommendations for
the automotive industry. In this context, the European Commission declared to promote
access to finance, boost demand for new vehicles by accelerating fleet renewal,
safeguard skilled employees, minimise social costs imposed on European carmakers and
to dedicate continuous investments into the research of ‘greener’ and more fuel-efficient
vehicles (European Communities Commission, 2009a). In 2009, the European
Investment Bank, for example, granted the VW Group a loan of USD 496 million to
support its research activities in that area (BMI, 2010).
V.2.2.3. New product development
Regarding the development of new products, the Group announced its aggressive plan
to introduce 60 new or upgraded models for the year 2010 (Volkswagen AG, 2010a).
With investments over USD 10.5 billion Audi will extend its product line-up by eight
models until 2015 to a total of 42 models. Among those new vehicles are a new large
luxury coupé A7, the luxury sedan A8 and its first premium compact car with the A1,
which will also be its lowest priced model (Reiter, 2009; Schäfer, 2010a). The VW
passenger brand, on the other hand plans to introduce its previously mentioned new
37 Horse power
60
small family starting with the UP! in 2010, thereby serving the increasing demand for
small and eco-friendly vehicles. By the end of 2010, the company further plans to
launch an adapted version of its compact Polo in India that will cater the local needs in
terms of design, vehicle payload, clearance height and a fortified horn amongst others
(Volkswagen AG, 2010b).
In order to strengthen customer focus even more, the VW Group continuously
enhances its integrated innovation management process, which simultaneously
integrates various functional departments such as R&D, procurement, production and
marketing and sales in the development of new technologies. Its efforts were also
acknowledged in the Dow Jones Sustainability Index, were the company scored far
above average in the category ‘innovation management’.
In all its new product developments, the Group profits from its extensive
platform and module strategy across all brands, which allows the company to increase
its product range while reducing development time, efforts and costs, as well as
complexity of its vehicles (Volkswagen AG, 2010a). The Skoda Fabia for example
shares a common platform with the VW Polo; the VW Golf with the VW Jetta, Audi A4
and the Skoda Laura, so do the VW Touraeg and the Porsche Cayenne (Mitra, 2010).
Even though platforms are very common in the industry, the Group’s strength is to
adopt those platforms without cannibalising sales of more expensive models by cheaper
platform counterparts (Economist, 2009d).
Despite the modular longitudinal platform (MLB), the Group further developed
the innovative modular transverse matrix platform (MQB). This platform supersedes
current platforms as it allows the modular arrangement of components for vehicles in
which the power train is mounted transversely to the driving direction rather than
longitudinal, thereby increasing the range of vehicles based on such platforms from
subcompacts to large luxury vehicles.
Moreover, the group constantly expands its module concept into other areas of
the automobile such as electronics, auto body, infotainment and many more
(Volkswagen AG, 2010a). Since 2009 the Group even uses modules to build new
dealerships (Volkswagen AG, 2009).
In order to increase efficiencies and synergies in the product development
process even further, the Group is currently working on the implementation of a central
engineering database ‘CONNECT’, that will contain all relevant product data and will
link all brands and departments, as well as strategic development partners and suppliers
(Volkswagen AG, 2010a).
61
V.2.2.4. Production
With 61 production sites (40 of which are used for the production of vehicles) spanned
over fifteen European countries, Mexico, Brazil, Argentina, South Africa, China, India
and Russia, the Group disposes over an extensive global production network offering
closer proximity to customers.
With the opening of the Indian plant, the inauguration of the Russian plant in
Kaluga and the acquisition of two more Chinese plants in Chengdu and Nanjing in
2009, the Group clearly shifts its focus to the growth opportunities in the emerging
markets (Volkswagen AG, 2010a).
Currently, the group is also setting up a plant in Chattanooga, Tennessee (US)
with the aim to increase its market presence in the US and to reduce risks due to
fluctuating exchange rates. The plant will be opened by 2011 and will be mainly used
for the production of a new midsize car especially designed for the US market (Kelly,
2009).
With a flexible manufacturing approach thanks to its platform and module
strategy, the Group can adjust its production to market developments enabling the
company to weather demand fluctuations (Volkswagen AG, 2010a).
One weakness for the Group remains the high production concentration in
Western Europe, in particular Germany, due to inflexible labour regulations and labour
unit costs ranking among the highest in the world that erode profitability (BMI, 2010).
Consequently, one of the company’s main aims represents the enhancement of quality
and productivity in conjunction with a strict cost and investment discipline. In 2008,
the Group teamed up with the Fraunhofer-Gesellschaft and established the ‘Center of
Excellence for Automotive Production’ in Chemnitz. The main research focus of the
centre will lie in the development of flexible and resource-efficient production solutions
(Volkswagen AG, 2010a). In the following two years, the Group also plans to invest
USD 8.2 billion in the upgrade of manufacturing plants, quality assurance, IT and parts
supply divisions mainly in Germany (BMI, 2010).
The Group also constantly encourages employees’ suggestions for
improvements. By these means, the Group achieved cost savings of USD 446 million in
2009, while premiums for idea contributors only amounted to USD 33 million
(Volkswagen AG, 2010a).
V.2.2.5. Marketing & Sales
One of the Group’s major strengths constitutes its broad brand portfolio covering all
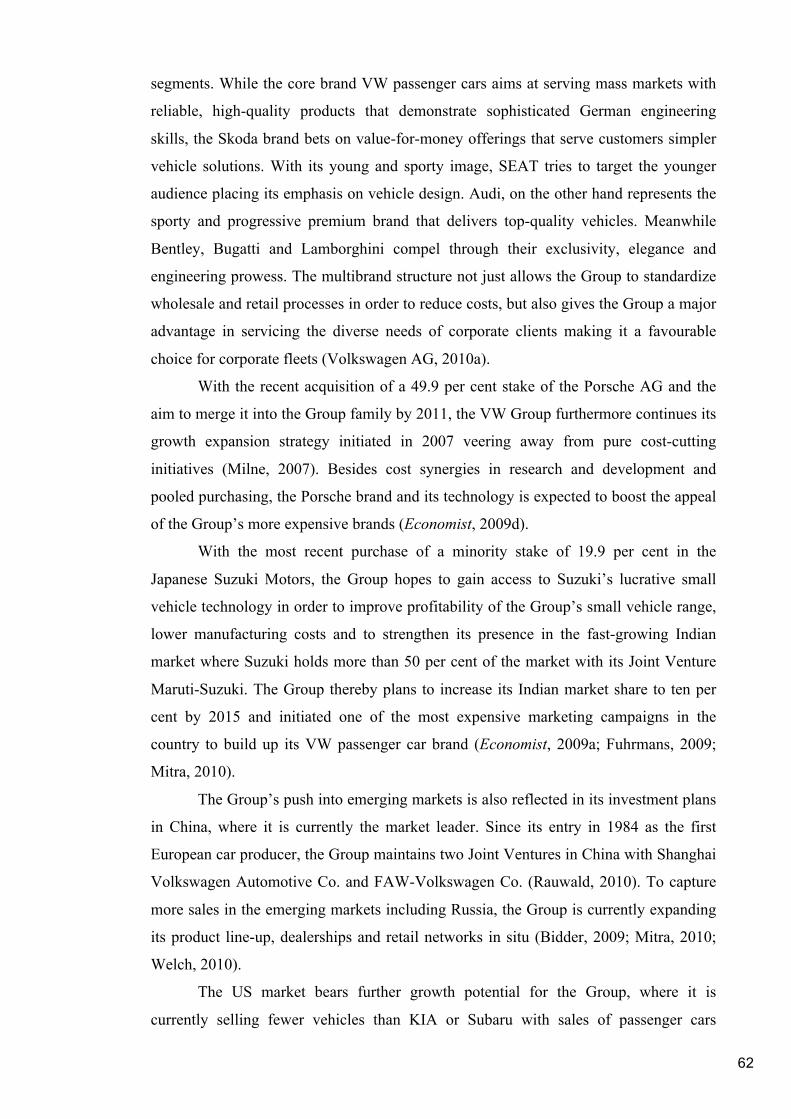
62
segments. While the core brand VW passenger cars aims at serving mass markets with
reliable, high-quality products that demonstrate sophisticated German engineering
skills, the Skoda brand bets on value-for-money offerings that serve customers simpler
vehicle solutions. With its young and sporty image, SEAT tries to target the younger
audience placing its emphasis on vehicle design. Audi, on the other hand represents the
sporty and progressive premium brand that delivers top-quality vehicles. Meanwhile
Bentley, Bugatti and Lamborghini compel through their exclusivity, elegance and
engineering prowess. The multibrand structure not just allows the Group to standardize
wholesale and retail processes in order to reduce costs, but also gives the Group a major
advantage in servicing the diverse needs of corporate clients making it a favourable
choice for corporate fleets (Volkswagen AG, 2010a).
With the recent acquisition of a 49.9 per cent stake of the Porsche AG and the
aim to merge it into the Group family by 2011, the VW Group furthermore continues its
growth expansion strategy initiated in 2007 veering away from pure cost-cutting
initiatives (Milne, 2007). Besides cost synergies in research and development and
pooled purchasing, the Porsche brand and its technology is expected to boost the appeal
of the Group’s more expensive brands (Economist, 2009d).
With the most recent purchase of a minority stake of 19.9 per cent in the
Japanese Suzuki Motors, the Group hopes to gain access to Suzuki’s lucrative small
vehicle technology in order to improve profitability of the Group’s small vehicle range,
lower manufacturing costs and to strengthen its presence in the fast-growing Indian
market where Suzuki holds more than 50 per cent of the market with its Joint Venture
Maruti-Suzuki. The Group thereby plans to increase its Indian market share to ten per
cent by 2015 and initiated one of the most expensive marketing campaigns in the
country to build up its VW passenger car brand (Economist, 2009a; Fuhrmans, 2009;
Mitra, 2010).
The Group’s push into emerging markets is also reflected in its investment plans
in China, where it is currently the market leader. Since its entry in 1984 as the first
European car producer, the Group maintains two Joint Ventures in China with Shanghai
Volkswagen Automotive Co. and FAW-Volkswagen Co. (Rauwald, 2010). To capture
more sales in the emerging markets including Russia, the Group is currently expanding
its product line-up, dealerships and retail networks in situ (Bidder, 2009; Mitra, 2010;
Welch, 2010).
The US market bears further growth potential for the Group, where it is
currently selling fewer vehicles than KIA or Subaru with sales of passenger cars
63
accounting to less than 100,000 units in 2009 (Wall Street Journal Online, 2010). The
Group announced the ambitious plan to increase their current sales figures to 800,000
units by 2018 (McGirt, 2010). Hereby, one of the main challenges will be the
improvement in affordability and customer orientation of their cars. These deficits and a
malposition of the VW brand were responsible for the company’s huge struggle in the
US market until today (Kiley & Edmondson, 2007; Vasilash, 2006; Welch, 2010). Even
though VW’s brand awareness among American consumers is quite high thanks to the
legacy of the VW Beetle, it is still perceived as a young and quirky brand targeting
younger audiences. To change customer’s perception and raise their model awareness,
the company introduced its new ‘Punch dub’38 campaign that was first screened during
the Super Bowl last year (Marketing Business Weekly, 2010).
In 2009, the VW brand occupied the 55th spot in the ranking of best global
brands published by Interbrand loosing two places in comparison to 2008, while Audi
and Porsche were ranked 65th and 75th. Competitors like Toyota, Honda and Ford are far
ahead (Interbrand, 2010).
Like most German carmakers, the Group relies less on cunning marketing
activities as many competitors, but rather on its technological prowess true to Audi’s
slogan ‘Vorsprung durch Technik’ (engl. ‘leading through technology’), which often
leads to the perception of German cars being over engineered (Milne, 2007). In 2009,
the Group’s selling expense ratio, for example, amounted to 10 per cent of total sales
slightly increasing from 7.7 per cent in 2008, and is herewith still far lower than
HKAGs.
Moreover, the technological prowess and sophistication paired with the
reputation of producing high-quality cars with a long durability reduces the depreciation
of vehicles thus maximising their resale value. In this vein, the sale of used cars
constitutes a major pillar in the Groups marketing strategy (Volkswagen AG, 2010a).
V.2.2.6. Organisational structure
The two latest Group acquisitions with an overall value of USD 6.9 billion have a deep
impact on the financial capabilities of the Group. In order to offset the purchases and
stabilise their credit ratings, the Group issued new preference shares39 worth USD 5
billion at the beginning of 2010 (Schäfer, 2010b). The Group’s current credit ratings by 38 “Punch dub” thereby refers to an old kids’ game called “Punch bug” in which a friend slugs the other upon first sight of a Beetle. In the Punch Dub commercials friends slug each other upon sight of any VW model. 39 In contrast to common stock, preference shares enjoy priority dividend payments, but do not implicate voting rights for the shareholder.
64
S&P and Moody’s are A- and A3 respectively, and thus stable above average
(Volkswagen AG, 2010a). After the completion of the Porsche merger the Group’s
CEO Winterkorn expects the operating profit to rise by USD 867 million annually, thus
vigorously enhancing the company’s financial capabilities (BMI, 2010).
Furthermore, with the worldwide growth and expansion of the Group, the
company is getting harder to manage despite the independency and managerial
autonomy of each brand (Welch, 2010). According to business analyst Datamonitor, for
example, the Group shows relatively low employee productivity in comparison to major
competitors. While the Group’s revenues per employee in 2009 stood at USD 398,091,
competitors such as BMW, Toyota, Ford and Hyundai were more productive with
revenues per employee around USD 600,000 or more, bespeaking operational
inefficiencies at the VW Group (Datamonitor, 2010b).
VI. DISCUSSION
Embedded into the market context, the in-depth case studies conducted in Chapter 5
served as a snapshot of the companies’ current competitive strategies and highlighted
their strengths and weaknesses along their value chains which are summarised in Table
3. Thereby significant differences can be observed.
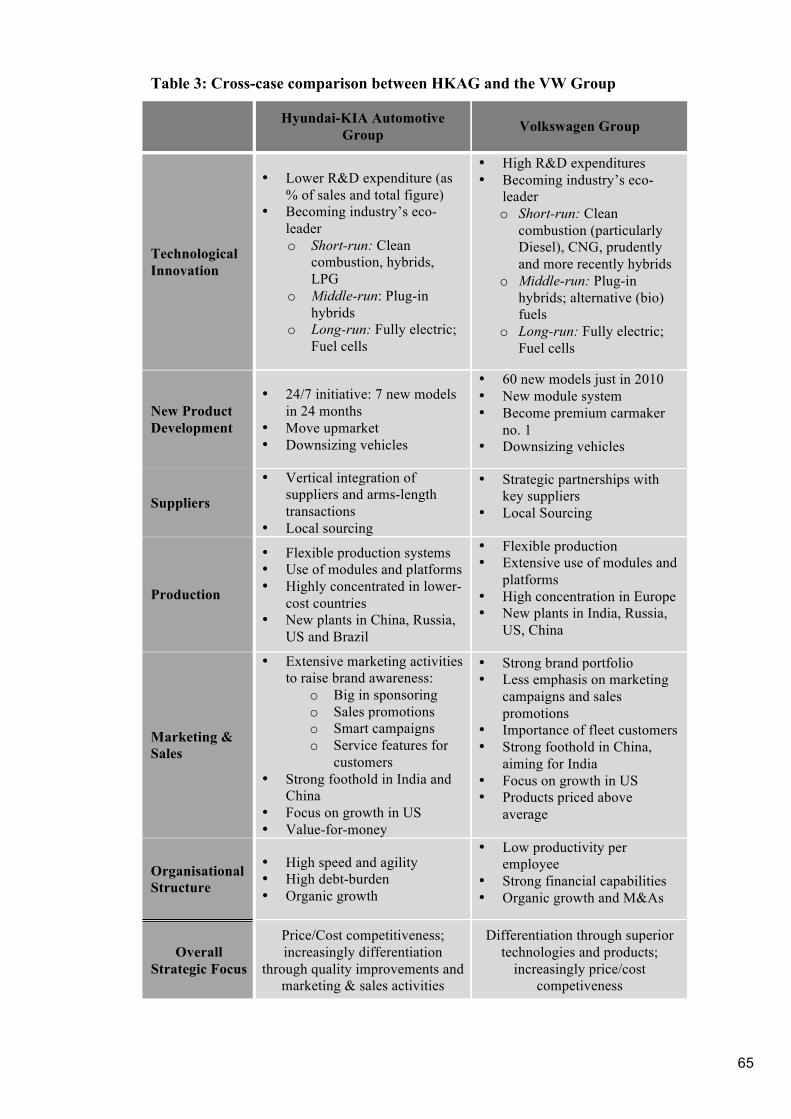
65
Table 3: Cross-case comparison between HKAG and the VW Group
Hyundai-KIA Automotive Group Volkswagen Group
Technological Innovation
• Lower R&D expenditure (as % of sales and total figure)
• Becoming industry’s eco-leader o Short-run: Clean
combustion, hybrids, LPG
o Middle-run: Plug-in hybrids
o Long-run: Fully electric; Fuel cells
• High R&D expenditures • Becoming industry’s eco-
leader o Short-run: Clean
combustion (particularly Diesel), CNG, prudently and more recently hybrids
o Middle-run: Plug-in hybrids; alternative (bio) fuels
o Long-run: Fully electric; Fuel cells
New Product Development
• 24/7 initiative: 7 new models in 24 months
• Move upmarket • Downsizing vehicles
• 60 new models just in 2010 • New module system • Become premium carmaker
no. 1 • Downsizing vehicles
Suppliers
• Vertical integration of suppliers and arms-length transactions
• Local sourcing
• Strategic partnerships with key suppliers
• Local Sourcing
Production
• Flexible production systems • Use of modules and platforms • Highly concentrated in lower-
cost countries • New plants in China, Russia,
US and Brazil
• Flexible production • Extensive use of modules and
platforms • High concentration in Europe • New plants in India, Russia,
US, China
Marketing & Sales
• Extensive marketing activities to raise brand awareness:
o Big in sponsoring o Sales promotions o Smart campaigns o Service features for
customers • Strong foothold in India and
China • Focus on growth in US • Value-for-money
• Strong brand portfolio • Less emphasis on marketing
campaigns and sales promotions
• Importance of fleet customers • Strong foothold in China,
aiming for India • Focus on growth in US • Products priced above
average
Organisational Structure
• High speed and agility • High debt-burden • Organic growth
• Low productivity per employee
• Strong financial capabilities • Organic growth and M&As
Overall Strategic Focus
Price/Cost competitiveness; increasingly differentiation
through quality improvements and marketing & sales activities
Differentiation through superior technologies and products;
increasingly price/cost competiveness
66
As depicted in the literature review, latecomer firms are often inferior to
established market actors in various areas. For HKAG, this is still true for its
technology. While the VW Group launched its first hybrid concepts already in the late
80s/beginning of the 90s with the Audi Duo Hybrid in 1989 and the VW Hybrid Golf in
1993, HKAG just started to step up its research activities by that time (Hyundai Motor
Company, 2010o; Volkswagen AG, 2010b). Although HKAG caught up quickly and is
almost head to head with its competitors, lower R&D expenditures and the head start of
the VW Group still leave a minor technological gap. Yet, HKAG’s technological
leapfrog in the last years reveals the company’s capabilities and with the launch of
several new vehicles in the next years featuring the newest technologies, the company
will close the gap really soon. Both companies also committed themselves to become
the industry’s eco-leader in the near future. In the pursuance of this goal HKAG is
focusing more on hybrid technologies and alternative fuels such as liquefied petroleum
gas, while the VW Group spurs the dispersion of diesel technologies and alternative
fuels such as compressed natural gas40 and bio fuel. More recently though, the VW
Group started to embrace hybrid technologies as an intermediate step to its ultimate
aim, the full electrification of vehicles (Zoia, 2010). According to a study conducted by
A.T. Kearney, the costs of diesel and hybrid vehicles for car owners will become almost
alike and competitive with conventional gasoline and liquefied petroleum gas engines
by 2020, while natural gas engines will be the most competitive option. Thus, both
companies are in a good competitive position for the future technology-wise. In the
long-term, both manufacturers concentrate on electric vehicles and fuel cells, where
prospects for electric vehicles are far more promising than for fuel cells as these still
imply various technical challenges such as storing hydrogen and operating in cold
temperatures due to water contents that may solidify41. In addition, the recharging
infrastructure for electric vehicles is less expensive, quicker and easier to implement
than hydrogen refuelling stations (Klink, Rings, Gifford, & Krubasik, 2009).
Interestingly, HKAG does not seem to rely as much on external research partnerships as
the VW Group, but rather prefers to develop most of its technologies in-house these
days. Notwithstanding HKAGs increase in R&D expenditure over the past years and
lower engineering costs, according to auto specialist Jae Woo from fund management
40 Compressed natural gas (CNG) is commonly agreed to be safer, offering lower emissions, better fuel-economy and can be found in a higher abundance than liquified petroleum gas (LPG) (National Petroleum News, 1993). 41 Despite the technical challenges, further concerns exist about the actual “eco-friendliness” of hydrogen as its production usually involves other power sources which can range from coal, gas, hydro-power to biomass.
67
Orbis Investment “with [HKAG] trying to address technical challenges on all fronts its
resources will be thinly distributed” (Ihlwan, 2008d).
In terms of new product developments, the companies follow similarly
aggressive strategies with an offensive product line-up extension in the next few years.
Platforms and modularisation thereby play a vital role in both companies. Nonetheless,
with the development of a new modular transverse matrix system the VW Group
expanded its possibilities of common platforms across a wider range of vehicles, again
showing its outrider position in this area. Both companies also concentrate on
downsizing their vehicles and engines in order serve current customer demand trends
and increase their competitiveness in the emerging markets. With the expansion of their
production and research facilities in these markets, they are also establishing closer
proximity to customers and reduce costs through local sourcing. HKAG’s legacy as a
provider of small, low-priced entry-level cars can hereby be advantageous for capturing
emerging markets. On the other hand, the VW Group reacted with the recent purchase
of a minor stake in Suzuki Motors, which represents one of the most profitable
producers of small cars in the world in the hope to gain access to its small car
technology (Economist, 2009a). HKAG is also continuing its move upmarket, while the
VW Group tries to further enhance its position in the premium segment with Audi’s aim
to become the largest premium carmaker by 2015.
Regarding suppliers, the HKAG has cost advantages through arms-length
transactions and vertical integration of suppliers like Hyundai Mobis, Hyundai Rotem
and steel producer Hyundai Steel. In addition, both companies rely on local sourcing
strategies to gain further cost advantages. Even though, the VW Group increased its
procurement from lower cost countries in Asia, its sourcing is still highly concentrated
in Europe; leaving HKAG with a cost advantage over the VW Group.
As to the production of vehicles, the two companies are trying to reduce costs
and increase production flexibility in order to adapt production to current demand trends
through the implementation of module and platforms, as well as improved flexible
process technologies. However, the VW Groups strength in modularisation and
platforms may give it an advantage over HKAG whose major strength still lies in lower
material and labour unit costs at its production sites.
Regarding marketing and sales activities, HKAG continues its catch-up quest.
With aggressive initiatives, HKAG tries to raise brand awareness among consumers and
to get rid of its cheap carmaker image in order to be perceived as an innovative
mainstream volume player. In the last years, the company also spent huge amounts in
68
promotional activities to catalyse sales. With offerings priced far below those of the
VW Group, HKAG is still betting on price competitiveness and value-for-money, thus
matching the current demand trends. In contrast, the VW Group relies more on the
technological prowess of its products.
Despite HKAG’s marketing supremacy outflanking the VW Group, both
companies see their biggest growth potential in the emerging markets and channelize
their efforts in this direction. Until now, the VW Group dominates the Chinese market
among foreign carmakers although its market share significantly decreased over
successive years with the entry of new competitors from its high of over 50 per cent by
the end of 2000 (Murphy, 2003). HKAG’s stronghold on the other hand is India. But
with HKAG steadily gaining market share and stepping up its efforts in China, the VW
Group has to be prepared for fierce rivalry.
Both companies also try to increase their presence in the US, which is the
world’s second biggest car market after China. With 4.7 per cent of the passenger
vehicle market HKAG so far holds a greater share than the VW Group with just 2.2 per
cent (Wall Street Journal Online, 2010). Moreover, the VW Group tries to capture the
diesel weary US market with the introduction of new fuel-efficient diesel models, which
may disadvantage the VW Group in comparison to its competitors that try to penetrate
the market with new hybrid models instead (Rauwald, 2008; Ward's Auto World, 2009).
Considering the organisational structures of those two companies, two
significant differences arise. While HKAG’s great advantage is its speed and agility,
enabling it to quickly adjust to current market movements and developments, the VW
Group’s major strength remains a stronger financial muscle in comparison to the highly
debt-burdened HKAG. Consequently, HKAG is favouring organic growth, while
mergers and acquisition play a vital role in the expansion strategy of the VW Group.
All in all, evidence suggests that the VW Group is carving its competitive
advantage from superior technology and products and thus to a greater extent from
differentiation, while HKAG’s strengths still lies in its price and cost competitiveness of
good quality vehicles combined with extensive marketing efforts that increase exposure
and consideration by customers. In this regard, HKAG is following a similar pattern as
nowadays industry leader Toyota decades ago (Halliday, 2009). Shankar, Carpenter and
Krishnamurthi (1998) describe two ways for late entrants to outsell pioneering
companies. First, by identifying a superior product position, undercutting pioneers’
prices and out-advertise or out-distribute the pioneer. Second, by beating the pioneer
through innovation where the innovative late entrant will affect the diffusion and
69
marketing spending effectiveness of the pioneer leading to its own faster growth while
slowing down the growth of the pioneer. While HKAG is still following the first route,
with its strong dedication to R&D it will likely outpace its competitors in the near future
in terms of innovativeness. The development of its own proprietary hybrid and fuel cell
architectures are first signs in that direction.
Nonetheless, due to the changes in customer demand and the growth
opportunities in the emerging markets, the VW Group is striving to improve the cost
competitiveness of its products. Conversely, HKAG is currently more focusing on the
differentiation of its products with the aim to increase its market share and profits.
While HKAGs operating profit margin in 2008 (2007) was 3.8 (4.1) per cent the VW
Group’s margin was considerably higher at 5.6 (5.6) per cent. Similarly, HKAG’s net
profit margins the same year added up to 1.1 (2.3) per cent in contrast to VW Group’s
4.1 (4.1) per cent, thus reflecting HKAG’s lower pricing strategy and strong cost control
(Hyundai Motor Company, 2009a; Volkswagen AG, 2010a). In other words, while
HKAG is concentrating on its upstream activities, the VW Group is placing more
emphasis on its downstream activities. In this sense, the strategies of the two automobile
producers are convergent, with HKAG veering away from a pure cost leadership
strategy to a differentiation strategy and the VW Group from a differentiation strategy
to a more cost-oriented one. As forecasted by Proff (2000), these so-called hybrid
strategies that combine the advantages of lower costs and differentiation, are gaining
importance in the automotive industry as the pressure of international competition
increases with newly emerging carmakers transforming from pure value-for-money to
premium producers. In order for German carmakers to survive in the future these hybrid
strategies become inalienable, especially in the middle-level segment. Nonetheless,
opportunities for pure differentiation strategies will most likely remain in shrinking
upper-level segments where quality, country-of-origin and autonomy of vehicle
concepts are the decisive purchase factors and where premium prices signal prestigious
purchases (Proff, 2000).
VII. CONCLUSIONS
Given the latest success of Korean car manufacturers, the aim of this dissertation was to
depict the driving forces behind the rise and to evaluate their competitive position in
comparison with German car manufacturers. Therefore relevant literature on
competitiveness and the late industrialisation was reviewed in order to reveal the
70
latecomer’s shortcomings such as lack of resources, knowledge and capabilities. In the
next step, possible strategies to overcome these obstacles by latecomers were presented.
Congruent with the literature, the findings of the HKAG case study revealed that the
main components in Korean car manufacturers catch-up quest constituted strong
governmental support coupled with intensive learning and leveraging processes from
linkages with their advanced competitors and thus a strong absorptive capacity, which
paved their way from contract manufacturers (OEM) to technologically independent
OBM manufacturers. Other crucial ingredients were the strong focus on international
markets especially emerging economies despite the hammerlock on the domestic
market, as well as the enormous intensification of R&D activities, tremendous
improvements in quality and strong leadership with the vision to become major players
in the near future.
While South Korean car manufacturers heavily rely on lower cost opportunities
offered at home and other emerging economies (their major export hubs) to penetrate
international markets with price competitive products, they are simultaneously working
with full speed on the differentiation of their offerings, which threatens established
industry forces. When asking Japanese manufacturers which competitors they fear most,
the common answer is South Koreans (Economist, 2010b). In fact, while Japanese car
manufacturers were able to establish themselves in second stage after the American and
European producers through knowledge transfer and continuous improvements in all
areas, the South Koreans initiated the third stage in the industry. And given the similar
path followed by Chinese car manufacturers with the exploitation of resources and
knowledge through formerly governmentally enforced Joint Ventures with advanced
partners, their dominance in the growing domestic market, the surge in quality and
internationalisation combined with lower costs; aspiring competitors from China are
already introducing the fourth stage and will most likely be joined by Indian car
producers in the near future (Bhattacharya & Michael, 2008; Bremner, et al., 2005;
Spitzer, 2009).
By comparing the South Korean carmakers with the German competitors, their
distinctive capability in form of a superior cost structure through ‘lean enterprises’ as a
combination of low material and labour costs, flexible demand-driven manufacturing
and organisational efficiency allowing greater agility became evident. It was not least
this capability and its customer–centricity that scored the South Koreans a strong
recession performance with the right offerings in the right markets at the right time –
namely affordable vehicles of good quality and superior service offers (Spitzer, 2009).
71
From this point of view, the Koreans seem to have the right mix of value and price for
capturing the potential in emerging markets and current trends in consumer demand
further. Regarding their technology the Korean car manufacturers are on their best way
to compete on equal terms with established industry players, but in order to stay
profitable they will have to gradually increase its prices in the long-term, especially
with the technological challenges ahead in developed countries. For premium carmakers
with less price sensitive clientele and a high percentage of fleet customers it is easier to
charge premiums for green technologies than it is for low cost competitors (Klink, et al.,
2009). Yet, it has to be awaited whether the Koreans can manifest themselves as a
premium force in the industry, which not least depends on the acceptance of customers.
Until now the Koreans are faring well in this undertaking with swift changes in
consumer demographics and advances in brand awareness, but it will still take much
more time to establish the desired premium brand and a national image, which is
associated with technologically advanced and innovative products of high-quality. In
this context, the inaugurated Presidential Council Nation Branding initiative in 2009 is a
step in the right direction in order to promote a positive and desirable foreign perception
of South Korea’s national image (Graves, 2010).
In contrast, German car producers will have to work even harder to differentiate
their products from the offerings of low-cost competitors in order to justify their
premium prices as some differentiators such as reliability, vehicle lifetime and comfort
features become less significant or disappear while low-cost competitors move up the
learning curve (Oxyer, Shivaraman, Gosh, & Pleines, 2009). By the same token, it is
important for German carmakers to watch the moves of low-cost competitors closely, as
complacency produces blind spots that may leave incumbents vulnerable and delay
responses (Kumar, 2006; Morehouse, O'Meara, Hagen, & Huseby, 2008; Ryans, 2010).
One major challenge for German carmakers’ mass volume vehicles will be their
affordability. This requires better cost structures that may imply further offshoring, even
though German carmakers are already stepping up the production in emerging markets.
Moreover, with the expected prosperity in emerging economies and the stagnation of
growth in developed countries, carmakers around the world are racing for the
development of ultra-low cost cars. It is equally important for German carmakers to get
involved in the low-cost car segment with the development of lower cost technologies
besides existing and new technologies, but without cannibalising existing products. To
meet the required cost structures, closer cooperation with suppliers and other car
manufacturers and the consultation of experienced engineers in emerging markets with
72
a low-cost, no frills mindset may be required. In the long-term, the new knowledge
gained from this segment should be transferred to the existing portfolio to increase their
competitiveness further (Oxyer, et al., 2009).
Yet, it remains to be seen which competitors will be better positioned for the
future. The growing trend for environmental sustainability and the uncertainty about
which green power trains will lead the way into the future, imply risky investments and
leave room for a lot of venture. Despite forecasts, which anticipate traditional
combustion engines’ predominance until 2020, it is certain that sustainable mobility
represents the future of the automobile industry and that it will lead to profound changes
in the competitive landscape. While power trains, for example, still constitute an
integral part of manufacturers value-add, new alternative drive trains such as electric
motors and batteries are rather unknown territories for car manufacturers resulting in a
high dependence on suppliers. One way of securing competitive advantages and value-
added hereby, are through strategic partnerships with key suppliers. Whether vertical
integration will be beneficial or not has to be awaited yet. In chorus these new
technologies will further complicate and extend carmakers’ range of models, R&D and
production, which will pose additional challenges for car manufacturers requiring
further standardisation and an even more extensive use of platforms. Even though the
shift to green technologies will occur more slowly in the emerging markets, tendencies
to establish CO2 limits in China, Russia and India by 2020 are looming. China further
plans to discard their fuel subsidies soon, which will further accelerate the uptake of
green fuel-efficient vehicles (Klink, et al., 2009). For carmakers from emerging
markets, this may constitute a major opportunity to tap latest technologies, thus
speeding up their technological trajectory and leapfrog some stages. Simultaneously,
they can also profit from ‘early mover’ advantages by already building up necessary
business structures such as suppliers, up-to-date production facilities and infrastructural
amenities (see Nidumolu, Prahalad, & Rangaswami, 2009). Combined with favourable
cost structures this may increase their future competitiveness in the industry
Last but not least, it became evident during this dissertation that national
governments had and will still have an incremental influence on the competitive
environment in the automobile industry and thus the competitiveness of firms in the
form of new regulations, tax legislations, the proliferation of free markets and trade, the
financial support of industry participants, the support of research activities in the area of
environmental-friendly technologies and not least the proliferation of necessary
infrastructures for the diffusion of new technologies since natural gas, plug in-hybrid,
73
electric and fuel cell vehicles, all require the establishment or the enlargement of
existing refuelling/recharging networks. Close cooperation with governments will
therefore be adjuvant to anticipate future developments and promote the dispersion of
various technologies, not least through purchase-price subsidies and favourable tax laws
(ACEA, 2009; Klink, et al., 2009).
All in all, South Korean and German car manufacturers are both on the right
track to prepare themselves for the new challenges ahead, which will certainly
restructure the industry, and most likely lead to a surge in mergers and acquisitions
(PricewaterhouseCoopers, 2010b).
VIII. LIMITATIONS AND FURTHER RESEARCH
Like most empirical researches, this study is also subject to several limitations. As
previously discussed, one of the major criticisms of case study research represents the
generalisability of results based on single cases. Despite the selection of representative
or typical cases with the largest car manufacturers from both countries, particular
differences among firms in scale, strategic orientation and positioning make it difficult
to draw general conclusions for all manufacturers from the said countries and may thus
decease the external validity of results. While HKAG, for example, showed strong
performances over the past years, other producers such as Ssangyong, the smallest
Korean carmaker and the third largest producer GM Daewoo did not fare equally well.
Ssangyong even had to seek receivership in 2009 and GM Daewoo is in a similar
precarious financial situation that stems from tremendous global losses of its giant
parent GM, which took over the Korean car manufacturer in 2002 and ever since sells
most of the Daewoo range under its other badges like Chevrolet and Buick amongst
others (Ihlwan, 2009; Song, 2009). Similarly, the VW Group is the only German car
manufacturer that targets the mass volume market. Other car producers such as BMW,
Daimler and Porsche solely focus on the premium segment, which may result in
different strategic and thus competitive implications. Nevertheless, the trends in the
industry particularly towards smaller and ‘greener’ vehicles will not spare them
affecting their earnings and will thus require responses in form of cost savings amongst
others (Hawranek, 2009).
In addition, the lack of a unitary concept to assess competitiveness and its
complexity allows for a broad leeway of categories and dimensions to consider, thus
questioning the construct validity of the measurements taken. To increase the construct
74
validity in this dissertation, measures were derived from the analysis of market contexts
and were subsequently compared with expert opinions from previous studies on the
global automobile industry. Nevertheless, certain subjectivity biases towards the
categories chosen cannot be completely ruled out and other constructs may have led to
different results.
As mentioned earlier the same criticism is applicable to the selection and
processing of data. However, were possible the author tried to reduce these biases and
increase the validity of information by choosing objective sources and the triangulation
of data. Another problem during this dissertation partially constituted the availability of
data. While competitiveness data of firms can be inexhaustible, it is in many cases also
difficult to attain since organisational data and information is often confidential and not
exposed to the public. Given the reliance on archival and documentary data, another
weakness of this dissertation constitutes the lack of internal organisational insights,
which were unfortunately refused to the author.
Last but not least, the limited scope of this dissertation posed some constraints
on the coverage of the analysis resulting in the analysis of only two cases and a
prioritization of certain factors leading to the negligence of other important categories
like human resource management and corporate governance amongst others. In the past,
the case company HKAG, for example, suffered in particular from difficult labour
relations, strikes and rigid unions that deteriorated its competitive position, despite a
corruption scandal were charges were pressed against HKAG’s chairman (Economist,
2007b; Gulati, 2010; Song, 2006; Song & Minder, 2008). On other hand, this leaves
opportunities for further research with the inclusion of more cases and other
competitiveness factors.
Moreover, given certain differences in the paths followed by latecomers in their
catch-up process, comparisons with other latecoming firms would be of particular
interest to describe best practices. HKAG for example failed several times to emulate
the successful Japanese business model characterised by lean production, horizontally
integrated businesses (so-called keiretsus), stakeholder-dominated corporate
governance, intimate supplier relations and sophisticated mechanisms to acquire and
upgrade labour skills. Instead, it found its own way, which is frequently entitled as
‘Fordism light’ including governmental support, lesser sympathy for unions and
workers, virtual immunity to local politics and interests of small firms, as well as the
vertical integration of businesses and a strict top-down control (Noble, 2010).
75
Last but not least, to increase the transparency in competitiveness analysis and
facilitate the comparison and benchmark among firms, industries or nations; a clear
definition and uniform framework for competitiveness that combines all different
conceptual streams is needed. Future research on these issues will thus require
interdisciplinary approaches and the collaboration of scholars from various areas such
as economics, international business, organisational management and operations, just to
name a few.
76
REFERENCES
Abegaz, B. (2005). The diversified business group as an innovative organisational
model for large state-enterprise reform in China and Vietnam. International
Journal of Entrepreneurship & Innovation Management, 5(5/6), 379-400.
Akamatsu, K. (1962). A historical pattern of economic growth in developing countries.
The Developing Economies, 1(1), 3-25.
Alberts, H. R. (2009). Hyundai Plans Third China Factory. Forbes.com. Retrieved from
http://www.forbes.com/2009/11/26/hyundai-third-factory-beijing-autos-
china.html
Ambastha, A., & Momaya, K. (2004). Competitiveness of Firms: Review of Theory,
Frameworks, and Models. Singapore Management Review, 26(1), 45-61.
Ambrosini, V., & Bowman, C. (2009). What are dynamic capabilities and are they a
useful construct in strategic management? International Journal of Management
Reviews, 11(1), 29-49.
Amend, J. (2008, August 1). VW Closer to Automated Driving. Ward's Auto World,
44(8), 20-21.
Amit, R., & Shoemaker, P. (1993). Strategic assets and organization rents. Strategic
Management Journal, 14(1), 33-46.
Amsden, A. H. (1995). Like The Rest: South-East Asias 'Late' Industrialization. Journal
of International Development, 7(5), 791-799.
Barney, J. (1986). Types of Competition and the Theory of Strategy: Toward an
Integrative Framework. Academy of Management Review, 11(4), 791-800.
Barney, J. (1991). Firm Resources and Sustained Competitive Advantage. Journal of
Management, 17(1), 99-120.
Barney, J. (1995). Looking inside for competitive advantage. The Academy of
Management Executive (1993-2005), 9(4), 49-61.
Barney, J., Wright, M., & Ketchen, D. J. (2001). The resource-based view of the firm:
Ten years after 1991. Journal of management, 27(6), 625-642.
Bensoussan, B., & Fleisher, C. S. (2009). The Financial Times Guide to Analysis for
Managers: Effective Planning Tools & Techniques: Prentice Hall.
Berret, M. (2005, December). Reductions & Relocations: The Suppliers' Challenges.
Automotive Design & Production, 117(12), 18-20.
Bhattacharya, A. K., & Michael, D. C. (2008). How Local Companies Keep
Multinationals At Bay. Harvard Business Review, 86(3), 84-95.
77
Bidder, B. (2009). Volkswagen's Big Russian Dreams. Spiegel Online. Retrieved from
http://www.businessweek.com/globalbiz/content/oct2009/gb20091021_304424.
htm
Bremner, B., Kerwin, K., Roberts, D., & Edmondson, G. (2005, May 26). Here Come
Chinese Cars. BusinessWeek(3936), 34-37.
Bryman, A., & Bell, E. (2007). Business research methods (2nd ed.). New York:
Oxford University Press.
Buckley, J. (2009, May/June). Korea's flexible carmakers. Automotive Manufacturing
Solutions, 18-23.
Buckley, P., Pass, C., & Prescott, K. (1988). Measures of international competitiveness:
a critical survey. Journal of Marketing Management, 4(2), 175-200.
Business Monitor International. (2010). Germany Autos Report Q2 2010: Business
Monitor International Ltd. (BMI).
Businessline. (2009, November 18). Hyundai too joins compact car race. Businessline.
Businessline. (2010, March 23). Hyundai to shift some i20 production to Turkey.
Businessline.
Cartwright, W. R. (1993). Multiple linked 'diamonds' and the international
competitiveness of export-dependent industries: the New Zealand experience.
Management International Review, 55-70.
Central Intelligence Agency. (2009). The World Factbook - South Korea. Retrieved
26.10.2009, from https://www.cia.gov/library/publications/the-world-
factbook/geos/ks.html
Chaffin, J. (2009, July 2). WTO sees global increase in protectionism. Financial Times,
p. 6.
Chang, S. (2006). Business groups in East Asia: Post-crisis restructuring and new
growth. Asia Pacific Journal of Management, 23(4), 407-417.
Chang, S., & Hong, J. (2000). Economic performance of group-affiliated companies in
Korea: Intragroup resource sharing and internal business transactions. Academy
of Management Journal, 43(3), 429-448.
Chao, J. (1998). Factors affecting the competitiveness of China-based companies.
Competitive Intelligence Review, 9(3), 39-44.
Child, J., & Rodrigues, S. B. (2005). The Internationalization of Chinese Firms: A Case
for Theoretical Extension? Management & Organization Review, 1(3), 381-410.
78
Cho, D., Kim, D., & Rhee, D. (1998). Latecomer strategies: evidence from the
semiconductor industry in Japan and Korea. Organization Science, 9(4), 489-
505.
Choe, S., & Pattnaik, C. (2007). The transformation of Korean business groups after the
Asian crisis. Journal of Contemporary Asia, 37(2), 232-255.
Choi, W., & Bok, D.-K. (2009). Hyundai Genesis: Taking the Korean Car to the Next
Level. SERI Quarterly, 2(3), 84-93.
Clark, J., & Guy, K. (1998). Innovation and competitiveness: A review. Technology
Analysis & Strategic Management, 10(3), 363-395.
Cohen, W. M., & Levinthal, D. A. (1990). Absorptive capacity: a new perspective on
learning and innovation. Administrative Science Quarterly, 35(1), 128-152.
Collis, D. (1994). Research note: how valuable are organizational capabilities? Strategic
Management Journal, 15(8), 143-152.
Consumer Reports. (2010). Rating the carmakers. Consumer Reports, 75(4), 14-17.
Courtenay, V. (2006, April 1). Hyundai Cutting Costs. Ward's Auto World, 42(4), 44-
45.
Daniel, D. R. (1961). Management information crisis. Harvard Business Review, 39(5),
111-121.
Datamonitor. (2009a). New Car Sales Industry Profile: China: Datamonitor Plc.
Datamonitor. (2009b). New Car Sales Industry Profile: India: Datamonitor Plc.
Datamonitor. (2010a). Automobiles Industry Profile: Global: Datamonitor Plc.
Datamonitor. (2010b). Volkswagen AG: Datamonitor Plc.
Denzin, N. K. (1978). Sociological Methods: A Sourcebook. New York: McGraw-Hill.
Dolan, M. (2009, August 26). Auto Makers Rethink Luxury Lines. Wall Street Journal,
p. B.1.
Dunning, J. H. (1980). Toward an Eclectic Theory of International Production: Some
Empirical Tests. Journal of International Business Studies, 11(1), 9-31.
Dunning, J. H. (1993). Internationalizing Porter's Diamond. Management International
Review (MIR), 33(2), 7-15.
Economist. (2005, September 10). Extinction of the predator. The Economist,
376(8443), 63-65.
Economist. (2007a, February 24). The big-car problem. The Economist, 382(8517), 81-
83.
Economist. (2007b, January 27). Heading down a dangerous road. The Economist,
382(8513), 67.
79
Economist. (2008, October 11). A new home for the Nano. The Economist, 389(8601),
85.
Economist. (2009a, December 12). Asian alliances; New ties for VW, GM and Peugeot
Citroen. The Economist, 393(8661), 72.
Economist. (2009b, September 5). Charge! The Economist, 392(8647), 21.
Economist. (2009c, March 7). Hyundai's surprising success: Sui Genesis. The
Economist, 390(8621), 65-66.
Economist. (2009d, August 22). My other car firm's a Porsche. The Economist,
392(8645), 57-58.
Economist. (2009e, September 19). Small isn't beautiful. The Economist, 392(8649), 73-
74.
Economist. (2010a, April 3). The chaebol conundrum; South Korea's industrial giants.
The Economist, 395(8676), 14.
Economist. (2010b, April 3). Return of the overlord; South Korea's industrial giants.
The Economist, 395(8676), 71.
Economist Intelligence Unit. (2009a). Germany: Automotive report: Economist
Intelligence Unit (EIU).
Economist Intelligence Unit. (2009b). South Korea: Automotive report: Economist
Intelligence Unit (EIU).
Edmondson, G., Rowley, I., Lakshman, N., Welch, D., & Roberts, D. (2007, April 23).
The race to build really cheap cars. BusinessWeek(4031), 44-48.
Eisenhardt, K. (1989). Building theories from case study research. Academy of
Management Review, 14(4), 532-550.
Eppinger, S. D., & Chitkara, A. R. (2006). The New Practice of Global Product
Development. MIT Sloan Management Review, 47(4), 22-30.
European Automobile Manufacturers Association. (2009). European Automobile
Industry Report 09/10. Brussels, Belgium: European Automobile Manufacturers
Association (ACEA).
European Automobile Manufacturers Association. (2010, June 16). EU - South Korea
Free Trade Agreement. Retrieved 17.06.2010, from
http://www.acea.be/index.php/news/news_detail/free_trade_agreement_with_so
uth_korea/
European Communities Commission. (2009a). Communication from the commission -
"Responding to the crisis in the European automotive industry" (COM(209) 104
final). Brussels: Commission of the European Communities.
80
European Communities Commission. (2009b). European industry in a changing world -
updated sectoral overview 2009 (SEC(2009) 1111 final). Brussels: Commission
of the European Communities.
Farrell, D. (2004). Beyond Offshoring: Assess Your Company's Global Potential.
Harvard Business Review, 82(12), 82-90.
Financial Times. (2009, July 23). Green leanings in Korea. Financial Times, p. 15.
Fleury, A., & Leme Fleury, M. T. (2009). Understanding the strategies of late-movers in
International Manufacturing. International Journal of Production Economics,
122(1), 340-350.
Flint, J. (2008, July 1). The Diesel Dilemma. Ward's Auto World, 44(7), 56.
Flyvbjerg, B. (2006). Five misunderstandings about case-study research. Qualitative
inquiry, 12(2), 219-245.
Forbes, N., & Wield, D. (2000). Managing R&D in technology-followers. Research
Policy, 29(9), 1095-1109.
Forbes, N., & Wield, D. (2002). Managing R&D in Technology-Followers. In
Managing Technology and Innovation: From Followers to Leaders (pp. 109-
137). London: Routledge.
Fortune. (2010). Global 500 by countries: South Korea. Retrieved 01.06.2010, from
http://money.cnn.com/magazines/fortune/global500/2009/countries/SouthKorea.
html
Foster, T., & Klier, T. (2009). Raising automotive fuel efficiency. Chicago Fed
Letter(266), 1-4.
Frink, L. (2008). Hyundai is thinking big with its new i10 minicar. Automotive News
Europe, 13(6), 22-22.
Fuhrmans, V. (2009, December 10). Volkswagen, Suzuki Forge Alliance On Emerging
Markets, Small Cars. Wall Street Journal, p. B.1.
German Association of the Automotive Industry. (2010a). Annual Report 2009. Frakfurt
am Main: German Association of the Automotive Industry (VDA). Retrieved
from
http://www.vda.de/de/publikationen/publikationen_downloads/detail.php?id=63
6
German Association of the Automotive Industry. (2010b). General annual figures.
Retrieved 12.03.2010, from
http://www.vda.de/en/zahlen/jahreszahlen/allgemeines/
81
Gerschenkron, A. (1962). Economic backwardness in historical perspective:
Cambridge, Harvard University Press.
Grant, R. M. (1991a). Porter's competitive advantage of nations': An assessment.
Strategic Management Journal, 12(7), 535-548.
Grant, R. M. (1991b). The Resource-Based Theory of Competitive Advantage:
Implications for Strategy Formulation. California Management Review, 33(3),
114-135.
Grant, R. M. (1996). Toward a knowledge-based theory of the firm. Strategic
Management Journal, 17(Winter Special Issue), 109-122.
Grant, R. M. (2008). Contemporary strategy analysis (6th ed.). Oxford: Blackwell
Publishing.
Grant, R. M. (2008). Ford and the World Automobile Industry. In Cases to Accompany
Contemporary Strategy Analysis (6th ed., pp. 40-57): Blackwell.
Graves, C. (2010, April). Designing a distinctive national brand, in South Korea:
Finding its place on the world stage. McKinsey Quarterly, 6-11.
Green, A. E. (1992). South Korea's Automobile Industry: Development and Prospects.
Asian Survey, 32(5), 411-428.
Greenlees, D. (2004, August 28). Korea Wows The World. Far Eastern Economic
Review, 167(34), 40-43.
Gulati, N. (2010). Hyundai Hit by Strike in India. Wall Street Journal Online. Retrieved
from
http://online.wsj.com/article/SB100014240527487033039045752924719786742
94.html
Halliday, J. (2009, November 9). Marketer of the year: Hyundai. Advertising Age,
80(38), 1-3.
Hamel, G., & Prahalad, C. K. (2005). Strategic intent. Harvard Business Review,
83(7/8), 148-161.
Hansen, G., & Wernerfelt, B. (1989). Determinants of firm performance: The relative
importance of economic and organizational factors. Strategic Management
Journal, 10(5), 399-411.
Haugh, D., Mourougane, A., & Chatal, O. (2010). The Automobile industry in and
beyond the crisis [Working Paper]. OECD Economics Department,
ECO/WKP(2010)1, 1-36.
82
Hawranek, D. (2009). The Luxury Trap - Mercedes, BMW Struggle as Car-Buyers
Downsize. Spiegel Online International. Retrieved from
http://www.spiegel.de/international/business/0,1518,649146,00.html
Hill, C. (1995). National institutional structures, transaction cost economizing and
competitive advantage: The case of Japan. Organization Science, 119-131.
Hobday, M. (1995). East Asian latecomer firms: Learning the technology of electronics.
World Development, 23(7), 1171-1193.
Hobday, M. (1998). Latecomer catch-up strategies in electronics: Samsung of Korea
and ACER of Taiwan. Asia Pacific Business Review, 4(2), 48-83.
Hyundai Motor Company. (2007, March 15). Hyundai and Infineon enter strategic
cooperation and inaugurate joint innovation center [Press Release]. Retrieved
11.05.2010, from http://worldwide.hyundai.com/company-overview/news-
view.aspx?idx=37&nCurPage=6&strSearchColunm=&strSearchWord=&ListNu
m=7
Hyundai Motor Company. (2008, December 5). Hyundai's new Tau V-8 named to
Ward's '10 Best Engine's list [Press Release]. Retrieved 11.05.2010, from
http://worldwide.hyundai.com/company-overview/news-
view.aspx?idx=133&nCurPage=&strSearchColunm=&strSearchWord=&ListNu
m=-114
Hyundai Motor Company. (2009a). Annual Report 2008. Seoul.
Hyundai Motor Company. (2009b, March 11). Equus, Hyundai's new luxury flagship
arrives [Press Release]. Retrieved 11.05.2010, from
http://worldwide.hyundai.com/company-overview/news-
view.aspx?idx=166&&nCurPage=1&strSearchColumn=content&strSearchWord
=equus&ListNum=3
Hyundai Motor Company. (2009c, November 17). Hyundai develops its first gasoline-
direct injection engine [Press Release]. Retrieved 11.05.2010, from
http://worldwide.hyundai.com/web/News/View.aspx?idx=233&nCurPage=1&st
rSearchColunm=&strSearchWord=&ListNum=161
Hyundai Motor Company. (2009d, June 23). Hyundai is the highest ranked non-
premium nameplate in the J.D. Power And Associates Initial Quality Study
[Press Release]. Retrieved 11.05.2010, from
http://worldwide.hyundai.com/web/News/View.aspx?idx=202&nCurPage=1&st
rSearchColunm=&strSearchWord=&ListNum=132
83
Hyundai Motor Company. (2009e, September 9). Hyundai joins industry leaders to
urge action on hydrogen infrastructure [Press Release]. Retrieved 11.05.2010,
from http://worldwide.hyundai.com/company-overview/news-
view.aspx?idx=217&nCurPage=1&strSearchColunm=&strSearchWord=&ListN
um=81
Hyundai Motor Company. (2009f, July 8). Hyundai launches its first HEV, Elantra LPI
Hybrid [Press Releases]. Retrieved 14.05.2010, from
http://worldwide.hyundai.com/web/News/View.aspx?idx=206&nCurPage=1&st
rSearchColunm=&strSearchWord=&ListNum=136
Hyundai Motor Company. (2009g, November 9). Hyundai Motor appoints Havas
Media for media planning & buying [Press Release]. Retrieved 14.05.2010,
from
http://worldwide.hyundai.com/web/News/View.aspx?idx=232&nCurPage=1&st
rSearchColunm=&strSearchWord=&ListNum=160
Hyundai Motor Company. (2009h, October 29). Hyundai opens new R&D center in
Hyderabad [Press Release]. Retrieved 14.05.2010, from
http://worldwide.hyundai.com/company-overview/news-
view.aspx?idx=228&nCurPage=1&strSearchColunm=&strSearchWord=&ListN
um=159
Hyundai Motor Company. (2009i, September 18). Hyundai's global brand ranking rises
[Press Release]. Retrieved 11.05.2010, from
http://worldwide.hyundai.com/company-overview/news-
view.aspx?idx=220&&nCurPage=2&strSearchColumn=content&strSearchWord
=brand&ListNum=62
Hyundai Motor Company. (2010a, April 1). All-new 2011 Sonata adds a second, even
more powerful engine delivering best-in-class horsepower and fuel economy
[Press Release]. Retrieved 11.05.2010, from
http://worldwide.hyundai.com/company-overview/news-
view.aspx?idx=265&&nCurPage=1&strSearchColumn=content&strSearchWord
=sonata&ListNum=52
Hyundai Motor Company. (2010b, February 17). Evolution of Hyundai's fluidic
sculpture continues, as stunning new concept car prepares for Geneva debut
[Press Release]. Retrieved 11.05.2010, from
http://worldwide.hyundai.com/company-overview/news-
84
view.aspx?idx=257&nCurPage=1&strSearchColunm=&strSearchWord=&ListN
um=109
Hyundai Motor Company. (2010c, January 12). Hyundai displays face-lifted Santa Fe
and 'Blue Will' at 2010 Naias in Detroit [Press Release]. Retrieved 11.05.2010,
from http://worldwide.hyundai.com/company-overview/news-
view.aspx?idx=248&nCurPage=6&strSearchColunm=&strSearchWord=&ListN
um=164
Hyundai Motor Company. (2010d, March 8). Hyundai Motor makes donation to
support quake-stricken Chile [Press Release]. Retrieved 11.05.2010, from
http://worldwide.hyundai.com/company-overview/news-
view.aspx?idx=263&nCurPage=1&strSearchColunm=&strSearchWord=&ListN
um=182
Hyundai Motor Company. (2010e, February 3). Hyundai opens micro-site for 2010
FIFA World Cup™ [Press Release]. Retrieved 11.05.2010, from
http://worldwide.hyundai.com/web/News/View.aspx?idx=256&nCurPage=1&st
rSearchColunm=&strSearchWord=&ListNum=173
Hyundai Motor Company. (2010f, April 1). Hyundai Sonata Hybrid debuts at New
Yourk auto show [Press Release]. Retrieved 11.05.2010, from
http://worldwide.hyundai.com/Web/News/View.aspx?idx=264
Hyundai Motor Company. (2010g, February 3). Hyundai Super Bowl advertising
highlights all-new Sonata and Tucson [Press Release]. Retrieved 11.05.2010,
from
http://worldwide.hyundai.com/web/News/View.aspx?idx=255&nCurPage=1&st
rSearchColunm=&strSearchWord=&ListNum=174
Hyundai Motor Company. (2010h, March 2). Hyundai to accelerate European market
expansion through UEFA Eurotop 2010-2017 Sponsorship [Press Release].
Retrieved 11.05.2010, from http://worldwide.hyundai.com/company-
overview/news-
view.aspx?idx=262&nCurPage=1&strSearchColunm=&strSearchWord=&ListN
um=180
Hyundai Motor Company. (2010i, February 24). Hyundai to present eight world debuts
at Geneva [Press Release]. Retrieved 11.05.2010, from
http://worldwide.hyundai.com/company-overview/news-
view.aspx?idx=259&nCurPage=1&strSearchColunm=&strSearchWord=&ListN
um=1
85
Hyundai Motor Company. (2010j, April 23). Hyundai unveils all-new Verna at Beijing
show [Press Release]. Retrieved 11.05.2010, from
http://worldwide.hyundai.com/company-overview/news-
view.aspx?idx=268&nCurPage=3&strSearchColunm=&strSearchWord=&ListN
um=185
Hyundai Motor Company. (2010k, January 29). Hyundai's 2009 global market share
tops 5 pct for the first time [Press Release]. Retrieved 11.05.2010, from
http://worldwide.hyundai.com/company-overview/news-
view.aspx?idx=252&nCurPage=&strSearchColunm=&strSearchWord=&ListNu
m=-40
Hyundai Motor Company. (2010l, May 19). Hyundai's Russia plant on schedule [Press
Release]. Retrieved 11.05.2010, from http://worldwide.hyundai.com/company-
overview/news-
view.aspx?idx=273&nCurPage=1&strSearchColunm=&strSearchWord=&ListN
um=189
Hyundai Motor Company. (2010m, January 27). Hyundai's volunteer program builds
houses, makes donation in Brazil [Press Release]. Retrieved 11.05.2010, from
http://worldwide.hyundai.com/company-overview/news-
view.aspx?idx=251&nCurPage=2&strSearchColunm=&strSearchWord=&ListN
um=170
Hyundai Motor Company. (2010n, March 15). Important News from the World of
Hyundai. Hyundai Motor World, 18(66), 1-12.
Hyundai Motor Company. (2010o). The Road to Sustainability - Hyundai Motor
Company 2009 Sustainability Report. Seoul.
Hyundai Motor Company. (n.d.). Company Website. Retrieved 12.09.2009, from
http://worldwide.hyundai.com
Ihlwan, M. (2008a, January 31). Hyundai Bets Big On India and China. BusinessWeek
Online, 15.
Ihlwan, M. (2008b). Hyundai Rides Demand For Small Cars. BusinessWeek Online.
Retrieved from
http://www.businessweek.com/globalbiz/content/jul2008/gb20080724_659211.h
tm
Ihlwan, M. (2008c, July 28). Hyundai: High Mileage From Pricey Oil.
BusinessWeek(4093), 63.
86
Ihlwan, M. (2008d). Korean Carmaker Hyundai Goes Green. BusinessWeek Online.
Retrieved from
http://www.businessweek.com/globalbiz/content/dec2008/gb20081222_424247.
htm
Ihlwan, M. (2009). GM's Korea Problem. BusinessWeek Online. Retrieved from
http://www.businessweek.com/globalbiz/content/jul2009/gb2009076_342788.ht
m
Ihlwan, M., & Kiley, D. (2009). Hyundai Gains with Marketing Blitz. BusinessWeek
Online. Retrieved from
http://www.businessweek.com/globalbiz/content/sep2009/gb20090917_167667.
htm
Interbrand. (2010). Best global brands - 2009 rankings. Retrieved 01.06.2010, from
http://www.interbrand.com/best_global_brands.aspx
International Organization of Motor Vehicle Manufacturers. (2006). The World's
Automotive Industry - Some key figures. Retrieved 12.10.2009, from
http://oica.net/wp-content/uploads/2007/06/oica-depliant-final.pdf
International Organization of Motor Vehicle Manufacturers. (2009). 2008 Production
Statistics. Retrieved 12.03.2010, from http://oica.net/category/production-
statistics/2008-statistics/
Jackson, K. (2008, Septemebr 1). To give fuel economy a boost, Hyundai spends big on
R&D. Automotive News, 82(6323), 18.
Jick, T. (1979). Mixing qualitative and quantitative methods: Triangulation in action.
Administrative Science Quarterly, 602-611.
Kelly, K. M. (2009, Jul/Aug). Volkswagen Plants Roots in Tennessee. Automotive
Design & Production, 121(7), 14.
Ketels, C. H. M. (2006). Michael Porter's Competitiveness Framework - Recent
Learnings and New Research Priorities. Journal of Industry, Competition &
Trade, 6(2), 115-136.
Khanna, T., & Palepu, K. (1997). Why focused strategies may be wrong for emerging
markets. Harvard Business Review, 75, 41-54.
KIA Motors. (2008, May 6). Microsoft and Hyundai-Kia Automotive Group to develop
next generation of in-car infotainment [Press Release]. Retrieved 12.05.2010,
from http://www.kiamotors.com/about-kia/company/corporate-news-
view.aspx?idx=389&Page=1&s1=3&sv=microsoft
KIA Motors. (2010a). Annual Report 2009. Seoul.
87
KIA Motors. (2010b, February 11). Kia Motors debuts 'Ray' plug-in hybrid concept in
Chicago [Press Release]. Retrieved 12.05.2010, from
http://www.kiamotors.com/about-kia/company/corporate-news-
view.aspx?idx=491&Page=1&s1=3&sv=ray
KIA Motors. (2010c). Kia Motors Sustainability Magazine 2010 - MOVE. Seoul.
Kiley, D., & Edmondson, G. (2007, July 23). Can VW finally find its way in America?
BusinessWeek(4043), 31.
Kim, B., & Lee, Y. (2001). Global capacity expansion strategies: lessons learned from
two Korean carmakers. Long Range Planning, 34(3), 309-333.
Kim, L. (1997). Imitation to Innovation: The Dynamics of Korea's Technological
Learning: Harvard Business School Press Books.
Kim, L. (1998). Crisis construction and organizational learning: Capability building in
catching-up at Hyundai Motor. Organization Science, 9(4), 506-521.
Klink, G., Rings, T., Gifford, D., & Krubasik, S. (2009). Fuel-Thrifty, Clean, Electric -
The race for the powertrain of the future: A.T. Kearney, Inc. Retrieved from
http://www.atkearney.com/images/global/pdf/Fuel-
Thrifty_Clean_Efficient_4.pdf
Kogut, B., & Zander, U. (1992). Knowledge of the firm, combinative capabilities, and
the replication of technology. Organization Science, 383-397.
Korea Auto Industries Cooprative Association. (2010). Auto Parts Import Statistics By
Area And Year. Retrieved 15.06.2010, from
http://www.kaica.or.kr/eng/industry/export.php
Korea Automobile Manufacturers Association. (2010). Reports & Statistics for Korean
Automoible Industry. Retrieved 01.06.2010, from
http://www.kama.or.kr/eng/R&s/Rsoften_e?key=Production
KPMG. (2009a). Carbon dioxide (CO2) legislation for the automotive industry: KPMG
International. Retrieved from
http://www.kpmg.com/NZ/en/IssuesAndInsights/ArticlesPublications/Issues-
monitor-Automotive/Documents/Issues-Monitor-Automotive-April-2009.pdf
KPMG. (2009b). KPMG's Global Auto Executive Survey 2010: KPMG International.
Retrieved from
http://www.kpmg.com/CN/en/IssuesAndInsights/ArticlesPublications/Document
s/Global-Auto-Executive-Survey-2010-O-200912.pdf
Kumar, N. (2006). Strategies to fight low-cost rivals. Harvard Business Review, 84(12),
104-112.
88
Kumar, R., & Chadee, D., &. (2002). International competitiveness of Asian firms: an
analytical framework [ERD Working Paper Series No. 4]. Asian Development
Bank, Economics and Research Department.
Lee, H., & Kim, K. (2009). Analysis of the managerial performance of the Korean auto
parts industry and the establishment of a new growth strategy. e-Kiet Industrial
Economic Information, 449, 1-8.
Lee, K. (2005). Making a Technological Catch-Up: Barriers and Opportunities. Asian
Journal of Technology Innovation, 13(2), 97-131.
Lee, S. M., & Yoo, S. (1987). Management style and practice of Korean chaebols.
California Management Review, 95, 95-110.
Lee, W., & Lee, N. (2007). Understanding Samsung's Diversification Strategy: The
Case of Samsung Motors Inc. Long Range Planning, 40(4-5), 488-504.
Lerner, I. (2009, February 15). Anyong electro-car. ICIS Chemical Business, 275(6),
24-25.
Lu, Y., Tsang, E., & Peng, M. (2008). Knowledge management and innovation strategy
in the Asia Pacific: Toward an institution-based view. Asia Pacific Journal of
Management, 25(3), 361-374.
Marketing Business Weekly. (2010, February 14). Volkswagen of America, Inc.;
Volkswagen to Spotlight 'Punch Dub' Game in Super Bowl Ad, Online
Campaign Touting Product Family. Marketing Business Weekly, 371.
Mathews, J. A. (1998). Fashioning a new Korean model out of the crisis: the rebuilding
of institutional capabilities. Cambridge Journal of Economics, 22(6), 747-759.
Mathews, J. A. (2002). Competitive Advantages of the Latecomer Firm: A Resource-
Based Account of Industrial Catch-Up Strategies. Asia Pacific Journal of
Management, 19(4), 467-488.
Mathews, J. A. (2006a). Catch-up strategies and the latecomer effect in industrial
development. New Political Economy, 11(3), 313-335.
Mathews, J. A. (2006b). Dragon multinationals: New players in 21st century
globalization. Asia Pacific Journal of Management, 23(1), 5-27.
McDermott, M. C. (1997). Korean auto producers: Asia's next major force in Europe.
Management Decision, 35(7), 497-507.
McGirt, E. (2010, February). The Germans Are Coming. Fast Company(142), 74-96.
Miller, K. D., & Reuer, J. J. (1998). Firm strategy and economic exposure to foreign
exchange rate movements. Journal of International Business Studies, 29(3),
493-513.
89
Milne, R. (2007, September 11). Germany relies on 'Vorsprung durch Technik'.
Financial Times, p. 2.
Mitra, K. (2008, September 3). Small Cars Big Promise. Business Today, 17(5), 131-
134.
Mitra, K. (2010, January 24). The challenger. Business Today, 19(2), 70-74.
Moon, H. C., & Peery Jr., N. S. (1995). Competitiveness of product, firm, industry, and
nation in a global business. Competitiveness Review, 5(1), 37-43.
Moon, H. C., Rugman, A. M., & Verbeke, A. (1995). The generalized double diamond
approach to international competitiveness. Research in Global Strategic
Management, 5, 97-114.
Moon, H. C., Rugman, A. M., & Verbeke, A. (1998). A generalized double diamond
approach to the global competitiveness of Korea and Singapore. International
Business Review, 7(2), 135-150.
Morehouse, J., O'Meara, B., Hagen, C., & Huseby, T. (2008). Hitting back: strategic
responses to low-cost rivals. Strategy & Leadership, 36(1), 4-13.
Murphy, D. (2003, March 6). Old Volkswagen chases new China. Far Eastern
Economic Review, p. 26.
National Petroleum News. (1993, August). No confusion over who's ahead in
CNG/LPG race. National Petroleum News (NPN), 85(9), 8.
Nidumolu, R., Prahalad, C. K., & Rangaswami, M. R. (2009). Why sustainability is
now the key driver of innovation. Harvard Business Review, 87(9), 56-64.
Noble, G. W., &. (2010). Fordism Light: Hyundai's Challenge to Coordinated
Capitalism [BRIE Working Paper 186]. The Berkeley Roundtable on the
International Economy.
Nonaka, I. (1994). A Dynamic Theory of Organizational Knowledge Creation.
Organization Science, 5(1), 14-37.
Nonaka, I., & Takeuchi, H. (1995). The knowledge-creating company: How Japanese
companies create the dynamics of innovation. New York: Oxford University
Press, USA.
North, D. C. (1990). Institutions, institutional change, and economic performance. New
York: Cambridge University Press, USA.
Ohnsman, A., & Cha, S. (2009). Hyundai Cost Cuts Spare R&D in Push to Match
Toyota Retrieved 01.06.2010, from
http://www.bloomberg.com/apps/news?pid=20601209&sid=aEzQqbsXUCZE&r
efer=transportation
90
Oliver, C. (1997). Sustainable Competitive Advantage: Combining Institutional and
Resource-based Views. Strategic Management Journal, 18(9), 697-713.
Oxyer, D., Shivaraman, S., Gosh, S., & Pleines, R. (2009). Think Small to Grow: A.T.
Kearney, Inc. Retrieved from
http://www.atkearney.com/index.php/Publications/think-small-to-grow.html
Panzar, J. C., & Willig, R. D. (1981). Economies of Scope. The American Economic
Review, 71(2), 268-272.
Patton, D. (2008). Car Review; Volkswagen Jetta TDI; German Auto Maker's Diesel
Models Make a Return to the U.S. Market. Wall Street Journal Online.
Retrieved from http://online.wsj.com/article/SB122289540716195651.html
Patton, P. (2010, April 11). Ex-Copycats Find Their Own Styles. New York Times, p.
AU2.
Peng, M. (2002). Towards an institution-based view of business strategy. Asia Pacific
Journal of Management, 19(2), 251-267.
Peng, M., Sunny Li, S., Pinkham, B., & Hao, C. (2009). The Institution-Based View as
a Third Leg for a Strategy Tripod. Academy of Management Perspectives, 23(3),
63-81.
Peng, M., Wang, D., & Jiang, Y. (2008). An institution-based view of international
business strategy: A focus on emerging economies. Journal of International
Business Studies, 39(5), 920-936.
Porter, M. E. (1980). Competitive strategy techniques for analyzing industries and
competitors. London: Free Press.
Porter, M. E. (1985). Competitive advantage: Creating and sustaining superior
performance. New York: The Free Press.
Porter, M. E. (1990). The Competitive Advantage of Nations. Harvard Business
Review, 68(2), 73-93.
Porter, M. E. (1998). The competitive advantage of nations: with a new introduction.
New York: The Free Press.
Porter, M. E. (2008). The Five Competitive Forces That Shape Strategy. Harvard
Business Review, 86(1), 78-93.
Prahalad, C., & Hamel, G. (1990). The Core Competence of the Corporation. Harvard
Business Review, 68(3), 79-91.
PricewaterhouseCoopers. (2010a). 13th Annual Global Survey - Setting a smarter
course for growth: Automotive: PricewaterhouseCooper. Retrieved from
http://www.pwc.com/gx/en/ceo-survey/download.jhtml
91
PricewaterhouseCoopers. (2010b). Drive Value - Automotive M&A Insights 2009:
ProcewaterhouseCoopers. Retrieved from
http://www.pwc.com/gx/en/automotive/mergers-acquisitions/mergers-
acquisitions-insights-2009.jhtml
Proff, H. (2000). Hybrid strategies as a strategic challenge - The case of the German
automotive industry. Omega, 28(5), 541-553.
Punch, K. (2005). Introduction to Social Research: Quantitative and Qualitative
Approaches. Thousand Oaks: Sage Publications.
Rauwald, C. (2008, July 28). Fuel Prices Hamper Diesel-Cars Push; VW, Daimler,
BMW Tout Fuel Efficiency In New U.S. Efforts. Wall Street Journal, p. B.3.
Rauwald, C. (2010). Volkswagen Invests Further in China. Wall Street Journal Online.
Retrieved from
http://online.wsj.com/article/SB100014240527487034652045752074411707825
22.html
Ravenhill, J., &. (2001). From National Champions to Global Partnerships: The
Korean Auto Industry, Financial Crisis and Globalization [Working Paper
Series 01.04]. MIT Japan Program.
Reiter, C. (2009). VW Boosts Audi in Luxury Car Challenge. BusinessWeek Online.
Retrieved from
http://www.businessweek.com/globalbiz/content/dec2009/gb20091228_035574.
htm
Reuters. (2008). Hyundai Motor to build $600 mln factory in Brazil. Reuters. Retrieved
from http://www.reuters.com/article/idUSSEO10419520080918
Revill, J. (2008, July 21). Hyundai spends €60 million to improve dealers. Automotive
News Europe, 13(15/16), 4.
Rockart, J. F. (1979). Chief executives define their own data needs. Harvard Business
Review, 57(2), 81-93.
Rouse, M. J., & Daellenbach, U. S. (1999). Rethinking Research Methods for the
Resource-Based Perspective: Isolating Sources of Sustainable Competitive
Advantage. Strategic Management Journal, 20(5), 487-494.
Rugman, A. M., & D'Cruz, J. R. (1993). The 'Double Diamond' Model of International
Competitiveness: The Canadian Experience. Management International Review,
33(2), 17-39.
Ryans, A. (2010, June). When companies underestimate low-cost rivals. McKinsey
Quarterly, 1-5.

92
Schäfer, D. (2010a, March 1). Audi gets ready to take on premium rivals. Financial
Times, p. 24.
Schäfer, D. (2010b). VW starts €4.5bn capital raising. FT.com. Retrieved from
http://www.ft.com/cms/s/0/5eec34f6-36e5-11df-bc0f-00144feabdc0.html
Schuller, B.-J., & Lidbom, M. (2009). Competitiveness of nations in the global
economy. Is Europe internationally competitive? Economics & Management,
934-939.
Schweinsberg, C., & Winter, D. (2008, December 1). Green Tech Stars in LA. Ward's
Auto World, 44(12), 8-9.
Schweinsberg, C., & Zoia, D. (2009, February 1). Stop-Start Systems Proliferating at
Hyundai, VW. Ward's Auto World, 45(2), 6.
Scott, B. R., Lodge, G. C., & Bower, J. L. (1985). US competitiveness in the world
economy. Boston, Mass.: Harvard Business School Press.
Scott, W. R. (1995). Institutions and organizations. Foundations for organizational
science: Thousand Oaks, CA: Sage.
Shankar, V., Carpenter, G., & Krishnamurthi, L. (1998). Late mover advantage: How
innovative late entrants outsell pioneers. Journal of Marketing Research, 35(1),
54-70.
Sirikrai, S. B., & Tang, J. C. S. (2006). Industrial competitiveness analysis: Using the
analytic hierarchy process. Journal of High Technology Management Research,
17(1), 71-83.
Snow, C., & Hrebiniak, L. (1980). Strategy, distinctive competence, and organizational
performance. Administrative Science Quarterly, 25(2), 317-336.
Snowdon, B., & Stonehouse, G. (2006). Competitiveness in a globalised world: Michael
Porter on the microeconomic foundations of the competitiveness of nations,
regions, and firms. Journal of International Business Studies, 37(2), 163-175.
Song, J. (2006, July 26). Concern rises on Hyundai strike. Financial Times, p. 20.
Song, J. (2009, September 16). Ssangyong turnround plan. Financial Times, p. 17.
Song, J., & Minder, R. (2008, June 3). Hyundai goes up a gear amid fear of life in
middle lane. Financial Times, p. 16.
Song, J., & Simon, B. (2009, October 23). Hyundai Motor reports record quarterly
earnings. Financial Times, p. 16.
Spitzer, R. (2009). Pole Positioning: accenture. Retrieved from
http://www.accenture.com/Global/Research_and_Insights/Outlook/By_Issue/Y2
009/PolePositioning.htm
93
Stabell, C. B., & Fjeldstad, Ø. D. (1998). Configuring value for competitive advantage:
on chains, shops, and networks. Strategic Management Journal, 413-437.
Stake, R. E. (1995). The art of case study research. Thousand Oaks: Sage Publications.
Stewart, J. B. (2010, April 14). Common Sense: Auto Shares Beckon, And VW in
Particular. Wall Street Journal, p. C.4.
Taylor III, A. (2010, January 5). Hyundai Smokes the Competition. Fortune, 161(1),
62-71.
Teece, D. J., Pisano, G., & Shuen, A. (1997). Dynamic capabilities and strategic
management. Strategic Management Journal, 18(7), 509-533.
Terlep, S., & Bennett, J. (2010, April 22). Car Makers Stabilize Year After Bailouts.
Wall Street Journal, p. A.1.
Thomson Reuters. (2009, March 24). Thomson Reuters analysis of 2008 world patent
activtiy finds U.S. market infused with Asian innovations [Press Release].
Retrieved 12.05.2010, from
http://science.thomsonreuters.com/press/2009/innovation_study/
Triebswetter, U., & Wackerbauer, J. (2008). Integrated environmental product
innovation and impacts on company competitiveness: a case study of the
automotive industry in the region of Munich. European Environment: The
Journal of European Environmental Policy, 18(1), 30-44.
UK Department for Business Innovation and Skills. (2010). The 2009 R&D Scoreboard
- Company Data: Department for Business, Innovation & Skills (BIS). Retrieved
from www.bis.gov.uk/randscoreboard
United Nations Conference on Trade and Development. (2009). World Investment
Report 2009 – Transnational Corporations, Agricultural Production and
Development (E.09.II.D.15). Geneva, Switzerland: United Nations Conference
on Trade and Development (UNCTAD).
United States Patent and Trademark Office. (2010). USTPO Patent Database. Retrieved
01.06.2010, from United States Patent and Trademark Office (USTPO)
www.uspto.gov
United States Trade Representative Office. (2010). Korea - U.S. Free Trade Agreement:
Office of the Unites States Trade Representative (USTR). Retrieved from
http://www.ustr.gov/trade-agreements/free-trade-agreements/korus-fta
Vasilash, G. (2006, September 1). HALLMARK on Jettas, Exchange Rates & Why
Technology Matters to VW. Automotive Design & Production, 118(9), 42-43.
94
Vasilash, G. (2007, August 1). VW Research: Vehicle Technology for today &
tomorrow. Automotive Design & Production, 119(8), 46-48.
Vasilash, G. (2008a, September 1). VW pursues advanced electronics. Automotive
Design & Production, 120(9), 30-33.
Vasilash, G. (2008b, November 1). VW's clean diesel (no, that's not an oxymoron).
Automotive Design & Production, 120(11), 46-47.
Veloso, F., & Kumar, R., &. (2002). The Automotive Supply Chain: Global Trends and
Asian Perspectives [ERD Working Paper Series No. 3]. Asian Development
Bank, Economics and Research Department.
Volkswagen AG. (2009, April 23). Premiere für das Volkswagen Handelsplatzkonzept
[Press Release]. Retrieved 04.06.2010, from https://www.volkswagen-media-
services.com/medias_publish/ms/content/de/pressemitteilungen/2009/04/23/pre
miere_fuer_das.standard.gid-oeffentlichkeit.html
Volkswagen AG. (2010a). Annual Report 2009. Wolfsburg.
Volkswagen AG. (2010b). Driving ideas - Sustainability Report 2009. Wolfsburg.
Volkswagen AG. (2010c). History. Retrieved 01.06.2010, from
http://www.volkswagenag.com/vwag/vwcorp/content/en/the_group/history.html
Volkswagen AG. (2010d). Innovation. Retrieved 01.06.2010, from
http://www.volkswagenag.com/vwag/vwcorp/content/en/innovation.html
Wall Street Journal Online. (2010). Auto Sales - Markets Data Center - Sales and Share
of Total Market by Manufacturer. Retrieved 03.06.2010, from
http://online.wsj.com/mdc/public/page/2_3022-autosales.html
Wang, J. (2007). From technological catch-up to innovation-based economic growth:
South Korea and Taiwan compared. Journal of Development Studies, 43(6),
1084-1104.
Warburton, M., & Pretorius, L. (2009). European Autos Data Book - 2Q:09: Size Really
Does Matter - Why the Shift to Small Cars Is a Big Problem: Bernstein Global
Wealth Management.
Ward, A. (2002, October 18). GM completes $400m partial takeover of Daewoo.
Financial Times, p. 29.
Ward's Auto World. (2009, January 1). Detroit Auto Show Skips Glitz This Time.
Ward's Auto World, 45(1), 10.
Welch, D. (2010, January 13). The Transformer: Why VW is the car giant to watch.
BusinessWeek(4164), 44-48.
95
Wernerfelt, B. (1984). A Resource-Based View of the Firm. Strategic Management
Journal, 5(2), 171-180.
Winter, D. (2009, April 1). Is the horsepower race over? Ward's Auto World, 45(4), 30-
34.
Woodall, B., & Kim, S. (2010). Hyundai targets 4.5 percent rise in U.S. market share.
Retrieved from http://www.reuters.com/article/idUSTRE61E3PH20100215
Wright, C., Suh, C., & Leggett, C. (2009). If at first you don't succeed: globalized
production and organizational learning at the Hyundai Motor Company. Asia
Pacific Business Review, 15(2), 163-180.
Yang, J.-M., Kim, T.-W., & Han, H.-O. (2006). Understanding the economic
development of Korea from a co-evolutionary perspective. Journal of Asian
Economics, 17(4), 601-621.
Yee, A. (2008, January 10). Carmakers turn to India for future growth. Financial Times,
p. 16.
Yin, R. K. (2003). Case study research: Design and methods (3rd ed.). Thousand Oaks:
Sage Publications.
Zoia, D. E. (2010, March 1). Upcoming Hybrids First Play in VW's Electrification
Strategy. Ward's Auto World, 46(3), 6.
Related Documents

![How to Improve the Competitiveness of Automobile Maintenance … · 2021. 5. 15. · Automobile Maintenance Quality [J]. Automobile & Driving Maintenance (Repair Edition),2019(04):107-108.](https://static.cupdf.com/doc/110x72/6141e5ca2035ff3bc76252a8/how-to-improve-the-competitiveness-of-automobile-maintenance-2021-5-15-automobile.jpg)