John Keells PLC | Annual Report 2017/18 THE RIGHT THINKING

Welcome message from author
This document is posted to help you gain knowledge. Please leave a comment to let me know what you think about it! Share it to your friends and learn new things together.
Transcript
John Keells PLC | Annual Report 2017/18
THE RIGHT THINKING

THE RIGHT FOUNDATION THE RIGHT PRINCIPLE
THE RIGHT EXECUTIONTHE RIGHT STRATEGY
01 03
0402
02 | About Us04 | Introduction to the report 06 | Ownership Structure 07 | Highlights 08 | Performance Highlights 10 | Milestones 12 | Key Events and Achievements of
producer clients during the year 14 | Chairman’s Statement
66 | Board of Directors 68 | Corporate Governance 88 | Enterprise Risk Management 94 | Audit Committee Report 97 | Annual Report of the Board of
Directors 103 | Statement of Directors’
Responsibility 104 | Senior Management
106 | Financial Calendar 107 | Independent Auditor’s Report 110 | Income Statement 111 | Statement of Comprehensive Income 112 | Statement of Financial Position 113 | Statement of Changes in Equity 115 | Cash Flow Statement 117 | Index to the Notes 118 | Notes to the Financial Statements 165 | Information to Shareholders and
Investors 168 | Five Year Summary 170 | Key Ratios and Information 172 | Glossary of Financial Terminology 173 | Notice of Meeting 175 | Form of Proxy
18 | Business Model 20 | Value Creation Model 22 | Stakeholder Relationships 25 | Operating Environment32 | Competitor Analysis 33 | Capital Management Review - Financial Capital - Manufactured Capital
- Social and Relationship Capital - Human Capital - Intellectual Capital - Natural Capital 57 | Sustainability
CONTENTS

THE RIGHT THINKINGAs we look back on an immensely successful year, at John Keells PLC, we strongly believe that our achievement is based on a progressive vision and an uncompromising will to win, reinforced by sound judgment and years of experience. We’re passionate about all that we do, and every day sees us striving to improve our products and processes, our people and performance; what we do and how we do it.
The report you now hold reviews an outstanding performance – a year in which we have undoubtedly exceeded stakeholder expectations in the value we have created. Read it closely to find out why we are so confident that wherever we have gone, whoever we have reached out to, whatever we have accomplished, it’s because of one thing – the right thinking.
02 JOHN KEELLS PLC
ABOUT US
VisionTo be internationally recognised as the best Produce
Broker in the world.
MissionTo retain the pre-eminent position as Sri Lanka’s leading
Tea and Rubber broker; To uphold the traditions and
ethics of the Tea and Rubber trades; To ensure superior
customer service through a dedicated and motivated
workforce.
ValuesWe are committed to the highest level of integrity and
ethical conduct in all our business activities. We will look
towards exceeding shareholder and customer expectations
by achieving excellence in all areas of operations. We
recognise the right of every individual to be treated with
fairness, dignity and respect and assist our employees to
improve their skills and reward their accomplishments.
We will focus on corporate social responsibility and look
to protect and safeguard the environment.
ABOUT JOHN KEELS PLCFor over 148 years, John Keells PLC has been a
corporate benchmark of quality, brand excellence
and good governance. Our long heritage and
sound values have led to our becoming the
paradigm that others follow. That is why this
report analyses the right thinking - the strategies
that lie behind the triple bottom line results
presented in these pages, in order to offer our
stakeholders a clear view of where they stand in
relation to their company.
We know that relentless self-assessment is the
first step towards an environment of excellence
and that is what we have demonstrated in this
Annual Report. The pages that follow describe an
excellent performance across a range of indicators
that will ensure our strength both now and into
the years ahead. You will also drive deep into
the way we operate, the numerous strategies we
adopt, and our long term vision - the things that
together, create the right thinking.

03Annual Report 2017/18
THE RIGHT THINKING
The Right Foundation
02 | About Us04 | Introduction to the report 06 | Ownership Structure 07 | Highlights 08 | Performance Highlights 10 | Milestones 12 | Key Events and Achievements
of producer clients during the year
14 | Chairman’s Statement
04 JOHN KEELLS PLC
The Right Principle
INTRODUCTION TO THE REPORT
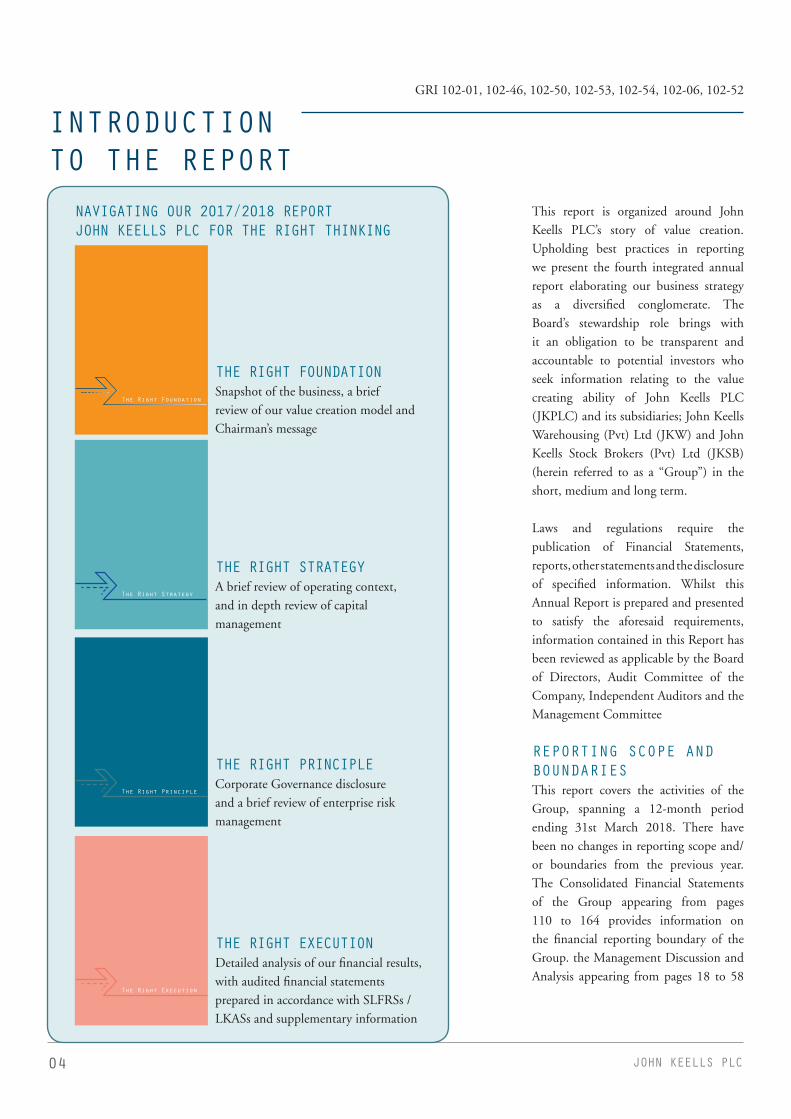
This report is organized around John Keells PLC’s story of value creation. Upholding best practices in reporting we present the fourth integrated annual report elaborating our business strategy as a diversified conglomerate. The Board’s stewardship role brings with it an obligation to be transparent and accountable to potential investors who seek information relating to the value creating ability of John Keells PLC (JKPLC) and its subsidiaries; John Keells Warehousing (Pvt) Ltd (JKW) and John Keells Stock Brokers (Pvt) Ltd (JKSB) (herein referred to as a “Group”) in the short, medium and long term.
Laws and regulations require the publication of Financial Statements, reports, other statements and the disclosure of specified information. Whilst this Annual Report is prepared and presented to satisfy the aforesaid requirements, information contained in this Report has been reviewed as applicable by the Board of Directors, Audit Committee of the Company, Independent Auditors and the Management Committee
REPORTING SCOPE AND BOUNDARIESThis report covers the activities of the Group, spanning a 12-month period ending 31st March 2018. There have been no changes in reporting scope and/or boundaries from the previous year. The Consolidated Financial Statements of the Group appearing from pages 110 to 164 provides information on the financial reporting boundary of the Group. the Management Discussion and Analysis appearing from pages 18 to 58
THE RIGHT FOUNDATIONSnapshot of the business, a briefreview of our value creation model andChairman’s message
THE RIGHT STRATEGYA brief review of operating context,and in depth review of capital management
THE RIGHT PRINCIPLECorporate Governance disclosure and a brief review of enterprise risk management
THE RIGHT EXECUTIONDetailed analysis of our financial results,with audited financial statements prepared in accordance with SLFRSs / LKASs and supplementary information
The Right Strategy
The Right Execution
NAVIGATING OUR 2017/2018 REPORTJOHN KEELLS PLC FOR THE RIGHT THINKING
The Right Foundation
GRI 102-01, 102-46, 102-50, 102-53, 102-54, 102-06, 102-52

05Annual Report 2017/18
THE RIGHT THINKING
identifies the activities of the Group. This report also cover risks, opportunities and outcomes that could materially affect the organisation’s ability to create value.
STANDARDS AND PRINCIPLESReporting
• Integrated Reporting Framework of the International Integrated Reporting Council (IIRC)
Governance, Risk Management and Operations
• Laws and Regulations of the Companies Act No. 7 of 2007
• Listing Rules of the Colombo Stock Exchange (CSE) and subsequent revisions to date
• Code of Best Practice on Corporate Governance jointly advocated by the Securities and Exchange Commission of Sri Lanka (SEC) and the Institute of Chartered Accountants of Sri Lanka (CA Sri Lanka)
Financial Reporting
• Sri Lanka Accounting Standards (SLFRSs / LKASs) issued by the Institute of Chartered Accountants of Sri Lanka (CA Sri Lanka)
Sustainability and Corporate Social Responsibility Reporting
• Voluntary adoption of Global Reporting Initiatives (GRI) Standards
• United Nations Sustainable Development Goals
• United Nations Global Compact Principles
ENTERPRISE GOVERNANCE Our value creation model aims to create value, while balancing the Company’s responsibilities towards its diverse stakeholders including shareholders and the environment. How the Company did this over the past financial year through performance and conformance
is discussed comprehensively in different sections of this report. In addition, the manner in which the Group has complied with the Code of Best Practice on Corporate Governance jointly issued by the Institute of Chartered Accountants of Sri Lanka (CA Sri Lanka) and Securities and Exchange Commission of Sri Lanka (SEC) is available in The Right Principle Section.
INTEGRATED THINKINGThe seven guiding principles in integrated reporting; strategic focus and future orientation, connectivity of information, stakeholder relationships, materiality, conciseness, reliability and completeness, consistency and comparability; have been given due consideration when preparing and presenting this report.
INDEPENDENT ASSURANCEThe financial statements at the company and the group level are audited by Messrs. Ernst & Young, Chartered Accountants. The independent auditors’ report is set out on page 107 to 109 of this annual report.
OUR APPROACH TO MATERIALITYThis report provides information that we believe is of material interest to current and prospective investors, and to any other stakeholder who wishes to make an informed assessment of Group’s ability to generate value over the short, medium and long term. Rather than providing a simple listing of ‘material issues’, we have sought to ensure that all the information in this report relates to matters affecting value creation at John Keells PLC. A snapshot of our business (page 18), our value creation model (page 20) and the capital management review (pages 33 to 38) forms the basis for appreciating how the Group creates value, and for identifying the issues impacting value. Our ability to create value is determined
by our operating environment (pages 25 to 31) and by our response to the resulting risks and opportunities (pages 88 to 93), our performance (pages 08 to 09), our leadership team (pages 104), and our governance practices (pages 68 to 87).
FORWARD-LOOKING STATEMENTSThe Annual Report herein contains forward-looking statements and information. The reality of the operational backdrop may change our business expectations, future outlook, plans and forecasts. shareholders and other stakeholders are advised to be cautious in placing too much emphasis on such statements, as the reality may materially differ with the projected and anticipated information. The Company does not undertake to update publicly the forward-looking statements to reflect the changes after the date of this report, except, in compliance with the applicable rules and regulations set by the relevant statutory and regulatory bodies.
CONTACT PERSONFor any inquiries and feedback with reference to this report please contactAsha PereraSector Financial ControllerJohn Keells PLCNo. 186, Vauxhall Street,Colombo 02.E-mail: [email protected]
06 JOHN KEELLS PLC
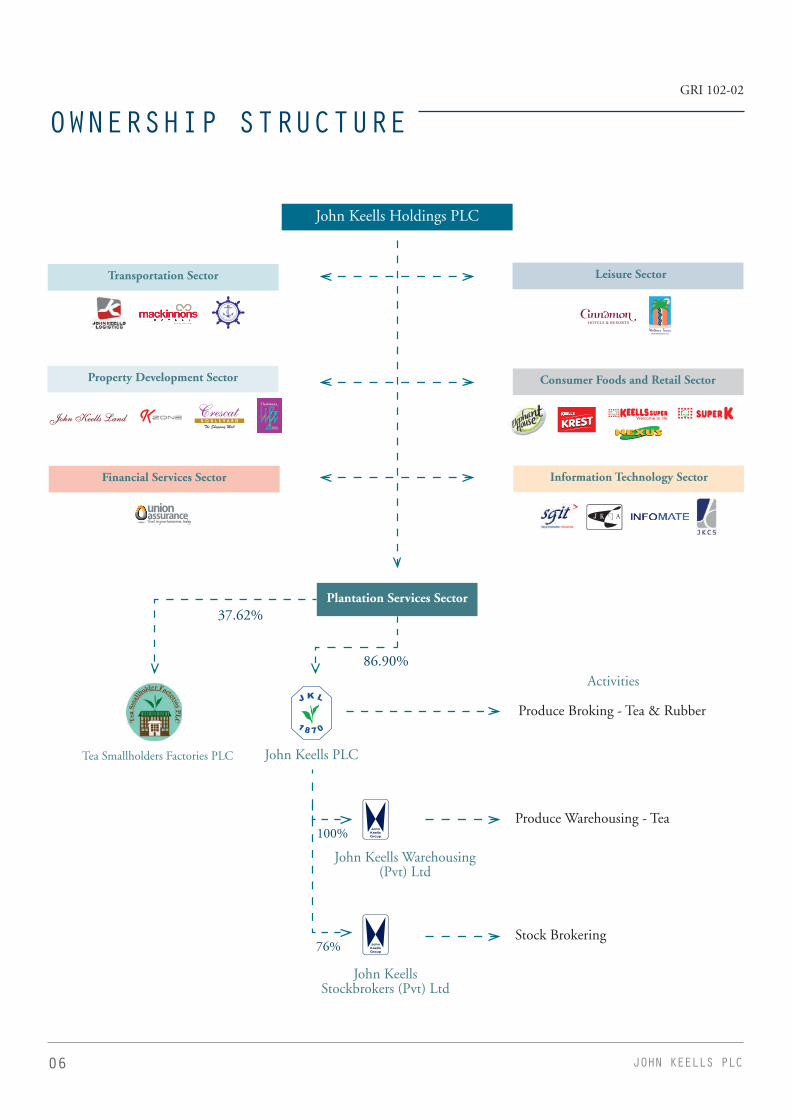
OWNERSHIP STRUCTURE
Plantation Services Sector
John Keells PLCTea Smallholders Factories PLC
86.90%
100%
76%
37.62%
Activities
Produce Broking - Tea & Rubber
John Keells Warehousing (Pvt) Ltd
Produce Warehousing - Tea
John Keells Stockbrokers (Pvt) Ltd
Stock Brokering
KRESTKREST
Transportation Sector Leisure Sector
Consumer Foods and Retail Sector
Information Technology Sector
Property Development Sector
Financial Services Sector
John Keells Holdings PLC
GRI 102-02

07Annual Report 2017/18
THE RIGHT THINKING
HIGHLIGHTSFinancial Capital
Natural Capital
Social & Relationship Capital
Human Capital
Manufacturing /Intellectual Capital
2017/2018
Rs.799 MnRevenue 2016/2017 – Rs.613
2017/2018
222 MTCarbon Foot Print 2016/2017 – 205 MT
2017/2018
Rs.902 MnDirect Economic Value Generated2016/2017 – Rs.731 Mn
2017/2018
435 GJDirect Energy Consumption 2016/2017 – 414 GJ
100%
Over 800 hoursof training for employees
Facilitated the obtaining of 1,204 Top Prices for Tea Factories
Employee performance review and feedback given
purchases from Local Suppliers
100%
Process of developing a fully integrated operating systems
Rs. 27 Mn Investment in Warehousing roof replacement

08 JOHN KEELLS PLC
PERFORMANCE HIGHLIGHTSFinancial Highlights – Three Year Performance - Group
For the Year Ended 31st March 2017/2018 2016/2017 2015/2016
RESULTS OF THE YEARGroup revenue Rs. 000's 799,267 612,627 706,664 Group profits before interest and tax (EBIT) Rs. 000's 409,151 303,794 128,648 Group profits before tax Rs. 000's 328,987 240,926 63,466 Group profits after tax Rs. 000's 237,763 191,329 54,213 Group profits attributable to shareholders Rs. 000's 234,760 196,020 52,746 Earnings per share Rs. 3.86 3.22 0.87 Interest cover No. of times 5.10 4.83 1.97 Return on Equity % 6.93 5.70 1.62Return on capital employed % 9.82 7.45 3.24
FINANCIAL POSITION AT THE YEAR ENDTotal assets Rs. 000's 5,113,133 5,625,592 4,982,427 Total debt Rs. 000's 712,112 673,577 652,115 Number of shares in issue Rs. 000's 60,800 60,800 60,800 Total shareholder funds Rs. 000's 3,455,198 3,402,973 3,312,398 Net assets per share Rs. 56.83 55.97 54.48 Net debt Rs. 000's (242,914) (277,313) (306,407)Debt/Equity % 20.38 19.60 19.58Debt/Total assets % 13.93 11.97 13.09
MARKET / SHAREHOLDER INFORMATIONMarket price as at 31st March Rs. 59.10 51.10 70.00 Market capitalization Rs. 000's 3,593,280 3,106,880 4,256,000 Enterprise value Rs. 000's 3,350,366 2,829,567 3,949,593 Price earning ratio No. of times 15.31 15.85 80.69 Dividend paid Rs. 000's 121,600 60,800 228,000 Dividend per share Rs. 2.00 1.00 3.75 Dividend payout ratio % 51.81 31.02 432.26Dividend yield % 3.38 1.96 5.36
GRI 102-07, 403-02

09Annual Report 2017/18
THE RIGHT THINKING
Non-Financial Highlights - Three Year Performance - Group
For the Year Ended 31st March 2017/2018 2016/2017 2015/2016
FINANCIAL CAPITALEconomic value added Rs. 000's 901,978 731,022 814,121 Proportion of purchases form local suppliers within Sri Lanka % 100 100 100
MANUFACTURED CAPITALTotal property plant and equipment Rs. 000's 353,465 321,237 339,448
NATURAL CAPITALDirect energy consumption (GJ) GJ 435 414 386 Direct energy (GJ) per Rs. million of revenue No. of times 0.54 70 0.55 Indirect energy consumption (GJ) GJ 985 886 884 Total carbon footprint (MT) MT 222 205 196 Total carbon footprint (MT) per Rs. million of revenue No. of times 0.27 0.33 0.28 Water withdrawal (m3) (m3) 4,144 3,242 3,208 Water withdrawal (m3) per Rs. million revenue No. of times 5.18 5.29 4.54 Significant environment fines* Rs. Nil Nil Nil
HUMAN CAPITALEmployee benefit liability Rs. 000's 64,629 65,363 72,126 Total employees Number 85 92 96 Number of injuries during work Number Nil Nil NilTotal training hours Hours 823 500 760 Average training hours per employee Hours 25 15 14 Number of lost days Number Nil Nil NilNumber of employees receiving performance review % 100 100 100
SOCIAL AND RELATIONSHIP CAPITALProportion of business analysed for risk of corruption % 100 100 100Significant fines for violation of laws/regulations* Rs. Nil Nil NilSignificant fines for product/service issues* Rs. Nil Nil Nil
INTELLECTUAL CAPITALSoftware development - work in progress Rs. 000's 2,957 Nil Nil Software licence*** Rs. 000's Nil 92 587
* Significant fines are defined as fines over Rs.one million *** Software Licence represents only JKSB

010 JOHN KEELLS PLC
MILESTONES18
76
1966
1878
1970
1890
1971
1895
1976
1948
1986
1960
1962
A partnership styled “John Brothers and Company” was formed with offices situated in Colombo and Kandy.
This partnership was dissolved and Edwin John started an
establishment of his own titled “E. John” and carried on the business of produce and exchange broking. The
first decade of business of E. John was one of low activity.
Villers records this period thus, “Business in those days was very limited. Coffee had all but gone out, Tea had not expanded sufficiently and the
little business in Chinchona was not enough to go around.”
During this period, Reginald, son of Edwin John, joined his
father in Ceylon.
Prospects began to improve rapidly with the approaching tea business.
Reginald John was taken into the partnership
of E. John and Co. By this time, business was growing quite rapidly in tea, shares, oil and
exchange.
E. John and Co., amalgamated with two London Tea Broking firms,
William Jas and Hy Thompson and Co. and Geo White and Co. The
firm was then incorporated as a private limited liability company and
the name was changed to E. John, Thompson, White and Co. Ltd.
Edwin John came to Ceylon, as the Island was then called, to join his brother George. Together, they established themselves as Produce and Exchange Brokers.
1870
E. John, Thompson, White and Co. Ltd., amalgamated with Keells and Waldock Ltd. The name was changed to John Keells Thompson White Ltd. The Company acquired its Glennie Street premises from Dodwell and Company which were initially used as a warehousing.
The firm moved to the sixth floor
of the then newly constructed
Ceylinco House.
The initial step towards diversification of the activities of the Company was taken with the acquisition of Ceylon Mineral Waters Ltd.
M.C. Bostock was elected Chairman of
the Company.
John Keells PLC., moved its offices to Glennie Street, Slave Island.
John Keells PLC., became a People’s
Company.
John Keells Holdings PLC, acquired the controlling
interest of John Keells PLC., M.C. Bostock retired and D.J.M. Blackler took over
as the Chairman of the Company.

011Annual Report 2017/18
THE RIGHT THINKING19
90
1993
2000
2001
2003
2004
2005
2007
2010
2011
2013
2015
2016
2018
K. Balendra took over as Chairman, the first Sri Lankan to hold this position. John Keells PLC., acquired controlling interests in John Keells Stock Brokers (Pvt) Ltd.
Financial Statements of the associates Keells Realtors Ltd., and International Tourists and Hoteliers Ltd. were incorporated to the Consolidated Accounts.
K. Balendra retired as Chairman on 31st December, 2000.
V. Lintotawela took over as Chairman on 1st January, 2001. John Keells PLC., incorporated John Keells Warehousing (Pvt) Ltd., a fully owned subsidiary with B.O.I. status.
The state of the art warehouse of John Keells Warehousing (Pvt) Ltd., which is the largest
hi-tech tea warehouse in this part of the region was commissioned for storing pre-auctioned produce.
The Company disposed its Investment in International Tourists and Hoteliers Ltd.
V. Lintotawela retired as Chairman
on 31st December 2005 and S.
Ratnayake took over as Chairman on
01st January 2006.
The name of the Company was changed to John Keells PLC which was a new requirement of the Companies Act No. 7 of 2007.
The Board of Directors at a meeting held on 20th July 2010 resolved to increase the number of shares by way of share sub – division in the ratio of one (1) share for every one (1) share held. Consequently, the no of shares after the sub – division increased to 30,400,000 shares from the current 15,200,000 shares.
The Board of Directors at a meeting held on 11th May 2011 resolved to increase the number of shares by way of a share sub -division in the ratio of one (1) share for every one (1)
share held. Consequently, the number of shares after the sub – division increased to 60,800,000 shares from the previous
30,400,000 shares.
The Company disposed of its land at 130, Glennie Street Colombo 2 to Waterfront Properties (Pvt) Ltd
In compliance with the new Securities Exchange Commission directive which came in to effect from 1st January 2016 the shares of the company which were listed on the Main Board were transferred to the Diri Savi Board of the Colombo Stock Exchange.
In compliance to the Capital Adequacy Requirement implemented by The Colombo Stock Exchange on stock broking firms, JKPLC increased its investment in its subsidiary John Keells Stock Brokers (Pvt) Ltd by accepting the rights for 570,000 shares.
Mr. K. N. J. Balendra and Mr. J. G. A. Cooray appointed as the new directors of John Keells PLC (w.e.f. 01st January 2018) with the retirement of Mr. A. D. Gunewardene and Mr. J. R. F. Peiris

012 JOHN KEELLS PLC
Abbotsleigh Tea EstateSold a quantity of 1.2 million kilograms
of made tea whilst securing the second
highest average in the CTC High Grown
category with an estate average of Rs.
605.04.
Tea Small Holder Factories PLCSold the second highest quantity of tea
by a group of Factories in the Low Grown
Category with a volume of 4.1 million
kilograms of made tea.
2017 2018
Kiruwanaganga Tea FactoryWas ranked first amongst the Regional
Plantation Company Factories for all
elevations. Sold a quantity of 0.61 million
kilograms of made tea with an average price
of Rs.723.38
IT Security user awareness
Awareness sessions were conducted among
all staff to educate them on Cybersecurity
and new IT Security Procedures
Grand CharityAuction
The Colombo Brokers Association, in
collaboration with Sri Lanka Tea Board
and Colombo Tea Traders’ Association,
conducted the Grand Charity Auction to
celebrate 150 years of Sri Lankan Tea
Plasticcycle Pledge
In line with JKH Group initiative John
Keells PLC staff took a pledge to reduce
plastic pollution in Sri Lanka
Rothschild Tea EstateRecorded the highest quantity sold amongst
the Regional Plantation Company Factories
with a sold quantity of 1.46 million
kilograms of made Tea with an average of
Rs. 566.08. in the CTC Medium category.
Kenilworth Tea EstateSecured an average of Rs. 667.76 in the
Western Medium Grown category whilst
selling a quantity of 0.54 million kilograms
of made Tea.
Dunsinane Tea EstateSold a quantity of 0.90 million kilograms
of made Tea whilst securing the highest
average in the CTC High Grown category
with an estate average of Rs. 605.50
Global Ceylon Tea Party
The Company was part of the Global
Ceylon Tea Party organized by the Tea
Board to Celebrate 150 years of Sri
Lankan Tea.
JULYDelta Tea EstateSold a total of 1.42 million kilograms of
tea at an average price of Rs.583.63 in the
CTC Medium Category.
Dickoya Tea EstateSold a quantity of 0.56 million kilograms
of made tea whilst securing a commendable
estate average of Rs 664.31 in the Western
High Grown category.
KEY EVENTS AND ACHIEVEMENTS OF PRODUCER CLIENTS DURING THE YEAR
NOVEMBER
AUGUSTMAY
013Annual Report 2017/18
THE RIGHT THINKING
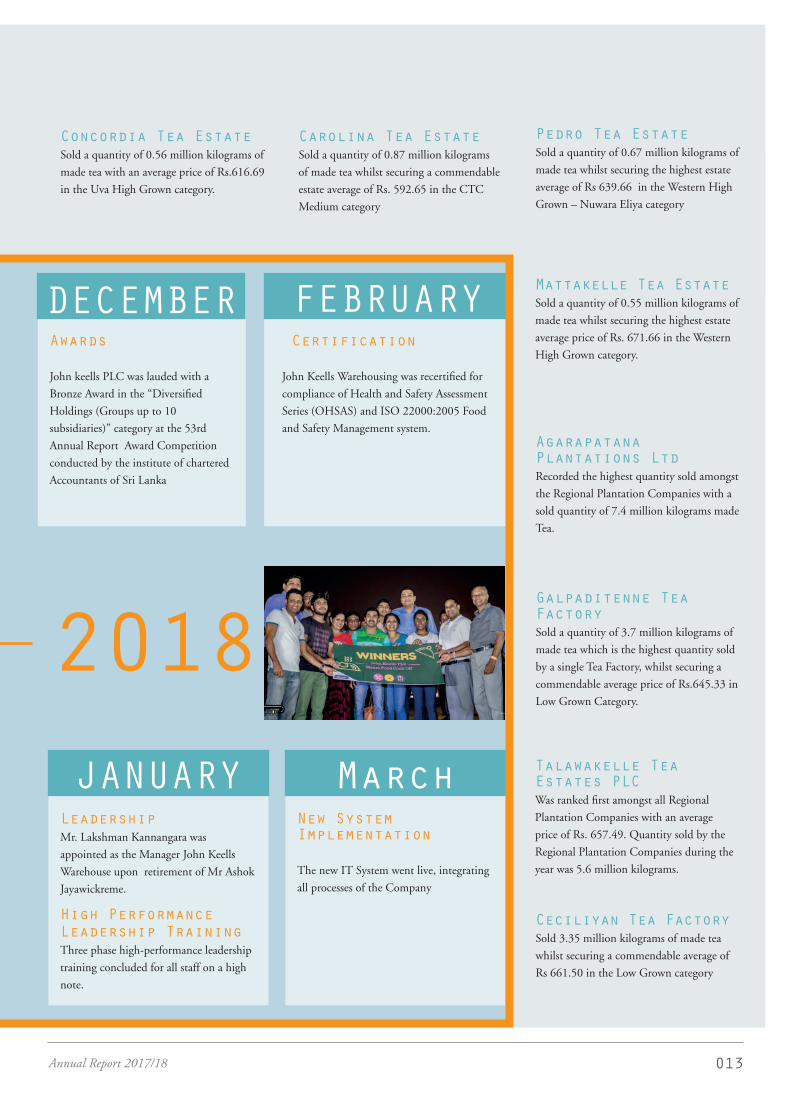
Concordia Tea EstateSold a quantity of 0.56 million kilograms of
made tea with an average price of Rs.616.69
in the Uva High Grown category.
Pedro Tea EstateSold a quantity of 0.67 million kilograms of
made tea whilst securing the highest estate
average of Rs 639.66 in the Western High
Grown – Nuwara Eliya category
Carolina Tea EstateSold a quantity of 0.87 million kilograms
of made tea whilst securing a commendable
estate average of Rs. 592.65 in the CTC
Medium category
Certification
John Keells Warehousing was recertified for
compliance of Health and Safety Assessment
Series (OHSAS) and ISO 22000:2005 Food
and Safety Management system.
2017 2018
Awards
John keells PLC was lauded with a
Bronze Award in the “Diversified
Holdings (Groups up to 10
subsidiaries)” category at the 53rd
Annual Report Award Competition
conducted by the institute of chartered
Accountants of Sri Lanka
Agarapatana Plantations LtdRecorded the highest quantity sold amongst
the Regional Plantation Companies with a
sold quantity of 7.4 million kilograms made
Tea.
Mattakelle Tea EstateSold a quantity of 0.55 million kilograms of
made tea whilst securing the highest estate
average price of Rs. 671.66 in the Western
High Grown category.
Galpaditenne Tea FactorySold a quantity of 3.7 million kilograms of
made tea which is the highest quantity sold
by a single Tea Factory, whilst securing a
commendable average price of Rs.645.33 in
Low Grown Category.
Talawakelle Tea Estates PLCWas ranked first amongst all Regional
Plantation Companies with an average
price of Rs. 657.49. Quantity sold by the
Regional Plantation Companies during the
year was 5.6 million kilograms.
Ceciliyan Tea FactorySold 3.35 million kilograms of made tea
whilst securing a commendable average of
Rs 661.50 in the Low Grown category
LeadershipMr. Lakshman Kannangara was
appointed as the Manager John Keells
Warehouse upon retirement of Mr Ashok
Jayawickreme.
High Performance Leadership TrainingThree phase high-performance leadership
training concluded for all staff on a high
note.
New System Implementation
The new IT System went live, integrating
all processes of the Company
JANUARY March
FEBRUARYDECEMBER
014 JOHN KEELLS PLC
CHAIRMAN’S STATEMENT
- S C RATNAYAKE -
MACRO-ECONOMIC OVERVIEWThe Sri Lankan economy grew by 3.1 percent for the calendar year 2017, compared to 4.5 percent GDP growth recorded in 2016, primarily as a result of prolonged adverse weather conditions and a contractionary monetary policy stance. Inflation remained high during the calendar year, on account of the aforementioned impacts, and minor disruptions to food supply on the back of unfavourable weather conditions.
Exports from Sri Lanka recorded an all-time high in the calendar year 2017 amounting to USD 11.4 billion, a 10.6 percent growth over the previous year, surpassing the previous high of USD 11.1 billion achieved in 2014. This growth
was largely supported by the sustained increase in export earnings stemming from the restoration of the GSP+ facility by the European Union, favourable prices for key commodities in the international market and a flexible exchange rate policy adopted by the Central Bank of Sri Lanka. According to the statistics published by the Export Development Board of Sri Lanka, Tea and Fisheries sectors recorded strong year on year growth of 20 percent and 40 percent respectively. Tea benefited from higher prices and improved access to Middle Eastern markets.
Sri Lanka achieved an annual revenue of Rs 233 billion (US$ 1.53 billion) for its tea exports in 2017 for an export quantity of 288 million kilograms. This is a substantial increase of Rs 48 billion,
up 27 percent from the previous year. The previous highest annual revenue for tea exports in Sri Lankan Rupees, was recorded in 2014 with tea exports of Rs 212 billion (US$ 1.63 billion) for an export quantity of 327 million kilograms of tea. Adverse weather conditions which impacted economic activity contributed to a consequent decline in domestic consumption impacting earnings of listed entities, with the exception of the banking and insurance sectors. This resulted in a subdued performance of the Colombo Stock Exchange (CSE) in comparison to most regional peers, while local participation in equities remained modest, with local retail, institutional and High Net Worth Individuals (HNI) investors continuing to opt for fixed income and property investments. The
I am pleased to present to you the Integrated
Annual Report and Financial Statements for the year ended 31st March 2018, and report that in recognition of our diligent focus on sharpening all aspects of the business,
your company recorded an improvement in performance.
GRI 102-12, 102-14

015Annual Report 2017/18
THE RIGHT THINKING
CSE did however witness an increase in foreign participation which resulted in a 42 percent increase in average daily turnover levels during the period under review.
THE TEA INDUSTRYThe year 2017 was a record year in terms of price, for Sri Lanka’s Tea Industry. Structurally low oil prices stabilised, while macroeconomic instabilities in the Middle East and the Commonwealth of Independent States (CIS) including Russia improved, contributing to a recovery in export demand. Despite a slow start to the year, the prospects of the Tea Brokering segment improved significantly in the second half of the year as trading activities at the Colombo Tea Auctions picked up ahead of the winter buying season. Led by robust demand from key buying markets in Russia and the Middle East, prices for all elevations recorded steep price appreciation at the Colombo Auctions, enabling JKPLC’s Tea Brokering business to end the year on a high note, recording an improvement in performance compared to the previous year.
The total tea production of Sri Lanka for the year 2017 amounted to 307 million kilograms in comparison to 292 million kilograms in 2016. The total national average price of tea sold for the year 2017 was Rs. 618.14 per kilogram, an increase of 32 percent on the national average price of Rs. 468.61 recorded in 2016. Low Growns, accounting for the largest market share with 64 percent of total production, recorded a gain of Rs.150.66 per kilogram while the High Growns and Mid Growns recorded gains of Rs.151.08 per kilogram and Rs.143.95 per kilogram respectively. The FOB average price per kilogram of tea for the calendar year 2017 stood at Rs.807.44 an increase of 26 percent in contrast to an FOB average price of Rs. 639.88 recorded in 2016.
0
100
200
300
400
500
600
700
ANNUAL ELEVATIONAL AVERAGES (Rs/kg)
high grown medium grownlow grown total
2017 2016 2015 2014 2013
THE RUBBER INDUSTRYThe natural rubber industry of Sri Lanka was ranked as the third largest export revenue earner accounting for approximately 8 percent of total export income in 2017. Sri Lanka’s global competitive advantage in certain niche export markets, such as Rubber grades of Latex Crepe and Sole Crepe, have been derived by the quality of the natural rubber and distinctive competencies the industry has developed over the years. Sri Lanka’s rubber exports which are dominated by Solid Tyres, accounted for
around 13 percent of the global market demand in 2017.
Sri Lanka’s rubber plantation industry is dominated by the Smallholder sector which accounts for 65 percent of the rubber area under cultivation while the rest is accounted for by the Regional Plantation Companies (RPC’s). Natural rubber production in Sri Lanka has been subject to significant constraints over the past few years, with the industry being vulnerable to price sensitivities mainly stemming from supply constraints such as labour shortages, weather impacts and loss of rubber land due to diversification into more lucrative crops, industrialisation and village expansion.
The future of Sri Lanka’s natural rubber industry relies on its ability to achieve an industry-wide productivity growth achieved through a consensual and proactive intervention by the two key industry players, the Smallholders and the Regional Plantation Companies with the support from the Government.
The rubber production for the year 2017 recorded a 5 percent growth, totaling 83.1 million kilograms against 79.1 million kilograms produced previous year.
WAREHOUSINGThis segment of the business performed well during the year with increased volumes directly linked with the tea brokering business. The decision to open the doors to the warehousing of tea produce of other brokers paid dividends in increasing the utilisation at the warehouse, together with the implementation of stringent cost controls resulting in an improvement in performance during the year.
STOCK BROKINGTrading conditions at the Colombo Stock Exchange remained subdued, with local retail, HNI’s and institutional investors continuing to opt for fixed income and property investments. Several rights issues by large cap banks also drained liquidity from the market. The benchmark All Share Index (ASI) ended the year at 6,476.78, advancing by 6.8 percent, while the S&P SL20 index rose by 6.1 percent over the year. The passing of the Inland Revenue Act did not have a material impact on the market, with many of the proposed tax changes having been factored in by investors.
Daily average turnover amounted to Rs. 1 billion for the financial year, with activity largely centered on large cap banking and diversified counters amid attractive valuations compared to most regional stock markets. Foreigners remained net
016 JOHN KEELLS PLC
buyers in the market, with net foreign inflow at Rs. 10.2 billion and foreign participation at 47 percent for the period. The CSE’s market capitalisation as at 31st March 2018 was Rs. 3,032.7 billion, compared to Rs. 2,662.9 billion as at the end of the previous year.
Rs 799 Mn
30%
The Group recorded a consolidated revenue for the year under review.
Revenue increase over the previous year.
PERFORMANCE SUMMARYThe Group recorded a consolidated revenue of Rs 799 million for the year under review, a 30 percent increase over the previous year. The increase is attributed to an increase in revenue by the Produce Broking segment due to an increase in tea volumes and prices at the Colombo tea auctions and a 66 percent increase in revenue at John Keells Stock
Brokers (Pvt) Ltd. The increase in tea volumes also contributed to a 19 percent rise in revenue at John Keells Warehousing (Pvt) Ltd during the period under review.
The improved revenue across all three segments of the Group and the increase in fair valuation of investment property by Rs 60 million, when compared to the previous years’ Rs 45 million contributed to an increase in Profit After Tax (PAT). The PAT recorded for the year was Rs 238 million, a 24 percent increase in comparison to the PAT of Rs 191 million recorded in the previous year.
FUTURE OUTLOOKGlobal tea consumption continues to grow and is being led by India and China who jointly account for 50 percent of the world’s tea consumption. The United States of America, although a small market is expected to grow in its demand for iced tea and instant tea over the flavored and other specialty varieties.
Managing challenges locally in order to improve production is essential while ensuring quality of tea produced is not compromised. On the external front, improved oil prices and stable environments in key tea importing nations would help sustain the increased prices and increased export volumes recorded during the year.
APPRECIATIONSI wish to thank each and every member of the John Keells PLC team as well as our stakeholders, for their loyalty and commitment during the year.
I welcome on to the Board Mr K.N.J Balendra and Mr J.G.A Cooray following the retirement of Mr A. D. Gunewardene and Mr J.R.F. Peiris with effect from 31st December 2017. I would like to place on record our sincere appreciation to them for their valuable contribution during their tenure and wish them the very best in their future endeavours. I also take this opportunity to thank my colleagues on the Board for their guidance and support.
S C RatnayakeChairman28th May 2018

017Annual Report 2017/18
THE RIGHT THINKING
18 | Business Model 20 | Value Creation Model 22 | Stakeholder Relationships 25 | Operating Environment32 | Competitor Analysis 33 | Capital Management Review - Financial Capital - Manufactured Capital - Social and Relationship Capital - Human Capital - Intellectual Capital - Natural Capital 57 | Sustainability
The Right Strategy

018 JOHN KEELLS PLC
We expedite the Right Thinking to manage our input, i.e the resources, depend on to carry out the operations with the vision of long term value creation. Throughout the process, the enhance the positives and minimize the negative outcomes of the business, sustaining value for the stakeholders we serve.
Business Model
RESOURCES WE DEPEND ON ACTIVITIES
Financial Capital Debt and Equity Cash Flow from Operations
Manufactured CapitalFixed Assets base
Human Capital DiversityExperience
Social & Relationship Capital Stakeholder Engagement Relationship Building
Intellectual Capital Technology Expertise Brand Development
Natural Capital EnergyWater
Business activities are geared to ensure the ability to provide sustainable value creation for all our stakeholders
Produce Brokering and WarehousingResponsible SourcingStrengthening sustainable relations with the Tea/Rubber Producers
Supplier Development Advising on manufacturing and financial support
Tasting, Grading Rubber & MarketingConsistently improve quality
Storage and warehousing solutions Providing fully fledged warehousing solutions
Delivery and Logistics Proactive in improving and adopting new technology
Stock Brokering Providing, guidance and advice on investment opportunities
Primary Output Tea/Rubber/Share broking and Tea Warehousing

019Annual Report 2017/18
THE RIGHT THINKING
OUTCOMES RIGHT THINKING ON POSITIVE/NEGATIVE OUTCOMES
Financial Capital Shareholder returns/dividends Payments to other stakeholders
Manufactured Capital Total asset purchases
Human Capital Staff motivationTalented/efficient work force
Social & Relationship Capital Community developmentBetter stakeholder relations
Intellectual Capital Intellectual assets
Natural Capital Reduction of carbon footprint Reduced utility consumption
Restructuring debt capital Competitive pricing on short term debt
Continue to protect and improve through development activities
Advancing on leadership, encouraging team work
Continuously improve stakeholder engagement strategies
Continue to improve governance practices, leverage on expertise and specialised skills and encourage innovation
Pursue further renewable sources of energy, upholding are pledge on the plastic initiative, optimised energy and water usage
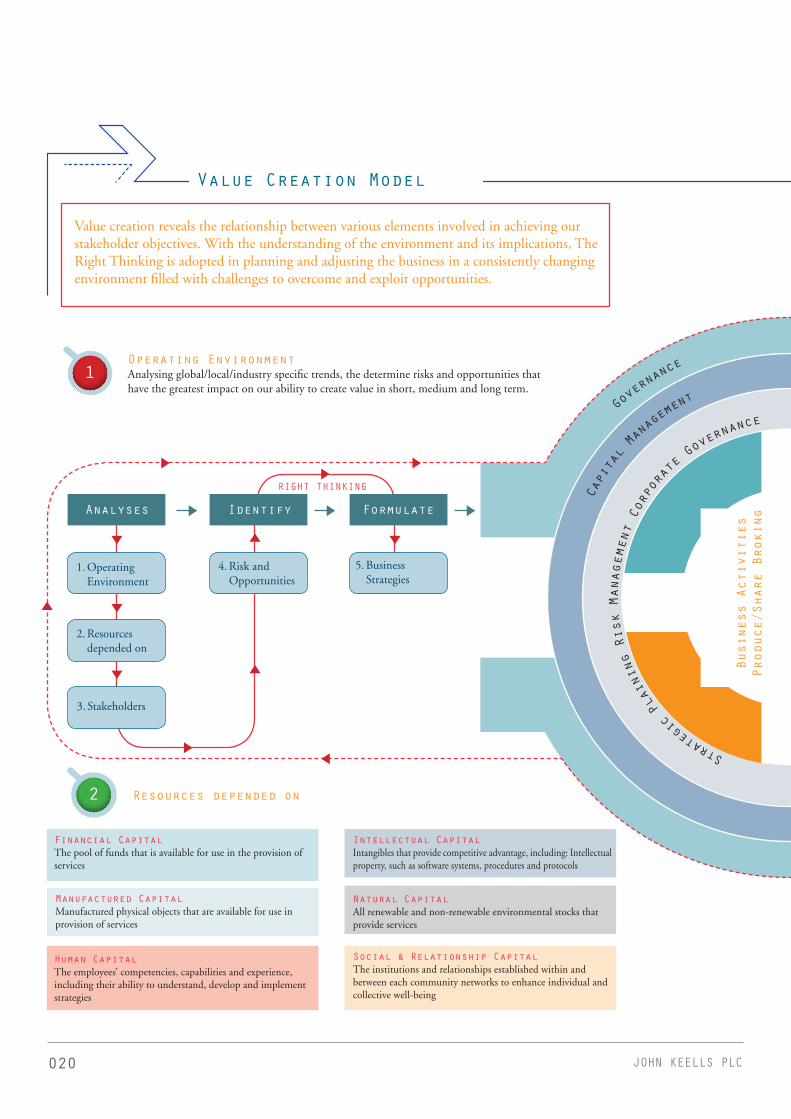
020 JOHN KEELLS PLC
Value creation reveals the relationship between various elements involved in achieving our stakeholder objectives. With the understanding of the environment and its implications, The Right Thinking is adopted in planning and adjusting the business in a consistently changing environment filled with challenges to overcome and exploit opportunities.
1Operating Environment Analysing global/local/industry specific trends, the determine risks and opportunities that have the greatest impact on our ability to create value in short, medium and long term.
2 Resources depended on
Financial Capital The pool of funds that is available for use in the provision of services
Social & Relationship Capital The institutions and relationships established within and between each community networks to enhance individual and collective well-being
Manufactured CapitalManufactured physical objects that are available for use in provision of services
Intellectual Capital Intangibles that provide competitive advantage, including: Intellectual property, such as software systems, procedures and protocols
Human Capital The employees’ competencies, capabilities and experience, including their ability to understand, develop and implement strategies
Natural Capital All renewable and non-renewable environmental stocks that provide services
Value Creation Model
Analyses Identify Formulate
1. Operating Environment
2. Resources depended on
3. Stakeholders
4. Risk and Opportunities
5. Business Strategies
Business Activities
Produce/Share Broking
Governanc
e
Capital Ma
nagemen
t
Susta
inab
ility Management Transparent Reporti
ng
RIGHT THINKING
Strat
egic
Plaining Risk Management Corporat
e Gover
nance

021Annual Report 2017/18
THE RIGHT THINKING
StakeholdersThrough engagement, identifying the economic, social and environmental values. The strengths and issues raised by the stakeholders are incorporated in the assessment of Risk and Opportunities.
Risk and Opportunities Capabilities are evaluated alongside the identified risk and opportunities and strategic planning is incorporated.
3
4
5Business Strategies Prioritising the risk & opportunities, identify the material matters to sustain value in short, medium and long term.
6Value Creation Key stakeholders’ goals
Suppliers Sustained growth revenue
Shareholders Sustained growth in dividend
Communities Responsible community engagement
Employees Talent development
Customers Sustained growth in supply and revenue
Warehousing of Tea
Governanc
e
Capital Ma
nagemen
t
Susta
inab
ility Management Transparent Reporti
ng
6. Value Creation
Strat
egic
Plaining Risk Management Corporat
e Gover
nance

022 JOHN KEELLS PLC
STAKEHOLDER ENGAGEMENTStakeholder engagement marks the first step in our journey towards identifying how we can deliver economic, social and environmental value, and by engaging with our stakeholders we are able to gain a better perspective of what they expect of the Group.
The purpose of our stakeholder engagement mechanism is to build trust and promote advocacy among external stakeholders in order to secure their commitment to work together towards realising our corporate vision.
STAKEHOLDER RELATIONSHIP
STAKEHOLDERS INVOLVEMENTRegular and ongoing interaction with all stakeholder groups speaks to our efforts to operationalise an integrated sustainability approach that would build long-term business resilience. Therefore stakeholder engagement is undertaken with a far broader aim than merely communicating ‘to’ various stakeholder groups. Rather, we aim to establish deep and meaningful partnerships with stakeholders to ensure they remain aligned to our values and are willing to work closely together for mutual benefit.
Focuses on
Long term stability
Consistent performance
Our right thinking
Adopting effective and sustainable relationships
Process improvements and continuous development
Shareholders/ Capital Providers
Focuses on
Job security
Remuneration
Career progression
Social recognition
Our right thinking
Implementation of a transparent and competitive remuneration structure
Investing in learning and development
Employees
Focuses on
Community development
Our right thinking
Partnership with the John Keells Foundation and National Level Institutes to implement community development projects
Communities
Focuses on
Quality service
Long term relations
Our right thinking
Adopting latest technology
Long term sustainable relations
Customers
Focuses on
Quality service
Long term relations
Comparative benefits
Our right thinking
Effective management of risk
Building long term/sustainable relationships
Maintaining goodwill
Suppliers
GRI 102-40 , 102-42
023Annual Report 2017/18
THE RIGHT THINKING
Stakeholders Mode of Engagement Levels of Engagement
Frequency
CUSTOMERS • Trading customers• Inter-company customers • Institutional customers• Individual customers
• Customer surveys• Electronic communication methods• Informing market performance • Reporting on the individual sale related information • Participating along with estate/factory visits • Representing in trade promotions and promoting
commodities • Linking the sellers’ capabilities and export market
conditions• Rewarding on outstanding performance
• Consult • Involve• Inform • Inform • Interactive
• Interactive
• Empower• Inform
• Annually• Continuously • Weekly • Weekly • Continuously
• Continuously
• Continuously • Annually
EMPLOYEES• Internal employees• Contract employees• Outsourced staff • Interns • Management• Directors
• Employee performance evaluations• Participating in the GPTW surveys • Conducting 360-degree performance evaluations • Employee councils and Meetings
• Focus group discussions (by independent parties)• Employee Portal of the Company network • Giving Feedback on employee performance • Recognition through rewarding • Conducting HR day and training on employee rights • Company’s ‘Open Door’ policy encourages direct
employee feedback • Open box for suggestions
• Involve • Involve• Inform • Interactive
• Interactive • Interactive • Interactive • Empower• Empower
• Empower• Interactive
• Annually/Biannually • Annually• Annually • Continuously
• Annually • Continuously • Annually/Biannually • Annually • Annually
• Continuously• Continuously
COMMUNITIES • Local community• Government• Local government• Media• Pressure groups • Advisers • Regulatory bodies • Trade Associations • Governmental Monitoring
Institutions
• Community development projects • Declaration on performance/returns and pay dues • Declaration on performance/returns and pay dues • Declaration on performance/returns and welfare activities • Participating/involving in discussion for the growth and
welfare • Participating/involved in expert opinions • Participating/involving in discussion for the growth and
welfare • Participating/involving in discussion for the growth of the
industry • Declaration on performance/returns and pay dues
• Involve • Involve• Inform • Inform
• Interactive • Interactive
• Interactive
• Interactive • Inform
• Continuous• Continuous• Continuous• Continuous
• Continuous• Continuous
• Continuous
• Continuous• Continuous
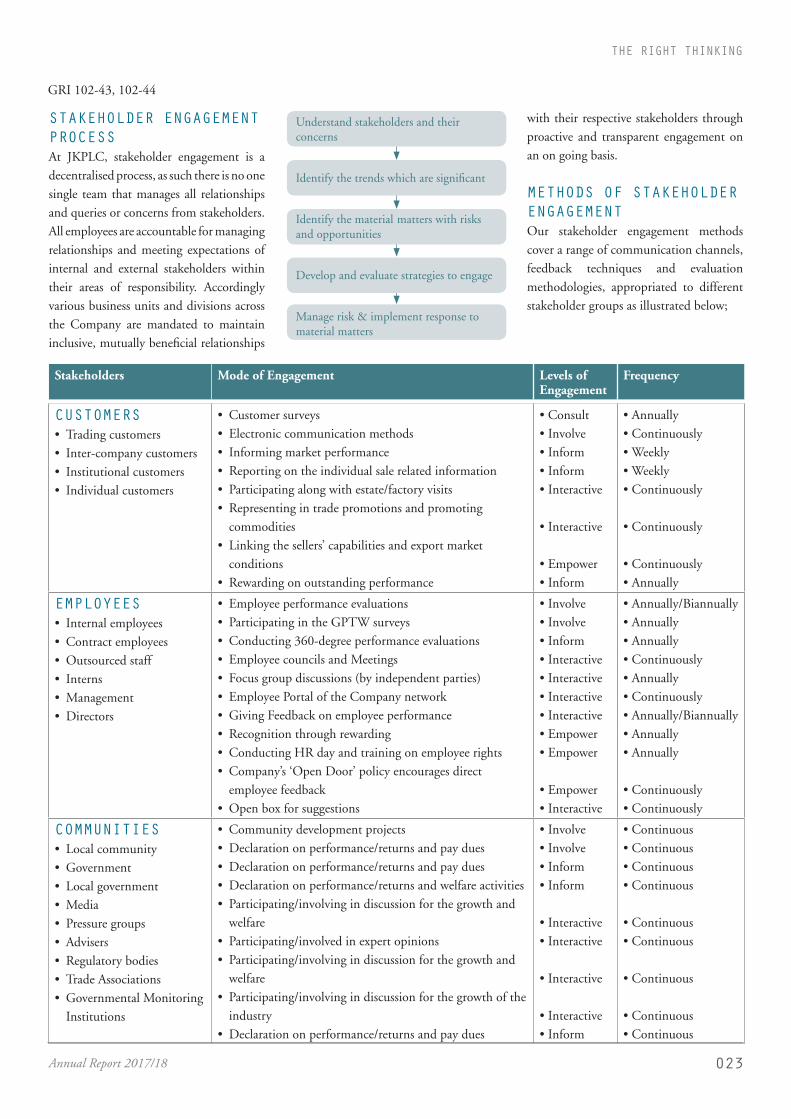
STAKEHOLDER ENGAGEMENT PROCESS At JKPLC, stakeholder engagement is a decentralised process, as such there is no one single team that manages all relationships and queries or concerns from stakeholders. All employees are accountable for managing relationships and meeting expectations of internal and external stakeholders within their areas of responsibility. Accordingly various business units and divisions across the Company are mandated to maintain inclusive, mutually beneficial relationships
Understand stakeholders and their concerns
Identify the trends which are significant
Identify the material matters with risks and opportunities
Develop and evaluate strategies to engage
Manage risk & implement response to material matters
with their respective stakeholders through proactive and transparent engagement on an on going basis.
METHODS OF STAKEHOLDER ENGAGEMENTOur stakeholder engagement methods cover a range of communication channels, feedback techniques and evaluation methodologies, appropriated to different stakeholder groups as illustrated below;
GRI 102-43, 102-44
024 JOHN KEELLS PLC
Stakeholders Mode of Engagement Levels of Engagement
Frequency
SHAREHOLDERS/ CAPITAL PROVIDERS • Shareholders • Banks • Financial Institutions
• Review the past year’s performance and engage in discussions with the management at Annual General Meeting
• Statement of providing the quarterly Financial Performance
• Company website/ CSE website• Review on financial stability
• Inform
• Inform • Interactive • Inform
• Annually
• Quarterly • Continuous• Continuous
SUPPLIERS • Regional Plantation
companies • Sole proprietors/
partnerships • Listed companies • Governmental Financial
Monitoring Units• Intercompany
• Informing market performance • Reporting on the individual sale related information • Principle issues discussed including product quality and
improvements • Customer satisfaction through meeting their expectations • On-site visits from suppliers and on-site visits to suppliers • Feedback on the performance and recognition • Rewarding on outstanding performance
• Inform • Inform
• Inform • Interactive • Interactive • Interactive • Empower
• Continuous• Continuous
• Continuous• Continuous• Continuous• Continuous• Annually
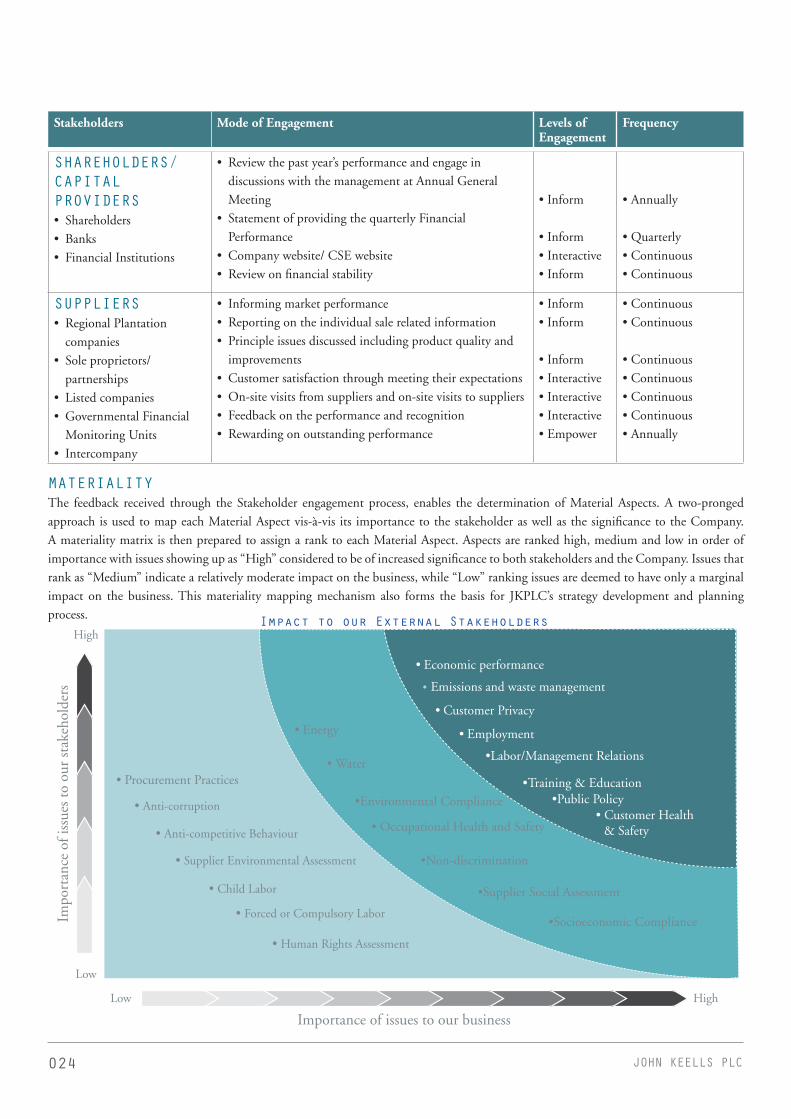
MATERIALITYThe feedback received through the Stakeholder engagement process, enables the determination of Material Aspects. A two-pronged approach is used to map each Material Aspect vis-à-vis its importance to the stakeholder as well as the significance to the Company. A materiality matrix is then prepared to assign a rank to each Material Aspect. Aspects are ranked high, medium and low in order of importance with issues showing up as “High” considered to be of increased significance to both stakeholders and the Company. Issues that rank as “Medium” indicate a relatively moderate impact on the business, while “Low” ranking issues are deemed to have only a marginal impact on the business. This materiality mapping mechanism also forms the basis for JKPLC’s strategy development and planning process.
Low
Low High
High
Impo
rtan
ce o
f iss
ues
to o
ur s
take
hold
ers
Importance of issues to our business
• Energy
• Emissions and waste management
• Customer Privacy
• Water
•Environmental Compliance
• Occupational Health and Safety
• Procurement Practices
• Anti-corruption
• Anti-competitive Behaviour
• Supplier Environmental Assessment
• Child Labor
• Forced or Compulsory Labor
• Human Rights Assessment
•Labor/Management Relations
•Training & Education•Public Policy
• Customer Health & Safety
• Economic performance
• Employment
•Non-discrimination
•Supplier Social Assessment
•Socioeconomic Compliance
Impact to our External Stakeholders

025Annual Report 2017/18
THE RIGHT THINKING
TEA BROKERINGOPERATING CONTEXTGlobal Tea output declined in 2017 compared to 2016, as prolonged bad weather resulted in lower output in the major tea producing nations of Kenya and Uganda. In the Asian region too, Bangladesh witnessed a decline in output compared to the previous calendar year. Consequently, a shortage of ‘Crush-Tear-Curl’ (CTC) varieties of black teas was seen, as global black tea production dropped to 1,823.69 million kilograms from 1,846.04 million kilograms in the previous year, despite India, the world’s largest producer of black tea, reporting a higher output over the previous year.
However by far the most notable improvement in output levels was recorded by Sri Lanka, where production was up by 14.5 million kilograms from 292 million kilograms in 2016 to 307 million kilograms by end-2017, a 5 percent year-on-year increase. Of this, the Low Grown elevation teas reported a notable 7 percent increase in volume, while Medium elevation tea witnessed a marginal increase and High Grown volumes stayed on par with the previous year.
Category wise segmentation indicated a moderate growth of 4 percent in orthodox tea volumes while CTC and Green Tea volumes registered significant growth rates of 17 percent and 13 percent respectively.
Of the major tea producing and exporting countries, Sri Lanka led the way with a increase in export volumes to 289 million kilograms.
OPERATING ENVIRONMENT
0
100
200
300
400
500
600
700
national production and averages
national production - Mn Kgnational average price- Rs/Kg
2018 2017 2016 2015 2014
Meanwhile, the global shortage of black tea in the major tea producing nations together with the higher demand especially from Turkey and Russia paved the way for record prices at the Colombo tea auctions with the national average reaching US$4.07 per kilogram compared to US$3.19 in 2016. In contrast, the national average for Mombasa, Kenya the island’s main competitor stood at US$2.82 a kilogram in 2017.
0
5
10
15
20
25
30
35
40
sri lanka tea exports (Mn. Kg)
2017 2016
turkey
iraq
russia
iran uae
azerbaijan
libya
china
japan
syria
chile
germany
hongkong usa
Turkey emerged as the largest buyer of Ceylon Tea in 2017 accounting for 35.4 million kilograms followed by Iraq with 31.4 million kilograms. Russia was in third place buying 31 million kilograms of Ceylon Tea in 2017, seemingly unaffected by their temporary ban on Sri Lankan Tea. In yet another notable development, Sri Lanka’s tea exports to China surged by 30 percent to 9.9 million kilograms in 2017 from the year before, making it the eighth biggest market for Ceylon tea.
GRI 102-10, 102-12, 102-47, 102-48, 102-49, 103-01, 201-02, 204-01

026 JOHN KEELLS PLC
TEA EXPORT COMPARISONQty - Mn kg, FOB - Rs./Kg, Value - Rs.Mn
Category
2017 2016
Qty FOB Value Qty FOB Value
Bulk 169.4 725.25 122,825 171.78 543.7 93,400
Packets 86.51 792.79 68,583 85.02 628.9 53,471
Tea Bags 17.81 1,382.51 24,619 19.62 1,199.1 23,530
Instant Tea 2.12 1,250.83 2,651 2.01 1,215.6 2,443
Green Tea 2.40 1,538.90 3,697 2.44 1,386.6 3,388
Sub Total 278.24 799.35 222,375 280.87 627.4 176,232
Re-Exports 10.79 1,016.08 10,963 7.9 1,082.2 8,546
Total 289.03 807.44 233,338 288.77 639.88 184,778
Bolstered by higher export volumes and record prices, revenue attributed to Tea exports grew by 26 percent to reach the highest-ever figure of Rs. 233 billion in 2017, which saw Tea exports regain its position as the country’s second largest foreign exchange earner - a fitting tribute to commemorate the 150th year of Ceylon Tea.
400
540
680
820
960
1100
sri lanka tea exports fob price(rs/kg)
2017 2016
turkey
iraq
russia
iran uae
azerbaijan
libya
china
japan
syria
chile
germany
hongkong usa
These achievements are even more impressive, considering the ongoing challenges facing the country’s Tea industry, in particular the government imposed ban on the weedicide – Glyphosate, which has forced plantations to resort to the use of alternative weedicides such as MCPA. Deemed to contain toxicity levels over and above
the minimum stipulated by many Tea importing countries in Europe and Japan, the continued use of MCPA is likely to irrevocably change the perception of Ceylon Tea.
0
70
140
210
280
350
420
QUANTITY SOLD AT WORLDAUCTION CENTRES (Mn kg)
2017 2016 2015 2014 2013
mombasa colombo kolkata siliguri guwahati
REVIEW OF BUSINESS PERFORMANCEOperating ResultsThe favourable market conditions augured well for John Keells PLC’s (JKPLC) Tea Brokering business, with the unit reporting impressive results for the year under review. Total volumes handled marginally decreased by 2 percent to 40.59 million kilograms in 2017/18 from 41.54 million kilograms in 2016/17. The marginal decrease in volumes is attributed to the strategic decision by JKPLC to let go of certain clients with high volumes
who demonstrated low long-term sustainability. Meanwhile, the strong emphasis on quality and the overall improved market conditions helped the Company to record improved prices across all elevations, with the Low-grown teas in particular achieving consistently high prices throughout the year.
Driven by record prices, the segment’s revenue for the twelve months ending 31st March 2018 reached Rs. 519 million, exceeding both budgeted estimates and the previous year’s revenue figure of Rs. 423 million, while profits from operating activities increased to Rs. 311 million in 2017/18, up by 47 percent from Rs. 212 million in the previous year.
0 100 200 300 400 500 600 700
john keells plc5 year tea average price (Rs)
high grownmedium grownlow growntotal
2018
2017
2016
2015
2014

027Annual Report 2017/18
THE RIGHT THINKING
Key Operational Focus
The operational focus for 2017/18 was centered mainly on improving the quality of tea, prompting the Company to urge factories to invest in new technology and enable them to modernise their production processes and thereby raise the quality of their output. However, in tandem with JKPLC’s selective lending strategy that seeks to minimize the risk of default, credit facilities were extended only to currently operational factories with a proven track record. Consequently, the total advances portfolio reported a decrease of Rs. 49 million to Rs. 1,260 million as at 31st March 2018 from Rs. 1,308 million a year ago.
OVERVIEW
JKPLC’s tea brokering business holds a pre-eminent position among the local tea brokering community and having been in business for over 15 decades, is ranked among the top tea brokers with a current market share of approximately 13.60 percent
key strengths• Strong track record• Backed by the strength of the John
Keells brand
JKPLC - ELEVATION WISE MONTHLY TOP PRICES - TEA
2017/2018 2016/2017
High Medium Low Total High Medium Low Total
April 31 24 34 89 24 16 41 81
May 47 41 55 143 35 31 56 122
June 42 29 45 116 51 34 67 152
July 35 21 41 97 26 21 46 93
August 45 39 46 130 48 28 49 125
September 38 24 41 103 41 33 54 128
October 43 29 50 122 29 24 40 93
November 31 24 39 94 48 32 42 122
December 17 17 23 57 21 18 33 72
January 33 26 43 102 50 53 60 163
February 14 16 31 61 25 25 40 90
March 29 25 36 90 40 36 47 123
405 315 484 1,204 438 351 575 1,364
During the year, the Company further encouraged Regional Plantation Companies to resume non-operational factories at a minimum during the peak-cropping season. JKPLC worked closely with these reopened factories to maintain high quality standards during this short window of opportunity, which in turn benefitted both parties with increased revenue and volumes.
Future Outlook
Although the year 2017 ended with favourable tea prices, the setback and resulting uncertainty in export of tea to Russia, placed Sri Lanka in a precarious position. Fortunately thanks to the long-standing relationship with Russia, the matter was resolved within a short period of time, although with new conditions where exports from Sri Lanka are now
subject to stringent testing. As an added measure, the Sri Lanka Tea Board is working closely with tea producers and exporters to ensure that phytosanitary standards are vigorously adhered to on all tea consignments originating from Sri Lanka.
Meanwhile, global tea consumption continues to grow led by India and China who jointly account for 50 percent of the world’s tea consumption.
The USA, although a small market is expected to increase its demand for iced tea and instant tea, as well as for flavoured and other specialty varieties of health Tea.
Moreover, improved oil prices and greater economic stability in traditional tea importing nations would also be a plus for sustained increased prices and increased export volumes.
If Sri Lanka is to capitalise on these opportunities, it is important to improve the country’s Tea crop and production levels, without compromising on quality. Lifting the ban on ‘Glyphosate’ is critical if the country is to achieve this goal.
The Bigger Picture
The biggest threat of all to the tea industry is the weather, as global warming has taken on new dimensions and the resulting climate change leaves a question as to the future of the tea industry worldwide. Under present climatic conditions the production of tea leaves suffer in terms of quality. Although the response to this concern needs to be a collective one, it remains halfhearted. The future of the tea industry will therefore depend on how we ultimately respond to climate change.

028 JOHN KEELLS PLC
RUBBER BROKERINGOPERATING CONTEXTRubber remains Sri Lanka’s third largest foreign exchange earner, accounting for approximately 8 percent of export income in 2017. Sri Lanka has a strong competitive advantage in several niche export markets, mainly certain grades of Latex Crepe and Sole Crepe thanks to the quality of the natural rubber and distinctive competencies the industry has accumulated over the years. Sri Lanka’s rubber exports, which are dominated by Solid Tyres, accounted for around 13 percent of the global market demand in 2017.
The country’s Rubber export volumes increased by 6.6 percent year-on-year to 17.2 million kilograms in 2017, led by a strong demand from China. Favourable global demand, helped boost prices at the Colombo Rubber Auctions, with the average price of RSS Number 1 (RSS1) up by 40.7 percent to Rs. 336.72 per kilogram, while the average price of Latex Crepe increased by 34.1 percent, to Rs. 351.71 per kilogram.
0
10
20
30
40
50
60
70
sri lankan rubber production(mn. kg)
20132017 2016 2015 2014
sheet rubbercrepe rubberothers
Sri Lanka’s Rubber production grew by 5.1 percent to 83.1 million kilograms
in 2017, from 79.1 million kilograms in 2016. Commendably this growth comes amidst unfavourable weather conditions, particularly during the first half of the year where traditional rubber growing areas were inundated by floods.
0
30
60
90
120
150
0
500
1,000
1,500
2,000
2,500
3,000
3,500
rubber cultivation (hectares)
2018 2017 2016 2015 2014total extentarea under tapping replantingnew planting
‘000
The average yield for rubber was 809 kilograms per hectare in 2017, a marginal increase, of 1.1 percent from the average yield recorded in 2016. The low yield in rubber was primarily driven by the decline in the number of tapping days, particularly in the smallholder sector, where key producers of Ribbed Smoked
Sheet (RSS) were seen scaling back on tapping operations in response to adverse weather conditions. Nonetheless, cost of production remains high and in 2017 increased by a further 8.3 percent year-on-year, making rubber production a less attractive source of income for the smallholder sector.
Of the major categories of Rubber produced by the country, the largest component of total rubber production - sheet Rubber production increased by 4.4 percent to 41.5 million kilograms. In contrast, crepe Rubber production dropped sharply by 23.3 percent to 11.5 million kilograms in 2017. Domestic Rubber consumption declined by 9.2 percent in 2017 to 129 million kilograms, as lower global prices saw many local industries begin importing their requirements of Rubber. However, with the increase in global rubber prices towards the end of 2017, the domestic market also witnessed a corresponding increase in prices.
REVIEW OF BUSINESS PERFORMANCEOperating Results
JKPLC’s Rubber sales volumes increased from 3.59 million kilograms in the

029Annual Report 2017/18
THE RIGHT THINKING
previous year to 3.67 million kilograms in the year under review, denoting a 2.23 percent increase year-on-year. Consequently, JKPLC’s volume-based market share increased to 31.83 percent in 2017/18, from 25.32 percent a year ago.
OVERVIEW
JKPLC is among the leading Rubber brokers in Sri Lanka. Having, been in business for 14 decades, the segment has built a solid track record and today hold a market share of approximately 31.83 percent.
key strengths• Strong track record• Backed by the strength of John Keells
brand
At Rs. 308.11, the average price per kilogram recorded by JKPLC at the Colombo Auctions in the year under review was also significantly higher than the Rs. 251.72 average reported for the previous year.
The combination of higher sales volume together with the higher auction prices pushed up JKPLC’s revenue from Rubber broking to Rs 11.83 million, up by
22.09 percent from the Rs. 9.68 million registered in the previous year.
Future Outlook
There appears to be considerable optimism that the local natural Rubber industry will make a full recovery in the year ahead, as the imminent increase in Crude oil prices is likely to push up the price of synthetic Rubber. Consequently, the demand for natural rubber is expected to grow in the coming months as China and other major consuming countries are expected to begin limiting synthetic rubber imports and instead opt to source natural rubber for their end products.
0 10 20 30 40 50
rubber auction qty market share-%
2018
2017
2016
2015
2014
JKPLC F & W J D SONSLCBL SIYAKA
0
4,000
8,000
12,000
16,000
export volume-Kg’000
2017 2016 2015 2014 2013
sheet creap other
However, with countries Vietnam and Thailand continuing to flood the global market with huge volumes of natural rubber, prices in the world market may face some uncertainty in the coming months, bringing fresh challenges for Sri Lanka’s natural Rubber industry in the forthcoming year.

030 JOHN KEELLS PLC
WAREHOUSINGREVIEW OF BUSINESS PERFORMANCE A successful year for the warehousing operation bolstered by a robust increase in storage volumes. Led by notably higher trading volumes at the Colombo Tea Auctions for good part of the year, average capacity utilisation increased to 70 percent in 2017/18 from 57 percent in the previous year.
Consequently revenue exceeded expectations, recording a year-on-year increase of 19 percent, which enabled the warehouse operation to deliver a strong bottom line performance for the year under review.
In a notable development, plans were drawn up for a broad-ranging infrastructure modernisation programme to upgrade the hardware and software of the warehouse operation over the next three years. Marking the first phase of the initiative, the roof of the warehouse complex was fully renovated during the year. Completed at a cost of Rs. 26.78 million, the re-roofing effort was designed to enhance the use of natural light and also improve the ambient air quality within the complex.
Meanwhile as part of the ongoing commitment to benchmark world-class standards, the HACCP ISO 22000:2005 and OHSAS 18000:2007 certifications were successfully renewed for the twelfth and sixth consecutive year respectively. This
consistency further enhances the credentials of the warehouse facility and serves as a competitive advantage in the market.
40
50
60
70
80
store space utilization-%
2018 2017 2016 2015 2014

031Annual Report 2017/18
THE RIGHT THINKING
STOCK BROKERINGOPERATING CONTEXTTrading conditions at the local equity market remained subdued, with local retail, High Net worth Individuals (HNI) and institutional investors continuing to opt for fixed income and property investments. Several rights issues by large cap banks also drained liquidity from the market. Notably, despite the diminished investor appetite for equities, two new Initial Public Offering’s (IPO) during the year were both oversubscribed.
Despite subdued trading conditions, the benchmark All Share Index (ASI) ended the year at 6,476.78, advancing by 6.8 percent, while the S&P SL20 index rose
by 6.1 percent over the year, compared to two consecutive years of decline in the immediate past.
Average daily turnover increased to US $6 million in 2017 compared to US$ 5 million in 2016, on the back of several foreign fund managers increasing their specific allocations to Sri Lanka in the first half of 2017.
According to statistics, foreigners were net buyers in 2017, with a net inflow of US$ 121 million compared to a meager inflow of US $13 million in 2016. Consequently, foreign participation as a percentage of total market turnover increased to 47 percent in 2017 compared to 42 percent in 2016.
Review of Business Performance
Operating Results
Swift action to capitalize on market movements enabled John Keells Stock Brokers (Pvt) Ltd (JKSB) to register a phenomenal 66 percent increase in revenue from Rs. 116 million in 2016/17 to Rs. 193 million for the year under review.
Future Outlook
Market conditions continue to be uncertain on both a local as well as a global perspective with emerging markets across the world having been under some pressure. However, the company feel that the local market is undervalued on a fundamental basis.
032 JOHN KEELLS PLC
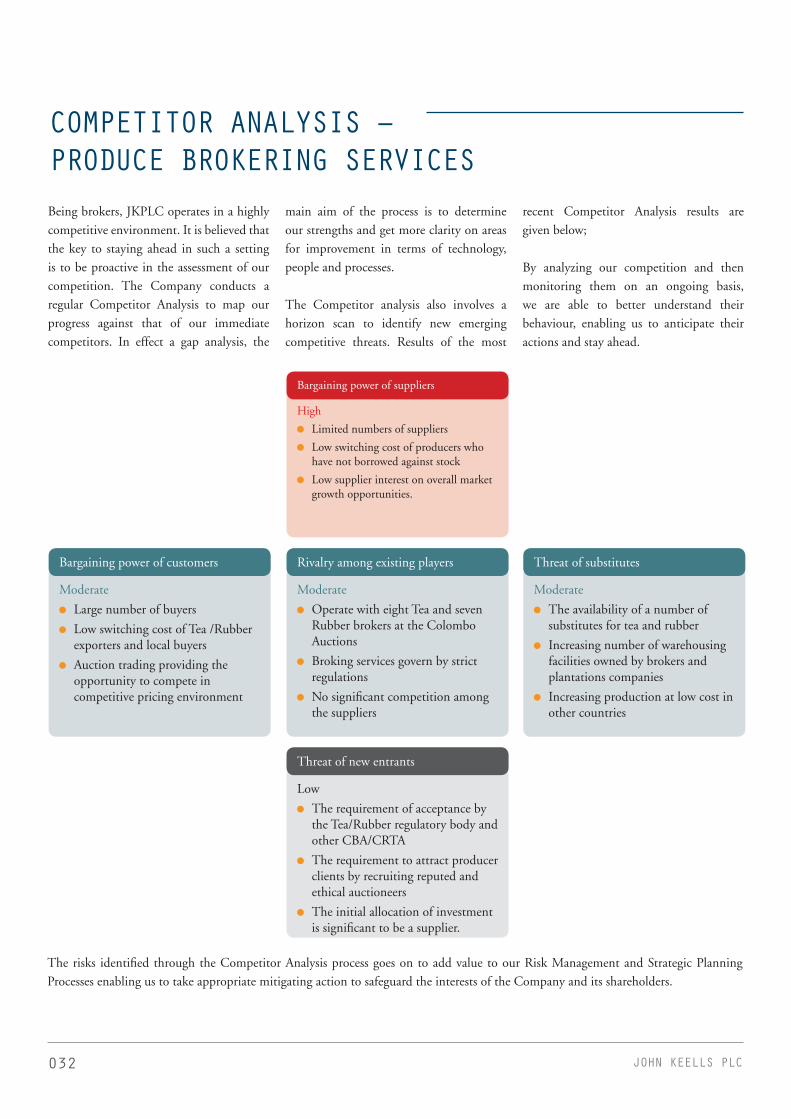
Being brokers, JKPLC operates in a highly competitive environment. It is believed that the key to staying ahead in such a setting is to be proactive in the assessment of our competition. The Company conducts a regular Competitor Analysis to map our progress against that of our immediate competitors. In effect a gap analysis, the
main aim of the process is to determine our strengths and get more clarity on areas for improvement in terms of technology, people and processes.
The Competitor analysis also involves a horizon scan to identify new emerging competitive threats. Results of the most
recent Competitor Analysis results are given below;
By analyzing our competition and then monitoring them on an ongoing basis, we are able to better understand their behaviour, enabling us to anticipate their actions and stay ahead.
Bargaining power of suppliers
High
Limited numbers of suppliers
Low switching cost of producers who have not borrowed against stock
Low supplier interest on overall market growth opportunities.
Bargaining power of customers
Moderate
Large number of buyers
Low switching cost of Tea /Rubber exporters and local buyers
Auction trading providing the opportunity to compete in competitive pricing environment
Rivalry among existing players
Moderate
Operate with eight Tea and seven Rubber brokers at the Colombo Auctions
Broking services govern by strict regulations
No significant competition among the suppliers
Threat of new entrants
Low
The requirement of acceptance by the Tea/Rubber regulatory body and other CBA/CRTA
The requirement to attract producer clients by recruiting reputed and ethical auctioneers
The initial allocation of investment is significant to be a supplier.
Threat of substitutes
Moderate
The availability of a number of substitutes for tea and rubber
Increasing number of warehousing facilities owned by brokers and plantations companies
Increasing production at low cost in other countries
COMPETITOR ANALYSIS – PRODUCE BROKERING SERVICES
The risks identified through the Competitor Analysis process goes on to add value to our Risk Management and Strategic Planning Processes enabling us to take appropriate mitigating action to safeguard the interests of the Company and its shareholders.
033Annual Report 2017/18
THE RIGHT THINKING
CONTEXT: JKPLC’s Financial Capital refers to the pool of funds including retained earnings, and a combination of long and short term loans from capital providers and equity.
MANAGEMENT APPROACH: At JKPLC we practice an integrated strategy for the management of our Financial Capital, where our decisions take cognizance of market conditions, risk profiles, operational constraints and industry trends, all aimed at effective margin management.
Strict internal controls and governance processes validate our revenue generation and cost control models, while proactive risk management safeguards against external shocks.
Strategic planning and resource allocation is another key pillar of our overall Financial Capital management strategy. It ensures adequate resources are allocated for the proper functioning of other capitals and contributes positively towards the Company’s economic value generation capacity.
ACTIVITY REPORT 2017/18Revenue
The Group recorded a consolidated revenue of Rs 799 million for the year under review, a 30 percent increase compared to the 613 million recorded in the previous year. The increase is mainly attributed to significantly higher revenue contribution by John Keells Stock Brokers (Pvt) Ltd (JKSB), where turnover increased by 66 percent year-on-year. The Produce Broking segment too made a notable contribution as higher
tea volumes together with stronger prices at the Colombo tea auctions pushed up the segment’s turnover. The increased utilisation of warehouse capacity also positively impacted the revenue of John Keells Warehousing (Pvt) Ltd (JKW).
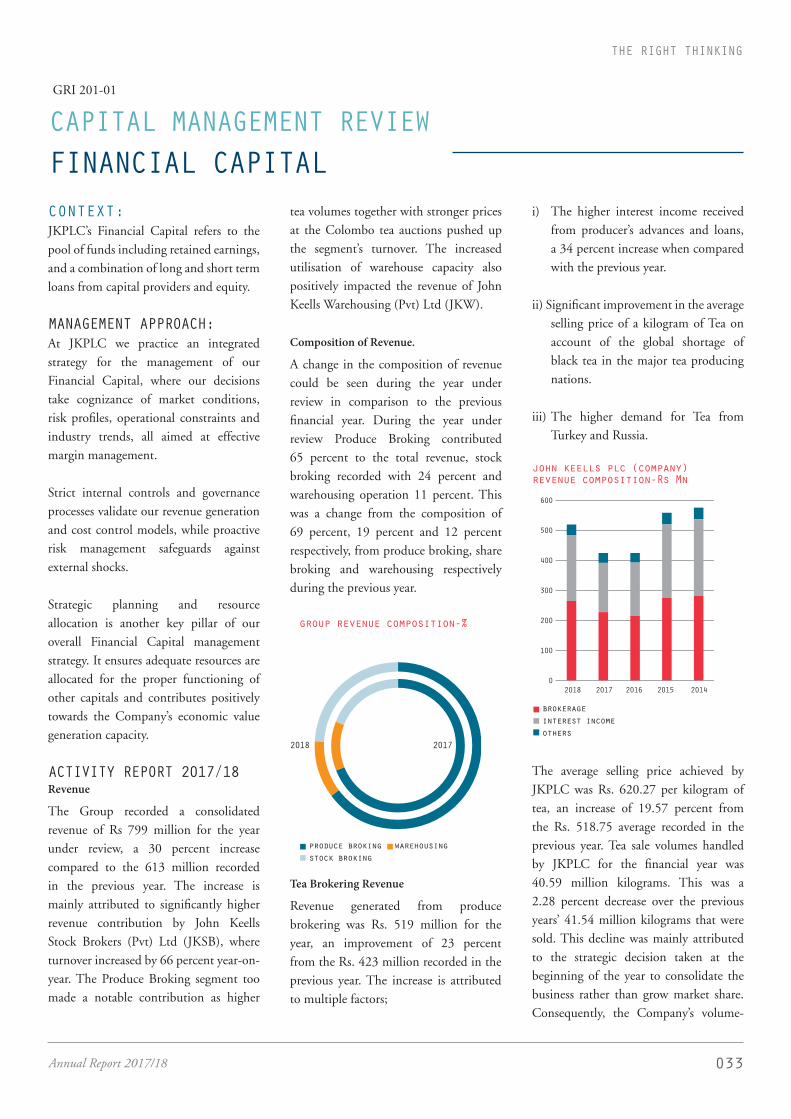
Composition of Revenue.
A change in the composition of revenue could be seen during the year under review in comparison to the previous financial year. During the year under review Produce Broking contributed 65 percent to the total revenue, stock broking recorded with 24 percent and warehousing operation 11 percent. This was a change from the composition of 69 percent, 19 percent and 12 percent respectively, from produce broking, share broking and warehousing respectively during the previous year.
group revenue composition-%
produce broking warehousing stock broking
20172018
Tea Brokering Revenue
Revenue generated from produce brokering was Rs. 519 million for the year, an improvement of 23 percent from the Rs. 423 million recorded in the previous year. The increase is attributed to multiple factors;
i) The higher interest income received from producer’s advances and loans, a 34 percent increase when compared with the previous year.
ii) Significant improvement in the average selling price of a kilogram of Tea on account of the global shortage of black tea in the major tea producing nations.
iii) The higher demand for Tea from Turkey and Russia.
0
100
200
300
400
500
600
john keells plc (company)revenue composition-Rs Mn
brokerageinterest incomeothers
2018 2017 2016 2015 2014
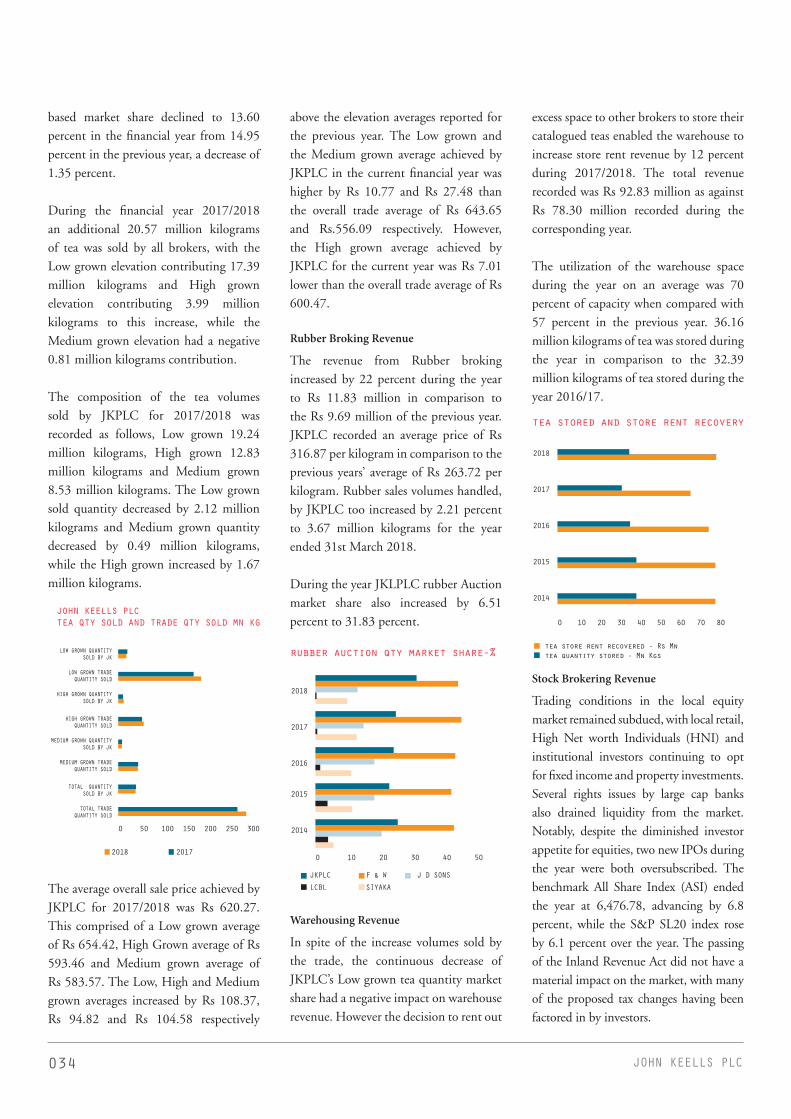
The average selling price achieved by JKPLC was Rs. 620.27 per kilogram of tea, an increase of 19.57 percent from the Rs. 518.75 average recorded in the previous year. Tea sale volumes handled by JKPLC for the financial year was 40.59 million kilograms. This was a 2.28 percent decrease over the previous years’ 41.54 million kilograms that were sold. This decline was mainly attributed to the strategic decision taken at the beginning of the year to consolidate the business rather than grow market share. Consequently, the Company’s volume-
FINANCIAL CAPITALCAPITAL MANAGEMENT REVIEWGRI 201-01
034 JOHN KEELLS PLC
based market share declined to 13.60 percent in the financial year from 14.95 percent in the previous year, a decrease of 1.35 percent.
During the financial year 2017/2018 an additional 20.57 million kilograms of tea was sold by all brokers, with the Low grown elevation contributing 17.39 million kilograms and High grown elevation contributing 3.99 million kilograms to this increase, while the Medium grown elevation had a negative 0.81 million kilograms contribution.
The composition of the tea volumes sold by JKPLC for 2017/2018 was recorded as follows, Low grown 19.24 million kilograms, High grown 12.83 million kilograms and Medium grown 8.53 million kilograms. The Low grown sold quantity decreased by 2.12 million kilograms and Medium grown quantity decreased by 0.49 million kilograms, while the High grown increased by 1.67 million kilograms.
0 50 100 150 200 250 300
john keells plctea qty sold and trade qty sold mn kg
low grown quantitysold by jk
low grown tradequantity sold
high grown quantitysold by jk
high grown tradequantity sold
medium grown quantitysold by jk
medium grown tradequantity sold
total quantitysold by jk
total tradequantity sold
2018 2017
The average overall sale price achieved by JKPLC for 2017/2018 was Rs 620.27. This comprised of a Low grown average of Rs 654.42, High Grown average of Rs 593.46 and Medium grown average of Rs 583.57. The Low, High and Medium grown averages increased by Rs 108.37, Rs 94.82 and Rs 104.58 respectively
above the elevation averages reported for the previous year. The Low grown and the Medium grown average achieved by JKPLC in the current financial year was higher by Rs 10.77 and Rs 27.48 than the overall trade average of Rs 643.65 and Rs.556.09 respectively. However, the High grown average achieved by JKPLC for the current year was Rs 7.01 lower than the overall trade average of Rs 600.47.
Rubber Broking Revenue
The revenue from Rubber broking increased by 22 percent during the year to Rs 11.83 million in comparison to the Rs 9.69 million of the previous year. JKPLC recorded an average price of Rs 316.87 per kilogram in comparison to the previous years’ average of Rs 263.72 per kilogram. Rubber sales volumes handled, by JKPLC too increased by 2.21 percent to 3.67 million kilograms for the year ended 31st March 2018.
During the year JKLPLC rubber Auction market share also increased by 6.51 percent to 31.83 percent.
0 10 20 30 40 50
rubber auction qty market share-%
2018
2017
2016
2015
2014
JKPLC F & W J D SONSLCBL SIYAKA
Warehousing Revenue
In spite of the increase volumes sold by the trade, the continuous decrease of JKPLC’s Low grown tea quantity market share had a negative impact on warehouse revenue. However the decision to rent out
excess space to other brokers to store their catalogued teas enabled the warehouse to increase store rent revenue by 12 percent during 2017/2018. The total revenue recorded was Rs 92.83 million as against Rs 78.30 million recorded during the corresponding year.
The utilization of the warehouse space during the year on an average was 70 percent of capacity when compared with 57 percent in the previous year. 36.16 million kilograms of tea was stored during the year in comparison to the 32.39 million kilograms of tea stored during the year 2016/17.
0 10 20 30 40 50 60 70 80
tea stored and store rent recovery
2018
2017
2016
2015
2014
tea store rent recovered - Rs Mntea quantity stored - Mn Kgs
Stock Brokering Revenue
Trading conditions in the local equity market remained subdued, with local retail, High Net worth Individuals (HNI) and institutional investors continuing to opt for fixed income and property investments. Several rights issues by large cap banks also drained liquidity from the market. Notably, despite the diminished investor appetite for equities, two new IPOs during the year were both oversubscribed. The benchmark All Share Index (ASI) ended the year at 6,476.78, advancing by 6.8 percent, while the S&P SL20 index rose by 6.1 percent over the year. The passing of the Inland Revenue Act did not have a material impact on the market, with many of the proposed tax changes having been factored in by investors.
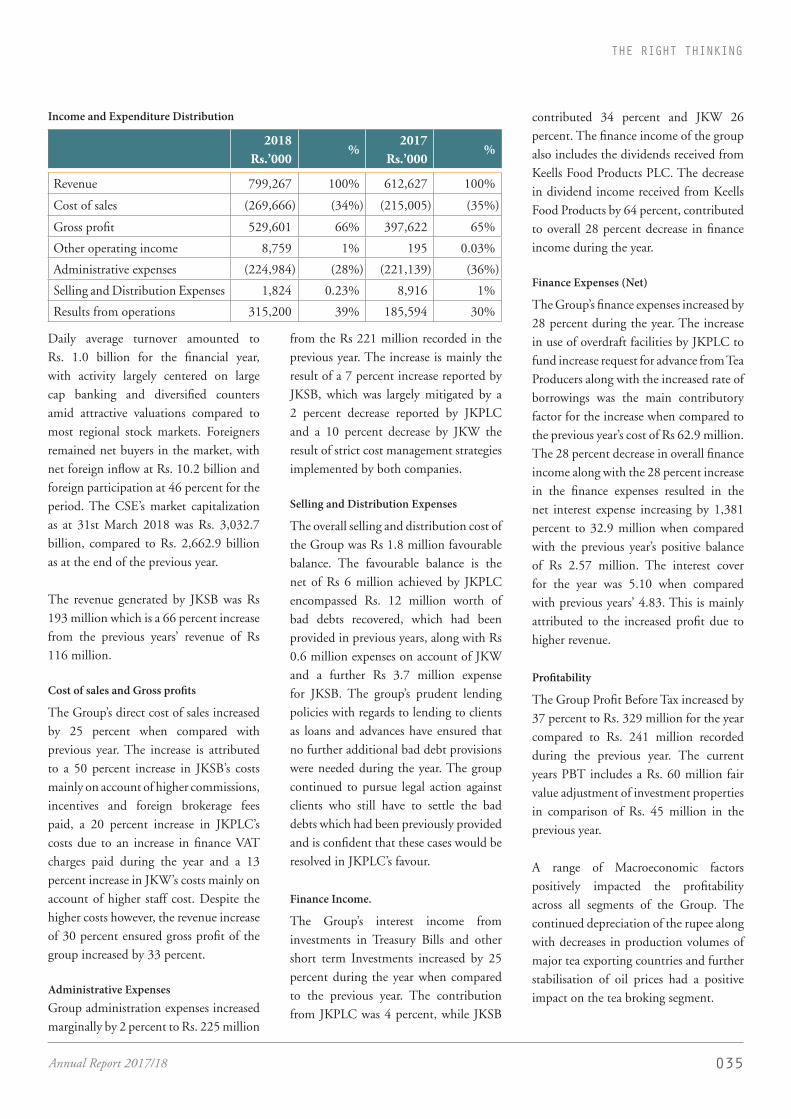
035Annual Report 2017/18
THE RIGHT THINKING
Income and Expenditure Distribution
2018
Rs.’000%
2017Rs.’000
%
Revenue 799,267 100% 612,627 100%
Cost of sales (269,666) (34%) (215,005) (35%)
Gross profit 529,601 66% 397,622 65%
Other operating income 8,759 1% 195 0.03%
Administrative expenses (224,984) (28%) (221,139) (36%)
Selling and Distribution Expenses 1,824 0.23% 8,916 1%
Results from operations 315,200 39% 185,594 30%
Daily average turnover amounted to Rs. 1.0 billion for the financial year, with activity largely centered on large cap banking and diversified counters amid attractive valuations compared to most regional stock markets. Foreigners remained net buyers in the market, with net foreign inflow at Rs. 10.2 billion and foreign participation at 46 percent for the period. The CSE’s market capitalization as at 31st March 2018 was Rs. 3,032.7 billion, compared to Rs. 2,662.9 billion as at the end of the previous year.
The revenue generated by JKSB was Rs 193 million which is a 66 percent increase from the previous years’ revenue of Rs 116 million.
Cost of sales and Gross profits
The Group’s direct cost of sales increased by 25 percent when compared with previous year. The increase is attributed to a 50 percent increase in JKSB’s costs mainly on account of higher commissions, incentives and foreign brokerage fees paid, a 20 percent increase in JKPLC’s costs due to an increase in finance VAT charges paid during the year and a 13 percent increase in JKW’s costs mainly on account of higher staff cost. Despite the higher costs however, the revenue increase of 30 percent ensured gross profit of the group increased by 33 percent.
Administrative ExpensesGroup administration expenses increased marginally by 2 percent to Rs. 225 million
from the Rs 221 million recorded in the previous year. The increase is mainly the result of a 7 percent increase reported by JKSB, which was largely mitigated by a 2 percent decrease reported by JKPLC and a 10 percent decrease by JKW the result of strict cost management strategies implemented by both companies.
Selling and Distribution Expenses
The overall selling and distribution cost of the Group was Rs 1.8 million favourable balance. The favourable balance is the net of Rs 6 million achieved by JKPLC encompassed Rs. 12 million worth of bad debts recovered, which had been provided in previous years, along with Rs 0.6 million expenses on account of JKW and a further Rs 3.7 million expense for JKSB. The group’s prudent lending policies with regards to lending to clients as loans and advances have ensured that no further additional bad debt provisions were needed during the year. The group continued to pursue legal action against clients who still have to settle the bad debts which had been previously provided and is confident that these cases would be resolved in JKPLC’s favour.
Finance Income.
The Group’s interest income from investments in Treasury Bills and other short term Investments increased by 25 percent during the year when compared to the previous year. The contribution from JKPLC was 4 percent, while JKSB
contributed 34 percent and JKW 26 percent. The finance income of the group also includes the dividends received from Keells Food Products PLC. The decrease in dividend income received from Keells Food Products by 64 percent, contributed to overall 28 percent decrease in finance income during the year.
Finance Expenses (Net)
The Group’s finance expenses increased by 28 percent during the year. The increase in use of overdraft facilities by JKPLC to fund increase request for advance from Tea Producers along with the increased rate of borrowings was the main contributory factor for the increase when compared to the previous year’s cost of Rs 62.9 million. The 28 percent decrease in overall finance income along with the 28 percent increase in the finance expenses resulted in the net interest expense increasing by 1,381 percent to 32.9 million when compared with the previous year’s positive balance of Rs 2.57 million. The interest cover for the year was 5.10 when compared with previous years’ 4.83. This is mainly attributed to the increased profit due to higher revenue.
Profitability
The Group Profit Before Tax increased by 37 percent to Rs. 329 million for the year compared to Rs. 241 million recorded during the previous year. The current years PBT includes a Rs. 60 million fair value adjustment of investment properties in comparison of Rs. 45 million in the previous year.
A range of Macroeconomic factors positively impacted the profitability across all segments of the Group. The continued depreciation of the rupee along with decreases in production volumes of major tea exporting countries and further stabilisation of oil prices had a positive impact on the tea broking segment.

036 JOHN KEELLS PLC
The increase in Sri Lanka’s tea production in comparison to the previous year had a positive impact on the warehouse segments profitability.
The stock broking segment too recorded a positive impact when compared to the previous year. This is attributed to the increase in daily average turnover recorded at the CSE which amounted, to Rs. 1.0 billion for the financial year, with activity largely centered on large cap banking and diversified counters amid attractive valuations compared to most regional stock markets.
Change in Fair Value of Investment Property
The Investment properties were valued by Mr P B Kalugalagedera using the open market value method as at date. The change in fair value was a positive of Rs 60 million during the current year as against Rs 45 million during the previous year.
Taxation
As per the tax regulations that prevailed during the financial year, Produce brokering and stock brokering income were subject to a tax of 28 percent whilst the warehousing operation was taxed at 10 percent and the other warehousing profits at 28 percent. As such the increase in profits had a direct impact on the amount of taxes paid to the government during the year.
Financial Position
Revenue Reserve
The Group’s revenue reserve increased by 4 percent to Rs. 2,848 million from the Rs. 2,737 million recorded in the previous year. This was on account of profit for the current year increasing by 19 percent over the previous year and increase in dividend payout by 100 percent over the previous year.
Available for Sale Reserve
The available for sale reserve balance decreased by 16 percent to Rs. 200 million from the Rs. 239 million recorded in the previous year. This was mainly due to Fair value decrease of investments held in Keells Food Products PLC by Rs. 39 million during the year.
Non- Controlling Interest
The Non- controlling interest increased by 18 percent to Rs. 40 million from the Rs. 34 million last year on account of higher (JKSB) during the year. The Non controlling interest in JKSB is 24 percent.
Cash Flow
The net movement in cash and cash equivalents for the year under review registered an inflow of Rs. 34 million, an increase of Rs. 5 million over the previous year’s Rs. 29 million. The increase comprises, higher cash generated from operations by Rs. 111 million, increase in cash out flow by Rs. 33 million on account of investments made in fixed assets and an increase in cash out flow by Rs 73 million on account of dividend payments and other financing cost.
Working Capital/Liquidity
The net working capital of the Group was Rs. 561 million as at 31 st March 2018 against Rs. 407 million in 2016/2017.This was mainly due to a 19 percent decrease in current assets of the group and a 30 percent decrease in the current liabilities. The group’s current assets have reduced by Rs. 475 million on account of Trade and other receivables decreasing by Rs. 517 million and short term investments and cash and Bank balances increasing by Rs. 73 million. The decrease in trade and other receivables consist of a Rs. 667 million decline reported by JKSB and a Rs 148 million increase reported by JKPLC. The decrease in trade and other
receivables of JKSB is mainly due to lower trade volumes as at end of March and the increase in JKPLC is due to increase in monies advanced to tea producers.
The group current liabilities have decreased by Rs. 629 million mainly on account of Rs. 688 million decline in trade and other payables and a Rs. 39 million increase in bank borrowing. The reduction in Group trade and other payables consist of Rs. 663 million decrease in JKSB balance and a Rs 26 million decrease in JKPLC Balance. The Group Bank Borrowings increase consist of Rs. 23 million increase in JKSB balance and Rs. 16 million increase in JKPLC balance.
Leverage and Capital Structure
Total Group assets of Rs. 5.11 billion was funded by Shareholders funds (67.58 percent) non – controlling interest (0.77 percent), non- current liabilities (3.12 percent) and current liabilities (28.53 percent). The long term funding of assets including Shareholders funds, non – controlling interest and other non – current liabilities together accounted for 71.47 percent of the total assets, an equivalent of at Rs. 3.65 billion
0.0 0.5 1.0 1.5 2.0 2.5 3.0 3.5 4.0
leverage and capital structureof group-Rs Bn
2018 2017
long termfunding
of assets
non-controlling
interest
non-currentliabilities
currentliabilities
shareholdersfunds
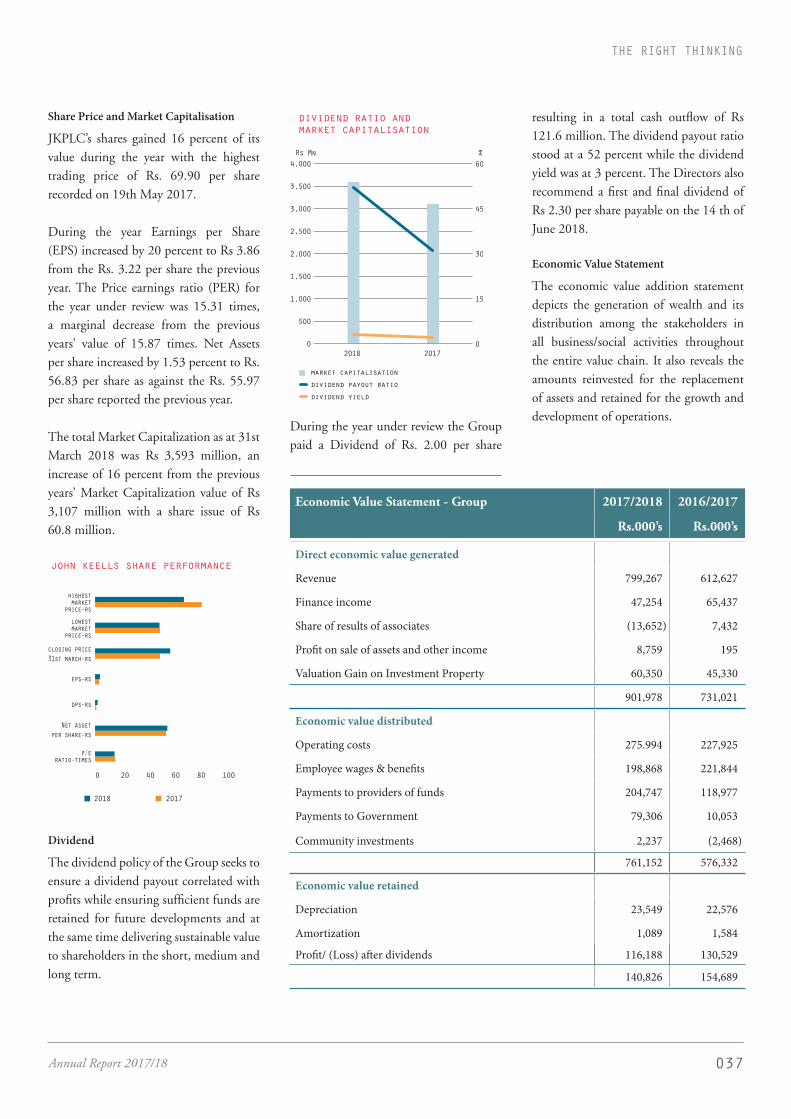
037Annual Report 2017/18
THE RIGHT THINKING
Share Price and Market Capitalisation
JKPLC’s shares gained 16 percent of its value during the year with the highest trading price of Rs. 69.90 per share recorded on 19th May 2017.
During the year Earnings per Share (EPS) increased by 20 percent to Rs 3.86 from the Rs. 3.22 per share the previous year. The Price earnings ratio (PER) for the year under review was 15.31 times, a marginal decrease from the previous years’ value of 15.87 times. Net Assets per share increased by 1.53 percent to Rs. 56.83 per share as against the Rs. 55.97 per share reported the previous year.
The total Market Capitalization as at 31st March 2018 was Rs 3,593 million, an increase of 16 percent from the previous years’ Market Capitalization value of Rs 3,107 million with a share issue of Rs 60.8 million.
0 20 40 60 80 100
john keells share performance
highestmarket
price-rslowestmarket
price-rs
closing price31st march-rs
eps-rs
dps-rs
Net assetper share-rs
p/eratio-times
2018 2017
Dividend
The dividend policy of the Group seeks to ensure a dividend payout correlated with profits while ensuring sufficient funds are retained for future developments and at the same time delivering sustainable value to shareholders in the short, medium and long term.
0
500
1,000
1,500
2,000
2,500
3,000
3,500
4,000
0
15
30
45
60
dividend ratio and market capitalisation
market capitalisationdividend payout ratiodividend yield
2018 2017
%Rs Mn
During the year under review the Group paid a Dividend of Rs. 2.00 per share
resulting in a total cash outflow of Rs 121.6 million. The dividend payout ratio stood at a 52 percent while the dividend yield was at 3 percent. The Directors also recommend a first and final dividend of Rs 2.30 per share payable on the 14 th of June 2018.
Economic Value Statement
The economic value addition statement depicts the generation of wealth and its distribution among the stakeholders in all business/social activities throughout the entire value chain. It also reveals the amounts reinvested for the replacement of assets and retained for the growth and development of operations.
Economic Value Statement - Group 2017/2018 2016/2017
Rs.000’s Rs.000’s
Direct economic value generated
Revenue 799,267 612,627
Finance income 47,254 65,437
Share of results of associates (13,652) 7,432
Profit on sale of assets and other income 8,759 195
Valuation Gain on Investment Property 60,350 45,330
901,978 731,021
Economic value distributed
Operating costs 275.994 227,925
Employee wages & benefits 198,868 221,844
Payments to providers of funds 204,747 118,977
Payments to Government 79,306 10,053
Community investments 2,237 (2,468)
761,152 576,332
Economic value retained
Depreciation 23,549 22,576
Amortization 1,089 1,584
Profit/ (Loss) after dividends 116,188 130,529
140,826 154,689

038 JOHN KEELLS PLC
revenuefinance incomeshare of results of associateprofit on sale of assets and other incomevaluation gain on investment property
-20
0
20
40
60
80
100
direct economic value generated-%
2018 2017
The group has contributed Rs 761 million to varied stakeholders during the current year and retained Rs 141 million for growth and development of assets.
Subsequent Events
There are no further matters or circumstances arising since 31 March 2018, not otherwise dealt with in the financial statements that would materially affect the operations or results of the Group.
CHALLENGES AND THE RIGHT THINKING To keep growing in an increasingly dynamic and competitive environment requires continuous and ongoing efforts to monitor the operating environment to help seize potential opportunities to strengthen returns and also engage pre-emptive action that will minimize the negative consequences in the event of an economic downturn. Such action ensures the Company’s Financial Capital continues to generate consistent value at all times.
The Right Thinking Effective communication on the
financial disciplines, reviewing
the variances and informing the
management periodically
The Right Thinking Employee centred cost efficiencies
made along with technological
advancements
The Right Thinking Innovative solutions given to attract
new markets and retain a sustainable
customer base
Challenge #4 Adhere to Fiscal
policy changes
Challenge #5 Comply with the
Internal Controls
and operations
practices in line
with financial
objectives
Challenge #2 Generating higher
ROE
Challenge #1 Increasing market
share
The Right Thinking Obtain advice from the Group
Tax departments and adhere to the
updates on the tax regulations
Challenge #3 Inconsistent
economic policies
The Right Thinking Consistently over looking the
market and updates to the upstream
of the supply chain
JKPLC will work to optimize its Financial Capital in order to ensure continuous and ongoing value creation for all stakeholders in the short, medium and long-term.

039Annual Report 2017/18
THE RIGHT THINKING
CONTEXT: JKPLC’s Manufactured Capital consists of the Company’s 125,000 square foot warehouse complex and related moving equipment required in the Warehouse operation. Apart from this; JKPLC’s need for Manufactured Capital is limited to the office equipment used in its day-to-day operations.
MANAGEMENT APPROACH: We are committed to invest continually in maintaining and upgrading existing assets, incurring capital expenditure to increase capacity when needed, which will ensure that we can continue to deliver on our strategy. All precautions are taken to safeguard our asset base, with our physical assets fully insured following a full annual valuation to determine market values.
ACTIVITY REPORT 2017/18
Value as at 31st March
2018 RS. Mn
Value as at 31st March
2017 RS. Mn
Activities for 2017/18 Cost Rs. Mn
Buildings on Leasehold Land 310.00 278.12 Reconstruction of Warehouse Roof 26.78
Plant and machinery 8.54 9.39 New Power Stacker for Warehouse 1.53
Furniture and fittings 13.44 20.03 New furniture for office use 0.22
Motor vehicles 16.93 8.14 New Motor vehicle 13.00
Computer Equipment 3.90 4.78 New computer equipment for staff 0.67
Office Equipment 0.41 0.38 New office equipment for staff 0.32
Others 0.25 0.39 - -
Total 353.47 321.23 42.52
PROPOSED INVESTMENTS FOR 2018/19• Automatic Weighing Scales for the sample room and arrivals section of the warehouse • Project to invest in generating solar energy• Evaluation and investment on a fully automated catalogue printing machine
MANUFACTURED CAPITAL
3
4
5
6
maintenance cost of property-Rs Mn
2018 2017 2016 2015 20140
1
2
3
insurance cost of property-Rs Mn
2018 2017 2016 2015 2014
Moreover, where applicable maintenance contracts are in place for regular upkeep to ensure the effective utilisation of physical assets.
In addition, we also look to invest in new innovative technology that will enable the Company to steadily reduce the environmental impact of our business and remain compliant with regulations across our markets.

040 JOHN KEELLS PLC
CHALLENGES AND THE RIGHT THINKING
Safeguarding our Manufactured Capital amid rapidly changing operating environment necessitates a clear understanding of the wider implications that can have a bearing on its ability to create value. This calls for a proactive involvement of all employees to take action at the right time to ensure our Manufactured Capital is optimised for the benefit of our stakeholders
The Right Thinking Proposed introduction of work-
from-Home and flexible time
allocations to staff. As part of an
initiative to maintaining work-life
balance philosophy which reflects a
‘Great Place to Work, This provides
an alternative option for efficient
utilisation of office space.
The Right Thinking Renewal of maintenance agreements
and updating of polices as required
The Right Thinking Aligning with Group insurance
policies to comprehensively cover
all requirements
Challenge #4 Allocation
of sufficient funds
on capital
Challenge #5 Flexibility on
utilisation of the
office space
Challenge #2 Maintaining
and safeguarding
the assets
Challenge #1 Adhere to
Insurance
requirements
The Right Thinking Involve staff to assess capital assets
and determine needs in advance
to be incorporated in the strategic
plan and ensure necessary budgetary
allocations are made.
Challenge #3 Labour concerns
with capital
utilisation
The Right Thinking Maintaining service contracts with
the reputed labour service providers
JKPLC will invest to optimise its Manufactured Capital in order to ensure continuous and ongoing value creation for all stakeholders in the short, medium and long-term.
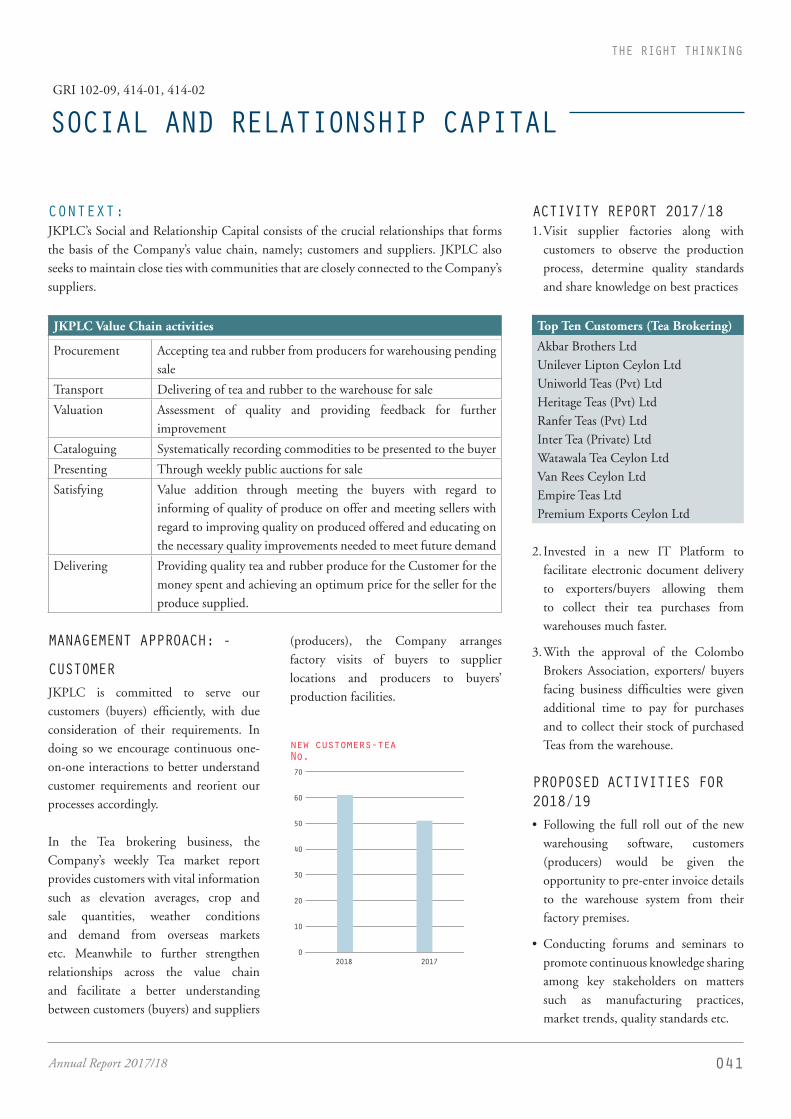
041Annual Report 2017/18
THE RIGHT THINKING
CONTEXT: JKPLC’s Social and Relationship Capital consists of the crucial relationships that forms the basis of the Company’s value chain, namely; customers and suppliers. JKPLC also seeks to maintain close ties with communities that are closely connected to the Company’s suppliers.
JKPLC Value Chain activities
Procurement Accepting tea and rubber from producers for warehousing pending sale
Transport Delivering of tea and rubber to the warehouse for sale
Valuation Assessment of quality and providing feedback for further improvement
Cataloguing Systematically recording commodities to be presented to the buyer
Presenting Through weekly public auctions for sale
Satisfying Value addition through meeting the buyers with regard to informing of quality of produce on offer and meeting sellers with regard to improving quality on produced offered and educating on the necessary quality improvements needed to meet future demand
Delivering Providing quality tea and rubber produce for the Customer for the money spent and achieving an optimum price for the seller for the produce supplied.
MANAGEMENT APPROACH: -
CUSTOMERJKPLC is committed to serve our customers (buyers) efficiently, with due consideration of their requirements. In doing so we encourage continuous one-on-one interactions to better understand customer requirements and reorient our processes accordingly.
In the Tea brokering business, the Company’s weekly Tea market report provides customers with vital information such as elevation averages, crop and sale quantities, weather conditions and demand from overseas markets etc. Meanwhile to further strengthen relationships across the value chain and facilitate a better understanding between customers (buyers) and suppliers
(producers), the Company arranges factory visits of buyers to supplier locations and producers to buyers’ production facilities.
0
10
20
30
40
50
60
70
new customers-teaNo.
2018 2017
ACTIVITY REPORT 2017/181. Visit supplier factories along with
customers to observe the production process, determine quality standards and share knowledge on best practices
Top Ten Customers (Tea Brokering)
Akbar Brothers Ltd Unilever Lipton Ceylon Ltd Uniworld Teas (Pvt) Ltd Heritage Teas (Pvt) Ltd Ranfer Teas (Pvt) Ltd Inter Tea (Private) Ltd Watawala Tea Ceylon Ltd Van Rees Ceylon Ltd Empire Teas LtdPremium Exports Ceylon Ltd
2. Invested in a new IT Platform to facilitate electronic document delivery to exporters/buyers allowing them to collect their tea purchases from warehouses much faster.
3. With the approval of the Colombo Brokers Association, exporters/ buyers facing business difficulties were given additional time to pay for purchases and to collect their stock of purchased Teas from the warehouse.
PROPOSED ACTIVITIES FOR 2018/19• Following the full roll out of the new
warehousing software, customers (producers) would be given the opportunity to pre-enter invoice details to the warehouse system from their factory premises.
• Conducting forums and seminars to promote continuous knowledge sharing among key stakeholders on matters such as manufacturing practices, market trends, quality standards etc.
SOCIAL AND RELATIONSHIP CAPITALGRI 102-09, 414-01, 414-02
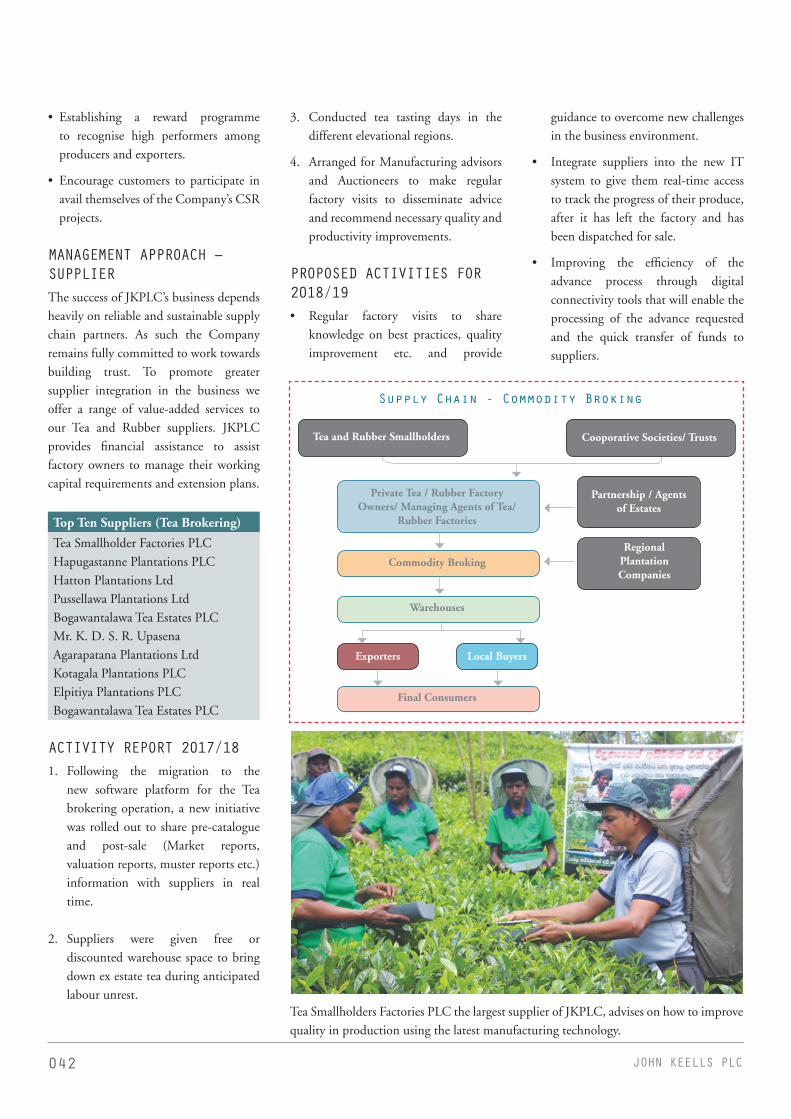
042 JOHN KEELLS PLC
• Establishing a reward programme to recognise high performers among producers and exporters.
• Encourage customers to participate in avail themselves of the Company’s CSR projects.
MANAGEMENT APPROACH – SUPPLIERThe success of JKPLC’s business depends heavily on reliable and sustainable supply chain partners. As such the Company remains fully committed to work towards building trust. To promote greater supplier integration in the business we offer a range of value-added services to our Tea and Rubber suppliers. JKPLC provides financial assistance to assist factory owners to manage their working capital requirements and extension plans.
Top Ten Suppliers (Tea Brokering)
Tea Smallholder Factories PLC Hapugastanne Plantations PLC Hatton Plantations LtdPussellawa Plantations Ltd Bogawantalawa Tea Estates PLC Mr. K. D. S. R. Upasena Agarapatana Plantations LtdKotagala Plantations PLC Elpitiya Plantations PLC Bogawantalawa Tea Estates PLC
ACTIVITY REPORT 2017/181. Following the migration to the
new software platform for the Tea brokering operation, a new initiative was rolled out to share pre-catalogue and post-sale (Market reports, valuation reports, muster reports etc.) information with suppliers in real time.
2. Suppliers were given free or discounted warehouse space to bring down ex estate tea during anticipated labour unrest.
3. Conducted tea tasting days in the different elevational regions.
4. Arranged for Manufacturing advisors and Auctioneers to make regular factory visits to disseminate advice and recommend necessary quality and productivity improvements.
PROPOSED ACTIVITIES FOR 2018/19• Regular factory visits to share
knowledge on best practices, quality improvement etc. and provide
guidance to overcome new challenges in the business environment.
• Integrate suppliers into the new IT system to give them real-time access to track the progress of their produce, after it has left the factory and has been dispatched for sale.
• Improving the efficiency of the advance process through digital connectivity tools that will enable the processing of the advance requested and the quick transfer of funds to suppliers.
Supply Chain - Commodity Broking
Private Tea / Rubber Factory Owners/ Managing Agents of Tea/
Rubber Factories
Tea and Rubber Smallholders Cooporative Societies/ Trusts
Partnership / Agents of Estates
Commodity BrokingRegional
Plantation Companies
Warehouses
Exporters Local Buyers
Final Consumers
Tea Smallholders Factories PLC the largest supplier of JKPLC, advises on how to improve quality in production using the latest manufacturing technology.

043Annual Report 2017/18
THE RIGHT THINKING
MANAGEMENT APPROACH – COMMUNITY
To further demonstrate our commitment to our suppliers, we also work to ensure the health and well-being of the communities. JKPLC regularly sponsors health camps and eye camps that are conducted for the benefit of grower communities. We also engage in disaster relief activities to support these communities affected by natural disasters.
We encourage our employees to volunteer their time to participate in organising and executing these initiatives.
In addition the Company makes an annual contribution to the John Keells Foundation through which all Group CSR activities are carried out.
In the year under review, JKPLC (Group) contributed a sum of Rs. 1.24 million to the John Keells Foundation to be utilized for community development projects conducted by the Group.
John Keells PLC staff were involved in repairing/Colour washing houses in Morawaka area, which were affected by floods
John Keells PLC staff volunteered for conducting eye camps in Neighboring Schools in Colombo
ACTIVITY REPORT 2017/18Activity Area Target Group No. employee
volunteers
Eye Camps Neighboring Schools in Colombo
Neighboring School Children
Nine
Disaster Relief Morawaka Two affected families Six

044 JOHN KEELLS PLC
The Right Thinking Being an intermediary and
operating in a controlled market the
inability to directly communicate to
clients who do not deal within our
facilities.
The Right Thinking Promote innovative and sustainable
industry practices
The Right Thinking Regular interaction with regulators
to foster collaborative partnerships
for the betterment of the industry
The Right Thinking Encourage continuous learning and
development and create a common
platform to promote technology
adoption among employees,
suppliers and customers.
The Right Thinking Educate suppliers on sustainable
sourcing and encourage them to
engage in community development
in collaboration with the Group
initiatives
Challenge #1 Intense market
competition
Challenge #2 Changes
in global markets
trends
Challenge #4 Institutional
influences
Challenge #3 Digitisation
and disruptive
innovation
Challenge #5 Geographical
and demographical
changes
CHALLENGES AND THE RIGHT THINKING Developing and maintaining relationships with customers (buyers), suppliers (producers) and communities, in a highly competitive and fast-paced market requires broader peripheral vision coupled with clear strategic thinking that would ensure sustained value creation for each stakeholder group.
JKPLC will look to foster stronger bonds with customers (buyers), suppliers (producers) and communities in an effort to achieve sustainability leadership.
045Annual Report 2017/18
THE RIGHT THINKING
CONTEXT: JKPLC’s Human Capital refers to the skill, talent, and productivity of our employees that enable the Company to succeed in achieving its corporate vision.
MANAGEMENT APPROACH: Our Human Capital Development approach is premised on the belief that our people are the lifeblood of our Company. Therefore the main objective of our Human Capital development strategy is to create a winning match between individual needs and the Company’s goals. As such we aim to attract and retain the right people, with the right experience, in the right place, by offering the right compensation and opportunities for career growth. Our approach is based on the following key commitments;
1. The Company will maintain equality and diversity at every stage of the employment process including recruitment, selection, evaluation, promotion, training and development of all employees.
2. The Company will ensure remuneration and benefits offered to employees are competive, in line with industry standards and comply with the statutory labour laws of the country
3. The Company will evaluate the performance of all employees and their capacity for progress within the company. The results of these evaluations will help identify the training requirements and also highlight an employees’ potential for career progression within the organization
• Step 1 – Following the best practices laid down by the John Keells Holdings PLC (JKH), strategy sessions and annual plans for the financial year are finalized by the GEC, with the objectives set according to the Hoshin Kanri Methodology, using the Balanced Score Card to set SMARTS objectives ahead of a given financial year.
• Step 2 – Once the self and supervisor appraisals relating to the previous financial year are completed, the performance appraisals of each staff member are taken up at a Career Committee meeting attended by the Management Committee and an independent 3rd party observer to finalize Performance Ratings. (Increments and Short Term Incentives are decided based on this rating). Additionally for Executives, AM’s and Managers, a scientifically developed, excel based tool is used to carry out the JKH Roof Competency Assessment covering seven Roof competencies. The competency assessment tool also serves, as a fair and focused way of identifying training needs. Meanwhile for Manager’s, the rating is attached to their performance and that of their respective Business Unit and goes on to impact their STI’s. All managers are also subjected to a 3600 evaluation process, which helps to ascertain the views of the employees within the immediate work circle. A strictly confidential process, the results of the 3600 survey is first discussed with the respective Manager separately and then again taken up at their annual appraisal. It is also used as a development tool to
motivate and address possible areas for improvement.
• Step 3 - Each staff member is given feedback on their performance rating. Staff members dissatisfied with the rating outcome can directly appeal to the President HR
• Step 4 – A midyear review is done to give employees feedback regarding their progress to help reorient objectives if needed, and assess effectiveness of training
COMMITMENT TO HUMAN RIGHTS
Fundamental to our Human Capital strategy is the commitment to uphold Human Rights.
JKPLC respects international principles of Human Rights including those expressed in the UN Declaration of Human Rights. As such the Company does not tolerate child labour, forced labour, physical punishment or abuse. We recognize lawful employee rights of free association and collective bargaining and remain committed to comply with all applicable labour laws. Further we are committed to providing a safe and healthy work environment and in doing so strive to emulate globally accepted best practices for safety at the workplace.
4. The Company will provide adequate training and development to ensure employees acquire the skills and competencies needed to optimize their capacity. Our investment in training seeks to correspond to the requirements identified through
HUMAN CAPITALGRI 102-08, 102-41, 401-01, 401-02, 401-03, 402 - 01, 403 - 01, 403 - 02, 403-03, 404 - 01, 404 - 02, 404 - 03, 406-01, 412-02

046 JOHN KEELLS PLC
the performance appraisals as well as to sharpen employee alignment with the John Keells Behavioural Competencies (Roof Competencies). The Company nominates staff for training to meet required competency levels at their current job level and also to develop them for a potential role. In addition diverse training programmes (classroom, e-learning, bite-sized and blended) are made available to meet the required competency levels of employees. We work with both internal/external trainers to customize the programmes, keeping in mind the development needs of our employees, in order to meet expectations.
5. The Company will create an active feedback mechanism that will provide the basis of a strong communicative culture. The following mechanisms are currently in place
• Skip level meetings to enable employees to skip their immediate supervisor and reach out to the next level in terms of seniority.
• Peer - and - upward - survey for Managers, an e-based feedback tool where an employees’ peers and subordinates are asked to provide feedback in a confidential manner. The feedback received is compared to the self-assessment form completed by the employee in line with the JKH Group’s 7 roof competencies
• Joint Consultative Committee (JCC) meetings, where Non Executives representing each department have the opportunity to meet the CEO and the Head of HR every 2 months to raise concerns, make suggestions and discuss areas for improvement.
• Quarterly staff meetings inform employees regarding Company strategy and update them on financial performance and other developments
• Every two years a GPTW (Great Place to Work) survey is conducted to obtain feedback from employees on areas such as Credibility, Respect, Fairness, Pride, Camaraderie etc.
• Young Forum, where staff meet the Chairman and Head of Group HR for an informal discussion, aims to promote bottom up and top down communication
6. The Company will strive to recognize leadership qualities in employees, and inspire them to reach for even greater heights. All Company employees have
access to the JKH Group rewards and recognition programme that aim to;
• Reward high performing Managers and AVP and above staff who have contributed significantly -and beyond expectations - while displaying the true spirit of JK values.
• Distinguish the high performers so that they are seen as role models.
• Encourage the practicing of JK values Currently, a wide range of recognition
platforms are available for various employee categories, including;
> Champion of the Year - Reward high
Employees receiving 25 Years’ Service awards

047Annual Report 2017/18
THE RIGHT THINKING
• Participation in team sports• Annual activity calendar (Staff
excursion, annual sports meet, Christmas party etc.)
• Employees volunteering for CSR activities
8. The Company will ensure all employees benefit from a proper work-life balance. Hence all JKPLC employees have access to the following;
• Flexi-hours• Paternity Leave • Working from home
performing Non Executive Staff> Employee of the Year - Reward high
performing Executive and AM Staff > Chairman’s Award - Reward high
performing Managers and AVP> Bravo - Recognizing superior
performance for Group Values > Long Service Awards > CSR Volunteers Recognition> Innovation Initiative Participants> Sustainability Award
7. The Company will provide opportunities for employee engagement and team building through;
9. JKPLC follows an equal opportunity principle by including people representing both genders, multiple social backgrounds and age groups.
Employee receiving BRAVO awards in recognition of superior performance on JK Values
Employee receiving the Employee of the Year for the high performance
0
5
10
15
20
employee diversity - age (no.)
Und
er 3
0A
ged
30-5
0O
ver 5
0U
nder
30
Age
d 30
-50
Ove
r 50
Und
er 3
0A
ged
30-5
0O
ver 5
0U
nder
30
Age
d 30
-50
Ove
r 50
Und
er 3
0A
ged
30-5
0O
ver 5
0
avp & above managers asst.managers
executives non-executives
2018 2017
0
5
10
15
20
25
employee diversity - gender (no.)
Mal
e
Fem
ale
Mal
e
Fem
ale
Mal
e
Fem
ale
Mal
e
Fem
ale
Mal
e
Fem
ale
avp & above managers asst.managers
executives non-executives
2018 2017
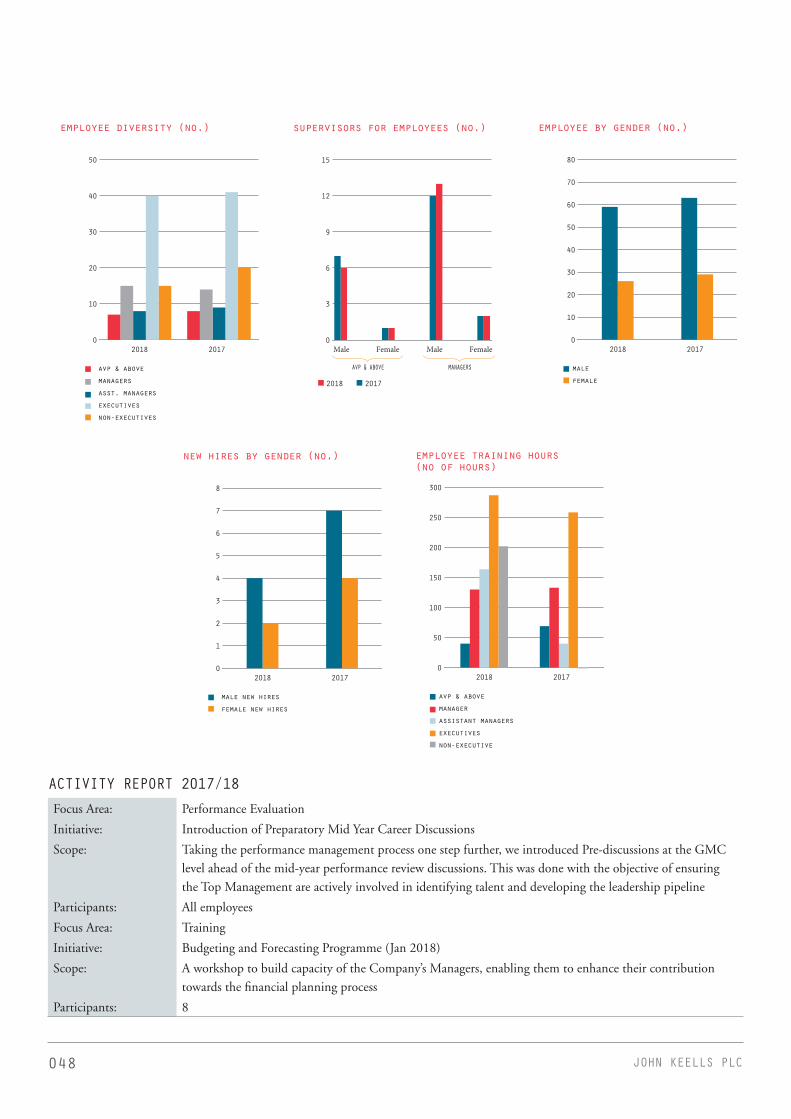
048 JOHN KEELLS PLC
ACTIVITY REPORT 2017/18Focus Area: Performance Evaluation
Initiative: Introduction of Preparatory Mid Year Career Discussions
Scope: Taking the performance management process one step further, we introduced Pre-discussions at the GMC level ahead of the mid-year performance review discussions. This was done with the objective of ensuring the Top Management are actively involved in identifying talent and developing the leadership pipeline
Participants: All employees
Focus Area: Training
Initiative: Budgeting and Forecasting Programme (Jan 2018)
Scope: A workshop to build capacity of the Company’s Managers, enabling them to enhance their contribution towards the financial planning process
Participants: 8
0
10
20
30
40
50
employee diversity (no.)
avp & above managers asst. managers executives non-executives
2018 2017
0
50
100
150
200
250
300
employee training hours(no of hours)
avp & above manager assistant managers executives non-executive
2018 2017
0
10
20
30
40
50
60
70
80
employee by gender (no.)
malefemale
2018 2017
0
1
2
3
4
5
6
7
8
new hires by gender (no.)
male new hires female new hires
2018 2017
0
3
6
9
12
15
supervisors for employees (no.)
avp & above managers
2018 2017
Male Female Male Female
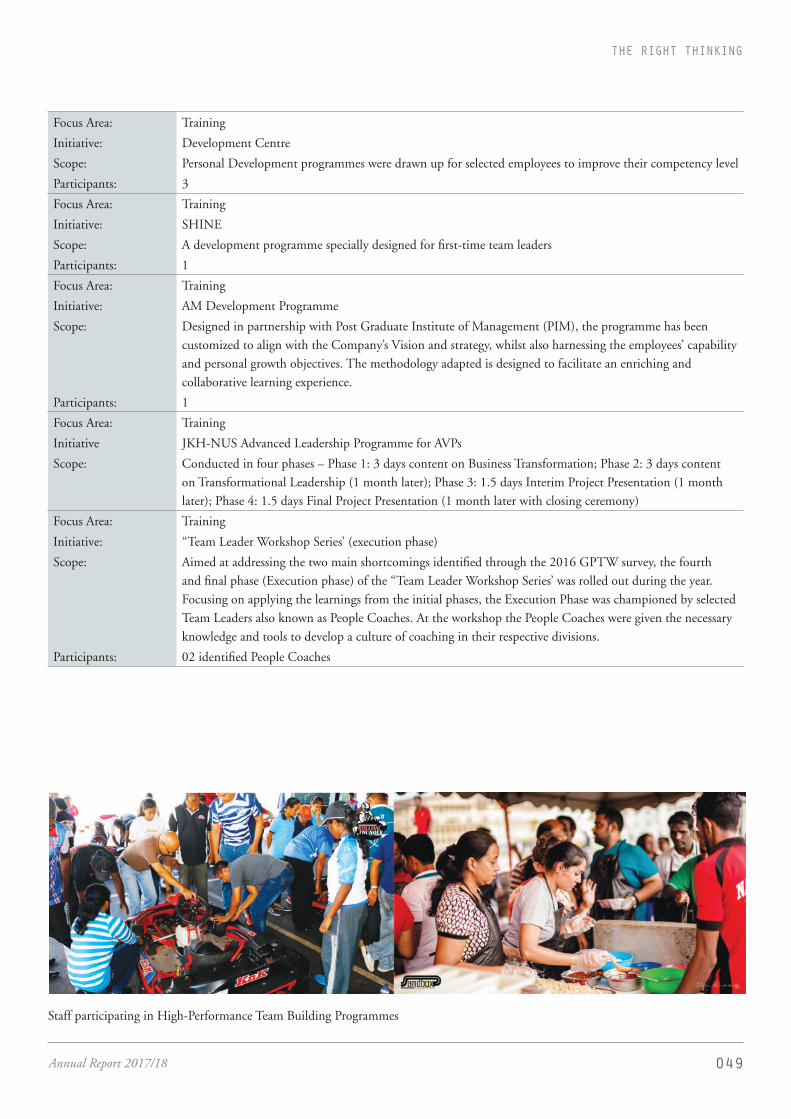
049Annual Report 2017/18
THE RIGHT THINKING
Staff participating in High-Performance Team Building Programmes
Focus Area: Training
Initiative: Development Centre
Scope: Personal Development programmes were drawn up for selected employees to improve their competency level
Participants: 3
Focus Area: Training
Initiative: SHINE
Scope: A development programme specially designed for first-time team leaders
Participants: 1
Focus Area: Training
Initiative: AM Development Programme
Scope: Designed in partnership with Post Graduate Institute of Management (PIM), the programme has been customized to align with the Company’s Vision and strategy, whilst also harnessing the employees’ capability and personal growth objectives. The methodology adapted is designed to facilitate an enriching and collaborative learning experience.
Participants: 1
Focus Area: Training
Initiative JKH-NUS Advanced Leadership Programme for AVPs
Scope: Conducted in four phases – Phase 1: 3 days content on Business Transformation; Phase 2: 3 days content on Transformational Leadership (1 month later); Phase 3: 1.5 days Interim Project Presentation (1 month later); Phase 4: 1.5 days Final Project Presentation (1 month later with closing ceremony)
Focus Area: Training
Initiative: “Team Leader Workshop Series’ (execution phase)
Scope: Aimed at addressing the two main shortcomings identified through the 2016 GPTW survey, the fourth and final phase (Execution phase) of the “Team Leader Workshop Series’ was rolled out during the year. Focusing on applying the learnings from the initial phases, the Execution Phase was championed by selected Team Leaders also known as People Coaches. At the workshop the People Coaches were given the necessary knowledge and tools to develop a culture of coaching in their respective divisions.
Participants: 02 identified People Coaches

050 JOHN KEELLS PLC
Focus Area: Training
Initiative: A series of High-Performance Team Building Programmes
Scope: Combining Gamification, immersive experiences and technology to facilitate real-time learning experiences, the series consisted of three segments; “Rolling Thunder” was aimed at enhancing existing team competencies and building synergy between teams. The next segment - “Rapid Response” focused on developing leadership, tactical skills, strategy and team dynamics, performance under pressure, hyper awareness and communications. And finally, a “Street Food Cook Off” to develop leadership, decision-making, team dynamics, performance under pressure and communication prioritization and problem solving, coordinated execution and attention to detail.
Participants: All staff
Focus Area: Training
Initiative: Internal Job Posting Programme
Scope: To facilitate the movement of employees within the Group by offering employees multiple career tracks. One staff member moved from JK PLC to JKSB and another moved from Infomate to JK PLC, thereby ensuring talent remains within the Group.
Focus Area: Training
Initiative: Fire Drill
Scope: A Fire Drill was conducted at head office with the consultation of Finlays Colombo Ltd and the Fire Department to increase the awareness on preventive measures as well as to training on responding to emergency situations to protect life and properties
Participants: All staff
Focus Area: Training
Initiative: Fire Drill (at Warehouse)
Scope: A periodical fire drill is conducted at the Warehouse to increase awareness on the preventive measures to be taken in the event of a fire
Participants: All staff
Focus Area: Training
Initiative: OHSAS 18001Compliance (Warehouse)
Scope: Ongoing measurement of warehousing safety standards in line with OHSAS 18001: 2007 - Occupational Health and Safety Standards and the deployment of necessary training to address identified gaps
Participants: All staff
Fire Drill at Warehouse
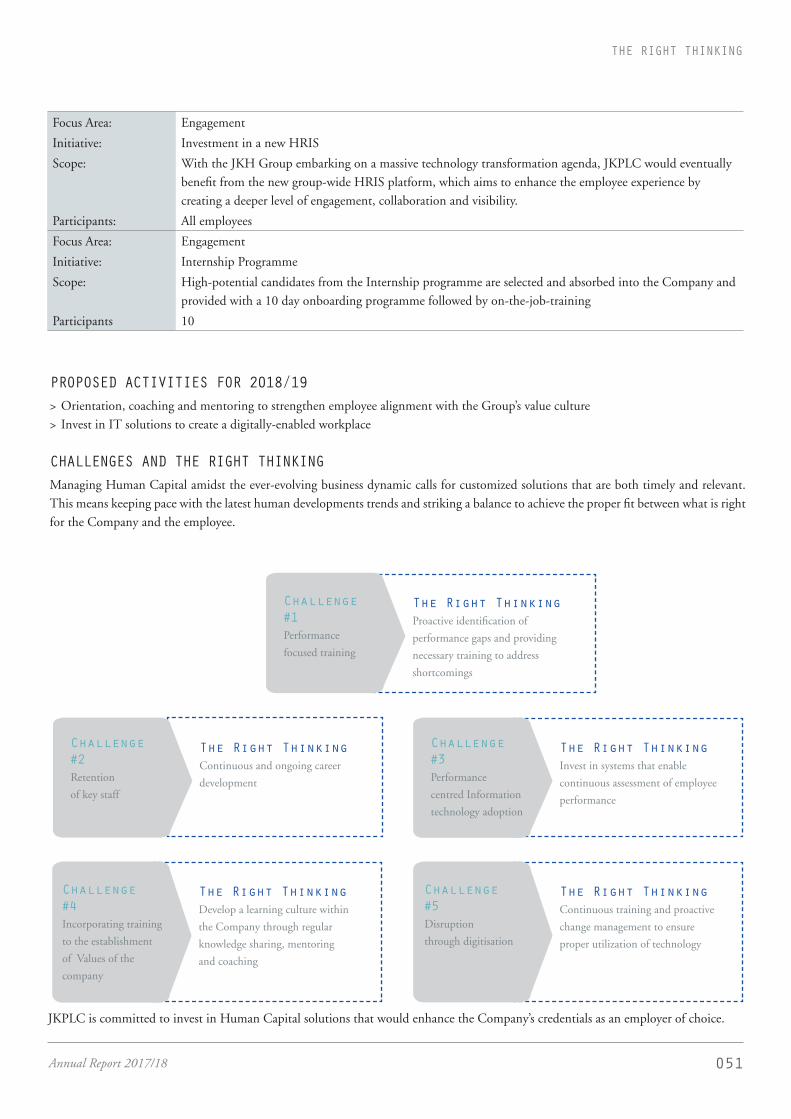
051Annual Report 2017/18
THE RIGHT THINKING
Focus Area: Engagement
Initiative: Investment in a new HRIS
Scope: With the JKH Group embarking on a massive technology transformation agenda, JKPLC would eventually benefit from the new group-wide HRIS platform, which aims to enhance the employee experience by creating a deeper level of engagement, collaboration and visibility.
Participants: All employees
Focus Area: Engagement
Initiative: Internship Programme
Scope: High-potential candidates from the Internship programme are selected and absorbed into the Company and provided with a 10 day onboarding programme followed by on-the-job-training
Participants 10
PROPOSED ACTIVITIES FOR 2018/19> Orientation, coaching and mentoring to strengthen employee alignment with the Group’s value culture > Invest in IT solutions to create a digitally-enabled workplace
CHALLENGES AND THE RIGHT THINKING Managing Human Capital amidst the ever-evolving business dynamic calls for customized solutions that are both timely and relevant. This means keeping pace with the latest human developments trends and striking a balance to achieve the proper fit between what is right for the Company and the employee.
The Right Thinking Continuous training and proactive
change management to ensure
proper utilization of technology
The Right Thinking Continuous and ongoing career
development
The Right Thinking Proactive identification of
performance gaps and providing
necessary training to address
shortcomings
Challenge #4 Incorporating training
to the establishment
of Values of the
company
Challenge #5 Disruption
through digitisation
Challenge #2 Retention
of key staff
Challenge #1 Performance
focused training
The Right Thinking Develop a learning culture within
the Company through regular
knowledge sharing, mentoring
and coaching
Challenge #3 Performance
centred Information
technology adoption
The Right Thinking Invest in systems that enable
continuous assessment of employee
performance
JKPLC is committed to invest in Human Capital solutions that would enhance the Company’s credentials as an employer of choice.
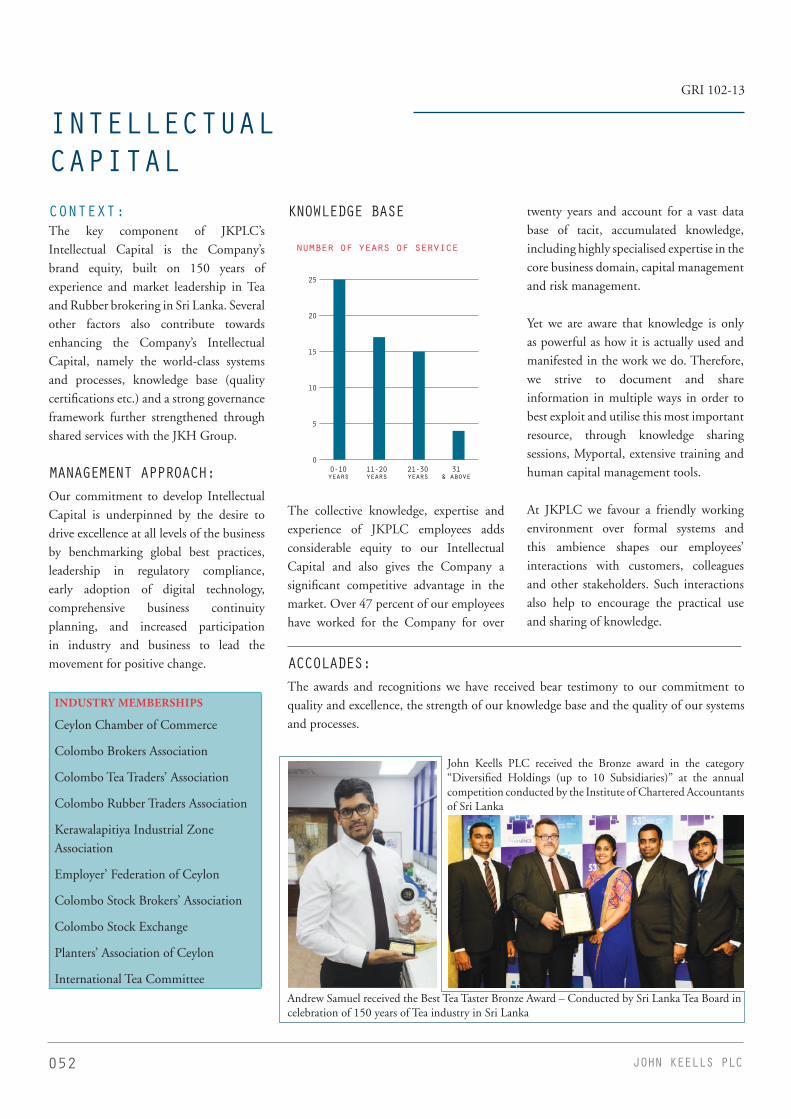
052 JOHN KEELLS PLC
CONTEXT: The key component of JKPLC’s Intellectual Capital is the Company’s brand equity, built on 150 years of experience and market leadership in Tea and Rubber brokering in Sri Lanka. Several other factors also contribute towards enhancing the Company’s Intellectual Capital, namely the world-class systems and processes, knowledge base (quality certifications etc.) and a strong governance framework further strengthened through shared services with the JKH Group.
MANAGEMENT APPROACH: Our commitment to develop Intellectual Capital is underpinned by the desire to drive excellence at all levels of the business by benchmarking global best practices, leadership in regulatory compliance, early adoption of digital technology, comprehensive business continuity planning, and increased participation in industry and business to lead the movement for positive change.
INDUSTRY MEMBERSHIPS
Ceylon Chamber of Commerce
Colombo Brokers Association
Colombo Tea Traders’ Association
Colombo Rubber Traders Association
Kerawalapitiya Industrial Zone Association
Employer’ Federation of Ceylon
Colombo Stock Brokers’ Association
Colombo Stock Exchange
Planters’ Association of Ceylon
International Tea Committee
INTELLECTUALCAPITAL
KNOWLEDGE BASE
0
5
10
15
20
25
number of years of service
0-10years
11-20years
21-30years
31& above
The collective knowledge, expertise and experience of JKPLC employees adds considerable equity to our Intellectual Capital and also gives the Company a significant competitive advantage in the market. Over 47 percent of our employees have worked for the Company for over
twenty years and account for a vast data base of tacit, accumulated knowledge, including highly specialised expertise in the core business domain, capital management and risk management.
Yet we are aware that knowledge is only as powerful as how it is actually used and manifested in the work we do. Therefore, we strive to document and share information in multiple ways in order to best exploit and utilise this most important resource, through knowledge sharing sessions, Myportal, extensive training and human capital management tools.
At JKPLC we favour a friendly working environment over formal systems and this ambience shapes our employees’ interactions with customers, colleagues and other stakeholders. Such interactions also help to encourage the practical use and sharing of knowledge.
ACCOLADES:The awards and recognitions we have received bear testimony to our commitment to quality and excellence, the strength of our knowledge base and the quality of our systems and processes.
John Keells PLC received the Bronze award in the category “Diversified Holdings (up to 10 Subsidiaries)” at the annual competition conducted by the Institute of Chartered Accountants of Sri Lanka
Andrew Samuel received the Best Tea Taster Bronze Award – Conducted by Sri Lanka Tea Board in celebration of 150 years of Tea industry in Sri Lanka
GRI 102-13

053Annual Report 2017/18
THE RIGHT THINKING
ACTIVITY REPORT 2017/18Focus Area Activity
Benchmarking global best practices
OHSAS 18001: 2007 - Occupational Health and Safety Standards – John Keells Warehousing (Pvt) Ltd(Certification period: 05.11.2016 – 04.11.2018)
Renewed
ISO 22000: 2005 – Food Safety Management Systems – John Keells Warehousing (Pvt) Ltd (Certification period: 31.07.2015 – 30.07.2018)
Renewed
Business Continuity Planning
Business Continuity Plan - JKPLC/JKW Last update on 17th January 2018
Early Adoption of technology
New Tea and warehousing system Investment Rs. 2.42 Mn
Integrated SAP modules (Upgrade) Investment Rs. 0.54Mn
Adoption of forest pin technology, a forensic analytics tool with embedded artificial intelligence technology to facilitate real time outlier alerts for vendor payments, claims payments, etc.
Ongoing
The Right Thinking Invest in Learning & development
for employees and promote the
effective utilisation of technology
The Right Thinking Develop systems in line with Group
values and the active involvement
of employees
The Right Thinking Adhere to group values and
innovative to meet market
requirements
Challenge #4 Institutional
influences
Challenge #5 Disruption
through digitisation
Challenge #2 Information
security threat
Challenge #1 Growing the
brand value
The Right Thinking Regular interaction with regulators
to foster collaborative partnerships
for the betterment of the industry
Challenge #3 Government
Institutional
influences
The Right Thinking Fully comply with all regulatory
requirements by promoting
a compliance culture within
the Company
PROPOSED ACTIVITIES FOR 2018/19• Completion of the new Tea/Rubber
and warehousing system integration
• Improvements and training on cyber security
• Involve/encourage customers and suppliers to use the on-line platform for daily transactions
• Implementing new online banking facilities with added focus on information safety
• Incorporate the Group-wide tax return system for transparent reporting purposes
CHALLENGES AND THE RIGHT THINKING Several challenges exist when developing Intellectual Capital, the most critical being the need to secure the commitment of employees and to ensure they remain properly aligned to the Company’s thinking at all times. Employee commitment is critical especially if the Company is to achieve industry leadership with regards to technology adoption.
Equally important is the continuous and ongoing interaction with regulators, which will enable JKPLC to stay updated with the latest developments in the compliance framework. Meanwhile building relationships with researchers will be crucial in identifying market trends.
JKPLC will seek to enhance its Intellectual Capital through targeted efforts that would enable the Company to sustain its growth momentum in the long-term.
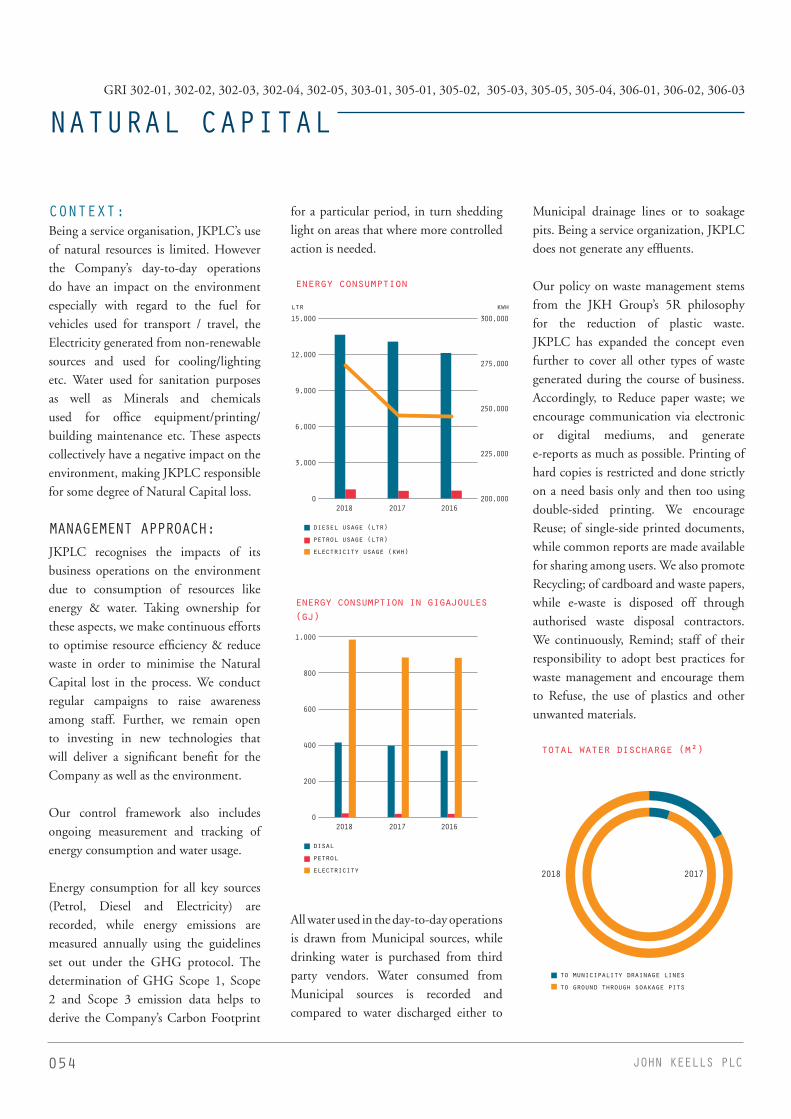
054 JOHN KEELLS PLC
CONTEXT: Being a service organisation, JKPLC’s use of natural resources is limited. However the Company’s day-to-day operations do have an impact on the environment especially with regard to the fuel for vehicles used for transport / travel, the Electricity generated from non-renewable sources and used for cooling/lighting etc. Water used for sanitation purposes as well as Minerals and chemicals used for office equipment/printing/building maintenance etc. These aspects collectively have a negative impact on the environment, making JKPLC responsible for some degree of Natural Capital loss.
MANAGEMENT APPROACH: JKPLC recognises the impacts of its business operations on the environment due to consumption of resources like energy & water. Taking ownership for these aspects, we make continuous efforts to optimise resource efficiency & reduce waste in order to minimise the Natural Capital lost in the process. We conduct regular campaigns to raise awareness among staff. Further, we remain open to investing in new technologies that will deliver a significant benefit for the Company as well as the environment.
Our control framework also includes ongoing measurement and tracking of energy consumption and water usage.
Energy consumption for all key sources (Petrol, Diesel and Electricity) are recorded, while energy emissions are measured annually using the guidelines set out under the GHG protocol. The determination of GHG Scope 1, Scope 2 and Scope 3 emission data helps to derive the Company’s Carbon Footprint
for a particular period, in turn shedding light on areas that where more controlled action is needed.
0
3,000
6,000
9,000
12,000
15,000
200,000
225,000
250,000
275,000
300,000
energy consumption
2018 2017 2016
diesel usage (ltr)petrol usage (ltr)electricity usage (kwh)
ltr kwh
0
200
400
600
800
1,000
energy consumption in gigajoules(gj)
2018 2017 2016
disalpetrolelectricity
All water used in the day-to-day operations is drawn from Municipal sources, while drinking water is purchased from third party vendors. Water consumed from Municipal sources is recorded and compared to water discharged either to
Municipal drainage lines or to soakage pits. Being a service organization, JKPLC does not generate any effluents.
Our policy on waste management stems from the JKH Group’s 5R philosophy for the reduction of plastic waste. JKPLC has expanded the concept even further to cover all other types of waste generated during the course of business. Accordingly, to Reduce paper waste; we encourage communication via electronic or digital mediums, and generate e-reports as much as possible. Printing of hard copies is restricted and done strictly on a need basis only and then too using double-sided printing. We encourage Reuse; of single-side printed documents, while common reports are made available for sharing among users. We also promote Recycling; of cardboard and waste papers, while e-waste is disposed off through authorised waste disposal contractors. We continuously, Remind; staff of their responsibility to adopt best practices for waste management and encourage them to Refuse, the use of plastics and other unwanted materials.
total water discharge (m²)
to municipality drainage linesto ground through soakage pits
20172018
NATURAL CAPITALGRI 302-01, 302-02, 302-03, 302-04, 302-05, 303-01, 305-01, 305-02, 305-03, 305-05, 305-04, 306-01, 306-02, 306-03

055Annual Report 2017/18
THE RIGHT THINKING
JKPLC CARBON FOOTPRINTSource 2017/2018 % 2016/2017 % 2015/2016 %
Scope 01 - Direct emission released from sources that are owned or controlled by the company
On-site energy consumption 32 14 31 15 28 15
Scope 02 - Indirect emission associated from the generation of imported energy (e.g. grid electricity)
Purchased electricity 186 84 168 82 168 85
Scope 03 - All other indirect emission sources that are not released from sources mentioned under scope 1 and 2.
Business traveling 4 2 6 3 - -
Total CO2 Foot Print 222 100 205 100 196 100
Carbon footprint (tCO2e) per Rs. Millions of revenue
0.27 0.33 0.28
PROPOSED ACTIVITIES FOR 2018/19> Invest in a solar pannel system at the Warehouse to reduce the electricity consumption from the main Electricity Grid> Install LED lighting system to reduce Electricity consumption for lighting by 58 percent > Invest in the Inverter Type Air conditioner units, to reduce electricity consumption by 30 percent
PLASTICCYCLEThe Plasticcycle Social Entrepreneurship project is aimed at reducing plastic pollution, by encouraging a reduction in the use of single-use plastics, supporting responsible disposal and promoting recycling initiatives.
Plasticcycle was launched as a pilot project in July 2017 in two wards belonging to the Colombo Municipal Council located in Colombo 2 (Wekanda
and Hunupitiya) with the intention of adopting the learnings from the pilot project in expanding the project.
Under the initiative the parent company (JKH) has introduced bins to collect plastic waste for recycling. Based on the positive response to the three bins that were placed initially, the Company is now expanding bin locations across many of the Keells Super outlets in and around Colombo.
Change needs to start with each and every one of us. Therefore, employees at John Keells PLC took a pledge to Refuse, Reduce, Reuse and Recycle plastics and become catalysts for that change.
ACTIVITY REPORT 2017/18All staff made a pledge to comply with the JKH Group plastic reduction project for waste management.

056 JOHN KEELLS PLC
The Right Thinking Invest in renewable energy and
promote recycling of materials
The Right Thinking Raising awareness among employees
and promoting active participation
in the Company’s environmental
initiatives
The Right Thinking Adhering to mandatory
environmental compliance
requirements applicable to the
business and adopt voluntary codes
where possible
Challenge #4 Institutional influences
Challenge #5 Influence
on utilisation
of renewable energy
Challenge #2 Engage employees
to contribute
towards sustainability
initiatives
Challenge #3 Government
Institutional
influences
The Right Thinking Align with Group Initiatives
to be recognised as a sustainable
corporate citizen
The Right Thinking Involve staff to assess capital assets
and determine needs in advance
to be incorporated in the strategic
plan and ensure necessary budgetary
allocations are made.
Challenge #1 Allocating initial
investments in
Natural Capital
CHALLENGES AND THE RIGHT THINKING Creating value for the environment has to be undertaken with progressive mindset and the active participation of stakeholders to pave the way for broader systemic change.
JKPLC will work cohesively with all stakeholders to preserve the environment for future generations.

057Annual Report 2017/18
THE RIGHT THINKING
SUSTAINABILITY
JKPLC is committed to maximizing social, economic and environmental value generated for the benefit of the Company’s stakeholders. In an economic sense JKPLC will conduct all business activities in a straightforward, open manner honestly and in good faith free from fraud or deception. In order to achieve this, the Company and all employees will: -
• Seek to comply with all relevant laws and regulations that apply to the business.
• Seek to generate sufficient profit to meet the needs of all stakeholders.
• Seek mutually beneficial commercial relationships with third parties
• Seek to offer responsible solutions that contribute towards increased benefits for our customers.
We are looking to build a sustainable business, which is measured not only in economic terms but also in the terms of environmental and social impact. In doing so we remain aligned with the ongoing effort to help solve global issues and have incorporated the ten principles of the UNGC and the Sustainable Development Goals (SDGs) throughout all our business activities.
We extend our commitment to sustainability through transparent reporting and want to provide information in a way that is most relevant to our diverse stakeholders. Accordingly, JKPLC has adopted the GRI Reporting Framework for reporting on matters that demonstrate the Company’s economic, social and environmental sustainability.
Participating and Encouraging Environment practices and operate in sustainable conditions
• Proposed Investing in LED lighting systems to reduce the lighting energy by 58 percent
• Proposed Investing in Inverter Type Air conditioner units to reduce the energy by 30 percent• Proposed Investment on Solar panels
GRI Standard GRI 302 : Energy GRI 303 : Water
GRI 305 : Emissions GRI 306 : Effluents and Waste
Innovative Business Solution with advance Technology involvement
• Completion of the new Tea/Rubber and Warehousing system integration
• Improvements and training on cyber security • Encourage customers
and suppliers on using on-line platform GRI Standard
GRI 201 : Economic Performance GRI 401 : Employment
Ensuring Gender Equality and Conducting Learning and Development activities for staff
• Conducting training programs for Prevention of Child Abuse / Cyber security • Initiate in Project WAVE Program (Working
Against Violence through Education)GRI Standard
GRI 406 : Non-discrimination GRI 401 : Employment
GRI 404 : Training and Development
Community Development • Staff volunteered in Eye camps in Neighbouring Schools in Colombo
• Staff volunteered in repairing and Colour washing houses in Morawaka area, which were affected by floods
GRI StandardGRI 201 : Economic Performance
Maintain and upgrade the physical assets for the better service provision
• Upgrading the warehousing assets base and assist the staff on effective utilisation of resources
GRI StandardGRI 404 : Training and Education
Sustainable Financial Performance • Increasing in Economic Value addition by 23.4 percent
• 100 percent Purchases from local suppliers GRI Standard
GRI 201 : Economic Performance GRI 401 : Employment
Financial CapitalManufactured Capital
Human CapitalSocial & Relationship
Capital Intellectual Capital
Natural Capital

058 JOHN KEELLS PLC
UN Global Compact Principles, 2000 Covered under - GRI Standard
Principle 1. Businesses should support and respect the protection of internationally proclaimed human rights
Human Rights Assessment 412-3Human Rights Assessment 412-2Non-discrimination 406-1Child Labour 408-1
Forced or Compulsory Labour 409-1Human Rights Assessment 412-1Supplier Social Assessment 414-1Supplier Social Assessment 414-2Principle 2. Businesses should make sure they
are not complicit in human rights abuses
Principle 3. Businesses should uphold the freedom of association and the effective recognition of the right to collective bargaining
Collective bargaining agreements 102-41
Principle 4. Businesses should uphold the elimination of all forms of forced and compulsory labour
Human Rights Assessment 412-3Human Rights Assessment 412-2Non-discrimination 406-1
Child Labour 408-1Forced or Compulsory Labour 409-1
Principle 5. Businesses should uphold the effective abolition of child labour
Child Labour 408-1Forced or Compulsory Labour 409-1
Principle 6. Businesses should uphold the elimination of discrimination in respect of employment and occupation
102-8 Information on employees and other workers
Principle 7. Businesses should support a precautionary approach to environmental challenges
GRI 300 : Environmental (all Aspects)
Principle 8. Businesses should undertake initiatives to promote greater environmental responsibility
GRI 300 : Environmental (all Aspects)
Principle 9. Businesses should encourage the development and diffusion of environmentally friendly technologies
GRI 300 : Environmental (all Aspects)
Principle 10. Businesses should work against corruption in all its forms, including extortion and bribery
GRI 205 Anti-corruptionGRI 415 Public PolicyGRI 206 Anti-competitive Behaviour
The Sustainable Development Goals (SDGs), otherwise known as the Global Goals, are a universal call to action to end poverty, protect the planet and ensure that all people enjoy peace and prosperity. John Keells PLC’s commitment to the SDG’s is operationalized by our “Right Thinking” corporate strategy; whereby we seek to integrate appropriate action on a day-to-day basis to fulfil our commitment to the following Goals;
Goal 1:No PovertyGoal 4: Quality EducationGoal 5: Gender EqualityGoal 6: Clean Water and Sanitation
Goal 7: Affordable and Clean Energy Goal 8 Decent Work and Economic Growth Goal 9: Industry Innovation and infrastructure
OUR COMMITMENT TO ACHIEVE UNITED NATIONS SUSTAINABILITY DEVELOPMENT GOALS UN GLOBAL COMPACT PRINCIPLES, 2000JKPLC is committed to integrating the UNGC’s ten principles in the areas of human rights, labour, environment and anti-corruption into its “daily business activities vis-à-vis our “Right Thinking” corporate strategy.
By doing so our intention is to support the vision of an inclusive, resource-efficient and sustainable global economy. Further by subscribing to these ten principles, we seek to demonstrate that sustainability is at the core of our corporate value system.
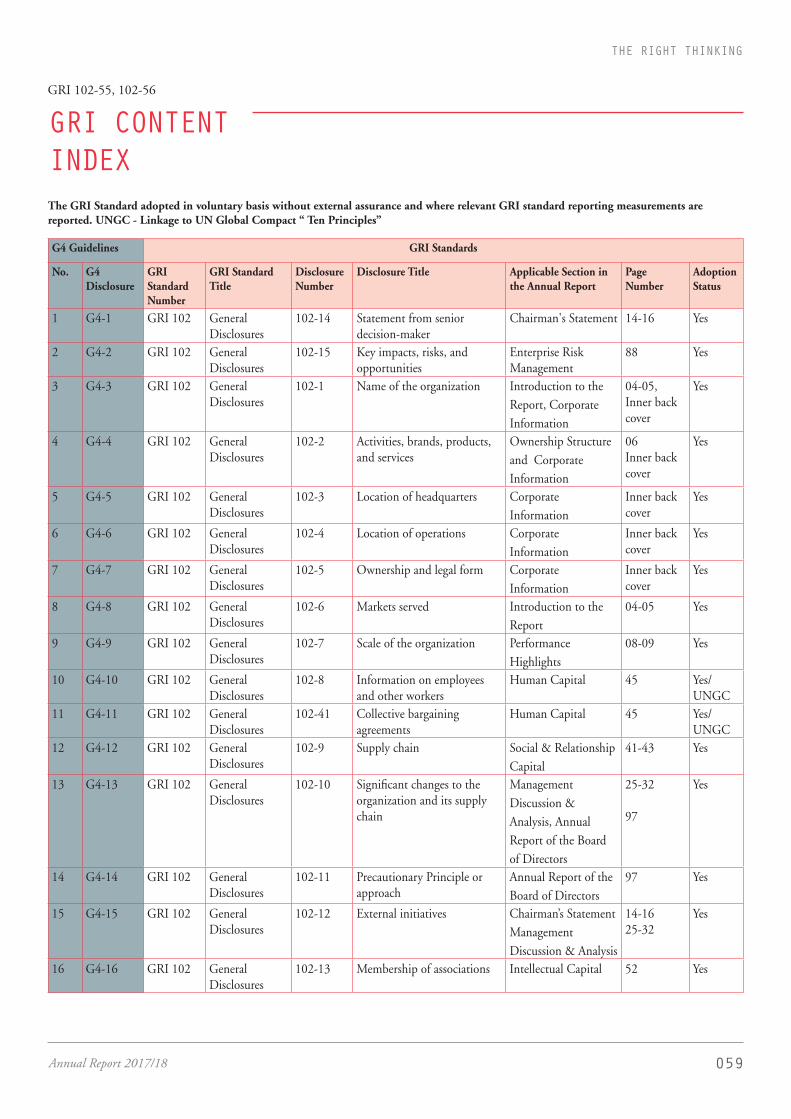
059Annual Report 2017/18
THE RIGHT THINKING
GRI CONTENT INDEX
G4 Guidelines GRI Standards
No. G4 Disclosure
GRI Standard Number
GRI Standard Title
Disclosure Number
Disclosure Title Applicable Section in the Annual Report
Page Number
Adoption Status
1 G4-1 GRI 102 General Disclosures
102-14 Statement from senior decision-maker
Chairman's Statement 14-16 Yes
2 G4-2 GRI 102 General Disclosures
102-15 Key impacts, risks, and opportunities
Enterprise Risk Management
88 Yes
3 G4-3 GRI 102 General Disclosures
102-1 Name of the organization Introduction to the Report, Corporate Information
04-05, Inner back cover
Yes
4 G4-4 GRI 102 General Disclosures
102-2 Activities, brands, products, and services
Ownership Structure and Corporate Information
06Inner back cover
Yes
5 G4-5 GRI 102 General Disclosures
102-3 Location of headquarters Corporate Information
Inner back cover
Yes
6 G4-6 GRI 102 General Disclosures
102-4 Location of operations Corporate Information
Inner back cover
Yes
7 G4-7 GRI 102 General Disclosures
102-5 Ownership and legal form Corporate Information
Inner back cover
Yes
8 G4-8 GRI 102 General Disclosures
102-6 Markets served Introduction to the Report
04-05 Yes
9 G4-9 GRI 102 General Disclosures
102-7 Scale of the organization Performance Highlights
08-09 Yes
10 G4-10 GRI 102 General Disclosures
102-8 Information on employees and other workers
Human Capital 45 Yes/UNGC
11 G4-11 GRI 102 General Disclosures
102-41 Collective bargaining agreements
Human Capital 45 Yes/UNGC
12 G4-12 GRI 102 General Disclosures
102-9 Supply chain Social & Relationship Capital
41-43 Yes
13 G4-13 GRI 102 General Disclosures
102-10 Significant changes to the organization and its supply chain
Management Discussion & Analysis, Annual Report of the Board of Directors
25-32
97
Yes
14 G4-14 GRI 102 General Disclosures
102-11 Precautionary Principle or approach
Annual Report of the Board of Directors
97 Yes
15 G4-15 GRI 102 General Disclosures
102-12 External initiatives Chairman’s Statement Management Discussion & Analysis
14-1625-32
Yes
16 G4-16 GRI 102 General Disclosures
102-13 Membership of associations Intellectual Capital 52 Yes
The GRI Standard adopted in voluntary basis without external assurance and where relevant GRI standard reporting measurements are reported. UNGC - Linkage to UN Global Compact ‘‘ Ten Principles’’
GRI 102-55, 102-56
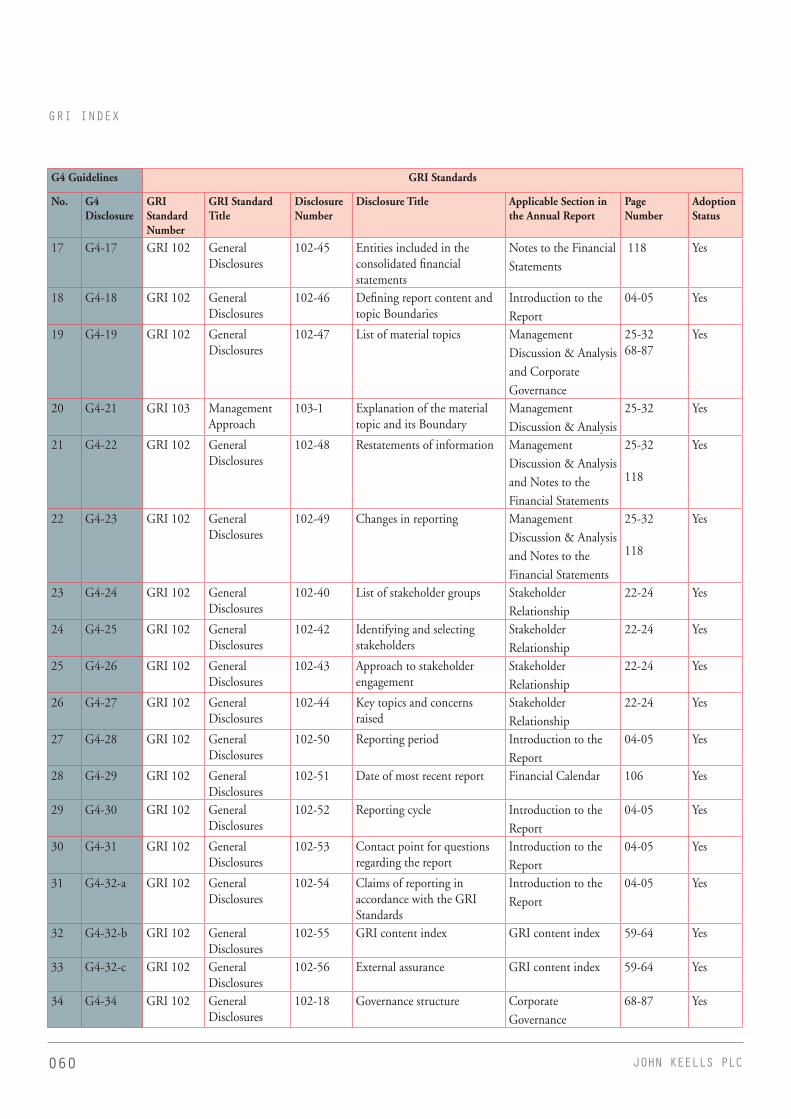
060 JOHN KEELLS PLC
G4 Guidelines GRI Standards
No. G4 Disclosure
GRI Standard Number
GRI Standard Title
Disclosure Number
Disclosure Title Applicable Section in the Annual Report
Page Number
Adoption Status
17 G4-17 GRI 102 General Disclosures
102-45 Entities included in the consolidated financial statements
Notes to the Financial Statements
118 Yes
18 G4-18 GRI 102 General Disclosures
102-46 Defining report content and topic Boundaries
Introduction to the Report
04-05 Yes
19 G4-19 GRI 102 General Disclosures
102-47 List of material topics Management Discussion & Analysis and Corporate Governance
25-3268-87
Yes
20 G4-21 GRI 103 Management Approach
103-1 Explanation of the material topic and its Boundary
Management Discussion & Analysis
25-32 Yes
21 G4-22 GRI 102 General Disclosures
102-48 Restatements of information Management Discussion & Analysis and Notes to the Financial Statements
25-32
118
Yes
22 G4-23 GRI 102 General Disclosures
102-49 Changes in reporting Management Discussion & Analysis and Notes to the Financial Statements
25-32
118
Yes
23 G4-24 GRI 102 General Disclosures
102-40 List of stakeholder groups Stakeholder Relationship
22-24 Yes
24 G4-25 GRI 102 General Disclosures
102-42 Identifying and selecting stakeholders
Stakeholder Relationship
22-24 Yes
25 G4-26 GRI 102 General Disclosures
102-43 Approach to stakeholder engagement
Stakeholder Relationship
22-24 Yes
26 G4-27 GRI 102 General Disclosures
102-44 Key topics and concerns raised
Stakeholder Relationship
22-24 Yes
27 G4-28 GRI 102 General Disclosures
102-50 Reporting period Introduction to the Report
04-05 Yes
28 G4-29 GRI 102 General Disclosures
102-51 Date of most recent report Financial Calendar 106 Yes
29 G4-30 GRI 102 General Disclosures
102-52 Reporting cycle Introduction to the Report
04-05 Yes
30 G4-31 GRI 102 General Disclosures
102-53 Contact point for questions regarding the report
Introduction to the Report
04-05 Yes
31 G4-32-a GRI 102 General Disclosures
102-54 Claims of reporting in accordance with the GRI Standards
Introduction to the Report
04-05 Yes
32 G4-32-b GRI 102 General Disclosures
102-55 GRI content index GRI content index 59-64 Yes
33 G4-32-c GRI 102 General Disclosures
102-56 External assurance GRI content index 59-64 Yes
34 G4-34 GRI 102 General Disclosures
102-18 Governance structure Corporate Governance
68-87 Yes
GRI INDEX
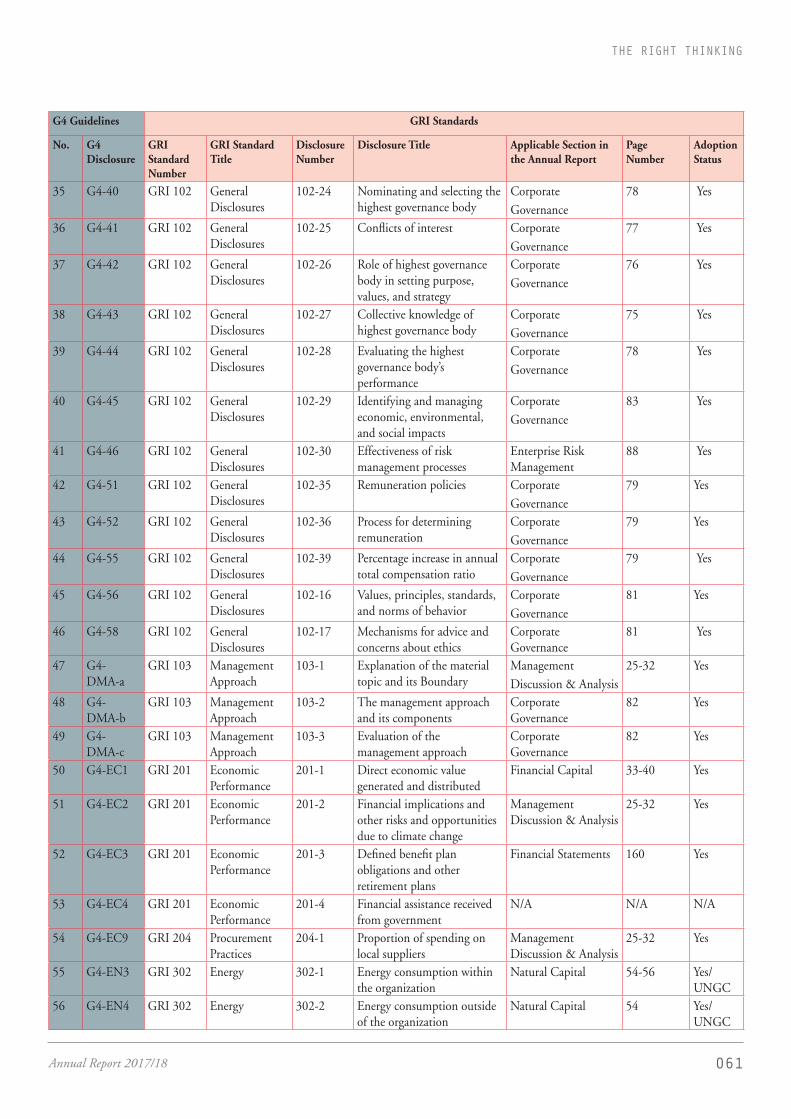
061Annual Report 2017/18
THE RIGHT THINKING
G4 Guidelines GRI Standards
No. G4 Disclosure
GRI Standard Number
GRI Standard Title
Disclosure Number
Disclosure Title Applicable Section in the Annual Report
Page Number
Adoption Status
35 G4-40 GRI 102 General Disclosures
102-24 Nominating and selecting the highest governance body
Corporate Governance
78 Yes
36 G4-41 GRI 102 General Disclosures
102-25 Conflicts of interest Corporate Governance
77 Yes
37 G4-42 GRI 102 General Disclosures
102-26 Role of highest governance body in setting purpose, values, and strategy
Corporate Governance
76 Yes
38 G4-43 GRI 102 General Disclosures
102-27 Collective knowledge of highest governance body
Corporate Governance
75 Yes
39 G4-44 GRI 102 General Disclosures
102-28 Evaluating the highest governance body’s performance
Corporate Governance
78 Yes
40 G4-45 GRI 102 General Disclosures
102-29 Identifying and managing economic, environmental, and social impacts
Corporate Governance
83 Yes
41 G4-46 GRI 102 General Disclosures
102-30 Effectiveness of risk management processes
Enterprise Risk Management
88 Yes
42 G4-51 GRI 102 General Disclosures
102-35 Remuneration policies Corporate Governance
79 Yes
43 G4-52 GRI 102 General Disclosures
102-36 Process for determining remuneration
Corporate Governance
79 Yes
44 G4-55 GRI 102 General Disclosures
102-39 Percentage increase in annual total compensation ratio
Corporate Governance
79 Yes
45 G4-56 GRI 102 General Disclosures
102-16 Values, principles, standards, and norms of behavior
Corporate Governance
81 Yes
46 G4-58 GRI 102 General Disclosures
102-17 Mechanisms for advice and concerns about ethics
Corporate Governance
81 Yes
47 G4-DMA-a
GRI 103 Management Approach
103-1 Explanation of the material topic and its Boundary
Management Discussion & Analysis
25-32 Yes
48 G4-DMA-b
GRI 103 Management Approach
103-2 The management approach and its components
Corporate Governance
82 Yes
49 G4-DMA-c
GRI 103 Management Approach
103-3 Evaluation of the management approach
Corporate Governance
82 Yes
50 G4-EC1 GRI 201 Economic Performance
201-1 Direct economic value generated and distributed
Financial Capital 33-40 Yes
51 G4-EC2 GRI 201 Economic Performance
201-2 Financial implications and other risks and opportunities due to climate change
Management Discussion & Analysis
25-32 Yes
52 G4-EC3 GRI 201 Economic Performance
201-3 Defined benefit plan obligations and other retirement plans
Financial Statements 160 Yes
53 G4-EC4 GRI 201 Economic Performance
201-4 Financial assistance received from government
N/A N/A N/A
54 G4-EC9 GRI 204 Procurement Practices
204-1 Proportion of spending on local suppliers
Management Discussion & Analysis
25-32 Yes
55 G4-EN3 GRI 302 Energy 302-1 Energy consumption within the organization
Natural Capital 54-56 Yes/UNGC
56 G4-EN4 GRI 302 Energy 302-2 Energy consumption outside of the organization
Natural Capital 54 Yes/UNGC

062 JOHN KEELLS PLC
G4 Guidelines GRI Standards
No. G4 Disclosure
GRI Standard Number
GRI Standard Title
Disclosure Number
Disclosure Title Applicable Section in the Annual Report
Page Number
Adoption Status
57 G4-EN5 GRI 302 Energy 302-3 Energy intensity Natural Capital 54 Yes/UNGC
58 G4-EN6 GRI 302 Energy 302-4 Reduction of energy consumption
Natural Capital 54 Yes/UNGC
59 G4-EN7 GRI 302 Energy 302-5 Reductions in energy requirements of products and services
Natural Capital 54 Yes/UNGC
60 G4-EN8 GRI 303 Water 303-1 Water withdrawal by source Natural Capital 54 Yes/UNGC
61 G4-EN9 GRI 303 Water 303-2 Water sources significantly affected by withdrawal of water
N/A N/A N/A
62 G4-EN10 GRI 303 Water 303-3 Water recycled and reused N/A N/A N/A
63 G4-EN15 GRI 305 Emissions 305-1 Direct (Scope 1) GHG emissions
Natural Capital 54 Yes/UNGC
64 G4-EN16 GRI 305 Emissions 305-2 Energy indirect (Scope 2) GHG emissions
Natural Capital 54 Yes/UNGC
65 G4-EN17 GRI 305 Emissions 305-3 Other indirect (Scope 3) GHG emissions
Natural Capital 54 Yes/UNGC
66 G4-EN18 GRI 305 Emissions 305-4 GHG emissions intensity Natural Capital 54 Yes/UNGC
67 G4-EN19 GRI 305 Emissions 305-5 Reduction of GHG emissions Natural Capital 54 Yes/UNGC
68 G4-EN20 GRI 305 Emissions 305-6 Emissions of ozone-depleting substances (ODS)
N/A N/A N/A
69 G4-EN21 GRI 305 Emissions 305-7 Nitrogen oxides (NOX), sulfur oxides (SOX), and other significant air emissions
N/A N/A N/A
70 G4-EN22 GRI 306 Effluents and Waste
306-1 Water discharge by quality and destination
Natural Capital 54 Yes/UNGC
71 G4-EN23 GRI 306 Effluents and Waste
306-2 Waste by type and disposal method
Natural Capital 54 Yes/UNGC
72 G4-EN24 GRI 306 Effluents and Waste
306-3 Significant spills Natural Capital 54 Yes/UNGC
73 G4-EN25 GRI 306 Effluents and Waste
306-4 Transport of hazardous waste N/A N/A N/A
74 G4-EN26 GRI 306 Effluents and Waste
306-5 Water bodies affected by water discharges and/or runoff
N/A N/A N/A
75 G4-EN29 GRI 307 Environmental Compliance
307-1 Non-compliance with environmental laws and regulations
N/A N/A N/A
76 G4-EN32 GRI 308 Supplier Environmental Assessment
308-1 New suppliers that were screened using environmental criteria
N/A N/A N/A
GRI INDEX

063Annual Report 2017/18
THE RIGHT THINKING
G4 Guidelines GRI Standards
No. G4 Disclosure
GRI Standard Number
GRI Standard Title
Disclosure Number
Disclosure Title Applicable Section in the Annual Report
Page Number
Adoption Status
77 G4-EN33 GRI 308 Supplier Environmental Assessment
308-2 Negative environmental impacts in the supply chain and actions taken
N/A N/A N/A
78 G4-LA1 GRI 401 Employment 401-1 New employee hires and employee turnover
Human Capital 45-51 Yes
79 G4-LA2 GRI 401 Employment 401-2 Benefits provided to full-time employees that are not provided to temporary or part-time employees
Human Capital 45-51 Yes
80 G4-LA3 GRI 401 Employment 401-3 Parental leave Human Capital 45-51 Yes
81 G4-LA4 GRI 402 Labor/Management Relations
402-1 Minimum notice periods regarding operational changes
Human Capital 45-51 Yes
82 G4-LA5 GRI 403 Occupational Health and Safety
403-1 Workers representation in formal joint management–worker health and safety committees
Human Capital 45-51 Yes
83 G4-LA6 GRI 403 Occupational Health and Safety
403-2 Types of injury and rates of injury, occupational diseases, lost days, and absenteeism, and number of work-related fatalities
Human Capital and Performance Highlights
45-5108-09
Yes
84 G4-LA7 GRI 403 Occupational Health and Safety
403-3 Workers with high incidence or high risk of diseases related to their occupation
Human Capital 45-51 Yes
85 G4-LA8 GRI 403 Occupational Health and Safety
403-4 Health and safety topics covered in formal agreements with trade unions
N/A N/A N/A
86 G4-LA9 GRI 404 Training and Education
404-1 Average hours of training per year per employee
Human Capital 45-51 Yes
87 G4-LA10 GRI 404 Training and Education
404-2 Programs for upgrading employee skills and transition assistance programs
Human Capital 45-51 Yes
88 G4-LA11 GRI 404 Training and Education
404-3 Percentage of employees receiving regular performance and career development reviews
Human Capital 45-51 Yes
89 G4-LA14 GRI 414 Supplier Social Assessment
414-1 New suppliers that were screened using social criteria
Social & Relationship Capital
41-44 Yes
90 G4-LA15 GRI 414 Supplier Social Assessment
414-2 Negative social impacts in the supply chain and actions taken
Social & Relationship Capital
41-44 Yes
91 G4-HR1 GRI 412 Human Rights Assessment
412-3 Significant investment agreements and contracts that include human rights clauses or that underwent human rights screening
N/A N/A N/A
92 G4-HR2 GRI 412 Human Rights Assessment
412-2 Employee training on human rights policies or procedures
Human Capital 45-51 Yes/UNGC
93 G4-HR3 GRI 406 Non-discrimination
406-1 Incidents of discrimination and corrective actions taken
Human Capital 45-51 Yes/UNGC

064 JOHN KEELLS PLC
G4 Guidelines GRI Standards
No. G4 Disclosure
GRI Standard Number
GRI Standard Title
Disclosure Number
Disclosure Title Applicable Section in the Annual Report
Page Number
Adoption Status
94 G4-HR5 GRI 408 Child Labor 408-1 Operations and suppliers at significant risk for incidents of child labor
N/A N/A N/A
95 G4-HR6 GRI 409 Forced or Compulsory Labor
409-1 Operations and suppliers at significant risk for incidents of forced or compulsory labor
N/A N/A N/A
96 G4-HR9 GRI 412 Human Rights Assessment
412-1 Operations that have been subject to human rights reviews or impact assessments
N/A N/A N/A
97 G4-HR10 GRI 414 Supplier Social Assessment
414-1 New suppliers that were screened using social criteria
N/A N/A N/A
98 G4-HR11 GRI 414 Supplier Social Assessment
414-2 Negative social impacts in the supply chain and actions taken
N/A N/A N/A
99 G4-SO3 GRI 205 Anti-corruption 205-1 Operations assessed for risks related to corruption
Enterprise Risk Management
88 Yes/UNGC
100 G4-SO4 GRI 205 Anti-corruption 205-2 Communication and training about anti-corruption policies and procedures
Enterprise Risk Management
88 Yes/UNGC
101 G4-SO5 GRI 205 Anti-corruption 205-3 Confirmed incidents of corruption and actions taken
N/A N/A N/A
102 G4-SO6 GRI 415 Public Policy 415-1 Political contributions N/A N/A N/A
103 G4-SO7 GRI 206 Anti-competitive Behavior
206-1 Legal actions for anti-competitive behavior, anti-trust, and monopoly practices
N/A N/A N/A
104 G4-SO8 GRI 419 Socioeconomic Compliance
419-1 Non-compliance with laws and regulations in the social and economic area
N/A N/A N/A
105 G4-SO9 GRI 414 Supplier Social Assessment
414-1 New suppliers that were screened using social criteria
N/A N/A N/A
106 G4-SO10 GRI 414 Supplier Social Assessment
414-2 Negative social impacts in the supply chain and actions taken
N/A N/A N/A
107 G4-PR1 GRI 416 Customer Health and Safety
416-1 Assessment of the health and safety impacts of product and service categories
N/A N/A N/A
108 G4-PR2 GRI 416 Customer Health and Safety
416-2 Incidents of non-compliance concerning the health and safety impacts of products and services
N/A N/A N/A
109 G4-PR9 GRI 419 Socioeconomic Compliance
419-1 Non-compliance with laws and regulations in the social and economic area
N/A N/A N/A
GRI INDEX
065Annual Report 2017/18
THE RIGHT THINKING
The Right Principle
66 | Board of Directors 68 | Corporate Governance 88 | Enterprise Risk Management 94 | Audit Committee Report 97 | Annual Report of the Board of
Directors 103 | Statement of Directors’
Responsibility 104 | Senior Management

066 JOHN KEELLS PLC
SUSANTHA RATNAYAKE
Chairman / Non-Independent Non-Executive Director
Appointed:
To Company Board 1992Percentage of Shares held 0 %
Board Committees
Member of Nomination Committee and Related Party Transaction Review Committee.
Skills and Experience:
Member of the John Keells Holdings PLC Board for over 25 years. He has over 41 years of management experience within the John Keells Group. He is a past chairman of the Sri Lanka Tea Board, Ceylon Chamber of Commerce and Employers’ Federation of Ceylon.
Other Current Appointments
Chairman and CEO of John Keells Holdings PLC (JKH) and Chairman/
Director of many listed/Unlisted Companies in the JKH Group.
KRISHAN BALENDRA
Non-Independent Non-Executive Director
Appointed:
To Company Board 2018Percentage of Shares held 0 %
Board Committees
None
Skills and Experience:
He holds a law degree (LLB) from the University of London and a MBA from INSEAD.
Has worked at UBS Warburg in Hong Kong as an Investment Banker for four years and then at Aitken Spence PLC in the corporate finance division prior to joining JKH.
He is a past chairman of the Colombo Stock Exchange.
Other Current Appointments
Deputy Chairman of John Keells Holdings PLC and is responsible for the Leisure and Transportation industry groups, John Keells Stock Brokers and John Keells Office Automation.
He is the Hon. Consul General of the Republic of Poland in Sri Lanka.
GIHAN COORAY
Non-Independent Non-Executive Director
Appointed:
To Company Board 2018Percentage of Shares held 0 %
Board CommitteesNone
Skills and Experience:
He holds an MBA from the Jesse H. Jones Graduate School of Management at Rice University, Houston, Texas.
He is an Associate member of the Chartered Institute of Management Accountants, UK, a certified management accountant of the Institute of Certified Management Accountants, Australia and has a Diploma in Marketing from the Chartered Institute of Marketing, UK.
Other Current Appointments
Gihan Cooray is the Group Finance Director and has overall responsibility
for the Group’s Finance and Accounting, Taxation, Corporate Finance and Strategy, Treasury and Information Technology functions (including John Keells IT) and John Keells Research. He is a Director of several companies in the John Keells Group.
He serves as a Committee Member of the Ceylon Chamber of Commerce.
ANIL PERERA
Non-Independent Non-Executive Director
Appointed:
To Company Board 2015Percentage of Shares held 0 %
Board Committees
None
Skills and Experience:
He has over 39 years’ experience in the Tea Industry, having started his career at the Janatha Estates Development Board.
He has served in the Plantation Regions of Hatton, Avissawella, Kegalle and Nawalapitiya. He has held the positions of Operations Director – Namunukula Plantations, Deputy Chairman – Colombo Tea Traders’ Association and Chairman – Sri Lanka Tea Factory Owners Association.
He has held the positions of Governor – National Institute of Plantation Management and Director – Sri Lanka Tea Board.
Other Current Appointments
Chief Executive Officer of Tea Smallholder Factories PLC.
BOARD OFDIRECTORS

067Annual Report 2017/18
THE RIGHT THINKING
CHARITHA WIJEWARDANE
Independent Non-Executive Director
Appointed:
To Company Board 2016Percentage of Shares held 0 %
Board Committees
Member of Audit Committee
Skills and Experience:
Graduated from the University of HULL, UK with BSc Honours Degree in Digital Electronics and Communications.
Engineer by profession, He has work experience at IBMs Asia Pacific Group Headquarters in Hong Kong, Singapore and Sri Lanka where he was in-charge of Mass Marketing Programmes for IBMs AS/400 series.
He has served at Lexmark Internationals Asia Pacific Operations based in Sydney, Australia.
He is recognised for setting up effective channel operations in diverse cultures and sub cultures.
He also has served as an Independent Non-Executive Director of Bank of Ceylon and was a Board member of MBSL, MBSL Insurance and BOC Travels.
He served as Chairman Hotels Colombo (1963) the owning company of Grand Oriental Hotel.
Other Current Appointments
He currently serves as an Independent Non-Executive Director of the National Lotteries Board and is a member of the Audit committee of the Lotteries Board.
ANANDHIY GUNAWARDHANA
Independent Non- Executive Director
Appointed:
To Company Board 2016Percentage of Shares held 0 %
Board Committees
Member of Audit Committee
Skills and Experience:
Attorney-at-Law and partner of Julius & Creasy, Attorneys-at-Law and Notaries Public.
Graduated from the University of Colombo’s Faculty of Law in 1995 with Second Class (Upper Division) Honours and also secured First Class Honours at the Attorneys-at-Law (Final) Examination in 1996, conducted by the Sri Lanka Law College.
She is a Fulbright Scholar and was awarded the Master of Laws (L.L.M. with Distinction) by Georgetown University, Washington DC, in May 2000 and thereafter, served a 7 month internship with the International Monetary Fund’s Legal Department in Washington D.C.
She was called to the Bar in June 1997 and was duly enrolled as an Attorney-at-Law of the Supreme Court of Sri Lanka.
Having joined Julius & Creasy in August 1996 as an apprentice, she was made a professional associate in July 1997 and admitted as a Partner in 2005.
Her areas of specialization are Capital Markets, Corporate and Commercial Law and Mergers & Acquisitions
Other Current Appointments
Director of the Colombo Fort Land & Building PLC and L B Finance PLC.
ARUNDATHI RAJAKARIER
Independent Non- Executive Director
Appointed:
To Company Board 2016Percentage of Shares held 0 %
Board Committees
Chairperson of Audit Committee
Skills and Experience:
She has over 25 years working experience as a finance professional
She is an Associate member of the Institute of Chartered Accountants, Sri Lanka
She is a founder Director of SheConsults (Pvt) Ltd., a financial consulting company.
She has also been a Consultant to World Bank and other institutions on various assignments.
Has served as Country Manager for ACCA Sri Lanka and Maldives.
Has served at NDB Bank in senior roles covering Corporate and Merchant Banking.
She also has served as Finance Director of Lanka Cellular Services (Pvt) Ltd.
She also has served on the Board of NDB Securities (Pvt) Ltd., a subsidiary of NCAP as a Non-Executive Director.
Other Current Appointments
She serves on the Board of Morison PLC in the capacity of an Independent Non- Executive Director and the Chairperson of its Audit Committee and Related Party Transaction Review Committee.

068 JOHN KEELLS PLC
Significant Introductions during the Financial Year 2017/2018 to further strengthen the adherence of Corporate Governance
• Further development of Forestpin which was introduced to the John Keells PLC Group last year in order to monitor discrepancies in control accounts.
• Migration of Tea system to “tbBOSS” warranting operations in an up to date Information Technology platform.
• Live testing of Business Continuity Plans
• John Keells PLC established a Cyber security policy in line with the John Keells Group and is in the process of implementing a security intelligence platform to further strengthen cyber resilience.
Corporate governance is essential to facilitate effective, entrepreneurial and prudent management that can deliver the long-term success of a Company. John Keells PLC (JKPLC), its subsidiary companies John Keells Warehousing (Pvt) Ltd (JKWL), John Keells Stock Brokers (Pvt) Ltd (JKSB) & Associate
company Keells Realtors Limited (KRL), referred to as the “Group” have strived to maintain the highest level of transparency when reporting both financial and non-financial information which has enhanced the trust stakeholders have in the Group. The Group has been structured and controlled internally through a process
of continuous review in facilitating the observance of the key principles of Corporate Governance.
Whilst the Group is governed by an internal process which ensures integrity and professionalism in all its activities and relationships, ethical values are also lived through every day in a constant effort to set high standards of social responsibility. This philosophy has been ingrained through the Group by means of a strong set of corporate values and a formal Code of Conduct and all employees, senior management and the Board of Directors are required to embrace this philosophy in the performance of their official duties. As a subsidiary of John Keells Holdings PLC (JKH) - the ultimate parent company, the Company displays these values and policies in its day-to-day activities as a fundamental requirement at
CORPORATE GOVERNANCE
HIGHLIGHTS OF THE 70TH AGM OF THE COMPANY HELD ON 23RD JUNE 2017• mr. a d gunawardene, who retired in terms of article 83 of the articles
of association of the company was re-elected director of the company.
• ms. a k gunawardhana, who retired in terms of article 90 of the articles of association of the company was re-elected director of the company.
• mr. c n wijewardene, who retired in terms of article 90 of the articles of association of the company was re-elected director of the company.
• ms. b a i rajakarier, who retired in terms of article 90 of the articles of association of the company was re-elected director of the company
• re-appointment of auditors messrs. ernst & young, chartered accountants, as the external auditors of the company.
GRI 102-18, 102-47

069Annual Report 2017/18
THE RIGHT THINKING
all times, following the best practices of the parent company JKH.
It is against this backdrop that John Keells PLC (JKPLC) is pleased to state that it is fully compliant with the mandatory provisions of the Companies Act No. 07 of 2007, Listing rules of the Colombo
Stock Exchange (“CSE”) and rules of the Securities and Exchange Commission of Sri Lanka (“SEC”) and our practices are in line with the Code of Best Practices on Corporate Governance ‘Code’ (2013) jointly advocated by the SEC and the Institute of Chartered Accountants of Sri Lanka (“CA Sri Lanka”)
The Corporate Governance philosophy practiced is in full compliance with the following and where necessary, any deviations as allowed by the relevant rules and regulations have been explained.
The below report is structured in line with Section 6.4 of the Code of Best Practice on Corporate Governance (2013) Issued Jointly by the SEC and the CA Sri Lanka as it provides a comprehensive view of relevant matters and facilitates reporting in a concise and logical manner.
Regulatory benchmarks
on Corporate Governance
Internal benchmarks on Corporate Governance
- Articles of Association of the Company
- Internal Code of corporate governance for the Board and Key Management Personnel
- Board Sub-Committees
- Compliance policy and code of conduct
- Human Resource policy and manual
- Whistleblowing Policy
- Communication Policy
- Procurement Policy
- Trading Policy
- Related Party Transaction Policy
- Integrated Risk Management Policy
- IT related Policies
- Finance Related Policies
• 6.4 Code of best practice on corporate governance issued jointly by the Securities and Exchange Commission of Sri Lanka (SEC) and Institute of Chartered Accountants of Sri Lanka (CA Sri Lanka)
- Voluntary Compliance
• Code of best practice on Corporate Governances as per section 7.10 of the listing rules of the Colombo Stock Exchange (CSE)
- Mandatory Compliance
• Content of the Annual Report as per section 7.6 of the listing rules of the CSE
-Mandatory Compliance
• Content of the Annual Report as per section 168 of the Companies Act No. 7 of 2007
- Mandatory Compliance
• Code of best practice on Related Party Transactions published by the SEC
- Mandatory Compliance
• Good Governance practices recommended in the corporate Directors’ handbook, a joint publication by the Sri Lanka Institute of Directors’ and the Chartered Institute of Management Accountants (CIMA)
- Voluntary Compliance
• Code of Best Practices on Corporate Governance (2017) issued by CA Sri Lanka, is under review for voluntary adoption.

070 JOHN KEELLS PLC
CORPORATE GOVERNANCE
A. THE BOARD – 11 PRINCIPLES1. An Efficient Board
2. Roles of Chairman
3. Chief Executive Officer
4. Financial Acumen
5. Board Balance
6. Supply of Information
7. Appointments to the Board
8. Re-election
9. Appraisal of Board Performance
10. Disclosure of Information in respect of Directors
11. Appraisal of Chief Executive Officer
A1. AN EFFICIENT BOARDAn effective Board of Directors is at the heart of the governance structure of a well-functioning and well-Governed corporation. JKPLC Board comprises of Four (4) Non-Executive, Non-Independent Directors and Three (3) Non-Executive, Independent Directors. Therefore the Board is deemed to have sufficient balance in line with the requirements of the code. Keells Consultants (Private) Limited functions as the Secretaries and Registrars of the
Company and provides the Secretarial input for Board proceedings in addition to maintaining Board minutes and Board records.
The governance structures of the Group is given below with reporting lines clearly identified. Nominations, Human Resources and Compensation and Related Party Transactions Review committees of the Group’s parent company, JKH assist the Board of JKPLC, as permitted by the listing rules of the CSE.
independence
Non Independent Non-executive Directors (Including Chairman)Independent Non-executive Directors
57% 43%
John Keells Holdings PLC (Parent Company)
John Keells PLCBoard of Directors
Human Resources & Compensation
Committee
NominationsCommittee
Board of Directors
Board Audit Committee
GroupManagement Committee –
PlantationServices Sector
Internal Audit
Chief Executive Officer
Management Committee of the Company
Employees
Related Party Transactions Review
Committee
The integrated Governance framework formulated is outlined in the diagram below and set out in the report that follows:
Code of Best Practice on Corporate Governance
The Company Shareholders
Directors(A)
Directors’ Remuneration
(B)
Relations with Shareholder
(C)
Accountability & Audit (D)
Institutional Investors
(E)
Other Investors (F)
Sustainability(G)

071Annual Report 2017/18
THE RIGHT THINKING
A.1.1 BOARD MEETINGS, ATTENDANCE & AGENDAThe Board and Audit Committee meets at the least, once every quarter. Any absences are excused in advance and duly recorded in the minutes. The absent members are immediately briefed on the
discussions and actions taken during the meeting.
Directors are provided with the necessary information well in advance (at least one week prior to the Board meeting) in order to facilitate more informed
decision making. Board information packs supplied to the Directors include the Board Resolutions and other functional areas such as tax, human resources, treasury and corporate social responsibility.
Board Agenda
A typical Board agenda in 2017/18 contained;
- Confirmation of previous minutes
- Matters arising from the previous minutes
- Status updates of major projects
- Review of performance in summary and in detail, including high level commentary on actuals and outlook
- Summation of strategic issues discussed at pre-Board meetings
- Approval of Quarterly and annual financial statements
- Board subcommittee reports and other matters exclusive to the Board
- Ratification of capital expenditure, disposal of fixed assets and donations
- Ratification of the use of the Company seal and share certificates issued
- Ratification of Circular resolutions & new resolutions
- Report on Corporate Social Responsibility
- Review of risks, sustainability development, HR practices/updates, etc...
- Any other business
A.1.2 ROLES AND RESPONSIBILITIES OF THE BOARD Notwithstanding the functioning of the Board Committees, the Board of Directors is collectively responsible for the decisions and actions taken. The John Keells Group Corporate Governance Framework expects the Board of Directors to:
> Provide direction and guidance to the Company in the formulation of its high-level strategies, with emphasis on the medium and long term, in the pursuance of its sustainable development goals
> Reviewing and approving annual plans and longer-term business plans
> Tracking actual progress against plans
> Reviewing HR processes with emphasis on top management succession planning
> Reviewing the performance of the Executive Director
> Monitoring systems of governance and compliance
> Overseeing systems of internal control, risk management and establishing whistleblowing conduits
Dates and attendance of Board of Directors to the quarterly Board meetings is as below:
Name Board meeting attendance28/04/2017 25/07/2017 27/10/2017 18/01/2018 Eligible no.
of meetingsMeetings Attended
Mr. S. C. Ratnayake NED/NID* 4 4/4
Mr. K. N. J. Balendra (appointed wef 1/1/2018)
NED/NID N/A N/A N/A 1 1/1
Mr. J. G. A. Cooray (appointed wef 1/1/2018)
NED/NID N/A N/A N/A 1 1/1
Mr. V. A. A. Perera NED/NID 4 4/4
Ms. A. K. Gunawardhana NED/ID** 4 4/4
Mr. C. N. Wijewardane NED/ID 4 4/4
Ms. B. A. I. Rajakarier NED/ID 4 4/4
Mr. A. D. Gunewardene (resigned wef 31/12/2018)
NED/NID Excused N/A 3 2/3
Mr. J. R. F. Peiris (resigned wef 31/12/2018)
NED/NID Excused N/A 3 2/3
*NED/NID – Non-Executive Non Independent Director*NED/ID – Non-Executive Independent Directors

072 JOHN KEELLS PLC
> Determining any changes to the discretions / authorities delegated from the Board to the executive levels
> Reviewing and approving major acquisitions, disposals and capital expenditure
> Approving any amendments to constitutional documents
> Adopting voluntarily, best practices where relevant and applicable.
The Company’s internal governance structure is designed in such a way that
the executive authority is well delegated through committees with clearly defined authority limits, responsibilities and accountability which are agreed upon in advance to achieve greater operating efficiency and freedom of decision making.
The Board’s effective governance is supported by the following sub-committees and senior management committees.
Board Audit Committee (BAC)
Composition All members to be exclusively Non-Executive, Independent Directors with at least one member having significant, recent and relevant financial management and accounting experience and a professional accounting qualification.The CEO, Financial Controller are permanent invitees for all Committee meetings.Members as at 31st March 2018• Ms. B. A. I. Rajakarier - Chairperson• Ms. A. K. Gunawardhana• Mr. C. N. WijewardaneDetailed information regarding the activities of the BAC are provided in the BAC report on pages 94 to 96
Mandate To provide an independent and objective review of the financial reporting process, internal controls, risk management process, and the internal and external audit function in ensuring;• Accurate and timely disclosure• Transparency, integrity and quality of financial reporting
Scope Confirm and assure;• Independence of External Auditor• Objectivity of Internal Auditor- Review with independent Auditors adequacy of internal controls and quality of financial reporting- Risk Management- Regular review meetings with management, Internal Auditor and External Auditors in seeking assurance on various
matters
Nomination Committee (of Parent Company John Keells Holdings PLC)
Composition The Committee comprises three (3) Independent Directors and one (1) Non-Independent Director. The Chairperson is a Non-Executive, Independent Director. Current members are:• Mr. M. A. Omar - Chairperson• Ms. M. P. Perera • Dr. S. S. H. Wijayasuriya • Mr. S. C. Ratnayake - Non-Independent Director
Mandate Define and establish the nomination process for Non-Executive Directors, lead the process and make recommendations to the Board on the appointment of Non-Executive Directors
CORPORATE GOVERNANCE
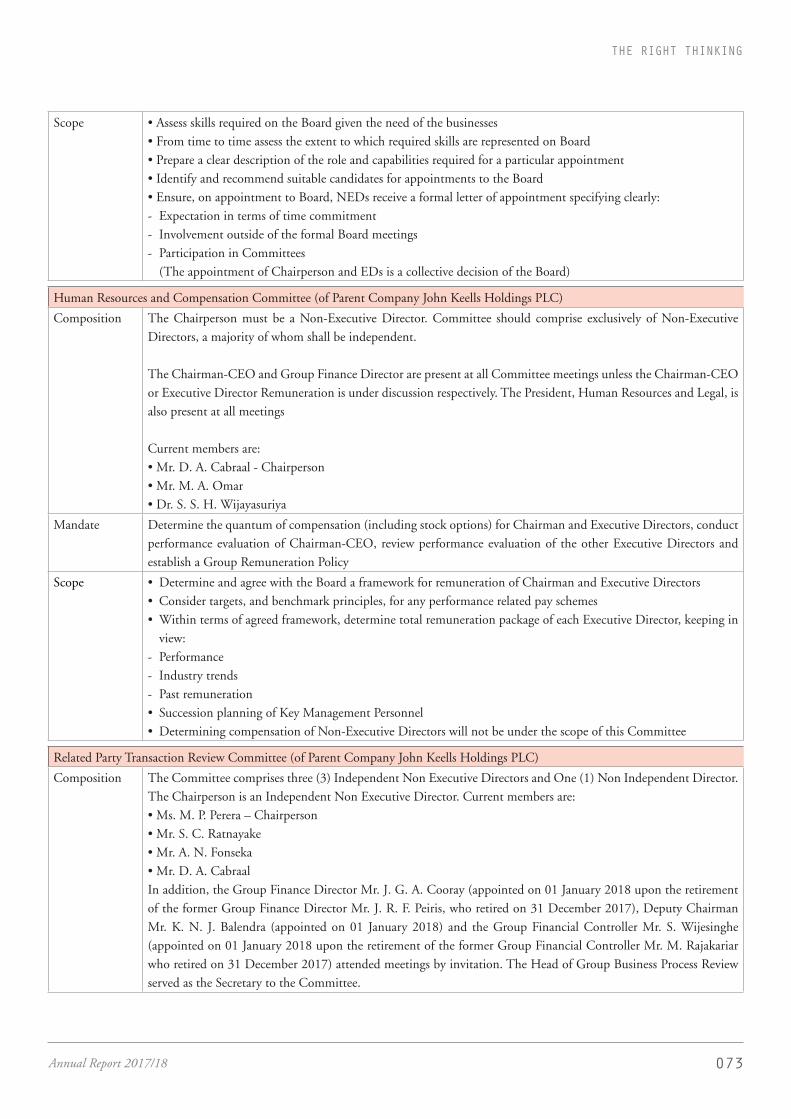
073Annual Report 2017/18
THE RIGHT THINKING
Scope • Assess skills required on the Board given the need of the businesses• From time to time assess the extent to which required skills are represented on Board• Prepare a clear description of the role and capabilities required for a particular appointment• Identify and recommend suitable candidates for appointments to the Board• Ensure, on appointment to Board, NEDs receive a formal letter of appointment specifying clearly:- Expectation in terms of time commitment- Involvement outside of the formal Board meetings- Participation in Committees (The appointment of Chairperson and EDs is a collective decision of the Board)
Human Resources and Compensation Committee (of Parent Company John Keells Holdings PLC)
Composition The Chairperson must be a Non-Executive Director. Committee should comprise exclusively of Non-Executive Directors, a majority of whom shall be independent.
The Chairman-CEO and Group Finance Director are present at all Committee meetings unless the Chairman-CEO or Executive Director Remuneration is under discussion respectively. The President, Human Resources and Legal, is also present at all meetings
Current members are:• Mr. D. A. Cabraal - Chairperson• Mr. M. A. Omar• Dr. S. S. H. Wijayasuriya
Mandate Determine the quantum of compensation (including stock options) for Chairman and Executive Directors, conduct performance evaluation of Chairman-CEO, review performance evaluation of the other Executive Directors and establish a Group Remuneration Policy
Scope • Determine and agree with the Board a framework for remuneration of Chairman and Executive Directors• Consider targets, and benchmark principles, for any performance related pay schemes• Within terms of agreed framework, determine total remuneration package of each Executive Director, keeping in
view:- Performance- Industry trends- Past remuneration• Succession planning of Key Management Personnel• Determining compensation of Non-Executive Directors will not be under the scope of this Committee
Related Party Transaction Review Committee (of Parent Company John Keells Holdings PLC)
Composition The Committee comprises three (3) Independent Non Executive Directors and One (1) Non Independent Director. The Chairperson is an Independent Non Executive Director. Current members are:• Ms. M. P. Perera – Chairperson• Mr. S. C. Ratnayake• Mr. A. N. Fonseka• Mr. D. A. CabraalIn addition, the Group Finance Director Mr. J. G. A. Cooray (appointed on 01 January 2018 upon the retirement of the former Group Finance Director Mr. J. R. F. Peiris, who retired on 31 December 2017), Deputy Chairman Mr. K. N. J. Balendra (appointed on 01 January 2018) and the Group Financial Controller Mr. S. Wijesinghe (appointed on 01 January 2018 upon the retirement of the former Group Financial Controller Mr. M. Rajakariar who retired on 31 December 2017) attended meetings by invitation. The Head of Group Business Process Review served as the Secretary to the Committee.

074 JOHN KEELLS PLC
Mandate To ensure on behalf of the Board, that all Related Party Transactions of JKH and its Listed Subsidiaries are consistent with the Code of Best Practices on Related Party Transactions issued by the SEC.
Scope • Develop and recommend for adoption by the Board of Directors of JKH and its Listed subsidiaries, a Related Party Transaction Policy which is consistent with the Operating Model and the Delegated Decision Rights of the JKH Group.
• Update the Board of Directors the Related Party Transaction of each of the listed Companies of the JKH Group on a quarterly basis.
• Define and establish the threshold values for each of the subject listed companies in the setting a benchmark for related party transactions, related party transactions which have to be pre-approved by the Board, related party transactions which require to be reviewed annually and similar issues relating to listed companies.
RELATED PARTY TRANSACTION REVIEW COMMITTEEObjective of the Committee is to exercise oversight on behalf of the Board of John Keells Holdings PLC and its listed Subsidiaries including JKPLC, in complying with the Code on Related Party Transactions as issued by the SEC and with the Listing Rules of the CSE. The Committee has also adopted best practices as recommended by the CA Sri Lanka and the CSE.
The Committee reviewed and pre-approved all proposed Non Recurrent Related Party Transactions of the parent Company and all its listed subsidiaries. Further, Recurrent Related Party
Transactions of the Company were reviewed annually by the Committee. The activities and views of the Committee have been communicated to the Board of Directors quarterly through verbal briefings and by tabling the minutes of the Committee’s meetings.
The Company carried out transactions in the ordinary course of business with parties who are defined as “Related Parties” in Sri Lanka Financial Reporting Standard 24 - Related Party Disclosure. There were no Non Recurrent Related Party Transactions of the Company during the financial year 2017 / 2018. The aggregate value of Recurrent Related Party Transactions of the Company for
the financial year 2017 / 2018 did not exceed 10 percent of the gross revenue of same year. The details of Recurrent Related Party Transactions are provided in note 36 of the financial statements on page 162.
The Board of Directors confirm that the Company is in compliance with the provision of the listing rules of the CSE pertaining to Related Party Transactions.
MEETINGSThe Committee held four meetings during the financial year under review.
Information on the attendance of these meetings by the members of the Committee is illustrated below,
25.05.2017 26.07.2017 01.11.2017 29.01.2018 Eligible to Attend
Attended
Mr. D. A. Cabraal 4 4
Mr. A. N. Fonseka 4 4
Ms. M. P. Perera 4 4
Mr. S. C. Ratnayake 4 4
By Invitation
Mr. J. R. F. Peiris* N/A 3 3
Mr. J. G. A. Cooray** 4 4
Mr. K. N. J. Balendra*** N/A N/A N/A 1 1
*Resigned from the Board on 31st December 2017**Appointed as the Group Finance Director of JKH w.e.f 1st January 2018***Appointed as the Deputy Chairman of JKH w.e.f 1st January 2018
CORPORATE GOVERNANCE

075Annual Report 2017/18
THE RIGHT THINKING
A.1.3 ACT IN ACCORDANCE WITH LAWS AND ACCESS TO INDEPENDENT PROFESSIONAL ADVICEThe Board acts in accordance with the laws of the country and all employees are required to conform accordingly as stated in the Code of Conduct of JKH. The Board and the Board Audit Committee receive statements of compliance on recurrent statutory requirements from management on a quarterly basis in this regard.
In order to preserve the independence of the Board, and to strengthen decision making, the Board seeks independent professional advice when deemed necessary. Accordingly, the Board obtains independent professional advice covering areas such as;
• Impacts on business operations of the current and emerging economic and geo-political shifts.
• Legal, tax and accounting aspects, particularly where independent external advice is deemed necessary in ensuring the integrity of the subject decision.
• Market surveys, architectural and engineering advisory services as necessary for business operations
• Actuarial valuation of retirement benefits and valuation of property including that of investment property.
• Information technology consultancy services pertaining to enterprise resource planning system, distributor management system or other major projects.
• Specific technical know-how and domain knowledge for identified project feasibilities and evaluations
Additionally, individual Directors are encouraged to seek expert opinion and / or professional advice on matters where they may not have full knowledge or expertise.
A.1.4 ROLE OF THE COMPANY SECRETARYThe Company Secretary is responsible for inducting new Directors, assist the Chairman and the Board of Directors in determining the annual Board Plan, guide the Board and the individual Directors in the proper discharge of their responsibilities and act as a central source of guidance on matters of ethics and governance. In addition to the many duties, the Company Secretary is responsible for making necessary disclosures on related party transactions required by law and regulations and also acts as a channel of communication with shareholders to ensure good shareholder relations. The shareholders can contact Keells Consultants (Private) Limited, the Company Secretaries on 011-2306245 for any Company related information requirements.
A.1.5 INDEPENDENT JUDGEMENT All Directors possess the necessary mix of skills, expertise and knowledge complemented with a high sense of integrity and independent judgment on issues of strategy, performance, resources and standard of business conduct. Non-Executive Directors are responsible for providing independent judgment for the proposals made by the Chairman and Executive Directors.
A.1.6 DEDICATION OF ADEQUATE TIME AND EFFORT BY DIRECTORSDirectors dedicated sufficient time before Board meetings to review Board papers and request additional material and information for further clarification as deemed necessary. This is supplemented by time allocation for discussions of issues of strategic importance. It is estimated that Non-Executive Directors each devoted a minimum of 30 full time equivalent days to the Group during the year.
strategy and performanceassurance and risk managementother board matters
35%
15%
50%
dedication of adequate time and effort by directors
A.1.7 TRAINING FOR DIRECTORSNewly appointed Non-Executive Directors are apprised of the John Keells Group and Company’s values and culture, Group governance framework, policies and processes, Code of Conduct expected by the Company, business model of the Company, strategy and the Directors’ responsibilities in accordance with current legislation.
The Chairman ensures that new Directors are introduced to other Board members and key management personnel and briefed on matters taken up at prior meetings.
Directors are encouraged to update their skills and knowledge on a continuous basis and this is facilitated through the following activities.
• Access to External and Internal Auditors
• Periodic reports on performance
• Updates on topics that range from proposed / new regulations to industry best practices
• Opportunities to meet Senior Management of the Managing Agents in a structured setting
GRI 102-27

076 JOHN KEELLS PLC
• Access to industry experts and other external professional advisory services
• Access to the Centre Legal, Tax and Finance Divisions of the John Keells Group of which the Company is a member
• The services of the Company Secretary
They also have the opportunity of gaining further insight into the Company’s business by undertaking business visits. The Directors devote sufficient time and make every effort to ensure that in proportion with their knowledge
and experience, they discharge their responsibilities to the Company.
A.2 AND A.3 – ROLES OF CHAIRMAN AND CHIEF EXECUTIVE OFFICER (CEO)The roles of the Chairman and Chief Executive Officer are segregated. The Chairman is a Non-Executive, Non Independent Director. The main responsibility of the Chairman is to lead and manage the Board and its Committees so that they can function effectively. He also sets the tone for the governance and ethical framework of the Group,
facilitates and encourages the expression of differing views, and by keeping in touch with local and global industry developments, ensures that the Board is alert to its obligations to the Company’s shareholders and other stakeholders. He represents the Company externally and is the focal point of contact for shareholders on all aspects of corporate governance.
The Human Resources and Compensation Committee of the parent Company, JKH appraises the performance of the Chairman on an organizational and individual basis as approved by the Board.
CORPORATE GOVERNANCE
CHAIRMAN
CEO
Implementation of policies and achieving strategic objectives of the company
Ensures that the operating model of the Group is aligned to the short term and long term strategies pursued by the Group
Optimising the use of Company’s resources within the framework of corporate and financial strategies, annual corporate plans and budget
Working closely with the Senior Management in identifying risks and initiating prompt action to mitigate such risks
Chief Executive Officer’s RoleChairman’s Role
Leads the Board for its effectiveness
Sets the tone for the governance and ethical framework
Ensures that constructive working relations are maintained between the Executive and Non-Executive members of the Board
Ensures with the assistance of the Board Secretary that;- Board procedures are followed- Information is disseminated in a timely manner to the Board
The Board has, subject to pre-defined limits, delegated its executive authority to the CEO of the Company for the implementation of strategies approved by the Board and developing and
recommending business plans and budgets in line with Company’s strategy to the Board.
A.4. FINANCIAL ACUMENCollectively the Board has sufficient financial acumen as they are selected through a sufficiently rigorous process. Additionally, the following Directors
GRI 102-26
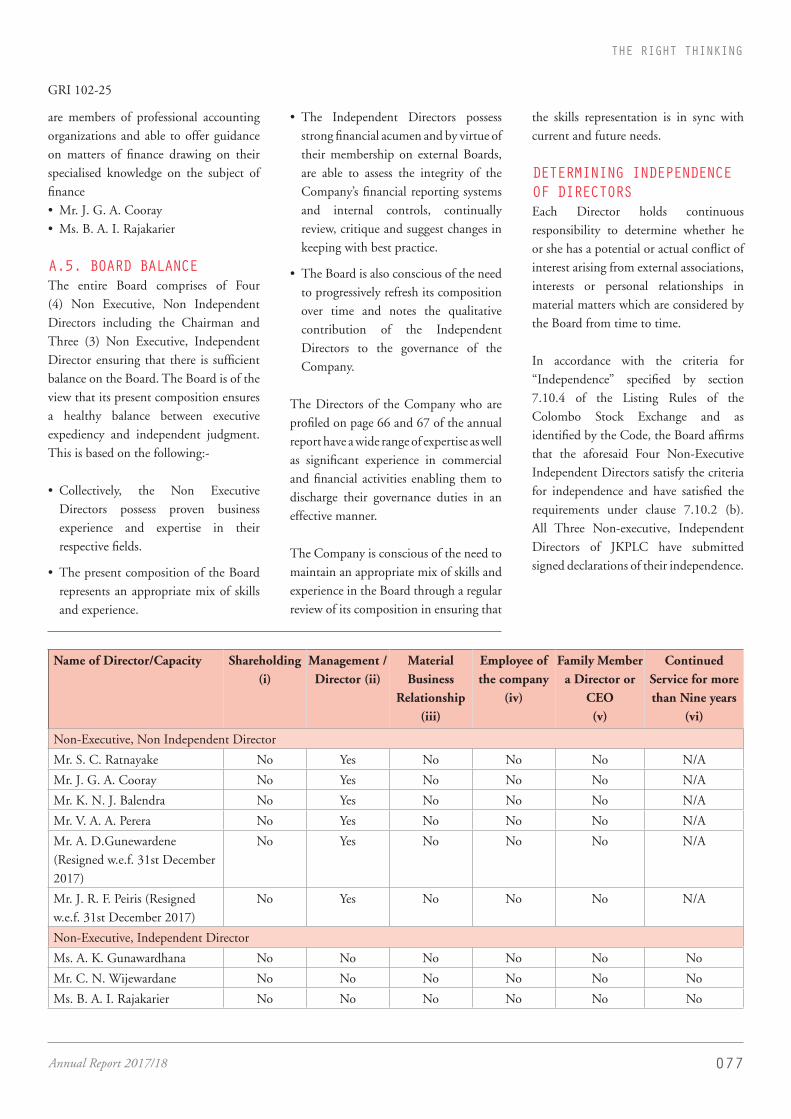
077Annual Report 2017/18
THE RIGHT THINKING
are members of professional accounting organizations and able to offer guidance on matters of finance drawing on their specialised knowledge on the subject of finance• Mr. J. G. A. Cooray• Ms. B. A. I. Rajakarier
A.5. BOARD BALANCEThe entire Board comprises of Four (4) Non Executive, Non Independent Directors including the Chairman and Three (3) Non Executive, Independent Director ensuring that there is sufficient balance on the Board. The Board is of the view that its present composition ensures a healthy balance between executive expediency and independent judgment. This is based on the following:-
• Collectively, the Non Executive Directors possess proven business experience and expertise in their respective fields.
• The present composition of the Board represents an appropriate mix of skills and experience.
• The Independent Directors possess strong financial acumen and by virtue of their membership on external Boards, are able to assess the integrity of the Company’s financial reporting systems and internal controls, continually review, critique and suggest changes in keeping with best practice.
• The Board is also conscious of the need to progressively refresh its composition over time and notes the qualitative contribution of the Independent Directors to the governance of the Company.
The Directors of the Company who are profiled on page 66 and 67 of the annual report have a wide range of expertise as well as significant experience in commercial and financial activities enabling them to discharge their governance duties in an effective manner.
The Company is conscious of the need to maintain an appropriate mix of skills and experience in the Board through a regular review of its composition in ensuring that
the skills representation is in sync with current and future needs.
DETERMINING INDEPENDENCE OF DIRECTORSEach Director holds continuous responsibility to determine whether he or she has a potential or actual conflict of interest arising from external associations, interests or personal relationships in material matters which are considered by the Board from time to time.
In accordance with the criteria for “Independence” specified by section 7.10.4 of the Listing Rules of the Colombo Stock Exchange and as identified by the Code, the Board affirms that the aforesaid Four Non-Executive Independent Directors satisfy the criteria for independence and have satisfied the requirements under clause 7.10.2 (b). All Three Non-executive, Independent Directors of JKPLC have submitted signed declarations of their independence.
Name of Director/Capacity Shareholding (i)
Management / Director (ii)
Material Business
Relationship (iii)
Employee of the company
(iv)
Family Member a Director or
CEO(v)
Continued Service for more than Nine years
(vi)
Non-Executive, Non Independent Director
Mr. S. C. Ratnayake No Yes No No No N/A
Mr. J. G. A. Cooray No Yes No No No N/A
Mr. K. N. J. Balendra No Yes No No No N/A
Mr. V. A. A. Perera No Yes No No No N/A
Mr. A. D.Gunewardene (Resigned w.e.f. 31st December 2017)
No Yes No No No N/A
Mr. J. R. F. Peiris (Resigned w.e.f. 31st December 2017)
No Yes No No No N/A
Non-Executive, Independent Director
Ms. A. K. Gunawardhana No No No No No No
Mr. C. N. Wijewardane No No No No No No
Ms. B. A. I. Rajakarier No No No No No No
GRI 102-25

078 JOHN KEELLS PLC
Definitionsi. Shareholding in the companyii. Director of a listed Company in which they are employed, or having a significant shareholding or have a material business relationshipiii. Income/Non cash benefits derived from the Company is equivalent to 20 percent of the director’s annual incomeiv. Director is employed by the Company two years immediately preceding appointmentv. Immediate family member who is a director or General Managervi. Has served the Board for a continuous period exceeding 9 years
A.6. SUPPLY OF INFORMATIONIn order to ensure robust discussion, informed deliberation and effective decision making, the Directors are provided access to;
• Information as is necessary to carry out their duties and responsibilities effectively and efficiently
• Information updates from management on topics under review by the Board, new regulations and best practices as relevant to the Groups business.
• External and internal auditors
• Experts and other external professional services
• The services of the Company secretaries whose appointment and removal is the responsibility of the Board
• Periodic performance reports
• Senior Management under a structured arrangement
A.7 & A.8 APPOINTMENTS TO THE BOARD & RE-ELECTIONDirectors are appointed to the Board based on nominees recommended by the Board following a transparent, structured and formal process within the purview of the Nominations Committee of the ultimate Parent Company JKH. Casual
vacancies are filled by the Board following the same rigorous process of selecting nominees. One third of the Directors, except the Chairman, retire by rotation on the basis prescribed in the Articles of Association of the Company. A Director retiring by rotation is eligible for re-election. The tenure of office for Non-Executive Directors (NEDs) is limited by their prescribed company retirement age. Independent Directors, on the other hand, can be appointed to office for three consecutive terms of three years, which however, is subject to the age limit set by statute at the time of reappointment following the end of a term.
Proposals for the re-appointment of Directors are set out in the Annual Report of the Board of Directors on page 97 as well as in the Notice of Meeting on page 173 of this Report.
A.9. APPRAISAL OF BOARD PERFORMANCEThe Board conducts Board performance appraisal annually. This is a formalised process of self-appraisal which enables each member to self-appraise on an anonymous basis, the performance of the Board, using a very detailed checklist / questionnaire, under the areas of
• Role clarity and effective discharge of responsibilities
• People mix and structures
• Systems and procedures
• Quality of participation
• Board image
The results are analysed to give the Board an indication of its effectiveness as well as areas that required addressing and / or strengthening. Despite the original anonymity of the remarks, the open and frank discussions that follow include some Directors identifying themselves as the person making the remark reflecting the openness of the Board.
A.10. DISCLOSURE OF INFORMATION IN RESPECT OF DIRECTORSInformation specified in the Code with regards to Directors are disclosed within this Annual Report as follows:
1. Name, qualifications, expertise, material business interests and brief profiles on pages 66 to 67.
2. Membership of sub-committees and attendance at Board Meetings and Sub-Committee meetings on page 71.
3. Related party transactions on pages 162 to 164.
CORPORATE GOVERNANCE
GRI 102-24, 103-3, 102-28

079Annual Report 2017/18
THE RIGHT THINKING
A.11. APPRAISAL OF CHIEF EXECUTIVE OFFICERThe annual appraisal of the Chief Executive Officer is carried out at a parent level and is based on a pre agreed performance criteria.
B. DIRECTORS REMUNERATION 1. Remuneration Procedures
2. The level of Makeup of Remuneration
3. Disclosure of Remuneration
REMUNERATION FOR NON-EXECUTIVE, NON INDEPENDENT DIRECTORSThe remuneration of the Non-Executive, Non Independent Directors (NED/NIDs) is determined in line with the remuneration policies of the Group. The remuneration policy is formulated to attract and retain high calibre executives and motivate them to develop and implement the business strategy in order to optimise long term shareholder value creation. The Group has adopted a remuneration policy designed to provide an appropriate balance between fixed
remuneration and variable ‘risk’ reward which includes a fixed and variable element. The variable element is based on both individual performance and an organisational performance matrix which covers revenue and Profit After Tax.
In addition, a long term incentive in the form of employee share options (ESOP) in the stated capital of the ultimate parent company JKH is granted based on actual performance. As prescribed by the Sri Lanka Accounting Standards (SLFRS / LKAS) all ESOPs of the respective employees are charged to the income statement of the relevant subsidiaries with effect from 01st July 2013 being the date of the first award after the introduction of the accounting standard.
Director’s fees applicable to NED/NIDs nominated by John Keells Holdings PLC are paid directly to the Parent company. The aggregate of NEDs Remuneration for the year was Rs. 11.07 million and Rs. 7.2 million for Group and Company respectively.
REMUNERATION FOR NON EXECUTIVE, INDEPENDENT DIRECTORSCompensation of Non-Executive, Independent Directors (NED/IDs) is determined with reference to fees paid to other NED/IDs of comparable companies and is adjusted where necessary. The fees received by NED/IDs are determined by the Board and reviewed annually. NED/IDs do not receive any performance/incentive payments and are not eligible to participate in any of the Group’s share option plans. The NED/IDs fees are not subject to time spent or defined by a maximum/minimum number of hours committed to the Group per annum, and hence are not subject to additional/lower fees for additional/lesser time devoted.
COMPENSATION FOR EARLY TERMINATIONIn the event of an early termination of a Director there are no compensation commitments other than for;
• Executive Director; as per employment contract like any other employee
• NEDs; Director Fees payable, if any, are payable in terms of his/her contract
C. SHAREHOLDER RELATIONS 1. Constructive use of Annual General
Meetings (AGM) and General Meetings
2. Communications with Shareholders
3. Major and Material Transactions
C.1 CONSTRUCTIVE USE OF AGM AND GENERAL MEETINGSThe Company makes use of the AGMs constructively to enhance constructive relationship with the shareholders and towards this end the following procedures are followed;
• Notice of the AGM and related documents, are sent to shareholders along with the Annual Report within the specified period
• Summary of procedures governing voting at General Meetings are clearly communicated
• All the Directors are available to answer queries
• The Chairman ensures that the relevant Senior Managers are available at the AGM to answer specific queries
• Separate resolutions are proposed for each item
• Proxy votes are counted
C.2 COMMUNICATIONS WITH SHAREHOLDERSThe Group has opened up several channels to ensure sound communication with the shareholders and the details are found in the relevant sections of this report.
The Board of Directors, in conjunction with the Audit Committee, is responsible in ensuring the accuracy and timeliness of published information and in presenting an honest and balanced assessment of results in the quarterly and Annual Financial Statements.
All other material and price sensitive information about the Company is promptly communicated to the CSE, where the shares of the Company are listed, and such information is also released to the employees, press and shareholders.
GRI 102-35, 102-36, 102-39

080 JOHN KEELLS PLC
C.3 MAJOR AND MATERIAL TRANSACTIONSShareholders are advised of any instance where the contemplated value of a transaction would be in excess of half of the net assets of the Company (Major transactions). There were no major transactions as defined under Section 185 of the Companies Act No. 07 of 2007, during the year under review.
D. ACCOUNTABILITY & AUDIT1. Financial Reporting
2. Internal Control
3. Audit Committee
4. Code of Business Conduct & Ethics
5. Corporate Governance Disclosures
D.1 FINANCIAL REPORTINGThe Board recognises its responsibility to present a balanced and understandable assessment of the Group’s financial position, performance and prospects in accordance with the requirements of the Companies Act No. 07 of 2007 and the CSE Continuing Listing Requirements. The Financial Statements included in this Annual Report are prepared and presented in accordance with the Sri Lanka Accounting Standards. The Annual Report also conforms to the G4 standard on Sustainability Reporting published by the Global Reporting Initiative and the Integrated Reporting Framework published by the International Integrated Reporting Council.
The following specialized information requirements are also included in this Annual Report:
• The Annual Report of the Board of Directors on the Affairs of the Company given on pages 97 to cover all areas of this section.
• The “Statement of Directors’ Responsibility” is given on page 103.
• The Directors’ Statement on Internal Controls is given on page 103.
• The “Independent Auditors’ Report” on page 107 for the Auditors’ responsibility.
• The Management Discussion and Analysis on page 25.
• Related Party Transitions on page 162
D.2 INTERNAL CONTROLThe Board has through the involvement of the Group Business Process Review (Group BPR) division of JKH, taken steps to obtain assurance that systems designed to safeguard the Company’s assets, maintain proper accounting records and provide management information, are in place and are functioning according to expectations. The risk review programme covering the Internal Audit of the Company is outsourced.
Reports arising out of such audits, in the first instance considered and discussed at the company level and after reviewed by the President.
An Executive Summary including appropriate management action prepared by the Group of BPR is forwarded to the relevant Audit Committee, through the Group Finance Director, on a quarterly basis. Further, the Audit Committees also assess the effectiveness of the risk review process and systems of internal control periodically.
The Internal Audit function of the Company is not outsourced to the External Auditor in a further attempt to ensure External auditor independence. The Auditors’ Report on the financial statements of the Company for the year under review is found in the Financial Information Section of the Annual Report.
The role of the Internal Auditor has transformed into a value adding function instead of a mere ‘policing’ function, where audit findings form an integral input in modifying and improving internal processes. Thereby, (Group BPR) division of JKH is a key contributor in achieving operational excellence and value addition of the Company.
INTERNAL COMPLIANCEA quarterly self-certification programme requires the Sector Head of the Plantation Services Sector of JKH and the Sector Financial Controller of the Company
to confirm compliance with financial standards and regulations. The Sector Head of the Plantation Services Sector of JKH and the CEO of the Company are required to confirm operational compliance with statutory and other regulations and key control procedures, and also identify any significant deviations from the expected norms.
RISK REVIEWThe Group has adopted a wide Risk Management programme which focus on wider sustainability development, to identify, evaluate and manage significant risks and to stress-test various risk scenarios. The programme ensures that a multitude of risks, arising as a result of the Group’s operations, are effectively
CORPORATE GOVERNANCE

081Annual Report 2017/18
THE RIGHT THINKING
managed in creating and preserving shareholder and other stakeholder wealth.
The steps taken towards promoting the Integrated Risk Management process are:
• Integrating and aligning activities and processes related to planning, policies / procedures, culture, competency, financial management, monitoring and reporting with risk management.
• Supporting executives / managers in moving the organisation forward in a cohesive integrated and aligned manner to improve performance, while operating effectively, efficiently, ethically and legally within the established limits for risk taking.
The risk management process would be elaborated under the Corporate Risk Management section of the Annual report.
D.3 AUDIT COMMITTEEThe Audit Committee comprises solely of Non-Executive, Independent Directors and conforms to the requirements of the Listing Rules of the Colombo Stock Exchange. It is governed by a Charter, which inter alia, covers the reviewing of policies and procedures of internal control, business risk management, compliance with laws and Group policies and independent audit function.
The Committee is also responsible for the consideration and recommendation of the appointment of External Auditors, the maintenance of a professional relationship with them, reviewing the accounting principles, policies and practices adopted in the preparation of public financial information and examining all documents representing the final Financial Statements.
A quarterly self-certification program that requires the President of the Plantation Services Sector, CEO of JKPLC and JKSB, Head of Finance of JKSB and the Sector Financial Controller (SFC) confirms compliance, on a quarterly basis, with statutory requirements and key control procedures and to identify any deviations from the set requirements. In addition the President of the Plantation Services Sector, CEO of JKPLC and JKSB and the Operational Heads of the different business units are also required to confirm operational compliance with statutory and other regulations and key control procedures, coupled with the identification of any deviations from the expected norms. These have significantly aided the committee in its efforts in ensuring correct financial reporting and effective internal control and risk management.
The Audit committee members resigned during the course of the year and new Non-Executive, Independent directors were appointed.
The Audit Committee had four (4) meetings during the year and attendance of the Audit Committee members are indicated in the Audit Committee Report on page 94.
The Non-Executive, Non Independent Director, CEO of JKPLC and JKSB, the Sector Financial Controller, the Head of Finance and other operational heads are invited to the meetings of the Audit Committee. The detailed Audit committee report including areas reviewed during the financial year 2017/18 is given on pages 94 to 96 of the Annual Report.
D.4 CODE OF BUSINESS CONDUCT & ETHICSThe Company follows the JKH Code of Conduct and is summated as follows;
JKH CODE OF CONDUCT• Allegiance to the Company and the
Group
• Compliance with rules and regulations applying in the territories that the Group operate in
• Conduct of business in an ethical manner at all times and in keeping with acceptable business practices
• Exercise of professionalism and integrity in all business and “public” personal transactions.
The objectives of the Code of Conduct are further affirmed by a strong set of corporate values which are well institutionalised at all levels within the company through structured communication. The degree of employee conformance with corporate values and their degree of adherence to the JKH Code of Conduct are key elements of reward and recognition schemes.
OMBUDSPERSON:In order to deal with a situation in which an employee or group of employees feel that an alleged violation has not been addressed satisfactorily using the available/existing procedures and processes, an Ombudsperson has been appointed by JKH being the ultimate Parent Company to entertain such concerns. The Ombudsperson’s duty ceases upon the confidential written communication of the findings of the Ombudsperson and recommendations to the Chairman or the Senior Independent Director of JKH, as the case may be.
The Chairman or the Senior Independent Director, as the case may be, will place before the Board.
GRI 102-16, 102-17

082 JOHN KEELLS PLC
• The decision and the recommendations of the Ombudsperson
• The action taken based on the recommendations
• The areas of disagreement and the reasons adduced in instances where the Chairman or the Senior Independent Director disagrees with any or all of the findings and/ or recommendations. In such cases, the Board shall consider the areas of disagreement and determine the way forward.
The Chairman or the Senior Independent Director is expected to take such steps as are necessary to ensure that the complainant is not victimized for having invoked this process.
These open door policies facilitate constant dialogue, communication, transparency and ultimately employee confidence, which would help retain existing talent whilst attracting new.
Compliance with laws and regulations
Avoidance of conflict of interests
Proactive promotion of ethical behavior
Fair dealings
Maintenance of Confidentiality
Code of Business Conduct &
Ethics
Whistleblower policy:
The employees can report to the Chairman through a communication link named “Chairman Direct”, on any concerns about unethical behaviour and any violation of John Keells Group values. Employees reporting such incidents are guaranteed complete confidentiality and such complaints are investigated and addressed via a select committee under the direction of the Chairman.
Securities trading policy:
The Groups securities trading policy prohibits all employees and agents engaged by the Company who are in possession of
unpublished price sensitive information from trading in the Company shares or other companies in which the Company has a business interest. The Group adopts a Zero tolerance policy against any employee who is found to be in violation of this policy.
Employee Participation:
Human Resource unit is designed in a manner that enables high accessibility by any employee to every level of management. Structured ‘skip level’ meetings are held where employees are given the opportunity to discuss matters of concern with superiors who are at a
level higher than their own immediate supervisor in an open but confidential environment. Through the participation of 360 Degree surveys and Voice of Employee (VOE) surveys which are conducted annually, employees are able to voice their opinion about the Company and their respective superiors. The employees also have the opportunity to take part in the Great Place To Work (GPTW) survey conducted by JKH once in every four years giving them the opportunity to voice their opinion on the overall work environment.
D.5 CORPORATE GOVERNANCE DISCLOSURESThe Board through the JKH Legal division, strives to ensure that the Company complies with the laws and regulations of the country.
The Board of Directors have also taken all reasonable steps in ensuring that all financial statements are prepared in accordance with the Sri Lanka Accounting Standards (SLFRS / LKAS) issued by the CA Sri Lanka and the requirements of the CSE and other applicable authorities.
The Board is aware of the growing importance of the disclosure of critical accounting policies as a part of good governance and opines that there are no instances where the use of such concepts would have a material impact on the Company’s financial performance.
The Company is fully compliant with all the mandatory rules and regulations stipulated by the Corporate Governance (2013) Listing Rules published by the CSE and also by the Companies Act No. 07 of 2007. The Company has also given
CORPORATE GOVERNANCE
GRI 103-02, 103-03

083Annual Report 2017/18
THE RIGHT THINKING
due consideration to the Code of Best Practice on Corporate Governance jointly issued by the CA Sri Lanka and the SEC and have in all instances, barring a few, embraced such practices, voluntarily, particularly if such practices have been identified as relevant and value adding. Few instances where the company has not adopted such best practice, the rationale
for such non adoption is articulated.
E & F. INSTITUTIONAL SHAREHOLDERS & OTHER INVESTORS Institutional Shareholders are depicted below
1. Shareholder Voting
2. Evaluation of Governance Disclosures
Other Investors are depicted below
1. Investing, Divesting Decisions
2. Shareholder Voting.
Shareholders are provided sufficient financial information and other relevant information on the website of the company to enable them to take decisions regarding their investments. Annual Reports and Interim Financial statements are circulated to all registered shareholders within prescribed timelines. All shareholders are encouraged to participate at the Annual General Meeting and vote on matters set before the shareholders which are detailed on page 173.
G. SUSTAINABILITY REPORTINGThe Group follows a stakeholder model of governance as enumerated in Stakeholder Engagement and is engaged in a number of projects which have a positive social
and environment impact outside its immediate business sphere.
IT GOVERNANCEThe IT Governance framework used by our parent Company JKH leverages best practices and industry leading models such as CObIT (Control Objectives for Information and Relate Technology), ISO 35800, ISO27001, ISO 9000:2008, COSO (Committee of Sponsoring Organisations of the Treadway Commission)/BCP (Business Continuity Planning), ITIL (Information Technology Infrastructure Library) in providing a best of breed framework.
The IT Governance frame work is built upon the following set of primal objectives:
• Leverage IT as a Strategic Asset.
• Ensuring agility, in a fast moving environment.
• Create better Alignment between business and IT.
• Create greater business value with our investments in IT.
• Create a strong IT governance and regulatory framework through a coherent set of policies, processes and adoption of best practices in line with world-class organizations.
Governance Drivers Governance Enables
Governance Scope
Business/IT Alignment
Management & Accountability
Value Management
Risk Management
Structure role and responsibilities
• Frameworks
• Principles
• Best Practices
• Standards
• Structures
• Policies
• Processes
• Procedures, Etc
• PEST
• Group Strategy
• Industry
strategies
• Business/IT
strategies
IT Governance Structure
CYBER SECURITY Along with the organisation becoming more data driven, there is a significant increase in the organisation’s reliance on technology and Cyber security continues to be a regular item on the agenda of Risk Management and Audit Committees and is periodically discussed at the Board level. In such a backdrop, securing and protecting the Company’s most valuable assets becomes a priority. The Board accepts that the risk of a security breach needs to be continually managed, and that one needs to be well aware of where
the vulnerabilities lie. During the year under review, the Company with the help of our parent Company’s IT division took necessary steps to help curtail the exposure to cyber-attacks by reducing the threat surface and any potentially exploitable vulnerabilities.
ENVIRONMENT, SOCIETY AND GOVERNANCETo ensure a sustainable business model, the Company has identified that it is a prerequisite to have an effective risk management model and a duly up-to-
GRI 102-29

084 JOHN KEELLS PLC
date business continuity plan. The Risk Report on page 88 describes how risks and opportunities pertaining to ESG are recognised, managed, measured and reported.
The Company adopts an integrated approach which mitigates the environmental threats and improves best practices in Company’s engagements
to fulfill the obligation towards the environment. Such best practices on emission management, water management, waste management and material Management are explained on Page 54.
The Company recognises that emphasis should not only be on maximising long term shareholder value, but it should
also look after the rights and appropriate claims of many non-shareholder groups such as employees, consumers, clients, suppliers, lenders, environmentalists, host communities and governments. A detailed description of the Company’s CSR activities can be found on the Management Discussion and Analysis section report of this Annual Report, laid down on pages 22 to 24.
STATEMENT OF COMPLIANCE UNDER SECTION 7.10 OF THE RULES OF THE COLOMBO STOCK EXCHANGE (CSE) ON CORPORATE GOVERNANCE (MANDATORY PROVISIONS – FULLY COMPLIED)
Compliant Non-Compliant
Rule No.
Subject Applicable requirement Compliance Status
Applicable Section in the Annual Report
7.10 Compliance
a./b./c. Compliance with Corporate Governance Rules
• The Company is compliance with the Corporate Governance Rules and any deviations are explained where applicable
Corporate Governance
7.10.1 Non-Executive Directors
a./b./c. Non-Executive Directors (NED)
• 2 or at least 1/3 of the total number (whichever is higher) of Directors should be NEDs
Corporate Governance
7.10.2 Independent Directors
a. Independent Directors (ID)
• 2 or1/3 of NEDs, whichever is higher, should be independent
Corporate Governance
b. Independent Directors • Each NED should submit a signed and dated declaration of independence or non-independence
Available with the Secretaries for review
7.10.3 Disclosures relating to Directors
a./b. Disclosure relating to Directors
• The Board shall annually determine the independence or otherwise of the NEDs
Corporate Governance
c. Disclosure relating to Directors
• A brief resume of each Director should be included in the Annual Report (AR) including the Director’s areas of expertise
Board of Directors (profile) section
d. Disclosure relating to Directors
• Provide a brief resume of new Directors appointed to the Board along with details
Corporate Governance
7.10.4 Criteria for defining independence
(a-h) Determination of Independence
• Requirements for meeting criteria to be an Independent Director
Corporate Governance
CORPORATE GOVERNANCE

085Annual Report 2017/18
THE RIGHT THINKING
Rule No.
Subject Applicable requirement Compliance Status
Applicable Section in the Annual Report
7.10.5 Remuneration Committee
7.10.5 Remuneration Committee (RC)
• The RC of the listed parent company may function as the RC
Corporate Governance
a. Composition of RC • Shall comprise of NEDs, a majority of whom will be independent
• One NED shall be appointed as Chairman of the Committee by the Board of Directors
Corporate Governance
b. Functions of RC • The RC shall recommend the remuneration of the Executive Directors and Chief Executive Officer (CEO)
Corporate Governance
c. Disclosure in the Annual Report relating to RC
• Names of Directors comprising the RC• Statement of Remuneration Policy• Aggregated remuneration paid to ED and NED
Corporate Governance, Corporate Governance of Holding Company and Notes to the Financials.
7.10.6 Audit Committee
a. Composition of Audit Committee (AC)
• Shall comprise of NEDs a majority of whom will be Independent
• A NED shall be appointed as the Chairman of the Committee
• CEO and Financial Controller should attend AC meetings
• The Chairman of AC or one member should be a member of a professional accounting body
Corporate Governance and the Board Committee Reports
b. AC Functions • Overseeing of the preparation, presentation and adequacy of disclosures in the financial statements in accordance with Sri Lanka Accounting Standards (SLFRS/LKAS)
• Overseeing of the compliance with financial reporting requirements, information requirements as per the laws and regulations
• Overseeing the process to ensure the internal controls and risk management are adequate to meet the requirements of the SLFRS/LKAS
• Assessment of the independence and performance of the external auditors
• Make recommendations to the Board pertaining to appointment, re-appointment and removal of external auditors, and approve the remuneration and terms of engagement of the external auditor
Corporate Governance and the Board Committee Reports
C Disclosure in Annual Report relating to AC
• Names of Directors comprising the AC• The AC shall make a determination of the
independence of the Auditors and disclose the basis for such determination
• The AR shall contain a Report of the AC setting out the manner of compliance with their functions
Corporate Governance and the Board Committee Reports
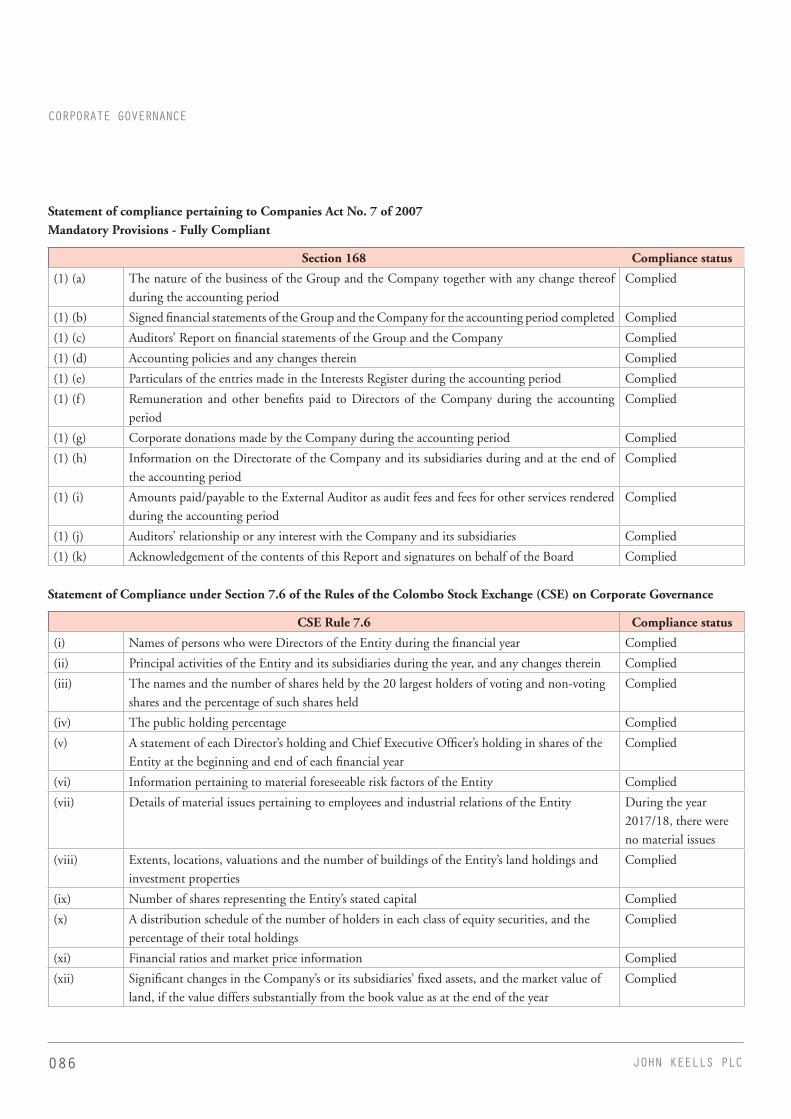
086 JOHN KEELLS PLC
Statement of compliance pertaining to Companies Act No. 7 of 2007 Mandatory Provisions - Fully Compliant
Section 168 Compliance status
(1) (a) The nature of the business of the Group and the Company together with any change thereof during the accounting period
Complied
(1) (b) Signed financial statements of the Group and the Company for the accounting period completed Complied
(1) (c) Auditors’ Report on financial statements of the Group and the Company Complied
(1) (d) Accounting policies and any changes therein Complied
(1) (e) Particulars of the entries made in the Interests Register during the accounting period Complied
(1) (f ) Remuneration and other benefits paid to Directors of the Company during the accounting period
Complied
(1) (g) Corporate donations made by the Company during the accounting period Complied
(1) (h) Information on the Directorate of the Company and its subsidiaries during and at the end of the accounting period
Complied
(1) (i) Amounts paid/payable to the External Auditor as audit fees and fees for other services rendered during the accounting period
Complied
(1) (j) Auditors’ relationship or any interest with the Company and its subsidiaries Complied
(1) (k) Acknowledgement of the contents of this Report and signatures on behalf of the Board Complied
Statement of Compliance under Section 7.6 of the Rules of the Colombo Stock Exchange (CSE) on Corporate Governance
CSE Rule 7.6 Compliance status
(i) Names of persons who were Directors of the Entity during the financial year Complied
(ii) Principal activities of the Entity and its subsidiaries during the year, and any changes therein Complied
(iii) The names and the number of shares held by the 20 largest holders of voting and non-voting shares and the percentage of such shares held
Complied
(iv) The public holding percentage Complied
(v) A statement of each Director’s holding and Chief Executive Officer’s holding in shares of the Entity at the beginning and end of each financial year
Complied
(vi) Information pertaining to material foreseeable risk factors of the Entity Complied
(vii) Details of material issues pertaining to employees and industrial relations of the Entity During the year 2017/18, there were no material issues
(viii) Extents, locations, valuations and the number of buildings of the Entity’s land holdings and investment properties
Complied
(ix) Number of shares representing the Entity’s stated capital Complied
(x) A distribution schedule of the number of holders in each class of equity securities, and the percentage of their total holdings
Complied
(xi) Financial ratios and market price information Complied
(xii) Significant changes in the Company’s or its subsidiaries’ fixed assets, and the market value of land, if the value differs substantially from the book value as at the end of the year
Complied
CORPORATE GOVERNANCE

087Annual Report 2017/18
THE RIGHT THINKING
CSE Rule 7.6 Compliance status
(xiii) Details of funds raised through a public issue, rights issue and a private placement during the year
N/A
(xiv) Information in respect of Employee Share Ownership or Stock Option Schemes Complied
(xv) Disclosures pertaining to corporate governance practices in terms of Rules 7.10.3, 7.10.5 c. and 7.10.6 c. of Section 7 of the Listing Rules
Complied
(xvi) Related party transactions exceeding 10 per cent of the equity or 5 per cent of the total assets of the Entity as per audited financial statements, whichever is lower
Complied

088 JOHN KEELLS PLC
OVERVIEWThe underlying principle of Enterprise Risk Management practiced at JKPLC (Group), its business operating segments, produce broking, share broking & warehousing operations is to provide value for its stakeholders through the Risk Management framework and guidelines whilst supporting the value creation process. JKPLC, being a part of its Parent Company John Keells Holdings (JKH) believes that Enterprise Risk Management (ERM) is intrinsically interwoven with Sustainability and Corporate Social Responsibility (CSR). Risk Management at JKPLC therefore considers more than the specific operational and financial risks
faced by the organisation by including potential risks related to the environment, community and employees. The Group is exposed to various forms of industrial, operational, environmental and financial risks arising from the environment within which it operates in and its own operations and transactions. The objective of the Risk Management Strategy of the Group is to identify, manage and mitigate risk, adapt to changing environment and harness opportunities which will ensure that the Group adopts long-term and short-term strategies which are aligned with the overall triple bottom-line objectives of the business and the Parent Company JKH.
The annual Risk Management cycle at JKPLC begins with a detailed discussion and identification of risks, impacts and preventive, detective and corrective mitigation plans in conjunction with the Parent Company of the Group JKH ERM Division, which constitute the ‘bottom-up’ approach. During the year, the Parent Company ERM division launched an online risk management platform which enables the Parent Company and it’s Group Companies to monitor, manage and mitigate risks in real time, thus allowing the business to have visibility of the Company’s risk profiles and action plans for better control and management.
ENTERPRISERISK MANAGEMENT
John Keells Risk Universe Headline Risk
Monitoring and Control
Risk Reporting
Risk Mitigation Strategy
Risk Assessment & Rating
External Environment
Business Strategies
& Policies
Business Process
Organisation and People
Analysing and reporting
Technology & Data
Sustainability & CSR
Individual Business Units
RISK MANAGEMENT TEAM
Produce Broking Stock Broking Warehousing Bus
ines
s U
nit L
evel
Group Level JKPLC
Risk Management
Team
Risk and Control
review team
Sustainability integration
Board of JK PLCAudit Committee JK PLC
Risk Identification
The Risk Management process and information flow adopted by the Group is depicted below.
GRI 102-15, 102-13

089Annual Report 2017/18
THE RIGHT THINKING
RISK MANAGEMENT TEAMThe management committee of each of the business segments of JKPLC headed by the Chief Executive Officer of the said business unit encompasses the Risk Management team of the business unit. Each of the Risk Management teams would also include a Risk Champion who will be the focal communication point for reporting. The Risk Management teams and the Champions are guided by the framework of Sustainability and Enterprise Risk Management Division of JKH.
RISK MANAGEMENT PROCESS1. Risk Identification
• A Risk Event - Any event with a degree of uncertainty which, if it occurs, may result in the Business Unit failing to meet its stated objectives.
• Core Sustainability Risks - Core Sustainability Risks are defined as those risks having a catastrophic impact to, and from the organisation, but may have a very low or nil probability of occurrence.
The risk management team at business unit level would proactively identify
any potential risk arising from any structural, operational, financial and strategic factors. The team will seek for varied sources of knowledge such as past experience, intelligence gathering, safety audits, internal audits and customer feedback when identifying potential risk.
RISK UNIVERSEThe identified risks are broadly classified into the Risk Universe as identified by the ultimate Parent Company JKH. The Risk Universe applicable to the group is depicted below.
Risk Universe
External Environment
Business Strategies and Policies
Business Process Organization and People
Analyzing and Reporting
Technology and Data
Sustainability & CSR
Political Reputation & Brand Image
Internal Business Process
Leadership/Talent Pipeline
Performance Measurement & reporting
Technology Infrastructure/ Architecture
Sustainability Strategy
Competitor Governance Operations – Planning, Production, Process
Training & Development
Budgeting/ Financial Planning
Technology Reliability & Recovery
Biodiversity & Climate Change
Catastrophic Loss
Capital & Finance Operations – Technology, Design, Execution, Continuity
Human Resource Policies & Procedures
Accounting/ Tax Data relevance, Processing & Integrity
Natural/Sustainable Resource Utilisation
Stakeholder Expectations
Strategy & Planning Interdependency Ethics Internal/ External Reporting & Disclosures
Cyber Security Community Investment & Philanthropy
Macro Economic
Business/Product Portfolio
Customer Satisfaction Fraud & Abuse IT processes Financing & Tax
Foreign Exchange & Interest Rates
Organisation Structure Legal, Regulatory Compliance & Privacy
Attrition Cloud computing
Oversight/Monitoring/Compliance
Weather & Climate
innovation & R&D Property & Equipment Damage & Breakdown
Knowledge & Intellectual Capital
Goal Congruence/ Dependence
Investment,Mergers, Acquisitions & Divestments
Vendor/Partner Reliance
Employee Relations & Welfare/H & S
Treasury, Hedging & Insurance
Performance Management & Compensation
GRI 205-01, 205-02
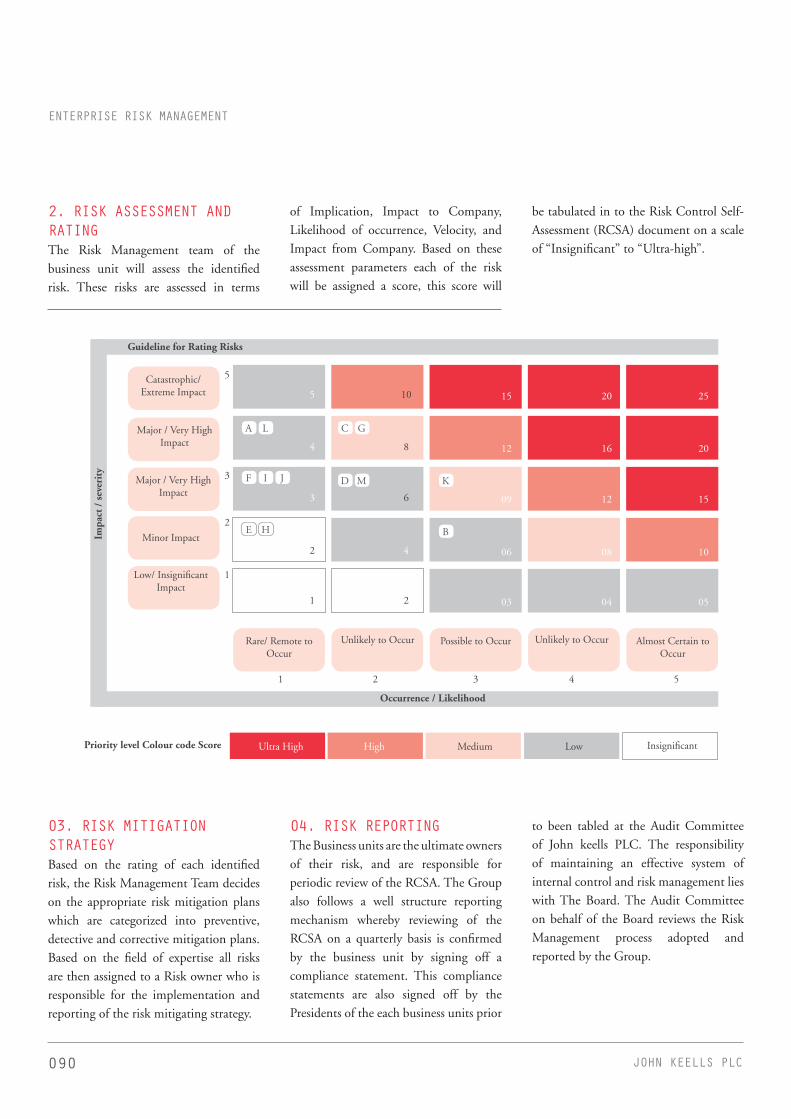
090 JOHN KEELLS PLC
2. RISK ASSESSMENT AND RATINGThe Risk Management team of the business unit will assess the identified risk. These risks are assessed in terms
of Implication, Impact to Company, Likelihood of occurrence, Velocity, and Impact from Company. Based on these assessment parameters each of the risk will be assigned a score, this score will
be tabulated in to the Risk Control Self-Assessment (RCSA) document on a scale of “Insignificant” to “Ultra-high”.
ENTERPRISE RISK MANAGEMENT
Catastrophic/ Extreme Impact
Major / Very High Impact
Minor Impact
Low/ Insignificant Impact
Rare/ Remote to Occur
Unlikely to Occur Possible to Occur Unlikely to Occur Almost Certain to Occur
Major / Very High Impact
5
4
3
3
2
2
1
1
10
8
6
4
2
1 3 4 52
15
12
09
06
03
20
16
12
08
04
25
20
15
10
05
5
Priority level Colour code Score Ultra High High Medium Low Insignificant
A C
DF
E H
L G
M K
B
I J
Occurrence / Likelihood
Guideline for Rating Risks
Impa
ct /
sev
erit
y
03. RISK MITIGATION STRATEGYBased on the rating of each identified risk, the Risk Management Team decides on the appropriate risk mitigation plans which are categorized into preventive, detective and corrective mitigation plans. Based on the field of expertise all risks are then assigned to a Risk owner who is responsible for the implementation and reporting of the risk mitigating strategy.
04. RISK REPORTINGThe Business units are the ultimate owners of their risk, and are responsible for periodic review of the RCSA. The Group also follows a well structure reporting mechanism whereby reviewing of the RCSA on a quarterly basis is confirmed by the business unit by signing off a compliance statement. This compliance statements are also signed off by the Presidents of the each business units prior
to been tabled at the Audit Committee of John keells PLC. The responsibility of maintaining an effective system of internal control and risk management lies with The Board. The Audit Committee on behalf of the Board reviews the Risk Management process adopted and reported by the Group.

091Annual Report 2017/18
THE RIGHT THINKING
05. MONITORING OF CONTROLSIt is the responsibility of the CEO and the Risk Management Team to ensure that each risk item is tracked over the course of the year and to ensure the mitigation actions identified during the risk review process are being carried out adequately.
The implemented operational and management controls and mitigation plans are regularly verified through independent internal audits as well as safety audits.
06. OPPORTUNITIESContinuous scanning and Monitoring helps the Company to identify Opportunities and trends in its operating environment. Opportunities specific to the Company are further discussed in the Management Discussion and Analysis section of this Report.
The key risks that may hinder the achievement of our strategic business objectives along with control measures and action plans implemented to mitigate them are given below
Ultra High High Medium Low Insignificant
Priority Level Colour code Score
Risk Item Potential Impact Risk control measure & action plans to mitigate risk
Change in Risk Profile
2017/18 2016/17 2015/16
A) Regional Plantation companies investing in broking companies
- Increased operational cost
- The company closely monitors competitor activities and ensure the Tea & Rubber Brokers operate within the controlled environment.
- Potential loss of revenue
- Providing manufacturing advice, enterprise management & marketing advice to producer clients in order that estates are aligned to market requirements
- Loss of reputation
B) Brokers not adhering to by laws
Segment – Produce Broking
- Loss of business - Canvassing to strengthen the CBA audit by extending it to cataloging of teas and
warehousing of tea.
C) Entry of Non CBA Members Segment – Produce Broking
- Loss of business due to non CBA members not adhering to by laws
- Lobbying with important authorities and converting the importance for new entrants to be members of the Colombo Brokers Association.
D) Natural Disasters - Loss of productivity - Having a proper BCP in place - Damaged goods - Covering all possible risks through an
insurance policy
- Harm to HR - Carrying out quarterly reviews of BCP
- Damaged machinery & equipment
E) Increase in interest rates Segment – Produce Broking
- Increase cost of debt - Having constant communications with Group Treasury & CBA on minimum lending rates
- Revision of interest rates charged to clients
- Constant review of the Average Weighted Prime Lending Rate (AWPLR)

092 JOHN KEELLS PLC
Risk Item Potential Impact Risk control measure & action plans to mitigate risk
Change in Risk Profile
2017/18 2016/17 2015/16
F) Over Exposure on lending Segment – Produce Broking
- Reduced cash flow and profitability
- The company deals mostly with recognized, credit worthy clients who are private Tea factory owners & plantation companies. Credit risks are minimized as we advance funds based on inventories available in our warehouse valued based on historical as well as potential market trends
- Over advances are made available only for those clients who have a good track record and are monitored closely but as a norm we minimize over advancing and adhere to the policy manual and processes in place
- Advances are released following an automated approval grid procedure
- Legal action would be taken on clients who fail to adhere to the commitment they made
G) Fire at warehouse Segment – Warehousing
- Loss of customers, Stock and property
- Making sure BCP is in place and reviewed on a quarterly basis
- Decline of brand reputation
- John Keells Warehousing has installed fire smoke detectors and carries out annual compliance audits. Further the company has obtained OHSAS & HACCP certification to ensure up to date adherence to safety requirements
- Covering all possible risks through an insurance policy
H) Human Resources risk Segment – Produce broking, Warehousing, Stock Broking
- Adverse impact on efficiency of operation and loss of competitive advantage
- The company attempts to mitigate this risk by encouraging continue education, providing relevant training and development opportunities, & fostering a culture where all employees, regardless of rank, can actively contribute to the business. During the year a formal succession plan for senior level was also developed
ENTERPRISE RISK MANAGEMENT

093Annual Report 2017/18
THE RIGHT THINKING
Risk Item Potential Impact Risk control measure & action plans to mitigate risk
Change in Risk Profile
2017/18 2016/17 2015/16
I) Information Technology (IT)Risk Segment – Produce broking, Stock Broking
- Not meeting service quality levels
- Potential loss of inventory & reputational loss
- The company has invested in a security infrastructure appropriate for our size and scale of operations & security procedures are constantly updated to take account of the latest knowledge and technical enhancements. Security regulations cover technical aspects as well as organizational measures including staff training, end user computer policies etc. The company has a fully-fledged disaster recovery location in place and recovery plan is tested periodically and found to be satisfactory.
J) Unauthorized access to critical assets
- Compromising of delivery orders being issued prior to buyers making payments.
- Following of Group IT policies- Introduction of a new system- Carrying internal audits on a timely basis
to see whether actions are initiated in compliance with the regulations
N/A* N/A*
K) Macro-economic environment of exporting countries. Currency fluctuation and drop in oil prices
- Increased operational cost & potential loss of revenue
- Constant monitoring of the environment, maintaining extra space in the warehouses in the short run
L)Trade rejection by Custodian Client of JKSB
- Broking Firm has to fund the purchase on T 3; Inability to fund large purchase rejection could result
in settlement failure by JKSB
- Close follow up with client or foreign broker on affirmation
M) Miscommunication of buy or sell orders
- Financial Loss- Loss of reputation- Legal liability
- Staff training, awareness and vigilance
* Not Applicable(N/A) due to the fact new Risk identified during the financial year 2017/18
The Board confirms that a process for identifying, evaluating and managing significant risks that compromise the achievement of the strategic objectives of JKPLC has been in place throughout the year in accordance with the guidelines set out by CA Sri Lanka and industry best practice. Potential Financial Risk in compliance with the Sri Lanka Accounting Standards (SLFRS) is disclosed on page 126 under notes to the Financial Statement.

094 JOHN KEELLS PLC
INTRODUCTION
This report focuses on the activities of the Audit Committee for the year under review. The Committee assists the Board in the areas of financial reporting, internal audit, internal controls and external audit. The Audit Committee Charter clearly defines the Terms of Reference of the Committee and the Board Audit Committee conducts committee proceedings in accordance with this and operates pursuant to the Audit Committee Charter.
ROLE OF THE BOARD AUDIT COMMITTEE
The BAC assists the Board in fulfilling their responsibilities with regard to;
> Ensuring the integrity of the financial statements of the Company and soundness of financial reporting systems in place to give accurate, appropriate and timely information to management, regulatory authorities and shareholders
> Ensure that high standards of Corporate Governance standards are in place by adopting and adhering to policies and procedures by the Company.
> Ensure compliance with laws, regulations and policies of the group and Company and applicable Accounting Standards.
> Assessing and reviewing the independence of the performance of External Auditors and outsourced Internal Auditors and follow up on their findings and recommendations.
> Ensuring the efficiency, effectiveness and adequacy of the Company’s internal controls and risk management measures and processes to accept, avoid, transfer or mitigate current and unforeseen risks.
- Assess the Company’s ability to continue as a going concern in the foreseeable future.
COMPOSITION OF THE BOARD AUDIT COMMITTEE AND MEETINGS
The Board Audit Committee (BAC) of John Keells PLC is formally constituted as a Sub Committee of the Main Board, to which it is accountable and comprises three Independent Non-Executive Directors for the financial year 2017/2018 whose detailed profiles are given on pages 66 to 67 of this report. The Sector Financial Controller for the Plantation Services Sector of John Keells group serves as the Secretary to the Audit Committee.
MEETING OF THE BOARD AUDIT COMMITTEE
The BAC convened four times during the financial year 2017 / 2018 and the attendance of the committee members at these meetings is illustrated at the end of this report.
The Non-Independent Non Executive, Director of John Keells PLC (JKPLC), Chief Executive Officer of John Keells PLC (JKPLC), Finance Manager of JKPLC, Chief Executive Officer of John Keells Stock Brokers (Pvt) Ltd (JKSB), Finance Manager of JKSB and Head of Group Business Process Review (Group BPR) of John Keells Holdings PLC attend the meetings of the Audit Committee by invitation. The External Auditors, Outsourced Internal Auditors and other officials attend the meetings on a need basis.
FINANCIAL REPORTING
The Audit Committee has reviewed and assisted the Board in its oversight on the financial statements of the Company, to ensure the integrity of the financial statements prepared for disclosure and to evidence a true and fair view on the financial position and performance. This process is in accordance with the Company’s accounting records and as per the stipulated
requirements of the Sri Lanka Accounting Standards.
The Committee is satisfied that all relevant matters have been taken into account in the preparation of the financial statements through discussion regarding the operations of the Company and its future aspects with the management.
The Committee continues to monitor the compliance in accordance with the financial reporting standards of The Institute of Chartered Accountant of Sri Lanka, Companies Act No. 7 of 2007, The Sri Lanka Accounting and Auditing Standards and the Continuing Listing Rules of the Colombo Stock Exchange.
INTERNAL AUDIT AND CONTROL ASSESSMENT
The internal audit plan and scope of work were formulated in consultation with the Group Business Process Review (Group BPR) Division (the internal audit function at John Keells) and the Outsourced Internal Auditors (BDO Partners), which was then approved by the Committee.
The main focus of the Internal Audit was to provide independent assurance on the overall system of internal controls, risk management and governance, by evaluating the adequacy and efficacy of internal controls, and compliance with laws, regulations and established policies and procedures of the Company.
During the year, the reports were presented to the Committee by the Outsourced Internal Auditors, which were reviewed and discussed along with the management and the Group Business Process Review Division. Findings and recommendations of internal investigations have been followed
AUDIT COMMITTEEREPORT

095Annual Report 2017/18
THE RIGHT THINKING
up, given due attention and implemented.
EXTERNAL AUDIT
The Audit Committee along with the External Auditors and the management reviewed and discussed the External Auditor’s letter of engagement, audit plan, scope of the audit prior to the commencement of the audit.
The External Auditors kept the Committee advised on an on-going basis regarding any unresolved matters of significance. Before the conclusion of the audit, the Committee met with the External Auditors to discuss all audit issues and agreed on their treatment. The Audit Committee also met the External Auditors, without the management, prior to the finalization of the financial statements. The External Auditors’ Management Letter for the year 2016/17, together with management’s responses was discussed with management and the auditors.
The Audit Committee is satisfied that the independence and objectivity of the External Auditors are safeguarded and has not been impaired by any event or service that gives rise to a conflict of interest. The assigned audit and non-audit work was reviewed by the Audit Committee and due consideration has been given to the level of audit and non-audit fees received by the External Auditors from the John Keells Group.
Confirmation with regard to compliance with the independence criteria given in the Code of Ethics of the Institute of Chartered Accountants of Sri Lanka has been received from the External Auditors. The performance of the External Auditors has been evaluated and discussed with the Senior Management of the Company. A declaration has been given by the Messrs. Ernst & Young to the Audit Committee, confirming the compliance on its independence criteria as given in the Code of Ethics of the Institute of Chartered Accountants of Sri Lanka.
RE- APPOINTMENT OF THE EXTERNAL AUDITORS
Based on the evaluation performed, the Audit Committee recommended to the Board that Messrs. Ernst & Young be re-appointed as the External Auditors of John Keells PLC for the financial year ending 31st March 2019, subject to approval of the shareholders at the next Annual General Meeting.
RISK ASSESSMENT
The Audit Committee has also reviewed the processes for the identification, evaluation and management of all significant operational risks faced by the Company. The management and the Sustainability and Enterprise Risk Management Division of the John Keells Group review the notable risks and the measures taken to mitigate those identified risks.
The senior management has provided formal corroboration and assurance to the Audit Committee regarding the efficaciousness and the status of the internal control systems and the risk management systems and acquiescence with applicable laws and regulations.
Formal confirmations and assurances have been received from senior management quarterly regarding the efficacy and status of the internal control systems and risk management systems and, compliance with applicable laws and regulations.
INFORMATION TECHNOLOGY AND RISK ASSESSMENT
The IT services are made use of by the Company to enhance the efficiency and the effectiveness of the internal processes and to provide value added services to its customers. When disseminating this role, conformity is drawn from the Head of IT Plantation Services Sector as well as Internal Auditors Messer’s BDO Partners.
ETHICS, GOVERNANCE AND WHISTLE BLOWING
The continuous emphasis by the Audit Committee on sustaining the ethical values of the employees through the whistle blowing policy ensured the achievement of highest standards of Corporate Governance and adhesion to the Code of Ethics of the Company.
The Company has an established mechanism for employees to report to the Chairman of John Keells Holdings through a communication link named “Chairman Direct” about any unethical behavior, any violation of group values or other improprieties. The reported incidents and the concerns raised are reviewed and investigated on a periodic basis and the identity of the whistle blower is kept confidential.
PROFESSIONAL ADVICE
It is within the power of the Committee to seek external professional advice as and when it requires on any relevant subject area. During the year under review the committee has drawn comfort from the services rendered by Actuarial & Management Consultants (Pvt) Ltd, Mr P. B. Kalugalgedera Chartered Valuer and Mr K. T. D. Tissera Chartered Valuer alongside the services of Messrs. Ernst & Young and Messrs. BDO Partners.
COMPLIANCE OF THE BOARD AUDIT COMMITTEE
The scope and the functions of the Board Audit Committee are in compliance with the requirements of the Code of Best Practice on Audit Committee. The Board Audit Committee has conducted its affairs with the requirements of the code of best practice on Corporate Governance and with the Corporate Governance Rules as per section 7.10 of the Listing Rules of the Colombo Stock Exchange.
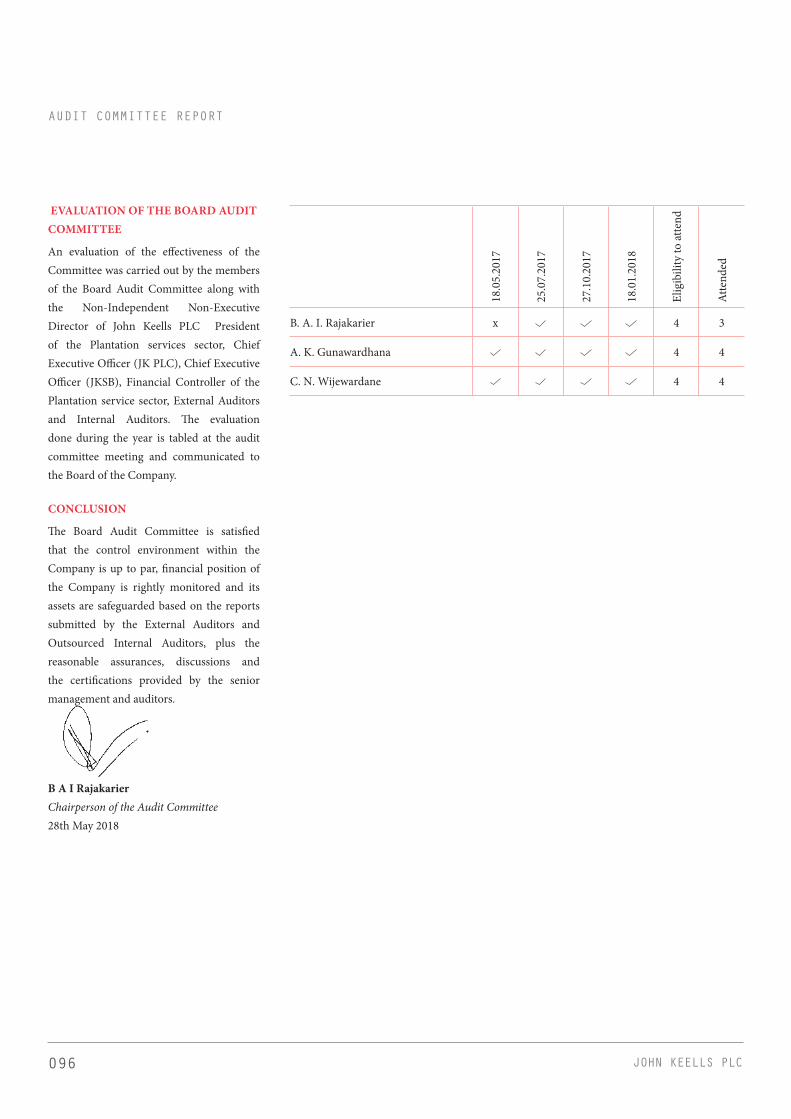
096 JOHN KEELLS PLC
EVALUATION OF THE BOARD AUDIT COMMITTEE
An evaluation of the effectiveness of the Committee was carried out by the members of the Board Audit Committee along with the Non-Independent Non-Executive Director of John Keells PLC President of the Plantation services sector, Chief Executive Officer (JK PLC), Chief Executive Officer (JKSB), Financial Controller of the Plantation service sector, External Auditors and Internal Auditors. The evaluation done during the year is tabled at the audit committee meeting and communicated to the Board of the Company.
CONCLUSION
The Board Audit Committee is satisfied that the control environment within the Company is up to par, financial position of the Company is rightly monitored and its assets are safeguarded based on the reports submitted by the External Auditors and Outsourced Internal Auditors, plus the reasonable assurances, discussions and the certifications provided by the senior management and auditors.
B A I RajakarierChairperson of the Audit Committee28th May 2018
18.0
5.20
17
25.0
7.20
17
27.1
0.20
17
18.0
1.20
18
Elig
ibili
ty to
atte
nd
Atte
nded
B. A. I. Rajakarier x 4 3
A. K. Gunawardhana 4 4
C. N. Wijewardane 4 4
AUDIT COMMITTEE REPORT

097Annual Report 2017/18
THE RIGHT THINKING
ANNUAL REPORT OF THE BOARD OF DIRECTORS
The Directors have pleasure in presenting the 71st Annual Report of your Company together with the Audited Financial Statements of John Keells PLC, and the audited Consolidated Financial Statements of the Group for the year ended 31st March, 2018
GENERAL
The Company was incorporated on 01st April 1960 as a Public Limited Liability Company and the issued shares of the Company are listed on the Colombo Stock Exchange. Pursuant to the requirements of the Companies Act No. 7 of 2007, the Company obtained a new Company registration No. PQ11 on 15th June 2007.
PRINCIPAL ACTIVITIES
Company
The principal activities of the Company remain unchanged as produce broking.
Subsidiaries
John Keells Stock Brokers (Private) Limited continues to provide stock broking services.
John Keells Warehousing (Private) Limited continues to provide warehousing facilities.
BUSINESS REVIEW
A review of the Company and its subsidiaries (Group’s) performance during the financial year is given in the Chairman’s’ Statement and in the Management Discussion and Analysis. These reports form an integral part of the Directors Report and provide a fair review of the performance of the Group during the financial year ended 31st March 2018.
FINANCIAL STATEMENTS
The Financial Statements of the Company and the Group are set out on pages 110 to 164 of the Annual Report.
AUDITOR’S REPORT
The Auditor’s Report on the Financial Statements are given on page 107 of the Annual Report.
SIGNIFICANT ACCOUNTING POLICIES
The Accounting Policies adopted in the preparation of the Financial Statements are given on pages 110 to 164 of the Annual Report.
GOING CONCERN
The Board of Directors is satisfied that the Company, its subsidiaries and associate, have adequate resources to continue its operations in the foreseeable future. Accordingly, the Financial Statements are prepared based on the “Going Concern Concept”.
STATED CAPITAL
The total stated capital of the Company as at 31st March 2018 was Rs. 152 million (2017 - Rs. 152 million).
REVENUE
Revenue generated by the Company amounted to Rs. 519 million (2017 - Rs. 423 million), whilst Group revenue amounted to Rs. 799 million (2017 - Rs. 613 million). Contribution to Group revenue, from the different business segments is provided in Note 11.1 to the Financial Statements on page 138.
RESULTS AND APPROPRIATIONS
The profit after tax of the Company was Rs. 242 million (2017 - Rs.189 million) whilst the Group profit attributable to equity holders of the parent Company for the year was Rs. 235 million (2017 - Rs. 196 million).
Results of the Company and of the Group are given in the Income Statement on page 110.
DIVIDEND
On 14th June 2017, a First and Final Dividend of Rs. 2.00 per share (2016 - Rs. 1.00) was paid for the financial year ended 31st March 2017 amounting to Rs. 121.6 million (2016 - Rs. 60.8 million).
Dividend per share has been computed based on the amount of dividends recognized as distribution to the equity holders during the period.
The Directors have recommended a First and Final Dividend of Rs 2.30 per share for the year ended 31st March 2018 from the profits available for appropriation. In accordance with the Sri Lanka Accounting Standards, events after the Reporting Period, the proposed dividend has not been recognized as a liability as at 31st March 2018.
As required by Section 56 (2) of the Companies Act No. 7 of 2007, the Board of Directors have, certified that the Company satisfies the solvency test in accordance with section 57 of the Companies Act No. 7 of 2007, and have obtained a certificate from the Auditors, prior to approving the First and Final Dividend of s 2.30 share for this year. The First and Final Dividend will be paid on 14th June 2018 to those shareholders on the register as at 04th June 2018.
GRI 102-10, 102-11

098 JOHN KEELLS PLC
Detailed description of the results and appropriations are given below.
Group CompanyProfits 2017 /2018 2016/2017 2017 /2018 2016/2017 Rs. 000's Rs. 000's Rs. 000's Rs. 000's
After making provision for bad and doubtful debts and for all known liabilities and after providing for depreciation on fixed assets, the profit earned was 328,987 240,926 312,270 239,925From which has to be (deducted) the provision for taxation of (91,224) (49,597) (70,229) (51,057)Leaving a net profit on ordinary activities after taxation of 237,763 191,329 242,041 188,868From which the amount attributable to minority Interest was (deducted)/ Added (3,003) 4,691 - -To which Other Comprehensive Income was (Deducted) (31,250) (66,669) (41,538) (64,932)To which share Based payment Expenses is added 19,762 22,024 10,127 12,369To which Differed tax impact on previous years was (Deducted) (49,448) - - -And after the balance brought forward from the previous year was added 3,402,973 3,312,398 3,027,922 2,952,417The amount available for appropriation was 3,576,797 3,463,773 3,238,551 3,088,722AppropriationsFirst and Final Dividend of Rs. 2.00 per share paid for 2016/2017 on 14th June 2017 (2015/2016-Rs.1.00) (121,600) (60,800) (121,600) (60,800)Leaving a balance to be carried forward to the next year of 3,455,197 3,402,973 3,116,951 3,027,922
DONATIONS
During the year under review the Company has not made any donations. (2017 – Nil).
The John Keells Foundation, which operates with funds contributed by each of the companies in the Group, handles most of the Group’s CSR initiatives and activities. The foundation manages a range of programs that underpin its key principle of acting responsibly in all areas of business to bring about sustainable development.
The Company’s contribution to John Keells Foundation was Rs. 1.06 million (2017 - Rs. 0.8 million) and the Group’s contribution was Rs. 1.24 million (2017 Rs. 1.5 million) respectively.
PROPERTY, PLANT AND EQUIPMENT
The book value of property, plant and equipment as at the Reporting date amounted to Rs. 22 million (2017 - Rs. 18 million) and Rs. 353 million (2017 - Rs. 321 million) for the Company and Group respectively.
Capital expenditure for the Company and Group amounted to Rs. 14 million (2017 - Rs. 2.0 million) and Rs. 42.5 million (2017 - Rs. 3.9 million), respectively. Details of property, plant and equipment and their movements are given in Note 19.3 to the Financial Statements on pages 147.
MARKET VALUE OF PROPERTIES
All properties classified as investment property were valued in accordance with the requirements of SLAS40 (2005) Investment Property. The carrying value of Investment Property of the Company and Group amounted to Rs. 288 million (2017 - Rs. 228 million) and Rs. 288 million (2017 - Rs. 228 million) respectively. The investment, property was revalued by Mr. P. B. Kalugalagedra Associated Chartered Valuer as at 31th March 2018.
Details of the valuation of Investment property is provided in Note 21 to the Financial Statements on page 150.
The real estate portfolio of the Group as at 31st March 2018 is disclosed on page 150.
INVESTMENT
Investments of the Company and the Group in subsidiaries, associate, and other external investments amounted to Rs. 2,433 million (2017 - Rs. 2,472 million) and Rs. 2,335 million (2017 - Rs. 2,389 million), respectively.
INVESTMENT IN WATERFRONT PROPERTIES (PVT) LTD
During the year, the Company’s holding in Waterfront Properties (Pvt) Ltd was diluted to 5.93 percent from 8.59 percent as a result of the direct equity infusion in WPL by the Parent Company, John Keells Holdings PLC as envisaged at the outset of the project.
ANNUAL REPORT OF THE BOARD OF DIRECTORS
099Annual Report 2017/18
THE RIGHT THINKING
Detailed description of the long term investments held as 31st March 2018, are given in Note 24 to the Financial statements on page 153.
RESERVES
Total reserves as at 31st March 2018 of the Company and Group amounted to Rs. 2,965 million (2017 - Rs. 2,876 million) and Rs. 3,303 million (2017 - Rs. 3,251 million), respectively.
The movement and composition of the Capital and Revenue reserves is disclosed in the statement of Changes in equity on page 113.
EVENTS OCCURRING AFTER THE REPORTING DATE
There have been no events subsequent to the Reporting date, which would have any material effect on the Company or on the Group other than those disclosed in Note 38 to the Financial Statements on page 164.
CONTINGENT LIABILITIES AND CAPITAL COMMITMENTS
There have been no commitments or Contingent liabilities other than those stated in Note 37 on page 164 of the Annual Report.
HUMAN RESOURCES
The number of persons employed by the Company and Group as at 31st March 2018 was 61 (2017 - 57) and 105 (2017 - 92), respectively.
The Group is committed to pursuing various HR initiatives that ensure the individual development of all our teams as well as facilitating the creation of value for themselves, the Company and all other stakeholders.
There were no material issues pertaining to employees and industrial relations in the year under review.
CORPORATE GOVERNANCE
Corporate Governance practices and principles with respect to the Management and operations of the Company is set out on page 68 of this report. The Directors confirm that the Company is in compliance with the relevant rules on Corporate Governance contained in the listing rules of the Colombo Stock Exchange.
The Directors declare that:
a) The Company has not engaged in any activities, which contravene laws and regulations;
and
b) The Directors have declared all material interest in contracts involving the Company and refrained from voting on matters in which they were materially interested; and
c) The Company has made all endeavours to ensure the equitable treatment of shareholders; and
d) The business is a Going Concern with supporting assumptions or qualifications as necessary; and
e) The Directors have conducted a review of internal controls covering financial operational and compliance controls and risk management and have obtained a reasonable assurance of their effectiveness and successful adherence herewith.
RISK MANAGEMENT AND INTERNAL CONTROL
The Board confirms that there is an ongoing process for identifying, evaluating and managing any significant risks faced by the Group. Risk assessment and evaluation for each business unit,
takes place as an integral part of the annual strategic planning cycle and the principle risks and mitigating actions in place are reviewed regularly by the Board and the
audit Committee. The Board, through the involvement of the risk review and Control Division takes steps to gain assurance on the effectiveness of control systems in place. The audit Committee receives reports on the results of internal control reviews and the Head of the Group risk review and Control Department has direct access to the Chairman of the audit Committee.
AUDIT COMMITTEE
The following Independent Non-Executive, Directors of the Board served on the Audit Committee of John Keells PLC• Ms. B.A.I. Rajakarier – Chairperson• Mr. C.N. Wijewardane• Ms A.K. Gunawardhana
The report of the Audit Committee is given on page 94 of the Annual Report.
HUMAN RESOURCES AND COMPENSATION COMMITTEE
As permitted by the listing rules of the Colombo Stock Exchange, the Human Resources and Compensation Committee of John Keells Holdings PLC (JKH), the parent Company of John Keells PLC functions as the Human resources and Compensation Committee of the Company and subsidiaries. The Human Resources and Compensation Committee of JKH comprises of three independent Directors.Mr. D A Cabraal - ChairpersonMr. M A OmarDr. S.S.H.Wijayasuriya
The remuneration policy of the Company and its subsidiaries is detailed in the Corporate Governance report on page 79 of the Annual Report.
NOMINATION COMMITTEE
As permitted by the listing rules of the Colombo Stock Exchange, the Nomination Committee of JKH, function s as the Nomination Committee of the Company, The Committee comprises of three

0100 JOHN KEELLS PLC
ANNUAL REPORT OF THE BOARD OF DIRECTORS
Independent Non-Executive Directors and one Non Independent Executive Director Mr. M A Omar - ChairpersonMs. M P Perera Dr. S S H.WijayasuriyaMr. S C Ratnayake
RELATED PARTY TRANSACTION REVIEW COMMITTEE
As permitted by the listing rules of the Colombo stock Exchange, the related Party Transaction review Committee of JKH, function as the related party Transaction review Committee of the Company. The Committee comprises of three Independent Non-Executive Directors and one Non Independent Executive Director.Ms. M P Perera – ChairpersonMr. A N FonsekaMr. D A CabraalMr. S C Ratnayake
The Chairperson is an Independent Non –Executive Director of JKH.
STOCK MARKET INFORMATION
An ordinary share of the Company was quoted on the Colombo stock Exchange at Rs. 59.10 as at 31st March 2018 (31st March 2017 - Rs. 51.10). Information relating to public holding, earnings, dividend, net assets, market value per share and share trading is given in Key Ratios and Information on pages 70 to 71 and in the Shareholders Information section on pages 65 to 67.
The Company endeavours at all times to ensure equitable treatment to all shareholders.
SUBSTANTIAL SHAREHOLDINGS
The names of the twenty largest Shareholders, the number of shares held and the percentages held are given on page 66
of the Annual Report. The distribution schedule of the Shareholders and public holdings are disclosed on page 165 of the Annual Report.
DIRECTORATE
As at 31st March 2018 the Board of Directors of John Keells PLC consisted of seven Directors with wide commercial, academic knowledge and experience. The Directors profile is given on pages 66 and 67 of the Annual Report.
The Board of Directors of the Company and its subsidiaries as at 31st March 2018 are listed below.
Name of the Director John Keells PLC John Keells Stock Brokers (Private)
Limited
John Keells Warehousing
(Private) Limited
Mr. S C Ratnayake Chairman √ √ √Mr. K N J Balendra** √ √ -Mr. J. G. A. Cooray ** √ - -Mr. V. A. A. Perera √ - -Ms. B. A. I. Rajakarier √ - -Mr. C. N. Wijewardane √ - -Ms. A. K. Gunawardhana √ - -Mr. J R Gunaratne - √ -Ms. D C Alagaratnam - - √Mr. S Rajendra - - √
** Mr. K. N. J. Balendra & Mr. J. G. A. Cooray was appointed to the Board of Directors with effect from 1st January 2018.
Mr. A.D. Gunewardene & Mr. J.R.F Peiris resigned from the Board of Directors with effect from 31st December 2017.
Retirement of Directors by Rotation or otherwise and their Re-Election
Mr. V. A. A. Perera and Ms. A. K. Gunawardhana retire in terms of the Article 83 of the Article of Association of the Company and are eligible for re-election.
Mr. K. N. J. Balendra and Mr. J. G. A. Cooray retire in terms of the Article 90 of the Article of Association of the Company and being eligible are recommended by the Board for re-election.
DIRECTORS’ REMUNERATION
Details of the remuneration and other benefits received by the Directors are set out in page 140 of the Financial Statements.
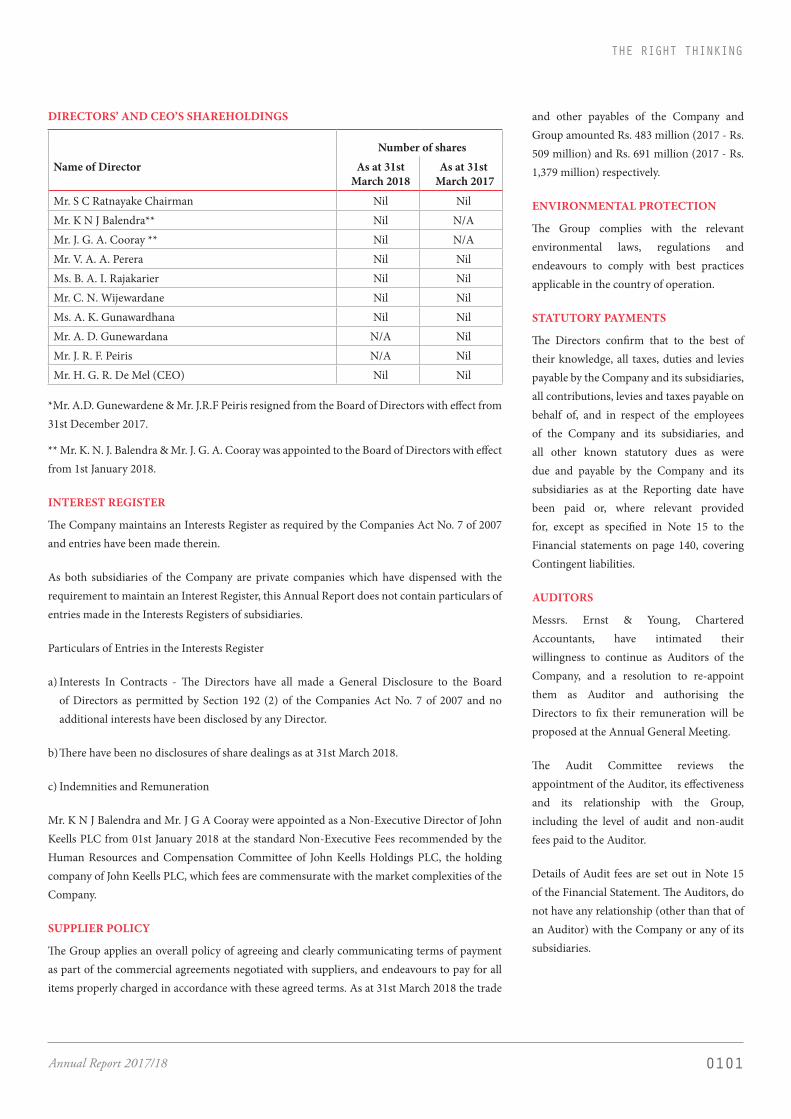
0101Annual Report 2017/18
THE RIGHT THINKING
DIRECTORS’ AND CEO’S SHAREHOLDINGS
Number of sharesName of Director As at 31st
March 2018As at 31st
March 2017
Mr. S C Ratnayake Chairman Nil NilMr. K N J Balendra** Nil N/AMr. J. G. A. Cooray ** Nil N/AMr. V. A. A. Perera Nil NilMs. B. A. I. Rajakarier Nil NilMr. C. N. Wijewardane Nil NilMs. A. K. Gunawardhana Nil NilMr. A. D. Gunewardana N/A NilMr. J. R. F. Peiris N/A NilMr. H. G. R. De Mel (CEO) Nil Nil
*Mr. A.D. Gunewardene & Mr. J.R.F Peiris resigned from the Board of Directors with effect from 31st December 2017.
** Mr. K. N. J. Balendra & Mr. J. G. A. Cooray was appointed to the Board of Directors with effect from 1st January 2018.
INTEREST REGISTER
The Company maintains an Interests Register as required by the Companies Act No. 7 of 2007 and entries have been made therein.
As both subsidiaries of the Company are private companies which have dispensed with the requirement to maintain an Interest Register, this Annual Report does not contain particulars of entries made in the Interests Registers of subsidiaries.
Particulars of Entries in the Interests Register
a) Interests In Contracts - The Directors have all made a General Disclosure to the Board of Directors as permitted by Section 192 (2) of the Companies Act No. 7 of 2007 and no additional interests have been disclosed by any Director.
b) There have been no disclosures of share dealings as at 31st March 2018.
c) Indemnities and Remuneration
Mr. K N J Balendra and Mr. J G A Cooray were appointed as a Non-Executive Director of John Keells PLC from 01st January 2018 at the standard Non-Executive Fees recommended by the Human Resources and Compensation Committee of John Keells Holdings PLC, the holding company of John Keells PLC, which fees are commensurate with the market complexities of the Company.
SUPPLIER POLICY
The Group applies an overall policy of agreeing and clearly communicating terms of payment as part of the commercial agreements negotiated with suppliers, and endeavours to pay for all items properly charged in accordance with these agreed terms. As at 31st March 2018 the trade
and other payables of the Company and Group amounted Rs. 483 million (2017 - Rs. 509 million) and Rs. 691 million (2017 - Rs. 1,379 million) respectively.
ENVIRONMENTAL PROTECTION
The Group complies with the relevant environmental laws, regulations and endeavours to comply with best practices applicable in the country of operation.
STATUTORY PAYMENTS
The Directors confirm that to the best of their knowledge, all taxes, duties and levies payable by the Company and its subsidiaries, all contributions, levies and taxes payable on behalf of, and in respect of the employees of the Company and its subsidiaries, and all other known statutory dues as were due and payable by the Company and its subsidiaries as at the Reporting date have been paid or, where relevant provided for, except as specified in Note 15 to the Financial statements on page 140, covering Contingent liabilities.
AUDITORS
Messrs. Ernst & Young, Chartered Accountants, have intimated their willingness to continue as Auditors of the Company, and a resolution to re-appoint them as Auditor and authorising the Directors to fix their remuneration will be proposed at the Annual General Meeting.
The Audit Committee reviews the appointment of the Auditor, its effectiveness and its relationship with the Group, including the level of audit and non-audit fees paid to the Auditor.
Details of Audit fees are set out in Note 15 of the Financial Statement. The Auditors, do not have any relationship (other than that of an Auditor) with the Company or any of its subsidiaries.

0102 JOHN KEELLS PLC
Further details on the work of the Auditor and the Audit Committee are set out in the Audit Committee Report on page 94.
ANNUAL REPORT
The Board of Directors approved the Company and Consolidated Financial Statements on 28th May 2018. The appropriate number of copies of this report will be submitted to the Colombo stock Exchange and to the Sri Lanka Accounting and Auditing Standards Monitoring Board.
ANNUAL GENERAL MEETING
The annual General Meeting will be held at the John Keells Auditorium, No. 186 Vauxhall Street, Colombo 2, on Monday 25th June, 2018 at 9.30 a.m. The notice of the Annual General Meeting appears on page 173.
This Annual Report is signed for and behalf of the Board of Directors
Chairman
Director
Keells Consultants (Private) Limited.Secretaries28th May 2018
ANNUAL REPORT OF THE BOARD OF DIRECTORS

0103Annual Report 2017/18
THE RIGHT THINKING
STATEMENT OF DIRECTORS’ RESPONSIBILITY
The responsibility of the Directors, in relation to the financial statements, is set out in the following statement. The responsibility of the auditors, in relation to the financial statements prepared in accordance with the provision of the Companies Act No. 7 of 2007 (‘Companies Act’), is set out in the Report of the Auditors on page 107.
As per the Provisions of the Companies Act the Directors are required to prepare, for each financial year and place before a general meeting, Financial Statements which comprises of;
• Income statement and statement of comprehensive income of the Company and its subsidiaries, which present a true and fair view of the profit and loss of the Company and its subsidiaries for the financial year; and
• A Statement of Financial Position, which presents a true and fair view of the state of affairs of the Company and its subsidiaries as at the end of the financial year: and
• A statement of change in equity, and
• Statement of cash flows for the year ended and notes to the financial statement.
The Directors have ensured that, in preparing these Financial Statements;
• Using the appropriate Accounting Policies which have been selected and applied in a consistent manner and material departures, if any, have been disclosed and explained; and
• All applicable accounting standards in accordance with the Sri Lanka Accounting Standards (SLFRS/LKAS) as relevant have been applied; and
• Reasonable and prudent Judgements and estimates have been made so that the form and substance of transactions are properly reflected and
• It provides the information required by and otherwise comply with the Companies Act and the Listing Rules of the Colombo Stock Exchange and requirements of any other regulatory authority as applicable to the Company.
The Directors have also ensured that the Company has adequate resources to continue in operation to justify applying the going concern basis in preparing these financial statements.
Further, the Directors have a responsibility to ensure that the Company maintains sufficient accounting records to disclose, with reasonable accuracy the financial position of the Company and its subsidiaries, and to ensure that the financial statements reflect the transparency of transactions and provides an accurate disclosure of its financial position and comply with the requirements of the Companies Act.
The Directors are also responsible for taking reasonable steps to safeguard the assets of the Company and its subsidiaries and in this regard to give proper consideration to the establishment of appropriate internal control systems with a view to preventing and detecting fraud and other irregularities.
The Directors are required to prepare the financial statements and to provide the auditors with every opportunity to take whatever steps and undertake whatever inspections they may consider to be appropriate to enable them to give their audit opinion.
Further, as required by Section 56(2) of the Companies Act No. 7 of 2007, the Board of Directors have confirmed that the Company, based on the information available, satisfies the solvency test immediately after the distribution, in accordance with Section 57 of the Companies Act No. 7 of 2007 and has obtained a certificate from the auditors, prior to declaring a First and Final Dividend of Rs 2.30 per share for the year, which will be paid on 14th June 2018.
The Directors are of the view that they have discharged their responsibilities as set out in this statement.
COMPLIANCE REPORT
The Directors confirm that to the best of their knowledge, all taxes, duties and levies payable by the Company and its subsidiaries, all contributions, levies and taxes payable on behalf of and in respect of the employees of the Company and its subsidiaries, and all other known statutory dues as were due and payable by the Company and its subsidiaries as at the reporting date have been paid, or where relevant provided for, except as specified in note 37 to the financial statements covering contingent liabilities.
By order of the Board
Keells Consultants (Private) Limited.Secretaries28th May 2018
0104 JOHN KEELLS PLC
JOHN KEELLS PLC [INC 1960] • Hishantha De Mel – Chief Executive officer / Vice President John Keells Holdings PLC• Asha Perera – Sector Financial Controller / Vice President John Keells Holdings PLC• Ravin Vannitamby – Head of Operations / Assistant Vice President John Keells Holdings PLC• Dasarath Dasanayaka – Head of Manufacturing – High Grown Tea• Sanjay Karunaratne – Manager Tea• Deshan Bandaranayake – Manager Tea• Ashan Fernando – Manager Tea• Kumar Bhareti – Manager Manufacturing• Vige Johnpillai – Manufacturing Consultant• Shehan Meegama – Manager Rubber• Shane Ingram – Manager Finance• Samantha Siriwardene – Head of Business and System
JOHN KEELLS WAREHOUSING (PVT) LTD [INC 2001]• Lakshman Kannangara – Manager Warehousing
John Keells Stock Brokers (Pvt) Ltd [Inc 1979]• Tivanka Ranayake – Chief Executive Officer / Vice President John Keells Holdings PLC• Suran Wijesinghe – Chief Financial Officer / Executive Vice President John Keells Holdings PLC• Akmal Mashoor – Head of Sales / Assistant Vice President John Keells Holdings PLC• Navin Ratnayake – Head of Research / Assistant Vice President John Keells Holdings PLC• Nithila Talgaswatte – Manager Foreign Sales• Lasitha Mendis - Manager Institutional Sales• Lourdeena Kudaliyanage – Manager Research• Chryshanthi Manuel – Compliance Officer• Samantha Siriwardene – Head of Business and System• Marinus Fernando – Manager IT
Keells Realtors Ltd.• Suresh Rajendra – Director / President John Keells Holdings PLC
SENIOR MANAGEMENT

0105Annual Report 2017/18
THE RIGHT THINKING
The Right Execution
106 | Financial Calendar 107 | Independent Auditor’s Report 110 | Income Statement 111 | Statement of Comprehensive Income 112 | Statement of Financial Position 113 | Statement of Changes in Equity 115 | Cash Flow Statement 117 | Index to the Notes 118 | Notes to the Financial Statements 165 | Information to Shareholders and
Investors 168 | Five Year Summary 170 | Key Ratios and Information 172 | Glossary of Financial Terminology 173 | Notice of Meeting 175 | Form of Proxy
0106 JOHN KEELLS PLC
FINANCIAL CALENDAR
INTERIM FINANCIAL STATEMENTS WILL BE PUBLISHED AS PER RULE 7.4 OF THE COLOMBO STOCK EXCHANGE
1st Quarter 25th July 20172nd Quarter 27th October 20173rd Quarter 18th January 20184th Quarter 28th May 2018
ANNUAL REPORTS2017/18 (Fourth Integrated Annual Report) 28th May 20182016/17 (Third Integrated Annual Report) 31st May 2017
MEETINGS71st Annual General Meeting 25th June 201870th Annual General Meeting 23rd June 2017
DIVIDENDSFirst and Final dividend of Rs. 2.30 per share will be paid on 14th June 2018
GRI 102-51

0107Annual Report 2017/18
THE RIGHT THINKING
INDEPENDENTAUDITORS’ REPORT
INDEPENDENT AUDITORS’ REPORT
TO THE SHAREHOLDERS OF JOHN KEELLS PLC
Report on the audit of the Consolidated Financial Statements
Opinion
We have audited the financial statements of John Keells PLC (“the Company”) and the consolidated financial statements of the Company and its subsidiaries (“the Group”), which comprise the statement of financial position as at 31 March 2018, and the statement of comprehensive income, statement of changes in equity and statement of cash flows for the year then ended, and notes to the financial statements, including a summary of significant accounting policies.
In our opinion, the accompanying financial statements of the Company and the Group give a true and fair view of the financial position of the Company and the Group as at 31 March 2018, and of their financial
performance and cash flows for the year then ended in accordance with Sri Lanka Accounting Standards.
Basis for opinion
We conducted our audit in accordance with Sri Lanka Auditing Standards (SLAuSs). Our responsibilities under those standards are further described in the Auditor’s responsibilities for the audit of the financial statements section of our report. We are independent of the Group in accordance with the Code of Ethics issued by CA Sri Lanka (Code of Ethics) and we have fulfilled our other ethical responsibilities in accordance with the Code of Ethics. We believe that the audit evidence we have obtained is sufficient and appropriate to provide a basis for our opinion.
Key audit matters
Key audit matters are those matters that, in our professional judgment, were of most
significance in our audit of the financial statements of the current period. These matters were addressed in the context of our audit of the financial statements as a whole, and in forming our opinion thereon, and we do not provide a separate opinion on these matters. For each matter below, our description of how our audit addressed the matter is provided in that context.
We have fulfilled the responsibilities described in the Auditor’s responsibilities for the audit of the financial statements section of our report, including in relation to these matters. Accordingly, our audit included the performance of procedures designed to respond to our assessment of the risks of material misstatement of the financial statements. The results of our audit procedures, including the procedures performed to address the matters below, provide the basis for our audit opinion on the accompanying financial statements.
Key audit matter How our audit addressed the key audit matter
Impairment of Trade ReceivablesTrade Receivables include significant amounts due from Tea Sellers. The impairment of such Trade Debtors was a key audit matter as management judgment was involved in evaluating the credit risk of tea sellers with outstanding debts that continue to be impacted by certain macroeconomic challenges facing the tea industry and determining whether the related Trade Receivables should be impaired.
We obtained an understanding of the process for credit assessment and credit approval, the process for impairment of Trade Receivables relating to Tea clients. We tested the operating effectiveness of relevant controls including the following:
> Checked on a sample basis that credit assessment has been appropriately completed and authorization of credit has been in accordance with the Company’s standard operating procedures for granting credit to Tea clients
> Read the related promissory notes where relevant for agreed terms
> Assessed the appropriateness of provision for impairment based on the internal policy of the Company
Evaluated the reasonability of the recoverable amounts of Trade Receivables collateralized by Tea Stocks by comparing the most recent trading prices as of reporting date
We assessed the adequacy of the Company’s disclosures in notes 8.1, 8.1.1.3 and 27 to the financial statements regarding credit risk and impairment of trade receivables..

0108 JOHN KEELLS PLC
Key audit matter How our audit addressed the key audit matter
Valuation of Investment PropertyAs at reporting date 31 March 2018, Investment Property carried at fair value amounted to Rs. 288 Mn. The fair value of such property was determined by an external valuer engaged by the Group. The valuation of Investment Property was significant to our audit due to the use of significant estimates such as per perch price disclosed in note 21 to the financial statements.
Our audit procedures focused on the valuation performed by the external valuer engaged by the Group, and included the following;
> Assessed the competency, capability and objectivity of the external valuer engaged by the Group
> Read the professional valuer’s report and understood the key estimates made and the approach taken by the valuer in determining the valuation of each property
> Engaged our internal specialised resources to assess the reasonability of the valuation technique and per perch price
We have also assessed the adequacy of the disclosures made in note 21 to the financial statements relating to the valuation technique and estimates used by the professional valuer.
Other information included in the Group’s 2018 Annual Report
Other information consists of the information included in the Annual Report, other than the financial statements and our auditor’s report thereon. Management is responsible for the other information.
Our opinion on the financial statements does not cover the other information and we do not express any form of assurance conclusion thereon.
In connection with our audit of the financial statements, our responsibility is to read the other information and, in doing so, consider whether the other information is materially inconsistent with the financial statements or our knowledge obtained in the audit or otherwise appears to be materially misstated. If, based on the work we have performed, we conclude that there is a material misstatement of this other information, we are required to report that fact. We have nothing to report in this regard
Responsibilities of management and those charged with governance
Management is responsible for the preparation of financial statements that give a true and fair view in accordance with Sri Lanka Accounting Standards, and for such internal control as management determines is necessary to enable the preparation of financial statements that are free from
material misstatement, whether due to fraud or error.
In preparing the financial statements, management is responsible for assessing the Group’s ability to continue as a going concern, disclosing, as applicable, matters related to going concern and using the going concern basis of accounting unless management either intends to liquidate the Group or to cease operations, or has no realistic alternative but to do so.
Those charged with governance are responsible for overseeing the Company’s and the Group’s financial reporting process.
Auditor’s responsibilities for the audit of the financial statements
Our objectives are to obtain reasonable assurance about whether the financial statements as a whole are free from material misstatement, whether due to fraud or error, and to issue an auditor’s report that includes our opinion. Reasonable assurance is a high level of assurance, but is not a guarantee that an audit conducted in accordance with SLAuSs will always detect a material misstatement when it exists. Misstatements can arise from fraud or error and are considered material if, individually or in the aggregate, they could reasonably be expected to influence the economic decisions of users taken on the basis of these financial statements.
As part of an audit in accordance with SLAuSs, we exercise professional judgment and maintain professional skepticism throughout the audit. We also:
• Identify and assess the risks of material misstatement of the financial statements, whether due to fraud or error, design and perform audit procedures responsive to those risks, and obtain audit evidence that is sufficient and appropriate to provide a basis for our opinion. The risk of not detecting a material misstatement resulting from fraud is higher than for one resulting from error, as fraud may involve collusion, forgery, intentional omissions, misrepresentations, or the override of internal control.
• Obtain an understanding of internal control relevant to the audit in order to design audit procedures that are appropriate in the circumstances, but not for the purpose of expressing an opinion on the effectiveness of the internal controls of the Company and the Group.
• Evaluate the appropriateness of accounting policies used and the reasonableness of accounting estimates and related disclosures made by management.
• Conclude on the appropriateness of management’s use of the going concern basis of accounting and, based on the audit
INDEPENDENT AUDITORS’ REPORT
0109Annual Report 2017/18
THE RIGHT THINKING
evidence obtained, whether a material uncertainty exists related to events or conditions that may cast significant doubt on the Group’s ability to continue as a going concern. If we conclude that a material uncertainty exists, we are required to draw attention in our auditor’s report to the related disclosures in the financial statements or, if such disclosures are inadequate, to modify our opinion. Our conclusions are based on the audit evidence obtained up to the date of our auditor’s report. However, future events or conditions may cause the Group to cease to continue as a going concern.
• Evaluate the overall presentation, structure and content of the financial statements, including the disclosures, and whether the financial statements represent the underlying transactions and events in a manner that achieves fair presentation.
• Obtain sufficient appropriate audit evidence regarding the financial information of the entities or business activities within the Group to express an opinion on the consolidated financial statements. We are responsible for the
direction, supervision and performance of the group audit. We remain solely responsible for our audit opinion.
We communicate with those charged with governance regarding, among other matters, the planned scope and timing of the audit and significant audit findings, including any significant deficiencies in internal control that we identify during our audit.
We also provide those charged with governance with a statement that we have complied with ethical requirements in accordance with the Code of Ethics regarding independence, and to communicate with them all relationships and other matters that may reasonably be thought to bear on our independence, and where applicable, related safeguards.
From the matters communicated with those charged with governance, we determine those matters that were of most significance in the audit of the financial statements of the current period and are therefore the key audit matters. We describe these matters in our auditor’s report unless law or regulation precludes public disclosure
about the matter or when, in extremely rare circumstances, we determine that a matter should not be communicated in our report because the adverse consequences of doing so would reasonably be expected to outweigh the public interest benefits of such communication.
Report on Other Legal and Regulatory Requirements
As required by section 163 (2) of the Companies Act No. 07 of 2007, we have obtained all the information and explanations that were required for the audit and, as far as appears from our examination, proper accounting records have been kept by the Company.
CA Sri Lanka membership number of the engagement partner responsible for signing this independent auditor’s report is 2471.
28th May 2018Colombo

0110 JOHN KEELLS PLC
INCOME STATEMENT
Group CompanyFor the Year Ended 31st March Note 2018 2017 2018 2017 Rs 000's Rs 000's Rs 000's Rs 000's
Rendering of Services 799,267 612,627 519,029 423,183 Revenue 11.1 799,267 612,627 519,029 423,183
Cost of Sales (269,666) (215,005) (144,316) (120,750)
Gross Profit 529,601 397,622 374,713 302,433 Dividend Income 12 - - 25,902 4,411 Other Operating Income 13.1 8,759 195 5,699 10 Selling and Distribution Expenses 1,824 8,916 6,083 11,100 Administrative Expenses (224,984) (221,139) (101,567) (106,218)Results from Operating Activities 315,200 185,594 310,830 211,736
Finance Expenses 14.2 (80,164) (62,868) (79,819) (62,671)Finance Income 14.1 47,253 65,438 20,909 45,530 Net Finance Expenses (32,911) 2,570 (58,910) (17,141)
Changes in Fair Value of Investment Properties 60,350 45,330 60,350 45,330
Share of Results of Equity Accounted Investee (13,652) 7,432 - -
Profit Before Tax 15 328,987 240,926 312,270 239,925
Tax Expense 18.1 (91,224) (49,597) (70,229) (51,057)Profit for the Year 237,763 191,329 242,041 188,868
Attributable to:Equity Holders of the Parent 234,760 196,020 Non- Controlling Interests 3,003 (4,691)
237,763 191,329
Earnings per shareBasic 16 3.86 3.22 3.98 3.11
Dividend per share 17 2.00 1.00 2.00 1.00
Figures in brackets indicate deductions.
The Accounting Policies and Notes as set out in pages 118 to 164 form an integral part of these Financial Statements.
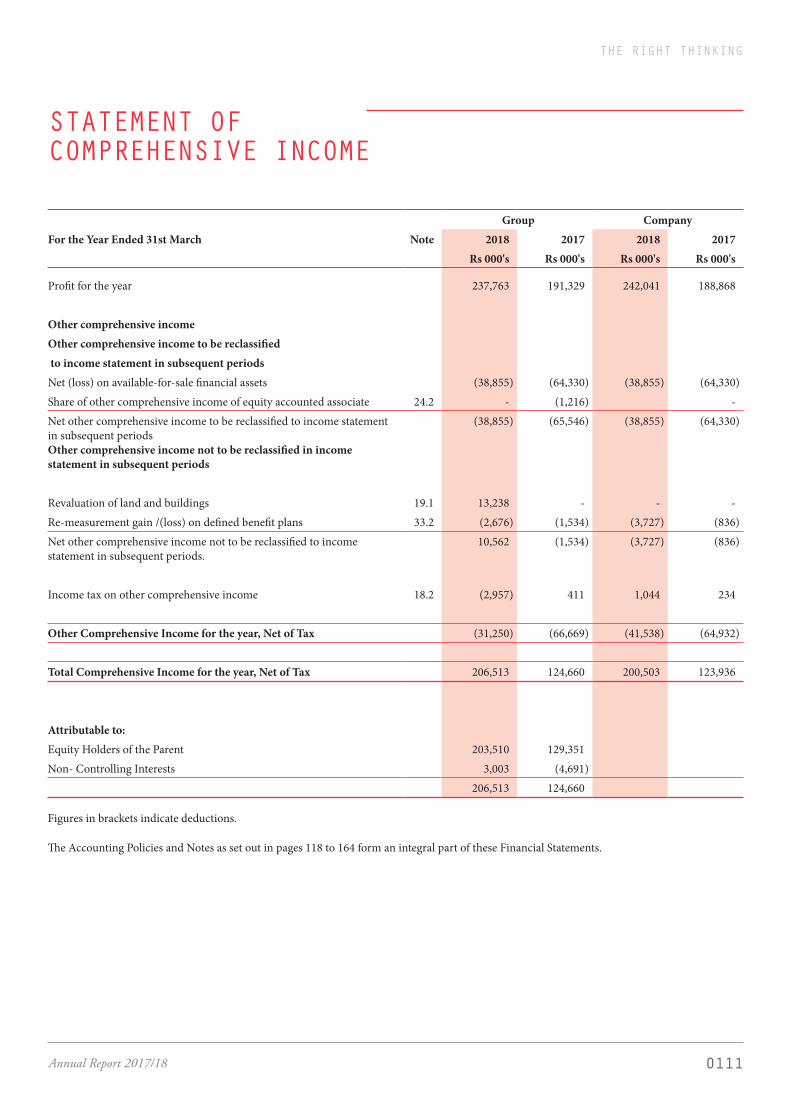
0111Annual Report 2017/18
THE RIGHT THINKING
STATEMENT OF COMPREHENSIVE INCOME
Group CompanyFor the Year Ended 31st March Note 2018 2017 2018 2017 Rs 000's Rs 000's Rs 000's Rs 000's
Profit for the year 237,763 191,329 242,041 188,868
Other comprehensive incomeOther comprehensive income to be reclassified to income statement in subsequent periods Net (loss) on available-for-sale financial assets (38,855) (64,330) (38,855) (64,330)Share of other comprehensive income of equity accounted associate 24.2 - (1,216) - Net other comprehensive income to be reclassified to income statement in subsequent periods Other comprehensive income not to be reclassified in income statement in subsequent periods
(38,855) (65,546) (38,855) (64,330)
Revaluation of land and buildings 19.1 13,238 - - - Re-measurement gain /(loss) on defined benefit plans 33.2 (2,676) (1,534) (3,727) (836)Net other comprehensive income not to be reclassified to income statement in subsequent periods.
10,562 (1,534) (3,727) (836)
Income tax on other comprehensive income 18.2 (2,957) 411 1,044 234
Other Comprehensive Income for the year, Net of Tax (31,250) (66,669) (41,538) (64,932)
Total Comprehensive Income for the year, Net of Tax 206,513 124,660 200,503 123,936
Attributable to:Equity Holders of the Parent 203,510 129,351 Non- Controlling Interests 3,003 (4,691)
206,513 124,660
Figures in brackets indicate deductions.
The Accounting Policies and Notes as set out in pages 118 to 164 form an integral part of these Financial Statements.

0112 JOHN KEELLS PLC
STATEMENT OF FINANCIAL POSITION
Group CompanyAs at 31st March Note 2018 2017 2018 2017 Rs 000's Rs 000's Rs 000's Rs 000's
ASSETSNon-Current AssetsProperty, Plant and Equipment 19.3 353,465 321,237 22,389 18,162 Lease Rentals Paid in Advance 20 36,935 38,024 - - Investment Property 21 288,100 227,750 288,100 227,750 Intangible Assets 22 - 92 - - Investments in Subsidiaries 23 - - 158,570 158,570 Investments in Associates 24 84,700 99,632 24,000 24,000 Non-Current Financial Assets 25 2,303,411 2,408,119 2,294,642 2,397,665 Deferred Tax Assets 18.5 17,842 29,118 8,008 15,380 Other Non - Current Assets 8,925 6,636 7,278 5,082
3,093,378 3,130,608 2,802,987 2,846,609
Current Assets Inventories 26 661 456 470 332 Trade and Other Receivables 27 1,543,725 2,061,480 1,416,099 1,268,496 Amounts due from Related Parties 36.1 1,803 30,155 1,871 4,314 Income Tax Refunds 18.4 401 1,489 - - Other Current Assets 28 3,967 5,140 1,205 1,992 Short Term Investments 29 284,744 221,030 - - Cash in Hand and at Bank 30.1 184,454 175,234 153,394 158,633
2,019,755 2,494,984 1,573,039 1,433,767 Total Assets 5,113,133 5,625,592 4,376,026 4,280,376
EQUITY AND LIABILITIESEquityStated Capital 31.1 152,000 152,000 152,000 152,000 Revenue Reserves 2,847,937 2,736,703 2,697,374 2,579,617 Other components of equity 31.2 455,260 514,270 267,577 296,305 Equity attributable to equity holders of the parent 3,455,197 3,402,973 3,116,951 3,027,922 Non-Controlling Interests 39,535 33,781 - - Total Equity 3,494,732 3,436,754 3,116,951 3,027,922
Non-Current LiabilitiesDeferred Tax Liabilities 18.6 95,088 35,060 - - Employee Benefit Liabilities 33 64,630 65,363 37,067 31,833
159,718 100,423 37,067 31,833 Current LiabilitiesTrade and Other Payables 34 691,233 1,379,257 483,038 509,026 Amounts due to Related Parties 36.2 3,552 3,153 3,761 8,471 Income Tax Liabilities 18.4 47,376 30,303 45,178 29,050 Other Current Liabilities 35 4,410 2,125 1,985 1,707 Bank Overdrafts 30.2 712,112 673,577 688,046 672,367
1,458,683 2,088,415 1,222,008 1,220,621 Total Equity and Liabilities 5,113,133 5,625,592 4,376,026 4,280,376
I certify that the financial statements have been prepared in compliance with the requirements of the Companies Act No. 7 of 2007.
Sector Financial ControllerP A P PereraThe Board of directors is responsible for these Financial Statements.
Chairman DirectorS C Ratnayake J G A CoorayThe Accounting Policies and Notes as set out in pages 118 to 164 form an integral part of these Financial Statements. 28 th May 2018

0113Annual Report 2017/18
THE RIGHT THINKING
STATEMENT OF CHANGES IN EQUITY
Group Attributable to Equity Holders of Parent Other Components of Equity
Note Statedcapital
Revalua-tionReserves
Availablefor sale
Reserves
OtherCapital
Reserves
Revenue Reserves
Total NonCon-
trolling Interest
Total
Rs 000's Rs 000's Rs 000's Rs 000’s Rs 000’s Rs 000’s Rs 000’s Rs 000's
As at 1st April 2016 152,000 188,996 304,060 64,736 2,602,606 3,312,398 23,820 3,336,218
Profit for the year - - - - 196,020 196,020 (4,691) 191,329
Other Comprehensive Income, net of tax - - (65,546) - (1,123) (66,669) - (66,669)
Total Comprehensive Income, net of tax - - (65,546) - 194,897 129,351 (4,691) 124,660
Share based payment expenses 32 - - - 22,024 - 22,024 2,772 24,796 Increase Share Capital of JKSB Non Controlling Interest
- - - - - - 12,060 12,060
Final Dividend Paid - 2015/16 17 - - - - (60,800) (60,800) - (60,800)Subsididiary Dividend to Non- Controlling Interest
- - - - - - (180) (180)
As at 31 March 2017 152,000 188,996 238,514 86,760 2,736,703 3,402,973 33,781 3,436,754
Profit for the year - - - - 234,760 234,760 3,003 237,763
Other Comprehensive Income, net of tax - 9,531 (38,855) - (1,926) (31,250) - (31,250)
Total Comprehensive Income, net of tax - 9,531 (38,855) - 232,834 203,510 3,003 206,513
Share based payment expenses 32 - - - 19,762 - 19,762 2,751 22,513 Charge of Differed tax impact on previous years - (49,448) - - - (49,448) - (49,448)Final Dividend Paid - 2016/17 17 - - - - (121,600) (121,600) - (121,600)
As at 31 March 2018 152,000 149,079 199,659 106,522 2,847,937 3,455,197 39,535 3,494,732
Figures in brackets indicate deductions.
The Accounting Policies and Notes as set out in pages 118 to 164 form an integral part of these Financial Statements.

0114 JOHN KEELLS PLC
STATEMENT OF CHANGES IN EQUITY
Company Other Components of Equity Note Stated
capitalOther
Capital Reserves
Availablefor sale
Reserves
Revenue Reserves
Total
Rs 000's Rs 000's Rs 000's Rs 000’s Rs 000’s
As at 1st April 152,000 45,422 302,844 2,452,151 2,952,417
Profit for the year - - - 188,868 188,868
Other Comprehensive Income, net of tax - - (64,330) (602) (64,932)
Total Comprehensive Income, net of tax - - (64,330) 188,266 123,936
Share based payment expenses 32 - 12,369 - - 12,369 Final Dividend Paid - 2015/16 17 - - - (60,800) (60,800) - - - - - As at 31 March 2017 152,000 57,791 238,514 2,579,617 3,027,922
Profit for the year - - - 242,041 242,041
Other Comprehensive Income, net of tax - - (38,855) (2,684) (41,539)
Total Comprehensive Income, net of tax - - (38,855) 239,357 200,502
Share based payment expenses 32 - 10,127 - - 10,127 Final Dividend Paid - 2016/17 17 - - - (121,600) (121,600)
As at 31 March 2018 152,000 67,918 199,659 2,697,374 3,116,951
Figures in brackets indicate deductions.
The Accounting Policies and Notes as set out in pages 118 to 164 form an integral part of these Financial Statements.

0115Annual Report 2017/18
THE RIGHT THINKING
CASH FLOW STATEMENT
Group CompanyFor the Year Ended 31st March Note 2018 2017 2018 2017 Rs 000's Rs 000's Rs 000's Rs 000's
OPERATING ACTIVITIES
Profit before tax 328,987 240,926 312,270 239,925
Adjustments to reconcile profit before tax to net cash flows:Associate Companies Share of Profit 24.2 13,652 (7,432) - - Interest income 14.1 (33,359) (26,647) (7,014) (6,739)Dividend income 12 (13,895) (38,791) (39,797) (43,202)Finance expenses 14.2 80,164 62,868 79,819 62,671 Change in fair value of investment properties 21 (60,350) (45,330) (60,350) (45,330)Depreciation of property, plant and equipment 15 23,458 22,081 9,709 7,702 Amortisation of Lease Charges 20 1,089 1,089 - - Amortisation of Intangible Assets 92 495 - - Amotisation of prepaid staff cost 529 716 - - (Profit) / loss on sale of property, plant and equipment (5,487) (213) (3,523) (10)Share based payment expenses 32 22,513 24,796 10,127 12,369 Gratuity provision and related costs 33.2 11,225 11,505 6,045 6,365 Operating Profit Before Working Capital Changes 368,618 246,063 307,286 233,751
Working Capital adjustments :Decrease / (Increase) in Inventories (205) 29 (138) 12 Decrease / (Increase) in Trade and Other Receivables 517,755 (571,634) (147,602) 799 Decrease / (Increase) in Other Non-Current Assets 62,909 (37,507) 61,974 (42,677)Decrease / (Increase) in amounts Due from Related Parties 28,352 (27,519) 2,443 (1,613)Decrease / (Increase) in Other Current Assets 1,174 (1,110) 786 (935)Increase / (Decrease) in Trade and Other Payables (688,023) 501,246 (25,988) (11,440)Increase / (Decrease) in amounts Due to Related Parties 400 331 (4,710) 2,669 Increase / (Decrease) in Other Current Liabilities 2,285 (2,887) 278 494 Cash Generated from Operations 293,265 107,012 194,329 181,061
Interest Received 14.1 33,359 26,647 7,014 6,739 Finance Expenses Paid 14.2 (80,164) (62,868) (79,819) (62,671)Dividend Received 14.1 13,895 38,791 25,902 4,411 Income Tax Paid and setoff 18.4 (52,776) (8,139) (45,686) (1,466)Gratuity paid/Transfers(Net) 33.2 (14,634) (19,802) (4,539) (17,313)Net Cash Flow from/(used in) Operating Activities 192,945 81,641 97,201 110,761

0116 JOHN KEELLS PLC
CASH FLOW STATEMENT
Group CompanyFor the Year Ended 31st March Note 2018 2017 2018 2017 Rs 000's Rs 000's Rs 000's Rs 000's
INVESTING ACTIVITIESAcquisition of Property, Plant and Equipment 19.1 (42,518) (3,958) (13,975) (2,001)Purchase of rights in subsidiary - - - (38,190)Dividend Received - - 13,895 38,791 Proceeds from Insurance claims 346 92 - 92 Proceeds from Sale of Property Plant & Equipment 5,226 239 3,561 5 Net cash flow from/(used in) Investing Activities (36,946) (3,627) 3,481 (1,303)
FINANCING ACTIVITIESDividend Paid (121,600) (60,800) (121,600) (60,800)Proceeds from issue of shares - Non Controlling Shareholders' - 12,060 - - Dividend Paid to Non Controlling Shareholders' - (180) - - Net cash flow From /(Used in) Financing Activities (121,600) (48,920) (121,600) (60,800)
NET INCREASE / (DECREASE) IN CASH AND CASH EQUIVALENTS
34,399 29,094 (20,918) 48,658
CASH AND CASH EQUIVALENTS AT THE BEGINNING (277,313) (306,407) (513,734) (562,392)
CASH AND CASH EQUIVALENTS AT THE END (242,914) (277,313) (534,652) (513,734)
ANALYSIS OF CASH AND CASH EQUIVALENTSFavourable balancesCash in hand and at bank 184,454 175,234 153,394 158,633 Short Term Investments 284,744 221,030 - -
469,198 396,264 153,394 158,633 Unfavourable balancesBank Overdrafts (712,112) (673,577) (688,046) (672,367)Cash and cash equivalents (242,914) (277,313) (534,652) (513,734)
Figures in brackets indicate deductions.
The Accounting Policies and Notes as set out in pages 118 to 164 form an integral part of these Financial Statements.

0117Annual Report 2017/18
THE RIGHT THINKING
INDEX TO THE NOTES
Note No. Section Page no
1 Corporate information 118
Basis of preparation and other significant accounting policies2 Basis of preparation 1183 Basis of consolidations 1184 Significant accounting judgements, estimates and assumptions 1195 Summary of significant accounting policies 1206 Standards issued but not yet effective 121
Group business, operations & management7 Segment information 1258 Financial risk management objectives and policies 1269 Fair value measurement and related fair value disclosures 13110 Financial instruments and related policies 133
Notes to the income statement, statement of comprehensive income and statement of financial position11 Revenue Recognition 13812 Dividend income 13813 Other operating income 13914 Net Finance income 13915 Profit before tax 14016 Earnings per share 14117 Dividend per share 14118 Taxes 14119 Property , plant and equipment 14620 Leases rental paid in advance 14921 Investment property 15022 Intangible assets 15123 Investment in subsidiaries 15224 Investment in associate 15325 Non current financial assets 15426 Inventories 15627 Trade and other receivables 15628 Other current assets 15729 Short term investments 15730 Cash in hand and at bank 15731 Stated capital and other components of equity 15732 Share-based payment plans 15833 Employee benefit liabilities 16034 Trade and other payables 16235 Other current liabilities 16236 Related party transactions 162
Commitments and Contingencies37 commitments and Contingent liabilities 16438 Events after the reporting period 164

0118 JOHN KEELLS PLC
NOTES TO THE FINANCIAL STATEMENTS
1. CORPORATE INFORMATION
Reporting Entity
John Keells PLC is a public limited liability company incorporated and domiciled in Sri Lanka and listed on the Colombo Stock Exchange. The registered office of the company is located at 117, Sir Chittampalam A Gardiner Mawatha, Colombo 02 and the principal place of business of the company is located at 186, Vauxhall Street, Colombo 02.
Ordinary shares of the company are listed on the Colombo Stock Exchange.
Consolidated financial statements
The financial statements for the year ended 31 March 2018, comprise “the Company” referring to John Keells PLC. as the holding Company and “the Group” referring to the companies that have been consolidated therein.
Approval of Financial Statements
The Financial statements for the year ended 31 March 2018 were authorized for issue by the directors on 28th May2018.
Principal Activities and Nature of Operations
Holding Company
The principal activities of the Company is Produce broking.
Subsidiaries and Associate
The companies within the Group and its business activities are disclosed in the Group Structure on page 6 of the Annual Report. There were no significant changes in the nature of the principal activities of the Company and the Group during the financial year under review.
Parent Entity and Ultimate Parent Entity
The Company’s parent entity is John Keells Holdings PLC in the opinion of the directors, which is incorporated in Sri Lanka.
Responsibility for Financial Statements
The responsibility of the Directors in relation to the financial statements is set out in ‘The statement of director’s responsibility on Page 103 to in the Annual report.
Statement of compliance
The financial statements which comprise the statement of financial position, the statement of income, statement of other comprehensive income, statement of changes in equity and the statement of cash flows, together with the accounting policies
and notes (the “financial statements”) have been prepared in accordance with Sri Lanka Accounting Standards (SLFRS/LKAS) as issued by the Institute of Chartered Accountants of Sri Lanka (CA Sri Lanka) and the requirement of the Companies Act No. 7 of 2007.
2 BASIS OF PREPARATION
Bases of Measurement
The company’s financial statements have been prepared on an accrual basis and under the historical cost convention except for investment properties, buildings on leasehold land and available-for-sale financial assets that have been measured at fair value.
Presentation and Functional Currency
The consolidated financial statements are presented in Sri Lankan Rupees, the Group’s functional and presentation currency, which is the primary economic environment in which the Holding Company operates. Each entity in the Group uses the currency of the primary economic environment in which they operate as their functional currency.
All values are rounded to the nearest rupees thousand (Rs. ’000) except when otherwise indicated.
The significant accounting policies are discussed in Note 5 below.
3 BASIS OF CONSOLIDATION
The consolidated financial statements comprise the financial statements of the Group and its subsidiaries as at 31 March 2018. Control is achieved when the Group is exposed, or has rights, to variable returns from its involvement with the investee and has the ability to affect those returns through its power over the investee. Specifically, the Group controls an investee if, and only if, the Group has:
• Power over the investee (i.e., existing rights that give it the current ability to direct the relevant activities of the investee)
• Exposure, or rights, to variable returns from its involvement with the investee
• The ability to use its power over the investee to affect its returns
Generally, there is a presumption that a majority of voting rights result in control. To support this presumption and when the Group has less than a majority of the voting or similar rights of an investee, the Group considers all relevant facts and circumstances in assessing whether it has power over an investee, including:
0119Annual Report 2017/18
THE RIGHT THINKING
• The contractual arrangement with the other vote holders of the investee
• Rights arising from other contractual arrangements
• The Group’s voting rights and potential voting rights
The Group re-assesses whether or not it controls an investee if facts and circumstances indicate that there are changes to one or more of the three elements of control. Consolidation of a subsidiary begins when the Group obtains control over the subsidiary and ceases when the Group loses control of the subsidiary. Assets, liabilities, income and expenses of a subsidiary acquired or disposed of during the year are included in the consolidated financial statements from the date the Group gains control until the date the Group ceases to control the subsidiary.
Profit or loss and each component of other comprehensive income (OCI) are attributed to the equity holders of the parent of the Group and to the noncontrolling interests, even if this results in the non-controlling interests having a deficit balance. When necessary, adjustments are made to the financial statements of subsidiaries to bring their accounting policies into line with the Group’s accounting policies.
Loss of control
If the Group loses control over a subsidiary, it derecognises the related assets (including goodwill), liabilities, noncontrolling interest and other components of equity while any resultant gain or loss is recognised in the income statement. Any investment retained is recognised at fair value.
The total profits and losses for the year of the Company and of its subsidiaries included in consolidation are shown in the consolidated income statement and consolidated statement of comprehensive income and all assets and liabilities of the Company and of its subsidiaries included in consolidation are shown in the consolidated statement of financial position.
Non-controlling interest (NCI)
Non-controlling interest which represents the portion of profit or loss and net assets not held by the Group, are shown as a component of profit for the year in the consolidated income statement and statement of comprehensive income and as a component of equity in the consolidated statement of financial position, separately from equity attributable to the shareholders of the parent. The consolidated statement of cash flow includes the cash flows of the Company and its subsidiaries.
Transactions eliminated on consolidation
All intra-group assets, liabilities, equity, income, expenses and cash flows relating to transactions between members of the Group are eliminated in full on consolidation. A change in the ownership interest of a subsidiary, without a loss of control, is accounted for as an equity transaction.
4 SIGNIFICANT ACCOUNTING JUDGEMENTS, ESTIMATES AND ASSUMPTIONS
The preparation of the financial statements of the Group require the management to make judgments, estimates and assumptions, which may affect the amounts of income, expenditure, assets, liabilities and the disclosure of contingent liabilities, at the end of the reporting period. In the process of applying the Group’s accounting policies, the key assumptions made relating to the future and the sources of estimation at the reporting date together with the related judgments that have a significant risk of causing a material adjustment to the carrying amounts of assets and liabilities within the next financial year are discussed below.
Going Concern
The management has made an assessment of its ability to continue as a going concern and is satisfied that it has the resources to continue in business for the foreseeable future. Furthermore, management is not aware of any material uncertainties that may cast significant doubt upon the Company’s ability to continue as a going concern. Therefore, the Financial Statements continue to be prepared on a going concern basis.
Revaluation of buildings on leasehold land and investment properties
The Group measures buildings on leasehold land at revalued amounts with changes in fair value being recognised in the statement of equity. In addition, it carries its investment properties at fair value, with changes in fair value being recognised in the income statement. The Group engaged independent valuation specialists to determine fair value of investment properties and buildings on leasehold land as at 31st March 2018.
The valuer has used valuation techniques such as market values and discounted cash flow methods where there was lack of comparable market data available based on the nature of the property. (Note 21)
The determined fair values of investment properties, using market comparable method, are most sensitive to the fairvalue of unobservable inputs. The methods used to determine the fair value of the investment properties, are further explained in Note 21.1.
Share-based payment transactions
The Group measures the cost of equity settled transactions with employees by reference to the fair value of the equity instruments at the date at which they are granted. Estimating fair value for sharebased payment transactions requires determining the most appropriate valuation model, which is dependent on the terms and conditions of the grant. This estimate also requires the determination of the most appropriate inputs to the valuation model including the expected life of the share option, volatility and dividend yield and making assumptions about them.

0120 JOHN KEELLS PLC
Transfer Pricing Regulation
The Company is subject to income taxes and other taxes including transfer pricing regulations. Prevailing uncertainties with respect to the interpretation of respective transfer pricing regulations, necessitated using management judgment to determine the impact of transfer pricing regulations. Accordingly critical judgments and estimates were used in applying the regulations in aspects including but not limited to identifying associated undertakings, estimation of the respective arm’s length prices and selection of appropriate pricing mechanism. The current tax charge is subject to such judgments. Differences between estimated income tax charge and actual payable may arise as a result of management’s interpretation and application of transfer pricing regulation.
Deferred Tax Assets/ Liabilities
Deferred tax assets are recognised for all unused tax losses to the extent that it is probable that taxable profit will be available against which the losses can be utilised. Significant management judgment is required to determine the amount of deferred tax assets that can be recognized, based upon the likely timing and the level of future taxable profits together with future tax planning strategies. Further details on taxes are disclosed in Note 18.2.
Contingent Liabilities
Contingent liabilities are possible obligations that arise from past events and whose existence will be confirmed only by the occurrence or non occurrence of one or more uncertain future events not wholly within the control of the entity. All contingent liabilities are disclosed in note 37 to the financial statement in page 164 unless the possibility of an outflow of resources embodying economic benefit is remote.
Employee Benefit Liability
The employee benefit liability of the Group is based on the actuarial valuation carried out by independent actuarial specialist. The actuarial valuations involve making assumptions about discount rates and future salary increases. The complexity of the valuation, the underlying assumptions and its long term nature, the defined benefit obligation is highly sensitive to changes in these assumptions. All assumptions are reviewed at each reporting date. Details of the key assumptions used in the estimates are contained in Note 33.
Fair value of financial instruments
Where the fair value of financial assets and financial liabilities recorded in the statement of financial position cannot be derived from active markets, their fair value is determined using valuation techniques including the discounted cash flow
model. The inputs to these models are taken from observable markets where possible.
Where this is not feasible, a degree of judgment is required in establishing fair values. The judgments include considerations of inputs such as liquidity risk, credit risk and volatility. Changes in assumptions about these factors could affect the reported fair value of financial instruments (see Note 9).
5. SUMMARY OF SIGNIFICANT ACCOUNTING POLICIES
Accounting Policies
The accounting policies adopted by the group are consistent with those used in the previous year.
Comparative information
The presentation and classification of the financial statements of the previous years have been amended, where relevant for better presentation and to be comparable with those of the current year.
5.1 Business combinations & goodwill
Acquisitions of subsidiaries are accounted for using the acquisition method of accounting. The Group measures goodwill at the acquisition date as the fair value of the consideration transferred including the recognized amount of any non-controlling interests in the acquiree, less the net recognized amount (generally fair value) of the identifiable assets acquired and liabilities assumed, all measured as of the acquisition date. When the excess is negative, a bargain purchase gain is recognized immediately in the income statement.
The Group selects on a transaction-by-transaction basis whether to measure non-controlling interests at fair value, or at their proportionate share of the recognized amount of the identifiable net assets, at the acquisition date. Transaction costs, other than those associated with the issue of debt or equity securities, that the Group incurs in connection with a business combination are expensed as incurred. When the Group acquires a business, it assesses the financial assets and liabilities assumed for appropriate classification and designation in accordance with the contractual terms, economic circumstances and pertinent conditions as at the acquisition date. This includes the separation of embedded derivatives in host contracts by the acquiree.
If the business combination is achieved in stages, the acquisition date fair value of the acquirer’s previously held
NOTES TO THE FINANCIAL STATEMENTS

0121Annual Report 2017/18
THE RIGHT THINKING
equity interest in the acquiree is remeasured to fair value at the acquisition date through profit or loss.
Any contingent consideration to be transferred by the acquirer will be recognized at fair value at the acquisition date. Contingent consideration which is deemed to be an asset or liability, which is a financial instrument and within the scope of LKAS 39, is measured at fair value with changes in fair value either in profit or loss or as a change to other comprehensive income. If the contingent consideration is classified as equity, it will not be remeasured. Subsequent settlement is accounted for within equity. In instances where the contingent consideration does not fall within the scope of LKAS 39, it is measured in accordance with the appropriate SLFRS/LKAS.
Goodwill is initially measured at cost being the excess of the consideration transferred over the Group’s net identifiable assets acquired and liabilities assumed. If this consideration is lower than the fair value of the net assets of the subsidiary acquired. The difference is recognized in the income statement.
After initial recognition, goodwill is measured at cost less any accumulated impairment losses. Goodwill is reviewed for impairment, annually or more frequently if events or changes in circumstances indicate that the carrying value maybe impaired. For the purpose of impairment testing, goodwill acquired in a business combination is, from the acquisition date, allocated to each of the Group’s cash generating units that are expected to benefit from the combination, irrespective of whether other assets or liabilities of the acquiree are assigned to those units.
Impairment is determined by assessing the recoverable amount of the cash generating unit to which the goodwill relates. Where the recoverable amount of the cash generating unit is less than the carrying amount, an impairment loss is recognized. The impairment loss is allocated first to reduce the carrying amount of any goodwill allocated to the unit and then to the other assets pro-rata to the carrying amount of each asset in the unit.
Goodwill and fair value adjustments arising on the acquisition of a foreign operation area treated as assets and liabilities of the foreign operation and translated at the closing rate.
Where goodwill forms part of a cash generating unit and part of the operation within that unit is disposed of, the goodwill associated with the operation disposed of is included in the carrying amount of the operation when determining the gain or loss on disposal of the operation. Goodwill disposed in this circumstance is measured based on the relative values of the operation disposed of and the portion of the cash-generating unit retained.
Other significant accounting policies not covered with individual notes.
Following accounting policies which have been applied consistently by the Group, are considered to be significant but are not covered in any other sections.
Current versus non-current classification
The Group presents assets and liabilities in statement of financial position based on current/non-current classification. An asset as current when it is:
* Expected to be realised or intended to be sold or consumed in normal operating cycle
* Held primarily for the purpose of trading
* Expected to be realised within twelve months after the reporting period, or
* Cash or cash equivalent unless restricted from being exchange or used to settle a liability for at least twelve months after the reporting period
All other assets are classified as non-current
A liability is current when
* It is expected to be settled in normal operating cycle
* It is held primarily for the purpose of trading
* It is due to be settled within twelve months after the reporting period, or
* There is no unconditional right to deter the settlement of the liability for at least twelve months after the reporting period
The Group classifies all other liabilities as non-current.
Deferred tax assets and liabilities are classified as non-current assets and liabilities.
6 STANDARDS ISSUED BUT NOT YET EFFECTIVE
The following SLFRS have been issued by the Institute of Chartered Accountants of Sri Lanka that have an effective date in the future and have not been applied in preparing
these financial statements. Those SLFRS’s will have an effect on the accounting policies currently adopted by the Group and may have an impact on the future financial statements.
The Group intends to adopt these standards, if applicable, when they become effective.

0122 JOHN KEELLS PLC
NOTES TO THE FINANCIAL STATEMENTS
Accounting Standard
Summary of the Requirements Effective Date
Possible Impact on Consolidated Financial Statements
SLFRS 9 - Financial Instruments
SLFRS 9 replaces the existing guidance in LKAS 39 Financial Instruments: Classification and Measurement,impairment and hedge accounting. SLFRS 9 includes revised guidance on the classification and measurement of financial instruments, a new expected credit loss model for calculating impairment on financial assets, and new general hedge accounting requirements. It also carries forward the guidance on recognition and derecognition of financial instruments from LKAS 39.
On or after 1 January 2018 (early adoption permitted)
The Group has adopted the new standard on the required effective date and will not restate comparative information. During 2017,the Group has performed a high-level impact assessment of all three aspects of SLFRS 9. This preliminary assessment is based on currently available information and may be subject to changes arising from further detailed analyses or additional reasonable and supportable information being made available to the Group in the future. Overall, the Group expects no significant impact on its financial position and equity.Group will implement changes in classification of certain financial instruments.
Classification and measurementThe Group does not expect a significant impact on its balance sheet or equity on applying the classification and measurement requirements of SLFRS 9. It expects to continue measuring at fair value all financial assets currently held at fair value.Debt securities are expected to be measured at fair value through OCI under SLFRS 9 as the Group expects not only to hold the assets to collect contractual cash flows, but also to sell a significant amount on a relatively frequent basis.The equity shares in listed and non-listed companies are intended to be held for the foreseeable future. No impairment losses were recognised in profit or loss during prior periods for these investments. The Group will apply the option to present fair value changes in OCI, and, therefore, the application of SLFRS 9 will not have a significant impact. Loans as well as trade receivables are held to collect contractual cash flows and are expected to give rise to cash flows representing solely payments of principal and interest. The Group analysed the contractual cash flow characteristics of those instruments and concluded that they meet the criteria for amortised cost measurement under SLFRS 9. Therefore, reclassification for these instruments is not required.
ImpairmentSLFRS 9 requires the Group to record expected credit losses on all of its debt securities, loans and trade receivables, either on a 12-month or lifetime basis. The Group will apply the simplified approach and record lifetime expected losses on all trade receivables.

0123Annual Report 2017/18
THE RIGHT THINKING
Accounting Standard
Summary of the Requirements Effective Date
Possible Impact on Consolidated Financial Statements
Hedge accounting The Group determined that all existing hedge relationships that are currently designated in effective hedging relationships will continue to qualify for hedge accounting under SLFRS 9.As SLFRS 9 does not change the general principles of how an entity accounts for effective hedges, applying the hedging requirements of SLFRS 9 will not have a significant impact on Group’s financial statements.
Other adjustmentsIn addition to the adjustments described above, on adoption of SLFRS 9, other items of the primary financial statements such as deferred taxes, assets held for sale and liabilities associated with them,will be adjusted as necessary.
SLFRS 15 - Revenue from Contracts with Customers
SLFRS 15 establishes a comprehensive framework for determining whether, how much and when revenue is recognised. It replaces existing revenue recognition guidance, including LKAS 18 Revenue, LKAS 11 Construction Contracts and IFRIC 13 Customer Loyalty Programmes
On or after 1 January 2018 (early adoption permitted)
SLFRS 15 establishes a five-step model to account for revenue arising from contracts with customers.Under SLFRS 15, revenue is recognised at an amount that reflects the consideration to which an entity expects to be entitled in exchange for transferring goods or services to a customer. The Group plans to adopt the new standard on the required effective date using the modified retrospective method. The Group completed diagnostic phase of SLFRS 15 adaptation in 2016/17 financial year with the assistance of external consultants, which was continued with a more detailed analysis completed in 2017/18 financial year.
(a) Sale of goodsUnder SLFRS 15, revenue will be recognised upon satisfaction of performance obligation. The Group expects the revenue recognition to occur at a point in time when control of the asset is transferred to the customer, generally on delivery of the goods.(b) Rendering of servicesCurrently, the Group recognises service revenue by reference to the stage of completion. Under SLFRS 15, the Group shall determine at contract inception whether it satisfies the performance obligation over time or at a point in time. For each performance obligation satisfied overtime, the Group shall recognise the revenue over time by measuring the progress towards complete satisfaction of that performance obligation.(c) Loyalty points programme Under IFRIC 13 Customer Loyalty Programmes, Loyalty points has been identified as a seperately identifiable component of the sales transaction. Under SLFRS 15, the Group will need to allocate a portion of the transaction price to the loyalty programme based on relative standalone selling price instead of the allocation using the fair value of points issued.

0124 JOHN KEELLS PLC
NOTES TO THE FINANCIAL STATEMENTS
Accounting Standard
Summary of the Requirements Effective Date
Possible Impact on Consolidated Financial Statements
SLFRS 16 - Leases
SLFRS 16 sets out the principles for the recognition, measurement, presentation and disclosure of leases and requires lessees to account for all leases under a single on-balance sheet model similar to the accounting for finance leases under LKAS 17. The objective is to ensure that lessees and lessors provide relevant information in a manner that faithfully represents those transactions. This information gives a basis for the users of financial statements to assess the effect that leases have on the financial position.
On or after 1 January 2019 (early adoption permitted)
The Group completed diagnostic phase of SLFRS 16 adaptation in 2017/18 financial year with the assistance of external consultants. In 2018/19, the Group will continue to assess the potential effect of SLFRS 16 on its consolidated financial statements.
The following amendments and improvements are not expected to have a significant impact on the Group’s financial statements during the year ended 31st March 2018. • Income Taxes (Amendments to LKAS 12 ) • Long-term Interests in Associates (Amendments to LKAS 28 ) • Prepayment Features with Negative Compensation (Amendments to SLFRS 9 ) • Insurance Contracts (Amendments to SLFRS 4 ) • Share Based Payment ( Amendments to SLFRS 2) • Disclosure of Interests in Other Entities (Amendments to SLFRS 12)

0125Annual Report 2017/18
THE RIGHT THINKING
7 SEGMENT INFORMATION
Accounting Policy
Reporting segments
Since the individual segments are located close to each other and operate in the same industry environment, catering to clientele from the same geographical location, the need for geographical segmentation does not arise.
Segment information
Segment information has been prepared in conformity with the accounting policies adopted for preparing and presenting the consolidated financial statements of the group.
No operating segments have been aggregated to form the above reportable operating segments. An individual segment manger is determined for each operating segment and the results are regularly reviewed by the Board of Directors. The Board of Directors monitors the operating results of its business units separately for the purpose of making decisions about resource allocation and performance assessment. Segment performance is evaluated based on operating profit or loss which in certain respects, as explained in the operating segments information, is measured differently from operating profit or loss in the consolidated financial statements. However, except for Financial Services segment other segments’ financing activities are managed on a Group basis and are not allocated to operating segment. The Income taxes are managed on Group basis and are not allocated to operating segments.
Transfer prices between operating segments are on an arm’s-length basis in a manner similar to transactions with third parties.
Segment Revenue Produce Broking Warehousing Share Broking Total
GroupFor the Year Ended 31st March 2018 2017 2018 2017 2018 2017 2018 2017 Rs 000's Rs 000's Rs 000's Rs 000’s Rs 000’s Rs 000’s Rs 000’s Rs 000’s
RevenueThird Parties 519,029 423,183 92,828 78,302 192,708 116,039 804,565 617,524 Inter Segment Sales - (5,298) (4,897) - (5,298) (4,897)Revenue 519,029 423,183 87,530 73,405 192,708 116,039 799,267 612,627
Segment Results 284,928 207,326 29,457 19,708 814 (41,440) 315,200 185,594
Finance Income 20,909 45,530 4,224 3,360 22,121 16,548 47,253 65,438 Finance Expenses (79,819) (62,671) (7) (3) (337) (194) (80,164) (62,868)Net Finance Expenses (58,910) (17,141) 4,217 3,357 21,784 16,354 (32,911) 2,570
Changes in fair value of Investment Property 60,350 45,330 - - 60,350 45,330
286,368 235,515 33,674 23,065 22,598 (25,086) 342,639 233,494 Share of results of Associate - - - (13,652) 7,432
Profit Before Tax 328,987 240,926 Tax Expense (70,229) (51,057) (9,527) (3,288) (10,082) 5,539 (89,839) (48,806)Unallocated Tax Expenses - - - (1,385) (791)Total Tax Expenses (70,229) 10,943 (9,527) (4,465) (10,082) (9,011) (91,224) (49,597)Profit After Tax - - - - 237,763 191,329
Segment Assets 4,277,275 4,191,621 412,804 396,565 423,054 1,037,406 5,113,133 5,625,592 Segment Liabilities 1,264,264 1,254,200 98,802 39,909 255,336 894,729 1,618,402 2,188,838

0126 JOHN KEELLS PLC
8 FINANCIAL RISK MANAGEMENT OBJECTIVES AND POLICIES
The Group and Company has loans and other receivables, trade and other receivables and cash and short-term deposits that arise directly from its operations. The Group and Company also holds other financial instruments such as available for sale. The Group’s and Company’s principal financial liabilities, comprise of loans and borrowings, trade and other payables and financial guarantee contracts. The main purpose of these financial liabilities is to finance the Group’s and Company’s operations and to provide guarantees to support its operations. The Group and Company is exposed to market risk, credit risk and liquidity risk.
8.1 Credit risk
Credit risk is the risk that counterparty will not meet its obligations under a financial instrument or customer contract, leading to a financial loss. The Group and Company is exposed to credit risk from its operating activities (primarily trade receivables) and from its financing activities, including deposits with banks and financial institutions and other financial instruments
The Group and Company trades only with recognised, creditworthy third parties. It is the Group’s and Company’s policy that all clients who wish to trade on credit terms are subject to credit verification procedures. In addition, receivable balances are monitored on an ongoing basis and proactive steps taken to reduce the risk..
With respect to credit risk arising from the other financial assets of the Group and Company, such as cash and cash equivalents, available-for-sale financial investments, the exposure to credit risk arises from default of the counterparty. The Group and Company manages its operations to avoid any excessive concentration of counterparty risk and the Group and Company takes all reasonable steps to ensure the counterparties fulfil their obligations.
8.1.1 Risk exposure
The maximum risk positions of financial assets which are generally subject to credit risk are equal to their carrying amounts (without consideration of collateral, if available).Following Table shows the maximum risk positions.
Group 2018 Notes Other non
current financial
assets
Cash in hand and
at bank
Trade andother
receivables
Other investments
Amounts due from
related parties
Total % of allocation
Rs 000's Rs 000's Rs 000’s Rs 000’s Rs 000’s Rs 000’s
Government securities 8.1.1.1 - - - 284,744 - 284,744 14%Loans to executives 8.1.1.2 20,814 - 9,475 - - 30,289 1%Trade receivables 8.1.1.3 - - 1,528,387 - - 1,528,387 74%Loans and Other receivables 8.1.1.4 28,457 - 5,863 - - 34,320 2%Amounts due from related parties 8.1.1.5 - - - - 1,803 1,803 -Cash in hand and at bank 8.1.1.6 - 184,454 - - - 184,454 9%Deposit 3,500 - - - - 3,500 -Total credit risk exposure 52,771 184,454 1,543,725 284,744 1,803 2,067,497 100%
NOTES TO THE FINANCIAL STATEMENTS

0127Annual Report 2017/18
THE RIGHT THINKING
Group 2017 Notes Other non
current financial
assets
Cash in hand and
at bank
Trade andother
receivables
Other investments
Amounts due from
related parties
Total % of allocation
Rs 000's Rs 000's Rs 000’s Rs 000’s Rs 000’s Rs 000’s
Government securities 8.1.1.1 - - - 221,030 - 221,030 8%Loans to executives 8.1.1.2 21,886 - 8,979 - - 30,865 1%Trade receivables 8.1.1.3 - - 2,045,324 - - 2,045,324 79%Loans and Other receivables 8.1.1.4 93,239 - 7,177 - - 100,416 4%Amounts due from related parties 8.1.1.5 - - - - 30,155 30,155 1%Cash in hand and at bank 8.1.1.6 - 175,234 - - - 175,234 7%Deposit 3,500 - - - - 3,500 0%Total credit risk exposure 118,625 175,234 2,061,480 221,030 30,155 2,606,524 100%
Company 2018 Notes Other non
current financial
assets
Cash in hand and
at bank
Trade andother
receivables
Other investments
Amounts due from
related parties
Total % of allocation
Rs 000's Rs 000's Rs 000’s Rs 000’s Rs 000’s Rs 000’s
Loans to executives 8.1.1.2 15,544 - 6,375 - - 21,919 1%Trade receivables 8.1.1.3 - - 1,407,237 - - 1,407,237 87%Loans and Other receivables 8.1.1.4 28,457 - 2,486 - - 30,943 2%Amounts due from related parties 8.1.1.5 - - - - 1,871 1,871 -Cash in hand and at bank 8.1.1.6 - 153,394 - - - 153,394 10%Total credit risk exposure 44,001 153,394 1,416,098 - 1,871 1,615,364 100%
Company 2017 Notes Other non
current financial
assets
Cash in hand and
at bank
Trade andother
receivables
Other investments
Amounts due from
related parties
Total % of allocation
Rs 000's Rs 000's Rs 000’s Rs 000’s Rs 000’s Rs 000’s
Loans to executives 8.1.1.2 14,931 - 6,084 - - 21,015 1%Trade receivables 8.1.1.3 - - 1,258,647 - - 1,258,647 83%Loans and Other receivables 8.1.1.4 93,239 - 3,765 - - 97,004 6%Amounts due from related parties 8.1.1.5 - - - - 4,314 4,314 -Cash in hand and at bank 8.1.1.6 - 158,633 - - - 158,633 10%Total credit risk exposure 108,170 158,633 1,268,496 - 4,314 1,539,613 100%
8.1.1.1 Government securities
As at March 2018 as shown in table above 14 percent (2017 - 8 percent) of debt securities comprises investment in government securities consist of treasury bills and reverse repo investments.
Government securities are usually referred to as risk free due to sovereign nature of the instrument.
8.1.1.2. Loans to executives
Loans to executive portfolio is largely made up of vehicle loans which are given to staff at assistant manager level and above. The respective business units have obtained the necessary Power of Attorney/promissory notes as collateral for the loans granted.
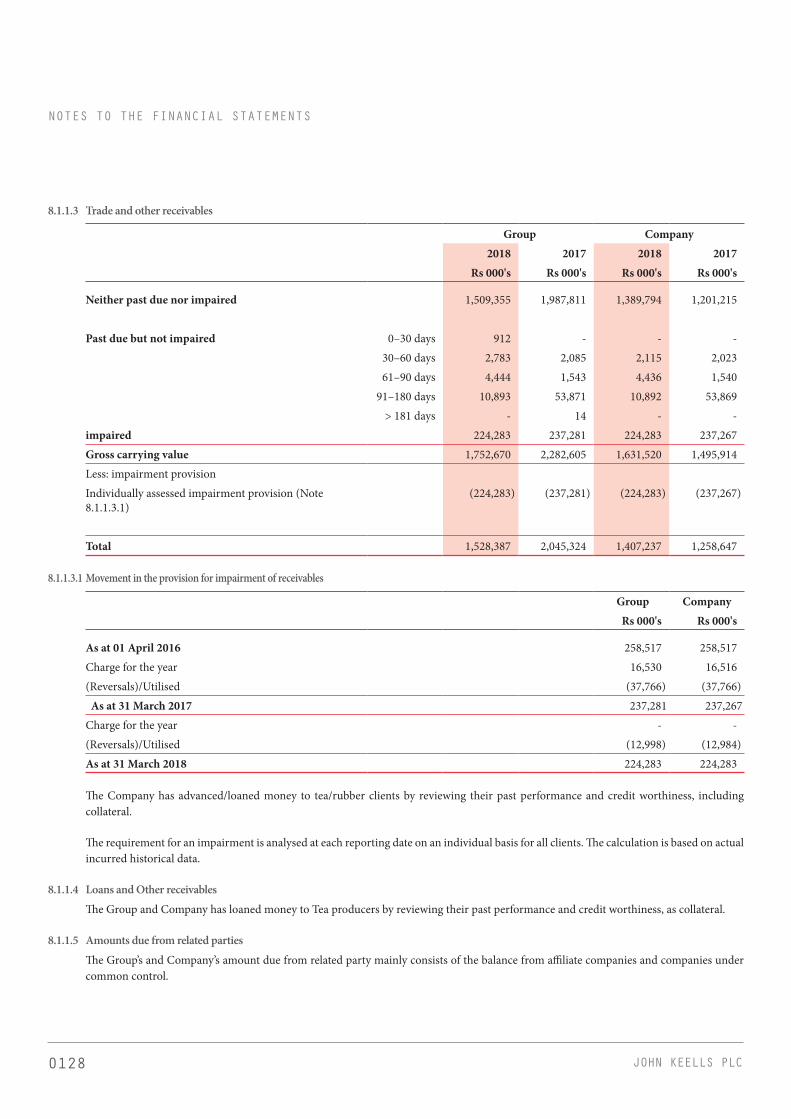
0128 JOHN KEELLS PLC
8.1.1.3 Trade and other receivables
Group Company2018 2017 2018 2017
Rs 000's Rs 000's Rs 000's Rs 000's
Neither past due nor impaired 1,509,355 1,987,811 1,389,794 1,201,215
Past due but not impaired 0–30 days 912 - - - 30–60 days 2,783 2,085 2,115 2,023 61–90 days 4,444 1,543 4,436 1,540
91–180 days 10,893 53,871 10,892 53,869 > 181 days - 14 - -
impaired 224,283 237,281 224,283 237,267 Gross carrying value 1,752,670 2,282,605 1,631,520 1,495,914 Less: impairment provision Individually assessed impairment provision (Note 8.1.1.3.1)
(224,283) (237,281) (224,283) (237,267)
Total 1,528,387 2,045,324 1,407,237 1,258,647
8.1.1.3.1 Movement in the provision for impairment of receivables
Group Company Rs 000's Rs 000's
As at 01 April 2016 258,517 258,517 Charge for the year 16,530 16,516 (Reversals)/Utilised (37,766) (37,766)
As at 31 March 2017 237,281 237,267 Charge for the year - - (Reversals)/Utilised (12,998) (12,984)As at 31 March 2018 224,283 224,283
The Company has advanced/loaned money to tea/rubber clients by reviewing their past performance and credit worthiness, including collateral.
The requirement for an impairment is analysed at each reporting date on an individual basis for all clients. The calculation is based on actual incurred historical data.
8.1.1.4 Loans and Other receivables
The Group and Company has loaned money to Tea producers by reviewing their past performance and credit worthiness, as collateral.
8.1.1.5 Amounts due from related parties
The Group’s and Company’s amount due from related party mainly consists of the balance from affiliate companies and companies under common control.
NOTES TO THE FINANCIAL STATEMENTS

0129Annual Report 2017/18
THE RIGHT THINKING
8.1.1.6 Credit risk relating to cash and cash equivalents
In order to mitigate the concentration, settlement and operational risks related to cash and cash equivalents, the Group consciously manages the exposure to a single counterparty taking into consideration, where relevant, the rating or financial standing of the counterparty, where the position is reviewed as and when required, the duration of the exposure in managing such exposures and the nature of the transaction and agreement governing the exposure.
8.2 Liquidity Risk
The Group’s & Company’s policy is to hold cash and undrawn committed facilities at a level sufficient to ensure that the Company has available funds to meet its medium term capital and funding obligations, including organic growth and acquisition activities, and to meet any unforeseen obligations and opportunities. The Company holds cash and undrawn committed facilities to enable the Company to manage its liquidity risk.
The Group & Company monitors its risk to a shortage of funds using a daily cash management process. This process considers the maturity of both the Company’s financial investments and financial assets (e.g. accounts receivable, other financial assets) and projected cash flows from operations.
The Group’s & Company ’s objective is to maintain a balance between continuity of funding and flexibility through the use of multiple sources of funding including bank loans, loan notes, & overdrafts.
8.2.1 Net (debt)/cash
Group Company2018 2017 2018 2017
Rs 000's Rs 000's Rs 000's Rs 000's
Cash in hand and at bank 184,454 175,234 153,394 158,633 Liquid Assets 184,454 175,234 153,394 158,633 Bank Overdrafts (712,112) (673,577) (688,046) (672,367)Liquid Liabilities (712,112) (673,577) (688,046) (672,367)(Net debt) Cash (527,658) (498,343) (534,652) (513,734)
8.2.2 Liquidity risk management
The mixed approach combines elements of the cash flow matching approach and the liquid assets approach. The business units attempts to match cash outflows in each time bucket against a combination of contractual cash inflows plus inflows that can be generated through the sale of assets, repurchase agreement or other secured borrowing.
Maturity analysis
The table below summarises the maturity profile of the Company’s financial liabilities based on contractual undiscounted payments.
Group As at 31 st March 2018 2017
Less than 3Months
3 to 12 Months
More than 12months
Total Less than 3Months
3 to 12 Months
More than 12months
Total
Rs 000's Rs 000's Rs 000's Rs 000’s Rs 000’s Rs 000’s Rs 000’s Rs 000’s
Trade and Other Payables 691,233 - - 691,233 1,379,257 - - 1,379,257 Amounts due to Related Parties 3,552 - - 3,552 3,153 - - 3,153 Bank Overdrafts 712,112 - - 712,112 673,577 - - 673,577 Total 1,406,897 - - 1,406,897 2,055,987 - - 2,055,987
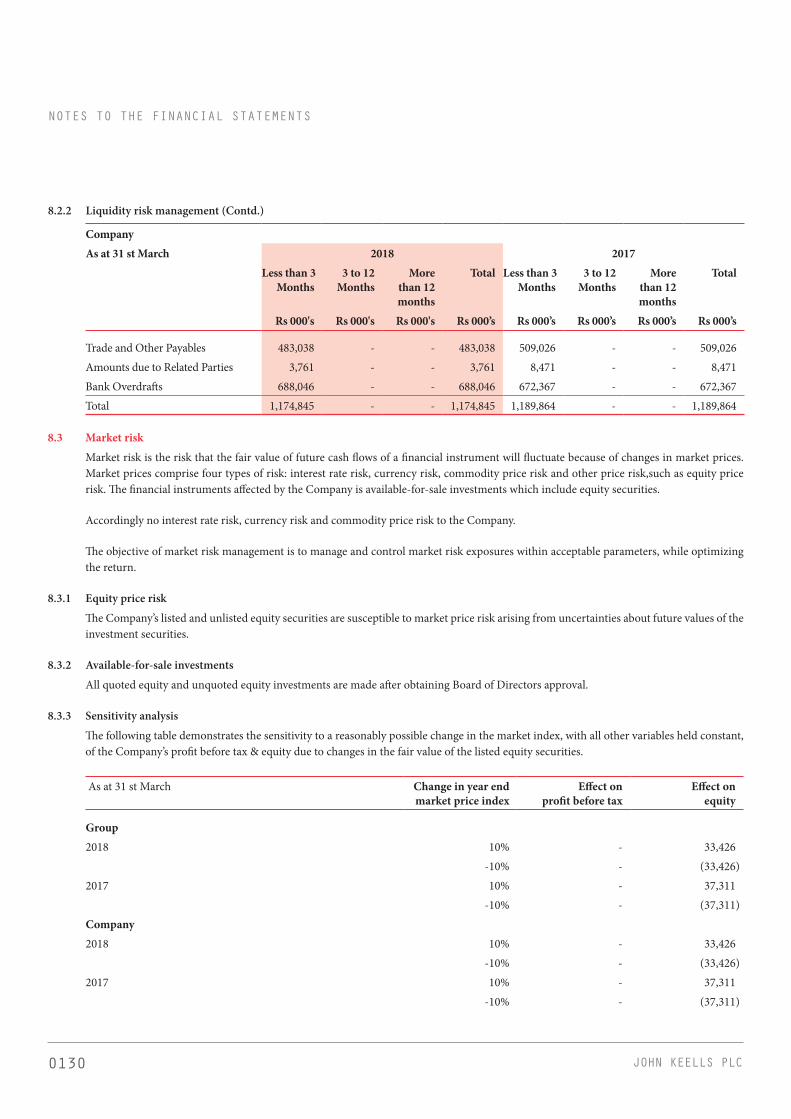
0130 JOHN KEELLS PLC
8.2.2 Liquidity risk management (Contd.)
Company As at 31 st March 2018 2017
Less than 3Months
3 to 12 Months
More than 12months
Total Less than 3Months
3 to 12 Months
More than 12months
Total
Rs 000's Rs 000's Rs 000's Rs 000’s Rs 000’s Rs 000’s Rs 000’s Rs 000’s
Trade and Other Payables 483,038 - - 483,038 509,026 - - 509,026 Amounts due to Related Parties 3,761 - - 3,761 8,471 - - 8,471 Bank Overdrafts 688,046 - - 688,046 672,367 - - 672,367 Total 1,174,845 - - 1,174,845 1,189,864 - - 1,189,864
8.3 Market risk
Market risk is the risk that the fair value of future cash flows of a financial instrument will fluctuate because of changes in market prices. Market prices comprise four types of risk: interest rate risk, currency risk, commodity price risk and other price risk,such as equity price risk. The financial instruments affected by the Company is available-for-sale investments which include equity securities.
Accordingly no interest rate risk, currency risk and commodity price risk to the Company.
The objective of market risk management is to manage and control market risk exposures within acceptable parameters, while optimizing the return.
8.3.1 Equity price risk
The Company’s listed and unlisted equity securities are susceptible to market price risk arising from uncertainties about future values of the investment securities.
8.3.2 Available-for-sale investments
All quoted equity and unquoted equity investments are made after obtaining Board of Directors approval.
8.3.3 Sensitivity analysis
The following table demonstrates the sensitivity to a reasonably possible change in the market index, with all other variables held constant, of the Company’s profit before tax & equity due to changes in the fair value of the listed equity securities.
As at 31 st March Change in year end market price index
Effect on profit before tax
Effect on equity
Group2018 10% - 33,426
-10% - (33,426)2017 10% - 37,311
-10% - (37,311)Company2018 10% - 33,426
-10% - (33,426)2017 10% - 37,311
-10% - (37,311)
NOTES TO THE FINANCIAL STATEMENTS
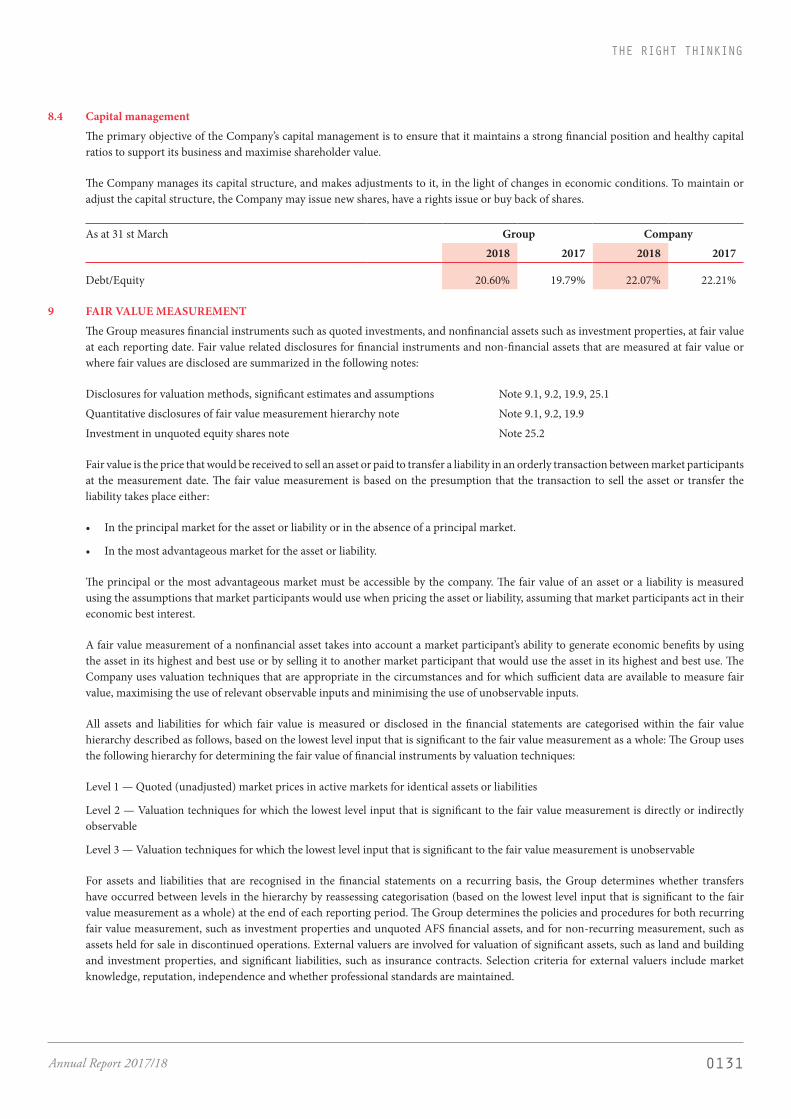
0131Annual Report 2017/18
THE RIGHT THINKING
8.4 Capital management
The primary objective of the Company’s capital management is to ensure that it maintains a strong financial position and healthy capital ratios to support its business and maximise shareholder value.
The Company manages its capital structure, and makes adjustments to it, in the light of changes in economic conditions. To maintain or adjust the capital structure, the Company may issue new shares, have a rights issue or buy back of shares.
As at 31 st March Group Company2018 2017 2018 2017
Debt/Equity 20.60% 19.79% 22.07% 22.21%
9 FAIR VALUE MEASUREMENT
The Group measures financial instruments such as quoted investments, and nonfinancial assets such as investment properties, at fair value at each reporting date. Fair value related disclosures for financial instruments and non-financial assets that are measured at fair value or where fair values are disclosed are summarized in the following notes:
Disclosures for valuation methods, significant estimates and assumptions Note 9.1, 9.2, 19.9, 25.1
Quantitative disclosures of fair value measurement hierarchy note Note 9.1, 9.2, 19.9
Investment in unquoted equity shares note Note 25.2
Fair value is the price that would be received to sell an asset or paid to transfer a liability in an orderly transaction between market participants at the measurement date. The fair value measurement is based on the presumption that the transaction to sell the asset or transfer the liability takes place either:
• In the principal market for the asset or liability or in the absence of a principal market.
• In the most advantageous market for the asset or liability.
The principal or the most advantageous market must be accessible by the company. The fair value of an asset or a liability is measured using the assumptions that market participants would use when pricing the asset or liability, assuming that market participants act in their economic best interest.
A fair value measurement of a nonfinancial asset takes into account a market participant’s ability to generate economic benefits by using the asset in its highest and best use or by selling it to another market participant that would use the asset in its highest and best use. The Company uses valuation techniques that are appropriate in the circumstances and for which sufficient data are available to measure fair value, maximising the use of relevant observable inputs and minimising the use of unobservable inputs.
All assets and liabilities for which fair value is measured or disclosed in the financial statements are categorised within the fair value hierarchy described as follows, based on the lowest level input that is significant to the fair value measurement as a whole: The Group uses the following hierarchy for determining the fair value of financial instruments by valuation techniques:
Level 1 — Quoted (unadjusted) market prices in active markets for identical assets or liabilities
Level 2 — Valuation techniques for which the lowest level input that is significant to the fair value measurement is directly or indirectly observable
Level 3 — Valuation techniques for which the lowest level input that is significant to the fair value measurement is unobservable
For assets and liabilities that are recognised in the financial statements on a recurring basis, the Group determines whether transfers have occurred between levels in the hierarchy by reassessing categorisation (based on the lowest level input that is significant to the fair value measurement as a whole) at the end of each reporting period. The Group determines the policies and procedures for both recurring fair value measurement, such as investment properties and unquoted AFS financial assets, and for non-recurring measurement, such as assets held for sale in discontinued operations. External valuers are involved for valuation of significant assets, such as land and building and investment properties, and significant liabilities, such as insurance contracts. Selection criteria for external valuers include market knowledge, reputation, independence and whether professional standards are maintained.
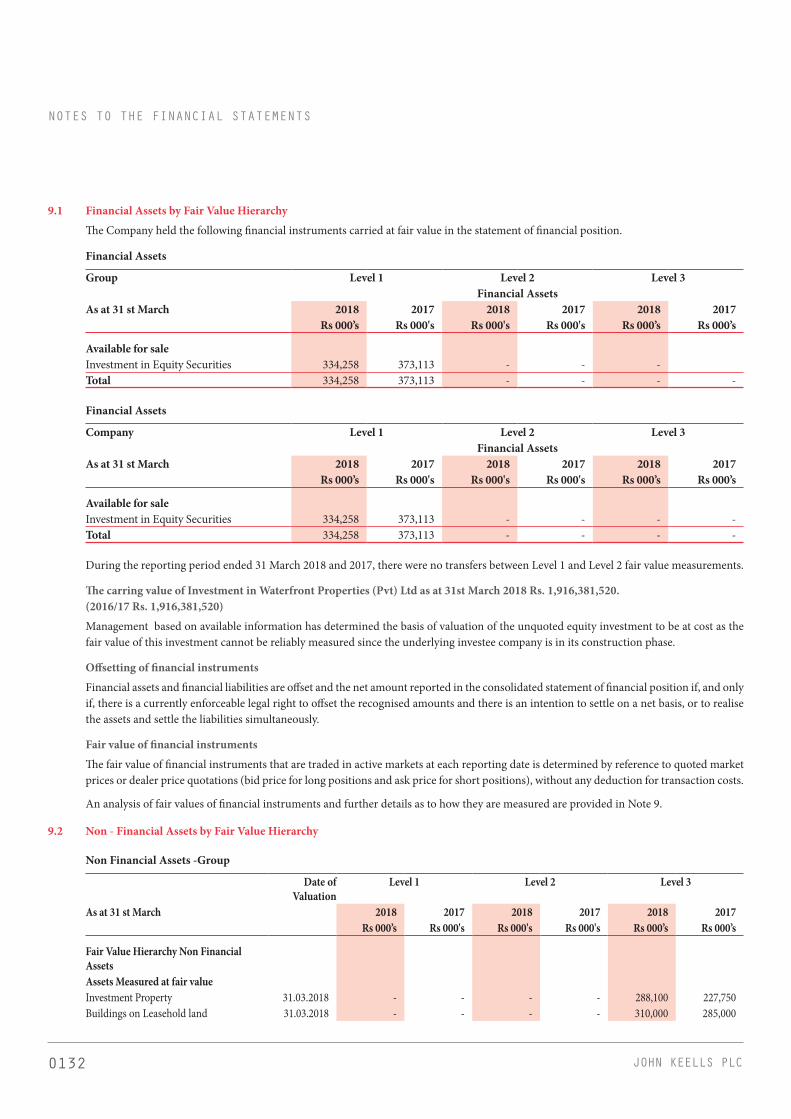
0132 JOHN KEELLS PLC
9.1 Financial Assets by Fair Value Hierarchy
The Company held the following financial instruments carried at fair value in the statement of financial position.
Financial Assets
Group Level 1 Level 2 Level 3Financial Assets
As at 31 st March 2018 2017 2018 2017 2018 2017 Rs 000’s Rs 000's Rs 000's Rs 000's Rs 000’s Rs 000’s
Available for saleInvestment in Equity Securities 334,258 373,113 - - - Total 334,258 373,113 - - - -
Financial Assets
Company Level 1 Level 2 Level 3Financial Assets
As at 31 st March 2018 2017 2018 2017 2018 2017 Rs 000’s Rs 000's Rs 000's Rs 000's Rs 000’s Rs 000’s
Available for saleInvestment in Equity Securities 334,258 373,113 - - - - Total 334,258 373,113 - - - -
During the reporting period ended 31 March 2018 and 2017, there were no transfers between Level 1 and Level 2 fair value measurements.
The carring value of Investment in Waterfront Properties (Pvt) Ltd as at 31st March 2018 Rs. 1,916,381,520. (2016/17 Rs. 1,916,381,520)
Management based on available information has determined the basis of valuation of the unquoted equity investment to be at cost as the fair value of this investment cannot be reliably measured since the underlying investee company is in its construction phase.
Offsetting of financial instruments
Financial assets and financial liabilities are offset and the net amount reported in the consolidated statement of financial position if, and only if, there is a currently enforceable legal right to offset the recognised amounts and there is an intention to settle on a net basis, or to realise the assets and settle the liabilities simultaneously.
Fair value of financial instruments
The fair value of financial instruments that are traded in active markets at each reporting date is determined by reference to quoted market prices or dealer price quotations (bid price for long positions and ask price for short positions), without any deduction for transaction costs.
An analysis of fair values of financial instruments and further details as to how they are measured are provided in Note 9.
9.2 Non - Financial Assets by Fair Value Hierarchy
Non Financial Assets -Group
Date of Valuation
Level 1 Level 2 Level 3
As at 31 st March 2018 2017 2018 2017 2018 2017 Rs 000’s Rs 000's Rs 000's Rs 000's Rs 000’s Rs 000’s
Fair Value Hierarchy Non Financial AssetsAssets Measured at fair valueInvestment Property 31.03.2018 - - - - 288,100 227,750 Buildings on Leasehold land 31.03.2018 - - - - 310,000 285,000
NOTES TO THE FINANCIAL STATEMENTS
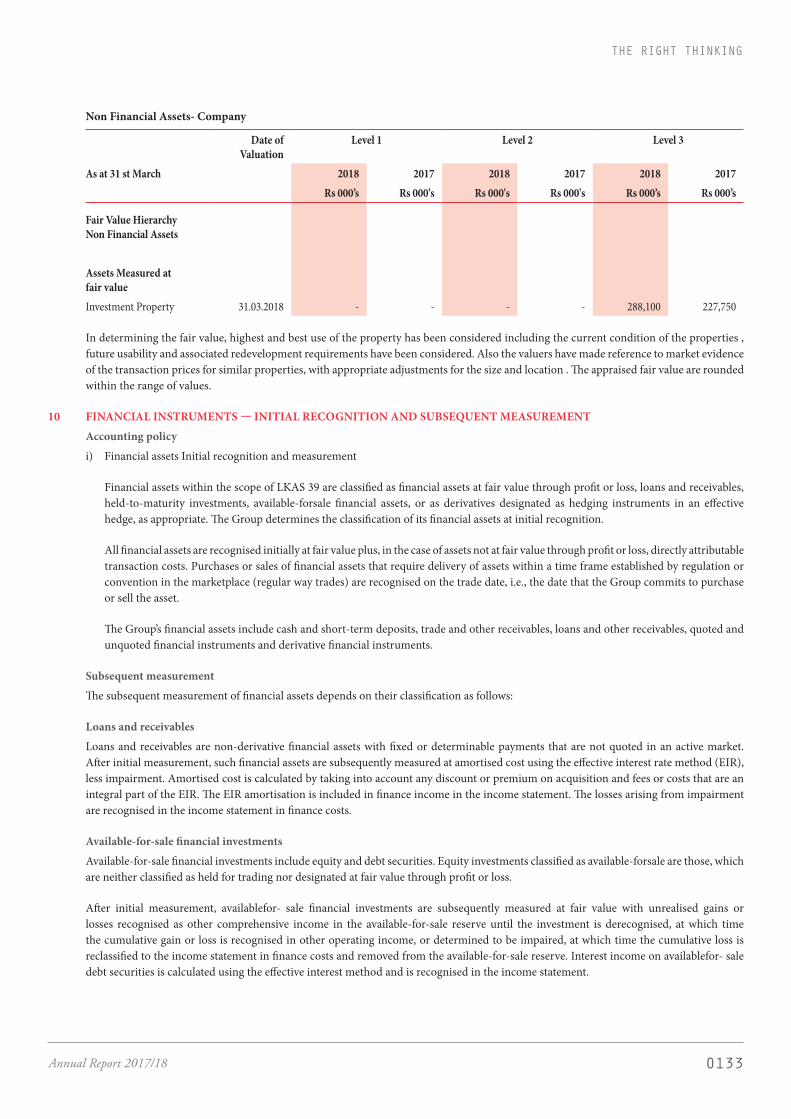
0133Annual Report 2017/18
THE RIGHT THINKING
Non Financial Assets- Company
Date of Valuation
Level 1 Level 2 Level 3
As at 31 st March 2018 2017 2018 2017 2018 2017 Rs 000’s Rs 000's Rs 000's Rs 000's Rs 000’s Rs 000’s
Fair Value Hierarchy Non Financial Assets
Assets Measured at fair valueInvestment Property 31.03.2018 - - - - 288,100 227,750
In determining the fair value, highest and best use of the property has been considered including the current condition of the properties , future usability and associated redevelopment requirements have been considered. Also the valuers have made reference to market evidence of the transaction prices for similar properties, with appropriate adjustments for the size and location . The appraised fair value are rounded within the range of values.
10 FINANCIAL INSTRUMENTS — INITIAL RECOGNITION AND SUBSEQUENT MEASUREMENT
Accounting policy
i) Financial assets Initial recognition and measurement
Financial assets within the scope of LKAS 39 are classified as financial assets at fair value through profit or loss, loans and receivables, held-to-maturity investments, available-forsale financial assets, or as derivatives designated as hedging instruments in an effective hedge, as appropriate. The Group determines the classification of its financial assets at initial recognition.
All financial assets are recognised initially at fair value plus, in the case of assets not at fair value through profit or loss, directly attributable transaction costs. Purchases or sales of financial assets that require delivery of assets within a time frame established by regulation or convention in the marketplace (regular way trades) are recognised on the trade date, i.e., the date that the Group commits to purchase or sell the asset.
The Group’s financial assets include cash and short-term deposits, trade and other receivables, loans and other receivables, quoted and unquoted financial instruments and derivative financial instruments.
Subsequent measurement
The subsequent measurement of financial assets depends on their classification as follows:
Loans and receivables
Loans and receivables are non-derivative financial assets with fixed or determinable payments that are not quoted in an active market. After initial measurement, such financial assets are subsequently measured at amortised cost using the effective interest rate method (EIR), less impairment. Amortised cost is calculated by taking into account any discount or premium on acquisition and fees or costs that are an integral part of the EIR. The EIR amortisation is included in finance income in the income statement. The losses arising from impairment are recognised in the income statement in finance costs.
Available-for-sale financial investments
Available-for-sale financial investments include equity and debt securities. Equity investments classified as available-forsale are those, which are neither classified as held for trading nor designated at fair value through profit or loss.
After initial measurement, availablefor- sale financial investments are subsequently measured at fair value with unrealised gains or losses recognised as other comprehensive income in the available-for-sale reserve until the investment is derecognised, at which time the cumulative gain or loss is recognised in other operating income, or determined to be impaired, at which time the cumulative loss is reclassified to the income statement in finance costs and removed from the available-for-sale reserve. Interest income on availablefor- sale debt securities is calculated using the effective interest method and is recognised in the income statement.

0134 JOHN KEELLS PLC
The Group evaluates its available-for-sale financial assets to determine whether the ability and intention to sell them in the near term is still appropriate. When the Group is unable to trade these financial assets due to inactive markets and management’s intention to do so significantly changes in the foreseeable future, the Group may elect to reclassify these financial assets in rare circumstances. Reclassification to loans and receivables is permitted when the financial assets meet the definition of loans and receivables and the Group has the intent and ability to hold these assets for the foreseeable future or until maturity. Reclassification to the held-to-maturity category is permitted only when the entity has the ability and intention to hold the financial asset accordingly.
For a financial asset reclassified out of the available-for-sale category, any previous gain or loss on that asset that has been recognised in equity is amortised to profit or loss over the remaining life of the investment using the EIR. Any difference between the new amortised cost and the expected cash flows is also amortised over the remaining life of the asset using the EIR. If the asset is subsequently determined to be impaired, then the amount recorded in equity is reclassified to the income statement.
i) Derecognition
A financial asset (or, where applicable a part of a financial asset or part of a Group of similar financial assets) is
derecognised when:
• The rights to receive cash flows from the asset have expired
• The Group has transferred its rights to receive cash flows from the asset or has assumed an obligation to pay the received cash flows in full without material delay to a third party under a ‘pass-through’ arrangement; and either (a) the Group has transferred substantially all the risks and rewards of the asset, or (b) the Group has neither transferred nor retained substantially all the risks and rewards of the asset, but has transferred control of the asset.
When the Group has transferred its rights to receive cash flows from an asset or has entered into a pass-through arrangement, and has neither transferred nor retained substantially all of the risks and rewards of the asset nor transferred control of it, the asset is recognised to the extent of the Group’s continuing involvement in it.
In that case, the Group also recognises an associated liability. The transferred asset and the associated liability are measured on a basis that reflects the rights and obligations that the Group has retained.
Continuing involvement that takes the form of a guarantee over the transferred asset is measured at the lower of the original carrying amount of the asset and the maximum amount of consideration that the Group could be required to repay.
ii) Impairment of financial assets
Accounting policy
The Group assesses at each reporting date whether there is any objective evidence that a financial asset or a Group of financial assets is impaired. A financial asset or a Group of financial assets is deemed to be impaired if, and only if, there is objective evidence of impairment as a result of one or more events that has occurred after the initial recognition of the asset (an incurred ‘loss event’) and that loss event has an impact on the estimated future cash flows of the financial asset or the Group of financial assets that can be reliably estimated.
Evidence of impairment may include indications that the debtors or a Group of debtors is experiencing significant financial difficulty, default or delinquency in interest or principal payments, the probability that they will enter bankruptcy or other financial reorganisation and where observable data indicate that there is a measurable decrease in the estimated future cash flows, such as changes in arrears or economic conditions that correlate with Financial assets carried at amortised cost.
For financial assets carried at amortised cost, the Group first assesses whether objective evidence of impairment exists individually for financial assets that are individually significant, or collectively for financial assets that are not individually significant. If the Group determines that no objective evidence of impairment exists for an individually assessed financial asset, whether significant or not, it includes the asset in a Group of financial assets with similar credit risk characteristics and collectively assesses them for impairment. Assets that are individually assessed for impairment and for which an impairment loss is, or continues to be, recognised are not included in a collective assessment of impairment.
NOTES TO THE FINANCIAL STATEMENTS

0135Annual Report 2017/18
THE RIGHT THINKING
If there is objective evidence that an impairment loss has been incurred, the amount of the loss is measured as the difference between the assets carrying amount and the present value of estimated future cash flows (excluding future expected credit losses that have not yet been incurred). The present value of the estimated future cash flows is discounted at the financial asset’s original effective interest rate. If a loan has a variable interest rate, the discount rate for measuring any impairment loss is the current effective interest rate.
The carrying amount of the asset is reduced through the use of an allowance account and the amount of the loss is recognised in the income statement. Interest income continues to be accrued on the reduced carrying amount and is accrued using the rate of interest used to discount the future cash flows for the loss. The interest income is recorded If, in a subsequent year, the amount of the estimated impairment loss increases or decreases because of an event occurring after the impairment was recognised, the previously recognised impairment loss is increased or reduced by adjusting the allowance account. If a future write-off is later recovered, the recovery is credited to finance costs in the income statement.
Available-for-sale financial investments
For available-for-sale financial investments, the Group assesses at each reporting date whether there is objective evidence that an investment or a Group of investments is impaired.
In the case of equity investments classified as available-for-sale, objective evidence would include a significant or prolonged decline in the fair value of the investment below its cost. ‘Significant’ is evaluated against the original cost of the investment and ‘prolonged’ against the period in which the fair value has been below its original cost. Where there is evidence of impairment, the cumulative loss measured as the difference between the acquisition cost and the current fair value, less any impairment loss on that investment previously recognised in the income statement is removed from other comprehensive income and recognised in the income statement. Impairment losses on equity investments are not reversed through the income statement; increases in their fair value after impairments are recognised directly in other comprehensive income.
iii) Financial liabilities
Accounting policy
Initial recognition and measurement
Financial liabilities within the scope of LKAS 39 are classified as financial liabilities at fair value through profit or loss, loans and borrowings, or as derivatives designated as hedging instruments in an effective hedge, as appropriate. The Group determines the classification of its financial liabilities at initial recognition. All financial liabilities are recognised initially at fair value and, in the case of loans and borrowings, carried at amortised cost. This includes directly attributable transaction costs.
The Group’s financial liabilities include trade and other payables, bank overdrafts, loans and borrowings.
Subsequent measurement
The measurement of financial liabilities depends on their classification as follows:
Loans and borrowings
After initial recognition, interest bearing loans and borrowings are subsequently measured at amortised cost using the effective interest rate method. Gains and losses are recognised in the income statement when the liabilities are derecognised as well as through the effective interest rate method (EIR) amortisation process. Amortised cost is calculated by taking into account any discount or premium on acquisition and fees or costs that are an integral part of the EIR. The EIR amortisation is included in finance costs in the income statement.
Derecognition
A financial liability is derecognised when the obligation under the liability is discharged or cancelled or expires. When an existing financial liability is replaced by another from the same lender on substantially different terms, or the terms of an existing liability are substantially modified, such an exchange or modification is treated as a derecognition of the original liability and the recognition of a new liability, and the difference in the respective carrying amounts is recognised in the income statement.
iv) Offsetting of financial instruments
Financial assets and financial liabilities are offset and the net amount reported in the consolidated statement of financial position if, and only if, there is a currently enforceable legal right to offset the recognised amounts and there is an intention to settle on a net basis, or to realise the assets and settle the liabilities simultaneously.

0136 JOHN KEELLS PLC
v) Fair value of financial instruments
The fair value of financial instruments that are traded in active markets at each reporting date is determined by reference to quoted market prices or dealer price quotations (bid price for long positions and ask price for short positions), without any deduction for transaction costs. For financial instruments not traded in an active market, the fair value is determined using appropriate valuation techniques. Such techniques may include using recent arm’s length market transactions; reference to the current fair value of another instrument that is substantially the same; a discounted cash flow analysis or other valuation models. An analysis of fair values of financial instruments and further details as to how they are measured are provided in Note 9.
10 FINANCIAL INSTRUMENTS
10.1 Financial Assets and Liabilities by Categories
Financial assets and liabilities in the tables below are split into categories in accordance with LKAS 39.
Loans and Receivables Available for sale TotalGroup Financial AssetsAs at 31 st March 2018 2017 2018 2017 2018 2017 Rs 000’s Rs 000's Rs 000's Rs 000's Rs 000’s Rs 000’s
Financial Instruments in Non Current AssetsOther Non - Current Financial Assets 52,772 118,624 2,250,640 2,289,495 2,303,411 2,408,119
Financial Instruments in Current AssetsTrade & Other Receivables 1,543,725 2,061,480 - - 1,543,725 2,061,480 Amount Due from Related Parties 1,803 30,155 - - 1,803 30,155 Cash in Hand and at Bank 184,454 175,234 - - 184,454 175,234 Short Term Investments 284,744 221,030 - 284,744 221,030 Total 2,067,498 2,606,523 2,250,640 2,289,495 4,318,137 4,896,018
Loans and Receivables Available for sale TotalCompany Financial AssetsAs at 31 st March 2018 2017 2018 2017 2018 2017 Rs 000’s Rs 000's Rs 000's Rs 000's Rs 000’s Rs 000’s
Financial Instruments in Non Current AssetsOther Non - Current Financial Assets 44,002 108,170 2,250,640 2,289,495 2,294,642 2,397,665
Financial Instruments in Current AssetsTrade & Other Receivables 1,416,099 1,268,496 - - 1,416,099 1,268,496 Amount Due from Related Parties 1,871 4,314 - - 1,871 4,314 Cash in Hand and at Bank 153,394 158,633 - - 153,394 158,633
Total 1,615,366 1,539,613 2,250,640 2,289,495 3,866,006 3,829,108
NOTES TO THE FINANCIAL STATEMENTS

0137Annual Report 2017/18
THE RIGHT THINKING
10.2 Financial Liabilities by Categories
Group Financial liabilities Totalmeasured at amortised cost
As at 31 st March 2018 2017 2018 2017 Rs 000's Rs 000's Rs 000’s Rs 000’s
Financial Instruments in Current Liabilities Trade and Other Payables 691,233 1,379,257 691,233 1,379,257 Amount Due from Related Parties 3,552 3,153 3,552 3,153 Bank Overdrafts 712,112 673,577 712,112 673,577
Total 1,406,897 2,055,987 1,406,897 2,055,987
Company Financial liabilities Totalmeasured at amortised cost
As at 31 st March 2018 2017 2018 2017 Rs 000's Rs 000's Rs 000’s Rs 000’s
Financial Instruments in Current Liabilities Trade and Other Payables 483,038 509,026 483,038 509,026 Amount Due from Related Parties 3,761 8,471 3,761 8,471 Bank Overdrafts 688,046 672,367 688,046 672,367
Total 1,174,845 1,189,864 1,174,845 1,189,864
The management assessed that cash and short-term deposits, trade and other receivables, amounts due from related parties, trade and other payables, amounts due to related parties,bank overdraft, short term borrowings and other current financial liabilities approximately their carrying amounts largely due to the short term maturities of these instruments.
The fair value of the financial assets and liabilities is included at the amount at which the instrument could be exchanged in a current transaction between knowledgeable and willing parties, other than in a forced or liquidation sale.
The following methods and assumptions were used to estimate the fair values:
Fair value of quoted equities based on price quotations in an active market at the reporting date.
The fair value of unquoted instruments, loans from banks and other financial liabilities, obligations under finance leases, as well as other non current financial liabilities is estimated by discounting future cash flows using rates currently available for debt on similar terms, credit risk and remaining maturities.

0138 JOHN KEELLS PLC
11 REVENUE RECOGNITION
Accounting policy
Revenue is recognised to the extent that it is probable that the economic benefits will flow to the Group, and the revenue and associated costs incurred or to be incurred can be reliably measured. Revenue is measured at the fair value of the consideration received or receivable, net of trade discounts and value added taxes, after eliminating sales within the Group.
The following specific criteria are used for recognition of revenue:
Rendering of services
Revenue from rendering of services (brokerage income) is recognised in the accounting period in the services are rendered or performed.
Turnover based taxes
Turnover based taxes include Value added tax, Economic service charge and Nation building tax. Companies in the Group pay such taxes in accordance with the respective statutes.
11.1 Revenue
Group CompanyFor the year ended 31st March 2018 2017 2018 2017 Rs 000's Rs 000's Rs 000’s Rs 000’s
RevenueRevenue 799,267 612,627 519,029 423,183 Revenue 799,267 612,627 519,029 423,183
12 DIVIDEND INCOME
Accounting policy
Dividend income is recognised when the Company’s right to receive the payment is established.
Group CompanyFor the year ended 31st March 2018 2017 2018 2017 Rs 000's Rs 000's Rs 000’s Rs 000’s
Income from investments in related parties - - 25,902 4,411 - - 25,902 4,411
13 GAINS AND LOSSES
Accounting policy
Net gains and losses of a revenue nature arising from the disposal of property, plant and equipment and other non-current assets, including investments, are accounted for in the income statement, after deducting from the proceeds on disposal, the carrying amount of such assets and the related selling expenses.
Gains and losses arising from activities incidental to the main revenue generating activities and those arising from a group of similar transactions, which are not material are aggregated, reported and presented on a net basis.
NOTES TO THE FINANCIAL STATEMENTS
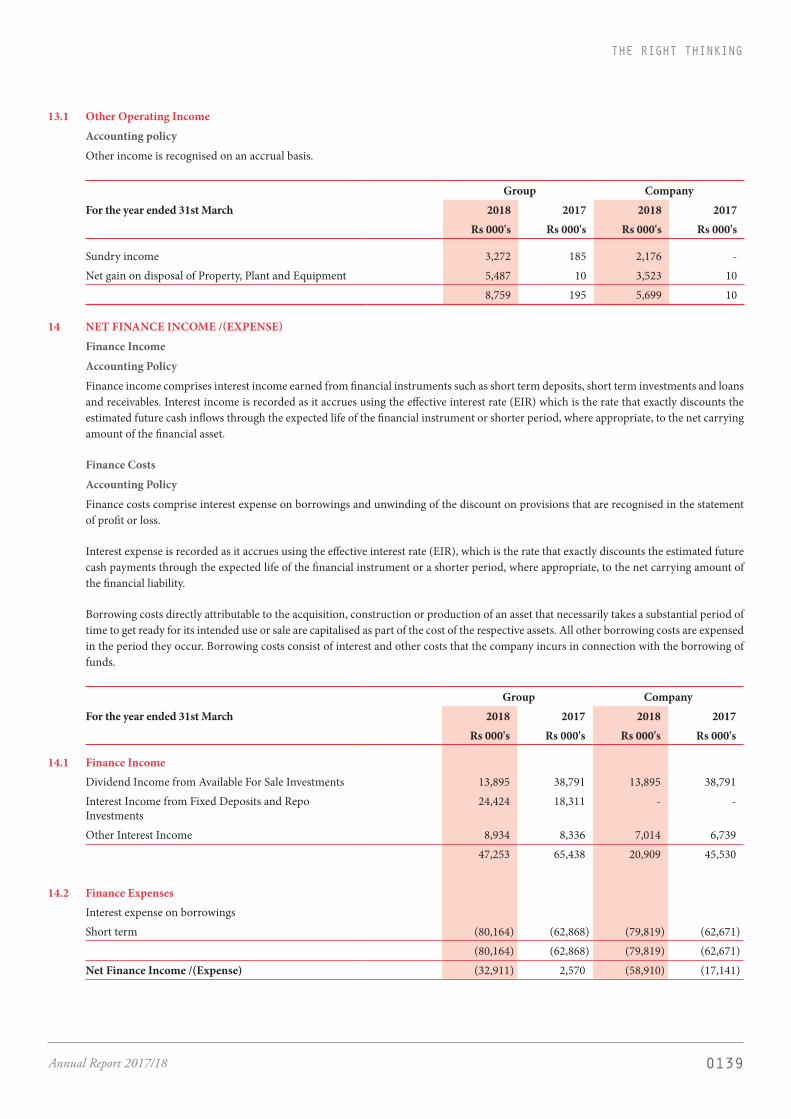
0139Annual Report 2017/18
THE RIGHT THINKING
13.1 Other Operating Income
Accounting policy
Other income is recognised on an accrual basis.
Group CompanyFor the year ended 31st March 2018 2017 2018 2017 Rs 000's Rs 000's Rs 000's Rs 000's
Sundry income 3,272 185 2,176 - Net gain on disposal of Property, Plant and Equipment 5,487 10 3,523 10
8,759 195 5,699 10
14 NET FINANCE INCOME /(EXPENSE)
Finance Income
Accounting Policy
Finance income comprises interest income earned from financial instruments such as short term deposits, short term investments and loans and receivables. Interest income is recorded as it accrues using the effective interest rate (EIR) which is the rate that exactly discounts the estimated future cash inflows through the expected life of the financial instrument or shorter period, where appropriate, to the net carrying amount of the financial asset.
Finance Costs
Accounting Policy
Finance costs comprise interest expense on borrowings and unwinding of the discount on provisions that are recognised in the statement of profit or loss.
Interest expense is recorded as it accrues using the effective interest rate (EIR), which is the rate that exactly discounts the estimated future cash payments through the expected life of the financial instrument or a shorter period, where appropriate, to the net carrying amount of the financial liability.
Borrowing costs directly attributable to the acquisition, construction or production of an asset that necessarily takes a substantial period of time to get ready for its intended use or sale are capitalised as part of the cost of the respective assets. All other borrowing costs are expensed in the period they occur. Borrowing costs consist of interest and other costs that the company incurs in connection with the borrowing of funds.
Group CompanyFor the year ended 31st March 2018 2017 2018 2017 Rs 000's Rs 000's Rs 000's Rs 000's
14.1 Finance IncomeDividend Income from Available For Sale Investments 13,895 38,791 13,895 38,791 Interest Income from Fixed Deposits and Repo Investments
24,424 18,311 - -
Other Interest Income 8,934 8,336 7,014 6,739 47,253 65,438 20,909 45,530
14.2 Finance ExpensesInterest expense on borrowingsShort term (80,164) (62,868) (79,819) (62,671)
(80,164) (62,868) (79,819) (62,671)Net Finance Income /(Expense) (32,911) 2,570 (58,910) (17,141)

0140 JOHN KEELLS PLC
15 PROFIT BEFORE TAX
Accounting Policy
Expenditure recognition
Expenses are recognised in the income statement on the basis of a direct association between the cost incurred and the earning of specific items of income. All expenditure incurred in the running of the business and in maintaining the property, plant and equipment in a state of efficiency has been charged to the income statement.
For the purpose of presentation of the income statement, the “function of expenses” method has been adopted, on the basis that it presents fairly the elements of the Group’s and company performance.
Group CompanyFor the Year Ended 31st March 2018 2017 2018 2017 Rs 000's Rs 000's Rs 000's Rs 000's
PROFIT BEFORE TAXProfit before tax is stated after charging all expenses including the following;Administration ExpensesRemuneration to Executive Director - 39 - 39 Remuneration to Non Executive Directors 11,070 11,040 7,200 7,200 Audit Fees 1,925 1,833 1,102 1,050 Personnel costs includes Defined Benefit Plan Cost 11,225 11,505 6,045 6,365 Defined Contribution Plan Cost - EPF and ETF 25,976 23,392 12,849 11,892 Other Staff Cost 229,197 205,989 97,483 95,556 Depreciation of Property, Plant and Equipment 23,457 22,081 9,709 7,702 Donations 1,235 (2,728) 1,055 887
Selling and Distribution ExpensesBad Debts Provision / (Recoveries) (12,984) (17,657) (12,984) (17,657)Impairment Loss / (Recovery) 856 (3,137) 856 (3,137)
NOTES TO THE FINANCIAL STATEMENTS
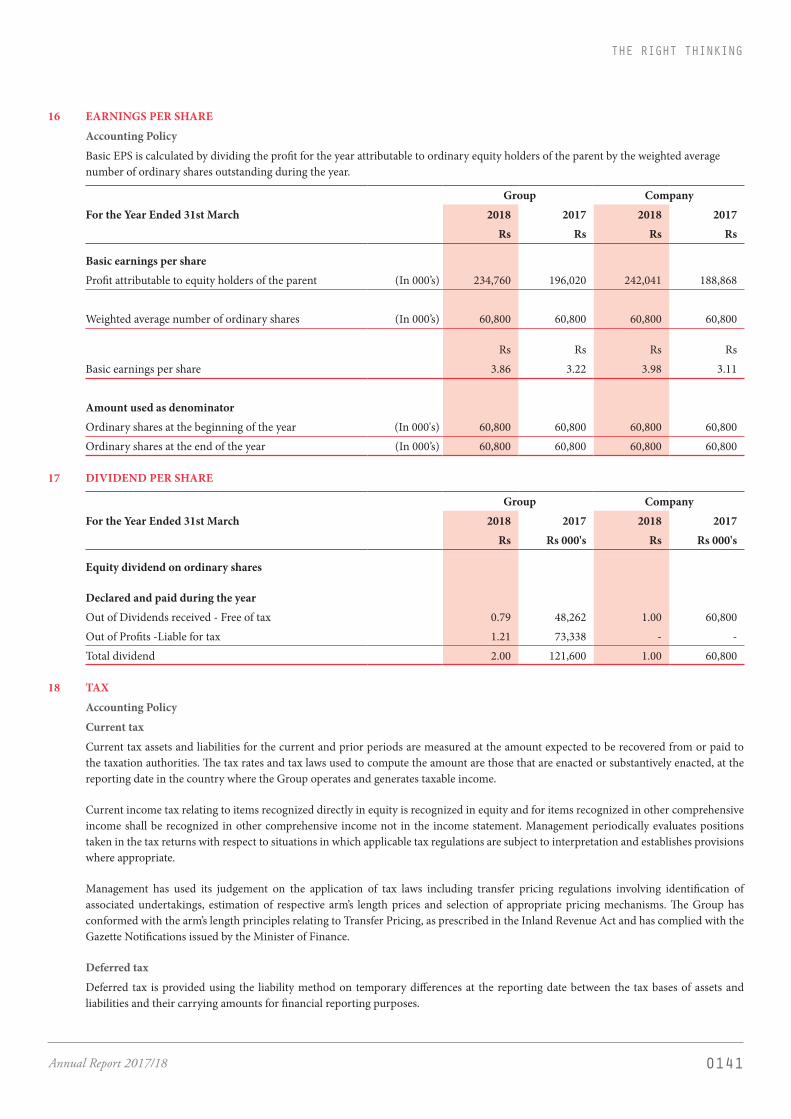
0141Annual Report 2017/18
THE RIGHT THINKING
16 EARNINGS PER SHARE
Accounting Policy
Basic EPS is calculated by dividing the profit for the year attributable to ordinary equity holders of the parent by the weighted average number of ordinary shares outstanding during the year.
Group CompanyFor the Year Ended 31st March 2018 2017 2018 2017 Rs Rs Rs Rs
Basic earnings per shareProfit attributable to equity holders of the parent (In 000’s) 234,760 196,020 242,041 188,868
Weighted average number of ordinary shares (In 000’s) 60,800 60,800 60,800 60,800
Rs Rs Rs RsBasic earnings per share 3.86 3.22 3.98 3.11
Amount used as denominatorOrdinary shares at the beginning of the year (In 000's) 60,800 60,800 60,800 60,800 Ordinary shares at the end of the year (In 000’s) 60,800 60,800 60,800 60,800
17 DIVIDEND PER SHARE
Group CompanyFor the Year Ended 31st March 2018 2017 2018 2017 Rs Rs 000's Rs Rs 000's
Equity dividend on ordinary shares
Declared and paid during the yearOut of Dividends received - Free of tax 0.79 48,262 1.00 60,800 Out of Profits -Liable for tax 1.21 73,338 - - Total dividend 2.00 121,600 1.00 60,800
18 TAX
Accounting Policy
Current tax
Current tax assets and liabilities for the current and prior periods are measured at the amount expected to be recovered from or paid to the taxation authorities. The tax rates and tax laws used to compute the amount are those that are enacted or substantively enacted, at the reporting date in the country where the Group operates and generates taxable income.
Current income tax relating to items recognized directly in equity is recognized in equity and for items recognized in other comprehensive income shall be recognized in other comprehensive income not in the income statement. Management periodically evaluates positions taken in the tax returns with respect to situations in which applicable tax regulations are subject to interpretation and establishes provisions where appropriate.
Management has used its judgement on the application of tax laws including transfer pricing regulations involving identification of associated undertakings, estimation of respective arm’s length prices and selection of appropriate pricing mechanisms. The Group has conformed with the arm’s length principles relating to Transfer Pricing, as prescribed in the Inland Revenue Act and has complied with the Gazette Notifications issued by the Minister of Finance.
Deferred tax
Deferred tax is provided using the liability method on temporary differences at the reporting date between the tax bases of assets and liabilities and their carrying amounts for financial reporting purposes.

0142 JOHN KEELLS PLC
Deferred tax liabilities are recognized for all taxable temporary differences, except:
· Where the deferred tax liability arises from the initial recognition of goodwill or of an asset or liability in a transaction that is not a business combination and, at the time of the transaction, affects neither the accounting profit nor taxable profit or loss; and
· In respect of taxable temporary differences associated with investments in subsidiaries and associates, where the timing of the reversal of the temporary differences can be controlled and it is probable that the temporary differences will not reverse in the foreseeable future.
Deferred tax assets are recognized for all deductible temporary differences, and unused tax credits and tax losses carried forward, to the extent that it is probable that taxable profit will be available against which the deductible temporary differences and the unused tax credits and tax losses carried forward can be utilized except:
· Where the deferred income tax asset relating to the deductible temporary difference arises from the initial recognition of an asset or liability in a transaction that is not a business combination and, at the time of the transaction, affects neither the accounting profit nor taxable profit or loss; and·
· in respect of deductible temporary differences associated with investments in subsidiaries and associates, deferred tax assets are recognized only to the extent that it is probable that the temporary differences will reverse in the foreseeable future and taxable profit will be available against which the temporary differences can be utilized.
The carrying amount of deferred tax assets is reviewed at each reporting date and reduced to the extent that it is no longer probable that sufficient taxable profit will be available to allow all or part of the deferred tax asset to be utilized. Unrecognised deferred tax assets are reassessed at each reporting date and are recognised to the extent that it has become probable that future taxable profit will allow the deferred tax asset to be recovered.
Deferred tax assets and liabilities are measured at tax rates that are expected to apply to the year when the asset is realised or liability is settled, based on the tax rates and tax laws that have been enacted or substantively enacted as at the reporting date.
Deferred tax relating to items recognised outside profit or loss is recognised outside profit or loss. Deferred tax items are recognised in correlation to the underlying transaction either in other comprehensive income or directly in equity.
Deferred tax assets and deferred tax liabilities are offset, if a legally enforceable right exists to set off current tax assets against current tax liabilities and when the deferred taxes relate to the same taxable entity and the same taxation authority.
Sales tax Revenues, expenses and assets are recognised net of the amount of sales tax except:
· where the sales tax incurred on a purchase of a assets or services is not recoverable from the taxation authority, in which case the sales tax is recognised as part of the cost of acquisition of the asset or as part of the expense item as applicable; and
· Receivables and payables that are stated with the amount of sales tax included.
The net amount of sales tax recoverable from, or payable to, the taxation authority is included as part of receivables or payables in the statement of financial position
18.1 Tax Expense
Group CompanyFor the Year Ended 31st March 2018 2017 2018 2017 Rs 000's Rs 000's Rs 000's Rs 000's
Current income tax 69,448 51,101 61,814 44,465 (Over)/ Under Provision in respect of previous years - (830) - - 10% Withholding Tax on Inter Company Dividends 2,878 479 - - Deferred income tax Relating to origination and reversal of temporary differences 18.2 18,898 (1,153) 8,415 6,592
91,224 49,597 70,229 51,057
NOTES TO THE FINANCIAL STATEMENTS
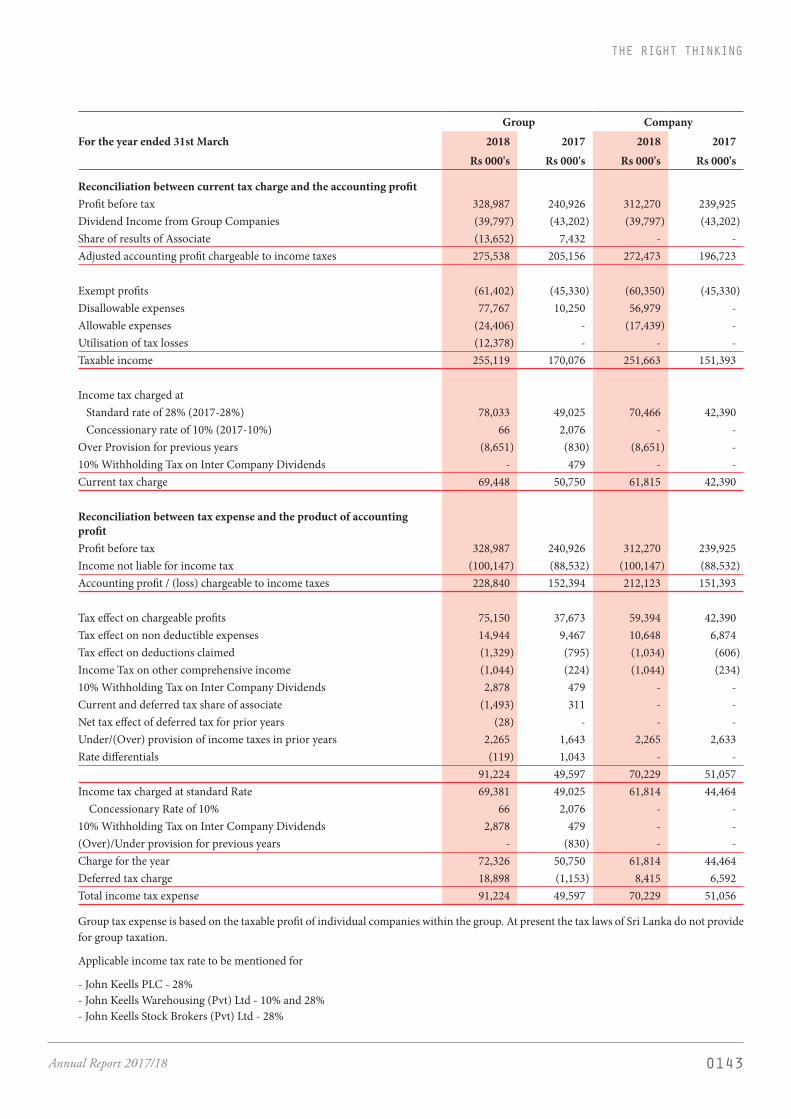
0143Annual Report 2017/18
THE RIGHT THINKING
Group CompanyFor the year ended 31st March 2018 2017 2018 2017 Rs 000's Rs 000's Rs 000's Rs 000's
Reconciliation between current tax charge and the accounting profitProfit before tax 328,987 240,926 312,270 239,925 Dividend Income from Group Companies (39,797) (43,202) (39,797) (43,202)Share of results of Associate (13,652) 7,432 - -Adjusted accounting profit chargeable to income taxes 275,538 205,156 272,473 196,723
Exempt profits (61,402) (45,330) (60,350) (45,330)Disallowable expenses 77,767 10,250 56,979 - Allowable expenses (24,406) - (17,439) - Utilisation of tax losses (12,378) - - -Taxable income 255,119 170,076 251,663 151,393
Income tax charged at Standard rate of 28% (2017-28%) 78,033 49,025 70,466 42,390 Concessionary rate of 10% (2017-10%) 66 2,076 - - Over Provision for previous years (8,651) (830) (8,651) - 10% Withholding Tax on Inter Company Dividends - 479 - -Current tax charge 69,448 50,750 61,815 42,390
Reconciliation between tax expense and the product of accounting profitProfit before tax 328,987 240,926 312,270 239,925 Income not liable for income tax (100,147) (88,532) (100,147) (88,532)Accounting profit / (loss) chargeable to income taxes 228,840 152,394 212,123 151,393
Tax effect on chargeable profits 75,150 37,673 59,394 42,390 Tax effect on non deductible expenses 14,944 9,467 10,648 6,874 Tax effect on deductions claimed (1,329) (795) (1,034) (606)Income Tax on other comprehensive income (1,044) (224) (1,044) (234)10% Withholding Tax on Inter Company Dividends 2,878 479 - -Current and deferred tax share of associate (1,493) 311 - -Net tax effect of deferred tax for prior years (28) - - - Under/(Over) provision of income taxes in prior years 2,265 1,643 2,265 2,633 Rate differentials (119) 1,043 - -
91,224 49,597 70,229 51,057 Income tax charged at standard Rate 69,381 49,025 61,814 44,464 Concessionary Rate of 10% 66 2,076 - - 10% Withholding Tax on Inter Company Dividends 2,878 479 - -(Over)/Under provision for previous years - (830) - - Charge for the year 72,326 50,750 61,814 44,464 Deferred tax charge 18,898 (1,153) 8,415 6,592 Total income tax expense 91,224 49,597 70,229 51,056
Group tax expense is based on the taxable profit of individual companies within the group. At present the tax laws of Sri Lanka do not provide for group taxation.
Applicable income tax rate to be mentioned for
- John Keells PLC - 28%- John Keells Warehousing (Pvt) Ltd - 10% and 28%- John Keells Stock Brokers (Pvt) Ltd - 28%
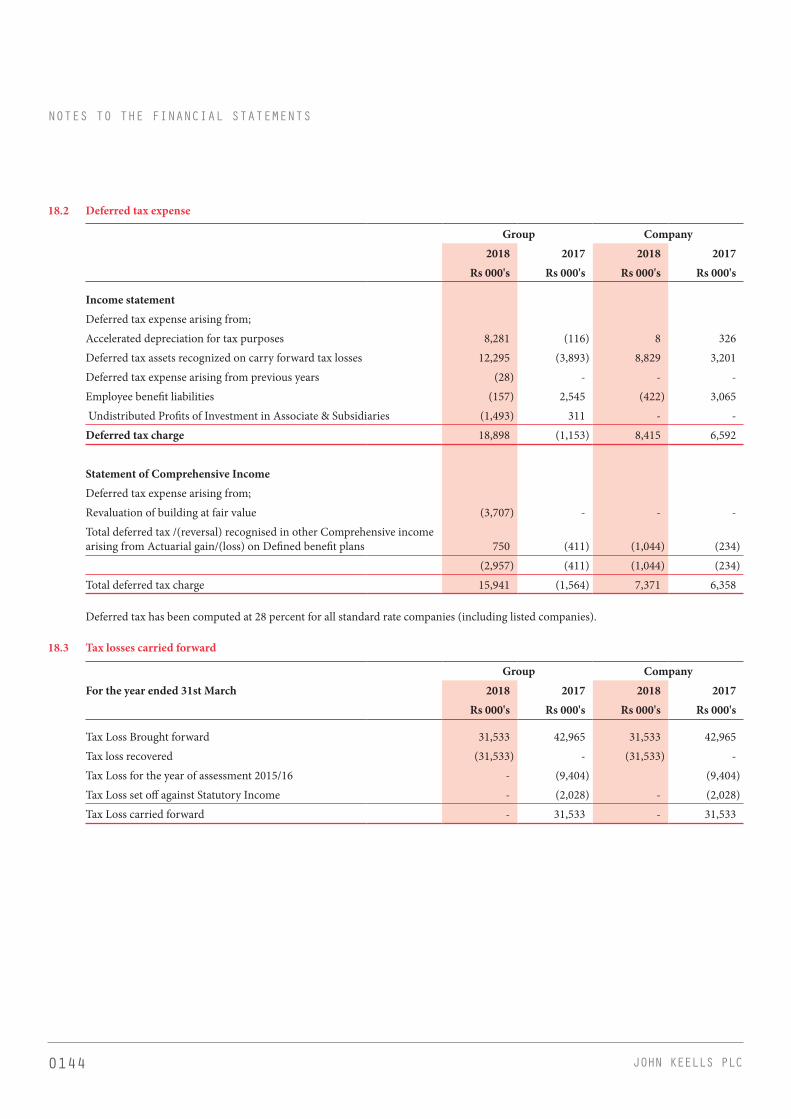
0144 JOHN KEELLS PLC
NOTES TO THE FINANCIAL STATEMENTS
18.2 Deferred tax expense
Group Company2018 2017 2018 2017
Rs 000's Rs 000's Rs 000's Rs 000's
Income statementDeferred tax expense arising from;Accelerated depreciation for tax purposes 8,281 (116) 8 326 Deferred tax assets recognized on carry forward tax losses 12,295 (3,893) 8,829 3,201 Deferred tax expense arising from previous years (28) - - - Employee benefit liabilities (157) 2,545 (422) 3,065 Undistributed Profits of Investment in Associate & Subsidiaries (1,493) 311 - - Deferred tax charge 18,898 (1,153) 8,415 6,592
Statement of Comprehensive IncomeDeferred tax expense arising from;Revaluation of building at fair value (3,707) - - - Total deferred tax /(reversal) recognised in other Comprehensive income arising from Actuarial gain/(loss) on Defined benefit plans 750 (411) (1,044) (234)
(2,957) (411) (1,044) (234)Total deferred tax charge 15,941 (1,564) 7,371 6,358
Deferred tax has been computed at 28 percent for all standard rate companies (including listed companies).
18.3 Tax losses carried forward
Group CompanyFor the year ended 31st March 2018 2017 2018 2017 Rs 000's Rs 000's Rs 000's Rs 000's
Tax Loss Brought forward 31,533 42,965 31,533 42,965 Tax loss recovered (31,533) - (31,533) - Tax Loss for the year of assessment 2015/16 - (9,404) (9,404)Tax Loss set off against Statutory Income - (2,028) - (2,028)Tax Loss carried forward - 31,533 - 31,533

0145Annual Report 2017/18
THE RIGHT THINKING
18.4 Income Tax Liabilities/Refunds
Group CompanyFor the year ended 31st March 2018 2017 2018 2017 Rs 000's Rs 000's Rs 000's Rs 000's
At the beginning of the year 30,303 (13,318) 29,050 (13,948)Charge for the year 69,448 50,271 61,814 44,465 Payments and set off against refunds (52,776) (8,139) (45,686) (1,467)At the end of the year 46,975 28,814 45,178 29,050
Income Tax Refund (401) (1,489) - -Income Tax Liability 47,376 30,303 45,178 29,050
18.5 Deferred Tax Asset
Group CompanyFor the year ended 31st March 2018 2017 2018 2017 Rs 000's Rs 000's Rs 000's Rs 000's
At the beginning of the year 29,118 27,662 15,380 21,738 (Charge) / release (12,061) 1,056 (8,416) (6,592)(Charge) / release Other - Comprehensive Income 785 400 1,044 234 At the end of the year 17,842 29,118 8,008 15,380
The closing deferred tax asset balances relate to the following; Carried forward tax losses 3,631 15,923 - 8,829 Accelerated depreciation for tax purposes (3,446) (3,321) (2,371) (2,363)Employee retirement benefit liability 17,657 16,516 10,379 8,914
17,842 29,118 8,008 15,380
18.6 Deferred Tax Liabilities
Group CompanyAs at 31st March 2018 2017 2018 2017 Rs 000's Rs 000's Rs 000's Rs 000's
At the beginning of the year 35,060 35,168 - - Charge / (release) 3,095 (108) - - (Charge) / release Other - Comprehensive Income 3,742 - - -Impact from deferred tax rate change 53,191 - At the end of the year 95,088 35,060 - -
The closing deferred tax liability balances relate to the following; Accelerated depreciation for tax purposes 89,456 28,134 - - Employee Retirement benefit liability (438) (637) - - Impact on consolidation of Associates’ retained earnings 6,070 7,563
95,088 35,060 - -

0146 JOHN KEELLS PLC
19 PROPERTY, PLANT AND EQUIPMENT
Accounting Policy
Basis of recognition
Property, plant and equipment are recognized if it is probable that future economic benefits associated with the asset will flow to the company and the cost of the asset can be reliably measured.
Basis of measurement
Plant and equipment are stated at cost less accumulated depreciation and any accumulated impairment loss. Such cost includes the cost of replacing component parts of the plant and equipment and borrowing costs for long-term construction projects if the recognition criteria are met. When significant parts of plant and equipment are required to be replaced at intervals, the Group derecognises the replaced part, and recognises the new part with its own associated useful life and depreciation. Likewise, when a major inspection is performed, its cost is recognised in the carrying amount of the plant and equipment as a replacement if the recognition criteria are satisfied. All other repair and maintenance costs are recognised in the income statement as incurred.
Buildings are measured at fair value less accumulated depreciation on buildings and impairment charged subsequent to the date of the revaluation. The carrying values of property, plant and equipment are reviewed for impairment when events or changes in circumstances indicate that the carrying value may not be recoverable. Where land and buildings are subsequently revalued, the entire class of such assets is revalued at fair value on the date of revaluation.
Any revaluation surplus is recognised in other comprehensive income and accumulated in equity in the asset revaluation reserve, except to the extent that it reverses a revaluation decrease of the same asset previously recognised in the income statement, in which case the increase is recognised in the income statement. A revaluation deficit is recognised in the income statement, except to the extent that it offsets an existing surplus on the same asset recognised in the asset revaluation reserve.
Accumulated depreciation as at the revaluation date is eliminated against the gross carrying amount of the asset and the net amount is restated to the revalued amount of the asset. Upon disposal, any revaluation reserve relating to the particular asset being sold is transferred to retained earnings.
Derecognition
An item of property, plant and equipment are derecognised upon replacement, disposal or when no future economic benefits are expected from its use. Any gain or loss arising on derecognition of the asset is included in the income statement in the year the asset is derecognised.
Depreciation
Depreciation is calculated by using a straight-line method on the cost or valuation of all property, plant and equipment, other than freehold land, in order to write off such amounts over the estimated useful economic life of such assets.
The estimated useful life of assets is as follows:
Assets Years
Buildings on leasehold land over the Lease period 34
Plant and machinery 2-10
Equipment 6-8
Furniture and fittings 8
Motor vehicles 5
Computer Equipment 5
Other 5
The asset’s residual values and useful lives are reviewed, and adjusted if appropriate, at each financial year end.
NOTES TO THE FINANCIAL STATEMENTS

0147Annual Report 2017/18
THE RIGHT THINKINGBu
ildin
gs
onLe
aseh
old
Land
Pla
nt a
nd
mac
hine
ry F
urni
ture
a
nd
fittin
gs
Mot
or
veh
icle
s C
ompu
ter
Equ
ipm
ent
Offi
ce
Equ
ipm
ent
Oth
ers
Tot
al
2018
Tot
al
2017
R
s 000
's R
s 000
's R
s 000
's R
s 000
’s R
s 000
’s R
s 000
’s R
s 000
’s R
s 000
’s R
s 000
’s
Prop
erty
, Pla
nt a
nd E
quip
men
tG
roup
19.1
Cos
t/Val
uatio
nAt
the b
egin
ning
of t
he y
ear
286
,038
4
2,25
9 8
3,24
3 2
3,46
6 2
2,85
4 3
,291
1
,786
4
62,9
37
460
,151
A
dditi
ons
26,
784
1,5
34
218
1
3,00
0 6
68
314
-
42,
518
3,9
58
Reva
luat
ion
13,2
38 -
--
--
-13
,238
- D
ispos
als
- (1
2,51
4) (6
59)
(7,4
42)
(2,1
02)
(792
) (1
12)
(23,
621)
(1,1
72)
Tran
sfers
(16,
060)
--
--
--
(16,
060)
-
At t
he en
d of
the y
ear
310
,000
3
1,27
9 8
2,80
2 2
9,02
4 2
1,42
0 2
,813
1
,674
4
79,0
12
462
,937
19.2
Acc
umul
ated
dep
reci
atio
n an
d im
pair
men
tAt
the b
egin
ning
of t
he y
ear
(7,9
17)
(32,
870)
(63,
212)
(15,
323)
(18,
069)
(2,9
12)
(1,3
97)
(141
,700
) (1
20,7
03)
Cha
rge f
or th
e yea
r (8
,143
) (2
,387
) (6
,803
) (4
,186
) (1
,547
) (2
52)
(139
) (2
3,45
7) (2
2,08
1)D
ispos
als
- 1
2,51
4 6
49
7,4
12
2,1
02
761
1
12
23,
550
1,0
84
Tran
sfer o
f acc
umul
ated
dep
reci
atio
n on
as
set r
eval
uatio
n 1
6,06
0 -
- -
- -
- 1
6,06
0 -
At t
he en
d of
the y
ear
- (2
2,74
3) (6
9,36
6) (1
2,09
7) (1
7,51
4) (2
,403
) (1
,424
) (1
25,5
47)
(141
,700
)
19.3
Car
ryin
g va
lue
As a
t 31
Mar
ch 2
018
310
,000
8
,536
1
3,43
6 1
6,92
7 3
,906
4
10
250
3
53,4
65
- A
s at 3
1 M
arch
201
7 2
78,1
21
9,3
89
20,
031
8,1
43
4,7
85
379
3
89
- 3
21,2
37

0148 JOHN KEELLS PLC
Plant and machinery
Furniture and
fittings
Motor vehicles
Computer Equipment
Office Equipment
Others Total 2018
Total 2017
Rs 000's Rs 000's Rs 000’s Rs 000’s Rs 000’s Rs 000’s Rs 000’s Rs 000’s
Company19.4 Cost
At the beginning of the year 232 26,282 23,465 12,071 883 1,300 64,233 62,347 Additions 104 218 13,000 568 85 - 13,975 2,001 Disposals - (654) (7,442) (1,712) (44) (112) (9,964) (115)At the end of the year 336 25,846 29,023 10,927 924 1,188 68,244 64,233
19.5 Accumulated depreciation and impairmentAt the beginning of the year (157) (19,676) (15,323) (9,328) (618) (969) (46,071) (38,398)Charge for the year (33) (4,284) (4,186) (1,018) (81) (107) (9,709) (7,702)Disposals - 645 7,412 1,712 44 112 9,925 29 At the end of the year (190) (23,315) (12,097) (8,634) (655) (964) (45,855) (46,071)
19.6 Carrying valueAs at 31 March 2018 146 2,531 16,926 2,293 269 224 22,389 - As at 31 March 2017 75 6,606 8,142 2,743 265 331 - 18,162
19.7 Carrying value
Group CompanyFor the year ended 31st March 2018 2017 2018 2017 Rs 000's Rs 000's Rs 000's Rs 000's
At cost 43,465 43,116 22,389 18,162 At valuation 310,000 278,121 - -
353,465 321,237 22,389 18,162
19.8 Revaluation of buildings on leasehold land
Accounting judgements,estimates and assumptions
The Group uses the revaluation model of measurement of buildings on leasehold land. The Group engaged independent expert valuers, to determine the fair value of buildings on leasehold land. Fair value is determined by reference to market-based evidence of transaction prices for similar properties. Valuations are based on open market prices, adjusted for any difference in the nature, location or condition of the specific property. These valuation techniques that are appropriate in the circumstances and for which sufficient data are available to measure fair value, maximising the use of relevant observable inputs and minimizing the use of unobservable inputs. The date of the most recent revaluation was carried out on 30th September 2017. The changes in fair value recognised in other comprehensive income and in the statement of equity. The valuer has used valuation techniques such as market values and discounted cash flow methods where there was lack of comparable market data available based on the nature of the property.
NOTES TO THE FINANCIAL STATEMENTS
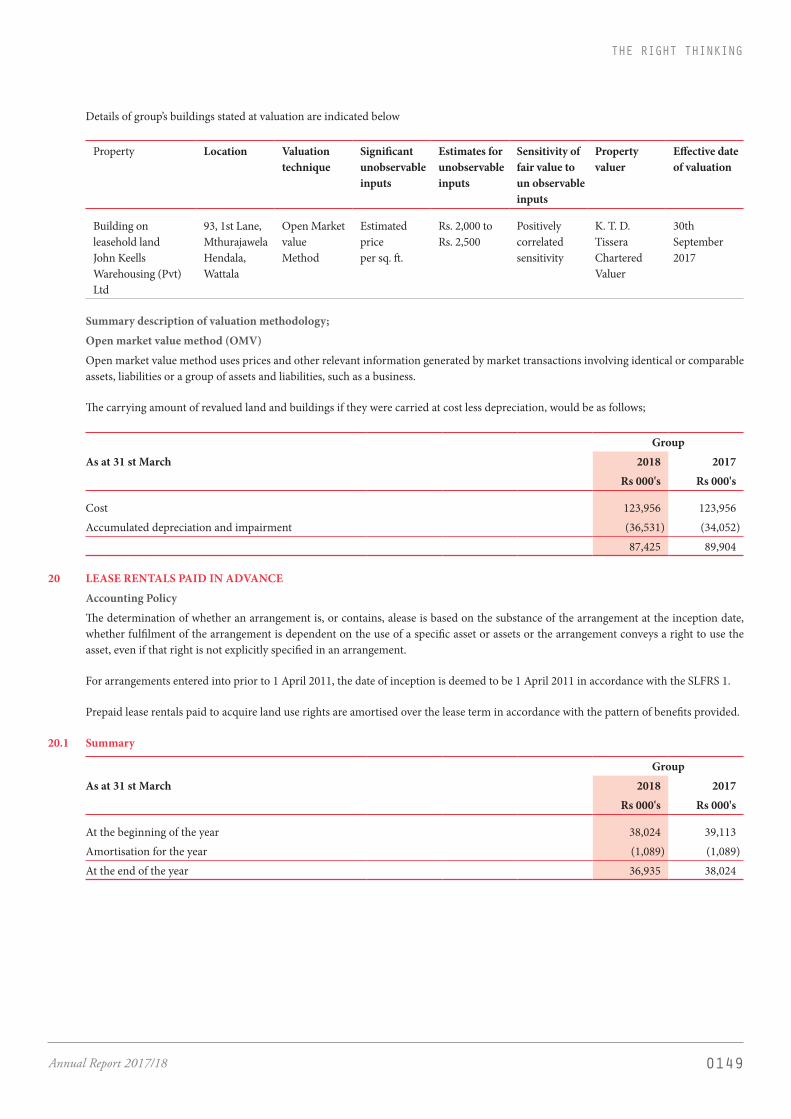
0149Annual Report 2017/18
THE RIGHT THINKING
Details of group’s buildings stated at valuation are indicated below
Property Location Valuation technique
Significant unobservable inputs
Estimates for unobservable inputs
Sensitivity of fair value to un observable inputs
Property valuer
Effective date of valuation
Building on leasehold landJohn Keells Warehousing (Pvt) Ltd
93, 1st Lane, MthurajawelaHendala, Wattala
Open Market value Method
Estimated priceper sq. ft.
Rs. 2,000 to Rs. 2,500
Positively correlated sensitivity
K. T. D. TisseraChartered Valuer
30th September 2017
Summary description of valuation methodology;
Open market value method (OMV)
Open market value method uses prices and other relevant information generated by market transactions involving identical or comparable assets, liabilities or a group of assets and liabilities, such as a business.
The carrying amount of revalued land and buildings if they were carried at cost less depreciation, would be as follows;
GroupAs at 31 st March 2018 2017 Rs 000's Rs 000's
Cost 123,956 123,956 Accumulated depreciation and impairment (36,531) (34,052)
87,425 89,904
20 LEASE RENTALS PAID IN ADVANCE
Accounting Policy
The determination of whether an arrangement is, or contains, alease is based on the substance of the arrangement at the inception date, whether fulfilment of the arrangement is dependent on the use of a specific asset or assets or the arrangement conveys a right to use the asset, even if that right is not explicitly specified in an arrangement.
For arrangements entered into prior to 1 April 2011, the date of inception is deemed to be 1 April 2011 in accordance with the SLFRS 1.
Prepaid lease rentals paid to acquire land use rights are amortised over the lease term in accordance with the pattern of benefits provided.
20.1 Summary
GroupAs at 31 st March 2018 2017 Rs 000's Rs 000's
At the beginning of the year 38,024 39,113 Amortisation for the year (1,089) (1,089)At the end of the year 36,935 38,024
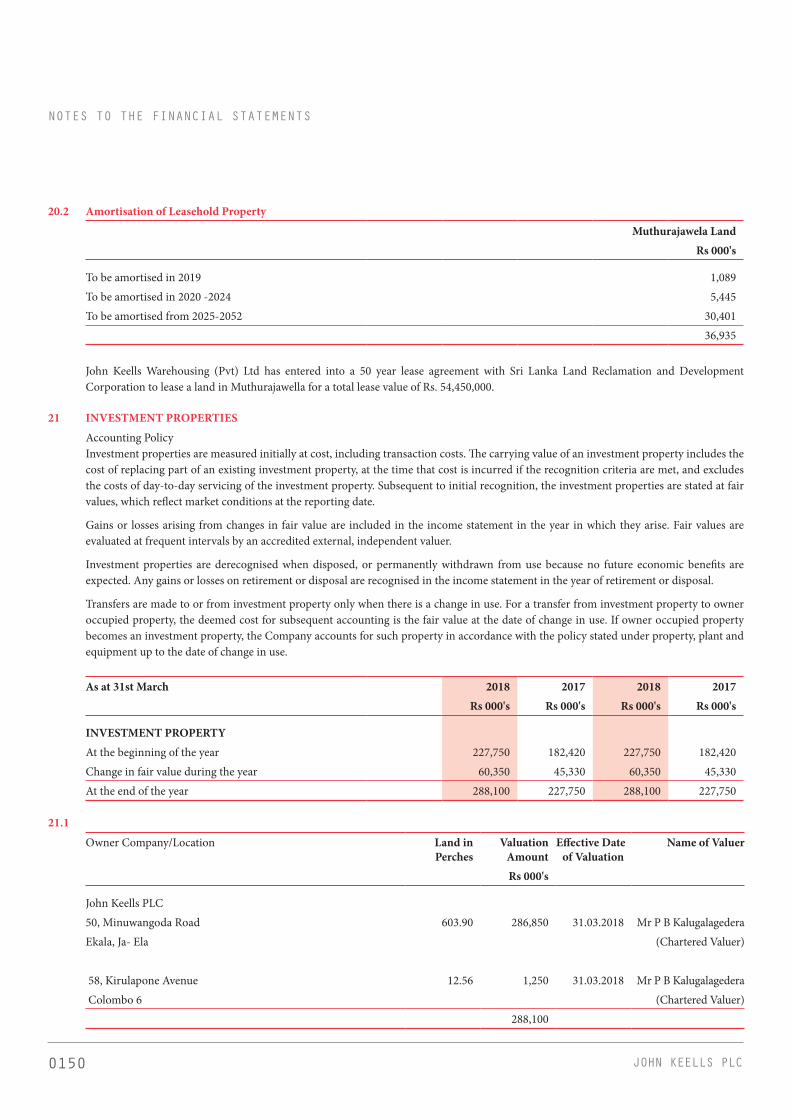
0150 JOHN KEELLS PLC
20.2 Amortisation of Leasehold Property
Muthurajawela Land Rs 000's
To be amortised in 2019 1,089 To be amortised in 2020 -2024 5,445 To be amortised from 2025-2052 30,401
36,935
John Keells Warehousing (Pvt) Ltd has entered into a 50 year lease agreement with Sri Lanka Land Reclamation and Development Corporation to lease a land in Muthurajawella for a total lease value of Rs. 54,450,000.
21 INVESTMENT PROPERTIES
Accounting Policy Investment properties are measured initially at cost, including transaction costs. The carrying value of an investment property includes the
cost of replacing part of an existing investment property, at the time that cost is incurred if the recognition criteria are met, and excludes the costs of day-to-day servicing of the investment property. Subsequent to initial recognition, the investment properties are stated at fair values, which reflect market conditions at the reporting date.
Gains or losses arising from changes in fair value are included in the income statement in the year in which they arise. Fair values are evaluated at frequent intervals by an accredited external, independent valuer.
Investment properties are derecognised when disposed, or permanently withdrawn from use because no future economic benefits are expected. Any gains or losses on retirement or disposal are recognised in the income statement in the year of retirement or disposal.
Transfers are made to or from investment property only when there is a change in use. For a transfer from investment property to owner occupied property, the deemed cost for subsequent accounting is the fair value at the date of change in use. If owner occupied property becomes an investment property, the Company accounts for such property in accordance with the policy stated under property, plant and equipment up to the date of change in use.
As at 31st March 2018 2017 2018 2017 Rs 000's Rs 000's Rs 000's Rs 000's
INVESTMENT PROPERTYAt the beginning of the year 227,750 182,420 227,750 182,420 Change in fair value during the year 60,350 45,330 60,350 45,330 At the end of the year 288,100 227,750 288,100 227,750
21.1
Owner Company/Location Land inPerches
Valuation Amount
Effective Dateof Valuation
Name of Valuer
Rs 000's
John Keells PLC50, Minuwangoda Road 603.90 286,850 31.03.2018 Mr P B KalugalagederaEkala, Ja- Ela (Chartered Valuer)
58, Kirulapone Avenue 12.56 1,250 31.03.2018 Mr P B Kalugalagedera Colombo 6 (Chartered Valuer)
288,100
NOTES TO THE FINANCIAL STATEMENTS
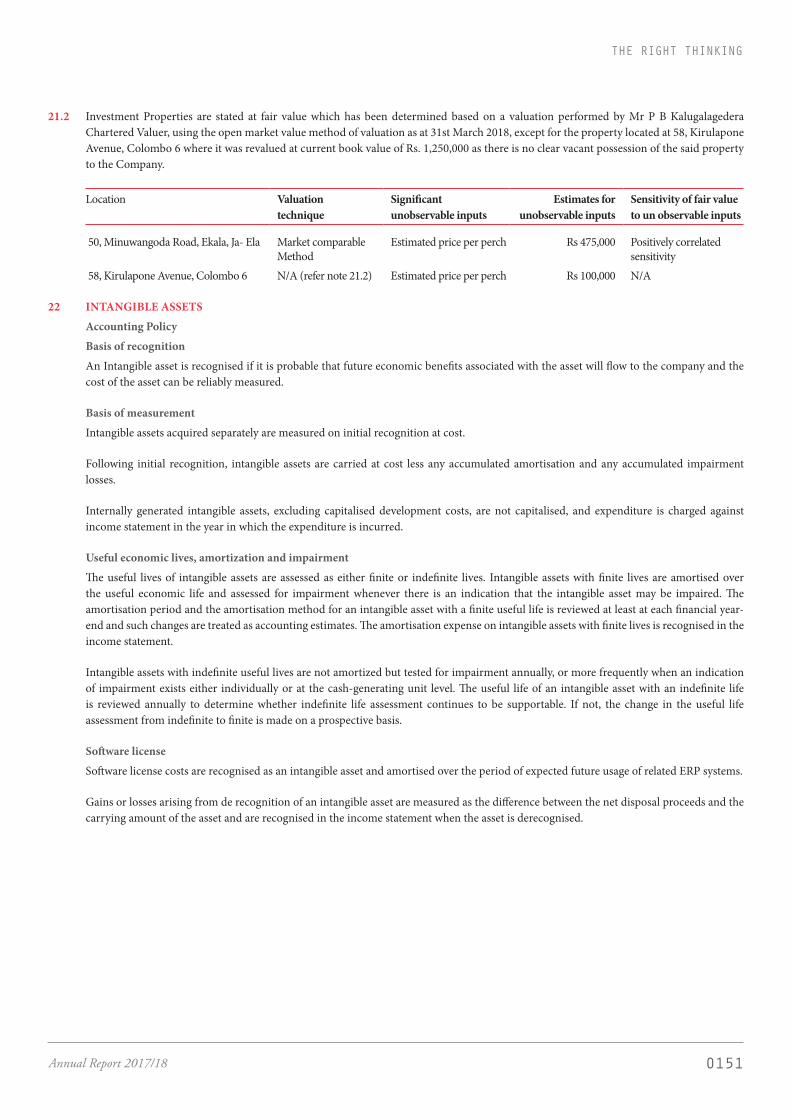
0151Annual Report 2017/18
THE RIGHT THINKING
21.2 Investment Properties are stated at fair value which has been determined based on a valuation performed by Mr P B Kalugalagedera Chartered Valuer, using the open market value method of valuation as at 31st March 2018, except for the property located at 58, Kirulapone Avenue, Colombo 6 where it was revalued at current book value of Rs. 1,250,000 as there is no clear vacant possession of the said property to the Company.
Location Valuation technique
Significant unobservable inputs
Estimates for unobservable inputs
Sensitivity of fair value to un observable inputs
50, Minuwangoda Road, Ekala, Ja- Ela Market comparable Method
Estimated price per perch Rs 475,000 Positively correlated sensitivity
58, Kirulapone Avenue, Colombo 6 N/A (refer note 21.2) Estimated price per perch Rs 100,000 N/A
22 INTANGIBLE ASSETS
Accounting Policy
Basis of recognition
An Intangible asset is recognised if it is probable that future economic benefits associated with the asset will flow to the company and the cost of the asset can be reliably measured.
Basis of measurement
Intangible assets acquired separately are measured on initial recognition at cost.
Following initial recognition, intangible assets are carried at cost less any accumulated amortisation and any accumulated impairment losses.
Internally generated intangible assets, excluding capitalised development costs, are not capitalised, and expenditure is charged against income statement in the year in which the expenditure is incurred.
Useful economic lives, amortization and impairment
The useful lives of intangible assets are assessed as either finite or indefinite lives. Intangible assets with finite lives are amortised over the useful economic life and assessed for impairment whenever there is an indication that the intangible asset may be impaired. The amortisation period and the amortisation method for an intangible asset with a finite useful life is reviewed at least at each financial year-end and such changes are treated as accounting estimates. The amortisation expense on intangible assets with finite lives is recognised in the income statement.
Intangible assets with indefinite useful lives are not amortized but tested for impairment annually, or more frequently when an indication of impairment exists either individually or at the cash-generating unit level. The useful life of an intangible asset with an indefinite life is reviewed annually to determine whether indefinite life assessment continues to be supportable. If not, the change in the useful life assessment from indefinite to finite is made on a prospective basis.
Software license
Software license costs are recognised as an intangible asset and amortised over the period of expected future usage of related ERP systems.
Gains or losses arising from de recognition of an intangible asset are measured as the difference between the net disposal proceeds and the carrying amount of the asset and are recognised in the income statement when the asset is derecognised.

0152 JOHN KEELLS PLC
NOTES TO THE FINANCIAL STATEMENTS
22.1 Cost
Software licenses
2018 2017 Rs 000's Rs 000's
At the beginning of the year 4,594 4,594 Additions - - Derecognition - - At the end of the year 4,594 4,594
22.2 Accumulated amortisation and impairmentAt the beginning of the year (4,502) (4,007)Amortisation (92) (495)Derecognition - - At the end of the year (4,594) (4,502)
22.3 Carrying valueAs at 31 March 2018 - - As at 31 March 2017 - 92
23 INVESTMENTS IN SUBSIDIARIES Accounting Policy
Investment in subsidiaries are initially recognised at cost in the financial statements of the Company. Any transaction cost relating to acquisition of investment in subsidiaries are immediately recognised in the income statement. Following initial recognition, Investment in subsidiaries are carried at cost less any accumulated impairment losses.
23.1 Carrying Value
CompanyAs at 31st March Note 2018 2017 Rs 000's Rs 000's
INVESTMENTS IN SUBSIDIARIES Investments in subsidiariesUnquoted 23.2 158,570 158,570
158,570 158,570
23.2 Group unquoted investments In Subsidiaries
As at 31st March Number ofshares
Additions Number of shares
Effective holding %
2018 2017
000’s 000’s Rs 000's Rs 000's
John Keells Stock Brokers (Pvt) Ltd. 1,140 - 1,140 76 38,570 38,570 John Keells Warehousing (Pvt) Ltd. 12,000 - 12,000 100 120,000 120,000
158,570 158,570
Directors’ valuation of unquoted investments amount to Rs.158.57 mn (2017 - Rs.158.57 mn).

0153Annual Report 2017/18
THE RIGHT THINKING
24 INVESTMENTS IN ASSOCIATE
Accounting Policy
An associate is an entity over which the Group has significant influence. Significant influence is the power to participate in the financial and operating policy decisions of the investee, but is not control or joint control over those policies. Associate company of the Group which has been accounted for under the equity method of accounting is:
Name Country of Incorporation
Keells Realtors Ltd Sri Lanka
The investments in associates are carried in the statement of financial position at cost plus post acquisition changes in the Group’s share of net assets of the associates. Goodwill relating to an associate is included in the carrying amount of the investment and is neither amortised nor individually tested for impairment. After application of the equity method, the Group determines whether it is necessary to recognise any additional impairment loss with respect to the Group’s net investment in the associate.
The Group determines at each reporting date whether there is any objective evidence that the investment in the associate is impaired. If this is the case, the Group calculates the amount of impairment as the difference between the recoverable amount of the associate and its carrying value and recognises the amount in the ‘share of results of equity accounted investees’ in the income statement.
The income statement reflects the share of the results of operations of the associate. Changes, if any, recognised directly in the equity of the associate, the Group recognises its share and discloses this, when applicable in the statement of changes in equity. Unrealised gains and losses resulting from transactions
The share of profit of an associate is shown on the face of the income statement. This is the profit attributable to equity holders of the associate and therefore is profit after tax and non-controlling interests in the subsidiaries of the associate.
The Group ceases to recognise further losses when the Group’s share of losses in an associate equals or exceeds the interest in the undertaking, unless it has incurred obligations or made payments on behalf of the entity. The accounting policies of associate companies conform to those used for similar transactions of the Group.
Equity method of accounting has been applied for associate financial statements using their respective 12 month financial period. Upon loss of significant influence over the associate, the Group measures and recognises any retaining investment at its fair value. Any difference between the carrying amount of the associate upon loss of significant influence and the fair value of the retaining investment and proceeds from disposal is recognised in profit or loss.
24.1 Carrying value
Group CompanyAs at 31st March Number of
sharesHolding % 2018 2017 2018 2017
000’s Rs 000’s Rs 000’s Rs 000's Rs 000's
Unquoted ordinary sharesKeells Realtors Ltd 2,400 32 24,000 24,000 24,000 24,000
Share of Profit as at the beginning of the year 75,632 73,736 Cumulative profit/(Loss) accruing to the group net of dividend (14,932) 3,112 - - Cumulative adjustment on account of associate company share of net assets - (1,216) - - Net of Dividend 60,700 75,632 - - Net Assets at the end of the year 84,700 99,632 - -

0154 JOHN KEELLS PLC
24.2 Summarised financial information of Associate
CompanyAs at 31st March 2018 2017 Rs 000's Rs 000's
Revenue 10,446 9,678 Cost of sales (491) (916)Gross Profit 9,955 8,762
Dividend income - - Administration Expenses (3,140) (1,907)Financial Income 250 279 Other Income - 3,662 Change in fair value of Investment Property 38,324 14,428 Income Tax Expenses (88,051) (1,997)Profit / (loss) for the year (42,662) 23,227
Group share of profit / (loss) for the year (13,652) 7,432 Group share of other comprehensive income - (1,216)Share of results of equity accounted investee (13,652) 6,216
Non - Current Assets 353,200 314,876 Current Assets 6,685 4,804 Total Assets 359,885 319,680 Non - Current Liabilities (92,829) (6,529)Current Liabilities (2,367) (1,801)Total Liabilities (95,196) (8,330)Net Assets 264,689 311,350 Group Share of net Assets 84,700 99,632
25 NON CURRENT FINANCIAL ASSETS
Group CompanyAs at 31st March Note 2018 2017 2018 2017 Rs 000's Rs 000's Rs 000's Rs 000's
Other quoted equity investments 25.1 334,258 373,113 334,258 373,113 Other unquoted equity investments 25.2 1,916,382 1,916,382 1,916,382 1,916,382 Other non equity investments 25.3 52,771 118,624 44,002 108,170
2,303,411 2,408,119 2,294,642 2,397,665
NOTES TO THE FINANCIAL STATEMENTS
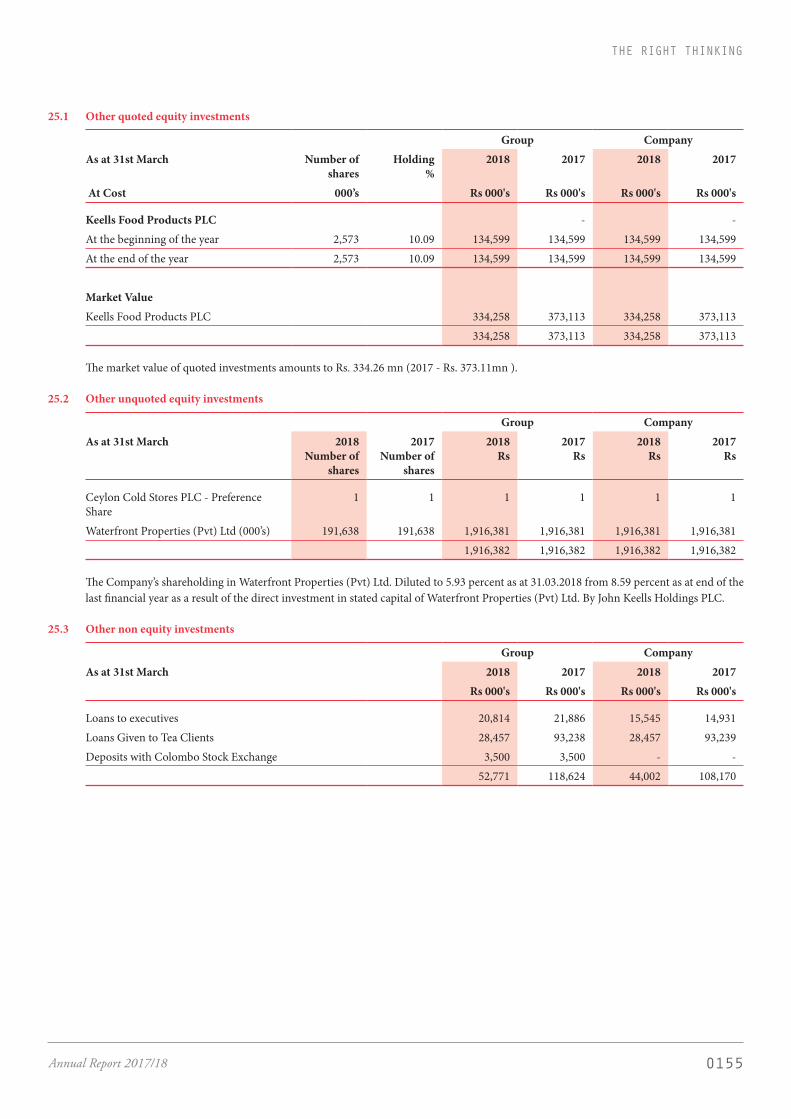
0155Annual Report 2017/18
THE RIGHT THINKING
25.1 Other quoted equity investments
Group CompanyAs at 31st March Number of
shares Holding
% 2018 2017 2018 2017
At Cost 000’s Rs 000's Rs 000's Rs 000's Rs 000's
Keells Food Products PLC - - At the beginning of the year 2,573 10.09 134,599 134,599 134,599 134,599 At the end of the year 2,573 10.09 134,599 134,599 134,599 134,599
Market ValueKeells Food Products PLC 334,258 373,113 334,258 373,113
334,258 373,113 334,258 373,113
The market value of quoted investments amounts to Rs. 334.26 mn (2017 - Rs. 373.11mn ).
25.2 Other unquoted equity investments
Group CompanyAs at 31st March 2018
Number ofshares
2017Number of
shares
2018Rs
2017 Rs
2018Rs
2017Rs
Ceylon Cold Stores PLC - Preference Share
1 1 1 1 1 1
Waterfront Properties (Pvt) Ltd (000’s) 191,638 191,638 1,916,381 1,916,381 1,916,381 1,916,381 1,916,382 1,916,382 1,916,382 1,916,382
The Company’s shareholding in Waterfront Properties (Pvt) Ltd. Diluted to 5.93 percent as at 31.03.2018 from 8.59 percent as at end of the last financial year as a result of the direct investment in stated capital of Waterfront Properties (Pvt) Ltd. By John Keells Holdings PLC.
25.3 Other non equity investments
Group CompanyAs at 31st March 2018 2017 2018 2017 Rs 000's Rs 000's Rs 000's Rs 000's
Loans to executives 20,814 21,886 15,545 14,931 Loans Given to Tea Clients 28,457 93,238 28,457 93,239 Deposits with Colombo Stock Exchange 3,500 3,500 - -
52,771 118,624 44,002 108,170

0156 JOHN KEELLS PLC
NOTES TO THE FINANCIAL STATEMENTS
25.4 Loans to executives
Group CompanyAs at 31st March 2018 2017 2018 2017 Rs 000's Rs 000's Rs 000's Rs 000's
At the beginning of the year 30,865 28,088 21,015 15,794 Loans granted 11,200 21,536 7,000 19,450 Recoveries/ Transfers (11,776) (18,759) (6,096) (14,229)At the end of the year 30,289 30,865 21,919 21,015
Receivable within one year 9,475 8,979 6,375 6,084
Receivable after one yearReceivable between one and five years 20,814 21,886 15,544 14,931
30,289 30,865 21,919 21,015
26 INVENTORIES
Accounting Policy
Inventories are valued at the lower of cost and net realisable value. Net realisable value is the estimated selling price less estimated costs of completion and the estimated costs necessary to make the sale.
The costs incurred in bringing inventories to its present location and condition, are accounted for as follows:
Other inventories- At actual Cost
Group CompanyAs at 31st March 2018 2017 2018 2017 Rs 000's Rs 000's Rs 000's Rs 000's
INVENTORIESConsumables and Spares 661 456 470 332
661 456 470 332
27 TRADE AND OTHER RECEIVABLES
Group CompanyAs at 31st March Note 2018 2017 2018 2017 Rs 000's Rs 000's Rs 000's Rs 000's
Trade Receivables 1,752,670 2,282,605 1,631,521 1,495,914 Less: Provision for Doubtful Debts (224,283) (237,281) (224,283) (237,267)Other Receivables 5,863 7,177 2,486 3,765 Loans to Executives 25.4 9,475 8,979 6,375 6,084
1,543,725 2,061,480 1,416,099 1,268,496

0157Annual Report 2017/18
THE RIGHT THINKING
28 OTHER CURRENT ASSETS
Group CompanyAs at 31st March 2018 2017 2018 2017 Rs 000's Rs 000's Rs 000's Rs 000's
Prepayments and non cash receivable 3,967 5,140 1,205 1,992 3,967 5,140 1,205 1,992
29 SHORT TERM INVESTMENTS
Group CompanyAs at 31st March 2018 2017 2018 2017 Rs 000's Rs 000's Rs 000's Rs 000's
Government Securities (less than 3 months) 284,744 221,030 - - 284,744 221,030 - -
30 CASH IN HAND AND AT BANK
Accounting Policy
Cash and short-term deposits in the statement of financial position comprise cash at banks and on hand and short-term deposits with a maturity of three months or less. For the purpose of the cash flow statement, cash and cash equivalents consist of cash and short-term deposits as defined above, net of outstanding bank overdrafts.
30.1 Favourable cash and bank balances
Group CompanyAs at 31st March 2018 2017 2018 2017 Rs 000's Rs 000's Rs 000's Rs 000's
Cash in hand and at bank 184,454 175,234 153,394 158,633 184,454 175,234 153,394 158,633
30.2 Unfavourable cash and bank balances
Group CompanyAs at 31st March 2018 2017 2018 2017 Rs 000's Rs 000's Rs 000's Rs 000's
Bank Overdrafts 712,112 673,577 688,046 672,367 712,112 673,577 688,046 672,367
31 STATED CAPITAL AND OTHER COMPONENTS OF EQUITY
Accounting Policy
The ordinary shares of John Keells PLC are quoted in the Colombo Stock Exchange. Holders of ordinary shares are entitled to receive dividends as declared from time to time, and are eligible to one vote per share at the General Meeting of the Company.
Revaluation reserve consist of the net surplus on the revaluation of property, plant and equipment.
The other capital reserve is used to recognise the value of equity -settled share based payments provided to employees, including key management personnel, as part of their remuneration.
Available for sale reserve includes changes of fair value of financial instruments designated as available for sale financial assets.
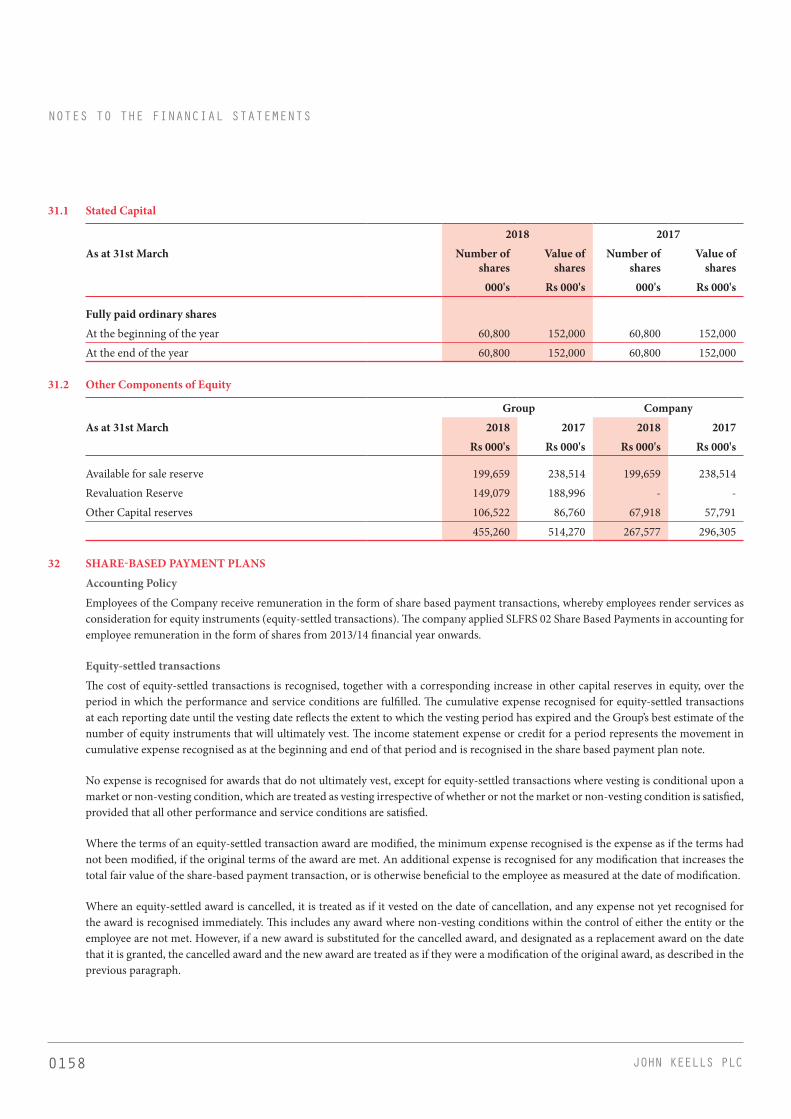
0158 JOHN KEELLS PLC
31.1 Stated Capital
2018 2017As at 31st March Number of
sharesValue of
sharesNumber of
sharesValue of
shares 000's Rs 000's 000's Rs 000's
Fully paid ordinary sharesAt the beginning of the year 60,800 152,000 60,800 152,000 At the end of the year 60,800 152,000 60,800 152,000
31.2 Other Components of Equity
Group CompanyAs at 31st March 2018 2017 2018 2017 Rs 000's Rs 000's Rs 000's Rs 000's
Available for sale reserve 199,659 238,514 199,659 238,514 Revaluation Reserve 149,079 188,996 - - Other Capital reserves 106,522 86,760 67,918 57,791
455,260 514,270 267,577 296,305
32 SHARE-BASED PAYMENT PLANS
Accounting Policy
Employees of the Company receive remuneration in the form of share based payment transactions, whereby employees render services as consideration for equity instruments (equity-settled transactions). The company applied SLFRS 02 Share Based Payments in accounting for employee remuneration in the form of shares from 2013/14 financial year onwards.
Equity-settled transactions
The cost of equity-settled transactions is recognised, together with a corresponding increase in other capital reserves in equity, over the period in which the performance and service conditions are fulfilled. The cumulative expense recognised for equity-settled transactions at each reporting date until the vesting date reflects the extent to which the vesting period has expired and the Group’s best estimate of the number of equity instruments that will ultimately vest. The income statement expense or credit for a period represents the movement in cumulative expense recognised as at the beginning and end of that period and is recognised in the share based payment plan note.
No expense is recognised for awards that do not ultimately vest, except for equity-settled transactions where vesting is conditional upon a market or non-vesting condition, which are treated as vesting irrespective of whether or not the market or non-vesting condition is satisfied, provided that all other performance and service conditions are satisfied.
Where the terms of an equity-settled transaction award are modified, the minimum expense recognised is the expense as if the terms had not been modified, if the original terms of the award are met. An additional expense is recognised for any modification that increases the total fair value of the share-based payment transaction, or is otherwise beneficial to the employee as measured at the date of modification.
Where an equity-settled award is cancelled, it is treated as if it vested on the date of cancellation, and any expense not yet recognised for the award is recognised immediately. This includes any award where non-vesting conditions within the control of either the entity or the employee are not met. However, if a new award is substituted for the cancelled award, and designated as a replacement award on the date that it is granted, the cancelled award and the new award are treated as if they were a modification of the original award, as described in the previous paragraph.
NOTES TO THE FINANCIAL STATEMENTS

0159Annual Report 2017/18
THE RIGHT THINKING
Share Based Payments- Employee Share Option Scheme
Under the John Keells Group’s Employees share option scheme (ESOP), share options of the parent are granted to senior executives of the Company with more than 12 months of service. The exercise price of the share options is equal to the 30 day volume weighted average market price of the underlying shares on the date of grant. The share options vest over a period of four years and is dependent on a performance critera and a service criteria. The performance criteria being a minimum performance achievement of “Met Expectations” and service criteria being that the employee has to be in employment at the time the share options vest. The fair value of the share options is estimated at the grant date using a binomial option pricing model, taking into account the terms and conditions upon which the share options were granted.
The contractual term for each option granted is five years. There are no cash settlement alternatives. The Group does not have a past practice of cash settlement for these share options.
The expense recognised for employee services received during the year is shown in the following table:
Group CompanyAs at 31st March 2018 2017 2018 2017 Rs 000's Rs 000's Rs 000's Rs 000's
Expense arising from equity-settled share-based payment transactions 22,513 24,796 10,127 12,369 Total expense arising from share-based payment transactions 22,513 24,796 10,127 12,369
Movements in the year
The following table illustrates the number (No.) and weighted average exercise prices (WAEP) of, and movements in, share options during the year:
Group CompanyAs at 31 st March 2018 2018 2017 2017 2018 2018 2017 2017
No. WAEP No. WAEP No. WAEP No. WAEP Rs 000's Rs 000’s Rs 000’s Rs 000’s
Outstanding at the beginning of the year 2,256,380 169.28 1,689,722 199.44 1,428,208 172.32 1,155,520 200.50 Granted during the year 413,727 173.25 382,326 142.83 177,705 173.25 142,289 142.83 Exercised during the year - - - - - - - - Adjusted -Sub division - - 241,360 174.25 - - 165,058 175.16 Adjusted -Warrants - - 11,666 190.96 - - 8,368 190.96 Lapsed/Forfeited during the year (11,984) 158.48 (68,694) 165.37 - - (43,027) 165.50 Transfers in /(out) During the year - - - - - - - - Outstanding at the end of the year 2,658,123 170.13 2,256,380 169.28 1,605,913 172.65 1,428,208 172.32Exercisable at the end of the year 1,955,196 173.41 1,450,584 176.79 1,265,511 175.53 1,152,993 176.18
Fair value of the share option and assumptions
The fair value of the share options is estimated at the grant date using a binomial option pricing model, taking into account the terms and conditions upon which the share options were granted.
The valuation takes into account factors such as stock price, expected time to maturity, exercise price, expected volatility of share price, expected dividend yield and risk free interest rate.

0160 JOHN KEELLS PLC
33 EMPLOYEE BENEFIT LIABILITIES
Accounting Policy
33.1 Employees are eligible for Employees’ Provident Fund contributions and Employees’ Trust Fund contributions in line with respective statutes and regulations. The companies contribute the defined percentages of gross emoluments of employees to an approved Employees’ Provident Fund and to the Employees’ Trust Fund respectively, which are externally funded.
33.2 Employee Defined Benefit Plan- Gratuity
The liability recognised in the statement of financial position is the present value of the defined benefit obligation at the reporting date using the projected unit credit method. Any actuarial gains or losses arising are recognised immediately in statement of other comprehensive income statement. Such actuarial gains and losses are also immediately recognized in retained earnings and are not reclassified to profit or loss subsequent periods.
Group CompanyAs at 31st March 2018 2017 2018 2017 Rs 000's Rs 000's Rs 000's Rs 000's
EMPLOYEE BENEFIT LIABILITIESAt the beginning of the year 65,363 72,126 31,833 41,945 Current service cost 4,759 3,932 2,543 1,961 Transfers 166 (77) (324) (77)Interest cost on benefit obligation 6,466 7,573 3,502 4,404 Payments (14,800) (19,725) (4,214) (17,236)(Gain)/Loss arising from changes in assumptions or due to (over)/under provision in the previous year 2,676 1,534 3,727 836 At the end of the year 64,630 65,363 37,067 31,833
33.3 The expenses are recognised in the income statement in the following line items;
Group CompanyAs at 31st March 2018 2017 2018 2017 Rs 000's Rs 000's Rs 000's Rs 000's
Cost of Sales 7,422 7,321 4,563 4,448 Administrative Expenses 3,448 3,724 1,127 1,456 Cost reimbursement for shared employees 355 460 355 460
11,225 11,505 6,045 6,365
The employee benefit liability of listed company and the group is based on the actuarial valuations carried out by Messrs. Actuarial & Management Consultants (Pvt) Ltd., actuaries.
NOTES TO THE FINANCIAL STATEMENTS

0161Annual Report 2017/18
THE RIGHT THINKING
33.4 The principal assumptions used in determining the cost of employee benefits were:
Group CompanyAs at 31st March 2018 2017 2018 2017
Discount rate 10.00% 11.50% 10.00% 11.50%Future salary increases 10.00% 10.00% 10.00% 10.00%
33.5 Sensitivity of assumptions used
A one percentage change in the assumptions would have the following effects:
Group CompanyAs at 31 st March Discount rate Salary increment Discount rate Salary increment
2018 2017 2018 2017 2018 2017 2018 2017 Rs 000’s Rs 000's Rs 000’s Rs 000’s Rs 000’s Rs 000’s Rs 000’s Rs 000’s
Effect on the defined benefit obligation liability; Increase by one percentage point (2,993) (2,868) 3,371 3,269 (1,958) (1,838) 2,217 2,116Decrease by one percentage point 3,289 3,163 (3,122) (3,014) 2,182 2,064 (2,026) (1,918)
33.6 Maturity analysis of the payments
The following payments are expected on employee benefit liabilities in future years
Group CompanyAs at 31st March 2018 2017 2018 2017 Rs 000's Rs 000's Rs 000's Rs 000's
Future Working Life Time Defined Benefit
Obligation
Defined Benefit
Obligation
Defined Benefit
Obligation
Defined Benefit
Obligation
Within the next 12 months 6,067 16,206 4,594 4,581 Between 1-2 years 12,788 8,366 6,287 4,809 Between 2-5 years 28,549 23,571 12,103 9,452 Between 5-10 years 9,150 10,020 7,041 6,338 Beyond 10 years 8,075 7,200 7,042 6,653 Total 64,629 65,363 37,067 31,833
The average duration of the defined benefit plan obligation at the end of the reporting period is 6.07 years for the Company (2017 - 6.71 years)
The average duration of the defined benefit plan obligation at the end of the reporting period is 3.99 years for John Keells Stock Brokers (Pvt) Ltd (2017 - 4 years)
The average duration of defined benefit obligation at the end of the reporting period is 7.72 years for John Keells Warehousing (Pvt) Ltd. (2017 - 1.06 years)
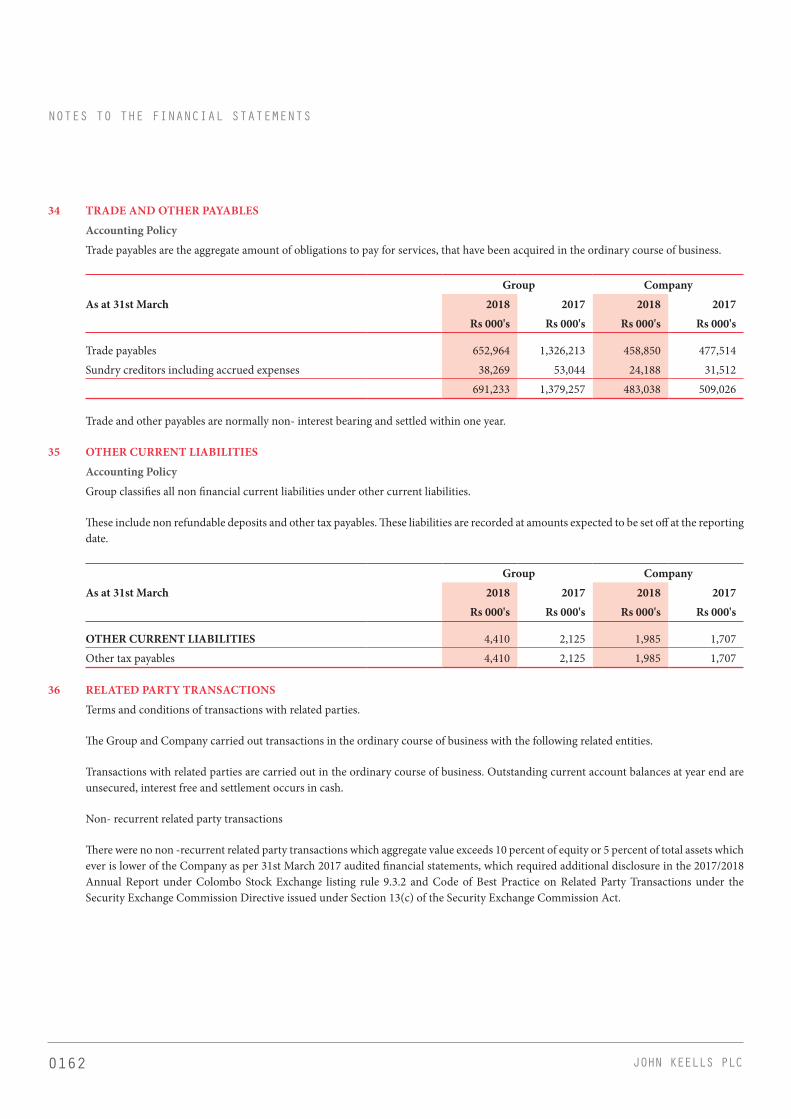
0162 JOHN KEELLS PLC
34 TRADE AND OTHER PAYABLES
Accounting Policy
Trade payables are the aggregate amount of obligations to pay for services, that have been acquired in the ordinary course of business.
Group CompanyAs at 31st March 2018 2017 2018 2017 Rs 000's Rs 000's Rs 000's Rs 000's
Trade payables 652,964 1,326,213 458,850 477,514 Sundry creditors including accrued expenses 38,269 53,044 24,188 31,512
691,233 1,379,257 483,038 509,026
Trade and other payables are normally non- interest bearing and settled within one year.
35 OTHER CURRENT LIABILITIES
Accounting Policy
Group classifies all non financial current liabilities under other current liabilities.
These include non refundable deposits and other tax payables. These liabilities are recorded at amounts expected to be set off at the reporting date.
Group CompanyAs at 31st March 2018 2017 2018 2017 Rs 000's Rs 000's Rs 000's Rs 000's
OTHER CURRENT LIABILITIES 4,410 2,125 1,985 1,707 Other tax payables 4,410 2,125 1,985 1,707
36 RELATED PARTY TRANSACTIONS
Terms and conditions of transactions with related parties.
The Group and Company carried out transactions in the ordinary course of business with the following related entities.
Transactions with related parties are carried out in the ordinary course of business. Outstanding current account balances at year end are unsecured, interest free and settlement occurs in cash.
Non- recurrent related party transactions
There were no non -recurrent related party transactions which aggregate value exceeds 10 percent of equity or 5 percent of total assets which ever is lower of the Company as per 31st March 2017 audited financial statements, which required additional disclosure in the 2017/2018 Annual Report under Colombo Stock Exchange listing rule 9.3.2 and Code of Best Practice on Related Party Transactions under the Security Exchange Commission Directive issued under Section 13(c) of the Security Exchange Commission Act.
NOTES TO THE FINANCIAL STATEMENTS

0163Annual Report 2017/18
THE RIGHT THINKING
36.1 Amounts due from related parties
Group CompanyAs at 31st March 2018 2017 2018 2017 Rs 000's Rs 000's Rs 000's Rs 000's
Ultimate Parent 753 1,845 753 1,845 Companies Under Common Control 1,050 28,310 1,118 2,469 Key management personnel (KMP) - - - Close family members of KMP - - -
1,803 30,155 1,871 4,314
36.2 Amounts due to related parties
Group CompanyAs at 31st March 2018 2017 2018 2017 Rs 000's Rs 000's Rs 000's Rs 000's
Ultimate Parent 2,528 1,857 2,183 1,520 Companies Under Common Control 873 1,296 1,578 6,951 Key management personnel 151 - - - Close family members of KMP - - - -
3,552 3,153 3,761 8,471
36.3 Transactions with related parties
Group CompanyAs at 31st March 2018 2017 2018 2017 Rs 000's Rs 000's Rs 000's Rs 000's
Ultimate Parent - John Keells Holdings PLCReceiving of Services for which fees are paid 32,507 28,188 18,373 16,323 Providing of Services for which fees are received (2,512) (210) - (210)
Companies under Common ControlPurchase of goods for a consideration 3,594 1,577 867 1,214 Receiving of Services for which fees are paid 10,087 10,187 6,985 7,403 Lending Money for which interest is received (17,984) (13,080) - -Renting of office space for which rent is received (1,622) (1,684) (1,622) (1,684)Proceeds Received for transfer of Fixed Assets - 315 - -Providing of Services for which fees are received (33,842) (24,781) (28,015) (24,671)
SubsidiariesRenting of stores space for which rent is paid - - 5,298 4,897
(9,772) 511 1,886 3,272
36.4 Key management personnel
Group CompanyAs at 31st March 2018 2017 2018 2017 Rs 000's Rs 000's Rs 000's Rs 000's
Short Term Employee Benefits 11,070 11,079 7,200 7,239 Share Based Payments - 7,470 - 7,470 Brokerage Commission earned on share transactions (1,934) (1,291) - -
9,136 17,258 7,200 14,709

0164 JOHN KEELLS PLC
36.5 Close family members of KMP
Group CompanyAs at 31st March 2018 2017 2018 2017 Rs 000's Rs 000's Rs 000's Rs 000's
(Receiving) / Rendering of services - - - -
Post employment benefit plan - - - -Contributions to the provident fund 11,777 10,607 11,777 10,607
37 COMMITMENTS & CONTINGENT LIABILITIES
Accounting Policy
Provisions are recognised when the Group has a present obligation (legal or constructive) as a result of a past event, it is probable that an outflow of resources embodying economic benefits will be required to settle the obligation and a reliable estimate can be made of the amount of the obligation. Where the Group expects some or all of a provision to be reimbursed, for example under an insurance contract, the reimbursement is recognised as a separate asset but only when the reimbursement is virtually certain. The expense relating to any provision is presented in the income statement net of any reimbursement. If the effect of the time value of money is material, provisions are discounted using a current pre-tax rate that reflects, where appropriate, the risks specific to the liability. Where discounting is used, the increase in the provision due to the passage of time is recognised as a finance cost.
All contingent liabilities are disclosed as a note to the financial statements unless the outflow of resources is remote. A contingent liability recognised in a business combination is initially measured at its fair value. Subsequently, it is measured at the higher of:
• The amount that would be recognised in accordance with the general guidance for provisions above (LKAS 37) or
• Contingent assets are disclosed, where inflow of economic benefit is probable.
37.1 Capital Commitments
The Company does not have significant capital commitments as at the reporting date.
37.2 Financial Commitments
The Company does not have significant financial commitments as at the reporting date.
37.3 Contingencies
There are no significant contingent liabilities as at the reporting date.
37.4 Assets Pledged
There are no assets pledged as security against borrowings as at 31 st March 2018.
38 EVENTS OCCURRING AFTER THE REPORTING PERIOD
The Board of Directors of the Company has declared first and final dividend of Rs 2.30 per share for the financial year ended 31 March 2018. As required by section 56 (2) of the Companies Act no 07 of 2007, the Board of Directors has confirmed that the Company satisfies the solvency test in accordance with section 57 of the companies Act No.07 of 2007, and has obtained a certificate from auditors, prior to declaring a first and final dividend which is to be paid on the 14th June 2018
NOTES TO THE FINANCIAL STATEMENTS

0165Annual Report 2017/18
THE RIGHT THINKING
1 STOCK EXCHANGE LISTING
The issued ordinary shares of John Keells PLC are listed with the Colombo Stock Exchange of Sri Lanka. The Audited Accounts of the Company and the Consolidated Accounts for the year ended 31st March 2018 have been submitted to the Colombo Stock Exchange.
Stock Symbol - JKL.N0000
ISIN - LK0093N00001
2 DISTRIBUTION OF SHAREHOLDINGS
31st March 2018 31st March 2017No. of Shares held Shareholders Holdings Shareholders Holdings
Number % Number % Number % Number %less than 1,000 819 67.08 203,872 0.33 773 64.96 201,246 0.331,001 - 10,000 298 24.40 1,049,602 1.73 311 26.13 1,111,322 1.8310,001 - 100,000 82 6.72 2,581,459 4.25 84 7.06 2,636,515 4.34100,001-1,000,000 21 1.72 4,130,283 6.79 21 1.77 4,016,133 6.601,000,001 and over 1 0.08 52,834,784 86.90 1 0.08 52,834,784 86.90Total 1,221 100.00 60,800,000 100.00 1,190 100.00 60,800,000 100.00
3 ANALYSIS OF SHAREHOLDERS
31st March 2018 31st March 2017Categories of Shareholders
Shareholders Holdings Shareholders HoldingsNumber % Number % Number % Number %
Individuals 1,132 92.71 5,427,828 9.80 1,099 92.35 5,450,332 8.96Institutions 89 7.29 55,372,172 91.07 91 7.65 55,349,668 91.04Total 1,221 100.00 60,800,000 100.00 1,190 100.00 60,800,000 100.00Residents 1,210 99.10 60,582,809 99.64 1,179 99.08 60,582,809 99.64Non-residents 11 0.90 217,191 0.36 11 0.92 217,191 0.36Total 1,221 100.00 60,800,000 100.00 1,190 100.00 60,800,000 100.00John Keells Holdings and subsidiaries 1 0.08 52,834,784 86.90 1 0.08 52,834,784 86.90
Public 1,220 99.92 7,965,216 13.10 1,189 99.92 7,965,216 13.10Total 1,221 100.00 60,800,000 100.00 1,190 100.00 60,800,000 100.00
4 SHARE PERFORMANCE AT COLOMBO STOCK EXCHANGE
2017/2018 2016/2017Highest market price 69.90 83.90Lowest market price 50.70 51.00Closing price as at 31st of March 59.10 51.10
5 DIVIDEND PAYMENTS
First and Final Dividend of Rs. 2.00 per share was paid on 14th June 2017.
INFORMATION TO SHAREHOLDERS AND INVESTORS
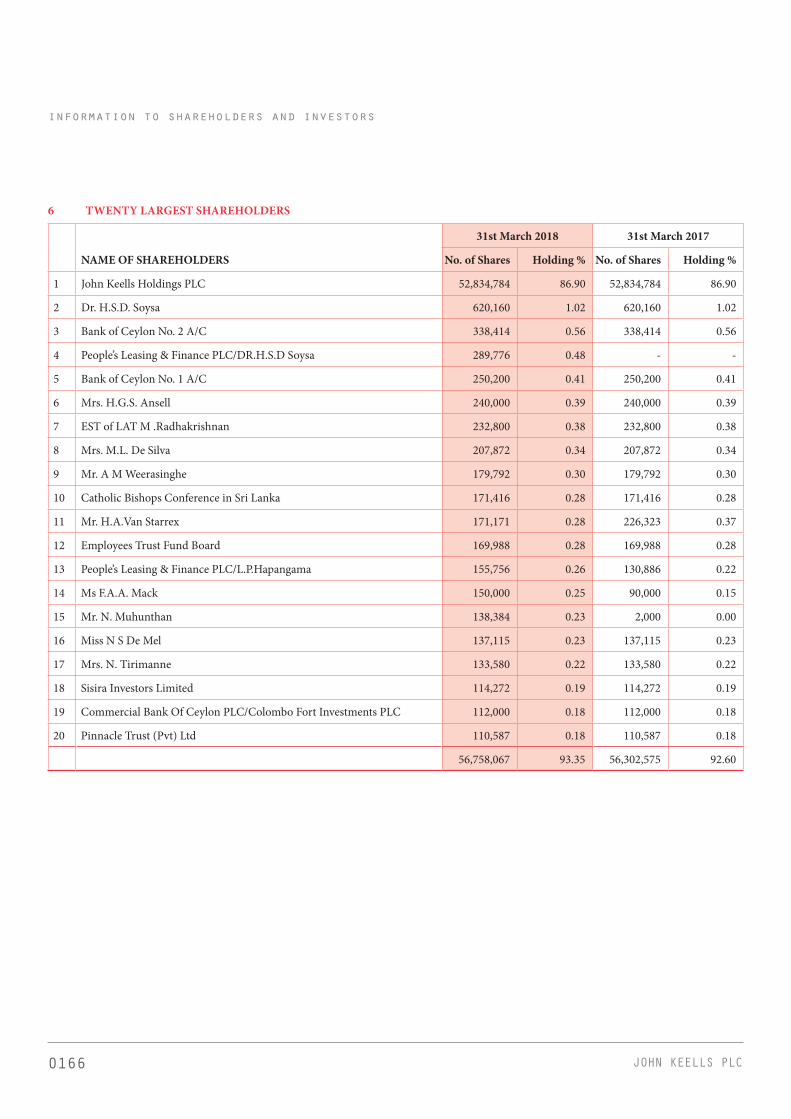
0166 JOHN KEELLS PLC
6 TWENTY LARGEST SHAREHOLDERS
31st March 2018 31st March 2017
NAME OF SHAREHOLDERS No. of Shares Holding % No. of Shares Holding %
1 John Keells Holdings PLC 52,834,784 86.90 52,834,784 86.90
2 Dr. H.S.D. Soysa 620,160 1.02 620,160 1.02
3 Bank of Ceylon No. 2 A/C 338,414 0.56 338,414 0.56
4 People’s Leasing & Finance PLC/DR.H.S.D Soysa 289,776 0.48 - -
5 Bank of Ceylon No. 1 A/C 250,200 0.41 250,200 0.41
6 Mrs. H.G.S. Ansell 240,000 0.39 240,000 0.39
7 EST of LAT M .Radhakrishnan 232,800 0.38 232,800 0.38
8 Mrs. M.L. De Silva 207,872 0.34 207,872 0.34
9 Mr. A M Weerasinghe 179,792 0.30 179,792 0.30
10 Catholic Bishops Conference in Sri Lanka 171,416 0.28 171,416 0.28
11 Mr. H.A.Van Starrex 171,171 0.28 226,323 0.37
12 Employees Trust Fund Board 169,988 0.28 169,988 0.28
13 People’s Leasing & Finance PLC/L.P.Hapangama 155,756 0.26 130,886 0.22
14 Ms F.A.A. Mack 150,000 0.25 90,000 0.15
15 Mr. N. Muhunthan 138,384 0.23 2,000 0.00
16 Miss N S De Mel 137,115 0.23 137,115 0.23
17 Mrs. N. Tirimanne 133,580 0.22 133,580 0.22
18 Sisira Investors Limited 114,272 0.19 114,272 0.19
19 Commercial Bank Of Ceylon PLC/Colombo Fort Investments PLC 112,000 0.18 112,000 0.18
20 Pinnacle Trust (Pvt) Ltd 110,587 0.18 110,587 0.18
56,758,067 93.35 56,302,575 92.60
information to shareholders and investors
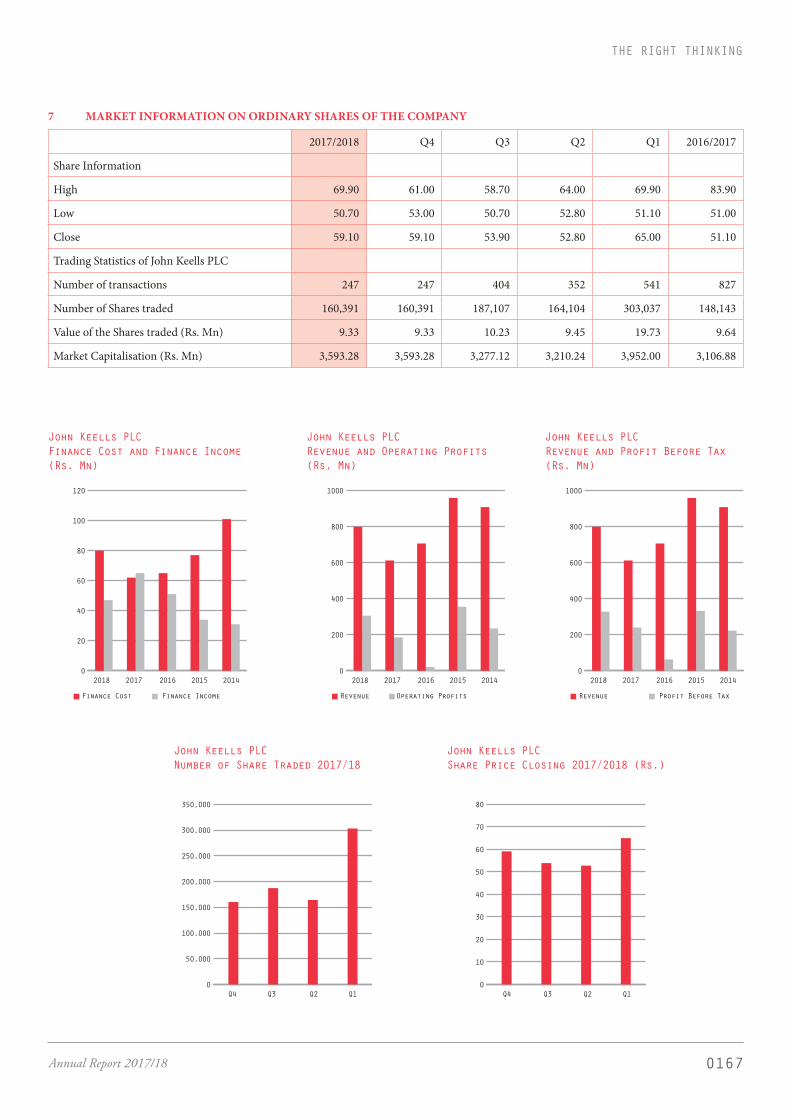
0167Annual Report 2017/18
THE RIGHT THINKING
7 MARKET INFORMATION ON ORDINARY SHARES OF THE COMPANY
2017/2018 Q4 Q3 Q2 Q1 2016/2017
Share Information
High 69.90 61.00 58.70 64.00 69.90 83.90
Low 50.70 53.00 50.70 52.80 51.10 51.00
Close 59.10 59.10 53.90 52.80 65.00 51.10
Trading Statistics of John Keells PLC
Number of transactions 247 247 404 352 541 827
Number of Shares traded 160,391 160,391 187,107 164,104 303,037 148,143
Value of the Shares traded (Rs. Mn) 9.33 9.33 10.23 9.45 19.73 9.64
Market Capitalisation (Rs. Mn) 3,593.28 3,593.28 3,277.12 3,210.24 3,952.00 3,106.88
0
50,000
100,000
150,000
200,000
250,000
300,000
350,000
John Keells PLCNumber of Share Traded 2017/18
Q4 Q3 Q2 Q1
0
200
400
600
800
1000
John Keells PLCRevenue and Operating Profits(Rs. Mn)
2018 2017 2016 2015 2014
Revenue Operating Profits
0
10
20
30
40
50
60
70
80
John Keells PLCShare Price Closing 2017/2018 (Rs.)
Q4 Q3 Q2 Q1
0
20
40
60
80
100
120
John Keells PLCFinance Cost and Finance Income(Rs. Mn)
2018 2017 2016 2015 2014
Finance Cost Finance Income
0
200
400
600
800
1000
John Keells PLCRevenue and Profit Before Tax(Rs. Mn)
2018 2017 2016 2015 2014
Revenue Profit Before Tax
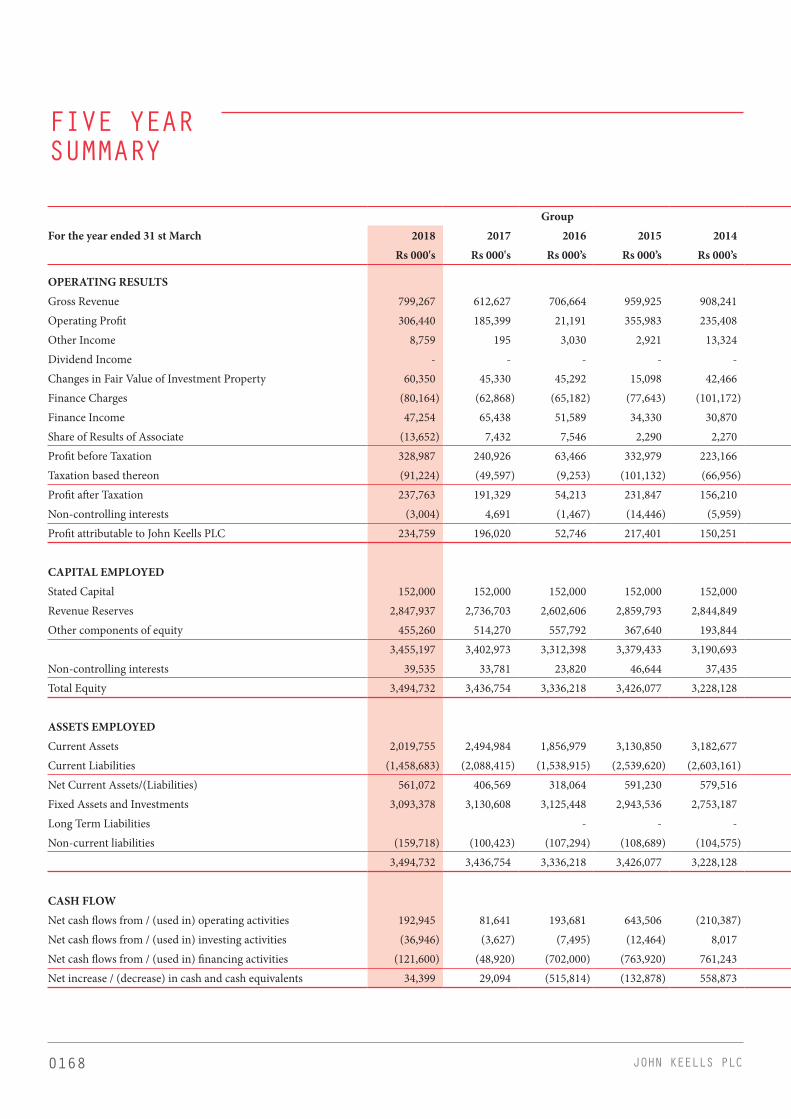
0168 JOHN KEELLS PLC
FIVE YEARSUMMARY
Group CompanyFor the year ended 31 st March 2018 2017 2016 2015 2014 2018 2017 2016 2015 2014 Rs 000's Rs 000's Rs 000’s Rs 000’s Rs 000’s Rs 000's Rs 000's Rs 000’s Rs 000’s Rs 000’s
OPERATING RESULTSGross Revenue 799,267 612,627 706,664 959,925 908,241 519,029 423,183 424,529 558,765 611,310 Operating Profit 306,440 185,399 21,191 355,983 235,408 279,229 207,315 (1,599) 244,812 181,673 Other Income 8,759 195 3,030 2,921 13,324 5,699 10 2 2,656 12,673 Dividend Income - - - - - 25,902 4,411 124,996 49,034 96,914 Changes in Fair Value of Investment Property 60,350 45,330 45,292 15,098 42,466 60,350 45,330 45,292 15,098 42,466 Finance Charges (80,164) (62,868) (65,182) (77,643) (101,172) (79,819) (62,671) (64,979) (77,394) (98,925)Finance Income 47,254 65,438 51,589 34,330 30,870 20,909 45,530 29,652 14,109 7,850 Share of Results of Associate (13,652) 7,432 7,546 2,290 2,270 - - - - Profit before Taxation 328,987 240,926 63,466 332,979 223,166 312,270 239,925 133,364 248,315 242,651 Taxation based thereon (91,224) (49,597) (9,253) (101,132) (66,956) (70,229) (51,057) 10,943 (60,024) (39,050)Profit after Taxation 237,763 191,329 54,213 231,847 156,210 242,041 188,868 144,307 188,291 203,601 Non-controlling interests (3,004) 4,691 (1,467) (14,446) (5,959) - - - - - Profit attributable to John Keells PLC 234,759 196,020 52,746 217,401 150,251 242,041 188,868 144,307 188,291 203,601
CAPITAL EMPLOYEDStated Capital 152,000 152,000 152,000 152,000 152,000 152,000 152,000 152,000 152,000 152,000 Revenue Reserves 2,847,937 2,736,703 2,602,606 2,859,793 2,844,849 2,697,374 2,579,617 2,452,151 2,610,820 2,626,361 Other components of equity 455,260 514,270 557,792 367,640 193,844 267,577 296,305 348,266 174,124 18,412
3,455,197 3,402,973 3,312,398 3,379,433 3,190,693 3,116,951 3,027,922 2,952,417 2,936,944 2,796,773 Non-controlling interests 39,535 33,781 23,820 46,644 37,435 - - - Total Equity 3,494,732 3,436,754 3,336,218 3,426,077 3,228,128 3,116,951 3,027,922 2,952,417 2,936,944 2,796,773
ASSETS EMPLOYEDCurrent Assets 2,019,755 2,494,984 1,856,979 3,130,850 3,182,677 1,573,039 1,433,767 1,373,723 2,547,576 2,867,632 Current Liabilities (1,458,683) (2,088,415) (1,538,915) (2,539,620) (2,603,161) (1,222,008) (1,220,621) (1,176,251) (2,198,427) (2,471,584)Net Current Assets/(Liabilities) 561,072 406,569 318,064 591,230 579,516 351,031 213,146 197,472 349,149 396,048 Fixed Assets and Investments 3,093,378 3,130,608 3,125,448 2,943,536 2,753,187 2,802,987 2,846,609 2,796,890 2,629,251 2,440,958 Long Term Liabilities - - - - - - - Non-current liabilities (159,718) (100,423) (107,294) (108,689) (104,575) (37,067) (31,833) (41,945) (41,456) (40,233)
3,494,732 3,436,754 3,336,218 3,426,077 3,228,128 3,116,951 3,027,922 2,952,417 2,936,944 2,796,773
CASH FLOWNet cash flows from / (used in) operating activities 192,945 81,641 193,681 643,506 (210,387) 97,201 110,761 265,043 469,013 (180,726)Net cash flows from / (used in) investing activities (36,946) (3,627) (7,495) (12,464) 8,017 3,481 (1,303) 24,609 4,353 20,075 Net cash flows from / (used in) financing activities (121,600) (48,920) (702,000) (763,920) 761,243 (121,600) (60,800) (678,000) (756,720) 787,200 Net increase / (decrease) in cash and cash equivalents 34,399 29,094 (515,814) (132,878) 558,873 (20,918) 48,658 (388,348) (283,354) 626,549
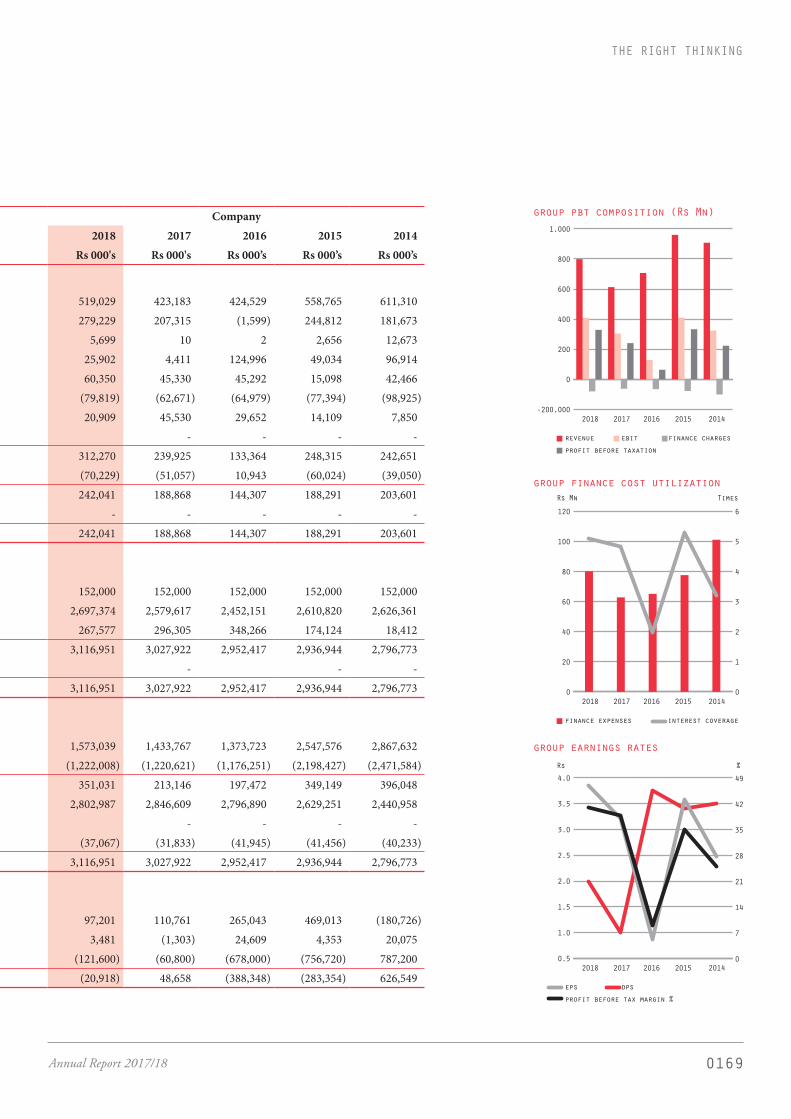
0169Annual Report 2017/18
THE RIGHT THINKING
Group CompanyFor the year ended 31 st March 2018 2017 2016 2015 2014 2018 2017 2016 2015 2014 Rs 000's Rs 000's Rs 000’s Rs 000’s Rs 000’s Rs 000's Rs 000's Rs 000’s Rs 000’s Rs 000’s
OPERATING RESULTSGross Revenue 799,267 612,627 706,664 959,925 908,241 519,029 423,183 424,529 558,765 611,310 Operating Profit 306,440 185,399 21,191 355,983 235,408 279,229 207,315 (1,599) 244,812 181,673 Other Income 8,759 195 3,030 2,921 13,324 5,699 10 2 2,656 12,673 Dividend Income - - - - - 25,902 4,411 124,996 49,034 96,914 Changes in Fair Value of Investment Property 60,350 45,330 45,292 15,098 42,466 60,350 45,330 45,292 15,098 42,466 Finance Charges (80,164) (62,868) (65,182) (77,643) (101,172) (79,819) (62,671) (64,979) (77,394) (98,925)Finance Income 47,254 65,438 51,589 34,330 30,870 20,909 45,530 29,652 14,109 7,850 Share of Results of Associate (13,652) 7,432 7,546 2,290 2,270 - - - - Profit before Taxation 328,987 240,926 63,466 332,979 223,166 312,270 239,925 133,364 248,315 242,651 Taxation based thereon (91,224) (49,597) (9,253) (101,132) (66,956) (70,229) (51,057) 10,943 (60,024) (39,050)Profit after Taxation 237,763 191,329 54,213 231,847 156,210 242,041 188,868 144,307 188,291 203,601 Non-controlling interests (3,004) 4,691 (1,467) (14,446) (5,959) - - - - - Profit attributable to John Keells PLC 234,759 196,020 52,746 217,401 150,251 242,041 188,868 144,307 188,291 203,601
CAPITAL EMPLOYEDStated Capital 152,000 152,000 152,000 152,000 152,000 152,000 152,000 152,000 152,000 152,000 Revenue Reserves 2,847,937 2,736,703 2,602,606 2,859,793 2,844,849 2,697,374 2,579,617 2,452,151 2,610,820 2,626,361 Other components of equity 455,260 514,270 557,792 367,640 193,844 267,577 296,305 348,266 174,124 18,412
3,455,197 3,402,973 3,312,398 3,379,433 3,190,693 3,116,951 3,027,922 2,952,417 2,936,944 2,796,773 Non-controlling interests 39,535 33,781 23,820 46,644 37,435 - - - Total Equity 3,494,732 3,436,754 3,336,218 3,426,077 3,228,128 3,116,951 3,027,922 2,952,417 2,936,944 2,796,773
ASSETS EMPLOYEDCurrent Assets 2,019,755 2,494,984 1,856,979 3,130,850 3,182,677 1,573,039 1,433,767 1,373,723 2,547,576 2,867,632 Current Liabilities (1,458,683) (2,088,415) (1,538,915) (2,539,620) (2,603,161) (1,222,008) (1,220,621) (1,176,251) (2,198,427) (2,471,584)Net Current Assets/(Liabilities) 561,072 406,569 318,064 591,230 579,516 351,031 213,146 197,472 349,149 396,048 Fixed Assets and Investments 3,093,378 3,130,608 3,125,448 2,943,536 2,753,187 2,802,987 2,846,609 2,796,890 2,629,251 2,440,958 Long Term Liabilities - - - - - - - Non-current liabilities (159,718) (100,423) (107,294) (108,689) (104,575) (37,067) (31,833) (41,945) (41,456) (40,233)
3,494,732 3,436,754 3,336,218 3,426,077 3,228,128 3,116,951 3,027,922 2,952,417 2,936,944 2,796,773
CASH FLOWNet cash flows from / (used in) operating activities 192,945 81,641 193,681 643,506 (210,387) 97,201 110,761 265,043 469,013 (180,726)Net cash flows from / (used in) investing activities (36,946) (3,627) (7,495) (12,464) 8,017 3,481 (1,303) 24,609 4,353 20,075 Net cash flows from / (used in) financing activities (121,600) (48,920) (702,000) (763,920) 761,243 (121,600) (60,800) (678,000) (756,720) 787,200 Net increase / (decrease) in cash and cash equivalents 34,399 29,094 (515,814) (132,878) 558,873 (20,918) 48,658 (388,348) (283,354) 626,549
-200,000
0
200
400
600
800
1,000
group pbt composition (Rs Mn)
revenue ebit finance chargesprofit before taxation
2018 2017 2016 2015 2014
0
20
40
60
80
100
120
0
1
2
3
4
5
6
group finance cost utilization
finance expenses interest coverage
2018 2017 2016 2015 2014
0.5
1.0
1.5
2.0
2.5
3.0
3.5
4.0
group earnings rates
eps dpsprofit before tax margin %
2018 2017 2016 2015 20140
7
14
21
28
35
42
49
TimesRs Mn
%Rs

0170 JOHN KEELLS PLC
Group CompanyFor the year ended 31 st March 2018 2017 2016 2015 2014 2018 2017 2016 2015 2014 Rs 000's Rs 000's Rs 000’s Rs 000’s Rs 000’s Rs 000's Rs 000's Rs 000’s Rs 000’s Rs 000’s
KEY INDICATORS(A) Profitability & Return to ShareholdersAnnual Turnover Growth (%) 30.47 (13.31) (26.38) 9.73 5.84 22.65 (0.32) (24.02) (2.90) 6.70Net Profit Ratio (%) 29.75 31.23 7.67 24.15 17.20 46.63 44.63 33.99 33.70 33.31Earnings per share (Rs.) * 3.86 3.22 0.87 3.58 2.47 3.98 3.11 2.37 3.10 3.35Returns on Shareholders' Funds (%) 6.93 5.76 1.59 6.43 4.65 7.77 6.24 4.89 6.41 7.23Return on Capital Employed (%) 9.81 7.45 3.24 9.58 7.59 10.30 8.18 5.51 8.45 8.83Dividend per share (Rs.)* 2.00 1.00 3.75 3.40 3.50 2.00 1.00 3.75 3.40 3.50Debt Equity Ratio (%) 20.61 19.79 19.68 26.88 33.84 22.07 22.21 21.97 30.77 38.37
(B) LiquidityCurrent Ratio (No. of Times) 1.38 1.19 1.21 1.23 1.22 1.29 1.17 1.17 1.16 1.16Interest Cover (No. of Times) 5.10 4.83 1.97 5.29 3.21 4.91 4.83 3.05 4.21 4.38
(C) Investor RatioNet Assets per share at year end (Rs.)* 56.83 55.97 54.48 55.58 52.48 51.27 49.80 48.56 48.31 46.00Price Earning Ratio (Times)* 15.31 15.85 80.69 25.73 28.34 14.85 16.45 29.49 29.71 20.90Enterprise Value (Rs. 000's) 3,350,365 2,829,567 3,949,592 5,353,007 3,598,285 3,058,627 2,593,145 3,693,608 4,969,556 3,365,310Dividends (Rs. 000's) 121,600 60,800 228,000 206,720 212,800 121,600 60,800 228,000 206,720 212,800Dividend Cover (Times)* 1.95 3.22 0.23 1.05 0.71 1.99 3.11 0.63 0.91 0.96
(D) Share ValuationMarket price per share (Rs.) 59.10 51.10 70.00 92.00 70.00 59.10 51.10 70.00 92.00 70.00Market Capitalisation (Rs. 000's) 3,593,280 3,106,880 4,256,000 5,593,600 4,256,000 3,593,280 3,106,880 4,256,000 5,593,600 4,256,000
(E) Other InformationNumber of Employees** 85 92 96 96 95 61 58 64 66 65Turnover per employee (Rs.000's) 9,403 6,658 7,361 9,999 9,560 8,509 7,296 6,633 8,466 9,405Value Added per Employee (Rs. 000's) 10,612 7,946 8,480 10,568 10,497 9,934 8,863 7,804 8,949 10,374
Note:*Earnings per share, Dividends per share & Net Assets per share is based on 60,800,000 number of shares in issue as at 31st March 2018.** Excluding contract Employees
KEY RATIOS ANDINFORMATION
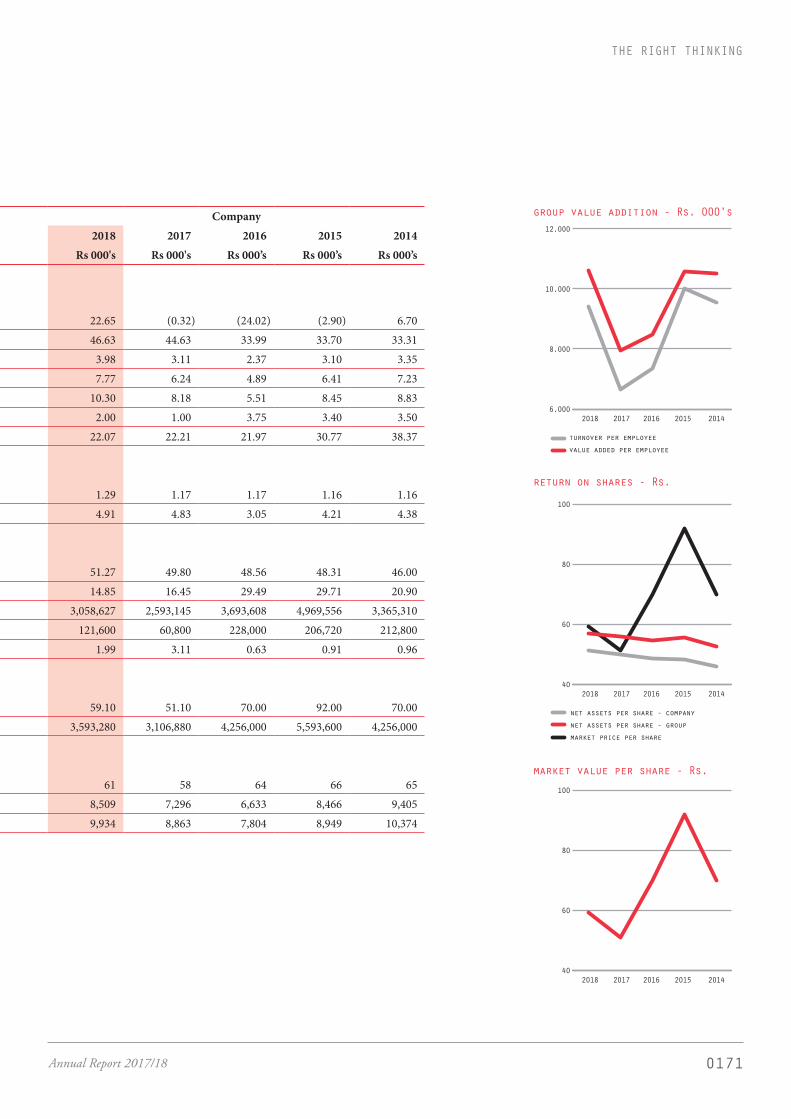
0171Annual Report 2017/18
THE RIGHT THINKING
Group CompanyFor the year ended 31 st March 2018 2017 2016 2015 2014 2018 2017 2016 2015 2014 Rs 000's Rs 000's Rs 000’s Rs 000’s Rs 000’s Rs 000's Rs 000's Rs 000’s Rs 000’s Rs 000’s
KEY INDICATORS(A) Profitability & Return to ShareholdersAnnual Turnover Growth (%) 30.47 (13.31) (26.38) 9.73 5.84 22.65 (0.32) (24.02) (2.90) 6.70Net Profit Ratio (%) 29.75 31.23 7.67 24.15 17.20 46.63 44.63 33.99 33.70 33.31Earnings per share (Rs.) * 3.86 3.22 0.87 3.58 2.47 3.98 3.11 2.37 3.10 3.35Returns on Shareholders' Funds (%) 6.93 5.76 1.59 6.43 4.65 7.77 6.24 4.89 6.41 7.23Return on Capital Employed (%) 9.81 7.45 3.24 9.58 7.59 10.30 8.18 5.51 8.45 8.83Dividend per share (Rs.)* 2.00 1.00 3.75 3.40 3.50 2.00 1.00 3.75 3.40 3.50Debt Equity Ratio (%) 20.61 19.79 19.68 26.88 33.84 22.07 22.21 21.97 30.77 38.37
(B) LiquidityCurrent Ratio (No. of Times) 1.38 1.19 1.21 1.23 1.22 1.29 1.17 1.17 1.16 1.16Interest Cover (No. of Times) 5.10 4.83 1.97 5.29 3.21 4.91 4.83 3.05 4.21 4.38
(C) Investor RatioNet Assets per share at year end (Rs.)* 56.83 55.97 54.48 55.58 52.48 51.27 49.80 48.56 48.31 46.00Price Earning Ratio (Times)* 15.31 15.85 80.69 25.73 28.34 14.85 16.45 29.49 29.71 20.90Enterprise Value (Rs. 000's) 3,350,365 2,829,567 3,949,592 5,353,007 3,598,285 3,058,627 2,593,145 3,693,608 4,969,556 3,365,310Dividends (Rs. 000's) 121,600 60,800 228,000 206,720 212,800 121,600 60,800 228,000 206,720 212,800Dividend Cover (Times)* 1.95 3.22 0.23 1.05 0.71 1.99 3.11 0.63 0.91 0.96
(D) Share ValuationMarket price per share (Rs.) 59.10 51.10 70.00 92.00 70.00 59.10 51.10 70.00 92.00 70.00Market Capitalisation (Rs. 000's) 3,593,280 3,106,880 4,256,000 5,593,600 4,256,000 3,593,280 3,106,880 4,256,000 5,593,600 4,256,000
(E) Other InformationNumber of Employees** 85 92 96 96 95 61 58 64 66 65Turnover per employee (Rs.000's) 9,403 6,658 7,361 9,999 9,560 8,509 7,296 6,633 8,466 9,405Value Added per Employee (Rs. 000's) 10,612 7,946 8,480 10,568 10,497 9,934 8,863 7,804 8,949 10,374
Note:*Earnings per share, Dividends per share & Net Assets per share is based on 60,800,000 number of shares in issue as at 31st March 2018.** Excluding contract Employees
6,000
8,000
10,000
12,000
group value addition - Rs. 000's
turnover per employee value added per employee
2018 2017 2016 2015 2014
40
60
80
100
market value per share - Rs.
market value per share
2018 2017 2016 2015 2014
40
60
80
100
return on shares - Rs.
net assets per share - companynet assets per share - groupmarket price per share
2018 2017 2016 2015 2014

0172 JOHN KEELLS PLC
GLOSSARY OF FINANCIAL TERMS
ACCRUAL BASISRecording Revenues and Expenses in the period in which they are earned or incurred regardless of whether cash is received or disbursed in that period.
CAPITAL EMPLOYEDShareholders’ Funds plus Debt
CONTINGENT LIABILITIESA condition or situation existing at the Balance Sheet date due to past events, where the financial effect is not recognised because:
1. The obligation is crystallised by the occurrence or non occurrence of one or more future events or,
2. A probable outflow of economic resources is not expected or,
3. It is unable to be measured with sufficient reliability
CURRENT RATIOCurrent Assets over Current Liabilities
DEBT/EQUITY RATIODebt as a percentage of Shareholders Funds
DIVIDEND COVEREarnings per Share over Dividends per Share
DIVIDEND PAYOUT RATIODividend paid as a percentage of Company profits.
DIVIDEND YIELDDividends in number of shares in issue as a percentage of the share price at the end of the period.
EARNINGS PER SHARE (EPS)Profit after tax attributable to ordinary shareholding over weighted average numbers of shares in issue during the period
EARNINGS YIELDEarnings per Share as a percentage of Market price per Share end of the period.
EARNINGS BEFORE INTEREST AND TAX (EBIT)Earnings before interest and tax (includes other operating income)
EFFECTIVE RATE OF TAXATIONIncome Tax, including deferred tax over Profit before Tax
ENTERPRISE VALUE (EV)Market capitalisation plus net debt/(net cash).
INTEREST COVERProfit before Interest and Tax over Finance Expenses
MARKET CAPITALISATIONNumber of Shares in issue at the end of the period multiplied by the Market price at end of period
NET ASSETSTotal assets minus Current Liabilities minus Long Term Liabilities minus Minority Interest
NET ASSET PER SHARENet Assets, over number of Ordinary Shares in issue
NET DEBTTotal debt minus (cash plus short-term deposits).
NET TURNOVER PER EMPLOYEENet Turnover over average number of employees
PRICE EARNINGS RATIOMarket Price per Share over Earnings per Share
QUICK ASSET RATIOCash plus Short Term Investments plus Receivables, Dividend by Current Liabilities
QUICK RATIOCash plus Short Term Investments plus Receivables over Current Liabilities
RETURN ON ASSETSProfit after Tax over Average Total Assets
RETURN ON EQUITYProfit after Tax as a percentage of Average Shareholder’s Funds
RETURN ON CAPITAL EMPLOYEDEarning before interest and tax as percentage of Capital Employed
SHAREHOLDERS FUNDSStated Capital plus other components of equity Plus Revenue Reserves
TOTAL ASSETSFixed Assets plus Investments plus Non Current Assets plus Current Assets
TOTAL DEBTLong Term Loans plus Short Term Loans and Overdrafts
TOTAL EQUITYShareholders’ funds plus non-controlling interest
TOTAL VALUE ADDEDThe difference between revenue (including other income) and expenses, cost of materials and services purchased from external sources
WORKING CAPITALCapital required finance the day-to-day operations Current Assets minus Current Liabilities

0173Annual Report 2017/18
THE RIGHT THINKING
NOTICE OF MEETING
Notice is hereby given that the Seventy First Annual General Meeting of John Keells PLC will be held on Monday 25th June 2018 at 9.30 a.m. at the John Keells Auditorium, 186 Vauxhall Street, Colombo 02.
The business to be brought before the meeting will be:
• To read the Notice Convening the Meeting.
• To receive and consider the Annual Report and Financial Statements of the company for the financial year ended 31 March 2018 with the Report of the Auditors thereon.
• To re-elect as Director, Mr V. A. A. Perera who retires in terms of Article 83 of the Articles of Association of the Company. A brief profile of Mr. V. A. A. Perera is contained in the Board of Directors Section on page 66 of the Annual Report.
• To re-elect as Director, Ms. A K Gunawardhana who retires in terms of Article 83 of the Articles of Association of the Company. A brief profile of Ms. A K Gunawardhana is contained in the Board of Directors Section on page 67 of the Annual Report.
• To re-elect as Director, Mr. K. N. J. Balendra who retires in terms of Article 90 of the Articles of Association of the Company. A brief profile of Mr. K. N. J. Balendra is contained in the Board of Directors section on page 66 of the Annual Report.
• To re-elect as Director, Mr J. G. A. Cooray who retires in terms of Article 90 of the Articles of Association of the Company. A brief profile of Mr. J. G. A. Cooray is contained in the Board of Directors Section on page 66 of the Annual Report.
• To re-appoint Auditors and to authorize the Directors to determine their remuneration.
• To consider any other business of which due notice has been given in terms of the relevant laws and regulations.
By order of the Board JOHN KEELLS PLC
Keells Consultants (Private) LimitedSecretariesColombo
28th May 2018
Notes:i. A member unable to attend is entitled to appoint a Proxy to attend and vote in his/her place.ii. A Proxy need not be a member of the Company.iii. A member wishing to vote by Proxy at the Meeting may use the Proxy Form enclosed.iv. In order to be valid, the completed Proxy Form must be lodged at the Registered Office of the Company not less than 48 hours before the
meeting.v. If a poll is demanded, a vote can be taken on a show of hands or by a poll. Each share is entitled to one vote. Votes can be cast in person,
by proxy or corporate representatives. In the event an individual member and his proxy holder are both present at the meeting, only the member’s vote is counted. If the proxy holder’s appointor has indicated the manner of voting, only the appointor’s indication of the manner to vote will be used.

0174 JOHN KEELLS PLC
Notes
0175Annual Report 2017/18
THE RIGHT THINKING
FORM OF PROXY
I/We ................................................................................................................................................................................................................................................of
................................................................................................................................................. being a member/members of John Keells PLC hereby appoint
.............................................................................................................................................................................................................................................................
of ........................................................................................................................................................................................................................ or, failing him/her
Mr. Susantha Chaminda Ratnayake or, failing himMr. Krishan Niraj Jayasekara Balendra or, failing himMr. Joseph Gihan Adisha Cooray or, failing himMr. Vithanage Anil Augustine Perera or, failing himMs. Anandhiy Krisnajina Gunawardhana or, failing herMr. Charitha Nissanka Wijewardane or, failing himMs. Bodiyabaduge Arundathi Indira Rajakarier
as my/our proxy to represent me/us and vote on my/our behalf at the Seventy First Annual General Meeting of the Company to be held on Monday, 25th June 2018 at 9.30 a.m. and at any adjournment thereof, and at every poll which may be taken on consequence thereof.
I/We, the undersigned, hereby direct my/our proxy to vote for me/us and on my/our behalf on the specified Resolution as indicated by the letter “X” in the appropriate cage:
FOR AGAINST
i) To re-elect as Director, Mr. V. A. A. Perera who retires in terms of Article 83 of the Article of Association of the Company.
ii) To re-elect as Director, Ms. A K Gunawardhana who retires in terms of Article 83 of the Article of Association of the Company.
iii) To re-elect as Director, Mr. K. N. J. Balendra who retires, in terms of Article 90 of the Articles of Association of the Company.
iv) To re-elect as Director, Mr. J. G. A. Cooray who retires in terms of Article 90 of the Article of the Association of the Company.
v) To re-appoint Auditors and to authorize the Directors to determine their remuneration.
Signed this ……..………………….. day of …………………...Two Thousand and Eighteen.
Signature/s of Shareholder/s
NOTE: INSTRUCTIONS AS TO COMPLETION OF PROXY FORM ARE NOTED ON THE REVERSE.

0176 JOHN KEELLS PLC
INSTRUCTIONS AS TO COMPLETION OF PROXY
1. Please perfect the Form of Proxy by filling in legibly your full name and address, signing in the space provided and filling in the date of signature.
2. The completed Form of Proxy should be deposited at the Company’s registered address at No. 117, Sir Chittampalam A. Gardiner Mawatha Colombo 2, not later than 48 hours before the time appointed for the holding of the Meeting.
3. If the Form of Proxy is signed by an Attorney, the relevant Power of Attorney should accompany the completed Form of Proxy for registration, if such Power of Attorney has not already been registered with the Company.
4. If the appointer is a company or Corporation, the Form of Proxy should be executed under its Common Seal or by a duly authorised officer of the company or Corporation in accordance with its Articles of Association or Constitution.
5. If this Form of Proxy is returned without any indication of how the person appointed as Proxy shall vote, then the Proxy shall exercise his/her discretion as to how he/she votes or, whether or not he/she abstains from voting.
Please fill in the following details:
Name : ......................................................................................................................................
Address : .......................................................................................................................................
........................................................................................................................................
........................................................................................................................................
Jointly with : .......................................................................................................................................
Share Folio No. : .......................................................................................................................................

NAME OF COMPANYJohn Keells PLC
COMPANY REGISTRATION NUMBERPQ 11
NAME OF SUBSIDIARIESJohn Keells Stock Brokers (Pvt) LimitedJohn Keells Warehousing (Pvt) Limited
NAME OF ASSOCIATE COMPANYKeells Realtors Limited
LEGAL FORM:Public Limited Liability Company listed on the Colombo Stock Exchange(Incorporated in Sri Lanka in 1960)
REGISTERED OFFICE:No. 117, Sir Chittampalam A. Gardiner Mawatha Colombo 2, Sri LankaTel: 2306000Telefax: 2446223E-mail: [email protected]
BUSINESS ADDRESS:No. 186, Vauxhall Street,Colombo 2.
DIRECTORSS.C. RatnayakeK.N.J. BalendraJ. G. A. Cooray V.A.A. PereraB.A.I. RajakarierC.N. WijewardaneA.K. Gunawardhana
SECRETARIES & REGISTRARSKeells Consultants (Pvt) LimitedNo. 117, Sir Chittampalam A. Gardiner Mawatha Colombo 2.
AUDITORSMessrs. Ernst & YoungChartered AccountantsP.O. Box 101, Colombo
PRINCIPAL BANKERS (in alphabetical Order)Bank of CeylonCommercial Bank of Ceylon PLCDeutsche BankDFCC Vardhana BankHatton National BankHongkong & Shanghai Banking Corporation Ltd.Nation’s Trust BankNational Development Bank PLCPeople’s BankSampath Bank PLCSeylan Bank PLCStandard Chartered Bank
CORPORATE INFORMATION
Designed & produced by
Printed by Printage (Pvt) Ltd
GRI 102-01, 102-02, 102-03, 102-04, 102-05

John Keells PLCNo. 117, Sir Chittampalam A. Gardiner Mawatha
Colombo 2, Sri LankaTel: [email protected]
Related Documents