The revenue crisis: when will the airline industry recover? Narjess Teyssier ICAO Chief Economic Analysis & Policy Section Montréal 26 September 2010

The revenue crisis: when will the airline industry recover? Narjess Teyssier ICAO n Chief Economic Analysis & Policy Section Montréal 26 September 2010.
Dec 15, 2015
Welcome message from author
This document is posted to help you gain knowledge. Please leave a comment to let me know what you think about it! Share it to your friends and learn new things together.
Transcript

The revenue crisis: when will the airline industry recover?The revenue crisis: when will the airline industry recover?
Narjess TeyssierICAO
Chief Economic Analysis & Policy Section
Montréal 26 September 2010
Narjess TeyssierICAO
Chief Economic Analysis & Policy Section
Montréal 26 September 2010
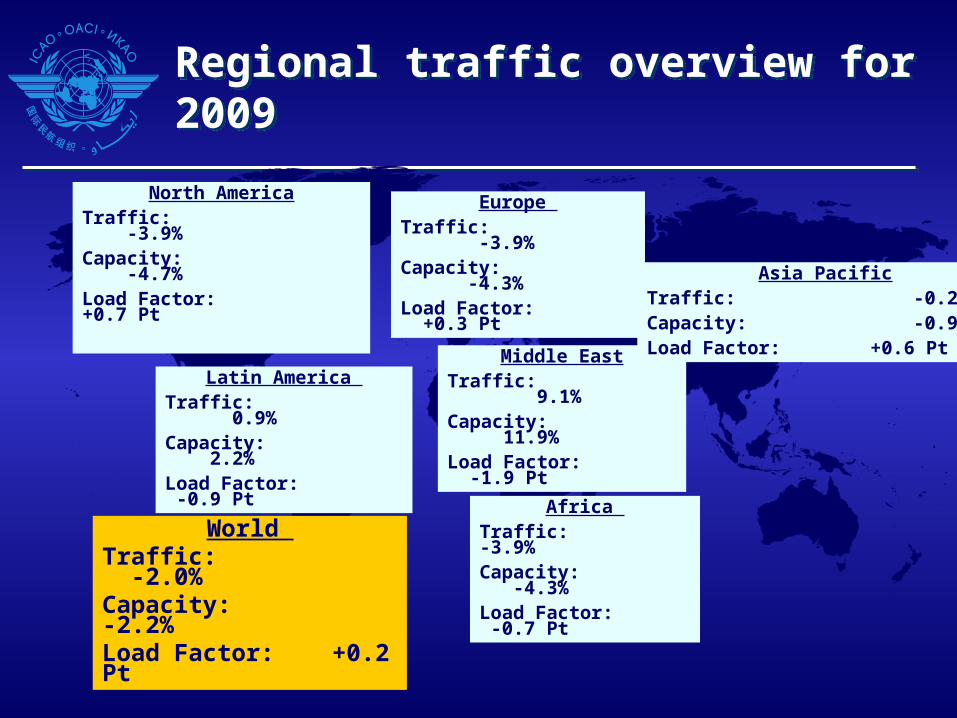
Regional traffic overview for 2009 Regional traffic overview for 2009
North AmericaTraffic: -3.9%Capacity: -4.7% Load Factor: +0.7 Pt
Latin America Traffic: 0.9%Capacity: 2.2% Load Factor: -0.9 Pt
Europe Traffic: -3.9%Capacity: -4.3% Load Factor: +0.3 Pt
Africa Traffic: -3.9%Capacity: -4.3% Load Factor: -0.7 Pt
Middle EastTraffic: 9.1%Capacity: 11.9% Load Factor: -1.9 Pt
Asia PacificTraffic: -0.2%Capacity: -0.9% Load Factor: +0.6 Pt
World Traffic: -2.0%Capacity: -2.2% Load Factor: +0.2 Pt
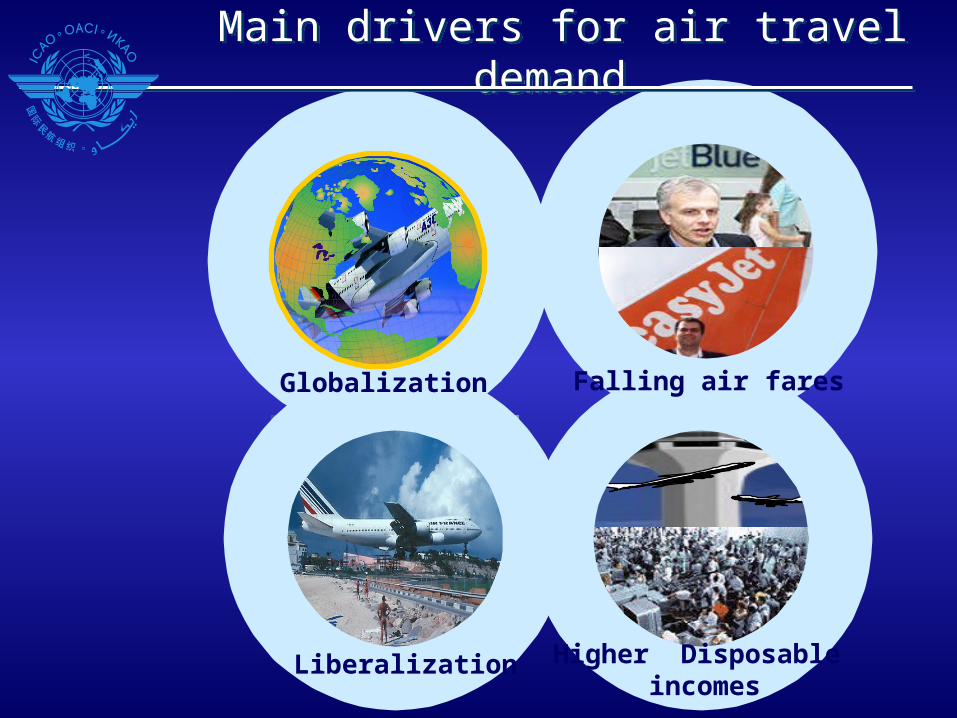
Higher Disposable incomes
Liberalization
Falling air faresGlobalization
Main drivers for air travel demand Main drivers for air travel demand

ICAN: ICAO forum for liberalizationICAN: ICAO forum for liberalization
0%
10%
20%
30%
40%
50%
60%
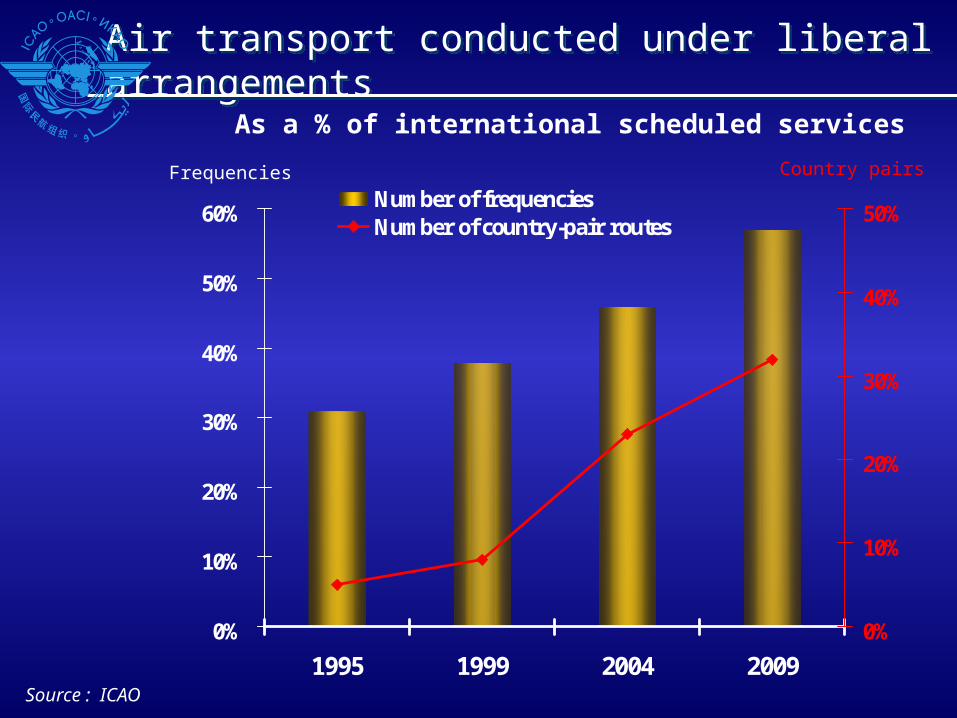
1995 1999 2004 2009
0%
10%
20%
30%
40%
50%Number of frequenciesNumber of country-pair routes
As a % of international scheduled services
Air transport conducted under liberal arrangementsAir transport conducted under liberal arrangements
Source : ICAO
Frequencies Country pairs

Number of LCCs : 13Deregulation : 1978
Number of LCCs : 33
Deregulation : accelerating
Number of LCCs (Africa and Middle East) : 10
Deregulation : uneven
Number of LCCs : 10
Deregulation : in progress
LCCs development by region
Network carriers
79%
LCCs
21%
Network carriers
86%
LCCs
14%
Network carriers
79%
LCCs
21%
Number of LCCs : 48
Deregulation : 1987- 1997
Network carriers
76%
LCCs
24%
Network carriers
91%
LCCs
9%
Liberalization: a necessary frame for Low Cost Carriers development

0
500
1000
1500
2000
2500
3000
3500
4000
4500
5000
Traffic Billions RPK
LCCsNon Scheduled carriersLegacy carriers
Low Cost Carriers progression Low Cost Carriers progression
Source: ICAO
1999-2009:14% p.a.
1999-2009:4.3 %p.a.
Total European air traffic
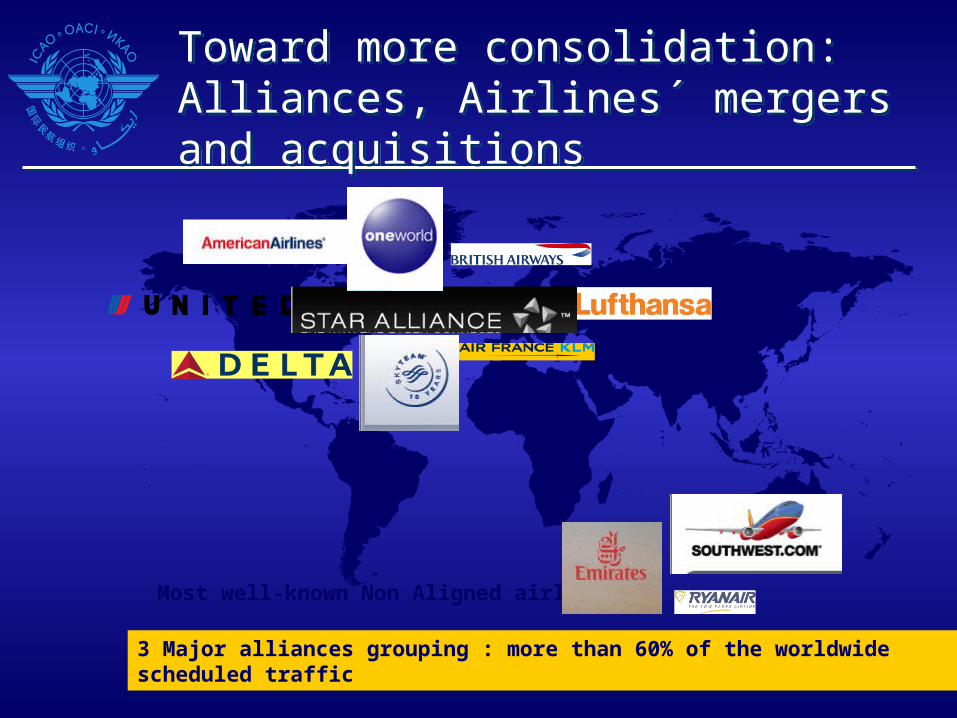
Toward more consolidation: Alliances, Airlines´ mergers and acquisitionsToward more consolidation: Alliances, Airlines´ mergers and acquisitions
3 Major alliances grouping : more than 60% of the worldwide scheduled traffic
Most well-known Non Aligned airlines
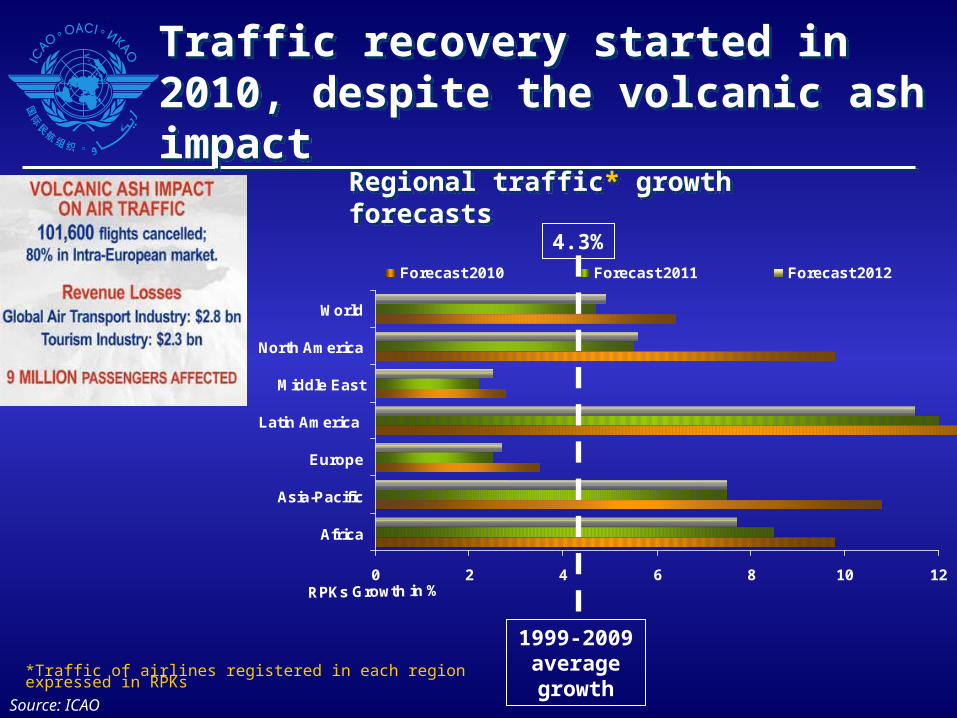
Traffic recovery started in 2010, despite the volcanic ash impactTraffic recovery started in 2010, despite the volcanic ash impact
Source: ICAO
0 2 4 6 8 10 12
Africa
Asia-Pacific
Europe
Latin America
Middle East
North America
World
RPKs Growth in %
Forecast 2010 Forecast 2011 Forecast 2012
1999-2009 average growth
4.3%
*Traffic of airlines registered in each region expressed in RPKs
Regional traffic* growth forecastsRegional traffic* growth forecasts

Challenges ahead for the airline industryChallenges ahead for the airline industry
How has the financial crisis impacted airlines and other industry stakeholders?
What are the recovery strategies?
Does liberalization improve or worsen the financial condition of airlines?
How do alliances and antitrust immunity enhance revenue, reduce costs, and affect consumer welfare?
Where will the industry be in five years?
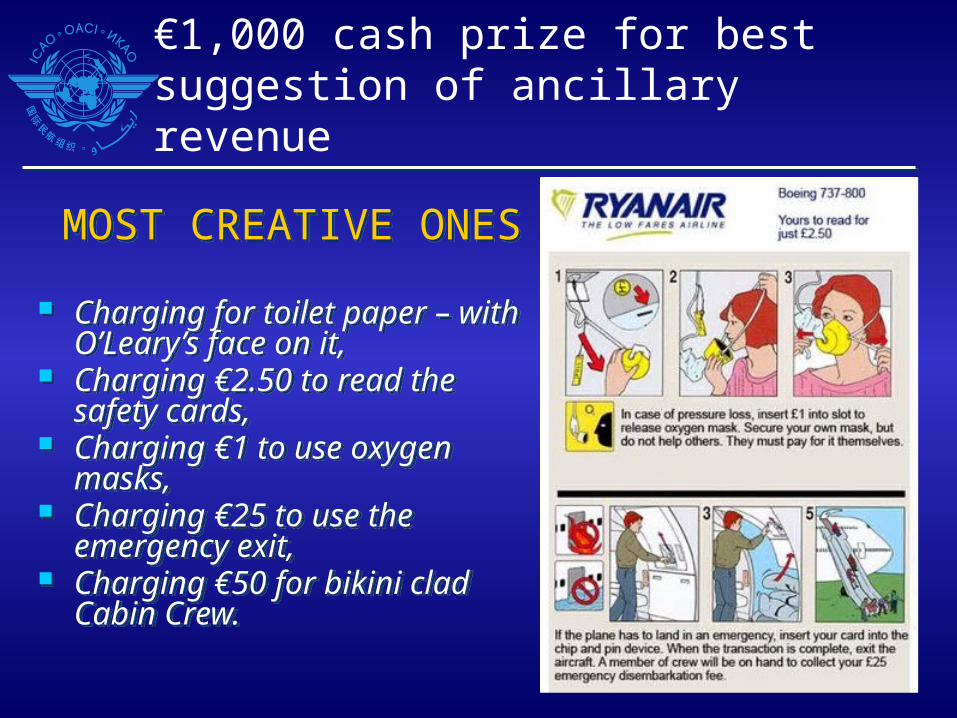
MOST CREATIVE ONES
Charging for toilet paper – with O’Leary’s face on it,
Charging €2.50 to read the safety cards,
Charging €1 to use oxygen masks,
Charging €25 to use the emergency exit,
Charging €50 for bikini clad Cabin Crew.
MOST CREATIVE ONES
Charging for toilet paper – with O’Leary’s face on it,
Charging €2.50 to read the safety cards,
Charging €1 to use oxygen masks,
Charging €25 to use the emergency exit,
Charging €50 for bikini clad Cabin Crew.
€1,000 cash prize for best suggestion of ancillary revenue

© ICAO All rights reserved.
This document and all information contained herein is the sole property of ICAO. No intellectual property rights are granted by the delivery of this document or the disclosure of its content. This document shall not be reproduced or disclosed to a third party without prior permission of ICAO. This document and its content shall not be used for any purpose other than that for which it is supplied.
The statements made herein are based on the mentioned assumptions and are expressed in good faith. Where the supporting grounds for these statements are not shown, ICAO will be pleased to explain the basis thereof.

0
500
1000
1500
2000
2500
3000
3500
4000
4500
1999 2000 2001 2002 2003 2004 2005 2006 2007 2008 2009
Low Cost Carriers progression Low Cost Carriers progression
Source: ICAO, IATA
Pas
sen
ger
r tr
affi
c B
illio
n R
PK
s
1999-2009+4.3 % p.a.
Non IATA airlines
7%
IATA members 93%
Passenger traffic market shareBy airline type
Non IATA airlines
25%
IATA members 75%
Passenger traffic market shareBy airline type
1999-2009+14 % p.a.
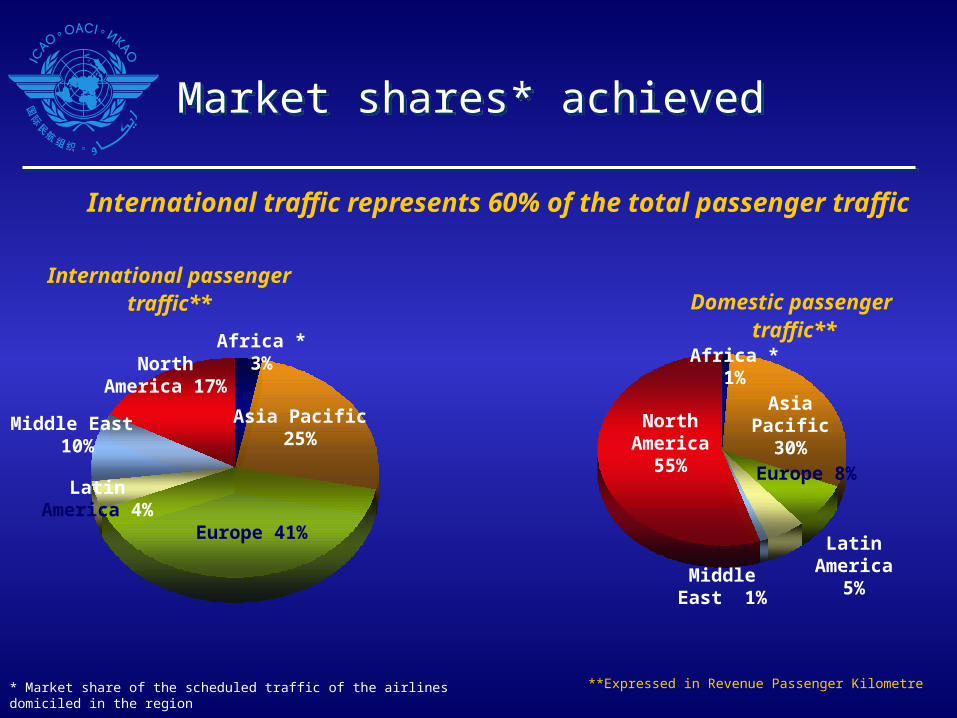
Market shares* achievedMarket shares* achieved
* Market share of the scheduled traffic of the airlines domiciled in the region
Europe 41%
Latin America 4%
North America 17%
Asia Pacific 25%
Africa *3%
Middle East 10%
International passenger traffic** Domestic passenger
traffic**
North America
55%
Africa *1%
Middle East 1%
Latin America 5%
Europe 8%
Asia Pacific 30%
International traffic represents 60% of the total passenger traffic
**Expressed in Revenue Passenger Kilometre
Related Documents