1 23 Ecosystems ISSN 1432-9840 Volume 16 Number 7 Ecosystems (2013) 16:1192-1202 DOI 10.1007/s10021-013-9676-x The Response of Soil CO 2 Fluxes to Progressively Excluding Vertebrate and Invertebrate Herbivores Depends on Ecosystem Type Anita C. Risch, Alan G. Haynes, Matt D. Busse, Flurin Filli & Martin Schütz

Welcome message from author
This document is posted to help you gain knowledge. Please leave a comment to let me know what you think about it! Share it to your friends and learn new things together.
Transcript
1 23
Ecosystems ISSN 1432-9840Volume 16Number 7 Ecosystems (2013) 16:1192-1202DOI 10.1007/s10021-013-9676-x
The Response of Soil CO2 Fluxes toProgressively Excluding Vertebrate andInvertebrate Herbivores Depends onEcosystem Type
Anita C. Risch, Alan G. Haynes, MattD. Busse, Flurin Filli & Martin Schütz

1 23
Your article is protected by copyright and all
rights are held exclusively by Springer Science
+Business Media New York. This e-offprint is
for personal use only and shall not be self-
archived in electronic repositories. If you wish
to self-archive your article, please use the
accepted manuscript version for posting on
your own website. You may further deposit
the accepted manuscript version in any
repository, provided it is only made publicly
available 12 months after official publication
or later and provided acknowledgement is
given to the original source of publication
and a link is inserted to the published article
on Springer's website. The link must be
accompanied by the following text: "The final
publication is available at link.springer.com”.
The Response of Soil CO2 Fluxesto Progressively Excluding Vertebrateand Invertebrate Herbivores Depends
on Ecosystem Type
Anita C. Risch,1* Alan G. Haynes,1 Matt D. Busse,2 Flurin Filli,3
and Martin Schutz1
1Community Ecology, Swiss Federal Institute for Forest, Snow and Landscape Research, Zuercherstrasse 111, 8903 Birmensdorf,
Switzerland; 2USDA Forest Service, Pacific Southwest Research Station, 3644 Avtech Parkway, Redding, California 96002, USA;3Swiss National Park, Chaste Planta-Wildenberg, 7530 Zernez, Switzerland
ABSTRACT
Grasslands support large populations of herbivores
and store up to 30% of the world’s soil carbon (C).
Thus, herbivores likely play an important role in the
global C cycle. However, most studies on how her-
bivory impacts the largest source of C released from
grassland soils—soil carbon dioxide (CO2) emis-
sions—only considered the role of large ungulates.
This ignores all other vertebrate and invertebrate
herbivores and their collective effects on ecosystem
properties. Weprogressivelyexcluded large,medium,
and small vertebrates and invertebrates from two
subalpine grasslands (productive, heavily grazed
short-grass; less productive, lightly grazed tall-grass)
using size-selective fences, assessed the impact on soil
CO2 emissions and related biotic and abiotic variables.
Exclusion resulted in significant changes in soil CO2
emissions in both vegetation types. Short-grass soil
CO2 emissions progressively increased when large
and medium mammals were excluded. However, no
difference was detected among plots were all or no
herbivores grazed. In contrast, tall-grass soil CO2
emissions were not affected by mammal exclusion,
but excluding all herbivores lead to reduced emis-
sions. Soil micro-climatic parameters best predicted
the patterns of soil CO2 emissions in short-grass veg-
etation, whereas root biomass was the best predictor
of CO2 release in tall-grass vegetation. Our results
showed that diverse herbivore communities affect
soil respiration differently than assumed from previ-
ous studies that only excluded large ungulates. Such
information is important if we are to understand how
changes in herbivore species composition—as could
happen through altered management practices,
extinction or invasion—impact grassland C storage
and release.
Key words: vertebrate herbivores; invertebrate
herbivores; consumption; soil temperature; soil
moisture; root biomass; soil microbial biomass C;
Q10; exclusion; soil respiration.
INTRODUCTION
Grasslands cover approximately one-third of the
earth’s terrestrial landscape (Lieth 1978; Foley and
others 2005), and support large populations of
vertebrate and invertebrate herbivores (White and
others 2000). Consuming potentially more than
Received 3 December 2012; accepted 5 April 2013;
published online 21 May 2013
Electronic supplementary material: The online version of this article
(doi:10.1007/s10021-013-9676-x) contains supplementary material,
which is available to authorized users.
Author Contributions: ACR, MS andFFconceived theexperiment.AGH,
MDB, ACR, and MS collected the data/performed laboratory analyses; ACR,
MS and AGH analyzed the data. ACR, MS, and MDB wrote the manuscript.
*Corresponding author; e-mail: [email protected]
Ecosystems (2013) 16: 1192–1202DOI: 10.1007/s10021-013-9676-x
� 2013 Springer Science+Business Media New York
1192
Author's personal copy
50% of the aboveground biomass (Detling 1988),
these animal communities can have strong effects
on various ecosystem properties. Physiological re-
sponses of plants to herbivory (top-down effects)
include changes in (1) biomass, nutrient content,
or litter quality of shoots and roots (Wardle and
others 2002; Frank and others 2002b; Chapman
and others 2003), and (2) the flow of carbon
(C) from roots to the soil (Bardgett and Wardle
2003; Harrison and Bardgett 2008). As a result of
these plant responses, the availability of soil C and
nutrients may change, which can lead to an alter-
ation of the abundance or community composition
of soil microbes or invertebrates (Bardgett and
others 1998, 2001; Bardgett and Wardle 2003;
Wardle and others 2004a, b). These changes, in
turn, can affect decomposition and nutrient min-
eralization processes of soil organic matter (Aho
and others 1998; Belovsky and Slade 2000; Harri-
son and Bardgett 2008), which alters plant nutrient
availability (McNaughton and others 1997; John-
son and Matchett 2001) and growth (bottom-up
effects; Alward and Joern 1993; McNaughton and
others 1998; Frank and others 2002b).
As grassland soils store between 10 and 30% of
the world’s soil carbon (Anderson 1991; Eswaran
and others 1993), herbivore-induced changes in
ecosystem processes likely play an important role in
the global C cycle. Soil CO2 respiration is the largest
source of released C from terrestrial ecosystems
(Raich and Schlesinger 1992) and is a function of
soil (1) organic matter quality and quantity, (2)
micro-climate (temperature, moisture), (3) physi-
cal properties (texture, bulk density), (4) chemical
properties (pH, nutrient concentrations), and (5)
biological properties (microbial biomass, composi-
tion, diversity, activity; Kirschbaum 1995). Thus,
any herbivore-induced alteration of one or several
of these parameters could alter soil respiration and
total C stored in grassland soils.
The net impact of herbivores on grassland pro-
cesses depends on the productivity of the system
and the grazing intensity it receives (Bardgett and
Wardle 2003; Wardle and others 2004a). Generally,
increases in soil biota biomass and richness and
accelerated soil C processes were reported when
ecosystem productivity and grazing intensity were
high, whereas the opposite was found for unpro-
ductive systems with low plant biomass consump-
tion (see also Bakker and others 2004, 2006). Total
consumption is directly related to the proportional
body size and abundance of the herbivores com-
munity. Thus, herbivory represents the combined
impact of several herbivore species or guilds that
differ in their functional behavior, feeding habits
(Belovsky 1997; Pawar and others 2012), trampling
impact, burrowing activities (Davidson and others
2012) and amount, distribution (patchy, evenly),
and quality of their waste (Bakker and others
2004). This fact has been ignored in the many
studies investigating the impact of grazing on soil
respiration (Knapp and others 1998; Johnson and
Matchett 2001; Cao and others 2004, Risch and
Frank 2006; Chen and others 2008; Strebel and
others 2010), as only the impact of the largest
herbivore group was assessed in these studies
(usually ungulates). We are not aware of any study
in which the impact of a functionally diverse her-
bivore community on soil CO2 emissions was
investigated, even though differences in herbivore
body size could alter vegetation-soil feedback in
grassland systems (Olff and Ritchie 1998; Ritchie
and Olff 1999a, b). More knowledge is needed on
how functionally diverse herbivore communities,
rather than just large ungulates, affect soil CO2
emissions in grassland ecosystems.
For this purpose we established an exclosure
experiment in the Swiss Alps. Our main objective
was to assess how soil CO2 emissions were affected
when four groups of functionally different herbi-
vores—large, medium, and small mammals, and
invertebrates—were progressively excluded with
size-selective fences from two subalpine vegetation
types: short-grass and tall-grass. The nutrient-rich
and fairly productive short-grass vegetation was
characterized by high herbivore consumption (over
60%), whereas much less biomass was consumed
(<20%) in the less productive, comparatively low
forage quality tall-grass vegetation (Schutz and
others 2006). We hypothesized that the progressive
exclusion of our four herbivore groups would lead
to: (1) Decreased soil CO2 emissions in short-grass
vegetation as positive feedbacks between grazing
and ecosystem processes (nutrient cycling) decel-
erate when grazing intensity ceases (Bardgett and
Wardle 2003; Wardle and others 2004a). Propor-
tionally larger changes were expected when smal-
ler herbivores were excluded (selective feeding,
evenly distributed waste). (2) Increased soil CO2
emissions in the tall-grass vegetation, as the nega-
tive effects of grazing cease and ecosystem process
rates accelerate. The largest effect in this vegetation
type was expected when large mammals were ex-
cluded. To assess potential mechanisms responsible
for herbivory-induced changes in soil CO2 emis-
sions, we measured abiotic and biotic variables that
are often affected by changes in grazing regime: soil
temperature, soil moisture, aboveground biomass
consumption, root biomass, and soil microbial
biomass C (MBC).
Herbivore Exclusion Alters Soil CO2 Fluxes 1193
Author's personal copy
MATERIALS AND METHODS
Study Area
The Swiss National Park (SNP) is located in the
southeastern part of Switzerland, and covers an
area of 170 km2, 50 km2 of which is forested,
33 km2 is occupied by alpine and 3 km2 by subal-
pine grasslands. Elevations range from 1,350 to
3,170 m a.s.l., and mean annual precipitation and
temperature are 871 ± 156 mm and 0.6 ± 0.6�C(average ± standard deviation) measured at the
Park’s weather station in Buffalora (1,980 m a.s.l.)
between 1960 and 2009 (MeteoSchweiz 2011).
Founded in 1914, the SNP received minimal hu-
man disturbance for almost 100 years (no hunting,
fishing, or camping, visitors are not allowed to
leave the trails). Large (>1 ha) homogeneous
patches of short- and tall-grass vegetation charac-
terize the subalpine grasslands. The average vege-
tation height of short-grass vegetation is 2–5 cm.
Red fescue (Festuca rubra L.), quaking grass (Briza
media L.), and common bent grass (Agrostis tenuis
Sipthrob) are the predominating plant species in
this vegetation type. Tussocks of evergreen sedge
(Carex sempervirens Vill.) and mat grass (Nardus
stricta L.) are predominant in the tall-grass vegeta-
tion, which averages 20 cm in vegetation height
(Schutz and others 2006). Short-grass vegetation
developed in areas where cattle and sheep rested
(high nutrient input) during agricultural land-use
(from 14th century until 1914); tall-grass vegeta-
tion developed in areas where cattle and sheep
used to graze, but did not rest (Schutz and others
2003, 2006). Herbivores were shown to consume
more than 60% of the biomass in short-grass
compared to less than 20% in tall-grass vegetation
(Schutz and others 2006). The herbivore commu-
nity present in the SNP can be divided into four
groups based on body size/weight: large [red deer
(Cervus elaphus L.) and chamois (Rupricapra rupri-
capra L.); 30–150 kg], medium [marmot (Marmota
marmota L.) and snow hare (Lepus timidus L.);
3–6 kg], and small vertebrate herbivores (small
rodents: for example, Clethrionomys spp., Microtus
spp., Apodemus spp.; 30–100 g) as well as inverte-
brates (for example, grasshoppers, caterpillars,
cicadas, <5 g). Large ungulates consume the most
biomass (for example, Schutz and others 2006),
although the other three groups also consume
considerable plant biomass in alpine ecosystems
(for example, Blumer and Diemer 1996). The diet
composition of large ungulates often reflects the
composition of grassland vegetation (mostly
graminoids; Schroder 1977), whereas smaller-sized
vertebrate herbivores usually prefer to selectively
graze on forbs or seeds (for example, Eskelinen
2002). The amount, distribution, and quality of
waste is dependent on body size (see Hobbs 1996).
Ungulates deposit the largest amounts of low
quality waste in a patchy distribution, whereas
small mammals and invertebrates deposit smaller
amounts of higher quality waste in a more evenly
distributed way (see for example, Bakker and oth-
ers 2004).
Experimental Design
We selected 18 subalpine grassland sites (9 short-
grass, 9 tall-grass vegetation). The sites were spread
across the entire park on dolomite parent material
at altitudes of 1,975–2,300 m. At each site we
established an exclosure network (fences) in spring
2009 (early June), immediately after snowmelt.
Each exclosure network consisted of a total of five
2 9 3 m sized plots that progressively excluded the
different herbivores listed above (further labeled
according to the herbivore guilds that had access to
the respective plots ‘‘All’’, ‘‘Marmot/Mice/Inverte-
brates’’, ‘‘Mice/Invertebrates’’, ‘‘Invertebrates’’,
‘‘None’’). The ‘‘All’’ treatment was thus accessible
to all herbivores, was not fenced and was located at
least 5 m away from a 2.1-m tall and 7 9 9 m main
fence that enclosed the other four treatments. This
fence was constructed of 10 9 10 cm wooden posts
and electrical equestrian tape (AGRARO ECO,
Landi, Bern, Switzerland; 20 mm width) mounted
at 0.7, 0.95, 1.2, 1.5, and 2.1 m above the ground
that were connected to a solar charged battery
(AGRARO Sunpower S250, Landi, Bern, Switzer-
land). We also mounted non-electrically charged
equestrian tape at 0.5 m to help exclude deer and
chamois, yet allow marmots and hares to enter
safely. Within each main fenced area we randomly
established four 2 9 3 m plots: (1) The ‘‘Marmot/
Mice/Invertebrates’’ plot remained unfenced, thus,
with the exception of red deer and chamois, all
herbivores were able to access the plot. (2) The
‘‘Mice/Invertebrates’’ plot consisted of a 90-cm-
high electric sheep fence (AGRARO Weidezaun-
netz ECO, Landi, Bern, Switzerland; mesh size
10 9 10 cm) connected to the solar panel and ex-
cluded all medium-sized mammals (marmots,
hares), but provided access for small mammals and
invertebrates. (3) The ‘‘Invertebrates’’ plot pro-
vided access for invertebrates only and was sur-
rounded by 1 m high metal mesh (Hortima AG,
Hausen, Schweiz; mesh size 2 9 2 cm). (4) The
‘‘None’’ plot was surrounded by a 1-m tall mosquito
1194 Anita C. Risch and others
Author's personal copy
net (Sala Ferramenta AG, Biasca, Switzerland; mesh
size 1.5 9 2 mm) to exclude all herbivores. This plot
was covered with a roof constructed of a wooden
frame lined with mosquito mesh that was mounted
on the wooden corner posts. We also treated this plot
with a biocompatible insecticide (Clean kill original,
Eco Belle GmbH, Waldshut-Tiengen, Germany)
when needed to remove insects that might have
entered during data collection or that hatched from
the soil.
To assess whether the design of the ‘‘None’’ ex-
closure (mesh and roof) affected the micro-climatic
condition associated with soil CO2 emissions, we
erected ‘‘micro-climate control’’ exclosures at six of
the 18 sites. These exclosures were built as the
‘‘None’’ exclosures, but were open at the bottom
(20 cm) of the 3 m side of the fence facing away
from the prevailing wind to allow invertebrates to
enter. A 20-cm high and 3-m long strip of metal
mesh was used to block access to small mammals.
Thus, this construction allowed a comparable mi-
cro-climate to the ‘‘None’’ plots, but also a com-
parable grazing pressure to the ‘‘Invertebrates’’
plots. We compared various properties within these
exclosures against one another to assess if our
construction altered the conditions in the ‘‘None’’
plots (Online Appendix Table A1). We were able to
show that the exclusion of invertebrates lead to
significantly higher aboveground biomass and
vegetation height. As a consequence, soil temper-
ature decreased (reduction in solar heating due to
higher and denser canopy), which lead to an in-
crease in soil moisture (less soil evapotranspiration
due to lower temperatures). The only parameter
that was directly altered by the roof construction
was the total amount of UV light, yet this change
did not reflect the amount of biomass produced.
Consequently, the exclusion of herbivores rather
than the construction of our exclosures was
responsible for potential differences in soil CO2
emissions.
The fences were dismantled in late October 2009
to protect them from snow pressure and avalanches
and remounted in early May 2010 immediately
after spring snowmelt. The two years differed in
climatic conditions. The winter (September–March)
preceding the 2009 growing season was consider-
ably wetter (463 mm) compared to winter 2010
(297 mm; measured at the nearby weather station
at Buffalora; MeteoSchweiz 2011). In contrast,
our study area received considerably more precipi-
tation in the 2010 growing season (April–August:
432 mm) compared to the year before (317 mm).
The average growing season temperature in 2010
was 1�C colder (7.1�C) compared to the same period
in 2009 (8.1�C).
Bi-weekly ungulate pellet counts (on two 4
wide 9 25 m long plots per site; adapted from Neff
1968) and grasshopper counts (on ten 0.5 9 0.5 m
plots per site; method adapted from Gardiner and
others 2002; for details see Spalinger and others
2012) showed that all sites were grazed by large
ungulates and invertebrates during both years
(Online Appendix Table A2). In addition, marmot
populations were counted twice during both sum-
mers (observation counts) indicating that marmots
were present at all sites (Online Appendix Table
A2). Small mammal populations were not assessed
at the individual sites and no attempt was made to
quantify herbivore numbers and composition
within the individual exclosure networks. How-
ever, using game cameras (Moultrie 6MP Game
Spy I-60 Infrared Digital Game Camera, Moultrie
Feeders, Alabaster, AL, USA), we did observe that
mice were present in some fences and that the
medium- and small-sized mammals (marmot/hares
and mice) were not afraid to enter the fences and
graze on their ‘‘designated’’ plots.
Measuring Soil CO2 Emission, SoilTemperature, and Soil Moisture
In situ soil CO2 emissions were measured with a PP-
Systems SRC-1 soil respiration chamber (closed
circuit) attached to a PP-Systems EGM-4 infrared
gas analyzer (PP-Systems, Amesbury, MA, USA) on
two randomly selected locations on one subplot
within each of the 90 plots. For each measurement
the soil chamber (15 cm high; 10 cm diameter) was
placed on a permanently installed PVC collar
(10 cm diameter) driven 5 cm into the soil at the
beginning of the study (June 2009). The measure-
ments were conducted between 0900 and 1700 h
every 2 weeks from late-June to late-August 2009
(n = 5) and late-May to late-August 2010 (n = 7);
until snow fell. Freshly germinated plants growing
within the PVC collars were removed prior to each
measurement to avoid measuring plant respiration/
photosynthesis. The two measurements collected
per plot every 2 weeks were averaged. Soil tem-
perature and soil moisture were measured at a
depth of 0–10 cm mineral soil at five random loca-
tions per plot during each soil CO2 sampling date.
Soil temperature was measured with a waterproof
digital pocket thermometer (Barnstead Interna-
tional, Dubuque IA, USA) and soil moisture by time
domain reflectometry with a Field-Scout TDR-100
(Spectrum Technologies, Plainfield IL, USA).
Herbivore Exclusion Alters Soil CO2 Fluxes 1195
Author's personal copy
Aboveground Biomass Consumptionby Herbivores
We estimated aboveground biomass on one ran-
domly located 1 9 1 m subplot at peak biomass
using the non-destructive canopy intercept method
(Frank and McNaughton 1992). Briefly, this
method estimates aboveground biomass based on
hits of a pin that was passed through the vegeta-
tion. Prior to the study a reference system (dry
biomass vs. hits) was established for the entire area.
Consumption was calculated for each plot, using
the ‘‘None’’ plot as baseline for each network
cluster (0% consumption) and the ‘‘All’’ treatment
as baseline for maximum consumption of all her-
bivore groups.
Root Biomass and Microbial BiomassCarbon Sampling
Soil samples were collected in early September
2009 and 2010 on the 90 subplots assigned for
destructive sampling. Prior to sampling the soils, we
removed the vegetation from two 10 9 100 cm
strips within the subplot. Thereafter we randomly
selected five spots within the two strips and col-
lected five 2.2 cm (diameter) 9 10 cm soil samples
with a soil corer (Giddings Machine Company,
Windsor, CO, USA), resulting in a total of 450 cores
each year. The samples were dried at 30�C and
roots were manually separated from the soil
material. We hand picked each sample for 1 h,
allowing retrieval of over 90% of all roots present
in the sample. The roots were then dried at 65�C for
48 h and weighed to the nearest mg. The average
root biomass of the five cores was used to derive
root biomass per 1 m2 plot.
Another three soil samples were randomly col-
lected on the strips where the vegetation was re-
moved to determine mineral soil MBC. For this
purpose, we first removed the dense root layer
generally present within the top 1–5 cm of our soils
and then collected a 5 cm (diameter) 9 10 cm
mineral soil core (AMS Samplers, American Falls,
ID, USA). The three samples were combined (90
samples for each sampling year), immediately put
on ice, taken to the laboratory, passed through a
2-mm sieve and stored at 4�C. MBC was then
determined using the substrate-induced method of
Anderson and Domsch (1978).
Statistical Analyses
We used the linear mixed model approach to
investigate how herbivore exclusion affected soil
CO2 emissions in each vegetation type. Soil CO2
emission was the dependent variable, modeled as a
function of the fixed-factors year, treatment,
year 9 treatment and sampling date. Site was in-
cluded as a random factor. We adjusted this model
for temporal autocorrelation using a first-order
autocorrelation structure (AR[1]). Pairwise com-
parisons were made for the main effect treatment
using the Bonferroni confidence interval adjust-
ment. The same modeling approach was used to
assess treatment effects on soil temperature and soil
moisture. In addition, we calculated linear mixed
effects models to assess treatment differences in
consumption, root biomass, and MBC as a function
of the fixed-factors year, treatment, and year 9
treatment, with site as a random factor. We trans-
formed all the data for these analyses using Box-
Cox transformation to meet the normality criteria.
We assessed the temporal relationship between
soil CO2 emissions and soil temperature/soil mois-
ture during the two growing seasons using linear
regression analysis. Further, we assessed which of
the abiotic and biotic parameters (soil temperature,
soil moisture, consumption, root biomass, and soil
MBC) were the best predictors of soil CO2 emis-
sions for each vegetation type. To do this we
averaged all plot measurements of soil CO2 emis-
sion, soil temperature (Box-Cox transformed), soil
moisture, consumption (ln-transformed), root bio-
mass (ln-transformed), and soil MBC (ln-trans-
formed) and then calculated stepwise multiple
regression models (backward selection) separately
by vegetation type. In addition, we calculated the
apparent temperature sensitivity of soil CO2 emis-
sion (Q10)—defined as the relationship of field
measured soil respiration against seasonal temper-
atures (see Smith and others 2008)—for each
treatment of each vegetation type (see Lloyd and
Taylor 1994 for equations) to assess how grazing
removal affected the temperature sensitivity of soil
CO2 emissions. All statistical analyses were per-
formed with the PASW Statistics 19.0 statistical
package (IBM SPSS, Chicago, IL, USA).
RESULTS
Soil CO2 emissions varied considerably during the
two growing seasons (Online Appendix Figure 1A).
The seasonal and inter-annual variance was ex-
plained by differences in soil temperature, whereas
soil moisture had no explanatory power (Online
Appendix Figure 1B, C). Overall, the average
emissions were 23% lower in 2010 (0.61 ± 0.011 g
CO2 m-2 h-1; mean ± standard error) compared
to 2009 (0.81 ± 0.016 g CO2 m-2 h-1, for statistics
see Online Appendix Table A3).
1196 Anita C. Risch and others
Author's personal copy
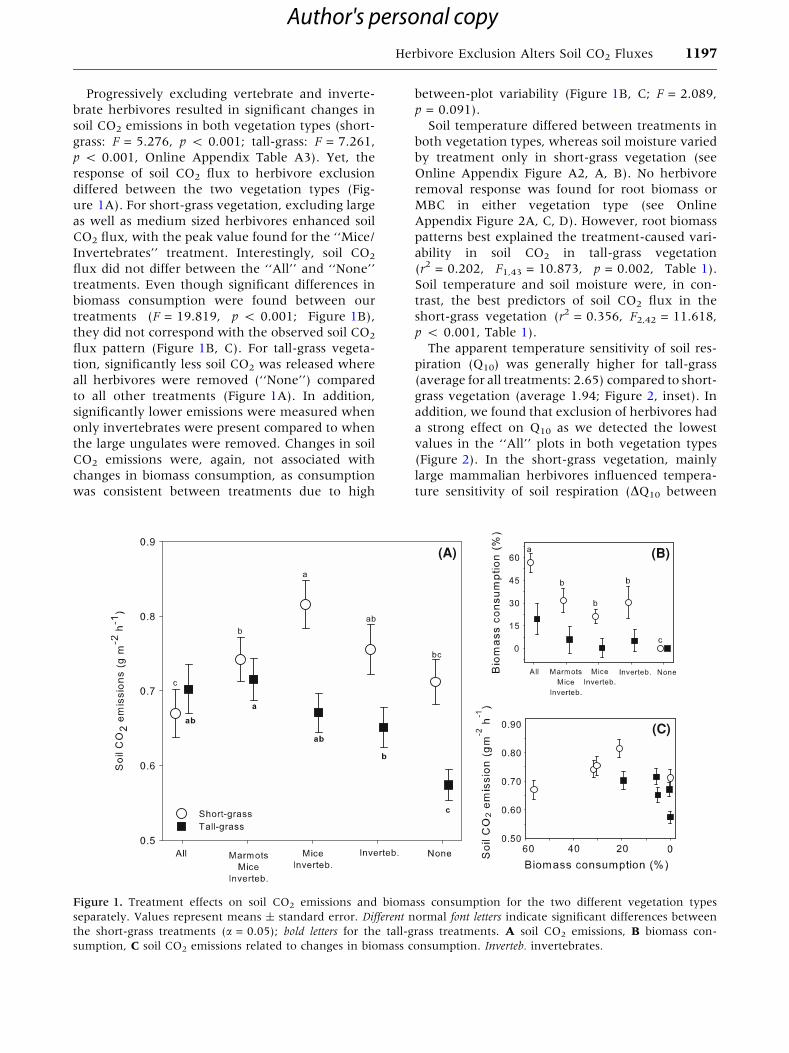
Progressively excluding vertebrate and inverte-
brate herbivores resulted in significant changes in
soil CO2 emissions in both vegetation types (short-
grass: F = 5.276, p < 0.001; tall-grass: F = 7.261,
p < 0.001, Online Appendix Table A3). Yet, the
response of soil CO2 flux to herbivore exclusion
differed between the two vegetation types (Fig-
ure 1A). For short-grass vegetation, excluding large
as well as medium sized herbivores enhanced soil
CO2 flux, with the peak value found for the ‘‘Mice/
Invertebrates’’ treatment. Interestingly, soil CO2
flux did not differ between the ‘‘All’’ and ‘‘None’’
treatments. Even though significant differences in
biomass consumption were found between our
treatments (F = 19.819, p < 0.001; Figure 1B),
they did not correspond with the observed soil CO2
flux pattern (Figure 1B, C). For tall-grass vegeta-
tion, significantly less soil CO2 was released where
all herbivores were removed (‘‘None’’) compared
to all other treatments (Figure 1A). In addition,
significantly lower emissions were measured when
only invertebrates were present compared to when
the large ungulates were removed. Changes in soil
CO2 emissions were, again, not associated with
changes in biomass consumption, as consumption
was consistent between treatments due to high
between-plot variability (Figure 1B, C; F = 2.089,
p = 0.091).
Soil temperature differed between treatments in
both vegetation types, whereas soil moisture varied
by treatment only in short-grass vegetation (see
Online Appendix Figure A2, A, B). No herbivore
removal response was found for root biomass or
MBC in either vegetation type (see Online
Appendix Figure 2A, C, D). However, root biomass
patterns best explained the treatment-caused vari-
ability in soil CO2 in tall-grass vegetation
(r2 = 0.202, F1,43 = 10.873, p = 0.002, Table 1).
Soil temperature and soil moisture were, in con-
trast, the best predictors of soil CO2 flux in the
short-grass vegetation (r2 = 0.356, F2,42 = 11.618,
p < 0.001, Table 1).
The apparent temperature sensitivity of soil res-
piration (Q10) was generally higher for tall-grass
(average for all treatments: 2.65) compared to short-
grass vegetation (average 1.94; Figure 2, inset). In
addition, we found that exclusion of herbivores had
a strong effect on Q10 as we detected the lowest
values in the ‘‘All’’ plots in both vegetation types
(Figure 2). In the short-grass vegetation, mainly
large mammalian herbivores influenced tempera-
ture sensitivity of soil respiration (DQ10 between
(A) (B)
(C)
Figure 1. Treatment effects on soil CO2 emissions and biomass consumption for the two different vegetation types
separately. Values represent means ± standard error. Different normal font letters indicate significant differences between
the short-grass treatments (a = 0.05); bold letters for the tall-grass treatments. A soil CO2 emissions, B biomass con-
sumption, C soil CO2 emissions related to changes in biomass consumption. Inverteb. invertebrates.
Herbivore Exclusion Alters Soil CO2 Fluxes 1197
Author's personal copy
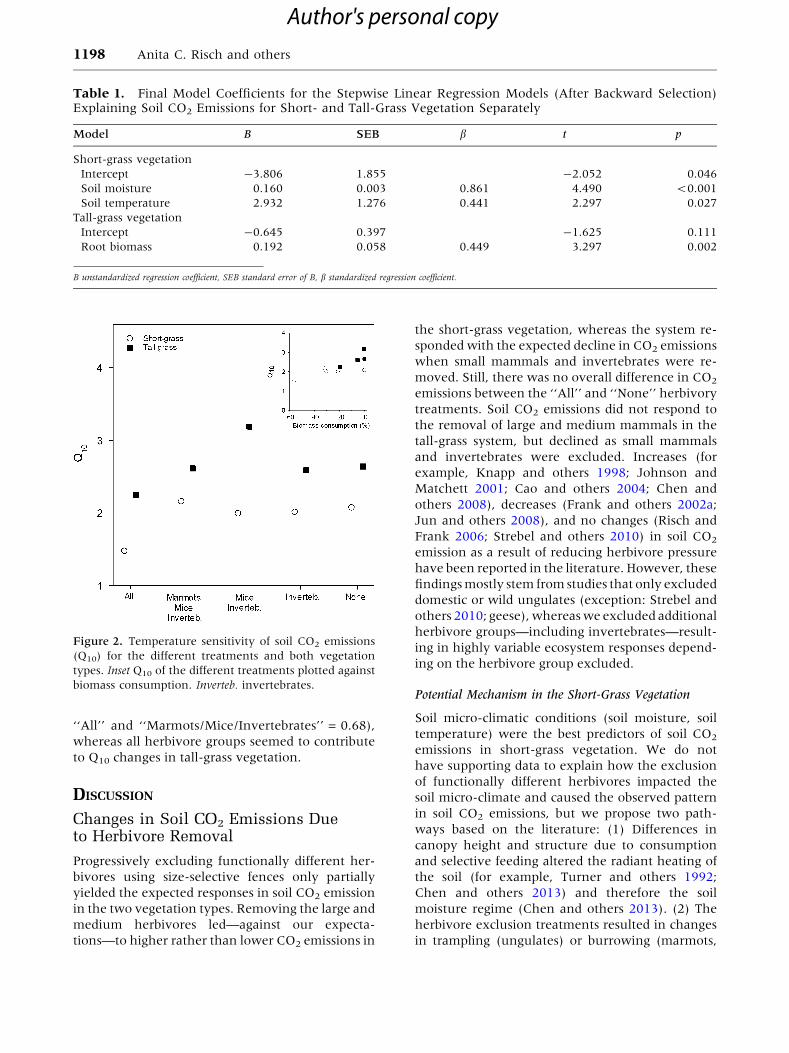
‘‘All’’ and ‘‘Marmots/Mice/Invertebrates’’ = 0.68),
whereas all herbivore groups seemed to contribute
to Q10 changes in tall-grass vegetation.
DISCUSSION
Changes in Soil CO2 Emissions Dueto Herbivore Removal
Progressively excluding functionally different her-
bivores using size-selective fences only partially
yielded the expected responses in soil CO2 emission
in the two vegetation types. Removing the large and
medium herbivores led—against our expecta-
tions—to higher rather than lower CO2 emissions in
the short-grass vegetation, whereas the system re-
sponded with the expected decline in CO2 emissions
when small mammals and invertebrates were re-
moved. Still, there was no overall difference in CO2
emissions between the ‘‘All’’ and ‘‘None’’ herbivory
treatments. Soil CO2 emissions did not respond to
the removal of large and medium mammals in the
tall-grass system, but declined as small mammals
and invertebrates were excluded. Increases (for
example, Knapp and others 1998; Johnson and
Matchett 2001; Cao and others 2004; Chen and
others 2008), decreases (Frank and others 2002a;
Jun and others 2008), and no changes (Risch and
Frank 2006; Strebel and others 2010) in soil CO2
emission as a result of reducing herbivore pressure
have been reported in the literature. However, these
findings mostly stem from studies that only excluded
domestic or wild ungulates (exception: Strebel and
others 2010; geese), whereas we excluded additional
herbivore groups—including invertebrates—result-
ing in highly variable ecosystem responses depend-
ing on the herbivore group excluded.
Potential Mechanism in the Short-Grass Vegetation
Soil micro-climatic conditions (soil moisture, soil
temperature) were the best predictors of soil CO2
emissions in short-grass vegetation. We do not
have supporting data to explain how the exclusion
of functionally different herbivores impacted the
soil micro-climate and caused the observed pattern
in soil CO2 emissions, but we propose two path-
ways based on the literature: (1) Differences in
canopy height and structure due to consumption
and selective feeding altered the radiant heating of
the soil (for example, Turner and others 1992;
Chen and others 2013) and therefore the soil
moisture regime (Chen and others 2013). (2) The
herbivore exclusion treatments resulted in changes
in trampling (ungulates) or burrowing (marmots,
Table 1. Final Model Coefficients for the Stepwise Linear Regression Models (After Backward Selection)Explaining Soil CO2 Emissions for Short- and Tall-Grass Vegetation Separately
Model B SEB b t p
Short-grass vegetation
Intercept -3.806 1.855 -2.052 0.046
Soil moisture 0.160 0.003 0.861 4.490 <0.001
Soil temperature 2.932 1.276 0.441 2.297 0.027
Tall-grass vegetation
Intercept -0.645 0.397 -1.625 0.111
Root biomass 0.192 0.058 0.449 3.297 0.002
B unstandardized regression coefficient, SEB standard error of B, b standardized regression coefficient.
Figure 2. Temperature sensitivity of soil CO2 emissions
(Q10) for the different treatments and both vegetation
types. Inset Q10 of the different treatments plotted against
biomass consumption. Inverteb. invertebrates.
1198 Anita C. Risch and others
Author's personal copy
mice, voles) regimes that affected soil physical
properties such as bulk density, soil porosity, and
water holding capacity (Binkley and others 2003;
Davidson and others 2010, 2012), which thus led to
alterations in the soil micro-climate.
Given the impact of our treatments on soil tem-
perature and soil moisture it is possible that chan-
ges in soil micro-climate directly led to changes in
soil CO2 emissions by changing the activity of the
soil community (see for example, Luo and Zhou
2006). Alternatively, exclusion-driven changes in
soil micro-climate may have indirectly effected soil
CO2 emissions by altering plant physiological pro-
cesses (Vargas and others 2011; Gomes-Casanovas
and others 2012) or N mineralization rates (Bakker
and others 2004) by altering the abundance and
composition of the soil microbial (Patra and others
2005; Zhou and others 2010) or arthropod com-
munities (Freckmann and others 1979; Mulder and
others 2003). Although we do not have any data on
how our treatments affected microbial activity or
plant physiological properties (for example, root
respiration, photosynthesis, microbial respiration),
we recently assessed soil organic matter decay rates
in our treated plots (2010; unpublished results) and
detected few differences in decay between treat-
ments. In support, we found no differences in MBC
in the present study. Similarly, Hodel (2011) found
no differences in the microbial community struc-
ture (assessed through T-RFLP) after the first and
second growing season of our experiment. Results
from our plots have shown that herbivore exclu-
sion alters the richness, but not the size of the
collembolan community without affecting the
abundance and diversity of mites (Raschein 2012).
It is possible that nematode abundance and biomass
were altered by changes in soil moisture (Freck-
mann and others 1979; Chen and others 2013) and
soil temperature (Mulder and others 2003; Chen
and others 2013), although we have no informa-
tion to support this claim. Further investiga-
tions—in particular with regard to nematodes—are
necessary to fully assess the relationship between
soil micro-climate, biotic activity, and CO2 emis-
sions.
Potential Mechanism in the Tall-Grass Vegetation
Root biomass was found to be the best predictor of
soil CO2 respiration in the tall-grass vegetation.
Even though our treatments did not lead to sig-
nificant differences in root biomass (see Online
Appendix Figure A2, C), it is possible that changes
in total consumption or changes in selective feed-
ing (specific plant species/plant parts) altered the C
allocation from shoots to roots. This, in turn, could
have reduced root respiration and consequently
soil CO2 emissions. However, results published by
Thorne and Frank (2009) showed no evidence for
increased mass-specific root respiration in a clip-
ping experiment of four grass species. A much more
likely pathway to explain our changes in soil CO2
emissions is that herbivore exclusion affected plant
physiological processes such as photosynthesis
(Milchunas and Lauenroth 1993; Wilsey and others
2002), root exudation, or fine root turnover
(Bardgett and Wardle 2003; Frank and others
2002b). Thus, the significantly lower soil CO2
emission rates measured in the ‘‘None’’ plots could
be a result of lower substrate availability and
therefore lower microbial activity.
Additional Potential Mechanisms Explaining
the Patterns Found
The herbivore exclusion treatments may have af-
fected the amount, distribution, composition, and
decomposability of animal waste (dung, urine),
ultimately resulting in changes in substrate avail-
ability for belowground community activity (Bak-
ker and others 2004). By progressively excluding
herbivores by body size in our study, the distribu-
tion of dung likely changed from large ‘‘pellets’’ of
low quality that were patchily distributed (for
example, ungulates present) to small ‘‘pellets’’ or
frass of high quality that were more evenly dis-
tributed (for example, small mammals and inver-
tebrates present). More evenly distributed higher
quality waste could result in increased resource
availability for plants, which in turn, could alter
plant physiological processes, resource allocation
between shoots and roots and therefore soil CO2
emissions. Further, depending on whether facili-
tation or competition are the dominating interac-
tive forces between the different herbivore groups,
one or several groups of herbivores might positively
or negatively respond to the exclusion of others in
terms of total abundance. Davidson and others
(2010) has, for example, shown that the exclusion
of cattle and prairie dogs favored the numbers of
grasshoppers. Changes in interactive forces could
therefore affect the amount of biomass that a cer-
tain herbivore group consumes. As a consequence,
the total amount of waste deposited within the
system by a specific herbivore group might in- or
decrease. Our data on consumption indicates that
the four herbivore groups competed for resources:
the exclusion of large and medium vertebrates re-
sulted in compensatory biomass consumption of
the smaller remaining species (compare Ritchie and
Herbivore Exclusion Alters Soil CO2 Fluxes 1199
Author's personal copy
Olff 1999b), which potentially led to larger quan-
tities of evenly distributed waste.
Changes in Temperature Sensitivityof Soil Respiration (Q10) Due to HerbivoreRemoval
Our study revealed considerable increases in the
apparent temperature sensitivity of soil respiration
when large herbivores were removed from short-
and tall-grass vegetation, as also reported by other
authors (Cao and others 2004; Chen and others
2008). Interestingly, no further increase in sensi-
tivity was detected with the exclusion of the other
herbivores in the short-grass vegetation, whereas
the exclusion of each herbivore group in the tall-
grass vegetation caused changes in the temperature
sensitivity of soil respiration. As the temperature
sensitivity of soil respiration is also controlled by
soil moisture, photosynthesis rates, and substrate
supply of the soil (Davidson and others 2006),
which in turn are differentially influenced by her-
bivores, understanding how progressive herbivore
exclusion affects Q10 mechanistically is even more
difficult than understanding the changes in actual
CO2 fluxes. Further investigations, ideally under
controlled conditions, could shed more light into
this issue. Nevertheless, our findings indicated
that—at least for our study area—removing func-
tionally different grazers leads to changes in the
temperature sensitivity of soil respiration.
CONCLUSIONS
As one of the first studies on the effects of both
vertebrate and invertebrate herbivore exclusion on
soil CO2 emissions in grassland ecosystems, our
results suggest that the controls on soil respiration
are substantially more complicated than assumed
from previous studies that only excluded large
ungulates. Given the multiple processes that dif-
ferent herbivores affect in grassland ecosystems-as
discussed in this study-assessing their impact on the
soil CO2 emissions remains difficult. Yet, our results
provide initial evidence of how changes in com-
petitive interactions among herbivores—as could
happen through changes in management, extinc-
tion or invasion—alter the grassland soil C cycle.
ACKNOWLEDGMENTS
We would like to thank various employees of the
Swiss Federal Institute for Forest, Snow and
Landscape Research and the Swiss National Park as
well as numerous interns and volunteers for their
help with fence construction, data collection and in
the laboratory. Special thanks go to Bigna Stoffel,
Vera Baptista, Anna Schweiger, and Annatina
Zingg for sorting the roots. We are grateful to the
Swiss National Park Service for administrative
support of our research and thank Douglas A.
Frank, Matthias Albrecht and two anonymous
reviewers for their critical remarks and constructive
comments on previous versions of this manuscript.
This study was funded by the Swiss National Sci-
ence Foundation, SNF Grant No. 31003A_122009/
1, to ACR, MS and FF.
REFERENCES
Aho K, Huntly N, Moen J, Oksanen T. 1998. Pikas (Ochotona
princeps: Lagomorpha) as allogenic engineers in an alpine
ecosystem. Oecologia 114:405–9.
Alward RD, Joern A. 1993. Plasticity and overcompensation in
grass responses to herbivory. Oecologia 95:358–64.
Anderson JM. 1991. The effects of climate change on decom-
position processes in grassland and coniferous forests. Ecol
Appl 1:326–47.
Anderson JPE, Domsch KH. 1978. A physiological method for
the quantitative measurement of microbial biomass in soil.
Soil Biol Biochem 10:215–21.
Bakker ES, Ritchie ME, Olff H, Milchunas DG, Knops JMH.
2006. Herbivore impact on grassland plant diversity depends
on habitat productivity and herbivore size. Ecol Lett 9:780–8.
Bakker ES, Olff H, Boekhoff M, Gleichman JM, Berendse F.
2004. Impact of herbivores on nitrogen cycling: contrasting
effects of small and large species. Oecologia 138:91–101.
Bardgett RD, Wardle DA. 2003. Herbivore mediated linkages
between aboveground and belowground communities. Ecol-
ogy 84:2258–68.
Bardgett RD, Jones AC, Jones DL, Kemmitt SJ, Cook R, Hobbs
PJ. 2001. Soil microbial community patterns related to the
history and intensity of grazing in sub-montane ecosystems.
Soil Biol Biochem 33:1653–64.
Bardgett RD, Wardle DA, Yeates GW. 1998. Linking above-
ground and below-ground interactions: how plant responses
to foliar herbivory influence soil organisms. Soil Biol Biochem
30:18867–78.
Belovsky GE, Slade JB. 2000. Insect herbivory accelerates
nutrient cycling and increases plant production. PNAS
97:14412–17.
Belovsky GE. 1997. Optimal foraging and community structure:
the allometry of herbivore food selection and competition.
Evol Ecol 11:641–72.
Binkley D, Singer F, Kaye M, Rochelle R. 2003. Influence of elk
grazing on soil properties in Rocky Mountain National Park.
For Ecol Manag 185:239–47.
Blumer P, Diemer M. 1996. The occurrence and consequences of
grasshopper herbivory in an alpine grassland, Swiss Central
Alps. Arctic Alpine Res 28:435–40.
Chapman SK, Hart SC, Cobb NS, Whitham TG, Koch GW. 2003.
Insect herbivory increases litter quality and decomposition: an
extension of the acceleration hypothesis. Ecology 84:2867–76.
Cao G, Tang Y, Mo W, Wang Y, Li Y, Zhao X. 2004. Grazing
intensity alters soil respiration in an alpine meadow on the
Tibetan plateau. Soil Biol Biochem 36:237–43.
1200 Anita C. Risch and others
Author's personal copy
Chen D, Zhen S, Shan Y, Taube F, Bai Y. 2013. Vertebrate
herbivore-induced changes in plants and soils: linkages to
ecosystem functioning in a semi-arid steppe. Funct Ecol
27:273–81.
Chen S, Lin G, Huang J, He M. 2008. Responses of soil respi-
ration to simulated precipitation pulses in semiarid steppe
under different grazing regimes. J Plant Ecol 1:237–46.
Davidson AD, Detling JK, Brown JH. 2012. Ecological roles and
conservation challenges of social, burrowing, herbivourous
mammals in the worlds grassland. Front Ecol Environ
10:477–86.
Davidson AD, Ponce E, Lightfoot DC, Frederickson EL, Brown
JH, Cruzado J, Brantley SL, Sierra-Corona R, List R, Toledo D,
Ceballos G. 2010. Rapid response of a grassland ecosystem to
an experimental manipulation of a keystone rodent and
domestic livestock. Ecology 91:3189–200.
Davidson EA, Janssens IA, Luo Y. 2006. On the variability of
respiration in terrestrial ecosystems: moving beyond Q10.
Glob Chang Biol 12:154–64.
Detling JK. 1988. Grasslands and savannas: regulation of energy
flow and nutrient cycling by herbivores. In: Pomeroy LR,
Alberts JJ, Eds. Concepts of ecosystem ecology. New York:
Springer. p 131–48.
Eskelinen O. 2002. Diet of the wood lemming Myopus schitsicolor.
Ann Zool Fenn 39:49–57.
Eswaran H, van den Berg E, Reich P. 1993. Organic carbon in
soils of the world. Soil Sci Soc Am J 57:192–4.
Foley JA, DeFries R, Asner GP, Barford C, Bonan G, Carpenter
SR, Chapin FS, Coe MT, Daily GC, Gibbs HK, Helkowski JH,
Holloway T, Howard EA, Kucharik CJ, Monfreda C, Patz JA,
Prentice IC, Ramankutty N, Snyder PK. 2005. Global conse-
quences of land use. Science 309:570–4.
Frank AB, Liebig MA, Hanson JD. 2002a. Soil carbon dioxide in
northern semiarid grasslands. Soil Biol Biochem 34:1235–41.
Frank DA, Kuns MM, Guido DR. 2002b. Consumer control of
grassland plant production. Ecology 83:602–6.
Frank DA, McNaughton SJ. 1992. Aboveground biomass esti-
mation with the canopy intercept method: a plant growth
form caveat. Oikos 57:57–60.
Freckmann DW, Duncan DA, Larson R. 1979. Nematode density
and biomass in an annual grassland ecosystem. J Range
Manag 32:418–22.
Gardiner T, Pye M, Field R, Hill J. 2002. The influence of sward
height and vegetation composition in determining the habitat
preferences of three Chorthippus species (Orthoptera: Acridi-
dae) in Chelmsford, Essex, UK. J Orthoptera Res 11:207–13.
Gomes-Casanovas N, Matamala R, Cook DR, Gonzalez-Meler
MA. 2012. Net ecosystem exchange modifies the relationship
between autotrophic and heterotrophic components of soil
respiration with abiotic factors in prairie grasslands. Glob
Chang Biol 18:2532–45.
Harrison KA, Bardgett RD. 2008. Impacts of grazing and
browsing by large herbivores on soil and soil biological prop-
erties. In: Gordon IJ, Prins HHT, Eds. The ecology of browsing
and grazing. Berlin: Springer. p 201–16.
Hobbs NT. 1996. Modification of ecosystems by ungulates.
J Wildl Manag 60:695–713.
Hodel M. 2011. Top-down effects of different sized herbivores on
soil microbial biomass C and bacterial community structure in
subalpine grasslands. MSc thesis. Zurich: University of Zurich.
Johnson LC, Matchett JR. 2001. Fire and grazing regulate
belowground processes in tallgrass prairie. Ecology 82:3377–89.
Jun W, Liquing S, Jianzhou L, Zhili F. 2008. CO2 efflux under
different grazing managements on subalpine meadows of
Shangri-La, northwest Yunnan Province, China. Acta Ecol Sin
28:3574–83.
Kirschbaum MUF. 1995. The temperature dependence of soil
organic matter decomposition, and the effect of global warming
on soil organic C storage. Soil Biol Biochem 27:753–60.
Knapp AK, Conrad SL, Blair JM. 1998. Determinants of soil CO2
flux from a sub-humid grassland: effect of fire and fire history.
Ecol Appl 8:760–70.
Lieth H. 1978. Pattern of primary productivity in the biosphere.
Stroudsberg, PA: Hutchinson & Ross.
Lloyd J, Taylor TA. 1994. On the temperature dependence of soil
respiration. Funct Ecol 8:315–23.
Luo Y, Zhou X. 2006. Soil respiration and the environment.
Burlington: Elsevier. pp 328
McNaughton SJ, Banyikwa FF, McNaughton MM. 1998. Root
biomass and productivity in a grazing ecosystem: the Seren-
geti. Ecology 79:587–92.
McNaughton SJ, Banyikwa FF, McNaughton MM. 1997. Pro-
motion of the cycling of diet-enhancing nutrients by African
grazers. Science 278:1798–800.
MeteoSchweiz (2011) https://gate.meteoswiss.ch/idaweb/login.
do?language=en. Accessed 10 Jan 2011.
Milchunas DG, Lauenroth WK. 1993. Quantitative effects of
grazing on vegetation and soils over a global range of envi-
ronments. Ecol Monogr 63:327–66.
Mulder C, de Zwart D, van Wijnen HJ, Schouten AJ, Breure AM.
2003. Observational and simulated evidence of ecological shifts
within the soil nematode community of agroecosystems under
conventional and organic farming. Funct Ecol 17:516–25.
Neff DJ. 1968. The pellet-group count technique for big game
trends, census, and distribution: a review. J Wildl Manag
32:597–614.
Olff H, Ritchie ME. 1998. Effects of herbivores on grassland plant
diversity. TREE 13:261–5.
Patra AK, Abadie L, Clays-Josserand A, Degrange V, Graystone
SJ, Loiseau P, Louault F, Mahmood S, Nazaret S, Philippot L,
Poly F, Prosser JI, Richaume A, Le Roux X. 2005. Effects of
grazing on microbial functional groups involved in soil N
dynamics. Ecology 75:65–80.
Pawar S, Dell AI, Savage VM. 2012. Dimensionality of consumer
search space drives trophic interactions strengths. Nature
486:485–9.
Raich JW, Schlesinger WH. 1992. The global carbon dioxide flux
in soil respiration and its relationship to vegetation and cli-
mate. Tellus 44B:81–99.
Raschein U. 2012. Cascading effects of gradual herbivore
exclusion on soil arthropods in subalpine grasslands of dif-
ferent productivity. MSc thesis. Zurich: University of Zurich.
Risch AC, Frank DA. 2006. Carbon dioxide fluxes in a spatially
and temporally heterogeneous temperate grassland. Oecologia
147:291–302.
Ritchie ME, Olff H. 1999a. Spatial scaling laws yield a synthetic
theory of biodiversity. Nature 400:557–60.
Ritchie ME, Olff H. 1999b. Herbivore diversity and plant
dynamics: compensatory and additive effects. Olff H, Brown
VK, Drent RH, editors. Herbivores: between plants and pre-
dators. Oxford: Blackwell Science. pp. 175–204.
Schroder W. 1977. Raumliche Verteilung und Nahrungswahl von
Gams und Rotwild im Hochgebirge. Forstwis Centralbl 96:94–9.
Herbivore Exclusion Alters Soil CO2 Fluxes 1201
Author's personal copy
Schutz M, Risch AC, Achermann G, Thiel-Egeneter C, Page-
Dumroese DS, Jurgensen MF, Edwards PJ. 2006. Phosphorus
translocation by red deer on a subalpine grassland in the
central European Alps. Ecosystems 9:624–33.
Schutz M, Risch AC, Leuzinger E, Krusi BO, Achermann G.
2003. Impact of herbivory by red deer (Cervus elaphus L.) on
patterns and processes in subalpine grasslands in the Swiss
National Park. For Ecol Manag 181:177–88.
Smith P, Fang C, Dawson JJC, Moncrieff JB. 2008. Impact of
global warming on soil organic carbon. Adv Agro 97:1–43.
Spalinger LC, Haynes AG, Schutz M, Risch AC. 2012. Impact of
wild ungulate grazing on Orthoptera abundance and diversity
in subalpine grasslands. Insect Conserv Divers 5:444–52.
Strebel D, Elberling B, Morgner E, Knicker HE, Cooper EJ. 2010.
Cold-season soil respiration in response to grazing and
warming in high-arctic Svalbard. Polar Res 29:46–57.
Thorne M, Frank DA. 2009. The effects of clipping and soil
moisture on leaf and root morphology and root respiration in
two temperate and two tropical grasses. Plant Ecol 200:205–15.
Turner CL, Seastedt TR, Dyer MI, Kittel TGF, Schimel DS. 1992.
Effects of management and topography on the radiometric re-
sponse of a tallgrass prairie. J Geophys Res Atmos 97:18855–66.
Vargas R, Baldocchi DD, Bahn M, Hanson PJ, Hosman kP,
Kulmala L, Pumpanen J, Yang B. 2011. On the multi-temporal
correlation between photosynthesis and soil CO2 efflux: rec-
onciling lags and observations. New Phytol 191:1006–17.
Wardle D, Bardgett RD, Klironomos JN, Setala H, van der Putten
WH, Wall DH. 2004a. Ecological linkages between above-
ground and belowground biota. Science 304:1629–33.
Wardle D, Yeates GW, Williamson WM, Bonner KI, Barker GM.
2004b. Linking aboveground and belowground communities:
the indirect influence of aphid species and diversity on a three
trophic level food web. Oikos 107:283–94.
Wardle DA, Bonner KI, Barker GM. 2002. Linkages between
plant litter decomposition, litter quality and vegetation re-
sponses to herbivores. Funct Ecol 16:585–95.
Wilsey BJ, Parent G, Roulet NT, Moore TR, Potvin C. 2002.
Tropical pasture carbon cycling: relationships between C
source/sink, above-ground biomass and grazing. Ecol Lett
5:367–76.
White RS, Murray S, Rohweder M. 2000. Pilot analysis of global
ecosystems: grassland ecosystems technical report. Washing-
ton: World Resources Institute.
Zhou X, Wang J, Hao Y, Wang Y. 2010. Intermediate grazing
intensities by sheep increase soil bacterial diversities in an
Inner Mongolian steppe. Biol Fert Soils 46:817–24.
1202 Anita C. Risch and others
Author's personal copy
Related Documents