THE RESPONSE OF BIRDS TO DROUGHT Examining Species Abundance and Richness with the Christmas Bird Count by Britt O’Leary A Thesis Submitted in partial fulfillment of the requirements for the degree Master of Environmental Studies The Evergreen State College June 2014

Welcome message from author
This document is posted to help you gain knowledge. Please leave a comment to let me know what you think about it! Share it to your friends and learn new things together.
Transcript

THE RESPONSE OF BIRDS TO DROUGHT
Examining Species Abundance and Richness
with the Christmas Bird Count
by
Britt O’Leary
A Thesis
Submitted in partial fulfillment
of the requirements for the degree
Master of Environmental Studies
The Evergreen State College
June 2014

© 2014 by Britt O’Leary. All rights reserved.

This Thesis for the Master of Environmental Studies Degree
by
Britt O’Leary
has been approved for
The Evergreen State College
by
________________________
Kevin Francis
Member of the Faculty
________________________
Date

ABSTRACT
The Response of Birds to Drought
Examining Species Abundance and Richness with the Christmas Bird Count
Britt O’Leary
The response of bird species to precipitation patterns and drought was measured using the Christmas Bird Count Database and precipitation data from weather stations. Two studies were performed, a population analysis and a presence/absence analysis. The first study found that the use of the Christmas Bird Count is an unsound way to measure population responses to rainfall. However, there may still be indications of population trends for some species. The second study indicated that species richness declined during drought. This was especially pronounced for species with certain migratory habits, dietary needs and habitat preferences. As our Global Climate shifts, drought many become more common, especially in the southern United states. We can expect to see many species disappear from their current occupied ranges.
iv
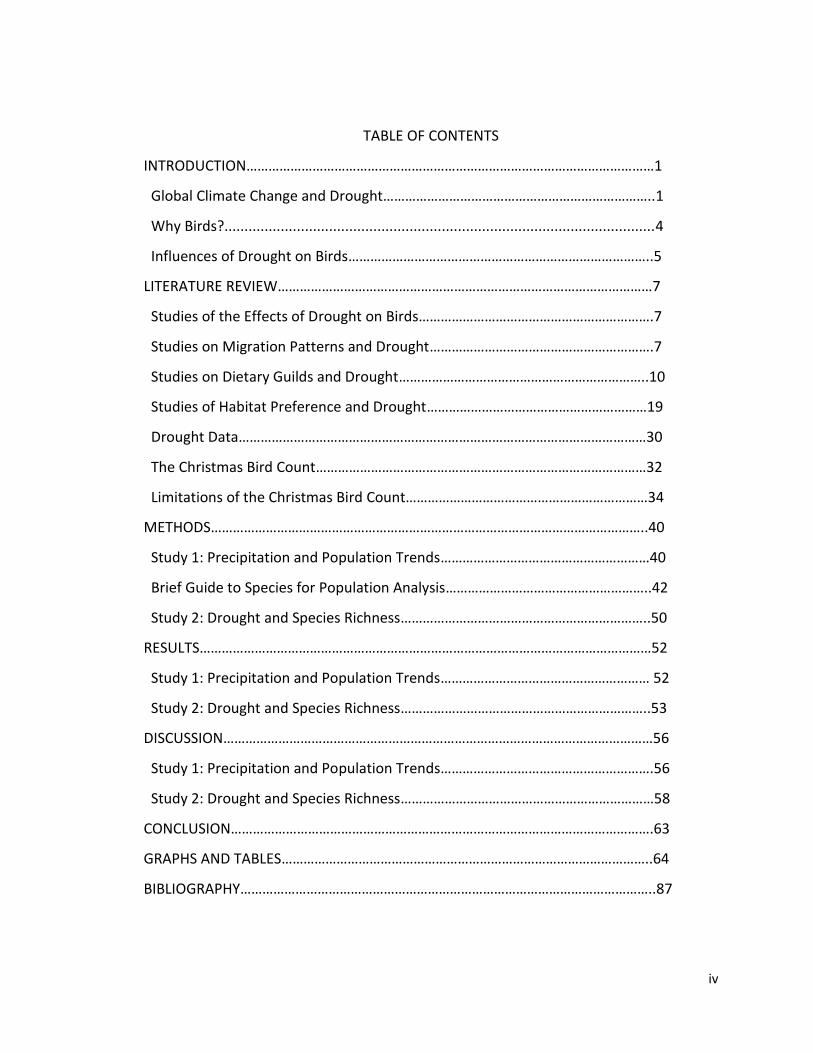
TABLE OF CONTENTS
INTRODUCTION…………………………………………………………………………………………………1
Global Climate Change and Drought………………………………………………………………..1
Why Birds?...........................................................................................................4
Influences of Drought on Birds………………………………………………………………………..5
LITERATURE REVIEW…………………………………………………………………………………………7
Studies of the Effects of Drought on Birds……………………………………………………….7
Studies on Migration Patterns and Drought…………………………………………………….7
Studies on Dietary Guilds and Drought…………………………………………………………..10
Studies of Habitat Preference and Drought……………………………………………………19
Drought Data…………………………………………………………………………………………………30
The Christmas Bird Count………………………………………………………………………………32
Limitations of the Christmas Bird Count…………………………………………………………34
METHODS………………………………………………………………………………………………………..40
Study 1: Precipitation and Population Trends…………………………………………………40
Brief Guide to Species for Population Analysis………………………………………………..42
Study 2: Drought and Species Richness…………………………………………………………..50
RESULTS……………………………………………………………………………………………………………52
Study 1: Precipitation and Population Trends………………………………………………… 52
Study 2: Drought and Species Richness…………………………………………………………..53
DISCUSSION………………………………………………………………………………………………………56
Study 1: Precipitation and Population Trends………………………………………………….56
Study 2: Drought and Species Richness……………………………………………………………58
CONCLUSION…………………………………………………………………………………………………….63
GRAPHS AND TABLES………………………………………………………………………………………..64
BIBLIOGRAPHY…………………………………………………………………………………………………..87

v
LIST OF FIGURES
Figure 1. Regression plot showing Canada Geese bird sightings per hour and December Snowfall in Carson City………….....………………………………………………………………………………….64
Figure 2. Regression plot showing Gadwall bird sightings per hour and Total Precipitation in Carson City…………………………………………………………………………………………………………….…64
Figure 3. Regression plot showing California Quail bird sightings per hour and Total Precipitation in Carson City, NV……..…………………………………………………………………….………65
Figure 4. Regression plot showing Savannah Sparrow bird sightings per hour and December Precipitation in Carson City, NV……………………………………………………………….….65
Figure 5. Regression plot showing Pine Grosbeak bird sightings per hour and December Precipitation in Jackson Hole, WY…………………………………………………………………………………66
Figure 6. Regression plot showing Red Crossbill bird sightings per hour and Total Snowfall in Jackson Hole, WY……………………………………………………………………………………….66
Figure 7. Time series graph showing Time series graph showing birds per hour sightings of the Belted Kingfisher in Jackson Hole, WY..………………………………………………………………73
Figure 8. Time series graph showing birds per hour sightings of the Downy Woodpecker in Jackson Hole, WY…………………………………………………………………………………….……………….73
Figure 9. Time series graph showing birds per hour sightings of the Hairy Woodpecker in Jackson Hole, WY………………………………………………………………………………….……………………..74
Figure 10. Time series graph showing birds per hour sightings of the Grey Jay in Jackson Hole, WY………………………………………………………………………………………..…………………………….74
Figure 11. Time series graph showing birds per hour sightings of the Canada Geese in Carson City, NV………………………………………………………………………………………………………..…..75
Figure 12. Time series graph showing birds per hour sightings of the California quail in Carson City, NV……………………………………………………………………………………………..……………..75
Figure 13. Time series graph showing birds per hour sightings of the American Dipper Sedona, AZ…………………………………………………………..……………………………………………………….76
Figure 14. Time series graph showing birds per hour sightings of the Canada Geese in Sedona, AZ……………………………………………………………………………………………..…………………….76
Figure 15. Time series graph showing birds per hour sightings of the Gadwall in Sedona, AZ…………………………………………………………………………………………………………………………………77

vi
LIST OF TABLES
Table 1: Results of Regression Analysis in the Population Study…………………………………..67
Tables 2: Results of the percentage difference from the average number of bird sighted
for all years, from the numbers of bird sighted in drought years………………………………….78
Table 2a: Jackson Hole, WY………..…………………………………………………………………………………78
Table 2b: Carson City, NV……………………………………………………………………………………………..79
Table 2c: Sedona, AZ…………………………………………………………………………………………………….81

vii
ACKNOWLEDGMENTS
I would like to thank the professors and staff at Evergreen State College for making this
thesis possible. Special thanks to Kevin Francis, Carrie Leroy, Martha Henderson, and
Gail Wootan. Their advice and aid was invaluable.
I dedicate this thesis to my loving parents, Dave O’Leary and Sally O’Leary. Without their
loving support, I would have never made it through college.
Lastly, I would like to thank my cat Vikki. She kept me sane by driving me crazy.

1
INTRODUCTION
Drought has a profound effect on birds. Depending on the species, their life habits and
their preferred habitat, birds may face a harder struggle to survive during prolonged dry
spells. They may also experience benefits, such as less snowfall in winter. Blessing or
bane, it is important to know how drought affects birds. As our planet’s climate
changes, such events are expected to become more frequent and severe.
Global Climate Change and Drought
Climate is a major factor in what kind of ecosystem is present in any given area.
Climate determines how hot summers will get, how cold winters will be, how much
precipitation will fall, and when that precipitation will arrive. Climate is an important
determining factor in the type of habitats that exist in any given area, be they rivers,
forests, deserts or jungles. The organisms living in these habitats are highly adapted to
whatever climate conditions have existed there for the past few millennia. However, in
recent years climatic conditions are changing at a record pace (IPCC, 2014). It is
expected that habitats all over the globe will be altered (IPCC, 2014). Changes will
include disruptions in normal precipitation patterns, creating more habitats afflicted by
frequent drought (IPCC, 2014).
Weather patterns will undergo substantial change due to Global Climate Change (IPCC,
2014). Precipitation frequency, intensity and type will differ over large areas of the
planet (IPCC, 2014). Pre-climate change, patterns for much of the world included

2
predictable rain cycles with frequent but moderate storm events. Climate change is
altering these weather cycles toward the extremes (IPCC, 2014). Areas nearer the tropic
of Cancer and the Tropic of Capricorn will have less rain on average (IPCC, 2014). The
Southwestern U.S.A. is also expected to have increased problems with drought (deBuys,
2011). Other areas will have the same average precipitation, but concentrated into a
few heavy storm events instead of spread out over the season (IPCC, 2014). This creates
boom and bust scenarios, where long periods of insufficient rainfall are followed by
flood-causing downpours.
The type of precipitation that falls matters as well. Many lowland ecosystems are
surprisingly dependent on mountain snowfall. Winter snow builds up in high altitude
areas and creates a slow release system for water over the rest of the year. Melting
snowpack keeps rivers fed in dry summers. With global climate change, there has been
less and less snowfall in high altitude areas (IPCC, 2014). Much of the precipitation falls
as rain instead. Rain does not create a slow release water system. Instead the water
arrives in the lowlands all at once, swelling rivers and streams in winter but leaving
them dry in summer.
Snowfall also serves to regulate the populations of organisms living in mountainous
areas. Snow makes survival harder for animals. It covers over and hides sources of food,
and makes ground travel much more difficult. Where there is a blanket of snow in
winter, animals must expend extra energy to locate food at the time when food sources
are most limited. Other organisms are killed outright by the cold and wet that
accompanies snowfall. The survival rates of hibernating insects and their eggs are

3
reduced by cold and snowy winters. This keeps the populations of some insect species
low, while excluding other species entirely.
In order to avoid the harsh conditions created by blankets of snow, many species of
animals, such as deer and elk, move into lowland areas during snowy winters (Martin,
2007). Mountain plants benefit from this reduction in the number of herbivores (Martin,
2007). However, in recent years, less and less snow has been falling (IPCC). This creates
conditions that allow large herbivores to remain in the mountains all year (Martin,
2007). The highland plants are now under increased pressure from these hungry
creatures (Martin, 2007). Insects and their eggs also survive better in dry winters.
Formally excluded insect species can move into higher altitudes. The increasingly dry
mountain winters have allowed destructive insects, such as the mountain bark beetle
(Dendroctonus ponderosae) to expand their ranges and destroy many trees.
Climate change alone would drive an increase in the incidence of drought, but there is
one more factor insuring that the future will experience a higher incidence of severe
drought: alteration of the landscape by human activities.
Human alteration of the landscape often involves the removal of forests. The trees in a
forest pull water up from the soil and release it into the air in a process known as
transpiration. This means that every forest is a giant, living, water pump that transfers
water from the ground, back into the atmosphere. This water then condenses and falls
as rain. Forests are rain-makers. Yet humans are cutting down forests at an enormous

4
rate and replacing them with cropland, cattle pastures, homes, shops and pavement.
None of these new landscapes provide the rain generating services of a forest.
With both global climate change and deforestation affecting our planet, it is certain
that drought events will become more common and severe (IPCC, 2014). It is therefore
important to understand the effects of drought. This includes more than just the effects
of drought on humans and their agriculture. It includes the impact of drought on plants
and wildlife. In this paper I will be examining the effects of drought on birds.
Why Birds?
Birds are excellent organisms for study. Their diurnal activity cycles and overall human
appeal makes them some of the most studied animals. Enormous numbers of people,
both scientists and non-scientists, observe birds. Birdwatchers make note of local bird
species, the timing of their appearances and disappearances from an area, and their
behavior. Multiple citizen science programs have been set up to make use of this public
interest to gather data. This creates an enormous amount of data that can be used to
make inferences about avian populations. The Christmas Bird Count is one of these
programs.
Birds also make excellent indicator species. An indicator species is one in which the
health of that species population reflects the health of its overall ecosystem. The higher
trophic levels and sensitivity to change common to many species of birds make them
excellent candidates for consideration as indicator species.

5
Influences of Drought on Birds
The following factors are known to affect bird numbers in a drought: lowered food
availability (Bolger, et al., 2005), lack of plant cover leading to increased predation
(Martin, 2007), heat stress (George, et al., 1992), lowered water availability (Albright, et
al., 2010) and use of a decreasing number of water sources leading to increased disease
transmission.
Migratory patterns have a strong influence on how birds cope with unfavorable
conditions (Albright, et al. 2010). Resident birds continue to be counted in local bird
surveys while migrants, especially long-distant migrants, disappear (Albright, et al.
2010). When drought ends, migrant numbers return to normal very quickly. This
suggests the migrants simply left the area to seek better conditions elsewhere (Albright,
et al. 2010). If the lack of migrants reflected a population crash it would take longer for
surviving birds to rebuild their numbers.
The preferred habitat of a bird is a strong determining factor in how well it does in a
drought (Albright, et al. 2010). Birds that prefer naturally dry habitats, such as
grasslands, are hit harder by drought then birds that live in wetter areas (Albright, et al.
2010; George, 1992). Birds that live in mountainous areas experience some direct
benefit from a lack of precipitation (Albright, et al. 2010). However, they suffer many
indirect costs (Dybala, et al., 2013).
Why would mountain birds appear to do better in drought? The determining factor
appears to be snowfall (Albright, et al. 2010). A deep blanket of snow is lethal for many

6
animals struggling to find food in cold weather, birds included. Drought reduces snow,
and makes winter survival easier. However, this apparent benefit is balanced by other
survival costs. For example, only adult Song Sparrows (Melospiza melodia) show
increased survival during drought, juvenile sparrow survival decreases (Dybala, et al.,
2013).This is a result of lowered primary productivity in spring, brought on by a
reduction in available melt water from winter snows (Dybala, et al., 2013). This lowered
primary productivity results in less food for birds (Dybala, et al., 2013). Adults are able
to use their experience at finding hidden or alternative food sources to survive (Dybala,
et al., 2013). Juvenile birds lack this experience and often starve (Dybala, et al., 2013).
This is not the only indirect effect to harm bird populations. Low snowfall also
increases the survival rates of other animals, such as predators (Dybala, et al., 2013) and
competitors (Martin, 2007). For example, dry winters allow deer and elk remain in the
highlands, increasing browsing pressure on local plants and trees (Martin, 2007). These
animals can strip their habitat of foliage (Martin, 2007). When this happens, local birds
lose precious cover for nesting, foraging and hiding from predators (Martin, 2007).

7
LITERATURE REVIEW
In this Literature review, I will summarize each of the papers I researched over the
course of my thesis. Each review will start with a paragraph stating the most important
part of the subsequent study to my research. Then, I will go into more detail about the
study.
After looking at studies of drought effects on birds, I will take a detailed look at my
data sources. The data section will begin with my sources of precipitation data. This
section will explain the various definitions of drought as well as my source for individual
weather station recordings. The final part of this section will cover the Christmas Bird
count. This coverage will include an explanation of what the Christmas Bird Count is and
the limitations and benefits of using this data.
Studies of the Effects of Drought on Birds
All studies in this literature review divide bird species up into one or more categories
based on their natural history. This allows generalizations to be made on the effects of
drought. Studies that primarily use migratory patterns to divide bird species will be
looked at first, followed by studies using dietary guilds. Lastly, this section of the
literature review will include studies in which habitat preference is the primary focus.
General Studies on Migration Patterns and Drought
Birds with highly mobile life histories tend to be more responsive to drought then birds
that remain in one area all their lives. The greater the distance these birds travel during

8
their life histories, the stronger the response. Migrants leave drought stricken areas to
seek better conditions elsewhere. Resident species remain regardless of conditions. The
Albright et al. paper studied the response of birds to precipitation patterns, and
greenness using migratory guilds and habitat preferences. This study found that
migrants respond more rapidly to changing precipitation.
The Albright et al. study is the most comprehensive paper I have found on the effects
of drought on birds. This paper covers an enormous amount of data. The area of study
included the entire central United States. Studied variables included ecoregions,
thickness and vigor of the vegetation (greenness), degrees of difference in precipitation,
and the habitat preferences and migratory patterns of the studied birds. The bird data
consisted of reports from 1,287 breeding bird survey routes. Bird species were divided
into four guilds: long-distance migrants, short-distance migrants, residents and
synanthropes (birds that do best in human habitats). Weather data was collected from
1,639 weather stations. To determine vegetation vigor, measurements of standardized
seasonal greenness (SSG) were obtained from satellites equipped with an Advanced
Very High-Resolution Radiometer (AVHRR).
Overall the Albright study found that precipitation was positively related to both avian
abundance and richness. Dry ecoregions showed the greatest changes relative to
precipitation. However, in mountain ecoregions precipitation was negatively related to
abundance, likely due to snowfall. Permanent resident bird abundance was more
strongly related to greenness, while species richness for this guild was more strongly
related to precipitation. Short-distant migrants showed a positive response to

9
precipitation levels in both abundance and richness in all ecoregions except in the
mountains. Long-distance migrant abundance and richness showed the strongest
positive response to precipitation. Synanthropes showed the least response to
precipitation. In all cases, abundance and richness of bird species returned to normal
the year after a drought. The stronger responses of long distance migrants to
precipitation and the speed with which they returned after the drought suggested that
these birds moved into other, less afflicted areas during the drought. When the rains
returned so too did the birds.
Desert birds regularly experience local drought conditions. They adapt through a highly
mobile lifestyle by continually traveling to areas of recent rainfall. The Robin book
provides a natural history of these drought adapted birds.
The Robin book contained several chapters on the ways various species of Australian
birds cope with drought. Among the most important variables for bird survival in this
region are high mobility and a flexible life history. Birds that live in the dry continental
interior of Australia must be able to readily leave drought stricken areas, and forestall or
forgo breeding in bad years. They also must be able to locate areas of recent rainfall and
breed whenever and wherever conditions permit, regardless of season. This book
included some educated guesses about how desert birds locate places where rain has
recently fallen. Several species may use infrasonic hearing to pick up the sound of
distant rain.

10
The Chan study uses avian migration patterns to study species richness and abundance
in drought and non-drought years. The paper found that migrants rapidly return to an
area when drought conditions end.
The Chan paper covers a study in Rockhampton, Australia that looked at bird
abundance in the last year of a four year drought and in the subsequent non-drought
year. Birds were counted via strip transects. Both species abundance and richness were
measured. There was a significant decline in both abundance and richness during the
drought year compared to the non-drought year. Chan discusses avian migration
patterns in this paper as a possible reason for the rapid increase in bird numbers during
the non-drought year but does not go into detailed analysis. The study acknowledges
that bird populations make take more than one non-drought year to return to normal
levels. As the year of normal rainfall in the study took place after the drought, it may not
have been a good control for comparison.
Studies on Dietary Guilds and Drought
The effects of drought often work their way up the food chain. Plants wither from
water loss, or fail to produce seed. This deprives plant eaters of needed food. The plant
eaters then become reduced in number, which deprives their predators of food. The
higher up the food chain an organism is the more vulnerable it is to starvation when the
lower levels of the food chain are reduced. The Smith paper examines changes in avian
community structure caused by a drought. This study found that birds at higher trophic
levels were more severely affected then lower ones.

11
The Smith study takes place in a mountainous environment where snowfall is vital to
the local ecology. From 1976 to 1979 Smith conducted research in the Bear River
Mountains, which run from Southern Idaho into Northern Utah. This environment
included disturbance-created meadows and successional stages of forest. When
selecting sites for her study plots, Smith chose to create one four to ten hectare plot per
successional stage. Each plot was censused approximately ten times during each avian
breeding season. In addition to bird counts, insect surveys were taken using a vacuum
sampler. The seventy one species of birds observed during this study were sorted into
feeding guilds.
In the years, 1976, 1978, and 1979, snowpack levels were comparable to average
levels. However, in 1977, no snow fell. In addition, summer temperatures for that year
were higher than average. This increased rates of evapotranspiration, reducing water
supplies even further.
During the drought there was a marked decline in the number of breeding bird species
in the aspen-dominated plot. There was also a slight decline in the number of breeding
birds in the fir-dominated plot. Total numbers of species did not change much during
the drought, but the species composition differed greatly. Also affected during the
drought year was the density of breeding species. Different avian feeding guilds
responded differently to the drought. The two species of obligate nectarivores became
virtually absent. Insectivores also suffered declines. Carnivorous birds also appeared to
decline, but their relative rarity even under normal circumstances made it difficult to be
certain. Surprisingly, granivorous birds actually became more abundant. This result was

12
due in part to a record breaking abundance of coniferous cones the year of the drought.
This immense food resource attracted previously absent granivorous bird species to the
area.
When a drought is severe even mid-level predators such as insectivores struggle to find
enough food for their growing young. The Bolger study looked at insect abundance and
the breeding success of birds over the course of a drought. Drought was found to
reduce the numbers of insects which led to reduced avian breeding success.
The Bolger paper examined the relationship of precipitation to reproductive success of
four bird species: the Rufous-crowned Sparrow (Aimophila ruficeps), the Wrentit
(Chamaea fasciata), Spotted Towhee (Pipilo maculatus), and California Towhee (P.
crissalis). All of these birds rely on insects to feed their young.
This three year study took place in coastal sage scrub habitat located in San Diego
County, California. Normal climate patterns for the area include winter rains followed by
summer drought. The researchers were primarily concerned with whether the
relationship of avian breeding success to precipitation was linear or non-linear. There
were a total of sixteen study plots, including both fragmented and continuous sage
scrub habitat. Each plot contained two to four focal nesting pairs of each of the studied
species. Nests were monitored at two to three day intervals.
The abundance of arthropods in the study plots was estimated with use of pit traps and
visual search transects. This was done to determine if drought effects on avian breeding
success were due to lowered food abundance.
13
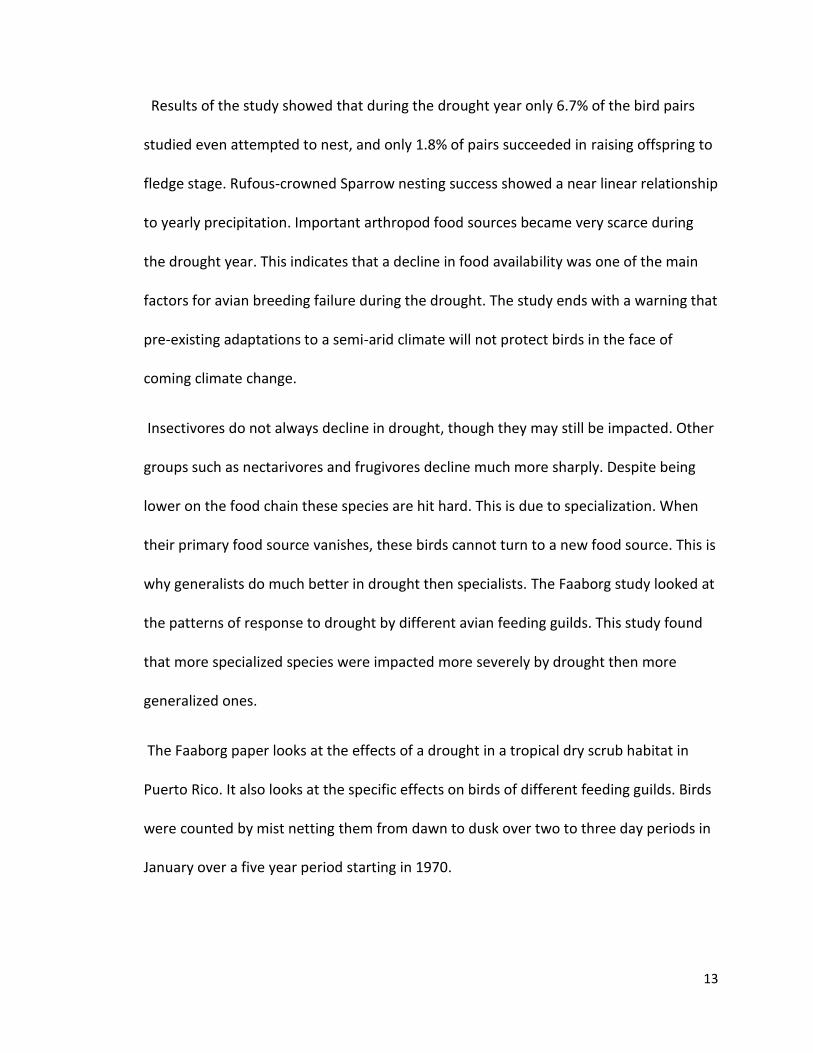
Results of the study showed that during the drought year only 6.7% of the bird pairs
studied even attempted to nest, and only 1.8% of pairs succeeded in raising offspring to
fledge stage. Rufous-crowned Sparrow nesting success showed a near linear relationship
to yearly precipitation. Important arthropod food sources became very scarce during
the drought year. This indicates that a decline in food availability was one of the main
factors for avian breeding failure during the drought. The study ends with a warning that
pre-existing adaptations to a semi-arid climate will not protect birds in the face of
coming climate change.
Insectivores do not always decline in drought, though they may still be impacted. Other
groups such as nectarivores and frugivores decline much more sharply. Despite being
lower on the food chain these species are hit hard. This is due to specialization. When
their primary food source vanishes, these birds cannot turn to a new food source. This is
why generalists do much better in drought then specialists. The Faaborg study looked at
the patterns of response to drought by different avian feeding guilds. This study found
that more specialized species were impacted more severely by drought then more
generalized ones.
The Faaborg paper looks at the effects of a drought in a tropical dry scrub habitat in
Puerto Rico. It also looks at the specific effects on birds of different feeding guilds. Birds
were counted by mist netting them from dawn to dusk over two to three day periods in
January over a five year period starting in 1970.

14
The years 1970-1971 were a period of normal to above normal rainfall. However, the
dry season started a month early in 1972. Afterward the years 1973-1975 featured
severe drought conditions during the avian breeding season.
Total resident bird populations declined during the drought years. Frugivores (fruit-
eating) birds showed the greatest decline in numbers. However, two frugivores, the
Pearly-eyed Thrasher (Margarops fuscatus) and the Red-legged Thrush (Turdus
plumbeus), increased in number. Nectarivores declined during the drought years;
particularly obligate nectarivores such as hummingbirds. Gleaning insectivores declined
very slowly compared to other feeding guilds, while fly-catching insectivores declined
sharply at first before making a slight comeback. Interestingly, populations of winter
migrant insectivores rose and fell in the opposite direction of resident insectivores. In
fact when resident insectivore populations were at their lowest, five new species of
winter migrant were netted in the study area. Two of these, the Cape May Warbler
(Dendroica tigrina) and the Indigo Bunting (Passerina cyanea), had never been seen in
the area before.
Faaborg hypothesizes that the strong declines of frugivores and nectarivores were
directly related to lowered primary productivity in their food plants. Drought stressed
plants may forego reproduction in bad years, resulting in a lack of flowers and fruit.
However, these plants continued to produce leaves, which fed the insect prey of
insectivores.
15
The increase in migrant insectivores in relation to the decline of residents may reflect
their competitive relationship for the same food source. Resident insectivores breed in
the earliest part of the wet season. Hence, when the wet season is late it reduces the
breeding success of residents, lowering their population. With fewer resident birds to
compete with more winter migrants were able to move into the area.
Unfortunately, the Faaborg study is located in the tropics where there are far more
bird species adapted to the frugivore and nectarivore niches. My study takes place in
North America during the winter, when members of these two dietary guilds have
already migrated south. My study did however, include over-wintering insectivores.
Hence Faaborg’s study is still relevant.
While frugivores and nectarivores are specialized to a certain extent, they are not as
specialized as the South Hills Red Crossbill (Loxia curvirostra/ sinesciuris). This very
specialized species faces a lot of risk when its environmental conditions deteriorate.
These birds are strongly affected by a specific phenomenon that often accompanies
drought: excessively hot weather. These heat waves reduce the birds’ access to their
sole food source. The Santisteban study examined the effects of heat waves on the
South Hills Red Crossbill. They found that hot weather caused pine trees to drop their
seeds, rendering them inaccessible to the birds.
The Santisteban paper looks at the effects of hot spring and summer weather on the
South Hills Red Crossbill (Loxia curvirostra/ sinesciuris), a range restricted, and specialist
species of bird. I included this paper because heat waves often accompany drought. Of
16
particular importance is the alteration of habitat due to global climate change. High
altitude ecosystems are under particular threat as they are unable to shift upward or
northward to cooler zones.
This study takes place in southern Idaho. The South Hills Crossbill specializes in eating
the seeds of the Rocky Mountain lodgepole pine (Pinus contorta latifoloa). The bird has
a specialized beak with crossed tips that it uses to pry open lodgepole pine cones to
extract the seeds. It has a very restricted range along the peaks of two small mountain
ranges: the South Hills and the Albion Mountains. Multiple threats to the birds’
existence are studied in the paper. These include scaly-leg mite (Knemidokoptes
jamaicensis) infestation and infection by the West Nile virus. However, the study
indicates these threats were not significantly impacting the birds. The real threat was
the increasing occurrence of hot weather.
This six year study used both point-transect surveys and mark-recapture-resighting
methods to examine crossbill populations. Presence/absence and degree of infestation
by scaly-leg mites was recorded in captured birds. This allowed the researchers to
determine that mite infestation was not responsible for the decrease in crossbill
populations over the course of the study. Age class, sex and general health of captured
birds was also recorded.
The lodgepole pine produces cones that remain closed until heat triggers them to open
and release their seeds. This is an adaptation to forest fires. Under normal
circumstances, seeds would remain dormant and protected within their cones until a

17
forest fire cleared out the understory and left a nourishing layer of ash. The heat of the
fire was the signal for the cones to open. Over the course of the study, a series of
exceptionally hot summers caused many pine cones to open and drop their seeds
without the involvement of fire. Climate data suggests these hot summers will continue
and may get even hotter. When released from their cones without the presence of fire,
lodgepole seeds have little chance of growing into trees. They are not able to compete
with understory plants.
The trees are not just dropping their seeds at the wrong time; they are producing fewer
seeds to begin with. During the study, annual cone production in the South Hills
dropped by 27%. Additionally mortality rates for adult lodgepole pines rose. As a result
the lodgepole pine population in the South Hills and the Albion Mts. is under serious
threat.
As go the trees, so goes the birds that depend on them. South Hills Crossbills get all
their food by prying open closed pine cones. They do not pick up seeds off the ground.
So when soaring summer temperatures cause cones to drop their seeds, it dramatically
reduces the amount of food available to the birds. Over the course of the study crossbill
density dropped 63% (p = 0.0003).
Interestingly, female crossbill survival dropped more than male survival as
temperatures increased. Juvenile survival rates did not change significantly. Nor did
nesting success decline as crossbills have a very variable breeding schedule and tie their
breeding directly to food availability.

18
This paper concludes that additional management efforts should be used to maintain
the lodgepole pine forests in the South Hills and the Albion Mountains. This may not be
enough however. Due to the warming climate this region may soon be totally unsuitable
for this type of habitat.
Certain dietary guilds of birds are more prone to extinction than others. The most at-
risk dietary guilds are in order: scavengers, piscivores, herbivores, omnivores,
granivores, and frugivores. The Şekercioğlu paper is primary focused on the ecological
importance of birds from a global perspective. However, it makes some very interesting
predictions regarding how vulnerable different dietary guilds are to disaster.
For the Şekercioğlu study, the researchers created a computer model using two data
bases. One database contained the conservation status, distribution and life histories of
9,787 extant bird species and 129 extinct ones. The other database contained studies of
the ecological roles of birds and their contributions to the functioning of both natural
and human-dominated ecosystems.
Each of the bird species in the model were given a probability of extinction based on
their current conservation status. Critically endangered species were given a 50%
chance of becoming extinct over the next ten years. Endangered species were given a
20% chance of extinction over the next twenty years, and vulnerable species were only
given a 10% chance of extinction over the next one hundred years.
Three possible scenarios were used to run simulations. In the best case scenario,
current conservation measures are assumed to be sufficient to prevent any more

19
species becoming threatened. These measures are not, however, assumed to raise the
odds of survival on already threatened species. In the intermediate case scenario,
historical records were used to calculate the probability that a non-threatened bird
species would come under threat over the course of a decade. This probability is then
assumed to be constant. In the worst case scenario, the probability of a non-threatened
species becoming threatened is assumed to grow by 1% every decade.
Probabilities were weighted for each species based on a factor known to significantly
correlate with threat status: range restriction. Bird species with small ranges are more
likely to become threatened then species with broad ranges.
Bird species that are endangered or worse are considered “functionally extinct” by the
model. They are no longer considered to be adequately contributing to the function of
their local ecosystems where these ecosystems still exist.
The results of the researchers’ simulations indicate that 21% of the 9,916 studied
species are extinction prone. According to this study, half of threatened bird species are
in trouble due to habitat loss. Where habitat loss is a factor, the disruption of ecological
function leads to the functional extinction of bird species.
Where habitat loss is not a factor, diet may be the key. This study found that diet
makes a big difference in the susceptibility of a species to extinction. Scavengers are the
most vulnerable, particularly large ones. This is followed by piscivores, herbivores,
omnivores, granivores, and frugivores. Insectivores are not considered especially
vulnerable. Sadly this study did not include carnivores as a dietary guild.

20
The conclusion of this study warns that the extinction of bird species may lead to the
destruction of ecological function.
Studies of Habitat Preference and Drought
Habitat plays a key role in the response of a species to drought. Some ecosystems are
more resilient to a lack of rainfall than others. However, even species that live in an
ecosystem that is highly resistant to drought may become much more vulnerable after
human disturbance alters their home. In these cases, access to higher quality habitat
determines how well they will do when the rains fail to fall. The George study looked at
how the quality and diversity of prairie grassland habitat affects the birds that live there
during drought. This research found that more birds were found in high quality habitat
during drought then in poor quality habitat.
The bird study covered by the George paper took place in western North Dakota over a
three year period. This period of time included the years before, during and after a
drought. This drought included extreme heat as well as reduced precipitation. Fifteen
grassland bird species living in mixed-grass prairie habitat were counted and analyzed.
This study took place alongside another study examining the effectiveness of biological
control agents against grasshoppers. Transect surveys by the bird study included areas
within the grasshopper study where the biological agent Nosema locustae was used as
well as areas where no agents were used. The bird study transects did not overlap areas
where traditional pesticides were applied by the grasshopper study group. It was
assumed that Nosema would have no effect on birds, whereas the pesticides would

21
have a negative effect. Therefore bird study transects were always at least five km from
pesticide sprayed areas.
Each of the twelve study transects was censused by two independent observers on the
same mornings. Transects were only censused in late May and late June. Analysis of
habitat quality was included. Nests, eggs and young birds were also included to monitor
bird breeding success.
An enormous amount of statistical analysis was included in this study. Drought analysis
included comparison of daily average high temperatures with drought highs, and
precipitation was compared with the long-term mean. Bird analysis included total bird
density, densities of the eight most common species, species richness, diversity, and
evenness. Each of these factors was compared according to month and year. The
researchers used two-way ANOVA, Hartley’s test and Ryan’s Q multiple range test.
During the drought, bird density declined 61%. Species richness and diversity dropped
during the drought but rebounded to pre-drought levels the next year. One species of
bird, the Horned Lark (Eremophila alpestris) increased in numbers over the study.
Western Meadowlarks (Sturnella neglecta) did not change in numbers in any significant
way during the study. All other species declined during the drought. Most species
recovered to pre-drought numbers the very next year. A few recovered more slowly.
Clay-colored Sparrows (Spizella pallida) failed to show any sign of recovery during the
post-drought study period. Nest abandonment became very frequent during the
22
drought, but nests that were not abandoned had similar fledgling success rates to non-
drought years.
Bird diversity dropped more on lower quality grassland then on that of higher quality.
Grassland quality is directly related to human land use patterns and other human
influences such as invasive species. This suggests that the effects of drought on
grassland birds are amplified by environmental degradation.
Environmental degradation does not have to be caused by local human activity.
Sometimes the negative effects of human land-use are felt many miles away. A river
may be lowered both by drought and by the irrigation of crops far upstream. The
Hinojosa-Huerta study examined bird abundance and species richness in a river delta
habitat during drought. It found that over allocation of upstream water to crops altered
the community structure.
The Hinojosa-Huerta paper covers a study of the effects of drought on the Colorado
River Delta. This riparian habitat is likely to disappear in the near future due to Global
Climate Change and human land use patterns. This makes it especially important that
the effects of drought on the area are understood.
The Colorado River is over-utilized by farmers in the United States. Flows that reach
the delta in Mexico originate as “waste spills”, agricultural drainage and governmentally
regulated water releases from reservoirs. This results in a very high degree amount of
fluctuation in water levels and flow rates. In the twenty years before the new
millennium, relatively large amounts of water were released from U.S. reservoirs every
23
year. This allowed extensive habitat restoration to take place on the Colorado River
Delta. Since the year 2000, drought has struck the watershed and water releases have
become increasingly smaller.
In order to study the effects of drought on bird populations, 136 sites were chosen
along the Mexican portion of the river and within the delta. Birds were counted using
transects run by teams of two persons. There were seventeen transects per site. Each
transect was composed of eight points, 200 m apart and extended for one point six km
from the levees toward the main channel of the river. All birds seen or heard within a
five minute period were counted. Flyover birds were discounted from analysis.
Estimates of abundance were expressed as birds per hundred ha based on point counts
and 95% confidence intervals. Careful surveys were conducted of the vegetation at
every survey point, including estimates of ground coverage, maximum height and
density of the vegetation, as well as species abundance.
As a result of the drought, shrub abundance and amount of bare soil increased. Tree
cover and open water decreased by 80%. Willows were the hardest hit, but all trees
declined in abundance. Continued loss of native vegetation is expected as many local
plants require flood flows to germinate seedlings.
Despite the deterioration of habitat bird abundance did not show any significant
trend. Community composition, however, changed substantially. Native land birds
declined, as did several species of breeding water birds and marsh obligate species.

24
Overall avian abundance remained steady because agriculture-loving synanthropes and
invasive species populations increased.
In the long run, it is expected that there will be much less water in this region,
accompanied by a rise in the salinity levels of the remaining water. This paper ends with
a note to policy makers. If resource managers wish to preserve this threatened
ecosystem, more water must be allocated to restoration efforts. As the climate grows
drier in this region, the researchers expect that there will be increasing conflict with
agriculture for water.
The greatest and most far reaching effect of human disturbance is global climate
change. This is leading to a drying out of the southwestern United States. As less and
less rain falls each year, it is causing widespread alterations to the ecosystems in these
areas. The Martin study marked the changes in bird species richness and abundance in
an increasingly dry local climate over the course of twenty years. The study found that
the reduced levels of snowfall allowed deer and elk to completely browse away the
forest understory. Bird abundance and species richness declined as a result.
The Martin paper is an exceptional study that takes a look at the larger ecological
picture as well as the direct effects of climate change on birds. This study took place
over a period of twenty years. The long study period enabled the author to examine the
longer term effects of climatic change. Like the Dybala study, this study took place in a
mountain forest ecosystem that normally experiences winter snowfall. The location of
the study, the Mogollon Rim, is a high elevation riparian system in Arizona.

25
Climate changes over the course of the study included significant decreases in winter
snowfall. This change in climate was measured using data from the Blue Ridge Ranger
Station.
Shallow valleys were used as study plots with marked stations every twenty five m.
Most plots were 625 m long and contained twenty five stations. Plant life was surveyed
for both species and density. Birds were counted in nine of the twenty two study plots
during the May-June nesting season.
The author chose to look at seven bird species that were locally abundant and nested
at or near ground level. These species were chosen because it was relatively easy for the
researchers to locate and study a large sample of nests. Bird nests were monitored for
clutch size, predation, starvation, and fledgling rates.
The author chose to use global models of analysis of covariance (ANCOVA) for each
dependent variable, with bird species as the main factor and hypothesized causal
factors as covariates. This method of statistical analysis was used to minimize multiple
testing issues while allowing multiple species to be examined simultaneously.
The results of the Martin study show the importance of winter snowfall. As seasonal
snow levels decreased, many plant species lost the steady supply of water they received
from snowmelt. This resulted in a reduction in the numbers of deciduous trees.
The lack of snow affected the trees in indirect ways as well. It allowed deer and elk to
remain in high altitude areas all year. These abundant herbivores browsed away the
understory of the forest and destroyed saplings, further reducing the number of

26
deciduous trees. The deer also ate coniferous saplings, preventing them from colonizing
places left open by the disappearing deciduous trees. Overall the entire understory of
the forest was stripped leaving only adult coniferous trees.
The dramatic changes in forest structure had negative consequences for avian
breeding success. The reduction of deciduous trees and the loss of understory growth
created a lack of cover in which to nest. This forced the birds to nest in less than ideal
locations, where they could be more easily found by predators. As a result nest
predation increased over the course of the study.
Four of the seven species of bird in this study declined. One of them, the MacGillivray’s
Warbler (Geothlypis tolmiei) became locally extinct. Two other species, the Green-tailed
Towhee (Pipilo chlorurus) and the Orange-crowned Warbler (Oreothlypis celata)
declined precipitously. Red-faced Warblers (Cardellina rubrifrons) declined slightly.
Grey-headed Juncos (Junco hyemalis) actually became more abundant during the study.
Other effects of the change in climate included earlier nesting by most bird species.
However, the earlier timing did not appear to have a significant effect on breeding
success.
Reduced snowfall levels affect birds in many ways besides those detailed in the Martin
paper. Snowpack often serves as a kind of natural water “bank”. As it slowly melts, it
releases water into local rivers and streams. This may keep the downstream plant life
alive and green even in a very dry summer. When snow fails to fall in the mountains, it
may initially benefit local birds. It is much easier for them to find winter food when it is
27
not covered in snow. However, this lack of snow may mean food becomes much
tougher to find in spring and summer. The Dybala study examined how snowfall
patterns related to the adult and juvenile survival of Song Sparrows (Melospiza
melodia). This paper found that adult survival increased in years of low snowfall, while
juvenile survival decreased.
The Dybala paper is an excellent illustration of how warmer winters can both benefit
and harm birds. The subjects of the paper are Song Sparrows (Melospiza melodia) in
California. Birds were counted through the use of mist netting and bird banding.
This study showed that warm, dry winters have a direct, positive effect on adult
survival. However, there was a negative lag effect on juvenile survival (A lag effect is a
situation where the effect of an event is not seen during the event). After a dry winter,
juvenile sparrow survival rates in spring and summer dropped.
There appeared to be two reasons for this: lowered food availability and increased
predation. Wet winters fed water into the local ecosystem through mountain snowpack.
This resulted in increased plant growth during the spring. Dry winters resulted in poorer
spring growth. This decreased spring growth made it more difficult for the sparrows to
find food. The adult birds appeared to be able to find sufficient food due to their greater
survival experience, but the juveniles lacked this experience and were at risk of
starvation. The second effect of dry winters was increased predation. The same factors
that increased the survival of adult sparrows in winter also increased the survival rates
28
of sparrow predators. Again, adult experience appeared able to overcome this effect but
juvenile inexperience led to increased losses.
Many birds can adapt to the harsh conditions of drought. The Dybala study showed
adaptation at an individual level: experience and memory leading to better survival odds
in adults but not in juveniles. Other adaptations alter the very physical structure of the
species through the forces of natural selection. These changes take many generations.
The Grant study tracked multi-generational changes to the beak and body size of
Darwin’s Finches (Geospiza spp.). Drought was found to have a strong effect on the
direction of these changes.
The Grant paper looks at the evolutionary adaptations of birds to climate driven
ecological change. This study takes place on the Galapagos Islands. It is an exceptional
study in that nearly the entire population of interest has been marked, measured and
recaptured over the course of thirty years. This level of data allowed the researchers to
make unprecedented inferences about population dynamics and evolutionary change.
The focus of this extraordinary effort has been a group of birds known as Darwin’s
Finches (Geospiza spp.). These endemic birds arose from a common ancestor and
diverged into multiple specialized species that still retain many features in common.
The Galapagos Islands on which the birds live is subject to regularly occurring droughts.
The El Nino Southern Oscillation creates a cycle in which abundant rainfall is followed by
drought approximately twice a decade. This erratic but predictable pattern allowed the

29
researchers to obtain measurements of population characteristics before and after
ecological change.
The section of the study of most relevant interest to our topic took place on Isla
Daphne Major, a part of the Galapagos Archipelago. The two most common species of
finch on this island are the Medium Ground Finch (Geospiza fortis) and the Cactus Finch
(G. scandens). Mark-recapture studies on this species began in 1973 and 90-100% of the
birds on the island were ringed.
In 1977, a severe drought struck the island. Soft, easily cracked seeds were rapidly
depleted, but the large, hard to crack seeds of Tribulus plants remained abundant. Over
80% of the medium ground finches died, but they did not die at random. Pre-existing
variation in the population meant some birds had large enough beaks to crack Tribulus
seeds. These birds survived while their smaller beaked kin did not. When the survivors
nested, their young tended to have large and powerful beaks as well. The entire
population had shifted toward larger beaks.
In 1983, there was an unprecedented level of rainfall. This also dramatically altered
island ecology. Plants that had been dormant during the drought took over. They
shaded over and smothered the low growing Tribulus. The big seeded plants became
quite rare, replaced by twenty five other species of plants, all with smaller and softer
seeds.
A second drought hit the island in 1985. This time large beaked birds were at a
disadvantage. Large beaks take more energy to grow. They also add to a birds overall

30
weight in flight. With small seeds more abundant then large ones, a big beak costs more
energy than it is worth. Those birds in the population with slightly smaller beaks had
better survival odds then those with large. The population shifted again as smaller
beaked parents had smaller beaked offspring.
In all cases during this study, adaptation was only possible because varying beak sizes
were already present in the initial population. The traits that would allow some
members of the population to survive were already there. Where avian populations
have been decimated by other factors, these adaptive traits may no longer exist when
adversity hits.
This suggests that some birds may be able to adapt to the increased incidence of
drought and overall drying of their habitats brought on by global climate change.
However, we cannot count on this, particularly where climate change is not the only
threat to its survival that a species faces.
This final piece of literature on the topic of birds and drought gives a very broad
overview of the effects of climate change. The Wormworth book is a layperson’s look at
the overall effects of Global Climate Change on birds.
The Wormworth book is primarily focused on avian phenology (the study of the timing
of life events) and how climate change is leading to mismatches between the life
histories of birds and their food species. However, I found lots of information on
drought and its effects on birds as well. In this book, the Bolger, Martin, and Şekercioğlu
studies were translated into plain English and used as examples of the effects of drought

31
on birds and the importance of birds to ecosystems. At the end of the book, the author
expresses a lot of worry over the future of many species, particularly marine birds.
Drought Data
In this section, I will detail where I obtained information on precipitation and drought.
In my study, I looked at the records from three weather stations that were located as
close as possible to the locations of my bird data. This data came from
Weatherwarehouse.com. This website is a compilation of weather data from stations
across the United States. It is free to access. This site only provided raw data. It did not
explain what drought is or what the various measurements of drought are. For that I
used the National Oceanic and Atmospheric Administration’s Palmer Drought Indices.
The National Oceanic and Atmospheric Administration (NOAA) is a branch of the
United States Department of Commerce. This governmental body has many jobs to do.
It manages marine fisheries, funds research and is responsible for the National Weather
Service.
NOAA also maintains the National Climatic Data Center. This database includes all
United States weather from 1900 to the present, including all known droughts. The
National Climatic Data Center measures droughts with the Palmer Drought Indices and
the Standardized Precipitation Index.
The measurement of drought is actually a rather difficult process. While all drought
stems from a deficiency of precipitation; the duration, geographical distribution and

32
variety of scales of drought make it difficult to create a hard definition of it. The
development of a drought index to measure drought requires many different
quantitative measurements from an array of different disciples.
In order to account for all these complications, there are three different Palmer
Drought Indices to choose from at the National Climatic Data Center website, as well as
a Standardized Precipitation Index. The three Palmer Drought Indices are the Palmer Z
index, the Palmer Drought Severity Index and the Palmer Hydrological Drought Index. All
three are water balance indices that take precipitation, evapotranspiration and runoff
into account.
The Palmer Z Index only measures short term drought on a monthly scale. A subset of
this index, the Crop Moisture Index, measures drought on a weekly scale to better
enable quantification of drought on agriculture.
The Palmer Drought Severity Index examines atmospheric circulation patterns in order
to measure the duration and intensity of long term drought. The index takes into
account the cumulative effects of long term drought. This index can respond rather
quickly to shifts to and from drought periods to wet ones.
The Palmer Hydrological Drought Index looks at the impacts of drought on the water
levels of reservoirs, groundwater and other hydrological structures. Like the Drought
Severity Index this is a long term index. However it is much slower to respond to
condition changes.

33
The Standardized Precipitation Index is a probability index. Unlike the Palmer Drought
Indices, it looks at precipitation alone. This Index measures the probability of recording
a given amount of precipitation. The expected level of precipitation is counted as 0.
Positive values indicate more precipitation than expected, while negative values indicate
less. Greater positive or lower negative values indicate more extreme deviations from
the expected levels. This index is computed for several time scales to account for both
short and long-term drought.
Given that the goal of this thesis is to examine the effects of severe drought on birds, I
used the Palmer Drought Severity Index to determine how low a year’s precipitation
needed to be to count as drought. This index allowed me to pick any location in the
United States as well any dates of interest after 1900 and then review where, when and
how severe drought impacts on that location have been. This index also allows users to
look at animated maps of the entire United States, month by month over periods of
time from two months to one hundred years.
The Christmas Bird Count
This section reviews my source of avian species richness and abundance data. First, I
will explain what the Christmas Bird Count is, what the methodologies are and how the
data is stored and accessed. Second, I will look at the problems and advantages that
come with using this data.
The Christmas Bird Count (CBC) is a bird-watching and data collecting event held
annually by the National Audubon Society. Each year’s event is called a count. These

34
counts were started in 1900 and have taken place every year since, right up to the
present. Originally the CBC was started as an alternative to hunting. The CBC now serves
as a way for ordinary citizens and bird watchers to get involved in science. It is named
after the time of year in which counts take place. As the CBC takes place in winter,
resident and winter migrant species are counted while summer migrants tend to be
excluded.
Christmas Bird Counts use a set methodology to collect data. Each count takes place
along a set route within a twenty four km wide circle. Hence, each count location is
referred to as a circle. There are thousands of circles across the United States and
beyond. For each circle, one count is performed on a day chosen from a period between
December fourteenth and January fifth. Birds seen between these dates but not on the
official day are marked as “count week” and are included in the database for
presence/absence studies. Each count is performed by a field party led by at least one
experienced bird watcher. All birds seen or heard along the route are counted. In
addition, birdwatchers that live within a circle can submit sightings of birds that visit
their bird feeders. No single observer bird counts are allowed, barring rare and unusual
circumstances. Up until very recently, each volunteer was charged a five dollar fee. This
fee has been removed and the CBC now runs entirely on donations.
The Audubon website contains a database that gives free public access to all Christmas
Bird Count data. This data has been used in more than 200 scientific studies. Most of
these studies were published in the journal “American Birds”, which is owned by the

35
Audubon society. These studies are categorized as Community Ecology and
Biogeography, Distribution, Methods, Participation, or Population Dynamics.
The CBC Results page allows internet users to search by location (country, state, and
circle), bird species, year, or count number. This number is a reflection of what year the
count took place in. As the year 1900 was Bird Count 1, the number assigned to each
count is the year, minus 1900, plus 1. Therefore, the 2013 bird count is number 114.
This is a useful rule of thumb for remembering when each count took place.
If one searches the database using “Results By Count” you can obtain a data sheet for
each circle, for each year of participation. These data sheets include which bird species
were seen and how many of each. The sheets also contain the weather, the number of
participants, the names of the participants and the name of the sponsoring
organization.
Using “Results By Species” you can search for either the common or the scientific name
of any bird seen. It is also necessary to choose a time period and a country/region. This
method of searching the database does not work well for very common species or for
very large periods of time. If your request includes a too great an amount of data you
will get a “No Data Available” message. When this happens it is necessary to pick a
different species, select a smaller time period, or use “Results By Count”. Species data
sheets show year by count number, the number of birds seen, the number of birds seen
per party hours, the number of bird counts that saw that species and the number of
36
observers. These sheets also include a graph of how many birds were seen per party
hour.
Limitations of the Christmas Bird Count Data
The CBC is not without problems, however. The following two papers show these
problems as well as some of the benefits of using CBC data. The first paper “Enhancing
the Scientific Value of the Christmas Bird Count” by Erica H. Dunn, Charles M. Francis,
Peter J. Blancher, Susan Roney Drennen, Marshall A. Howe, Denis Lepage, Chandler S.
Robbins, Kenneth V. Rosenberg, John R. Sauer, And Kimberly G. Smith explains what
these issues are. The second paper “Controlling for Varying Effort in Count Surveys: An
Analysis of Christmas Bird Count Data” by William A. Link, and John R. Sauer, shows an
attempt to overcome these problems with complex statistics.
The Dunn paper illustrates the following problems with the CBC: there are few rules
for conducting a count, there is high variability in number of participants, there is high
variability in number of hours participants spend in the field, there are large differences
in the extent and mode of travel used by participants (walking vs motorized transport),
there is no consistency in the number of different types of habitat visited among and
within circles, the use of attracting devices such as feeders or pishing is inconsistent,
the count circle distribution is non-random, the CBC database has no records of which
methods each bird was seen by (feeder vs survey, attraction methods vs none), use of
the CBC database takes a substantial time investment, the database is incomplete and it
contains uncorrected errors. This paper indicates that the non-randomness of count

37
circle locations and the high variability in effort are the CBC’s biggest problems. The
count circle locations are chosen based primarily on the nearness of large population
centers. Some circles were created in locations with a history of high species richness,
but these areas tend to be in easy travel distance of cities. As circles may not represent
the entire region, high concentrations of circles in some areas may skew large studies.
The Dunn study also indicated that there has been an increase over time in the number
of people choosing to join the bird count, by watching feeders from indoors. This has
skewed counts of feeder-visiting bird species toward higher numbers. Birds per hour is
the most commonly used way of overcoming the problem of variable effort. However,
the relationship between hours of effort and birds seen is not linear, nor consistent
across all species. This can lead to a substantial bias. Waterfowl may be counted in
similar numbers regardless of hours of effort if concentrated into a body of water. The
relationship between effort and bird numbers may vary among circles.
Despite all the above problems, there are many good reasons to use CBC data. This
data covers an enormous period of time and huge amounts of space. The drive of the
volunteers to see as many species as possible leads to excellent presence-absence data.
This allows for good distribution studies. It has been seen that abundance values in the
Christmas Bird Count roughly correlate with the North American Breeding Bird Survey
and Project Feederwatch, two citizen science programs with more consistent methods.
Lastly, the CBC database is free to use and publicly accessible through the internet.
The Dunn paper make several recommendations. These include making the database
more researcher friendly, using more consistent methods for survey counts, having full

38
time researchers to maintain and update the database, and separating birds seen by
methods used. The researchers did not recommend relocating circles to a random
pattern. This would result in a dramatic reduction in volunteer participants and result in
a loss of previously obtained data. This study also recommends that any changes to
methods be volunteer friendly so as to keep high participation levels.
The Dunn paper did not show how researchers could overcome the limitations they
outlined. In order to show one possible method of doing this I included the following
paper.
The Link and Sauer paper examines ways of overcoming the varying amounts of effort
in CBC data collection. Effort in this paper includes number of participants, duration of
survey and distance travelled within a circle. This paper does not include differences in
transportation (vehicle vs walking) and attractant methods such as pishing or bird
feeders, in its examination of effort. This study examines different mathematical models
in order to combine amount of effort with number of birds seen. The first mathematical
model looks at an individual species and describes the data as log (expected value of the
count) = index of population abundance for the count circle and baseline year examined
+ effect of effort + change in population over time from the baseline year to another
chosen year. The baseline year is the start year or year zero and the chosen year is a
subsequent year. The logarithmic scale is used to describe multiplicative effects. This
study claims that the actual population size of a species is unknown and cannot be
estimated from the count data. Hence the authors chose to use relative abundance
rather than actual abundance. Relative abundance for the baseline year is measured by

39
taking the ratio of estimates of baseline abundance. Baseline abundance is considered
feasible only where a common effort adjustment has been estimated for the region.
Trajectories are an important issue and this paper recommends smoothed trajectories
such as polynomials. This paper indicates that individual count circles cannot be used to
estimate trajectory effects because of missing years and lack of consistent effort
(replication). The authors also caution against large scale regional studies due to bias in
site location and inconsistent effort effects. They recommend that small discrete regions
are the best ones for study. The paper devotes an entire section to determining effort
adjustments. Another section covers an example of how the authors use their
mathematical models. The example model’s chosen parameters are the Pied-billed
Grebe (species), in the California Foothills (region), during the period from 1959 to 1988
(time). The raw data consisted of 623 reports from 47 circles. This study found that the
effort increased over time. The authors indicate that overall effort is confounded by
temporal patterns of population change. However, it is unclear if they meant patterns in
the local human population or the population of the birds under study. After analyzing
the California Foothills region, the authors perform further analysis using the same
species and time period with 4 more regions. They found that effort in this areas also
appeared to have increased over time.

40
METHODS
I did two studies using data from the Audubon Society’s Christmas Bird Count (CBC)
and precipitation data from weather stations. Therefore, I divided my methods and
results sections into two parts. The first part is the precipitation a population trends
study. The second part is the Drought and Species Richness study.
Study 1: Precipitation and Population Trends
The first study looked at the number of individual birds seen per hour from a select few
species. The goal of this study was to make inferences about the possible population
effects of precipitation. An additional goal of this research is to confirm or disprove the
Dunn paper hypothesis that the CBC data is inappropriate for population studies (Dunn,
et al. 2005).
The studies in the literature review that I found most fascinating were those that took
place in areas where snowfall was a factor, particularly high altitude systems in the
Western U.S. (Albright et al. 2010; Martin, 2007; Dybala et al. 2013). Therefore one of
my criteria for acceptable sites was higher elevation. Other criteria were chosen based
on the assumption that patterns could be better found over longer periods of time than
in shorter periods of time. This is why I looked for CBC circles with several decades of
continuous data: both from bird counts and from weather data. The following is the
complete list of criteria I used to determine my data sets: within the Western United
States, altitude above 1000 feet, 30 or more years of continuous bird counts in the
circle, and nearly complete weather station data for all years of bird data.

41
I used the first three circles I found to meet all the above criteria. The three circles
were located in Jackson Hole, WY; Sedona, AZ; and Carson City, NV.
Many of the papers in my review of the literature divided bird species into guilds or
groups based on ecological roles and interrelationships. Species within the same guild
are assumed to respond to changes in their environment in very similar ways. Examples
of guilds used in this and other papers include migratory guilds (Albright, 2010) feeding
guilds (Faaborg, 1982), and habitat guilds (George, 1992). For this reason, I chose my
example species with the goal of including a broad range of different guilds, with special
emphasis on those guilds that my literature review indicated were the most affected by
drought.
I used Microsoft excel to record and organize my data.
For each year in which I had both CBC and weather data, I compared the birds per hour
recordings for each selected species to the total yearly rainfall, total December rainfall,
total yearly snowfall and total December snowfall using regression analysis. December
rain and snowfall was included in case short term weather patterns had a bigger effect
then the long term patterns found in a year. Total yearly rainfall was one month short in
a few of my data years, however none of these missing months occurred during drought
years.
I created time series graphs for each comparison to see if there were any patterns of
note. I also compared bird abundance between drought years and non-drought years. I
defined a drought year as a year in which total rainfall was 5 inches below average or

42
less (Palmer Drought Index). I used the formula (x-y)2/y2 to look at the percentage
difference from the average number of birds for each year. In this formula x is the
number of birds of a species seen in a particular year at a circle, and y is the average
number of birds of that species seen in all years
Brief Guide to Species for Population Analysis
This is a guide to the nineteen representative species I used in my population study. This
guide explains which community role categories I placed each species in. I selected
these bird species as representatives of a wide range of different habitats, diets and
migration patterns. My initial selections were based on what was present in Jackson
Hole, WY. When some of those species were not found to be in the other two sites, I
attempted to choose equivalent species as substitutes. My choices were heavily
influenced by my review of the literature. For example, the Albright et al. paper focuses
on residents versus migrants. This is why I decided to include two woodpeckers.
Woodpeckers are one of the few truly resident birds in North America. They do not
migrate at all, whereas other “resident” birds are known to occasionally travel to and
from an area. Waterfowl and fish-eaters were included thanks to the Hinojosa-Huerta
paper. This study observed that some waterfowl species leave an area in response to
drought. Another study, detailed in the Santisteban et al. paper focused on a pine nut
specialist, the red crossbill. The birds’ diet was considered the main factor in their
decline during heat waves which often accompany drought. This is why I chose to
include two pine nut specialists in my study. Multiple papers in my literature review
indicated that alpine species benefited from the reduced snowfall that accompanied

43
droughts (Albright et al, 2010; Dybala et al. 2013). I made sure to include two high
altitude specialists. Several papers also indicated grassland species were highly
responsive to drought. I included at least one grassland specialist found at each site in
my study. The Smith paper indicated predators at the highest trophic levels might be
affected. This is why I added two apex predators.
The total list of birds I chose to include in my study shows that each circle contained a
small, and a medium species of waterfowl, an upland game bird, a small fish eater, an
apex predator of aquatic animals (including fish), an apex predator of land animals, a
grassland specialist, two woodpeckers, two high altitude specialists, and two pine nut
feeders. I also included a large waterfowl for two of the sites. No large waterfowl were
present at Sedona, AZ.
For this guide I used the following format:
Species common name (scientific name) Sites: This category shows what study sites this species was present at. Migration: Category I used; description of migratory category and/or why I chose it. Diet: Category I used; more detailed description of diet. Aquatic: This category indicates whether a species is dependent on open water bodies such as rivers, streams, lakes and reservoirs. As these habitats may take a long time to vanish even during a long drought, such species may be buffered against the negative effects of these events. Habitat: Category I used; more detailed description and/or why I chose the category Bird feeder visitor: This category indicates whether a species numbers may have been affected by the increasing use of feeder data in Christmas bird counts. Species that visit feeders may appear to have increased in number over the past few decades. Notes: This section contains anything I thought would be needed or useful that does not fall into the other categories. Examples include potential taxonomic difficulties, and my reasons for choosing the particular species.
44
Gadwall (Anas strepera) Sites: This species was present at all three sites. Migration: Double season migrant; species is present all year, but different individuals or populations migrate in and out. Diet: Plants and aquatic invertebrates; this species feeds predominantly on plants during the winter months but also includes snails, midges, water beetles, and other aquatic insects in its diet. Aquatic: Yes Habitat: Wetland; this includes lakes, reservoirs, rivers, and marshes. Bird feeder visitor: No Notes: I chose this as my representative dabbling duck rather than the more common mallard, due to the mallard’s strongly synanthropic habits. It may be difficult for volunteers to tell wild mallards apart from feral birds which have escaped, or been released into the wild. Gadwall are not as commonly kept in captivity due to their plain plumage.
Canada goose (Branta canadensis) Sites: This species was present at all three sites. Migration: Double season migrant; species is present all year, but different individuals or populations migrate in and out. Diet: Plants. Much of their diet consists of grass. They also eat aquatic vegetation. Aquatic: Yes Habitat: Wetland; this species requires lakes, ponds or rivers to nest. However, when feeding this species may often be found on agricultural land, golf courses, and public parks with large expanses of regularly mowed lawn. Bird feeder visitor: These geese do not visit standard bird feeders. However, they may feed on spilled grain or at waterfowl specific feeding stations. Notes: This species has a large number of subspecies and regional variants. Some current subspecies may be split into separate species in the future. For the purposes of this paper all subspecies were counted as conspecific.
Trumpeter swan (Cygnus buccinator) Sites: Jackson Hole, WY Migration: Double season migrant; I listed this as a double season migrant due to its year round presence in nearby Yellowstone National Park. This species is otherwise migratory. Diet: Plants; Diet is almost entirely aquatic vegetation and seeds. Aquatic: Yes Habitat: Wetland; this includes lakes, reservoirs, rivers, and marshes. Bird feeder visitor: No

45
Notes: This species was formerly endangered but is now listed as least concern. It is very similar in appearance to the tundra swan and may be mistaken for one by an inexpert volunteer.
Tundra swan (C. columbianus) Sites: Carson City, NV. This species was included in Jackson Hole, WY community analysis as a passing migrant but not in the initial population analysis for that site. Migration: Winter Migrant in Carson City, NV; Passing Migrant in Jackson Hole, WY Diet: Plants and aquatic invertebrates. Aquatic: Yes Habitat: Wetland; this includes lakes, reservoirs, rivers, and marshes. Bird feeder visitor: No Notes: This species was included to provide a large waterfowl for the Carson City, NV site. It is similar to the trumpeter swan in its habitat requirements, aquatic diet, and overall appearance. It may be mistaken for a trumpeter by an inexperienced volunteer. There were no swan species seen at the Sedona, AZ site.
Greater sage grouse (Centrocercus urophasianus) Sites: Jackson Hole, WY Migration: Resident Diet: Plants and invertebrates Aquatic: No Habitat: Grassland; this bird is specialized to live in sagebrush plains. Bird feeder visitor: No Notes: I chose three different upland game birds because no one species of game bird was present at all sites. Initially, I chose the greater sage grouse due to its specialized habitat requirements.
California quail (Callipepla californica) Sites: Carson City, NV Migration: Resident Diet: Plants and invertebrates Aquatic: No Habitat: Various open; grassland, scrubland, desert, and suburban backyards Bird feeder visitor: Yes Notes: This species is very similar to the Gambel’s quail in appearance and behavior, although C. gambelii has a greater preference for desert habitat and Carson City,NV is not part of its range. Inexpert bird watchers may confuse the two species.
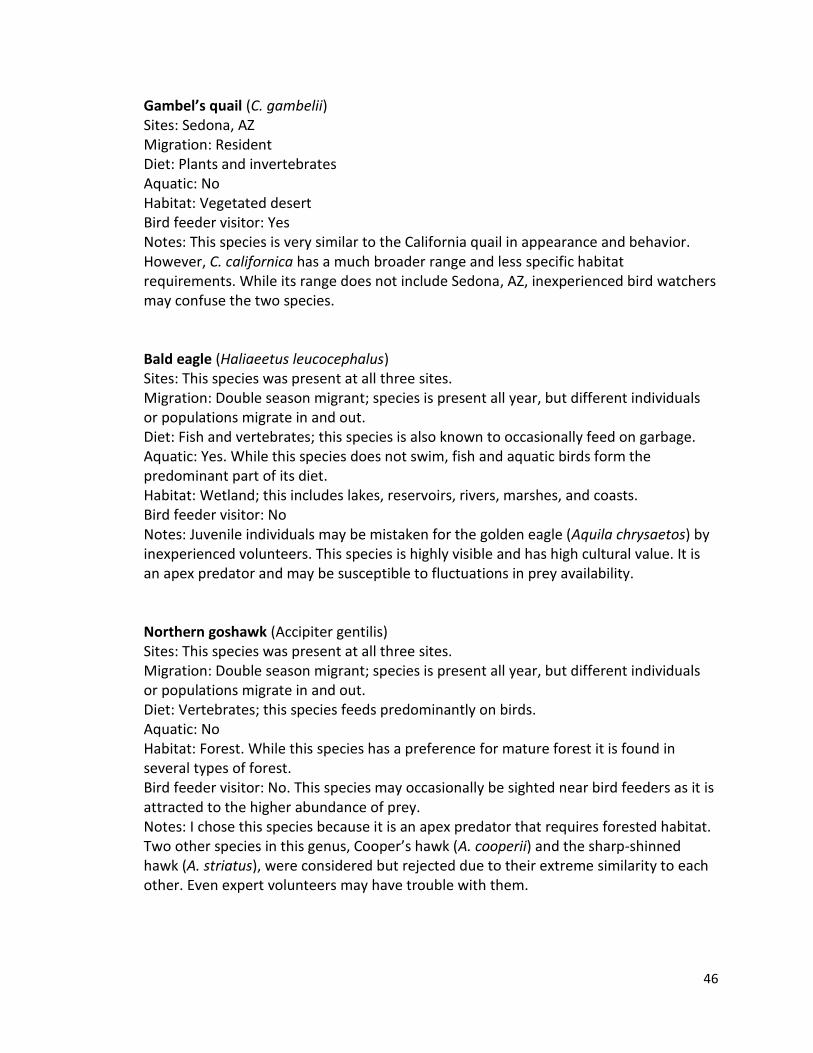
46
Gambel’s quail (C. gambelii) Sites: Sedona, AZ Migration: Resident Diet: Plants and invertebrates Aquatic: No Habitat: Vegetated desert Bird feeder visitor: Yes Notes: This species is very similar to the California quail in appearance and behavior. However, C. californica has a much broader range and less specific habitat requirements. While its range does not include Sedona, AZ, inexperienced bird watchers may confuse the two species.
Bald eagle (Haliaeetus leucocephalus) Sites: This species was present at all three sites. Migration: Double season migrant; species is present all year, but different individuals or populations migrate in and out. Diet: Fish and vertebrates; this species is also known to occasionally feed on garbage. Aquatic: Yes. While this species does not swim, fish and aquatic birds form the predominant part of its diet. Habitat: Wetland; this includes lakes, reservoirs, rivers, marshes, and coasts. Bird feeder visitor: No Notes: Juvenile individuals may be mistaken for the golden eagle (Aquila chrysaetos) by inexperienced volunteers. This species is highly visible and has high cultural value. It is an apex predator and may be susceptible to fluctuations in prey availability.
Northern goshawk (Accipiter gentilis) Sites: This species was present at all three sites. Migration: Double season migrant; species is present all year, but different individuals or populations migrate in and out. Diet: Vertebrates; this species feeds predominantly on birds. Aquatic: No Habitat: Forest. While this species has a preference for mature forest it is found in several types of forest. Bird feeder visitor: No. This species may occasionally be sighted near bird feeders as it is attracted to the higher abundance of prey. Notes: I chose this species because it is an apex predator that requires forested habitat. Two other species in this genus, Cooper’s hawk (A. cooperii) and the sharp-shinned hawk (A. striatus), were considered but rejected due to their extreme similarity to each other. Even expert volunteers may have trouble with them.

47
Belted kingfisher (Megaceryle alcyon) Sites: This species was present at all three sites. Migration: Double season migrant; species is present all year, but different individuals or populations migrate in and out. Diet: Fish. Small fish make up the great majority of this species diet although it may occasionally take large aquatic invertebrates such as crayfish, or even small land vertebrates. Aquatic: Yes. Habitat: Wetland; this includes lakes, reservoirs, rivers, marshes, and coasts. Bird feeder visitor: No Notes: This is a very loud and showy species with a characteristic call. I chose it as a representative small fish eater.
Downy woodpecker (Picoides pubescens) Sites: This species was present at all three sites. Migration: Resident. Diet: Plants and invertebrates. This species primarily eats wood boring insects, but about a quarter of its diet consists of nuts, seeds and berries. Aquatic: No Habitat: Forest. This species may be seen in highly fragmentary as well as in intact forest. Bird feeder visitor: Yes. This species is particularly fond of feeders featuring suet or peanut butter. Notes: This species is very similar to the hairy woodpecker (P. villosus) and may confuse inexperienced volunteers. I included both species in my analysis as they have slightly different niches.
Hairy woodpecker (P. villosus) Sites: This species was present at all three sites. Migration: Resident. Diet: This species primarily eats wood boring insects, but about a fifth of its diet consists of nuts, and seeds Aquatic: No Habitat: Forest. Bird feeder visitor: Yes. This species is particularly fond of feeders featuring suet or sunfower seeds. Notes: This species is very similar to the downy woodpecker (P. pubescens) and may confuse inexperienced volunteers. I included both species in my analysis as they have slightly different niches.

48
Grey jay (Perisoreus canadensis) Sites: Jackson Hole, WY Migration: Resident Diet: Generalist. This species eats a very wide range of different items Aquatic: No Habitat: Boreal Forest, this species tends to be found only in high-altitude, coniferous forest Bird feeder visitor: Yes. This bird readily takes food from humans. Notes: This is a highly visible species that only makes it home at high altitude. My review of the literature indicated drought effects on species living at high altitude differed from the effects on lowland species, so I included this well-known mountain bird.
Clark’s nutcracker (Nucifraga columbiana) Sites: This species was present at all three sites. Migration: Resident Diet: Pine nuts. While this species does take a wide range of other foods, ninety percent of its diet is pine seeds. Aquatic: No Habitat: Boreal Forest. This species prefers coniferous forest. Bird feeder visitor: Yes Notes: This species, along with the red crossbill was included due to its dependence on the seeding cycle of coniferous trees.
Mountain chickadee (Poecile gambeli) Sites: This species was present at all three sites. Migration: Resident Diet: Plants and invertebrates Aquatic: No Habitat: Boreal Forest Bird feeder visitor: Yes Notes: This is one of the species I chose due to its mountainous habitat preferences.
American dipper (Cinclus mexicanus) Sites: This species was present at all three sites. Migration: Resident Diet: Aquatic invertebrates Aquatic: Yes Habitat: Fast flowing streams Bird feeder visitor: No Notes: This species has very specialized feeding habits. It is dependent on high oxygen, fast flowing streams. This may render it vulnerable to draught.
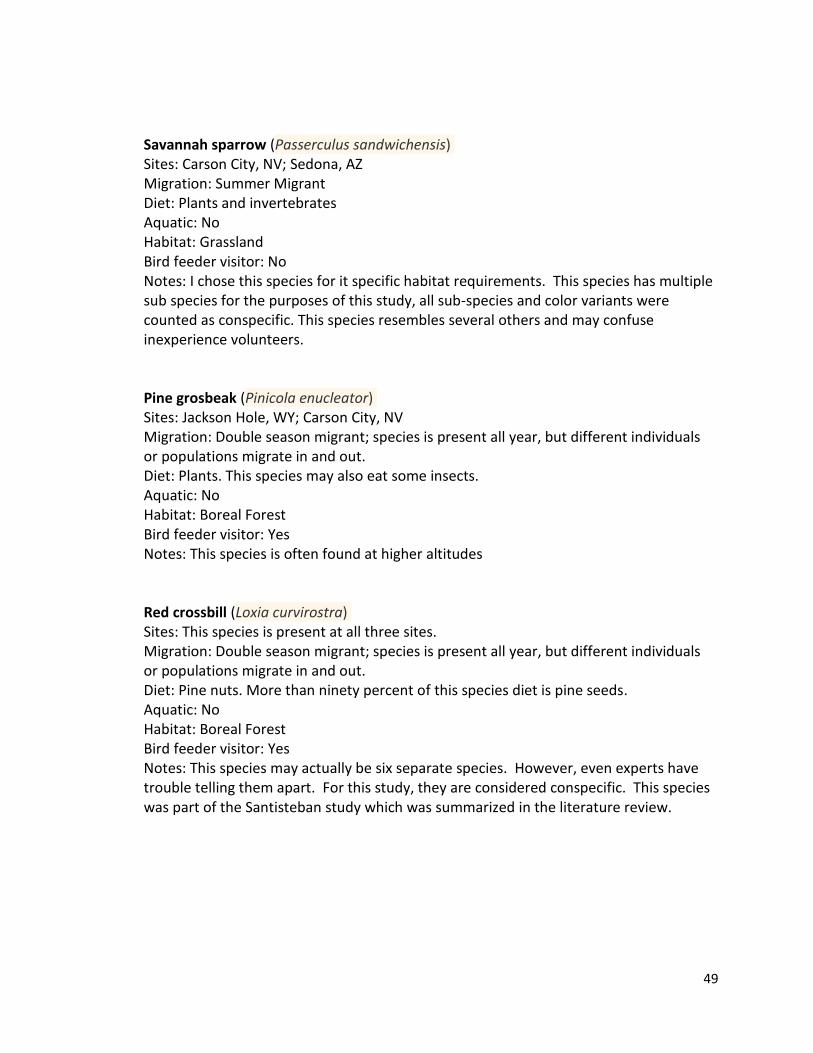
49
Savannah sparrow (Passerculus sandwichensis) Sites: Carson City, NV; Sedona, AZ Migration: Summer Migrant Diet: Plants and invertebrates Aquatic: No Habitat: Grassland Bird feeder visitor: No Notes: I chose this species for it specific habitat requirements. This species has multiple sub species for the purposes of this study, all sub-species and color variants were counted as conspecific. This species resembles several others and may confuse inexperience volunteers.
Pine grosbeak (Pinicola enucleator) Sites: Jackson Hole, WY; Carson City, NV Migration: Double season migrant; species is present all year, but different individuals or populations migrate in and out. Diet: Plants. This species may also eat some insects. Aquatic: No Habitat: Boreal Forest Bird feeder visitor: Yes Notes: This species is often found at higher altitudes
Red crossbill (Loxia curvirostra) Sites: This species is present at all three sites. Migration: Double season migrant; species is present all year, but different individuals or populations migrate in and out. Diet: Pine nuts. More than ninety percent of this species diet is pine seeds. Aquatic: No Habitat: Boreal Forest Bird feeder visitor: Yes Notes: This species may actually be six separate species. However, even experts have trouble telling them apart. For this study, they are considered conspecific. This species was part of the Santisteban study which was summarized in the literature review.

50
Study 2: Drought and Species Richness
The second study used presence-absence data to examine the effects of drought on a
community level. This study used all species present at the chosen count circle rather
than a few select species. I selected Jackson Hole, WY, for community analysis as it had
the most complete and extensive CBC data for the longest period of time and the most
drought events. I used the same definition of a drought year as in the previous study. In
Jackson Hole, there were seven total drought years out of forty total years.
I recorded the presence or absence of every species seen in the chosen circle. I also
divided the species into community role categories based on migration pattern, diet,
and habitat preference. I obtained this data from various cross-referenced sources using
both the internet and field guides. My two primary sources for this were the Sibley
Guide to North American Birds (Sibley, 2000) and Allaboutbirds.org (Cornell, 2011).
Some species wound up in multiple categories due to overlapping dietary preferences.
For example, the smaller meat eaters also eat insects. They are dependent on both food
sources, and so I counted them as meat eaters in the meat-eater analysis and as
insectivores in the corresponding analysis. A fourth category: Aquatic or non-aquatic
was included to sort out habitat preferences for large water bodies from those without.
This was done on the assumption that large water bodies would buffer against the
effects of some droughts. Alternately, the dependence on water might make aquatic
species more vulnerable if large water bodies were to dry out (Hinojosa-Huerta, 2013).
Some habitat categories found in the literature were not included due to a lack of birds
within those categories. For example, there are no birds specialized to live in deciduous
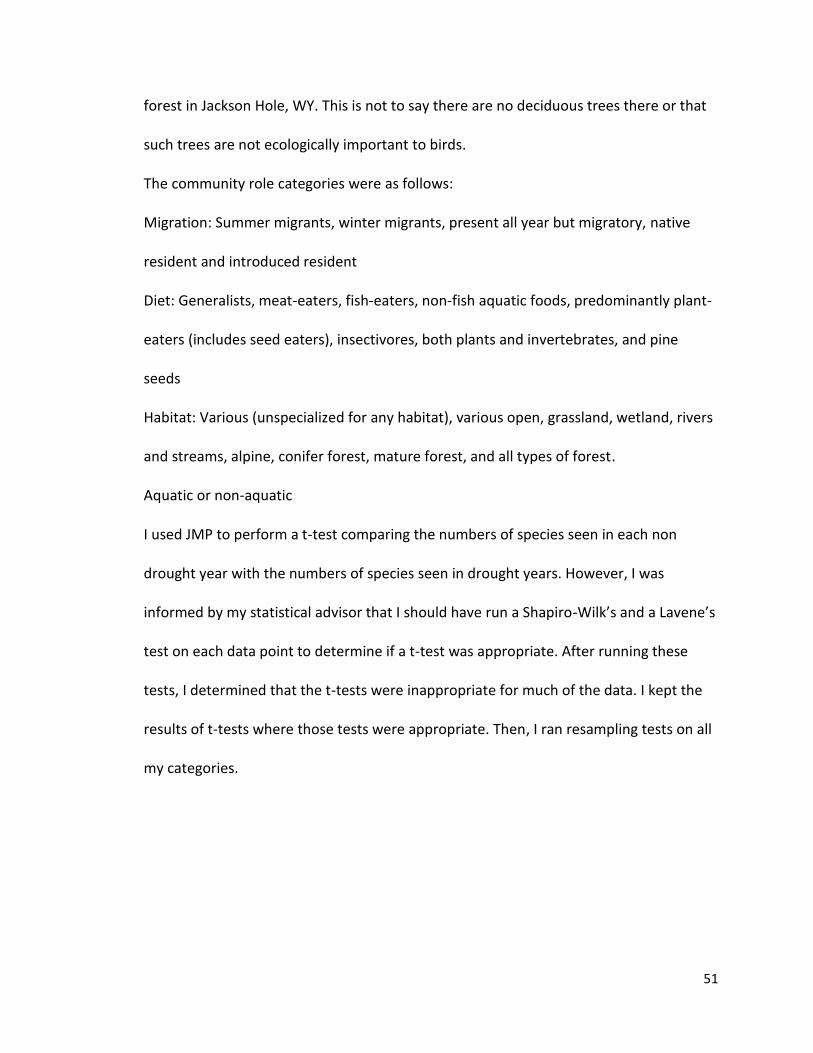
51
forest in Jackson Hole, WY. This is not to say there are no deciduous trees there or that
such trees are not ecologically important to birds.
The community role categories were as follows:
Migration: Summer migrants, winter migrants, present all year but migratory, native
resident and introduced resident
Diet: Generalists, meat-eaters, fish-eaters, non-fish aquatic foods, predominantly plant-
eaters (includes seed eaters), insectivores, both plants and invertebrates, and pine
seeds
Habitat: Various (unspecialized for any habitat), various open, grassland, wetland, rivers
and streams, alpine, conifer forest, mature forest, and all types of forest.
Aquatic or non-aquatic
I used JMP to perform a t-test comparing the numbers of species seen in each non
drought year with the numbers of species seen in drought years. However, I was
informed by my statistical advisor that I should have run a Shapiro-Wilk’s and a Lavene’s
test on each data point to determine if a t-test was appropriate. After running these
tests, I determined that the t-tests were inappropriate for much of the data. I kept the
results of t-tests where those tests were appropriate. Then, I ran resampling tests on all
my categories.
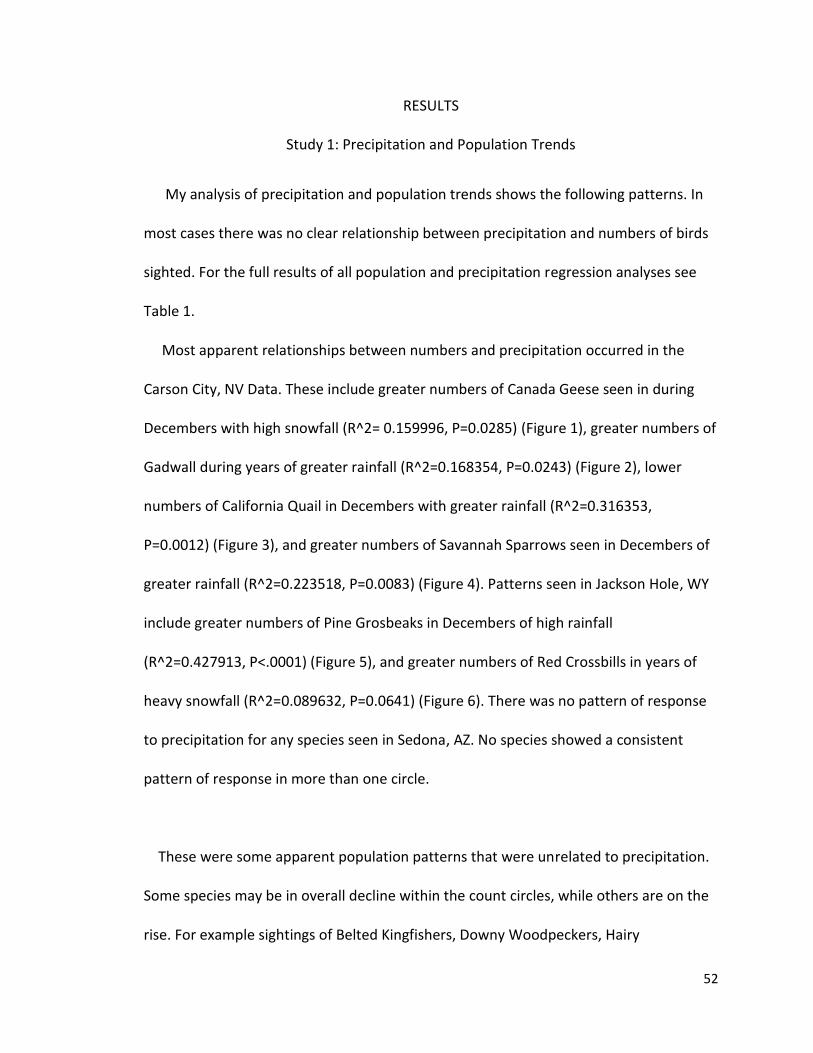
52
RESULTS
Study 1: Precipitation and Population Trends
My analysis of precipitation and population trends shows the following patterns. In
most cases there was no clear relationship between precipitation and numbers of birds
sighted. For the full results of all population and precipitation regression analyses see
Table 1.
Most apparent relationships between numbers and precipitation occurred in the
Carson City, NV Data. These include greater numbers of Canada Geese seen in during
Decembers with high snowfall (R^2= 0.159996, P=0.0285) (Figure 1), greater numbers of
Gadwall during years of greater rainfall (R^2=0.168354, P=0.0243) (Figure 2), lower
numbers of California Quail in Decembers with greater rainfall (R^2=0.316353,
P=0.0012) (Figure 3), and greater numbers of Savannah Sparrows seen in Decembers of
greater rainfall (R^2=0.223518, P=0.0083) (Figure 4). Patterns seen in Jackson Hole, WY
include greater numbers of Pine Grosbeaks in Decembers of high rainfall
(R^2=0.427913, P<.0001) (Figure 5), and greater numbers of Red Crossbills in years of
heavy snowfall (R^2=0.089632, P=0.0641) (Figure 6). There was no pattern of response
to precipitation for any species seen in Sedona, AZ. No species showed a consistent
pattern of response in more than one circle.
These were some apparent population patterns that were unrelated to precipitation.
Some species may be in overall decline within the count circles, while others are on the
rise. For example sightings of Belted Kingfishers, Downy Woodpeckers, Hairy
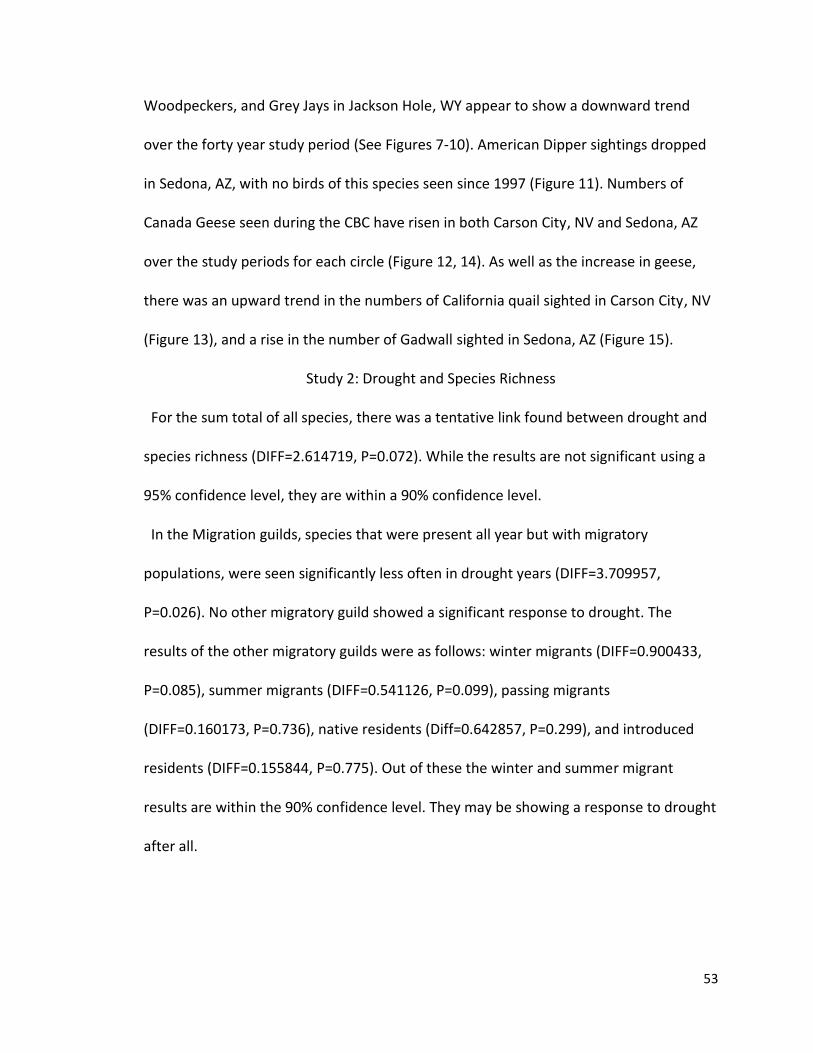
53
Woodpeckers, and Grey Jays in Jackson Hole, WY appear to show a downward trend
over the forty year study period (See Figures 7-10). American Dipper sightings dropped
in Sedona, AZ, with no birds of this species seen since 1997 (Figure 11). Numbers of
Canada Geese seen during the CBC have risen in both Carson City, NV and Sedona, AZ
over the study periods for each circle (Figure 12, 14). As well as the increase in geese,
there was an upward trend in the numbers of California quail sighted in Carson City, NV
(Figure 13), and a rise in the number of Gadwall sighted in Sedona, AZ (Figure 15).
Study 2: Drought and Species Richness
For the sum total of all species, there was a tentative link found between drought and
species richness (DIFF=2.614719, P=0.072). While the results are not significant using a
95% confidence level, they are within a 90% confidence level.
In the Migration guilds, species that were present all year but with migratory
populations, were seen significantly less often in drought years (DIFF=3.709957,
P=0.026). No other migratory guild showed a significant response to drought. The
results of the other migratory guilds were as follows: winter migrants (DIFF=0.900433,
P=0.085), summer migrants (DIFF=0.541126, P=0.099), passing migrants
(DIFF=0.160173, P=0.736), native residents (Diff=0.642857, P=0.299), and introduced
residents (DIFF=0.155844, P=0.775). Out of these the winter and summer migrant
results are within the 90% confidence level. They may be showing a response to drought
after all.

54
Birds in the aquatic category showed no response to drought (DIFF=0.492857,
P=0.533), while dry land species showed a significant response (DIFF=4.65368, P=0.031)
with fewer species being seen in drought years.
Out of the dietary categories, the meat-eaters category showed the fewest species
seen in drought years (DIFF=2.155844, p=0.02; t-test P=0.0002). The dry-land plants and
invertebrates category showed significant results in a t-test (P=0.0179) but not in the
resampling test (DIFF=2.614719, P=0.082). The distinctly low value in the reshuffling test
suggests the possibility that these bird species are affected by drought. The other
dietary categories did not show significant responses to drought. The results of these
diet categories are: generalists (DIFF=0.515152, P=0.209), fish-eaters (DIFF=0.382143,
P=0.13), aquatic plants and invertebrates (DIFF=0.891775, P=0.07), primarily land plants
(DIFF=0.290043, P=0.073), primarily land invertebrates (DIFF=0.220779, P=0.742), and
primarily pine nuts (DIFF=0.028571, P=1). Of these the aquatic plants and invertebrates
category were within the 90% confidence interval, as were those species that ate
primarily land plants.
The habitat categories indicated that bird species that inhabited any or all types of
forest were significantly affected by drought (DIFF=2.796537, P= 0.019). The specified
forest categories did not show this pattern: mature forest (DIFF=0.424242, P=0.122),
and coniferous forest (DIFF=0.753247, P=0.123). The alpine category showed a distinct
pattern (DIFF=0.95671, P= 0.076) but not a significant one. None of the other non-forest
guild categories showed a pattern. They included species that inhabited all open

55
habitats (DIFF=0.512083, P=0.515), grassland (DIFF= 0.077922, P=1) and all types of
habitat (DIFF=1.121212, P=0.36).

56
DISCUSSION
Study 1: Precipitation and Population Trends
At the start of this study, I expected that there would be a direct relationship
between rainfall and bird populations, with greater rainfall resulting in increased bird
numbers (Robin, 2009). I also expected that high levels of snowfall would result in
decreased numbers of birds (Dybala, et al., 2013). I was surprised to find that the
numbers of birds seen during the CBC did not generally conform to these expectations.
There were only three species that showed the assumed response to precipitation: the
Gadwall, the Savannah Sparrow and the Pine Grosbeak. These were the responses I
expected from my review of the literature. Specifically the Hinojosa-Huerta, et al.;
George, et al.; and Martin papers. These birds only showed significant positive
responses in a single count circle each, despite occurring in two or more circles. For
example, despite being present at all three circles, greater numbers of Gadwall were
seen with greater amounts of rain only within the Carson City circle.
Other species responded to precipitation patterns in the opposite pattern from the
expected results. Canada Geese and Red Crossbills were seen in greater numbers in
years of high snowfall. This is counter to the findings in the Albright, et al. study. The
response patterns only occurred in one circle each, even though these species were
found in all three circles. Another surprising result was that California Quail were seen at
higher numbers when yearly precipitation was low. This is contrary to the avian

57
movement patterns seen in the Robin et al. book where species with a similar migration
pattern to quail are seen much more often in times of high rainfall.
Out of nineteen studied species, the above instances were the only cases whereby
significant results were obtained. Why would this be? The Dunn et al. paper may hold
the key. This paper suggests that CBC data is totally inappropriate for population
studies. The inconsistency of effort per count is the chief reason the number of bird
sightings will not reflect actual population (Dunn, et al., 2005). Christmas Bird Counts
methods vary enormously, such as in the amount of time spent surveying, the number
of people participating, the attraction mechanisms used and modes of transportation
used along routes (Dunn, et al., 2005). To try and overcome the temporal
inconsistencies in the CBC data, I used birds per hour rather than total numbers of birds
seen. This is a common method, but it does not account for other variances in the
amount of count effort (Dunn, et al., 2005). Other researchers have attempted to
account for most of the effort variables using very complex statistical analyses (Link, et
al. 1999). However, even these sophisticated processes cannot account for differences
in attraction devices, routes and modes of travel (Link, et al. 1999). These methods are
not recorded in the CBC database and therefore, cannot be included in analysis.
My results indicate that Dunn et al. were correct in their assessment of the CBC data as
regards to population studies. For the most part, my data does not show the expected
responses of avian populations in response to precipitation.

58
Therefore, this study should not be considered a sound measure of bird populations
and their response to precipitation. It may however, give some indications of what
might be occurring in nature. The non-precipitation related patterns are especially
interesting. The gradual decline of several species (Figures 7-10) may be a sign that
these species are actually becoming scarcer. It may be prudent to examine these species
in future studies. The two species that showed an apparent increase (Figures 11-12) are
species that thrive with human land use changes and could very well be increasing their
populations (Albright et al. 2010).
The time series showing the disappearance of American Dippers, and the arrival of
Canada Geese and Gadwalls in Sedona, AZ probably reflects something of actual
significance. CBC data referring to the presence or absence of a species is considered
especially sound (Dunn, et al., 2005). This is thought to be due to the eagerness of
volunteers to see as many species as possible, and the prior scouting for rare species by
experienced birders before a count takes place (Dunn, et al., 2005). The disappearance
or arrival of these species may represent a shift in their migration patterns
(Wormworth, 2011) or a change in the landscape around Sedona, AZ.
Study 2: Drought and Species Richness
In this study, I expected that there would be fewer species sighted in drought years.
There is good reason to think my data does show this to be the case. While the result is
not within the 95% confidence interval, it is well within a 90% one. Further, birds within
the migration, feeding and habitat guilds often responded to drought just as I expected
from my review of the literature.

59
In the Albright et al. study, it was found that migratory birds showed a greater
response to drought than resident birds. Birds with a life history of high mobility readily
leave drought stricken areas (Albright, et al., 2010; Chan, 1999). In my own study, I also
found this to be the case. Migrant species were seen much less often during drought.
This effect was especially pronounced in migratory species that would be present all
year round in good years. These birds have a flexibility in their migration pattern that
allows them to adjust rapidly to change (Chan, 1999). Also as in the Albright et al. study,
resident species tended to remain regardless of drought conditions. They continued to
be sighted at much the same rates as in non-drought years.
The dietary guilds also tended to respond as seen in the literature. Higher trophic
levels tended to be more affected then lower ones. This is the same finding made in the
Smith paper. Omnivores were less affected than more specialized species. This is what I
expected from my reading of the Albright et al. paper. Aquatic food dependent birds
showed little response, perhaps because large bodies of water tend to last a long time
even in droughts. Jackson Hole, WY has a lake and a large river (the Snake River) near
the city. These water bodies do not suffer as much depletion in drought years as the
river system examined in the Hinojosa-Huerta, et al. study. These permanent water
bodies would protect aquatic organisms and the creatures that feed on them against
drought.
Within the dietary guilds, the most heavily affected species were top level carnivores.
Far fewer meat-eating species were seen in drought years. This pattern was hinted at in
the Smith paper. While her study could not soundly confirm this pattern, it makes a

60
great deal of sense (Smith, 1982). Drought causes a decline in the plants that make up
the bottom of the food chain. This leads to fewer and fewer creatures as one moves up
the chain. Creatures closer to the bottom hang on in reduced numbers. Creatures at the
top, which are normally very few in number even under the best circumstances (Smith,
1982), tend to disappear when prey becomes scarcer.
Surprisingly, the insect eaters and pine nut dependent species did not disappear during
drought. The Bolger et al. and the Santisteban et al. studies suggested that species
within these dietary guilds would be sensitive to drought. This may reflect differences in
the ecology of Jackson Hole, WY compared to that of the locations in these studies.
Alternately, these may reflect the differences in seasonality. The Bolger and Santisteban
studies took place during the breeding season while the CBC occurs in winter.
The habitat preferences of different species also appear to have an effect on whether
they are seen during drought. However, these effects did not all match the kind of
effects I would have expected based on my review of the literature.
For example, the Hinjosa-Huerta study showed a decline in most aquatic species
during drought, while my study showed no effect. This may reflect the differing
hydrology of the Colorado River delta from the water bodies found in Jackson Hole, WY.
The Colorado is a major source of irrigation water (Hinjosa-Huerta, 2013). Because of
modern agricultural practices, the river delta becomes highly depleted in times of
drought as the farmers upstream must provide their crops with additional water
(Hinjosa-Huerta, 2013). Jackson Hole, WY is located near Jackson Lake and the Snake

61
River. This river is also used for irrigation, but Jackson Hole, WY is not located at the
river mouth where water loss would be most apparent.
Unlike the aquatic species, dry-land species were definitely seen less often during
drought. Without the buffering effects of being continuously near water, these species
were more vulnerable to the effects of low rainfall. This is not because dry-land species
have a harder time finding water. This is because the plants these birds and their prey
depend on are unable to travel to water.
The forested habitat results showed an odd pattern. Conifer or mature forest
specialists in my study continued to be seen just as often as normal while more
generalized forest species were seen less often. This may be due to the vulnerability of
deciduous plants to drought (Martin, 2007). Because Jackson Hole, WY is at high
altitude, there are no bird species that specialize in deciduous forest. However,
deciduous plants still occur and are an important part of the ecosystem (Martin, 2007).
Bird species that do not specialize in any particular type of forest may be more
dependent on deciduous trees than conifer forest specialists. This could be why these
species responded to drought while their more specialized counterparts did not.
Alpine birds did not show a significant pattern in response to drought in my study, but
there were distinct signs that they may become scarcer with low rainfall. This is in
opposition to the Albright et al. paper which suggested that high altitude species may
actually benefit from drought. Apparently, the lower levels of snowfall did not make up
for the increased difficulty of finding food (Dybala, et al., 2013).

62
The last habitat category, and the one that was the biggest surprise was the grassland
guild. My review of the literature suggested grassland birds were especially vulnerable
to drought (George, et al., 1992). Yet my study found no such connection. This may be
due to a difference in the quality of the grassland habitat in Jackson Hole, WY. Grassland
birds living in disturbed or poor quality habitat were found to be more sensitive to
drought in the George study. It is possible that the grassland areas in Jackson Hole, WY
are of higher quality.

63
CONCLUSION
Taken as a whole, the results of my study suggest that many bird species cease to be
seen by CBC volunteers during drought. These birds move away from their usual range
when rainfall is insufficient to maintain their needs. If only single year’s drought results
in a reduction in species richness, what might a long term drying trend do? Much of the
southern and western United States is expected to experience less rainfall and more
drought in the future (IPCC, 2014). Global climate change will create dramatic changes
in our landscape (IPCC, 2014). Those of us who love birds and who would like to
continue to see familiar species may soon find ourselves watching fewer of them.
However, the loss to birdwatchers is nothing compared to the loss to ecosystems if
birds disappear (Şekercioğlu, et al., 2004). Bird species are interwoven into the fabric of
nature and their loss may cause the web of life to unravel.
Some species may manage to adapt to the fast paced changes in our climate (Grant,
2004). However, we cannot count on all or even most birds to adapt at a fast enough
rate to avoid local extinction, or worse, true, absolute extinction.
Without sincere concerted effort to slow the pace of climate change, we may be facing
an impoverished world where our grandchildren can only hear birdsong from
recordings.

64
GRAPHS AND TABLES
Figure 1. Regression Plot of Canada Geese bird sightings per hour and December Snowfall in Carson City, NV.
R^2= 0.159996, P=0.0285
Figure 2. Regression Plot of Gadwall bird sightings per hour and Total Precipitation in Carson City, NV.
R^2=0.168354, P=0.0243
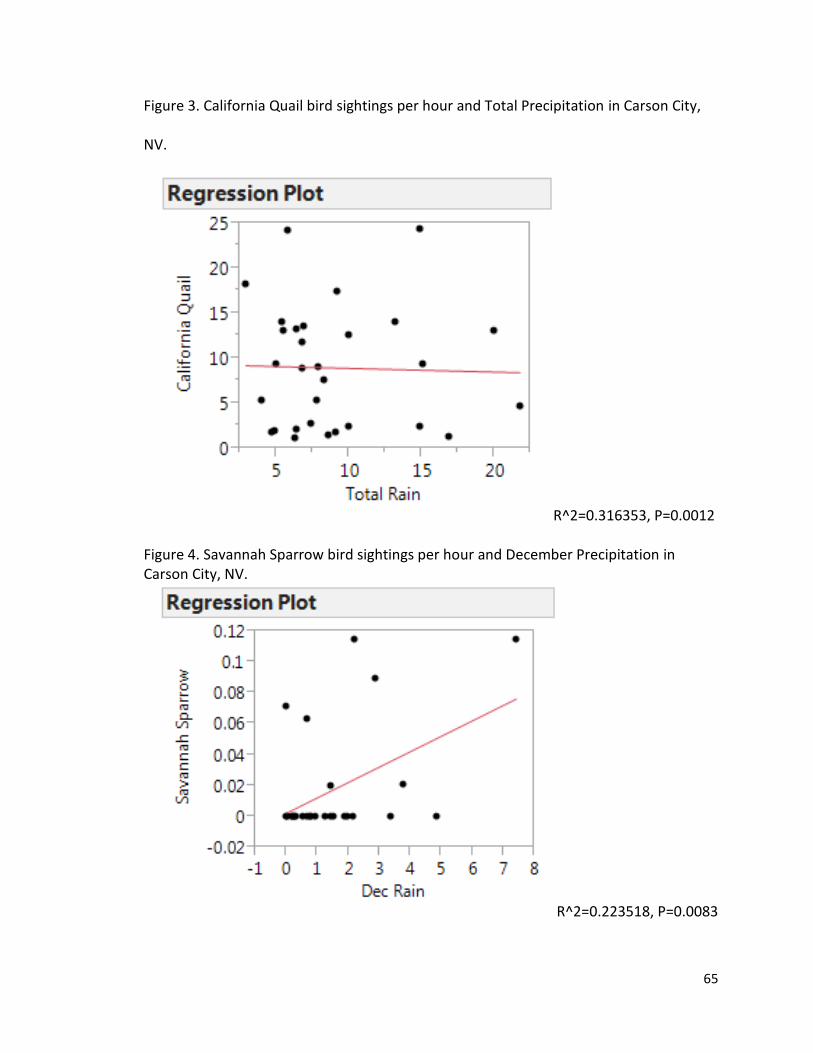
65
Figure 3. California Quail bird sightings per hour and Total Precipitation in Carson City,
NV.
R^2=0.316353, P=0.0012
Figure 4. Savannah Sparrow bird sightings per hour and December Precipitation in Carson City, NV.
R^2=0.223518, P=0.0083

66
Figure 5. Pine Grosbeak bird sightings per hour and December Precipitation in Jackson Hole, WY.
R^2=0.427913, P<.0001
Figure 6. Red Crossbill bird sightings per hour and Total Snowfall in Jackson Hole, WY.
R^2=0.089632, P=0.0641

67
Table 1: Results of Regression Analysis in population Study
Jackson Hole, WY Precipitation
Species Total Rain Dec Rain Total Snow Dec Snow
Canada
Goose
R^2= 0.009556,
P=0.5538
R^2= 0.042961,
P=0.2055
R^2= 0.001163,
P=0.8367
R^2=0.000833,
P=0.8616
Trumpeter
Swan
R^2=0.08408,
P=0.0734
R^2=0.000504,
P=0.8921
R^2=0.02368,
P=0.3496
R^2=0.001016,
P=0.8473
Tundra Swan Not present Not present Not present Not present
Gadwall R^2=0.013853,
P=0.4755
R^2=0.030507,
P=0.2876
R^2=0.02796,
P=0.3089
R^2=0.054311,
P=0.1534
Greater Sage
Grouse
R^2=0.000125,
P=0.946
R^2=0.026823,
P=0.3191
R^2=0.001039,
P=0.8456
R^2=0.020963,
P=0.3792
California
Quail
Not present Not present Not present Not present
Gambel's
Quail
Not present Not present Not present Not present
Bald Eagle R^2=0.009163,
P=0.5621
R^2=0.006864,
P=0.6161
R^2=0.013712,
P=0.4777
R^2=0.000536,
P=0.8888
Northern
Goshawk
R^2=0.004516,
P=0.6844
R^2=0.018662,
P=0.407
R^2=0.000597,
P=0.8826
R^2=0.003055,
P=0.7382

68
Belted
Kingfisher
R^2=0.024927,
P=0.3371
R^2=0.015805,
P=0.4457
R^2=0.010779,
P=0.5294
R^2=0.000563,
P=0.886
Downy
Woodpecker
R^2=0.012766,
P=0.4934
R^2=0.008954,
P=0.5666
R^2=0.002948,
P=0.7427
R^2=0.014125,
P=0.4711
Hairy
Woodpecker
R^2=0.039744,
P=0.2237
R^2=0.002329,
P=0.7705
R^2=0.010521,
P=0.5344
R^2=0.010795,
P=0.5291
Grey Jay R^2=0.01079,
P=0.5291
R^2=0.001668,
P=0.8050
R^2=0.00657,
P=0.6238
R^2=0.002747,
P=0.7513
Clark's
Nutcracker
R^2=0.023345,
P=0.3531
P=0.010305,
P=0.5386
R^2=0.000221,
P=0.9284
R^2=0.024589,
P=0.3404
Mountain
Chickadee
R^2=0.023507,
P=0.3514
R^2=0.026123,
P=0.3256
R^2=0.001756,
P=0.8001
R^2=0.000116,
P=0.9482
American
Dipper
R^2=0.003653,
P=0.7147
R^2=0.035405,
P=0.2513
R^2=0.023262,
P=0.3540
R^2=0.008234,
P=0.5827
Savannah
Sparrow
Not present Not present Not present Not present
Pine
Grosbeak
R^2=0.068046,
P=0.1087
R^2=0.427913,
P<.0001
R^2=0.016337,
P=0.4381
R^2=0.029811,
P=0.2932
Red Crossbill R^2=0.017088,
P=0.4277
R^2=0.030642,
P=0.2865
R^2=0.089632,
P=0.0641
R^2=0.077788,
P=0.0855
Carson City, NV Precipitation

69
Total Rain Dec Rain Total Snow Dec Snow
Canada
Goose
R^2=0.000636,
P=0.8947
R^2=0.082592,
P=0.1236
R^2=0.06354,
P=0.179
R^2= 0.159996,
P=0.0285
Trumpeter
Swan
Not present Not present Not present Not present
Tundra Swan R^2=0.013838,
P=0.5359
R^2=0.007353,
P=0.6523
R^2=0.094177,
P=0.099
R^2=0.052895,
P=0.2215
Gadwall R^2=0.168354,
P=0.0243
R^2=0.149386,
P=0.0349
R^2=0.00127,
P=0.8517
R^2=0.018414,
P=0.4746
Greater Sage
Grouse
Not present Not present Not present Not present
California
Quail
R^2=0.000852,
P=0.8783
R^2=0.316353,
P=0.0012
R^2=0.013655,
P=0.5386
R^2=0.050471,
P=0.2327
Gambel's
Quail
Not present Not present Not present Not present
Bald Eagle R^2=0.001863,
P=0.8208
R^2=0.034515,
P=0.3256
R^2=0.023017,
P=0.4235
R^2=0.003785,
P=0.7467
Northern
Goshawk
R^2=0.00322,
P=0.7658
R^2=0.018171,
P=0.4776
R^2=0.027365,
P=0.3823
R^2=3.631e-6,
P=0.992
Belted
Kingfisher
R^2=0.159937,
P=0.0285
R^2=0.005239,
P=0.7039
R^2=0.001776,
P=0.825
R^2=0.008504,
P=0.6279

70
Downy
Woodpecker
R^2=0.003017,
P=0.7731
R^2=0.009248,
P=0.6132
R^2=0.008519,
P=0.6276
R^2=8.486e-6,
P=0.9878
Hairy
Woodpecker
R^2=0.077308,
P=0.1368
R^2=0.077477,
P=0.1364
R^2=0.042412,
P=0.2749
R^2=0.040359,
P=0.2871
Grey Jay Not Present Not Present Not Present Not Present
Clark's
Nutcracker
R^2=0.050074,
P=0.2346
R^2=0.009737,
P=0.6039
R^2=0.02315,
P=0.4222
R^2=0.000216,
P=0.9386
Mountain
Chickadee
R^2=0.0037,
P=0.7495
R^2=0.089532,
P=0.1082
R^2=0.096332,
P=0.0951
R^2=0.000104,
P=0.9574
American
Dipper
R^2=0.001865,
P=0.8207
R^2=0.09782,
P=0.0924
R^2=0.000616,
P=0.8965
R^2=0.063626,
P=0.1787
Savannah
Sparrow
R^2=0.030591,
P=0.3553
R^2=0.223518,
P=0.0083
R^2=0.045425,
P=0.2581
R^2=0.027074,
P=0.3849
Pine
Grosbeak
R^2=0.014573,
P=0.5251
R^2=0.000441,
P=0.9123
R^2=0.007436,
P=0.6505
R^2=0.001053,
P=0.8648
Red Crossbill R^2=0.018772,
P=0.4703
R^2=0.005346,
P=0.701
R^2=0.061659,
P=0.1858
R^2=0.033759,
P=0.3311
Sedona, AZ Precipitation
Total Rain Dec Rain Total Snow Dec snow
Canada
Goose
R^2=0.058327,
P=0.1441
R^2=0.000229,
P=0.9282
R^2=0.01438,
P=0.4733
R^2=0.004531,
P=0.688

71
Trumpeter
Swan
Not present Not present Not present Not present
Tundra Swan Not present Not present Not present Not present
Gadwall R^2=0.002991,
P=0.7444
R^2=0.004821,
P=0.6787
R^2=0.000619,
P=0.8822
R^2=0.006509,
P=0.6302
Greater Sage
Grouse
Not present Not present Not present Not present
California
Quail
Not present Not present Not present Not present
Gambel's
Quail
R^2=0.014273,
P=0.4750
R^2=0.031425,
P=0.2870
R^2=0.000914,
P=0.8570
R^2=0.011323,
P=0.5249
Bald Eagle R^2=0.075766,
P=0.0944
R^2=0.015862,
P=0.4521
R^2=0.000115,
P=0.9490
R^2=0.003681,
P=0.7175
Northern
Goshawk
Only seen in
one year
Only seen in
one year
Only seen in
one year
Only seen in
one year
Belted
Kingfisher
R^2=0.014317,
P=0.4743
R^2=0.013721,
P=0.4837
R^2=0.000473,
P=0.8968
R^2=0.010846,
P=0.5338
Downy
Woodpecker
R^2=0.000204,
P=0.9322
R^2=0.006789,
P=0.6229
R^2=0.000897,
P=0.8584
R^2=0.004545,
P=0.6876
Hairy
Woodpecker
R^2=0.000498,
P=0.8942
R^2=0.07012,
P=0.1081
R^2=0.006159,
P=0.6396
R^2=0.020581,
P=0.3902

72
Grey Jay Not present Not present Not present Not present
Clark's
Nutcracker
Only seen in
one year
Only seen in
one year
Only seen in
one year
Only seen in
one year
Mountain
Chickadee
R^2=0.011177,
P=0.5276
R^2=0.013632,
P=0.4851
R^2=0.017119,
P=0.4336
R^2=0.006354,
P=0.6343
American
Dipper
R^2=2.52e-5,
P=0.9761
R^2=0.00515,
P=0.8924
R^2=0.00575,
P=0.6509
R^2=0.000016,
P=0.9810
Savannah
Sparrow
R^2=0.001318,
P=0.8287
R^2=0.053937,
P=0.1606
R^2=0.019262,
P=0.4060
R^2=0.010067,
P=0.5489
Pine
Grosbeak
Not present Not present Not present Not present
Red Crossbill R^2=0.033376,
P=0.2723
R^2=0.062008,
P=0.1317
R^2=0.006435,
P=0.6321
R^2=0.0016,
P=0.8115

73
Figure 7. Time series graph showing birds per hour sightings of the Belted Kingfisher in
Jackson Hole, WY.
Figure 8. Time series graph showing birds per hour sightings of the Downy Woodpecker
in Jackson Hole, WY.
0.0000
0.0500
0.1000
0.1500
0.2000
0.2500
Bir
ds
Per
Ho
ur
Belted Kingfisher Birds Per Hour, Jackson Hole, WY 1973-2012
Belted Kingfisher BpH
0.0000
0.0500
0.1000
0.1500
0.2000
0.2500
0.3000
0.3500
0.4000
Bir
ds
Per
Ho
ur
Downy Woodpecker Birds Per Hour, Jackson Hole, WY 1973-2012
Downy Woodpecker BpH

74
Figure 9. Time series graph showing birds per hour sightings of the Hairy Woodpecker in
Jackson Hole, WY.
Figure 10. Time series graph showing birds per hour sightings of the Grey Jay in Jackson
Hole, WY.
0.0000
0.0500
0.1000
0.1500
0.2000
0.2500
0.3000
0.3500
0.4000
0.4500
0.5000
Bir
ds
Per
Ho
ur
Hairy Woodpecker Birds Per Hour, Jackson Hole, WY 1973-2012
Hairy Woodpecker BpH
0.0000
0.0500
0.1000
0.1500
0.2000
0.2500
0.3000
0.3500
0.4000
0.4500
Bir
ds
Per
Ho
ur
Grey Jay Birds Per Hour, Jackson Hole, WY 1973-2012
Grey Jay BpH

75
Figure 11. Time series graph showing birds per hour sightings of the Canada Geese in
Carson City, NV.
Figure 12. Time series graph showing birds per hour sightings of the California quail in
Carson City, NV.
0.0000
10.0000
20.0000
30.0000
40.0000
50.0000
60.0000
70.0000
80.0000
90.0000
19
83
19
84
19
85
19
86
19
87
19
88
19
89
19
90
19
91
19
92
19
93
19
94
19
95
19
96
19
97
19
98
19
99
20
00
20
01
20
02
20
03
20
04
20
05
20
06
20
07
20
08
20
09
20
10
20
11
20
12
Bir
ds
Per
Ho
ur
Canada Geese Birds Per Hour, Carson City, NV 1983-2012
Canada Goose BpH
0.0000
5.0000
10.0000
15.0000
20.0000
25.0000
30.0000
19
83
19
84
19
85
19
86
19
87
19
88
19
89
19
90
19
91
19
92
19
93
19
94
19
95
19
96
19
97
19
98
19
99
20
00
20
01
20
02
20
03
20
04
20
05
20
06
20
07
20
08
20
09
20
10
20
11
20
12
Bir
ds
Per
Ho
ur
California Quail Birds Per Hour, Carson City, NV 1983-2012
California Quail

76
Figure 13. Time series graph showing birds per hour sightings of the American Dipper
Sedona, AZ.
Figure 14. Time series graph showing birds per hour sightings of the Canada Geese in
Sedona, AZ.
0.0000
0.0050
0.0100
0.0150
0.0200
0.0250
0.0300
1972197419761978198019821984198619881990199219941997199920012003200520072009
Bir
ds
Per
Ho
ur
American Dipper Birds Per Hour, Sedona, AZ 1972-2010
American Dipper
0.0000
1.0000
2.0000
3.0000
4.0000
5.0000
6.0000
1972197419761978198019821984198619881990199219941997199920012003200520072009
Bir
ds
Per
Ho
ur
Canada Geese Birds Per Hour, Sedona, AZ 1972-2010
Canada Goose

77
Figure 15. Time series graph showing birds per hour sightings of the Gadwall in Sedona,
AZ.
0.0000
0.2000
0.4000
0.6000
0.8000
1.0000
1.2000
1972197419761978198019821984198619881990199219941997199920012003200520072009
Bir
ds
Per
Ho
ur
Gadwall Birds Per Hour, Sedona, AZ 1972-2010
Gadwall
78
Tables 2: Results of the percentage difference from the average number of bird sighted
for all years, from the numbers of bird sighted in drought years.
Table 2a. Jackson Hole, WY
Drough
t year
1974 1979 1984 1992 2000 2001 2003
Canada Goose
BpH
0.0974
65
0.0106
58
0.7883
92
0.1183
49
0.0007
94
0.1586
24
0.1393
98
Trumpeter Swan
BpH
0.2225
12
0.2621
62
0.6312
74
0.4006
06
0.2374
05
0.1987
62
0.3775
44
Gadwall BpH 0.7046
03
2.5703
75
0.9265
04
0.8943
14
0.5394
62
0.8017
62
0.0889
5
Bald Eagle BpH 0.0579
68
0.6095
86
0.3102
52
0.0744
86
0.1839
66
1.4009
8
0.6208
42
Belted Kingfisher
BpH
0.5941
84
0.2982
59
5.54E-
05
0.0263
1
0.6481
21
0.0234
93
0.0749
72
Downy
Woodpecker BpH
0.2982
29
0.5422
31
0.1961
22
0.0939
38
0.0546
47
0.0955
37
0.0021
86
Hairy
Woodpecker BpH
0.2163
44
0.2299
08
0.0965
78
0.2358
47
0.0371
8
0.0021
3
0.0610
98

79
Grey Jay BpH 2.9350
56
1.7274
9
0.1343
75
0.2930
17
0.5642
82
0.4978
76
0.2600
71
Clark's
Nutcracker BpH
0.1519
1
0.1541
93
0.0182
19
0.0227
66
0.2922
91
0.0344
52
0.3475
37
Mt. Chickadee
BpH
0.4848
08
0.0114
95
0.1114
8
0.0376
68
0.0063
87
0.7549
34
0.0825
2
American Dipper
BpH
0.1516
15
0.2751
44
0.0514
11
0.0133
98
0.0404
41
0.0083
19
0.0801
74
Pine Grosbeak
BpH
1.0000 0.2677
61
0.5067
31
6.88E-
06
0.0010
11
1.0151
36
1.0000
Gtr. Sage Grouse
BpH
36.549
6
1.0000 1.0000 1.0000 1.0000 1.0000 4.0644
Northern
Goshawk
1.0000 1.0000 0.1641 9.4615 0.4333 1.0000 1.0000
Red Crossbill BpH 1.0000 0.4953 0.4568 1.0000 1.0000 0.1754 1.0000
Table 2b. Carson City, NV
Drought Year 1990.00 2007.00
Canada Goose
BpH
0.1506 0.2442

80
Tundra Swan 0.2935 1.0000
Gadwall 1.0000 0.2707
California Quail 0.1622 1.0724
Bald Eagle 1.0000 0.4900
Northern
Goshawk
1.0000 1.0000
Belted
Kingfisher
0.4113 0.0734
Downy
Woodpecker
0.4145 0.1348
Hairy
Woodpecker
0.3537 0.5942
Clark's
Nutcracker
1.0000 1.0000
Mtn. Chickadee 0.4317 0.0563
American
Dipper
1.0000 1.0000
Savannah
Sparrow
1.0000 1.0000
Pine Grosbeak 1.0000 1.0000
Red Crossbill 1.0000 1.0000

81
Table 2c. Sedona, AZ
Drought Year 1989 1996 2002 2006 2009
Canada Goose 0.0726 1.0000 8.8661 1.6860 0.0345
Gadwall 1.0000 0.4289 0.2572 0.0753 0.5782
Gambel's Quail 0.2553 0.0026 0.0832 0.2841 0.5784
Bald Eagle 1.0000 2.0393 326.9575 0.6990 0.4205
Northern
Goshawk
1.0000 1.0000 1.0000 1.0000 1.0000
Belted Kingfisher 0.3603 0.0596 0.1782 0.2472 1.0000
Downy
Woodpecker
1.0000 1.0000 1.0000 4.9031 34.7258
Hairy Woodpecker 0.3078 0.0876 0.3961 0.3369 0.1239
Clark's Nutcracker 1.0000 1.0000 1.0000 1.0000 1.0000
Mtn. Chickadee 0.5413 16.5066 0.2953 0.1249 0.0126
American Dipper 1.0000 0.4313 1.0000 1.0000 1.0000
Savannah Sparrow 1.0000 0.6611 1.0000 1.0000 1.0000
Red Crossbill 1.0000 0.4223 1.0000 1.0000 1.0000

82
BIBLIOGRAPHY
GLOBAL CLIMATE CHANGE AND DROUGHT
deBuys, William (2011) A Great Aridness: Climate Change and the Future of the
American Southwest. Oxford University Press
IPCC (2014) Climate change 2014: synthesis report. Intergovernmental panel on climate
change Chapter 3.4.8
Parmesan, Camille, Gary Yohe (2003) A Globally Coherent Fingerprint of Climate Change
Impacts Across Natural Systems. Nature 421 37-42
DROUGHT AND PRECIPITATION DATA
http://weather-warehouse.com/
http://www.drought.noaa.gov/palmer.html Palmer Drought Index
BIRD DATA
http://birds.audubon.org/data-research Christmas Bird Count Database
Sauer, J. R., J. E. Hines, J. E. Fallon, K. L. Pardieck, D. J. Ziolkowski, Jr., and W. A. Link.
2012. The North American Breeding Bird Survey, Results and Analysis 1966 - 2011.
Version 07.03.2013 USGS Patuxent Wildlife Research Center, Laurel, MD
http://www.allaboutbirds.org/ Cornell Lab of Ornithology website.
Sibley, David Allen (2000) The Sibley Guide to Birds. Chanticleer Press Inc., New York

83
BIRDS AND DROUGHT RESEARCH
Albright, Thomas P., Anna M. Pigeon, Chadwick D Ruttenhouse, Murray K. Clayton,
Curtis H. Flather, Patrick D. Culbert, Brian D Wardlows, Volker C, Radeloff (2010) Effects
of drought on avian community structure. Global Change Biology 16, 2158-2170
Bolger, Douglas T., Michael A. Patten, David C. Bostock (2005) Avian reproductive failure
in response to an extreme climatic event. Oecologia 142 398-406
Chan, Ken (1999) Bird Numbers in Drought and Non-drought years in Tropical Central
Queensland Australia. Tropical Ecology 40 (1) 63-68
Dunn, Erica H., Charles M. Francis, Peter J. Blancher, Susan Roney Drennen, Marshall A.
Howe, Denis Lepage, Chandler S. Robbins, Kenneth V. Rosenberg, John R. Sauer,
Kimberly G. Smith (2005) Enhancing the Scientific Value of the Christmas Bird Count. The
Auk 122 (1)
Dybala, Kristen E., John M. Eadie, Thomas Gardali, Nathaniel E. Seavy, Mark P. Herzog
(2013) Projecting demographic responses to climate change: adult and juvenile survival
respond differently to direct and indirect effects of weather in a passerine population.
Global Change Biology 19 (9) 2688-2697
Faaborg, L. (1982) Avian Population Fluctuations During Drought Conditions in Puerto
Rico. Wilson Bulletin 94 (1) 20-30

84
George, T.L., A.C. Fowler, R.L. Knight, L.C. Mcewen (1992) Impacts of a Severe Drought
on Grassland Birds of North Dakota. Ecological Applications 2 (3) 275-284
Grant, B. Rosemary (2003) Evolution in Darwin’s Finches: a review of a study on Isla
Daphne Major in the Galapagos Archipelago. Zoology 106 255-259
Hinojosa-Huerta, Osvel, Panela L. nagler, Yamilett K. Carrillo-Guererro, Edward P. Glenn
(2013) Effects of drought on birds and riparian vegetation in the Colorado River Delta,
Mexico. Ecological Engineering 51 275-281
Link, William A., and John R. Sauer, (1999) Controlling for Varying Effort in Count
Surveys: An Analysis of Christmas Bird Count Data. Journal of Agricultural, Biological,
and... 4 (2) 116-125
Martin, T.E. (2007) Climate correlates of 20 years of trophic changes in a high-elevation
riparian system. Ecology 88 (2) 367-380
Robin, Libby, Leo Joeph, Rob Heinshohn, Robert Heinsohn, Leo Joseph (2009) Boom and
Bust: Bird Stories for a Dry Country. Csiro Publishing
Santisteban, Leonard, Craig W. Benkman, Trevor Fetz, Juilie W. Smith (2012) Survival
and population size of a resident bird species are declining as temperature increases.
Journal of Animal Ecology. 81 352-365
Şekercioğlu, Çağan H., Gretchen C. Daily, Paul R. Ehrlich (2004) Ecosystem consequences
of bird declines. Proceedings of the National Academy of Sciences. 101 (52) 18042-
18047
Smith, Kimberly G., (1982) Drought-induced Changes in avian community structure
along a montane sere. Ecology 63 (4) 952-961

85
Wormworth, Janice (2011) Winged Sentinels: Birds and Climate Change. Cambridge
University Press
Related Documents