49 © Springer International Publishing AG, part of Springer Nature 2019 L. Meyer-Ohlendorf, Drivers of Climate Change in Urban India, Springer Climate, https://doi.org/10.1007/978-3-319-96670-0_3 Chapter 3 The Research Context: India and the Megacity of Hyderabad Keywords Hyderabad · Megacity · Urbanisation · New economic policy · Poverty · Measuring poverty · Social mobility · New middle classes · Climate change in India India has been facing rapid transformation processes for about the last two and a half decades. One of the most critical manifestations and drivers of these changes is economic growth, which is a consequence of external (globalisation) and internal factors (liberalisation and economic reform since the early 1990s) – both interre- lated. Along with economic development, there are other dimensions of social and environmental change, such as rapid urbanisation, rising incomes, a maturing young workforce, emergence of a new and rapidly growing middle class, and associated social-cultural changes. These apparently positive developments involve a multi- plicity of interrelated processes and mechanisms that directly and indirectly create social, ecological, and political risks and challenges. For instance, the social effects of economic development have to be looked at from two sides. On the one hand, the last two decades of growth have led to an escalator effect, which has lifted large parts of the poor out of poverty. However, on the other hand, social disparities have grown substantially – between different regions and between urban and rural areas. Moreover, the fast character of change and the lack of effective institutions have led to tremendous social and environmental risks and challenges. And, as a form of “umbrella effect”, most of these changes take place in urban areas in a concentrated manner, with the consequence of powerful feedback mechanisms that further drive urbanisation and serve as a pull factor for rural-to-urban migration. Hyderabad is taken as a representative example for many other megacities in India. This city defines the geographic frame for an analysis of processes that transcend physical- spatial boundaries by far. Such concentration, however, allows that the manifest locational aspects anchoring these processes on the ground are not lost sight of in the analysis.

Welcome message from author
This document is posted to help you gain knowledge. Please leave a comment to let me know what you think about it! Share it to your friends and learn new things together.
Transcript

49© Springer International Publishing AG, part of Springer Nature 2019 L. Meyer-Ohlendorf, Drivers of Climate Change in Urban India, Springer Climate, https://doi.org/10.1007/978-3-319-96670-0_3
Chapter 3The Research Context: India and the Megacity of Hyderabad
Keywords Hyderabad · Megacity · Urbanisation · New economic policy · Poverty · Measuring poverty · Social mobility · New middle classes · Climate change in India
India has been facing rapid transformation processes for about the last two and a half decades. One of the most critical manifestations and drivers of these changes is economic growth, which is a consequence of external (globalisation) and internal factors (liberalisation and economic reform since the early 1990s) – both interre-lated. Along with economic development, there are other dimensions of social and environmental change, such as rapid urbanisation, rising incomes, a maturing young workforce, emergence of a new and rapidly growing middle class, and associated social-cultural changes. These apparently positive developments involve a multi-plicity of interrelated processes and mechanisms that directly and indirectly create social, ecological, and political risks and challenges. For instance, the social effects of economic development have to be looked at from two sides. On the one hand, the last two decades of growth have led to an escalator effect, which has lifted large parts of the poor out of poverty. However, on the other hand, social disparities have grown substantially – between different regions and between urban and rural areas. Moreover, the fast character of change and the lack of effective institutions have led to tremendous social and environmental risks and challenges. And, as a form of “umbrella effect”, most of these changes take place in urban areas in a concentrated manner, with the consequence of powerful feedback mechanisms that further drive urbanisation and serve as a pull factor for rural-to-urban migration. Hyderabad is taken as a representative example for many other megacities in India. This city defines the geographic frame for an analysis of processes that transcend physical- spatial boundaries by far. Such concentration, however, allows that the manifest locational aspects anchoring these processes on the ground are not lost sight of in the analysis.
50
3.1 Economic Development and Dynamics of Urbanisation in India
3.1.1 Liberalisation Politics, Trends of Economic Development, and Future Visions of (Urban) Development
One of the most significant boundary conditions of India’s social-economic and social-cultural development of the last two and a half decades can be seen in eco-nomic liberalisation policy, mainly initiated by P. V. Narasimha Rao taking office in June 1991. At that time, the new government had to deal with the conditions of a nearly bankrupt economy, with a massive current account deficit, imbalances in foreign exchange, and a largely inefficient public sector based industry (Rieger 1995, p. 523). International pressure, mainly led by the World Bank and the International Monetary Fund (IMF) and the absence of other options urged the rela-tively weak governing majority to drive forward massive and unprecedented reforms of the economic order – from a largely government-dominated to a market-oriented system. The reform, which was mainly conceptualised by Manmohan Singh in his role as finance minister, involved a new industrial policy, a partial withdrawal of the government from paternalising the economy, and a stepwise liberalisation of the market in order to incentivise foreign direct investments (Rieger 1995, p. 524).
With the success of the initial reform years and even with some setbacks, the following years involved further reorganisational steps with the consequence of a more or less stable growth rate over the last 25 years. As an effect, after a slowdown in growth rates in 2009 due to the global economic recession and another downward shift in 2012, India has recovered and gained new impetus. With a growth rate of 7.3% in the fiscal period 2014/2015 and even higher estimates for 2015/2016, India for the first time outpaced China (World Bank 2016b: 142). Today, with a gross domestic product (GDP) at market prices (current US$) of $2.049 trillion, India is the No. 4 economy in the world today (World Bank 2014). Soon, the country will climb up the global “economic ladder” surpassing Japan in the next year and the Euro area in about 20 years (Johannson et al. 2012, p. 22).
However, in spite of the vast growth and rapid urbanisation rates, more than half of the employment is still based on agriculture and its allied sectors (forestry and fishing) (GoI 2014a). This is while the agricultural sector’s output is relatively low, accounting for around 18% of the GDP in 2014 (World Bank 2016a).
Other than in most other emerging economies, economic growth in India has not led from agriculture to industries but to an expansion of the service sector. The ser-vice sector gives employment to around 25% of the workforce (GoI 2014a), which is argued to be very low relative to other economies (Mukherjee 2013, p. 1). However, in terms of economic output, services account for the largest share of the overall economy, at 52% in 2014 (World Bank 2016a). Moreover, services in India depict the highest labour productivity, and in terms of services’ exports and imports, India ranges among the top ten WTO members in international trade (Mukherjee
3 The Research Context: India and the Megacity of Hyderabad

51
2013, p. 16). In comparison, industrial development has not kept pace with services development. In terms of employment, it ranges around 20% (GoI 2014a), and in respect to economic output, industries account for just 30% (compared to more than 42% in China) (World Bank 2016a).
To sum up, agriculture still makes out to be the most important base for liveli-hood in India, where a share of almost 70% of the population still lives in rural areas (GoI 2011). This substantial share of rural population can be termed as largely dis-advantaged against the trends of development in urban areas. The share of agricul-ture in accounting for the overall GDP remains low, and its trend is continuously falling. Lack of capital goods and financial resources, fragmented small-scale acre-age, poor quality or lack of infrastructure for efficient and fast supply, and stagnat-ing crop yields are very relevant issues that call for political intervention (Bronger 1996, p. 150). Moreover, in terms of the living conditions, disadvantages substan-tially contribute to the push factors in rural areas that yearly drive millions of people from rural to urban areas. For instance, in 2013, more than one fourth of all rural dwellers still had no access to electricity, i.e. 237 million people (IEA 2015). And in 2012, based on the Global Hunger Index, India was even ranked behind Sub-Saharan Africa (Von Grebmer et al. 2012, p. 12).
Also with regard to the service sector, there is huge potential for progress. Observers argue that its share in providing employment in terms of number as well as quality still lags behind its actual possibilities (Mukherjee 2013, p. 16). Also in respect to access to different services, there are great disparities – socially and regionally – especially basic services such as healthcare, electricity, education, and water and sanitation (Mukherjee 2013, p. 16). Much hope is also placed in industrial development in order to create new jobs in this sector.
This strategic realm has also been taken up by the new BJP government under Narendra Modi, who has taken office in Mai 2014. For instance, his industrial pol-icy initiative “Make in India” has raised quite some international attention (Betz et al. 2013, p. 3). In this initiative, Modi builds on the country’s advantages of a huge and still growing young labour force and the large domestic market in compet-ing with China (cf. Thite 2014, p. 290). The programme aims to ease and enhance the conditions for doing business and thereby incentivise foreign direct investment in India. It foresees investments into large infrastructure projects such as develop-ment of industrial corridors that connect important economic hubs (e.g. Delhi- Mumbai Industrial Corridor). It also involves a programme on developing selected smart cities (part of industrial corridors programme) (Ganesan 2014; GoI 2014b). Moreover, large investments are being planned and made in terms of transport sys-tem development in railways, aviation, and shipping.
According to some observers, however, the rather newly framed discourse around “smart” development is quite as much an envisioning or a “seductive projection” that aims to frame and shape urban and industrial policy (Bunnell and Das 2010, p. 277). It is argued that it follows a language of technology-led utopian “imagin-ings” with terms such as “leapfrogging”, “smart”, and “intelligent” (Bunnell and Das 2010, p. 281). This language is underlined with well-designed statistical fig-ures, pictures, and digital simulations “to visualise the ‘multimedia utopia’”
3.1 Economic Development and Dynamics of Urbanisation in India
52
(Bunnell and Das 2010, p. 281, emphasis in original). In respect to the language and representation of policies and government-led programmes, a lot has changed since Modi took office. Newly designed government webpages mirror the recently invented digital marketing campaign. The prime minister’s highly “data-driven” (Fraser 2015) and professionalised use of social media such as Facebook and Twitter is successful in terms of demonstrating “connectedness”. With issues such as sanita-tion and hygiene, growth, digitisation, and technology, it aims directly to reach out to an increasingly relevant and growing share of young and educated people, mostly representing the new middle classes (BBC 2015; Fraser 2015).
This language and imagination of a new modernity tends to mask bottleneck issues such as local (Datta 2015, p. 14) or national (Sherwell 2015) resistance, and/or technological and finance-related challenges, especially with respect to the smart city programme. Certainly, Modi has achieved a broad-based political backing, especially among the Hindu population and from the corporate sector. But the suc-cess of many large-scale infrastructure projects depends on a variety of factors and boundary conditions.
3.1.2 Urbanisation in India: Cities as Foci of Diversity and Lifestyle
3.1.2.1 Urbanisation as Central Aspect of Global Change
The process of urbanisation is one of the most remarkable issues of global change. The year 2007 marks a silent turning point in human history, when for the first time more people lived in urban areas than in rural areas. In 2014, the world’s urban population has increased to a share of 54%, and urban growth is expected to con-tinue with estimates saying that by 2050, around two thirds of the world’s popula-tion will be living in urban areas (United Nations 2014a, p. 7). Urbanisation in most countries of the Global North has already reached quite high levels, e.g. in Europe (73%) and the USA (82%) (United Nations 2014b). Latin America and the Caribbean also account for very high levels of urbanisation (80%). In many countries of the Global South, especially most countries in Sub-Saharan Africa and Asia, the level of urbanisation is still very low, while the rate of growth is remarkably high here. Almost 90% of the urban population growth in the coming 35 years will take place in Asia and Africa. In absolute terms, the world’s urban population has grown from around 700,000 in 1950 to close to 3.9 billion in 2014 and is expected to reach 6.3 billion in 2050 (United Nations 2014a, p. 12). The UN projections further estimate that the urban population in Africa will triple and in Asia it will grow by 61% by 2050. As a result, most of the world’s urban population will then be concentrated in Asia (52%) and Africa (21%). China, India, and Nigeria alone will account for around 37% of the future global growth in urban population between 2014 and 2050 (United Nations 2014a, p. 12).
3 The Research Context: India and the Megacity of Hyderabad
53
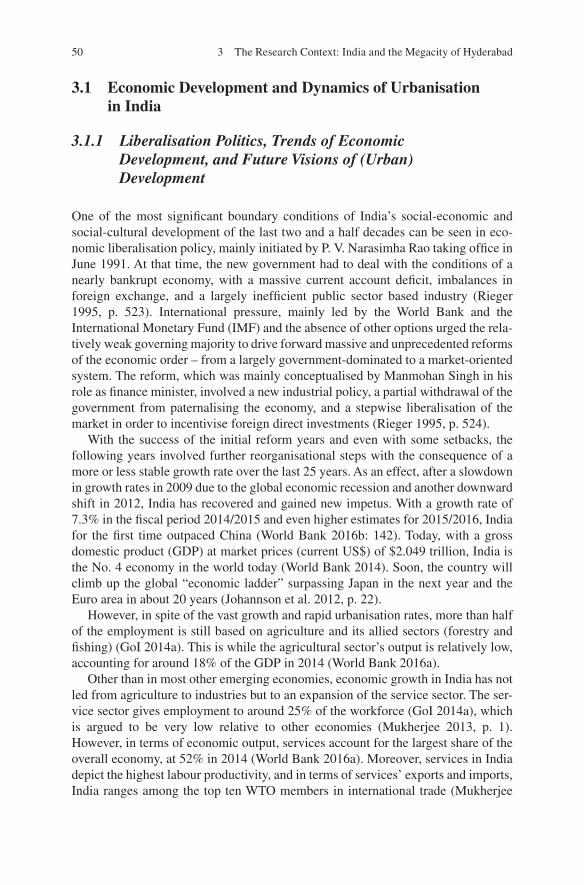
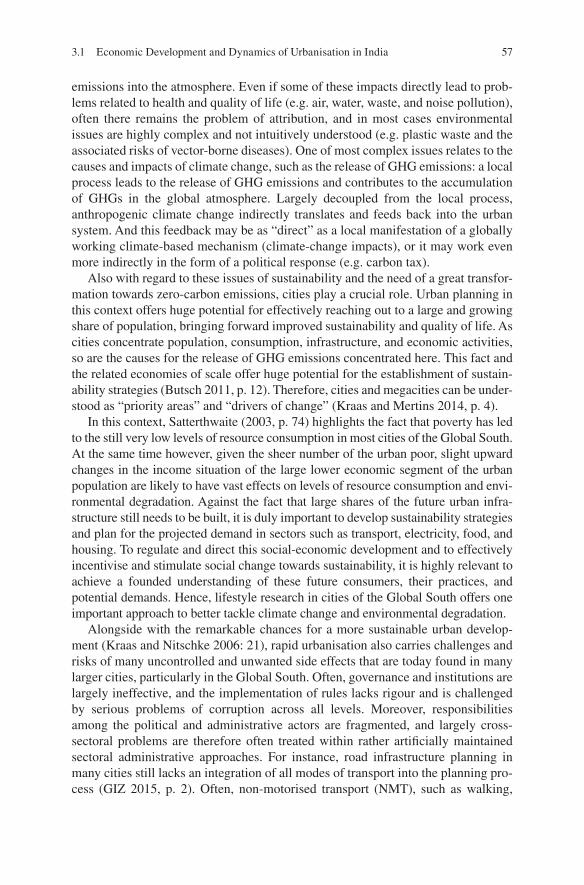
A quite critical issue of the world’s urbanisation history of the last two centuries is seen in the unprecedented concentration of people in urban agglomerations. The largest and most concentrated agglomerations are known as megacities, with popu-lations – depending on definitions – of above five million (e.g. Kraas 2007, p. 79), more than eight million (e.g. Fuchs et al. 1994, p. 1), or more than ten million inhab-itants (e.g. United Nations 2014a, p. 78). In this study, a threshold of five million inhabitants has been decided upon in order to take into account all those cities, which have recently emerged as megacities and which often grow more rapidly than larger megacities. These are especially relevant in the Global South and in transi-tional countries (Kraas 2007, p. 82). In 2014, about 10% (758 million people) of the global population lived in only 51 megacities (9 in India) with a size of more than five million inhabitants (United Nations 2014a, p. 78). In 2030, there will be more than 100 cities with a population above the threshold of five million people (Fig. 3.1). However, it is not the megacities that grow at the fastest pace but the medium-sized cities or cities with less than one million inhabitants. Most of these fastest-growing medium-sized cities are located in Asia or Africa, and a very large share of them are found in China alone (United Nations 2014a, p. 20).
Concerning quantitative definitions of megacities, the given minimum/maximum thresholds are bound to be subjective and invite debate. In the end, all quantitative data involve such definitional problems and in addition bear the risk of statistical and reporting problems. Therefore, the given trends and data have to be seen in this light and taken with proper caution (Kraas 2007, p. 82; Kraas and Nitschke 2006, p. 19). Frauke Kraas therefore suggests a “more qualitative, process-oriented
Fig. 3.1 Distribution of the world’s urban population by size class of urban settlement and number of cities, 1970, 1990, 2014, and 2030. (Source: United Nations 2014a, p. 17)
3.1 Economic Development and Dynamics of Urbanisation in India

54
perception and a more comprehensive understanding of megacities as functional mega- urban regions” (Kraas 2007, p. 82). However, it is worth taking a specific look at the urbanisation trends and data for India.
3.1.2.2 Urbanisation Dynamics in India
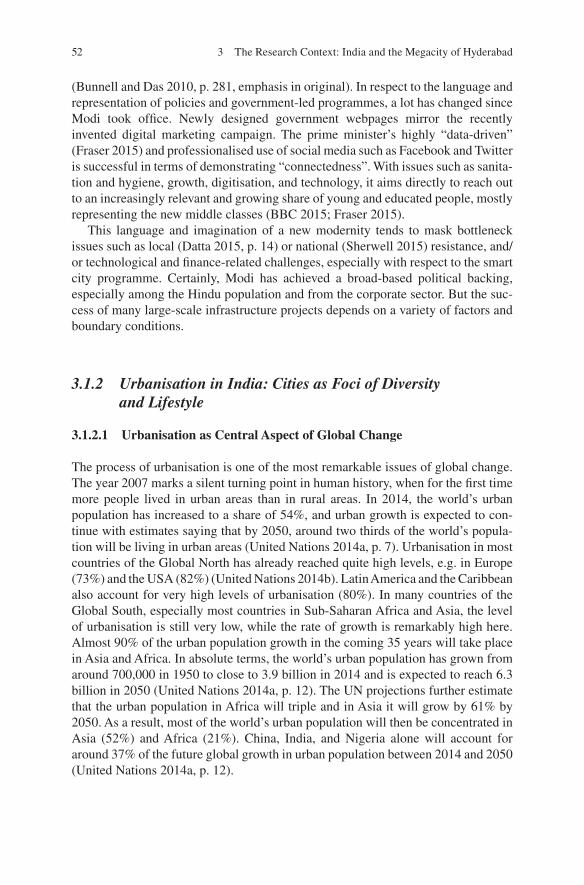
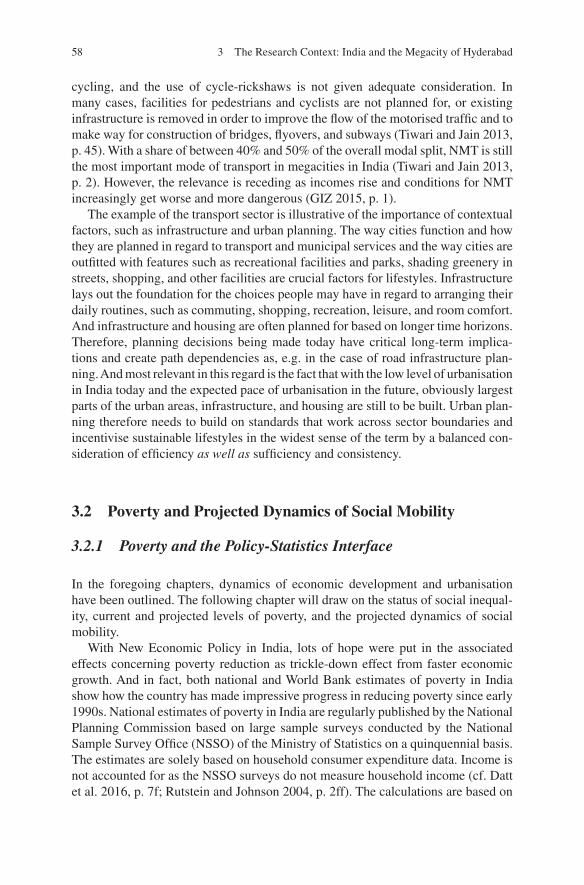
According to UNPD and the 2011 Census, the level of urbanisation in India is still very low at 32.4% (GoI 2011; United Nations 2014b). This rate is still below the average urbanisation level of Asia and still below that of Sub-Saharan Africa. The average rate of annual growth of the urban population in India has been quite mod-est since independence. From a reasonably high rate in the 1950s, it fell sharply over the 1960s and reached a peak in the 1970s (Kundu 2014, p. 197). Over the last two decades (1991–2011), the annual growth rate has ranged between 2.73% and 2.76%. According to the UNPD projections (2014 revision), the Indian urban population grows exponentially, while the growth of the rural population slowly decreases until it comes to a point of nearly zero growth (Fig. 3.2). Figure 3.2 also indicates the growth of the urban population in absolute terms. In only two and a half decades (1990–2015), the urban population in India has increased by almost 200 million people – this number exceeds the total population of Western Europe. By 2030, another 160 million people are expected to add to the existing share of the urban population, which will then reach to a total number of more than 580 million people (Fig. 3.2). Today, one out of ten city dwellers of the world lives in India. In 2050, urban India will account for about 14% of the world’s urban population (more than 800 million people), and the majority of Indians will be living in urban areas.
Fig. 3.2 Urban population percent distribution in cities of different size classes and absolute dis-tribution of population between urban and rural areas over time between 1950 and 2030. (Source: Own draft based on United Nations 2014b)
3 The Research Context: India and the Megacity of Hyderabad
55
It is worth looking at the patterns of urbanisation across different size classes of urban areas. A commonly used size classification of urban centres and towns in India is based on six classes: at its lowest end are Class VI towns with populations of below 5,000 inhabitants and its highest order level are Class I towns and cities of above 100,000 inhabitants. Based on this low-threshold classification, the largest population increases over the past several decades happened in Class I cities. The share of the overall urban population residing in these largest cities has reached 70.2% in 2011 (from 26% in 1901). According to Kundu (2014, p. 201), the reasons for this shift are not based on a faster pace of growth of these larger cities. Rather it is the graduation of smaller towns and cities into the highest category with a result-ing rise in the number of these cities. Given the fact of the existence and high rele-vance of megacities in India, a more differentiated analysis of the growth patterns of larger cities is required.
The UNPD provides a more suitable classification, depicted in Fig. 3.2. It sub-sumes all towns and cities of below 300,000 inhabitants into the smallest size cate-gory. All larger cities are classified into five higher-order classes with an uppermost threshold of ten million, which is the actual UN megacity minimum threshold. Figure 3.2 illustrates the population distribution among different city sizes over time. It shows that the share of the overall urban population steadily shifts away from the smaller class cities towards larger cities and megacities in particular. In 2014, for the first time, more than a quarter of the urban population in India resided in megacities of above 5 million inhabitants; this is about 100 million people alto-gether. The overall population share of these five million-plus cities is projected to remain at this one-quarter level. However, by 2030, three more cities will reach the ten million threshold and thereby add to the share of this largest size class. In 2015, there were four of these largest cities contributing to the urban population with a share of about 17% (71 million inhabitants; Delhi, Mumbai, Kolkata, and Bangalore).1 In 2030, it will be seven ten-million-plus cities with a share of 23% (135 million inhabitants; Delhi, Mumbai, Kolkata, Bangalore, Chennai, Hyderabad, Ahmadabad) (United Nations 2014a, p. 98).
Kundu (2014, p. 227) and other scholars underline the fact that urbanisation in India has been “top-heavy” with an orientation towards large cities. Population growth can be traced back to natural increases as well as higher net in-migration. Some authors argue that this tendency of concentration points towards the phenom-enon of city primacy (Butsch 2011, p. 21; Stang 2002, p. 120). In terms of infra-structure, global integration, better healthcare, education, and employment, these megacities are outstanding with very central functions for their particular regions. Even more important is the economic relevance of these cities, making them highly efficient in generating growth and attracting investments. All these aspects are seri-ous pull factors for migration. Also, New Economic Policy (NEP) has contributed to this trend of concentration. In a globalised context, national as well as global investments are more likely to concentrate in more developed states, regions, and cities. This in return also makes it easier for local urban bodies to initiate and invest
1 At this time, Chennai ranged just marginally below the threshold of ten million inhabitants.
3.1 Economic Development and Dynamics of Urbanisation in India

56
into public works and infrastructure development projects (Kundu 2014, p. 227). The tendency of decentralisation and the strengthening of local urban bodies over the last two and a half decades have also substantially contributed to this shift. Kundu (2014, p. 227) argues that “the resulting decline in central and state financial assistance has led to an exacerbation of inequity in the provision of basic services among states and among size categories of urban centres”.
3.1.2.3 General Implications, Opportunities, and Challenges of Rapid Urbanisation Processes
The above analysis remains incomplete without an understanding of the meanings and implications that these dynamics have for the country, the regional develop-ment, and the conditions in and around the urban areas. Since the Neolithic revolu-tion, processes of urbanisation have been a consequence as well as a driver of human development. Cities and urban areas have always served as hubs for trade, exchange of knowledge and services, innovation, creativity, and cultural development. And cities are likely to provide the critical link between the development of rural areas and the larger global economy (see also Kraas and Nitschke 2006, 21; Sánchez- Rodríguez et al. 2005, 12; World Bank 2009). Cities work as nodes and hubs under processes of globalisation and they often serve as nuclei of societal change and social-cultural innovations. The large majority of the world’s future population will reside in urban areas, and this is one of the main reasons why it is of such impor-tance to search for solutions for humanity’s most urgent problems in the context of cities and urban areas.
Furthermore, urbanisation processes in the Global South tend to be fast, often out-pacing adequate governance and institutional responses. Therefore, many of the devel-opment processes are not well or effectively regulated in order to steer development adequately (slums, growth of informal sector, emergence of unauthorised or badly planned areas and neighbourhoods). In consequence, there are processes involved that create and accumulate largely unconsidered and unaddressed risks and challenges.
These risks and challenges have a social dimension, as vulnerability levels increase and social disparities in regard to education, health, housing, access to basic infrastructure, and quality of life grow considerably. Closely related to this social dimension is the political dimension. As formal institutions fail to address the complexity of problems, informal mechanisms and institutions emerge that fill the social disorganisation gap. Informality however bears the risk of high transaction costs and high levels of institutional insecurity for large portions of the society. These problems of governance and the dynamics of change are likely to also shift the priorities and responsiveness away from issues of sustainability that tend to have a rather long time horizon. Environmental issues are very characteristic in this realm. Urban areas spatially concentrate a multiplicity of human activities with a concentration of related environmental impacts. Some of these impacts are localised within the boundaries of the city, while others partly transcend the boundaries across scales up to the global level, as, for instance, impacts related to the release of GHG
3 The Research Context: India and the Megacity of Hyderabad
57
emissions into the atmosphere. Even if some of these impacts directly lead to prob-lems related to health and quality of life (e.g. air, water, waste, and noise pollution), often there remains the problem of attribution, and in most cases environmental issues are highly complex and not intuitively understood (e.g. plastic waste and the associated risks of vector-borne diseases). One of most complex issues relates to the causes and impacts of climate change, such as the release of GHG emissions: a local process leads to the release of GHG emissions and contributes to the accumulation of GHGs in the global atmosphere. Largely decoupled from the local process, anthropogenic climate change indirectly translates and feeds back into the urban system. And this feedback may be as “direct” as a local manifestation of a globally working climate-based mechanism (climate-change impacts), or it may work even more indirectly in the form of a political response (e.g. carbon tax).
Also with regard to these issues of sustainability and the need of a great transfor-mation towards zero-carbon emissions, cities play a crucial role. Urban planning in this context offers huge potential for effectively reaching out to a large and growing share of population, bringing forward improved sustainability and quality of life. As cities concentrate population, consumption, infrastructure, and economic activities, so are the causes for the release of GHG emissions concentrated here. This fact and the related economies of scale offer huge potential for the establishment of sustain-ability strategies (Butsch 2011, p. 12). Therefore, cities and megacities can be under-stood as “priority areas” and “drivers of change” (Kraas and Mertins 2014, p. 4).
In this context, Satterthwaite (2003, p. 74) highlights the fact that poverty has led to the still very low levels of resource consumption in most cities of the Global South. At the same time however, given the sheer number of the urban poor, slight upward changes in the income situation of the large lower economic segment of the urban population are likely to have vast effects on levels of resource consumption and envi-ronmental degradation. Against the fact that large shares of the future urban infra-structure still needs to be built, it is duly important to develop sustainability strategies and plan for the projected demand in sectors such as transport, electricity, food, and housing. To regulate and direct this social-economic development and to effectively incentivise and stimulate social change towards sustainability, it is highly relevant to achieve a founded understanding of these future consumers, their practices, and potential demands. Hence, lifestyle research in cities of the Global South offers one important approach to better tackle climate change and environmental degradation.
Alongside with the remarkable chances for a more sustainable urban develop-ment (Kraas and Nitschke 2006: 21), rapid urbanisation also carries challenges and risks of many uncontrolled and unwanted side effects that are today found in many larger cities, particularly in the Global South. Often, governance and institutions are largely ineffective, and the implementation of rules lacks rigour and is challenged by serious problems of corruption across all levels. Moreover, responsibilities among the political and administrative actors are fragmented, and largely cross- sectoral problems are therefore often treated within rather artificially maintained sectoral administrative approaches. For instance, road infrastructure planning in many cities still lacks an integration of all modes of transport into the planning pro-cess (GIZ 2015, p. 2). Often, non-motorised transport (NMT), such as walking,
3.1 Economic Development and Dynamics of Urbanisation in India
58
cycling, and the use of cycle-rickshaws is not given adequate consideration. In many cases, facilities for pedestrians and cyclists are not planned for, or existing infrastructure is removed in order to improve the flow of the motorised traffic and to make way for construction of bridges, flyovers, and subways (Tiwari and Jain 2013, p. 45). With a share of between 40% and 50% of the overall modal split, NMT is still the most important mode of transport in megacities in India (Tiwari and Jain 2013, p. 2). However, the relevance is receding as incomes rise and conditions for NMT increasingly get worse and more dangerous (GIZ 2015, p. 1).
The example of the transport sector is illustrative of the importance of contextual factors, such as infrastructure and urban planning. The way cities function and how they are planned in regard to transport and municipal services and the way cities are outfitted with features such as recreational facilities and parks, shading greenery in streets, shopping, and other facilities are crucial factors for lifestyles. Infrastructure lays out the foundation for the choices people may have in regard to arranging their daily routines, such as commuting, shopping, recreation, leisure, and room comfort. And infrastructure and housing are often planned for based on longer time horizons. Therefore, planning decisions being made today have critical long-term implica-tions and create path dependencies as, e.g. in the case of road infrastructure plan-ning. And most relevant in this regard is the fact that with the low level of urbanisation in India today and the expected pace of urbanisation in the future, obviously largest parts of the urban areas, infrastructure, and housing are still to be built. Urban plan-ning therefore needs to build on standards that work across sector boundaries and incentivise sustainable lifestyles in the widest sense of the term by a balanced con-sideration of efficiency as well as sufficiency and consistency.
3.2 Poverty and Projected Dynamics of Social Mobility
3.2.1 Poverty and the Policy-Statistics Interface
In the foregoing chapters, dynamics of economic development and urbanisation have been outlined. The following chapter will draw on the status of social inequal-ity, current and projected levels of poverty, and the projected dynamics of social mobility.
With New Economic Policy in India, lots of hope were put in the associated effects concerning poverty reduction as trickle-down effect from faster economic growth. And in fact, both national and World Bank estimates of poverty in India show how the country has made impressive progress in reducing poverty since early 1990s. National estimates of poverty in India are regularly published by the National Planning Commission based on large sample surveys conducted by the National Sample Survey Office (NSSO) of the Ministry of Statistics on a quinquennial basis. The estimates are solely based on household consumer expenditure data. Income is not accounted for as the NSSO surveys do not measure household income (cf. Datt et al. 2016, p. 7f; Rutstein and Johnson 2004, p. 2ff). The calculations are based on
3 The Research Context: India and the Megacity of Hyderabad

59
interstate price differentials and a state-specific poverty line for rural and urban areas. For a more detailed overview of the method, see GoI (2013), and for a com-prehensive critique, see Deaton and Kozel (2005) and Ferreira et al. (2015). Table 3.1 gives an overview of the share of population living below the national poverty line in total and disaggregated into rural and urban areas.
Apart from this national estimate, an international approach to measuring global poverty levels has been taken up by the World Bank. Based on a conversion of the world’s poorest countries’ poverty lines into a common currency, the World Bank constructed a single global poverty line. This benchmark aims to measure “extreme poverty” (World Bank 2015b) in all countries by the same standard and is made to reflect a person’s minimum nutritional, clothing, and shelter needs in the respective country. The conversion is based on exchange rates in purchasing power parity (PPP) to ensure that the same quantity of goods and services are priced equivalently across countries (World Bank 2015b). Based on recurrent surveys on global price levels (PPP), the $1 a day poverty line from the first round in 1990 was revised three times, in 1993 to $1.08 a day (at 1993 PPP prices), in 2005 to $1.25 a day (at 2005 PPP prices), and in 2015 to $1.90 a day (at 2011 PPP prices) (Ferreira et al. 2015, p. 3). However, the poverty lines have been revised only because of changes in the relative price levels, not in response to economic development and related overall improvements in living standards in many parts of the world. The World Bank states that they have “sought to keep the definition of the line unchanged, and its new value as close as possible to that of the $1.25 line (in 2005 PPPs) in real terms” (Ferreira et al. 2015, p. 3f). In this sense, the new benchmark for the minimum level of well-being follows the same definition as the one dollar a day benchmark set two- and- a-half decades earlier in 1990. For each of the revised PPPs, the World Bank has backcasted the estimates for previous years in consideration of the adjusted prices.
For India, the World Bank poverty line is based on the same data as the national poverty line – consumer expenditure data from large NSSO sample surveys. Table 3.1 compares the two more recent revisions of the World Bank estimates for India with the Indian national estimates beginning in 1993 up to 2011. In each of the
Table 3.1 Comparative trends in population below poverty line, with 2005 and 2015 PPP revisions
World Bank estimates: population below global poverty line
National estimates: population below poverty line
$1.25 a day (2005 PPP) $1.90 a day (2011 PPP) Based on Tendulkar methodTotal Total Total Rural Urban
1993 – 46.1 – – –1994 49.4 – 45.3 50.1 31.82004 – 38.4 – – –2005 41.6 – 37.2 41.8 25.72009 – 31.4 – – –2010 32.7 – – – –2011 23.6 21.3 21.9 25.7 13.7
Source: compiled from GoI (2013), p. 3, and World Bank (2016b)
3.2 Poverty and Projected Dynamics of Social Mobility
60
three backcasting cases, the same methodology has been applied to adjust the pov-erty lines to the respective price levels. All three figures show a significant down-ward trend indicating that extreme poverty levels have been more than halved over a time of less than two decades.
Estimating social inequality and levels of poverty is a highly political issue, and for the case of India alone, debates about definitions of poverty lines and methodol-ogy have been going on for many decades. Deaton and Kozel (2005) have provided an excellent review of the ongoing debate. They have shown how closely politics and statistics interact in this mainly domestic debate, and they highlight the consid-erable weaknesses of estimating poverty based on consumer expenditure data over time. Especially in the case of India, changes in the questionnaire design, e.g. in regard to the length of the reporting period ranging from 7 days over 30 days up to 365 days, have led to debatable inconsistencies regarding data quality issues (Deaton and Kozel 2005, p. 183; Ferreira et al. 2015, p. 14). Moreover, it is problematic to mix income data with consumer expenditure data to arrive at a common basis for well-being, especially for building a common international poverty line as followed by World Bank. As Ferreira et al. (2015, p. 12) state, measures of income and con-sumption are “neither conceptually nor empirically comparable measures of wel-fare. Conceptually, income is usually described as defining the opportunity set, while consumption defines realised outcomes” (Ferreira et al. 2015, p. 12).
Following a similar methodology, but providing for a more in-depth assessment, a recent World Bank study (2016a) has made an attempt to analyse the effects of long-term economic development over the last 60 years in India. The study puts a special focus on the post-1991 reforms and their effects on mitigating poverty. Just as the described above assessments, the study also builds on data from 51 NSSO household surveys (3rd round, 1951, up to 68th round, 2011/2012). The authors show that poverty in India follows a downward trend since 1970. This trend has accelerated in the post-1991 era. This faster post-reform reduction of poverty is shown to be even more significant in rural than in urban areas2 (Datt et al. 2016, p. 28). And as an effect, a convergence of rural and urban poverty was observed with the share of the urban poor having significantly increased. Today, one in three of the poor live in urban areas compared to one in eight in the early 1950s (Datt et al. 2016, p. 48). In spite of the decline in absolute poverty levels, the authors admit a signifi-cant rise in levels of inequality. Much of the rise in inequality is primarily driven by growing inequalities in urban areas and especially by the increasing gap between urban and rural areas (Datt et al. 2016, p. 28; Motiram and Vakulabharanam 2012, p. 50).
The above-given overview of classic approaches to measuring poverty raises the question of how meaningful and significant these purely financial assessments actu-
2 Definition of urban and rural was based on NSS standards following the India Census definition of urban areas. It includes all places with a municipality, corporation, cantonment board or notified town area committee, and places that meet a number of criteria including a population greater than 5000, a density not less than 400 persons per sq. km. and three fourths of the male workers engaged in nonagricultural pursuits as well as certain pronounced urban characteristics (Datt et al. 2016: 9f; Kundu 2014: 543).
3 The Research Context: India and the Megacity of Hyderabad

61
ally are. This is even more at question against the background of the above- highlighted weaknesses and discrepancies in the methods that makes comparisons over time and between regions problematic. The authors of the study cited above admit that one-dimensional approaches lack scope and that there are various other dimensions of well-being that are worth considering, especially in regard to evaluat-ing the social effects of the NEP (Datt et al. 2016, p. 7f). Studies such as the one issued by Datt et al. (2016) are insightful and valuable, as they deliver broad and nationally representative trends on poverty and levels of inequality (Motiram and Vakulabharanam 2012, p. 47). Such studies exemplify classic approaches to poverty which are based on the assumption that poverty is a function mainly of income and consumption.
Over the last two or three decades, the discussion on poverty has increasingly begun to recognise the multidimensional character of poverty that involves various sources of deprivation. According to this perspective, a set of multiple factors chal-lenge and hinder the poor in trying to improve their overall livelihood situation and well-being. And these impediments and deprivations are further linked to the way people live and work, to the level of access to resources and infrastructure, and to the extent to which poor people can raise their voices politically and organise them-selves collectively. Poverty therefore involves a multiplicity of mechanisms that work at the same time in creating inequalities and leading to social segregation and exclusion. Baud and colleagues call this complex of structural determinants “collec-tive structures of constraint” (Baud et al. 2008, p. 1385f). These closely interacting mechanisms become apparent in many realms of everyday life: deprivation in one area may work as a determinant of deprivation in another area, e.g. insufficient sani-tation may cause health problems that again cause problems in insecure employ-ment relations and considerable income loss. Along the chain of these exemplary determinants, there are feedback mechanisms at work, and the factors have much broader implications for the whole household (Baud et al. 2008, p. 1386).
Meanwhile, there are a number of new initiatives and methodological approaches that aim to shed light on the diverse character of poverty and its underlying determi-nants. These approaches, e.g. the livelihood approach and Amartya Sen’s (1999) capabilities approach, aim to take into account a multiplicity of factors contributing to poverty. Due to space restrictions, only the results of two such approaches can briefly be discussed here.
The Multidimensional Poverty Index (MPI) aims to measure acute poverty based on “a person’s inability to meet minimum international standards in indicators related to the Millennium Development Goals and to core functionings” (Alkire and Santos 2014, p. 251). It has been tested and applied for over 100 developing coun-tries including India. The MPI involves the three dimensions health (nutrition, child mortality), education (years in school and attendance), and living standard (cooking fuel, sanitation, water, electricity, floor, and assets).3 Based on these three dimen-sions, a person is rated as being multidimensionally poor if they are deprived in at least one third of the factors, i.e. the cut-off for poverty (k) is 33.3% of the weighted
3 For information on the MPI methodology, see Alkire and Santos (2014).
3.2 Poverty and Projected Dynamics of Social Mobility
62
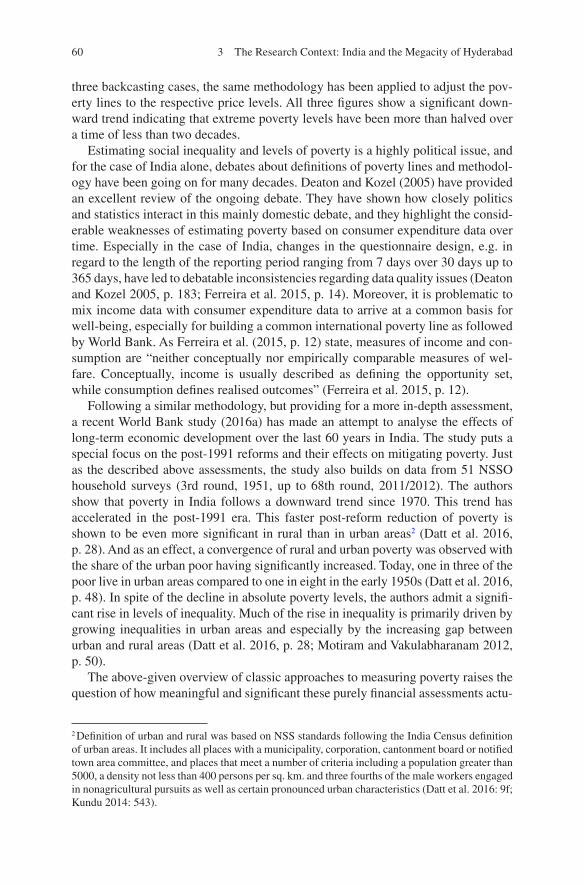
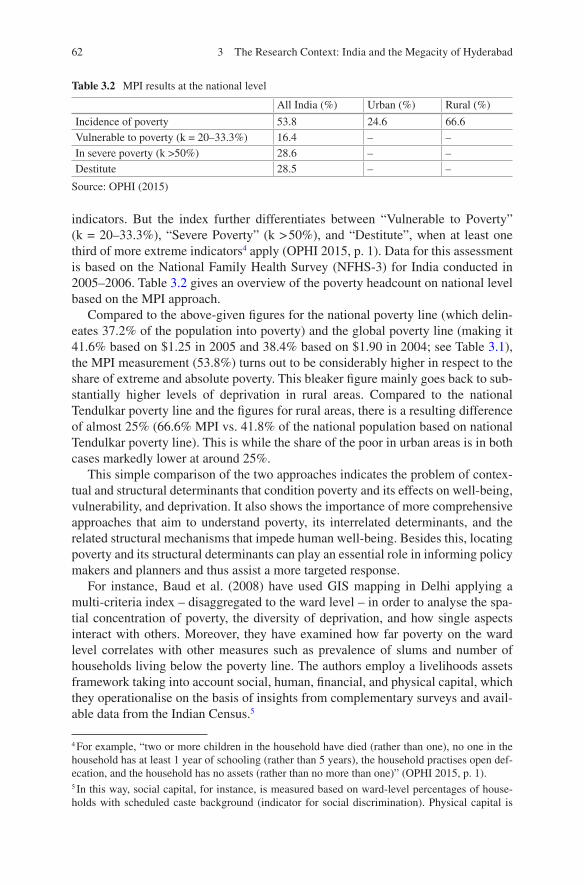
indicators. But the index further differentiates between “Vulnerable to Poverty” (k = 20–33.3%), “Severe Poverty” (k > 50%), and “Destitute”, when at least one third of more extreme indicators4 apply (OPHI 2015, p. 1). Data for this assessment is based on the National Family Health Survey (NFHS-3) for India conducted in 2005–2006. Table 3.2 gives an overview of the poverty headcount on national level based on the MPI approach.
Compared to the above-given figures for the national poverty line (which delin-eates 37.2% of the population into poverty) and the global poverty line (making it 41.6% based on $1.25 in 2005 and 38.4% based on $1.90 in 2004; see Table 3.1), the MPI measurement (53.8%) turns out to be considerably higher in respect to the share of extreme and absolute poverty. This bleaker figure mainly goes back to sub-stantially higher levels of deprivation in rural areas. Compared to the national Tendulkar poverty line and the figures for rural areas, there is a resulting difference of almost 25% (66.6% MPI vs. 41.8% of the national population based on national Tendulkar poverty line). This is while the share of the poor in urban areas is in both cases markedly lower at around 25%.
This simple comparison of the two approaches indicates the problem of contex-tual and structural determinants that condition poverty and its effects on well-being, vulnerability, and deprivation. It also shows the importance of more comprehensive approaches that aim to understand poverty, its interrelated determinants, and the related structural mechanisms that impede human well-being. Besides this, locating poverty and its structural determinants can play an essential role in informing policy makers and planners and thus assist a more targeted response.
For instance, Baud et al. (2008) have used GIS mapping in Delhi applying a multi-criteria index – disaggregated to the ward level – in order to analyse the spa-tial concentration of poverty, the diversity of deprivation, and how single aspects interact with others. Moreover, they have examined how far poverty on the ward level correlates with other measures such as prevalence of slums and number of households living below the poverty line. The authors employ a livelihoods assets framework taking into account social, human, financial, and physical capital, which they operationalise on the basis of insights from complementary surveys and avail-able data from the Indian Census.5
4 For example, “two or more children in the household have died (rather than one), no one in the household has at least 1 year of schooling (rather than 5 years), the household practises open def-ecation, and the household has no assets (rather than no more than one)” (OPHI 2015, p. 1).5 In this way, social capital, for instance, is measured based on ward-level percentages of house-holds with scheduled caste background (indicator for social discrimination). Physical capital is
Table 3.2 MPI results at the national level
All India (%) Urban (%) Rural (%)
Incidence of poverty 53.8 24.6 66.6Vulnerable to poverty (k = 20–33.3%) 16.4 – –In severe poverty (k >50%) 28.6 – –Destitute 28.5 – –
Source: OPHI (2015)
3 The Research Context: India and the Megacity of Hyderabad
63
In result, they highlight that the hotspots of poverty are not necessarily located in slum areas and that these hotspots are diverse in terms of the underlying factors. Through this study, the authors show that multidimensional measures of poverty much better reflect the underlying barriers to improved well-being and that such an index combined with GIS is better able to inform policy makers to make targeted interventions on the ground (Baud et al. 2008, p. 1385).
3.2.2 Social Mobility and the Emergence of the New Indian Middle Class(es)
As shown in the chapter above, India is still a poor country. According to the National Council of Applied Economic Research, NCAER (Shukla 2010, p. 100), the lower classes in India account for about 85% of the population with a household income below of 200,000 INR per year in 2009/2010 (“aspirers” and “deprived”). Against these figures, the role of the so-called middle class seems to be of minor importance. However, its role in terms of both consumption and politics should not be underestimated.
An analytical assessment of the social-economic relevance of the Indian middle classes cannot be separated from more general issues, such as liberal reforms of the 1990s, the role of state policies, or India’s position in a globalising world. Much of the debate has focused on the size of the middle class and the criteria to be used in drawing the boundaries. Political critics of liberalisation tend to both downplay the share of the middle class in India’s social structure and to criticise its presumed “predatory consumerism”, while proponents of liberalisation tend to overestimate its size and to downplay its negative impacts on society and natural resources (Reusswig et al. 2012, p. 35).
While much of the market-oriented research defines “middle class” basically via income (e.g. MGI 2004), more sociologically oriented researchers focus on struc-tural characteristics such as occupational position or cultural capital (Béteille 2001; Deshpande 2003; Sridharan 2004). Nevertheless, the basic quantitative findings of both types of research converge (cf. Reusswig et al. 2012, p. 36).
A study published by McKinsey Global Institute (MGI) in (2007) is an example for a very optimistic and market-oriented assessment and a bold projection of the emerging middle class in India. The MGI study assumes an income classification and definition of the middle class suggested by the National Council of Applied Economic Research, NCAER (2004) (see also Sect. 5.1.4). According to this, the middle class has a household income level ranging between INR 200,000 and INR 1,000,000 per year.
measured on the basis of household infrastructure with “use of handpump”, “no latrine”, “no electricity”, and “little space” being indicators for low levels of physical capital (for further details on operationalisation, see Baud et al. 2008, p. 1395).
3.2 Poverty and Projected Dynamics of Social Mobility
64
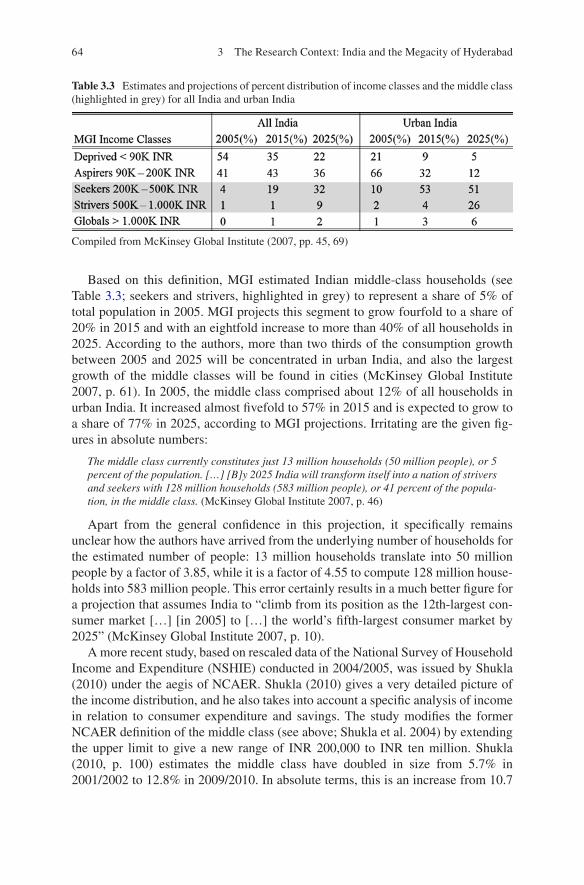
Based on this definition, MGI estimated Indian middle-class households (see Table 3.3; seekers and strivers, highlighted in grey) to represent a share of 5% of total population in 2005. MGI projects this segment to grow fourfold to a share of 20% in 2015 and with an eightfold increase to more than 40% of all households in 2025. According to the authors, more than two thirds of the consumption growth between 2005 and 2025 will be concentrated in urban India, and also the largest growth of the middle classes will be found in cities (McKinsey Global Institute 2007, p. 61). In 2005, the middle class comprised about 12% of all households in urban India. It increased almost fivefold to 57% in 2015 and is expected to grow to a share of 77% in 2025, according to MGI projections. Irritating are the given fig-ures in absolute numbers:
The middle class currently constitutes just 13 million households (50 million people), or 5 percent of the population. […] [B]y 2025 India will transform itself into a nation of strivers and seekers with 128 million households (583 million people), or 41 percent of the popula-tion, in the middle class. (McKinsey Global Institute 2007, p. 46)
Apart from the general confidence in this projection, it specifically remains unclear how the authors have arrived from the underlying number of households for the estimated number of people: 13 million households translate into 50 million people by a factor of 3.85, while it is a factor of 4.55 to compute 128 million house-holds into 583 million people. This error certainly results in a much better figure for a projection that assumes India to “climb from its position as the 12th-largest con-sumer market […] [in 2005] to […] the world’s fifth-largest consumer market by 2025” (McKinsey Global Institute 2007, p. 10).
A more recent study, based on rescaled data of the National Survey of Household Income and Expenditure (NSHIE) conducted in 2004/2005, was issued by Shukla (2010) under the aegis of NCAER. Shukla (2010) gives a very detailed picture of the income distribution, and he also takes into account a specific analysis of income in relation to consumer expenditure and savings. The study modifies the former NCAER definition of the middle class (see above; Shukla et al. 2004) by extending the upper limit to give a new range of INR 200,000 to INR ten million. Shukla (2010, p. 100) estimates the middle class have doubled in size from 5.7% in 2001/2002 to 12.8% in 2009/2010. In absolute terms, this is an increase from 10.7
Table 3.3 Estimates and projections of percent distribution of income classes and the middle class (highlighted in grey) for all India and urban India
Compiled from McKinsey Global Institute (2007, pp. 45, 69)
3 The Research Context: India and the Megacity of Hyderabad

65
million households (58 million people) to 28.4 million households (153 million people) within a decade.
The latter study also draws on aspects of social inequality, in particular region-ally, both between states as well as between urban and rural areas (Shukla 2010, p. 97). With this growing gap between the rich and the poor, the question of what is middle class remains crucial. There is no consensus internationally in regard to defining a “new, income-based ‘class’ of the not-poor but not-rich in developing countries” (Meyer and Birdsall 2012, p. 2). Some authors who deal with an income- based definition of the middle class in the Global South suggest a bottom line just above the international poverty line: e.g. Banerjee and Duflo (2007, p. 4) set the range between $2 and $10 a day (in PPP), while Ravallion (2009, p. 5) designates as middle-class people living between $2 and $13 a day (in PPP). In Europe, this income segment would be regarded as poor, and therefore such a classification is specifically set for the Global South. And people defined as being within this seg-ment are still very vulnerable even to an economic downturn, as their incomes are so low that they do not allow precautionary savings or assets to be accumulated (Birdsall 2010, p. 5).
A more recent strand in income-based middle-class measurement argues for a much higher benchmark starting at a minimum of $10 per capita per day (in PPP) (Birdsall 2010, p. 4; Ferreira et al. 2012, p. 2; Kharas 2010, p. 6; Meyer and Birdsall 2012, p. 2). Such a threshold is considerably higher than the World Bank’s interna-tional poverty level, but it still implies a “minimum vulnerability to most economic and political shocks” (Meyer and Birdsall 2012, p. 2). Birdsall (2010, p. 6f) con-tends that – although it is a “round” and ad hoc number – this benchmark of around $10 a day per person demarcates a financial position that allows people to care about and save for the future and that it conveys a feeling of economic security against downturns of “the normal business cycle” (Birdsall 2010, p. 6). The basic argument here is that “a household is unlikely to need to sell household or business assets or take children out of school, and is insured through savings or formal insurance arrangements against such idiosyncratic risks as a family health catastrophe or a brief spell of personal unemployment” (Birdsall 2010, p. 6). While the upper bench-mark in delineation to the rich still varies considerably, some authors predict a $10 per capita minimum threshold to be emerging as a new global standard definition for the middle class (Meyer and Birdsall 2012, p. 2).
Based on data from the NSSO Socio-Economic Survey 66th round (2009/2010), Meyer and Birdsall from the Center for Global Development (CGD) in Washington have attempted to assess the size of the middle class with an underlying middle- class definition ranging between $10 and $50 per capita per day. With this upper threshold, 0.06% of the rural population and 0.23% of the urban population have been found to have higher income than $50 per day, altogether about 1.33 million people (Meyer and Birdsall 2012, p. 6). The authors compare their findings with the results of the NCAER estimates from Shukla (2010, p. 100ff; see above) showing that less than 6% (about 70 million people) can be termed as middle class according to this definition, less than half of the NCAER estimation. Interestingly, about 60%
3.2 Poverty and Projected Dynamics of Social Mobility

66
of the Indian middle class lives in urban areas, making out a share of almost 12% (about 41 million people) of the overall urban population in India (Table 3.4).
The size and aspirations of the emerging middle class are also part of a social discourse on India’s new power and future development. Even if it is just “a small segment of urban upwardly mobile people that has provided the basis for the discur-sive production of the image of ‘the new middle class’”(Fernandes 2006: 89), this public discourse not only reveals the developmental desires but also reflects the shifting social realities of urban India. Also quite controversial appears to be the academic and market-research literature of the last two decades that turns around the issue of an emerging new middle class and the advent of a so far unseen con-sumer culture. Especially market-research-oriented studies follow a quite dominant narrative of new middle-class consumer lifestyle with rapidly growing levels of consumption and very optimistic projections of the growing middle class (Mathur 2010, p. 213). The German-language rather than popular-science-based literature has also joined this optimistic canon quite unequivocally, with book titles such as Wirtschaftsmacht Indien, Weltmacht Indien, Die neue Wirtschaftsmacht am Ganges, or Tanz der Riesen: Indien und China prägen die Welt.
Very importantly, the Indian state also intones into this “new middle class rheto-ric” (Fernandes 2009: 219). Leela Fernandes (2009: 219) has taken a closer look at this phenomenon. She conceptualises the narrative of a new middle class in India as an aspect of “a state-led project […] of development rather than as an expanding consumer group that has naturally been produced by economic growth” (Fernandes 2009: 219). First, the massive influx and sudden availability of a broad variety of new consumer goods and the ubiquitous visualisation of their use through advertis-ing and marketing is an outcome of state-led liberalisation policy. Along with this highly visible market development, “new languages of development” emerged centring on the promise of a growing middle class that directly benefits from this transition towards consumer lifestyle (Fernandes 2009, p. 223). These two strands, the changed market situation on the one hand and the new middle-class narrative on the other, create a so far unknown atmosphere of new “imaginations” (Appadurai 1996, p. 10) towards future development and the question of what a good life could look like.
The above-given context and the figures on poverty in India (Table 3.1 in Sect. 3.2.1) indicate the huge potential of social mobility in the near future. The figures in Table 3.1 allow the assumption that more than half of the overall Indian population still lives under conditions that at the utmost allow them to satisfy little more than
Table 3.4 Size of India’s middle-class, CGD, and NCAER estimates (2009/2010)
Meyer and Birdsall (2012)/CGD Shukla (2010)/NCAERPopulation share (%) (Million) Population share (%) (Million)
Rural 3.37 27.84Urban 11.79 41.33Total 5.88 69.17 12.8 153
Source: Meyer and Birdsall (2012, p. 6)
3 The Research Context: India and the Megacity of Hyderabad

67
basic human needs, such as water, food, shelter, clothing, sanitation, education, and healthcare. Yet some improvement in the income situation for this bottom segment of Indian society allow them to increase their level of consumption and to change some aspects in their way of life. Against this background, growing demands for consumer goods such as cars, homes, household appliances, etc., seem inevitable. And obviously, with the liberalisation of the Indian economy, this demand is met by a virtually boundless variety of new mass consumer goods that have emerged on the Indian market.
Moreover, crucially important in transporting images of lifestyle are mass media, advertising, and marketing strategies. They play key roles in creating new imagina-tions and in shaping and manifesting the different world views, values, and prefer-ences (McFarlane 2013) that guide behaviour and consumption. Urban areas and cities are in the focus and serve as projected area for marketing and advertising, as they offer an unprecedented market potential for new products. This especially holds true in emerging economies, such as India, where advertising occupies a major space in the public sphere as well as in mass media (cf. Franck 2010; Brosius 2010). Existing and newly emerging urban public spaces have therefore become a target of market-driven scenic colonisation and commercialisation that leads to an intense atmosphere of departure. These urban-specific features materialise in the form of oversized hoardings, advertising, and locations of exclusionary consump-tion, such as malls, cinema halls, leisure parks, cafes, and restaurants. They charac-terise the setting and the social space, and they are at work quite directly in stimulating and creating demand for new consumer products. These publicly cele-brated and commercially staged sceneries of a newly emerging consumer culture create a set of new images and a semiotic language for conspicuous consumption and distinctive behaviour. As highly visible markers of social inequalities and exclu-sion, they convey comprehensive images and references for various styles of living. In this way, new lifestyles and new ways of consumption become conceivable, much of it in reference to a “Western” or “global” role model.
By considering consumption as a medium to perform and express a specific way of life, these images and references and their reception and translation into individu-ally specific consumption patterns play an important orientational role for stylisa-tion and construction of a social identity. Such expressive modes of behaviour and consumption, for instance, are manifested in diverging dietary patterns, modes of transport, religious practices and rituals, leisure activities, practices of vacation, and through a material culture conspicuously exhibited in the form of acquiring a mul-tiplicity of consumer goods. Thereby, individual consumption and lifestyle tends to be based on following existing behavioural patterns and is based on shared imagina-tions of what a good life should look like (see Sect. 3.2.2). In this sense, cities can be seen as stages where a multiplicity of different social practices are performed and expressed.
It is well known from research on globalisation that the flow of information, images, goods, and products does not lead to a globally homogenised consumer culture. The information, images, products, sceneries, and practices are received very differently depending on the locational context as well as on the people’s
3.2 Poverty and Projected Dynamics of Social Mobility
68
social-cultural and social-economic background. Income is not by far the only determinant for certain patterns of consumption, as income does not say much about spending or saving. Therefore, income-based projections of the middle class – no matter how exact they might be – are unable to reflect how consumption levels may actually change. Most observers expect the greatest dynamics will take place in urban areas. In many ways, such trends in consumption dynamics – and especially in respect to economies of scale as part of the lower economic segments – have severe implications for urban governance and climate-change mitigation. Whether and how this “dividend” of increasing incomes will be spent depends considerably on external and cultural factors such as the market, infrastructure, housing condi-tions, cultural dynamics, and institutions. It also builds, however, on socially shared representations that are based on the structure of individual attitudes and values.
3.3 Climate Change in India6
3.3.1 Impacts of Climate Change in India
Most of the impacts of climate change will affect India severely in many ways. Some of the more general environmental and climate-related risks and hazards that already exist without anthropogenic climate change are likely to be exacerbated, taking the form of extremes and increased variability. Extreme weather events such as torrential rain with flooding or failed monsoon seasons are expected to rise in number and intensity. Such events often have far-reaching and in some cases cas-cading effects for large parts of the population but also for whole economic sectors with related feedback mechanisms, for instance, in agriculture or the transport sec-tor. In addition, larger and more systemic effects such as sea-level rise, glacier change in the Himalayans, and the destabilisation of the Indian monsoon are as yet unclear. Moreover, most of the climate signals translate into a multiplicity of impacts, which often interact in complex ways and which represent often long net-works and pathways of effects (Reckien et al. 2009, p. 3). Given the enormous size and variation of India’s physical and social geography, the possible impacts but also its adaptive capacity will vary widely, resulting in a broad range of vulnerability to climate change (O’Brien et al. 2004). In particular, major impacts are projected for agriculture. Moreover, there are important health implications, as climate change is likely to impose an additional layer on already existing, severe environmental health risks – to name just a few – risks associated with air, water and soil pollution, heat stress, flooding, waterlogging, and vector-borne diseases. This is in particular the case in urban areas within a context of rapid urbanisation.
In 2010, India released its first-ever scientific assessment of climate-change- related impacts projected for 2030 and deduced from the Hadley Centre Regional
6 Some parts of this chapter have been taken from one of the author’s earlier publications, namely, that authored by Reusswig and Meyer-Ohlendorf (2010: 19ff).
3 The Research Context: India and the Megacity of Hyderabad

69
Model Version 3 (HAD RM3) run for the IPCC SRES A1B scenario. The 4x4 assessment study addresses four of the key sectors of the Indian economy, namely, agriculture, water, natural ecosystems and biodiversity, and health. It concentrates geographically on the four climate-sensitive regions of India, namely, the Himalayan region, the Western Ghats, the coastal area, and the north-east region” (MoEF 2010). Table 3.5 summarises the most important conclusions from the assessment.
Table 3.5 Summary of findings from India’s “4 × 4 assessment of the impact of climate change on key sectors and regions of India in the 2030s”
Impact category Expected changes and variability by the year 2030
Temperatures Rise in annual mean surface air temperature between 1.7 and 2.0 °C. Potential of increase in variability of seasonal mean temperature in winter months
Precipitation Small increases in annual precipitationExtreme events
Extreme temperatures: potential of intensification of daily temperature minimum and maximum in surface air temperature. Spatial pattern change in lowest daily minimum and highest maximum temperature suggests warming of 1–4 °C. Night temperatures likely to rise more over south peninsula and central and northern India. Central and northern India may experience increase in daytime warmingExtreme precipitation: extreme precipitation events likely to increase by 5–10 days in all regionsCyclones: frequency of cyclones likely to decrease, but increase in cyclonic intensityStorm surges: All locations along eastern coast north of Vishakhapatnam, except at Sagar and Kolkata, show increase in storm surge levels in the 100-year return period by about 15–20% with respect to the 1970s. For Sagar and Kolkata, increase was found less than 5%
Sea-level rise Sea level along Indian coast has been rising at rate of 1.3 mm/year; likely to rise in consonance with global sea level rise in future
Agriculture In all regions, irrigated rice likely to gain in yields marginally from CO2 fertilisation compared to rain-fed rice. Maize and sorghum projected to have reduced yields in all regions. With overall warming, the thermal humidity index projected to increase in all regions, especially in months of May and June, leading to stress to livestock and reduction in milk productivity
Forestry All forest vegetation types in the four eco-sensitive regions vulnerable to projected climate change in short term, even under moderate climate change scenario (A1B). Impacts vary from region to region with changes ranging from 8% to 56% in vegetation cover
Human health Malaria projected to spread in new areas in Jammu and Kashmir in Himalayan region. In the north-east region, opportunities for transmission likely to increase for longer period. In Western Ghats, no change observed. In coastal region, especially in eastern coast marked decrease in number of months; this increases likelihood of malaria transmission
Droughts and floods
Water yield projected to increase in Himalayan region by 5–20%; water yields likely to be variable across north-east region, Western Ghats, and coastal region. Moderate to extreme drought severity for Himalayan region, as compared to other regions. All regions likely to experience flooding with exceeding existing magnitudes by 10–30%
Source: data compiled from MoEF (2010)
3.3 Climate Change in India

70
When the report was released, the then Environment Minister Jairam Ramesh stressed: “There is no country in the world that is as vulnerable on so many dimen-sions, to climate change as India is”, and he emphasised the importance of building indigenous, independent research capacity for assessing the risks of climate change (MoEF 2010, p. 9).
3.3.2 India’s Role in (International) Climate Policy
It is not only these climate-change impacts that provoke India’s major interest in influencing the outcome of a global agreement on climate change. The pressing issue of future adaptation to climate change, growing environmental problems, the importance of energy security as a precondition for economic development, and increasing pressure from a broad, concerned, and well-informed (English speaking) public certainly provoke the interest in an effective post-Kyoto international climate policy regime – in favour of non-Annex I parties (Wagner 2010, p. 70). Most impor-tantly, such an agreement provides the opportunity of assistance, financially as well as in the form of a technology partnership and strategic climate and energy relations with Annex I parties such as the USA. This has implications for infrastructure and non-polluting and energy self-sufficient economic development, as well as the potential of probably seising new markets globally (e.g. solar technology, electric cars). Against this background, India’s position in international climate change negotiations is unique and worth looking at in more detail.
Since the Conference of Parties (COP13) in Bali, India increasingly faces rigid pressure in the international climate change negotiations towards taking legally binding commitments to a post-Kyoto agreement. In the Kyoto Protocol, binding emission-reduction targets were set only for 37 industrialised countries under the principle of “common but differentiated responsibilities”. With its late economic awakening in the early 1990s, India has until now contributed relatively little to the overall cumulative GHG emissions (so-called historic GHG emissions) when com-pared with the early industrialisers. But given its rapid economic development of the last 25 years and the vast population numbers and area, India has now reached the fourth position with a contribution of almost 6% to overall global annual GHG emissions following the USA, China, and EU (WRI 2015). However, by taking population into account and calculating per capita emissions, India falls back to the 129th position with only 2.44 tonnes per capita per year in 2012 (WRI 2015).
Mainly holding to this argument of very low per capita GHG emissions, India has long retained a tough position in the international climate-change negotiations under the United Nations Framework Convention on Climate Change (UNFCCC). In fact, India cannot be lumped with China as a global economic player with its almost 250 million Indians surviving on less than a dollar a day (see above). Moreover, India still struggles with one third of all households still lacking access to electricity (GoI 2011), and in regard to energy security, India still faces major challenges. Hence, economic development, poverty alleviation, and energy security
3 The Research Context: India and the Megacity of Hyderabad

71
are among the major priority areas that India has to deal with in the coming years. A reduction of GHG emissions holds the risk of being bound to seriously compro-mise on these priority areas, such as building up a stronger economy, addressing poverty, and investing in broad-based infrastructure development. In addition, Indian foreign policy has – since independence – insisted on maintaining its own sovereignty, especially since the founding of the Non-Aligned Movement in 1961 (Wagner 2010, p. 67). Any legally binding commitment to an international agree-ment on climate change counteracts these priorities.
Against this background, it appears surprising that India has in fact taken major steps forward in the recent years to address climate change voluntarily and in a self- determined way, and it is obvious that climate change ranks high on the political agenda. Quite relevant here are technological and economic opportunities and chal-lenges associated with strategies to reduce GHG emissions and develop sustainably. Quite groundbreaking was the constitution of the Prime Minister’s Council on Climate Change in 2007, established to coordinate national action plans for assess-ment, adaptation, and mitigation of climate change. In this light, the visionary National Action Plan on Climate Change (NAPCC) was released, defining eight core national missions as a framework for the implementation of state action plans on climate change. Since then, quite a number of initiatives and programmes have emerged: just to name a few, the Energy Efficiency Programme (EEP), the Carbon Strategy, a coal tax to finance clean energy research and development, fuel effi-ciency standards, a Renewable Energy Certificate (REC) trading scheme, and the initiation of the Indian Network on Climate Change Assessment (INCCA), which represents a network of over 120 institutions and 220 scientists aiming to further improve Indian climate science. Also, the new prime minister, Narendra Modi, sig-nalled changed priorities, as he initiated a nomenclature change of the Ministry of Environment and Forest renaming it the Ministry of Environment, Forest and Climate Change.
A breakthrough in the international negotiations was reached in 2015 at COP21 in Paris, where India has been lauded for the quite ambitious targets that it has set as part of the Intended Nationally Determined Contributions (INDCs). India has communicated its future commitment based on eight targets, out of which three are quantitatively tangible. The other targets are more inexplicit, but they are not less remarkable. The very first mentioned target draws on the issue of increasingly changing lifestyles. It aims to “put forward and further propagate a healthy and sustainable way of living based on traditions and values of conservation and mod-eration” (GoI 2015, p. 29). This reference to values of thriftiness and frugality rooted in the Gandhian ideals of simplicity and asceticism (see Sect. 4.1.2.1) con-tains an implicit critique of an adoption of “Western” lifestyles and values and an emerging consumer culture. This critique is further underlined by a second objec-tive to “adopt a climate friendly and a cleaner path than the one followed hitherto by others at corresponding level of economic development” (GoI 2015, p. 29). These first two targets are noteworthy as they reflect one side of an ambivalent development discourse. The discourse on conservation and moderation on the one hand is considerably at variance with the dominant technology-oriented and liberal
3.3 Climate Change in India
72
development paradigm that has been deeply embraced since the emergence of the NEP (see Sects. 3.1.1 and 3.1.2). The following three targets are more concrete and quantitatively measurable. In its third objective, India proposes to “reduce the emissions intensity7 of its GDP by 33–35% by 2030 from 2005 level” (GoI 2015, p. 29). Fourth, it aims to “achieve about 40 percent cumulative electric power installed capacity from non-fossil-fuel-based energy resources by 2030 with the help of transfer of technology and low cost international finance including from Green Climate Fund” (GoI 2015, p. 29). And fifth, India aims to “create an addi-tional carbon sink of 2.5 to 3 billion tonnes of CO2 equivalent through additional forest and tree cover by 2030” (GoI 2015, p. 29). Also remarkable is that only the sixth target refers to the issue of climate change adaptation in sectors “vulnerable to climate change, particularly agriculture, water resources, Himalayan region, coastal regions, health and disaster management” (GoI 2015, p. 29). The last two goals rather draw on the issue of implementation and finance with the support of Annex I countries and the creation of a domestic framework and international architecture in order to bring forward research and development of future techno-logical solutions (GoI 2015, p. 29).
While it is still open, whether and how the Indian government would operation-alise and implement the “soft” targets, it is worth looking at the feasibility of the quantitatively tangible objectives and the proposed mitigation strategies and actions. India aims to develop an installed capacity of 175 GW based on new renewable energy sources to be built by 2022: 60 GW of grid-connected wind power, 100 GW of solar power (60 utility scale, 40 rooftop), 10 GW of biomass energy, and 5 GW of small hydro. While there is no given nuclear capacity target mentioned for 2022, the document proposes a target of 63 GW for 2032. Also large hydro plants, which currently make out the largest source of non-fossil energy, are not mentioned directly.
While some observers doubt the viability of these quite ambitious targets, others are quite positive about the proposed commitments. Chakravarty and Ahuja argue that in order to meet the 4% non-fossil target in 2030, India requires about 300–400 GW of non-fossil capacity. With an expected increase of about 5 GW of wind power and 15 GW of solar PV per year, this target is not seen as unrealistic (Chakravarty and Ahuja 2016, p. 475). For this, however, huge investment needs to be made, and it is unlikely that much of it will be drawn from the Green Climate Fund, a financial mechanism under the UNFCCC. However, this doesn’t seem nec-essary, as the Indian market for renewable energy is highly attractive for Indian and international private-sector firms (Chakravarty and Ahuja 2016, p. 475f).
Apart from investments in generation systems, such as wind and solar power, the requirements of renewable energy systems in respect to the electricity grid are con-siderable. A robust, flexible, and well-integrated grid system that connects the Indian subcontinent needs to be put in place in combination with reliable storage facilities for balancing out remaining variabilities. This is quite challenging as smart
7 Emission intensity is defined as tonnes of CO2 generated per unit of GDP corrected for purchasing power parity.
3 The Research Context: India and the Megacity of Hyderabad

73
and well-integrated solutions still need to be found and huge investments in the energy grid need to be made (Chakravarty and Ahuja 2016, p. 476).
Increasing the share of low-carbon electricity-generation technologies certainly does not suffice to meet the substantially growing energy demands in India. Such a scheme needs to be combined with significant reductions in the emission intensity, as rightly envisioned in the INDCs. A high and increasing share of the service sector and considerable gains in energy efficiency are among the main factors which could contribute towards realisation of the intensity targets. The former and the new gov-ernment have put into place a variety of programmes that aim to raise energy effi-ciency. The Star appliance labelling programme, the promotion of compact fluorescent lamps (CFL), and another programme to replace all incandescent light bulbs with LEDs by 2020 have induced and are likely to further increase energy savings. This is an essential step to reduce peak power demands, especially in the evening hours, and thereby balance out the lack of solar power with the setting sun (Chakravarty and Ahuja 2016, p. 476).
Huge potential concerning both energy efficiency and in the reduction of non- CO2 GHG emissions lies in the realm of refrigeration and air-conditioning (AC). Technological advancements can raise efficiency levels to a substantial extent. Adding to this, building design and urban planning as well as behavioural and oper-ational adaptations can contribute to huge energy savings in room and vehicle air- conditioning, considering the sector’s growth rate and the current lack of awareness (see, e.g. Noé21 2014). Some observers estimate the peak AC load alone as high as 140 GW in 2030, which represents almost the all-India peak load today (Chakravarty and Ahuja 2016, p. 476). ACs, room and water heaters, chillers, refrigerators, etc., have tremendous potential for energy savings. And in addition to the issue of effi-ciency increases, even can be achieved in terms of avoiding the use of refrigerants (hydrofluorocarbons, HFCs) increasingly used in air-conditioners and refrigerators (Velders et al. 2009, p. 10949), yet having a very high global warming potential (GWP) ranging between about 700 and 4,000 GWP (Xu et al. 2013, p. 6084).
However, the greatest challenge India will face in the future is based on the fact of rising incomes and large fractions of the population entering the middle class. This transition will significantly increase the consumption of manufactured goods, electricity, ACs, heating, automobiles, and air transport, and it has just started with the New Economic Policy in India and will continue for decades to come (Chakravarty and Ahuja 2016, p. 476). The next chapter will examine this factor in more detail, taking a closer look at the effects of urbanisation, rising incomes, and changing patterns of consumption.
3.3.3 The Indian Middle Class, Rising Incomes, and Emissions
Considering India’s per capita GHG emissions and its historical contribution to the existing emissions stock in the atmosphere, the country’s role as a driver of anthro-pogenic global climate change is still minor. However, with its rapid economic
3.3 Climate Change in India
74
growth, its fast-growing population, and its high rate of urbanisation, GHG emis-sions are growing at much higher rates than those of the developed countries. India’s total GHG emissions have more than doubled between 1990 and 2008 (IEA 2010), and the World Energy Outlook 2009 Reference Scenario projects that CO2 emis-sions in India will increase by more than 2.5 times by 2030 from 2008 (IEA 2010). With an average per capita value of only 2.44 tonnes per year in 2012 (WRI 2015), India still ranges far below the world average of about 4 tonnes. This together with the prevalent poverty in India has long served as a telling argument to legitimise India’s strict rejection of any binding emission-reduction agreement with the Global North, i.e. Annex I countries, being largely responsible for the climate-change prob-lem. While this argument seems justifiable in terms of global environmental justice, the high growth rate of India’s total and – to a lower degree – per capita emissions asks for a deeper analysis.
Average per capita emissions mask the fact that in recent years a growing middle class has produced significantly higher per capita emissions – not to mention upper class members, whose emissions dwarf average emissions in Europe or even the USA. This has raised concern among some scholars and NGOs in India and else-where, who ask whether more and more of India today is “hiding behind the poor” – in reference to the apt title of a Greenpeace India publication on this issue.
With its growing size and the increasing purchasing power, the middle class is most relevant in regard to this social-cultural transition and its effect on the environ-ment in general and the climate in particular (Myers and Kent 2003, p. 4966). Myers and Kent argue that it is mainly the consumption sectors meat consumption, indi-vidual motorised transport (IMT) and electricity use that have the greatest potential to be affected by rising incomes (Myers and Kent 2003, p. 4964ff). As one example, the release of the Tata Nano car – the most affordable car ever produced – has reminded the world of the potential risks of the Western-oriented development and planning paradigm being followed in most of the developing world. The rapidly increasing shares of personal motorised transport users especially in cities, the sharp decline in walking and bicycle trips, and the fact that public transport and non- motorised transport users are mostly captive users illustrate the problem (Tiwari 2011, p. 9). Even if the trends in car ownership still range on a rather low level at less than 2% on national level and at 10–15% in richer cities, aspirations for owning a personal motorised mode of transport are immense. It is also the growing demand for long-distance travel and the rising market in air travel that will have a major impact on the development of future emissions in India, and much of this relates to the dynamics of upward social mobility.
Therefore, the new consumption patterns on the one hand and the high overall carbon intensity of the Indian economy on the other will inevitably lead to growing emissions – and to a growing environmental responsibility on the part of the Indian middle class. The majority of this social segment is located in cities. It may thus be said that India’s future urban middle class holds a key to both national and, to a lower but still significant degree, global GHG emissions in its hands.
3 The Research Context: India and the Megacity of Hyderabad

75
3.4 The Case Study: The Megacity Hyderabad
3.4.1 Location and Early History
Hyderabad, with a population nearly nine million people today, is the sixth largest city in India and is expected to reach the threshold of ten million inhabitants by the year 2020 (United Nations 2014a, p. 332). It is expected to grow to 12.8 million people by 2030 (United Nations 2014a, p. 316). With its rapid population growth and its population still ranging between five and ten million people, Hyderabad can be classified as a city, which has recently emerged as megacity. This feature was one of the reasons to consider the city as case study for a project under the BMBF- funded Future Megacities programme with the project title “Hyderabad as a Megacity of Tomorrow: Climate and Energy in a Complex Transition Process towards Sustainable Hyderabad”.
Hyderabad is situated on a hilly terrain of grey and pink granite at an average altitude of 542 m. Apart from the very typical landscape of dotted hills with charac-teristic granite rock formations, there are quite a number of artificial lakes created by dams on the Musi River. While it is situated along the banks of the Musi River, Hyderabad is located within the crossroads of the two larger rivers, Krishna and Godavari, in the peneplain Telengana (MCH 2005, p. 1). Hyderabad is well con-nected with other metropolitan areas through a well-developed national and regional railroad network as well as some national and state highways converging in the city. The city’s newly established and state-of-the-art international airport well connects the city with destinations outside India and contributes to the attractiveness of the city in regard to foreign direct investments.
The city of Hyderabad was established in 1591 by Muhammad Quli Qutb Shah, the fifth and most celebrated ruler of the Qutb Shahi dynasty of the sultanate of Golconda. The original city plan of Hyderabad was inspired by and incorporated many features of the mythical Islamic heaven as laid out in the Quran (Luther 2008, p. 1). Literally planned as replica of the Qur’anic “Gardens of Eternity”, the city was laid out around a monumental central building, the Char Minar, with the cross-ing of two axial streets oriented along the cardinal directions. This area, which also contained other new buildings, civic spaces, and shopping areas, covered only a quarter of a square kilometre (Das 2015, p. 49). This feature in part accords with the ancient Indian architectural theory of Hindu Vastu Shastra, but there are other fea-tures which clearly go back to Islamic and Persian ideas of an ideal configuration of streets and buildings (see Pieper 1984, p. 47). Already during the period of the Qutb Shahi dynasty, Hyderabad developed as an important economic, trade, and cultural centre for the larger region of Golconda.
In the late seventeenth century (1687), Hyderabad was taken over by the Mughal emperor Aurangzeb and was since then ruled by several appointed Nizams (gover-nors), until the Nizam Asaf Jah I declared his independence from the Mughal impe-rium (Das 2015, p. 49). During the 200 years of Nizam rule, the region and its central trade and cultural hub of Hyderabad became famous for pomp, flaunted
3.4 The Case Study: The Megacity Hyderabad
76
wealth, and noble jewellery (Das 2015, p. 49). However, with the East India Company’s increasing dominance over the subcontinent in the second half of the eighteenth century, the Nizams’ sovereignty declined considerably. But the Hyderabad princely state remained independent until 1948, when it was forcibly integrated into the Indian union. In 1956, the former Nizam region became part of the newly formed state of Andhra Pradesh (AP) with Hyderabad becoming state capital.
The newly formed state of AP integrated three distinct geographical regions – Telangana, the former Nizam state in the north-west, coastal Andhra in the east, and Rayalaseema in the south and south-west. These newly integrated regions in fact share the same language but have very different geographical, historical, cultural, and social-economic backgrounds. While coastal Andhra is richly endowed with fertile agricultural lands, where early types of irrigation were introduced by the British rulers, Telangana and Rayalaseema rather remained backward with much harsher physical conditions. Especially the former Nizam region of Telangana has been left isolated from the rather technology-oriented approach of the British rulers in terms of education and economic development (Benbabaali 2009, p. 689).
The formation of the federal state in the mid-1950s subsequently nurtured a con-siderable rise in in-migration to the city, with rising tensions especially between migrants from coastal Andhra and people from Telangana. With their often advanced level of education and development, people from coastal Andhra succeeded filling important and influential positions in business, politics, and administration. This has also led to further neglect and the increasing backwardness of the Telangana region (Das 2015, p. 49f). And while diversity has been a constant feature of Hyderabad, the emergent conflict arose not because of diversity, but more due to rising inequali-ties (Benbabaali 2009, p. 699). The smouldering Telangana conflict came to the boil again in 2010 with the repeated demand to separate Telangana region from AP. This struggle went on until recently in 2014, when Telangana achieved independent statehood with Hyderabad as its capital.
3.4.2 Hyderabad as an Engine for Growth
The post-independence urban growth of the city is characterised by a trend of public- sector-based industrial development during the 1960s and 1970s, with enor-mous employment opportunities for skilled workers. Also, several scientific research institutions and the headquarters of the South-Central Railway zone settled in Hyderabad through to the late 1980s. The resulting massive influx of migrants from the surrounding districts led to considerable pressure on the housing sector and the existing urban infrastructure. During this time, due to the lack of affordable hous-ing, large shares of the population had to make a living in slums or slum-like condi-tions (Das 2015, p. 51). With the advent of the New Economic Policy (NEP) and the tendencies of decentralisation and strengthening of the political role of the federal states after 1991 (Das 2015, p. 51; Kennedy 2007, p. 97), the character of urban
3 The Research Context: India and the Megacity of Hyderabad
77
development of the city changed considerably with a strong focus towards the ser-vice sector, particularly information technology (IT), IT-enabled services (ITES), and biotechnology.
This changed path of urban development is specific for the case of Hyderabad. It presents an outstanding example of how globalisation and economic liberalisation can affect the development of a city and its hinterland and how a city can work as engine of economic growth and social change. At the same time, Hyderabad exem-plifies to accommodate most of the major social and environmental issues and chal-lenges related with rapid urban growth. These two aspects will be dealt with in the following.
The decentralisation and rescaling of provincial states have opened up a range of so far unknown political options and possibilities but also increased the pressure on state capitals and major urban centres in India to compete for foreign direct invest-ment and attract industries to settle (Kennedy 2007, p. 97; Kennedy and Zérah 2008, p. 115). However, this process of decentralisation only had limited effect on the scope of action for local governments, and this, although the 74th Constitutional Amendment Act was ratified in 1993, suggests extended functions and competences in planning for economic and social development (Kennedy 2007: 98). In the case of development of Hyderabad, it is the federal state of AP playing out the major role in adopting a city-centric growth strategy (see, e.g. Kennedy and Zérah 2008).
In 1995, the AP government under Chief Minister Chandrababu Naidu was con-fronted with a major economic crisis, with an agriculturally dominated economy, very high levels of subsidies and welfare comprising around 10% of the state GDP, and a stagnating manufacturing sector (Das 2015, p. 51). Bound to take a loan from the World Bank under the structural adjustment programme (SAP), the state govern-ment was pressured to reduce expenditures and introduce economic reforms. Naidu cut subsidies and welfare programmes, which especially benefitted the poor, and instead focused on attracting foreign investments in tertiary industries such as infor-mation technology, biotechnology, finance, and banking (Das 2015, p. 51; Kennedy and Zérah 2008, p. 113). Interestingly, Naidu also began travelling to search for and learn from experiences elsewhere in the world and was especially impressed by the recent development projects in Singapore and Malaysia, especially the Multimedia Super Corridor (MSC) near Kuala Lumpur (Das 2015, p. 51).
Deeply inspired by these neoliberal programmes, Naidu initiated a plan for the development of a “knowledge enclave” in Hyderabad, known as “HITEC City” (Hyderabad Information Technology and Engineering Consultancy City). The com-pletion of the “Cyber Towers” in 1998 has been seen as a first major landmark in the creation of a “world-class city”. With the increasing demand and the given incentives, more such intelligent buildings were constructed. Das argues that the “policy initia-tives of creating HITEC City provided a boost to Hyderabad’s urbanisation, and spawned massive developments of gated residential apartments, ‘intelligent’ offices and shopping malls around the HITEC City area” (Das 2015, p. 51; Kennedy and Zérah 2008, p. 113f).
In 1999, endorsed by the success of the reforms and new policy initiatives, a visionary document was created, the “Andhra Pradesh Vision 2020”, formulated in
3.4 The Case Study: The Megacity Hyderabad
78
close consultation with the consultancy company McKinsey. Largely inspired by the Malaysian Vision 2020, it laid out a state development strategy with Hyderabad being anticipated as an engine of growth. With a vision of leapfrogging towards becoming an information society, the emphasis was laid on the development of the service sector and a further attraction of foreign direct investments in IT and related services, biotechnology, tourism, logistics, healthcare, and educational services. Investments in premium urban infrastructure and the promotion of high-tech knowl-edge enclaves provided the required incentives and proper conditions for domestic and international companies to invest and establish their services in Hyderabad. Two additional policy initiatives in 2002 and 2005 even further raised the incentives for IT-related and other firms, and the hype on the success of Hyderabad was glar-ing, similarly as in Bangalore (Das 2015: 51; Iyer et al. 2007: 9ff).
This dominant service sector orientation has not stopped the industrial sector from growing; however it has become more concentrated on the periphery of the city. And today, both the Hyderabad Metropolitan Development Plan 2031 and the first Socio-Economic Outlook 2015 of the new Telangana Government underline the importance of a balance between the service sector and industrial development. Especially the new Telangana government puts an emphasis on restrengthening the role of industrial development too, with Hyderabad as “growth engine” (Government of Telangana 2015, p. 6). The trend towards containment of industries on the urban fringe of the city has made it necessary to improve land-use planning and gover-nance in the peri-urban area. This is one reason also for the spatial restructuring made in 2008 and in smaller steps later on (Das 2015, p. 51) as will be outlined in the following.
3.4.3 Administration and Urban Spatial Restructuring
Hyderabad is the capital of the newly formed state of Telangana, which has sepa-rated from the state of Andhra Pradesh in June 2014. As an interim solution, it will function as capital for both states for the following 10 years after separation.8 There are two major urban administrative bodies in Hyderabad, the planning authority, before 2007 known as Hyderabad Urban Development Authority (HUDA), and the municipality, formerly known as Hyderabad Municipal Corporation (HMC). While the planning authority is in charge of coordination and urban zonal planning (Hyderabad Master Plan), the municipal corporation coordinates and manages all basic urban services. In April 2007, the planning agency Hyderabad Urban Development Authority (HUDA) and the Hyderabad Municipal Corporation (HMC) expanded their sphere of influence to cover a greater area. Through integrating the formerly 12 independent surrounding municipalities, HMC (formerly 175 km2) became the Greater Hyderabad Municipal Corporation (GHMC) that now covers an
8 The main research of this study has been conducted between 2009 and 2012. All references to Andhra Pradesh in this study connote to the erstwhile undivided state of Andhra Pradesh (AP).
3 The Research Context: India and the Megacity of Hyderabad

79
area of 650 km2 (about as large as the former HUDA region) with a population of about 6.7 million people in 2007. GHMC is the local urban government of Greater Hyderabad that includes 12 municipalities and 8 gram panchayats (village coun-cils). Its area of 650 km2 is larger than the municipalities of Mumbai, Chennai, or Bangalore. It is divided into five zones (south, east, north, west, and central). Each zone is subdivided into circles and wards, with the ward being the smallest admin-istrative unit. A ward usually contains a population of about 37,000 people. At the same time in 2007, HUDA was transformed into the Hyderabad Metropolitan Development Authority (HMDA) and reaches out into areas that are far beyond influence of GHMC – more than ten times the area of GHMC – with about 7,228 km2. Hyderabad Metropolitan Area has thereby become the second largest urban region in India after Bangalore (Das 2015, p. 53).
3.4.4 Hyderabad as Symbolic Representation of “World-Class” Infrastructure Development
As outlined above, Hyderabad serves as a globally connected hub for economic development and employment for a larger region, which was formerly dominated by agriculture and in quite large parts of the region remains relatively backward in terms of economic development. Politically, the city has been envisioned as an engine of growth for the region, and through an advanced neoliberal economic reform policy of the last two decades, the city has successfully become attractive for domestic as well as international corporations to invest in and to operate their busi-nesses and services from this city. Not only due to these newly gained job opportu-nities, but also because of the still relatively affordable real estate prices compared to Delhi and Mumbai, Hyderabad offers quite favourable living conditions, espe-cially for rather well off professionals and their families. Also in terms of infrastruc-ture, the city has quite a lot to offer: the recently established and very efficiency-oriented international airport, which is well connected to the city through an expressway to Cyberabad and the outer ring road, underlines the image of a glob-ally well-connected cutting-edge city. A number of well-connected railway stations, a relatively well-functioning city road-infrastructure network, and the envisioned Hyderabad Metro Rail Project (HMP) accentuate this representation. Also in terms of quality of life, the city is perceived as attractive: the local climate in Hyderabad is quite pleasant compared to other cities in the country and a number of parks, beautiful hills with Hyderabad-specific granite rock formations, and several natural and artificial lakes offer favourable places for recreation within the city.
3.4 The Case Study: The Megacity Hyderabad
Related Documents