The Relationship of Three Cortical Regions to an Information-Processing Model John R. Anderson 1 , Yulin Qin 1 , V. Andrew Stenger 2 , and Cameron S. Carter 2 Abstract & This research tests a model of the computational role of three cortical regions in tasks like algebra equation solving. The model assumes that there is a left parietal region-of-interest (ROI) where the problem expression is represented and transformed, a left prefrontal ROI where information for solving the task is retrieved, and a motor ROI where hand movements to produce the answer are programmed. A functional magnetic resonance imaging (fMRI) study of an abstract symbol- manipulation task was performed to articulate the roles of these three regions. Participants learned to associate words with instructions for transforming strings of letters. The study manipulated the need to retrieve these instructions, the need to transform the strings, and whether there was a delay between calculation of the answer and the output of the answer. As predicted, the left parietal ROI mainly reflected the need for a transformation and the left prefrontal ROI the need for retrieval. Homologous right ROIs showed similar but weaker responses. Neither the prefrontal nor the parietal ROIs responded to delay, but the motor ROI did respond to delay, implying motor rehearsal over the delay. Except for the motor ROI, these patterns of activity did not vary with response hand. In an ACT-R model, it was shown that the activity of an imaginal buffer predicted the blood oxygen level-dependent (BOLD) response of the parietal ROI, the activity of a retrieval buffer predicted the response of the prefrontal ROI, and the activity of a manual buffer predicted the response of the motor ROI. & INTRODUCTION As exemplified by the classic research of Sternberg (1969), information-processing models have frequently been used to predict latency. They postulate a series of cognitive components like memory retrieval and motor programming that are involved in the performance of a task and offer theories about the factors that control how long these components take. Brain imaging re- search has tried to identify brain regions that instantiate such components and has studied how the activation of these regions varies with manipulations of complexity. This article will describe how to bring these two tradi- tions together in precise models. It will describe an information-processing model developed within the ACT-R cognitive architecture (Anderson & Lebiere, 1998) for a symbol-manipulation task and how that model was used to predict both latency data and the blood oxygen level-dependent (BOLD) response ob- tained in an functional magnetic resonance imaging (fMRI) study. By combining the two data sources, we obtained much greater guidance in the development of cognitive models. In particular, we will show that given an association of components of a cognitive architecture with brain regions and given a model fit to latency data, it is possible to make a priori predictions about the BOLD response in these regions. This model-development methodology is not unique to the ACT-R theory nor are the conclusions. The methodology can be applied to any well-specified architecture and we believe that it would force convergence among different cognitive architectures in terms of the characterizations they give of the cognitive processes involved in the performance of a task. We also suspect that the methodological program, if successful, would help bring some conver- gence in the brain-imaging literature as to the function of different brain regions. This article will begin with a brief description of the ACT-R architecture and the associations of components of that architecture with brain regions. Then it will describe a new experiment that was motivated to test some predictions that followed from these associations. After describing this experiment and its results, the article will describe a model that we developed for this task and how the development of an accurate model was informed by the results of the imaging study. The ACT-R 5.0 Architecture and the BOLD Response Figure 1 illustrates the basic architecture of ACT-R 5.0. There are a set of ‘‘modules’’ devoted to processes like 1 Carnegie Mellon University, 2 University of Pittsburgh © 2004 Massachusetts Institute of Technology Journal of Cognitive Neuroscience 16:4, pp. 637–653

Welcome message from author
This document is posted to help you gain knowledge. Please leave a comment to let me know what you think about it! Share it to your friends and learn new things together.
Transcript

The Relationship of Three Cortical Regions to anInformation-Processing Model
John R Anderson1 Yulin Qin1 V Andrew Stenger2 andCameron S Carter2
Abstract
amp This research tests a model of the computational role ofthree cortical regions in tasks like algebra equation solving Themodel assumes that there is a left parietal region-of-interest(ROI) where the problem expression is represented andtransformed a left prefrontal ROI where information for solvingthe task is retrieved and a motor ROI where hand movementsto produce the answer are programmed A functional magneticresonance imaging (fMRI) study of an abstract symbol-manipulation task was performed to articulate the roles ofthese three regions Participants learned to associate wordswith instructions for transforming strings of letters The studymanipulated the need to retrieve these instructions the needto transform the strings and whether there was a delay
between calculation of the answer and the output of theanswer As predicted the left parietal ROI mainly reflected theneed for a transformation and the left prefrontal ROI the needfor retrieval Homologous right ROIs showed similar butweaker responses Neither the prefrontal nor the parietal ROIsresponded to delay but the motor ROI did respond to delayimplying motor rehearsal over the delay Except for the motorROI these patterns of activity did not vary with response handIn an ACT-R model it was shown that the activity of an imaginalbuffer predicted the blood oxygen level-dependent (BOLD)response of the parietal ROI the activity of a retrieval bufferpredicted the response of the prefrontal ROI and the activity ofa manual buffer predicted the response of the motor ROI amp
INTRODUCTION
As exemplified by the classic research of Sternberg(1969) information-processing models have frequentlybeen used to predict latency They postulate a series ofcognitive components like memory retrieval and motorprogramming that are involved in the performance of atask and offer theories about the factors that controlhow long these components take Brain imaging re-search has tried to identify brain regions that instantiatesuch components and has studied how the activation ofthese regions varies with manipulations of complexityThis article will describe how to bring these two tradi-tions together in precise models It will describe aninformation-processing model developed within theACT-R cognitive architecture (Anderson amp Lebiere1998) for a symbol-manipulation task and how thatmodel was used to predict both latency data and theblood oxygen level-dependent (BOLD) response ob-tained in an functional magnetic resonance imaging(fMRI) study By combining the two data sources weobtained much greater guidance in the development ofcognitive models In particular we will show that givenan association of components of a cognitive architecturewith brain regions and given a model fit to latency data it
is possible to make a priori predictions about the BOLDresponse in these regions This model-developmentmethodology is not unique to the ACT-R theory norare the conclusions The methodology can be applied toany well-specified architecture and we believe that itwould force convergence among different cognitivearchitectures in terms of the characterizations they giveof the cognitive processes involved in the performanceof a task We also suspect that the methodologicalprogram if successful would help bring some conver-gence in the brain-imaging literature as to the functionof different brain regions
This article will begin with a brief description of theACT-R architecture and the associations of componentsof that architecture with brain regions Then it willdescribe a new experiment that was motivated to testsome predictions that followed from these associationsAfter describing this experiment and its results thearticle will describe a model that we developed for thistask and how the development of an accurate model wasinformed by the results of the imaging study
The ACT-R 50 Architecture and the BOLDResponse
Figure 1 illustrates the basic architecture of ACT-R 50There are a set of lsquolsquomodulesrsquorsquo devoted to processes like1Carnegie Mellon University 2University of Pittsburgh
copy 2004 Massachusetts Institute of Technology Journal of Cognitive Neuroscience 164 pp 637ndash653
identifying objects in the visual field controlling thehands retrieving information from declarative memoryor keeping track of current goals and intentions Thereis a central production system that is not sensitive tomost of the activity in these modules but rather can onlyrespond to information that is deposited in the lsquolsquobuf-fersrsquorsquo of these modules For instance people are notaware of all the information in the visual field but onlythe object they are currently attending to Similarlypeople are not aware of all the information in long-termmemory only the fact currently retrieved Each modulemakes this information available as a chunk (an ACT-Rdeclarative structure) in a buffer As illustrated in Figure 1the core production system can recognize patterns inthese buffers and make changes to these buffersmdashas forinstance when it makes a request to perform an action inthe manual buffer In the terms of Fodor (1983) theinformation in these modules is largely encapsulated andthey communicate only through the information theymake available in their buffers
This article will be principally focused on three buff-ers The first buffer is an imaginal buffer that holds therepresentations of problems like mental images ofequations while operations are being performed onthese problems In line with other work (DehaenePiazza Pinel amp Cohen 2003 Reichle Carpenter amp Just2000) we found evidence for this buffer in the leftposterior parietal cortex The second buffer holds infor-mation retrieved from declarative memory and is asso-ciated with a portion of the left prefrontal cortex acrossBA 45 and BA 46 (a similar region has been reported by anumber of investigators Cabeza Dolcos Graham ampNyberg 2002 Donaldson Petersen Ollinger amp Buck-ner 2001 Fletcher amp Henson 2001 Wagner MarilBjork amp Schacter 2001 Wagner Pare-Blagoev Clark amp
Poldrack 2001 Lepage Ghaffar Nyberg amp Tulving2000 Buckner Kelley amp Peterson 1999) The third isthe manual buffer which is responsible for program-ming and execution of hand movements It is associatedwith the region of the left motor cortex that controlsright-hand movements (Roland Larsen Lassen amp Skin-hoj 1980)
Anderson Qin Sohn Stenger and Carter (2003)performed a study of two algebraic tasks that served totest certain components of the architecture The firstexperiment involved solution of real algebraic equationslike 3x + 5 = 23 The second motivated in part to showthat the imaging results did not depend on the involve-ment of arithmetic used an artificial string transforma-tion task that preserved many of the formal properties ofalgebra but did not involve arithmetic ACT-R models(Anderson Reder amp Lebiere 1996 for real algebraBlessing amp Anderson 1996 for artificial algebra) alreadyexisted for these two tasks These models were updatedto correspond to ACT-R 50 and to generate predictionsabout the fMRI signal As we will describe later it ispossible to generate predictions for the exact form ofthe BOLD responseWe found left parietal prefrontaland motor regions whose BOLD responses corre-sponded to the predictions derived from the ACT-Rmodel In this article we will work with three prespeci-fied regions-of-interest (ROIs) based on the ROIs fromthis earlier study Each region was 5 voxels wide 5 voxelslong and 4 voxels deep (approximately 16 pound 16 pound13 mm) and was centered at or near the center of theregions found by Anderson et al To explore the later-ality of these effects we also looked at prespecified 100-voxel ROIs in the right hemisphere obtained by justswitching the sign of the x coordinate Thus our pre-specified ROIs are
Figure 1 The organization ofinformation in ACT-R 50
638 Journal of Cognitive Neuroscience Volume 16 Number 4
1 Parietal centered at (x = plusmn 23 y = iexcl64 z = 34)covering Brodmannrsquos areas 39 and 40 at the intraparietalsulcus
2 Prefrontal centered at (x = plusmn 40 y = 21 z = 21)covering Brodmannrsquos areas 45 and 46 around theinferior frontal sulcus
3 Motor centered at (x = plusmn 37 y = iexcl25 z = 47)covering Brodmannrsquos areas 3 and 4 at the central sulcus
The advantage of working with predefined regions suchas these is that we can perform more powerful statisticaltests because we do not have to correct for the kind offalse positives that can occur in exploratory analyses Wewill have specific regions and specific predictions aboutthe responses found in these regions Indeed it makesthe logic of our statistical tests identical to the logic usedon behavioral measures like latency and accuracy Wehave just added six additional dependent measurescorresponding to these six prespecified regions Becauseof this when we assess our model fits to the BOLDfunctions we do not have to worry about correcting forconfirmatory biases that would occur if we selectedregions because they happened to show the effectspredicted by the model
The Current Study
This study has a number of goals besides testing theearlier associations of these brain regions with specificinformation-processing components The first was toascertain better what the BOLD response reflects interms of the activity of the postulated bufffers Althoughwe assume that these regions hold a representation ofthe information in the corresponding buffer (prefrontalholds a representation of a retrieved fact motor arepresentation of a manual program parietal a repre-sentation of the problem state) our assumption is thatthe BOLD response reflects the processing required tochange the contents of the buffer (ie retrieve a newfact to place in the retrieval buffer produce a programfor the manual buffer transform the problem represen-tation in the imaginal buffer) Thus it should not matterhow long the information is held but rather how muchtime is spent transforming the information However inAnderson et al (2003) the duration of maintenance wasconfounded with number of changes To separate outthe effects of active transformations from passive hold-ing we introduced a delay during which participants hadto just hold the information According to the ACT-Rmodel regions like the prefrontal and parietal shouldnot be affected by this delay
A second goal was to assess the degree to which theseeffects are left lateralized Our original study that definedthe regions involved high school algebra which onemight assume is left lateralized The research reportedhere will use a more abstract symbol-manipulation taskthat might not have the same degree of lateralization It
will examine the behavior of the right homologues ofthe regions found in the Anderson et al (2003) study Inaddition to separate any effect of hand of respondinghalf of the participants (all right-handed) responded withtheir left hands and half responded with their right hands
Another goal was to more carefully separate retrievalfrom transformation In the past studies they wereconfounded because number of retrievals increased withnumber of transformations Here we wanted to performa study in which retrieval and transformation were moreindependently manipulated
A fourth goal was to minimize the effect of eyemovements The expressions used in the past researchwere rather large and subtended many degrees of visualangle In the current experiment we used a task inwhich all the critical information could be perceived inthe fovea
The experiment involved two phases In the firstphase (outside the magnet) participants memorizedinformation that they would use in the second phaseof the experiment that took place in the magnet Thematerial to be memorized involved associations betweentwo-letter words and two-digit numbers such as
AT 13 and BE 26
Then in the second phase of the experiment partic-ipants either saw these two-letter words or two-digitnumbers paired with permutations of the letters A B Cand D Table 1 illustrates the various conditions of theexperiment Participants were told that the two-digitcodes that they had learned were instructions fortransforming the four-letter sequences Thus 13 meansthat the first and third letters should be reversedApplied to CDAB it would produce ADCB Some two-digit codes are lsquolsquono-opsrsquorsquo such as 26 because one of thedigits is greater than 4 and so in this case does notrequire a transformation The difference between no-opdigit pairs and ones that require an operation is referredto as the transformation factor in Table 1 andthroughout the article Participants can either be giventhe digit pair directly in which case no retrieval isrequired or be given a word from which they have toretrieve the digit pair The requirement to perform thisretrieval is referred to as the substitution factor inTable 1 and throughout the article because it requiredthe participant to substitute the digit for the word
Table 1 Illustration of the Four Conditions of the Experiment(Assuming AT Is Associated to 13 and BE to 26)
NoTransformation
YesTransformation
No substitution Stimulus CDAB 26Response CDAB
Stimulus CDAB 13Response ADCB
Yes substitution Stimulus CDAB BEResponse CDAB
Stimulus CDAB ATResponse ADCB
Anderson et al 639
Figure 2 illustrates the scanning procedure for theexperiment Each trial lasted 24 sec and consisted of 2012-sec scans During the first 12 sec an asterisk ap-peared Then the letter string with a number or wordinstruction below appeared until the participant presseda thumb key indicating that they were ready to key theanswer (the letters A B C and D were mapped to indexbig ring and small fingers) The time to press the thumbkey is our most important behavioral measure reflectingthe time to comprehend the instruction and plan theresponse When the thumb key was pressed the letterstring disappeared and the participant either would haveto wait 4 sec before keying out the answer or couldrespond immediately The choice of immediate or delaywas randomly determined from trial to trial When theprompt to respond appeared they had to key out theirletters quickly and so had to have the response sequencepreplanned
Thus the fundamental design of the experiment wasa 2 pound 2 pound 2 pound 2 pound 20 design with choice of responsehand a between-participant variable and the within-participant variables being whether a delay was in-volved whether a transformation was involved whetherretrieval of a paired associate was required and scan(20 values)
Predictions
The following were our predictions for the experiment
1 The parietal ROI would show a stronger effect oftransformation than substitution since transformationrequires more substantial changes to the problemrepresentation
2 The prefrontal ROI would show a stronger effect ofsubstitution than transformation since substitution isassociated with greater retrieval requirements
3 The prefrontal ROI would show no response in theno-substitution no-transformation condition because no
retrieval is required but the parietal region would showa substantial effect because it is still necessary to buildup a representation of the problem
4 Neither the prefrontal nor the parietal ROI wouldshow an effect of delay
5 Neither the prefrontal nor parietal ROI would beaffected by the choice of response hand but thedominant motor ROI should switch hemispheres ac-cording to the response hand
6 Anchored for time of response the motorregion would not show an effect of substitution ortransformation
We did not have a priori predictions as to what regionwould show an effect of delay
RESULTS
Behavioral Results
Figure 3A shows the mean latencies of the thumb press(our measure of planning time) as a function of condi-tion and Figure 3B shows the mean times for each of thesubsequent key presses separately for delay and nodelay Response hand had no significant effect on anykey time With respect to planning time participantsshow significant effects of transformation F(120) =7870 p lt 0001 SEM = 396 and of substitutionF(120) = 15660 p lt 0001 SEM = 158 but nointeraction between the two F(120) = 47 SEM = 10Note that the time in the substitution no-transformationcondition (421 sec) is close to the time in the no-substitution transformation condition (434 sec) There-fore differences between these conditions in BOLDresponse are unlikely to be due to total time Withrespect to subsequent keying times participants averagewell under a half a second per key indicating that theymust have planned their responses as instructed Thesekeying times show an effect of key indicating a basic
Figure 2 The 24-sec structureof an fMRI trial It is assumedthat the word lsquolsquowersquorsquo isassociated with 34
640 Journal of Cognitive Neuroscience Volume 16 Number 4
speedup F(360) = 5447 p lt 0001 SEM = 012 asthey progress through the keying sequence In themodel times are slower for key 1 (first key of the answerafter the thumb key) because participants must wait forthe answer prompt to respond The ACT-R predictionsin the Figure 3B are a priori predictions based on thetimes for its perceptual-motor components There isalso a significant effect of delay F(120) = 1597p lt 001 SEM = 021 and a significant delay by keyinteraction F(360) = 1184 p lt 0001 SEM = 006 Themodel is faster for the first key of the answer with a delaybecause it can use the delay between the thumb key andthe answer prompt to prepare to respond There is also asignificant effect of substitutionF(120) = 1983 p lt 001SEM = 0031 and a significant delay by substitution
interaction F(120) = 1192 p lt 01 SEM = 002Participants are 6 msec slower to key in the substitutioncondition when there is delay and 28 msec when there isnot These effects are miniscule compared to the over1 sec effect of substitution on planning time
The Posterior Parietal Regions
Figure 4 reports the effects of substitution transforma-tion and delay on the BOLD response in the left andright parietal regions These curves take as baseline theaverage of Scans 1 and 2 (before the response begins torise) and Scan 20 (by which time it has returned tobaseline) Each point is defined as the percent rise abovethis baseline We performed an analysis of the degree to
Figure 3 (A) Mean latenciesfor a thumb press as a functionof whether a transformation ora substitution was required (B)Mean interkey times for thesubsequent four keys as afunction of whether there is adelay or not The solid linesindicate the predictions ofACT-R and the dotted linesindicate the data
Anderson et al 641
Figure 4 Effect of mainfactors on the BOLDresponse in the left andright parietal regions(A) substitution (B)transformation (C) delay
642 Journal of Cognitive Neuroscience Volume 16 Number 4
which the curves defined by Scans 3ndash19 rose above thebaseline which we measured as the area under the curveThere was no difference between left and right respond-ing participants F(120) = 06 SEM = 2477 or betweendelay and no delay F(120) = 43 SEM = 100 Howeverthe left side responds significantly more than the rightF(120) = 834 p lt 01 SEM = 615 the responses risemore when there is a transformation than not F(120) =2667 p lt 0001 SEM = 89 and more when there is asubstitution than not F(120) = 2490 p lt 0001 SEM =89 There was one significant interaction and onemarginally significant interactionmdashhemisphere by substi-tution F(120) = 931 p lt 01 SEM = 46 and hemi-sphere by transformation F(120) = 429 p = 05 SEM =43 Both of these interactions reflect the fact apparentin Figure 4 that the effects are stronger in the lefthemisphere However note that while the left hemi-sphere reflects both effects there is only an effect oftransformation and not an effect of substitution in theright hemisphere
The fact that there was no effect of hand or of delayconfirms the predictions about this region The BOLDresponse in this region seems to reflect changes to the
problem representation and not the duration that thisrepresentation must be held Once the solution hasbeen obtained it is not affected by downstream factorslike delay or response hand We also had predicted thatthis region would show a larger effect of transformationthan substitution Comparing Figure 4A and B one seesthat at peak transformation has a larger effect thansubstitution but the substitution effect maintains itselflonger resulting in an equivalent difference in areabetween the substitution and no-substitution curves inFigure 4A and between the transformation and no-transformation curves in Figure 4B A test looking atthe differences in the heights of the two curves betweenscans 5 and 10 where they peak does find the differ-ence between transformation and no transformationsignificantly greater than the difference between substi-tution and no substitution t(21) = 254 p lt 01
The Prefrontal Regions
Figure 5A shows the results for the left prefrontal regioncollapsing over delay Our prediction was that thisregion would show no rise in the condition of no
Figure 5 The BOLDresponses for the left prefrontalregion (A) each conditionwith its own baseline(B) the no-transformationno-substitution conditionserving as the baseline
Anderson et al 643
Figure 6 Effect of mainfactors on the BOLDresponse in the leftand right prefrontal(A) substitution(B) transformation(C) delay
644 Journal of Cognitive Neuroscience Volume 16 Number 4
substitution and no transformation It would seem thatour predictions have been exceeded in that there is adip in this condition that seems to begin after the othercurves have peaked The other curves also seem to dip atbelow baseline Anderson et al (2003) found some sug-gestion for negativity in the prefrontal response butnothing so strong as this Actually only half of the partic-ipants show this negative effect (5 left-responding and 6right-responding) For purposes of model fitting we havechosen to adopt the no-substitution no-transformationcondition as reflecting baseline (zero) and to plot differ-ences from thisThis is theway Figure 5b plots the data andit shows that there are systematic differences among theother conditions relative to this baseline Subsequentanalyses will work with transformed BOLD responses asin Figure 5b We think the negativity in Figure 5a reflectssome other process that occurs after the offset of the trialand viewFigure 5b as reflecting the real process of interestThe statistical tests reported below have identical resultsfor the transformed and pretransformed data The pur-pose of the transformation was to extract the criticalcomponent for later model fitting
Figure 6 displays the main effects of each factor usingthe recalculated BOLD responses for the left and rightprefrontal regions Again we performed an analysis ofthe degree to which the curve defined by Scans 3ndash19rose above the baseline or the area under the curveThere was no difference between left and right respond-ing participants F(120) = 108 SEM = 1017 orbetween delay and no delay F(120) = 040 SEM =348 The left side responds more than the right andthis is marginally significant F(120) = 353 p lt 10SEM = 288 The effect of substitution is significant
F(120) = 898 p lt 01 SEM = 320 but not the effectof transformation F(120) = 135 SEM = 104 aspredicted However there is a significant region bytransformation interaction F(120) = 609 p lt 05SEM = 036 reflecting the fact that the left but notthe right seems to respond to transformation The inter-action between region and substitution is marginally sig-nificant F(120) = 396 p lt 1 SEM = 070 Theseinteractions may just reflect the greater sensitivity of theleft prefrontal region to manipulationsThere are no othersignificant interactions The prediction of a greater effectof substitution than transformation seems confirmed Acontrast comparing the substitution no-transformationcondition with the transformation no-substitution condi-tion is significant t(21) = 229 p lt 05
The Motor Regions
Figure 7 displays the average response of the left andright motor regions for the left and right respondingparticipants As would be expected those participantswho respond with their right hand show a large effectin the left motor cortex and those participants whorespond with their left hand show a large effect in theirright motor cortex There is a suggestion of an interac-tion in the other hemisphere such that the BOLDresponse rises a little in the left hemisphere for partic-ipants responding with their left hands while it drops alittle in the right hemisphere for participants respond-ing with their right hands
The graphs to this point are stimulus-locked in thatthey begin with the onset of the stimulus However inthe case of the motor regions it would be more infor-
Figure 7 Stimulus-lockedBOLD responses in the left andright motor regions forparticipants responding withthe left and right hands
Anderson et al 645
mative to do a response-locked analysis where time zerowas set to be when participants emitted their responseFigure 8 shows the data plotted this way with 5 scansbefore the response scan and the 14 scans after Thebaseline for these graphs are taken as the first threescans The BOLD response is beginning to rise even onthe scan before the response indicating some prepara-tory motor behavior
We performed an analysis of the degree to which thecurve defined by scans iexcl2 to 14 rose above the baselinedefined by scans iexcl5 to iexcl3 For purposes of analysis anddisplay in Figure 8 we classified the left hemisphere forthe right-responding participants as the major hemi-sphere and the right as the minor this labeling wasreversed for the left-responding participants There wasno difference between left and right-responding partic-ipants F(120) = 93 SEM = 2924 but there was largedifference between the major and minor hemispheresF(120) = 10146 p lt 0001 SEM = 1698 There wasalso an interaction between response hand and hemi-sphere F(120) = 552 p lt 05 SEM = 1698 reflectingthe fact that the two minor hemispheres react oppositelyas noted with respect to Figure 7 As predicted there is nosignificant effect of transformation F(120) = 177 SEM =243 or substitution F(120) = 014 SEM = 1433There is however a strong effect of delay F(120) =2238 p lt 0001 SEM = 399 which was not predictedThere is also a significant interaction between delay andregion F(120) = 9922 p lt 0001 SEM = 308 whichreflects that delay only has an effect on the major hemi-sphere There are no other significant interactions
Confirmatory Analyses Summary
By way of summary whereas the prefrontal and parietalresponses are strongly left lateralized there are weakerresponses in the homologous right-hemisphere regionsAs predicted the prefrontal region was more sensitive tosubstitution reflecting its role as a retrieval region Theparietal region is more sensitive to transformation thansubstitution in its peak response but not in its total areaInterestingly in both cases the right hemisphere onlyresponded to the hypothesized more important factor(transformation in the case of the parietal region andsubstitution in the case of the prefrontal region) whilethe left hemisphere responded to both but morestrongly to the more important factor Both prefrontaland parietal regions respond to actual information-processing engagement and not just time and so nei-ther was sensitive to delay Unexpectedly the motorregion did respond to delay suggesting that peoplewere rehearsing their motor responses over the delayIn addition the fact that the motor region started to risebefore the overt response indicates anticipatory motorpreparation before the thumb press We used thisbehavior of the motor region to tune our model forthis task
Fit of the ACT-R Model to the BOLD Responses
Figure 9 illustrates the behavior of the ACT-R model inthe most complex condition of the experiment whichinvolves substitution transformation and delay Initiallya representation of the string is built up in the imaginalbuffer Then the word command (AT) is encoded and itsnumber representation is retrieved from declarativememory This number 14 is added to the imaginalrepresentation and then the letters in the critical posi-tions (in the example D in first position and B in fourthposition) are committed to temporary memory to guidethe transformation of the string in declarative memoryThen the motor program for transmitting the string isencoded or rehearsed a thumb key is pressed themotor program is rehearsed during the delay and thenthe four fingers pressed at the end of the delay Thisdiffers from the ACT-R model we initially proposedbefore the imaging study as that model did not includemotor rehearsal before the thumb press or during thedelay Guided by the BOLD response in the motorregion we assumed the four keys were being rehearsedbefore the thumb press and an average of five keys wererehearsed in the interval The addition of these motorrehearsals is an example of how imaging can informmodel development
Besides these rehearsals two parameters were esti-mated for the model in advance of trying to fit the BOLDresponses The retrieval of the paired associate wasestimated at 79 sec and the encoding and retrieval ofthe critical letters at 54 sec These parameters wereestimated to fit the behavioral data in Figure 3A None ofthe other process times were estimated but all comefrom prior values in the ACT-R architecture In particu-lar the imaginal transformations take 2 sec and each ma-nual step (rehearsal or key press) takes 3 sec The 3 secfor the manual step come from the well-establishedmotor module in ACT-R (which is derived from Meyeramp Kierasrsquos 1997a 1997b EPIC theory) The 2 sec for theimaginal transformations comes from a generalization ofthe parameters in ACT-Rrsquos visual module for encoding anobject This value was used in Anderson et al (2003)With the processes in Figure 9 and their durations set itis possible to predict BOLD responses for the threeprespecified regions
Predicting the BOLD Response
Anderson et al (2003) proposed that whenever anactivity takes place to change the content of one ofthe ACT-R buffers there is an increased hemodynamicdemand and it is this hemodynamic demand that drivesthe BOLD response in the corresponding cortical re-gion We developed a precise proposal for how thelength of activity of a buffer mapped onto the predictedBOLD response in fMRI A number of researchers (egCohen 1997 Dale amp Buckner 1997 Boyton Engel
646 Journal of Cognitive Neuroscience Volume 16 Number 4
Figure 8 Effect of mainfactors on the BOLDresponse (response-locked)in the left and right motorregions (A) substitution(B) transformation (C) delay
Anderson et al 647
Glover amp Heeger 1996) have proposed that the BOLDresponse to an event varies according to the followingfunction of time t since the event
Bhelliptdagger ˆ t aeiexclt
where estimates of the exponent a have varied between2 and 10 This is essentially a gamma function that willreach maximum a time units after the event Weproposed that while a buffer is active it is constantlyproducing a change that will result in a BOLD responseaccording to the above function The observed fMRIresponse is integrated over the time that the buffer isactive Therefore the observed BOLD response will varywith time as
CBhelliptdagger ˆ MZ t
0ihellipxdaggerB t iexcl x
s
plusmn sup2dx
where M is the magnitude scale for response s is thelatency scale and i(x) is 1 if the buffer is occupied attime x and 0 otherwise Note that because of the latencyscale factor the prediction is that the BOLD responsewill reach maximum at roughly t = a pound s sec
The peak of the BOLD function reflects roughly whenthe buffer was active but is offset because of the lag inthe hemodynamic response The height of the BOLDresponse reflects the duration of the event since theintegration makes the height of the function approxi-mately proportional to duration over short intervalsWhile this relationship is only approximate for theheight of the function the total area under the curvewill be precisely proportional to the total time that thebuffer is active If a buffer is active for a total periodof time T the area under the BOLD response will beM pound s pound iexcl(a+1) pound T where iexcl is the gamma function (inthe case of integer a note that iexcl(a+1) = a)
Thus we can use the length of duration of the bufferactivities in Figure 9 to generate exact predictions for theBOLD responses in each of the prespecified ROIs for eachof the experimental conditions In making these predic-tions we have to estimate three parameters that determinetheexact shapeof theBOLDresponse the latency scale (s)the exponent (a) and the magnitude (M) These param-eters are estimated to minimize the squared deviationsbetween the observed and predicted BOLD functionsWhile these parameters determine the exact shape of theBOLDresponse theydonotchange thepredictionthat thearea under the BOLD function is proportional to the timethe buffer is active Thus given a commitment to timing ofactivity in a buffer across conditionsof the experiment themodel is committed to predictions about the relativeareasunder the BOLD functions for the different conditions inthecorrespondingbrainregionAs thetimingissettofit thebehavioral data predictions for therelativeBOLDfunctionareas become parameter-free predictions of the theory
Some strong assumptions underlie the application ofthis methodology One is that the BOLD response is
exactly described by a gamma function Another is thatthe effect of repeated use of a buffer is additive A third isthat the only thing reflected in the activity of a particularregion is the behavior of the assumed buffer We willreturn to discussing issues involving each of these as-sumptions at the end of the article
Note that this analysis does not reflect a frequentassumption in the literature (eg Just Carpenter ampVarma 1999) that a stronger BOLD signal reflects ahigher rate of metabolic expenditure Rather the as-sumption is that it reflects a longer duration of increasedmetabolic expenditure The two assumptions are rela-tively indistinguishable in the BOLD functions they pro-duce but the time assumption more naturally maps ontoan information-processing model that assumes stagestaking different durations of activity Since these pro-cesses are going to take longer they will generate higherBOLD functions without making any extra assumptionsabout different rates of metabolic expenditure
The mathematics in this analysis is basically the sameas what underlies the frequent image-analysis techniqueof correlating the BOLD signal with the temporal profilecreated by convolving the trial structure with a hypo-thetical hemodynamic function Among the differenceselaborations are the following
1 The temporal structure generated by an ACT-Rmodel (or any information-processing model) is morefine grained generated from the internal operations ofdifferent components of the cognitive architecture
2 Each condition has a natural baseline defined bythe beginning of the trial before the BOLD response hasbegun to rise and the end of the trial after the BOLDresponse has come down hence there is no need tosubtract out some neutral control condition
3 There is the additional assumption that themagnitude of the response reflects the duration ofactivation of that component Combined with point (2)the theory becomes subject to strong parametric tests
4 There is an association of different regions of thebrain with different components of the cognitivearchitecture
5 One can estimate the parameters a and s of theBOLD function for a specific region rather than having tofit a single assumed BOLD function to all regions
With this mapping of activity of information-process-ing components onto BOLD functions one can derivepredictions from a cognitive model and test how wellthey fit the data Table 2 summarizes the various fitswhich we describe below
Figure 10A illustrates the ability of the imaginal bufferto predict the behavior of the left posterior parietalregion The overall quality of fit is good as indicatedby a correlation of 990 and a chi-square of 9059 with157 degrees of freedom (160 observations minus 3 pa-rameters)1 Figure 10A collapses over delay because thisdid not have an effect on the behavior of this region but
648 Journal of Cognitive Neuroscience Volume 16 Number 4
the fit is calculated to the data before collapsing Theheights of the curves reflect the numbers of visualoperations performed In the case of no substitutionor transformation four operations are required to en-code the letter string An additional operation is re-quired to encode the result of transforming the wordwhen substitution is required and two additional oper-ations are required to transform the equation in the caseof transformation As predicted the transformation no-substitution curve is higher than the no-transformationsubstitution condition
Figure 10B illustrates the ability of the retrieval bufferto predict the behavior of the left prefrontal region Asnoted earlier we have made the no-substitution no-transformation the baseline and so we are only predict-ing the other conditions Again because there is noeffect of delay Figure 10B averaged over that factor Theoverall fit is reasonable as indicated by a correlation of939 and a chi-square of 6821 with 117 degrees offreedom (120 observations minus 3 parameters) Themodel successfully predicts that the substitution no-transformation condition will be higher than the no-substitution transformation condition However thereis a suggestion of a deviation in the data Specifically themodel is underpredicting the height of these two curves(substitution no transformation and no substitutiontransformation) and overpredicting the height of thesubstitution transformation curve Thus even thoughthe behavioral data (Figure 3A) display additivity the
BOLD responses may not The actual deviation fromadditivity is only marginally significant t(21) = 186 p lt10 in a test of whether the area under the substitutionno-transformation curve and the area under the no-substitution transformation curve add to the area underthe substitution transformation curve
Figure 10C illustrates the ability of the manual bufferto predict the behavior of the major motor regionmdashleftmotor cortex for right-responding participants and rightmotor cortex for left-responding participants This anal-ysis is response-locked and Figure 10C collapses over
Figure 9 The approximatetime line for the buffer activityin the ACT-R model
Table 2 Summary of Fits to Various Brain Regions
Parietal Prefrontal Motor
Scale (sec) 1837 1554 0862
Exponent (a) 2412 2217 5160
Magnitude M iexcl(a+1) 2219 1319 1502
Chi-square 9060 6822 32842
Correlation 986 913 971
This is a more meaningful measure since the height of the function isdetermined by the exponent as well as M157 degrees of freedom except for the prefrontal which has 117since the no-transformation no-substitution condition was defined asthe zero baselineCorrelation with all 160 observations (rather than with the collapseddata in Figure 10)
Anderson et al 649
Figure 10 Predicted andobserved BOLD functions(A) posterior parietal ROI(B) prefrontal ROI and(C) motor ROI Solid linesare the predictions of theACT-R model
650 Journal of Cognitive Neuroscience Volume 16 Number 4
the factors of substitution and transformation which didnot have significant effects It assumes that there arenine events in the manual buffer in the no-delay condi-tion (four encodingrehearsals of key presses and fivefinger presses) while there are five additional rehearsalevents in the delay condition As noted earlier theassumption of motor rehearsal was not part of ouroriginal model but was suggested by the data Whilethe overall fit of the model is good as indicated by thecorrelation (r = 977) the chi-square measure (32842with 157 degrees of freedom) indicates that there aresignificant points of discrepancy Looking at the curvesit can be seen where these are First the model doesnot rise above zero as quickly as the data This isparticularly apparent on the scan on which the responseis emittedmdashthe participantsrsquo BOLD response has risen10 while the model is still almost at zero On theother end the empirical BOLD response goes downmore rapidly and slightly undershoots zero where themodel predicts a more gradual approach to zero Thesedeviations suggest that use of the gamma function tomodel the shape of the BOLD response may not beexactly correct
This is the only BOLD function whose form revealssomething of the timing of the buffer actionsmdashin par-ticular in the delay condition The initial planning ofthe motor response produces the initial rise (and is thereason why in the model there is some rise even on theresponse scan) The rehearsal over the 4 sec maintainsthe height of the BOLD function The final execution ofthe response produces the second rise before thefunction goes back down to zero
DISCUSSION
The basic premise in this research is that we can map theduration of various components of an architecture likeACT-R onto the BOLD response obtained in variousregions The relative success in this article supports thispremise However it is worth noting some assumptionson which this effort depends and any signs that theseassumptions might have been somewhat stressed in thismodeling application
1 It depends on the assumption that the BOLDresponse reflects just the duration a component isoccupied and not the intensity of occupation Thisuniform-intensity assumption seemed to have workedappropriately in most cases
2 It also depends on the assumption that the BOLDresponse is additive across multiple events Again thishas proven to be a relatively successful assumption butthere was a suggestion that the BOLD response tosubstitution-plus-transformation in the prefrontal ROIwas less that the sum of the responses to substitutionand transformation individually While some peoplehave found that the BOLD response is additive (eg
Dale amp Buckner 1997 Boyton et al 1996) others havenot (eg Glover 1999)
3 A third assumption is that the BOLD response in aparticular area reflects at least for the current task only asingle postulated cognitive function As a general asser-tion this seems an improbable assumption but it mightbe true in specific tasks The place where we seemed tohave the most problem with this assumption in thecurrent task is in the prefrontal ROI where there seemeda postresponse negativity overlaid on the stimulus-lockedpositive response to retrieval demands In this case wehad a neutral condition to serve as a baseline that wecould subtract from the other BOLD responses As amethodological point it might be worthwhile to try tomaintain a condition that deletes all the cognitiveprocesses but retains simple stimulus and motorcomponents Such control conditions are typical of fMRIdesigns and this experience suggests that the currentapproach has not eliminated the utility of such a baseline
4 The approach depends on the assumption that thegamma function correctly characterizes the BOLDresponse We are able to parameterize the gammafunction differently for different regions to accommo-date regional differences However this approach stillassumes it is exactly a gamma function everywhere Onthe other hand there was evidence for deviations fromthe assumed form in certain regions such as a smallnegativity at the end of the function Others (egGlover 1999) have reported a small negative componentto the BOLD response and proposed modeling theBOLD response as the difference of two gammafunctions This would greatly complicate the modelingbut it is an approach that might be necessary
This methodology should be judged not as absolutelycorrect or wrong but rather as more or less fruitful Wethink it has proven relatively fruitful However oneneeds to remain mindful of the potential pitfalls in usingthe methodology
Given that the methodology was relatively successfulthis article does illustrate the interaction that is possiblebetween cognitive modeling and neuroimaging Pastresearch provided a priori hypotheses about the func-tion of specific brain regions interpreted in ACT-Rinformation-processing terms The results of this studyhave been to largely confirm these assumptions but notwithout consequence for the modeling enterprise Inparticular the behavior of the motor region (surely themost obvious of our associations) told us that covertmotor rehearsal was occurring This led us to incorpo-rate such rehearsal into our information-processingmodel With that elaborated model in hand we couldgo back and better understand the behavior of differentbrain regions
Finally we would like to reiterate and elaborate themajor assumption behind the prediction of the BOLDresponse in the ACT-R model We assume that the
Anderson et al 651
magnitude of the BOLD response reflects the duration oftime to change the representations in the buffers We donot assume that it reflects the duration of time that theserepresentations reside in the buffers At least with respectto the retrieval buffer (prefrontal) and the imaginal buffer(parietal) our assumptions seem supported It mightseem strange that there is no metabolic cost associatedwith maintaining information and actually our modelfitting does not require this assumptionWe are fitting riseof the BOLD response from base line If we assume thatthese regions have some asymptotic activation levels tomaintain information then we would expect to see no risefrom baseline just with maintenance that is a constantactivity What we see is the extra effort associated with thechanging of the information being represented Thus thekey assumption is that transitions in information repre-sentation require special effort and it is this effort that ourBOLD measure taps (change from baseline)
METHODS
Task and Procedure
The trial structure is illustrated in Figure 2 A trial beganwith a prompt which was an asterisk After 12 sec afour-letter string was presented above a two-digit num-ber or a two-letter word Participants were instructed toextract the instruction represented by that number orword and apply it to transforming the string Participantswere instructed to solve the problem mentally and pressthe thumb key when they were ready to key in the finalsolution upon which the problem in the first rectangledisappeared The thumb press provided a measure ofthe planning time If the plan time exceeded 108 secthe trial was scored as incorrect After the thumb pressthey either had to enter the answer or wait 4 sec If therewas a delay the word lsquolsquoDELAYrsquorsquo appeared in the rectan-gle for the response and participants could only beginresponding when the word disappeared Once theybegan entering their answer they had no more than10 sec to press a key for each of four symbols in theanswer This rapid responding was designed to preventparticipants from postponing transformations until theygave their response The letters A B C and D weremapped to their index big ring and little fingers in theresponse glove After the participants typed the answerthe correct answer appeared for 16 sec Then the screenwas blank for the remaining portion of the 24-sec trial
Prescan Practice
On the day before the scan day there was a prescansession in which participants memorized 12 pairs ofword-to-number correspondences (participants prac-ticed until they could produce three consecutive trialswithout any errors) practiced finger-to-key mappingsand practiced actual problem solving There were justtwo blocks (16 trials per block) of practice at the actual
problem solving This was just enough to familiarizeparticipants with the procedure before going into thescanner
Parametric Design
Four binary factors were manipulated First half of theparticipants responded with their right hands and halfresponded with their left hands The other factors werevaried within participants Half of the trials involved a4 sec delay and half did not Half of the trials presentedtwo-letter words and half presented two-digit numbersas instructions Half of the trials required a transforma-tion of the letter string and half did not These factorswere totally crossed to create 16 conditions The variouswithin-participant conditions occurred in random orderParticipants were tested in 65-min blocks in which tworepetitions of each of the eight within-participant con-ditions were tested in random order for a sequence of16 trials
Event-Related fMRI Scan
Event-related fMRI data were collected by using a single-shot spiral acquisition on a GE 3T scanner 1200 msec TR18 msec TE 708 flip angle 20 cm FOV 21 axial slices perscan with 32-mm thickness 64 pound 64 matrix (3125 pound3125 mm per pixel) with the AC-PC on the second slicefrom thebottom Images acquired were analyzed using theNIS (Neuroimaging Software) system (httpkraepelinwpicpittedunisindexhtml) Images first were real-igned using 12-parameter AIR (Woods Grafton HolmesCherry amp Mazziotta 1998) and then cross-registered to acommon reference brain by minimizing signal intensitydifference after which functional images were set to astandard mean intensity smoothed (6 mm FWHM 3-DGaussian kernel) and pooled across participants to im-prove signal-to-noise ratio
Participants
Participants were 22 right-handed members of theCarnegie Mellon University community (9 women)Their ages ranged from 18 to 24 years with an averageof 211 Half of the participants responded with theirright hands and half responded with their left hands
Acknowledgments
This research was supported by the NSF ROLE grant REC-0087396 to Anderson and Carter and career developmentaward KO2 MH01306 from NIMH
Reprint requests should be sent to John R AndersonDepartment of Psychology Carnegie Mellon University Pitts-burgh PA 15213 or via e-mail jacmuedu
The data reported in this experiment have been deposited inthe fMRI Data Center (httpwwwfmridcorg) The accessionnumber is 2-2003-114B4
652 Journal of Cognitive Neuroscience Volume 16 Number 4
Note
1 In calculating these chi-squares we divide the summeddeviations by the variance of the means calculated from thecondition by subject interaction
REFERENCESAnderson J R amp Lebiere C (1998) The atomic
components of thought Mahwah NJ ErlbaumAnderson J R Qin Y Sohn M-H Stenger V A amp
Carter C S (2003) An information-processing modelof the BOLD response in symbol manipulation tasksPsychonomic Bulletin and Review 10 241ndash261
Anderson J R Reder L M amp Lebiere C (1996)Working memory Activation limitations on retrievalCognitive Psychology 30 221ndash256
Blessing S B amp Anderson J R (1996) How people learnto skip steps Journal of Experimental PsychologyLearning Memory and Cognition 22 576ndash598
Boyton G M Engel S A Glover G H amp Heeger D J(1996) Linear systems analysis of functional magneticresonance imaging in human V1 Journal of Neuroscience16 4207ndash4221
Buckner R L Kelley W M amp Petersen S E (1999)Frontal cortex contributes to human memory formationNature Neuroscience 2 311ndash314
Cabeza R Dolcos F Graham R amp Nyberg L (2002)Similarities and differences in the neural correlates ofepisodic memory retrieval and working memoryNeuroImage 16 317ndash330
Cohen M S (1997) Parametric analysis of fMRI data usinglinear systems methods NeuroImage 6 93ndash103
Dale A M amp Buckner R L (1997) Selective averaging ofrapidly presented individual trials using fMRI HumanBrain Mapping 5 329ndash340
Dehaene S Piazza M Pinel P amp Cohen L (2003)Three parietal circuits for number processing CognitiveNeuropsychology 20 487ndash506
Donaldson D I Petersen S E Ollinger J M amp BucknerR L (2001) Dissociating state and item components ofrecognition memory using fMRI NeuroImage 13 129ndash142
Fletcher P C amp Henson R N A (2001) Frontal lobes and
human memory Insights from functional neuroimagingBrain 124 849ndash881
Fodor J A (1983) The modularity of the mind CambridgeMA MITBradford Books
Glover G H (1999) Deconvolution of impulse response inevent-related BOLD fMRI NeuroImage 9 416ndash429
Just M A Carpenter P A amp Varma S (1999)Computational modeling of high-level cognition andbrain function Human Brain Mapping 8 128ndash136
Lepage M Ghaffar O Nyberg L amp Tulving E (2000)Prefrontal cortex and episodic memory retrieval modeProceedings of the National Academy of Sciences USA97 506ndash511
Meyer D E amp Kieras D E (1997a) A computational theoryof executive cognitive processes and multiple-taskperformance Part 1 Basic mechanisms PsychologicalReview 104 2ndash65
Meyer D E amp Kieras D E (1997b) A computationaltheory of executive cognitive processes and multiple-taskperformance Part 2 Accounts of psychologicalrefractory-period phenomena Psychological Review 104749ndash791
Reichle E D Carpenter P A amp Just M A (2000) The neuralbasis of strategy and skill in sentencendashpicture verificationCognitive Psychology 40 261ndash295
Roland P E Larsen B Lassen N A amp Skinhoj E (1980)Supplementary motor area and other cortical areas inorganization of voluntary movements in man Journal ofNeurophysiology 43 118ndash136
Sternberg S (1969) Memory scanning Mental processesrevealed by reaction time experiments American Scientist57 421ndash457
Wagner A D Maril A Bjork R A amp Schacter D L(2001) Prefrontal contributions to executive controlfMRI evidence for functional distinctions within lateralprefrontal cortex NeuroImage 14 1337ndash1347
Wagner A D Pare-Blagoev E J Clark J amp PoldrackR A (2001) Recovering meaning Left prefrontalcortex guides controlled semantic retrieval Neuron 31329ndash338
Woods R P Grafton S T Holmes C J Cherry S R ampMazziotta J C (1998) Automated image registrationI General methods and intrasubject intramodalityvalidation Journal of Computer Assisted Tomography22 139
Anderson et al 653
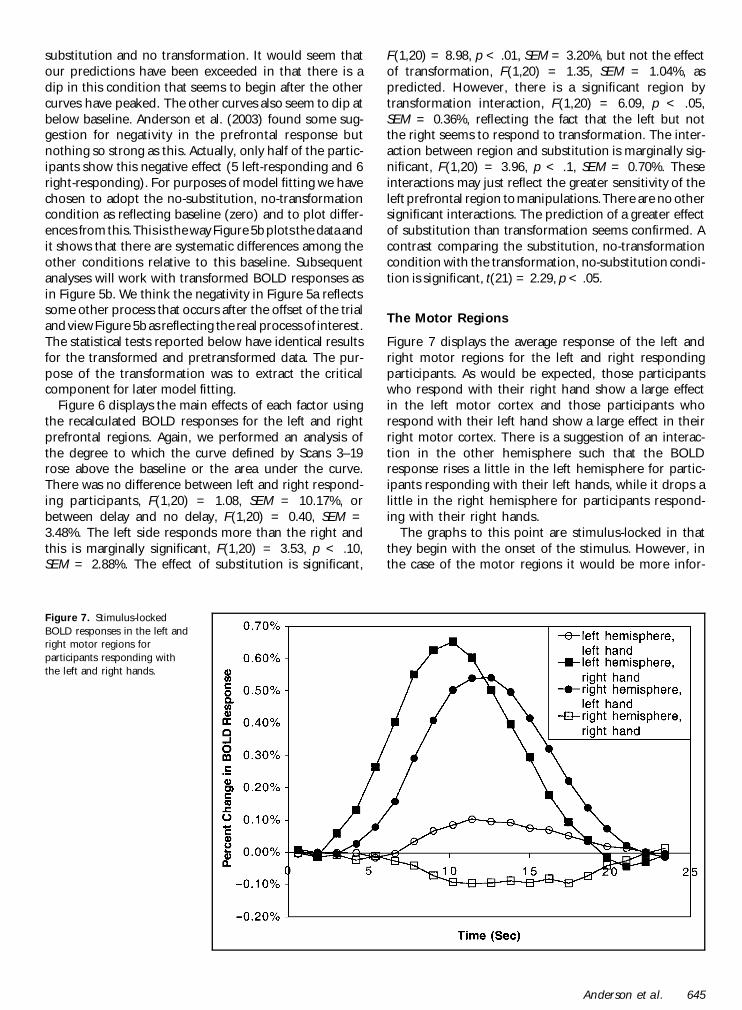
Related Documents