The relationship between ram sperm head morphometry and fertility depends on the procedures of acquisition and analysis used Paulino de Paz a, *, María Mata-Campuzano a , E. Jorge Tizado b , Mercedes Álvarez c , Manuel Álvarez-Rodríguez c , Paz Herraez a , Luis Anel c a Department of Molecular Biology, University of León, 24071 León, Spain b Department of Biodiversity and Environmental Management, University of León, 24071 León, Spain c Department of Veterinary Medicine, Anatomy and Surgery, University of León, 24071 León, Spain Received 26 March 2011; received in revised form 27 May 2011; accepted 29 May 2011 Abstract Sperm head morphometry is a parameter in the evaluation of semen that has been associated with fertility in two ways: comparing morphometric measures between predefined groups of fertility; or analyzing morphometric data by multivariate techniques to identify cell populations. We analyzed the morphometry of ram sperm head by three procedures and checked its relationship with male fertility. A Computer-Aided Sperm Morphometric Assessment procedure (CASMA), an image analysis software (NIS-Elements) in combination with an optical microscope (MO-NIS) and this image analysis software in combination with a scanning electron microscope (SEM-NIS) were used. Eight morphometric parameters were assessed: length, width, area, perimeter, ellipticity, form factor, elongation and regularity. We observed significant differences between the morphometric data of sperm head obtained with three study procedures. The CASMA procedure shows the highest values for all parameters and the SEM-NIS procedure the lowest. The analysis of a semen sample, when only the mean of morphometric parameters is used to describe the cell population, is too limited to interpret their fertilizing capacity. It is essential to analyze the complex structure of the samples by defining subpopulations by multivariate methods. With few exceptions, the means of each morphometric parameter differ between the three subpopulations analyzed in each procedure. Only the subpopulations obtained with the MO-NIS procedure showed a significant correlation with male fertility. In short, it is necessary to establish an instrumental standard for the analysis of sperm morphometry to obtain reliable results and we believe that the MO-NIS system presents these basic requirements. © 2011 Elsevier Inc. All rights reserved. Keywords: Ram; Sperm; Head morphometry; Cell subpopulations; Fertility 1. Introduction Artificial Insemination (AI) is the reproductive bio- technology that has contributed to the genetic improve- ment of livestock breeding. The evaluation of semen to predict male fertility before AI is essential for accept- able fertility results. At present, the routine test of semen quality includes, amongst other parameters, the assessment of sperm morphology. The evaluation of sperm morphology by strict criteria is a simple, cost- effective method and can be used to guide the clinician and scientist when making clinical decisions [1]. Sperm * Corresponding author. Tel.: 0034987291204; fax: 003498729 1322. E-mail address: [email protected] (Paulino de Paz). Available online at www.sciencedirect.com Theriogenology 76 (2011) 1313–1325 www.theriojournal.com 0093-691X/$ – see front matter © 2011 Elsevier Inc. All rights reserved. doi:10.1016/j.theriogenology.2011.05.038

Welcome message from author
This document is posted to help you gain knowledge. Please leave a comment to let me know what you think about it! Share it to your friends and learn new things together.
Transcript
Available online at www.sciencedirect.com
Theriogenology 76 (2011) 1313–1325
0d
The relationship between ram sperm head morphometry andfertility depends on the procedures of acquisition
and analysis used
Paulino de Paza,*, María Mata-Campuzanoa, E. Jorge Tizadob, Mercedes Álvarezc,Manuel Álvarez-Rodríguezc, Paz Herraeza, Luis Anelc
a Department of Molecular Biology, University of León, 24071 León, Spainb Department of Biodiversity and Environmental Management, University of León, 24071 León, Spainc Department of Veterinary Medicine, Anatomy and Surgery, University of León, 24071 León, Spain
Received 26 March 2011; received in revised form 27 May 2011; accepted 29 May 2011
Abstract
Sperm head morphometry is a parameter in the evaluation of semen that has been associated with fertility in two ways: comparingmorphometric measures between predefined groups of fertility; or analyzing morphometric data by multivariate techniques to identifycell populations. We analyzed the morphometry of ram sperm head by three procedures and checked its relationship with male fertility.A Computer-Aided Sperm Morphometric Assessment procedure (CASMA), an image analysis software (NIS-Elements) in combinationwith an optical microscope (MO-NIS) and this image analysis software in combination with a scanning electron microscope (SEM-NIS)were used. Eight morphometric parameters were assessed: length, width, area, perimeter, ellipticity, form factor, elongation andregularity. We observed significant differences between the morphometric data of sperm head obtained with three study procedures. TheCASMA procedure shows the highest values for all parameters and the SEM-NIS procedure the lowest. The analysis of a semen sample,when only the mean of morphometric parameters is used to describe the cell population, is too limited to interpret their fertilizingcapacity. It is essential to analyze the complex structure of the samples by defining subpopulations by multivariate methods. With fewexceptions, the means of each morphometric parameter differ between the three subpopulations analyzed in each procedure. Only thesubpopulations obtained with the MO-NIS procedure showed a significant correlation with male fertility. In short, it is necessary toestablish an instrumental standard for the analysis of sperm morphometry to obtain reliable results and we believe that the MO-NISsystem presents these basic requirements.© 2011 Elsevier Inc. All rights reserved.
Keywords: Ram; Sperm; Head morphometry; Cell subpopulations; Fertility
www.theriojournal.com
1. Introduction
Artificial Insemination (AI) is the reproductive bio-technology that has contributed to the genetic improve-
* Corresponding author. Tel.: �0034987291204; fax: �0034987291322.
E-mail address: [email protected] (Paulino de Paz).
093-691X/$ – see front matter © 2011 Elsevier Inc. All rights reserved.oi:10.1016/j.theriogenology.2011.05.038
ment of livestock breeding. The evaluation of semen topredict male fertility before AI is essential for accept-able fertility results. At present, the routine test ofsemen quality includes, amongst other parameters, theassessment of sperm morphology. The evaluation ofsperm morphology by strict criteria is a simple, cost-effective method and can be used to guide the clinician
and scientist when making clinical decisions [1]. Sperm
tmdwssintptto
sscywsnaa
1314 P. de Paz et al. / Theriogenology 76 (2011) 1313–1325
morphology can be evaluated in two ways: 1) by de-fining the relative proportion of cells within a pre-defined morphological category and assessing the im-pact of abnormal forms of the fertilizing capacity of thesemen sample [2–6]; or 2) by calculating basic mor-phometric sperm measurements (head, acrosome, mid-piece,..) and defining basic cellular biotypes using sta-tistical techniques that allow the fertilizing potential ofthe sample to be analysed [1].
The lack of objectivity in evaluating sperm morphol-ogy has provided the incentives for developing systemsfor computer-aided sperm morphometric assessment(CASMA). CASMA systems have the potential to pro-vide objective, accurate and precise measurements ofspermatozoa, however, the measurements obtainedfrom the same sample with different instruments can besignificantly different [1]. So small differences in met-ric requirements and classification rules can dramati-cally change the percentage of normal sperm, andtherefore, until more rigorous definitions of sperm fea-tures are developed and valid statistical models are usedto describe the population characteristics of fertile se-men, the prognostic value of sperm morphology islimited [2]. The accuracy of sperm morphology assess-ment depends on the careful preparation, fixation andstaining of spermatozoa. Among the stains used toassess sperm morphology, the use of the Diff-Quikstain is recommended by World Health Organization[7]. Recently a new stain, SpermBlue, has been devel-oped for the evaluation of human and animal spermmorphology, resulting in accurate evaluations of spermhead morphometry that is closest to that of the nativesperm [8].
Spermatozoa head morphometry has been analyzedin relation to fertility in a number of species: man [9],boar [10,11], stallion [12–14], goat [15] and, bull[16,17]. The variation in the morphometric measure-ments of spermatozoa has proven likely to be a bio-marker related to fertility potential and abnormal chro-matin structure (goat [15]; bull [16]). However, Saraviaet al [11] have detected significant differences in boarsperm head dimensions among breeds, although thesedifferences were not accompanied by deviations in thechromatin structure either within or between fertileAI-boars.
The seminal sample represents a very complex cel-lular community and therefore we can find biotypesdefined by cellular morphometry. The analysis of sem-inal samples followed two general strategies: 1) ani-mals were grouped by subjectively defined classes of
fertility and the average data of the head morphometry owere compared (bull [17]; boar [10]); and 2) cellularmodels (biotypes) were defined using multivariate tech-niques applied to the complete basis of the morphomet-ric data and the percentage of seminal sample repre-senting each of these biotypes in different experimentalgroups was compared [18–20]. Rubio-Guillen et al [18]showed that by applying ASMA techniques and multi-variate cluster analysis it is possible to determine threesubtle subpopulations of spermatozoa with differentmorphometric characteristics coexisting in bull ejacu-lates. The proportion of spermatozoa in each spermsubpopulation showed considerable differences amongmales and varied significantly throughout the cryo-preservation procedure. Peña et al [19] identify foursperm morphometric subpopulations in fresh boar ejac-ulates using ASMA and analyzing data with a multi-variate statistical procedure. A similar study was car-ried out by Esteso et al [20] in red deer semen, andthe proportion of spermatozoa within each of thesperm subpopulations showed considerable differ-ences among males.
Although sperm morphology is recommended aspart of the spermiogram for domestic animal [21], theanalysis of sperm morphometry in ram semen has re-ceived little attention. To our knowledge, there havebeen only 3 studies dealing with this issue applying anASMA system [22–24]. Gravance et al [22] showedhat in ram semen, sperm morphometry among fertileales is very homogeneous, so this can be useful for
etecting subfertile males. However, Sancho et al [23],ho evaluated the influence of fixatives in the ram
perm head morphometry using an ASMA system, de-cribed high variability of morphometric data amongndividuals. Maroto-Morales et al [24] described sig-ificant differences in sperm head morphometry be-ween rams belonging to the different herds. For allarameters, within-animal CVs were greater than be-ween-animal coefficients of variations (CVs), showinghe high degree of sperm polymorphism present in thevine ejaculate.
We have analyzed the morphometry of ram spermamples by three techniques with different technicalupport: a) a CASMA procedure based on light micros-opy and a video camera routinely used in semen anal-sis, b) a MO-NIS procedure based on light microscopyith a digital camera and a conventional image analysis
ystem, and c) a SEM-NIS procedure based on scan-ing electron microscopy and a conventional imagenalysis system. The objectives of this work are: 1) tossess the effect of analytical procedures on the results
f the morphometric study and 2) to evaluate, as pre-
p
2
iRacd(sfc((iot(Msme�
dswQ
armCANe
wkcttt
(
wpgu
1315P. de Paz et al. / Theriogenology 76 (2011) 1313–1325
dictors of fertility, the parameters of ram sperm headmorphometry analyzed by multivariate analysis meth-ods to obtain different sperm subpopulations or bydefining groups of fertility and comparing the means ofthese parameters.
2. Materials and methods
All the chemicals, unless otherwise specified, wereobtained from Sigma® (Madrid, Spain) in the highesturity available.
.1. Animals and sample collection
The rams (24 animals, Assaf breed, aged 2–5 y) usedn this study were housed in an AI center (Selection andeproduction Centre of the Diputación de León)ccording to Spain and European regulations for AIentres. They were kept under natural day-length con-itions at a latitude of 42° 36’N and fed with barley1kg�male�day), alfalfa (0.5kg�male�day) andtraw ad libitum supplemented with molasses. Samplesrom each ram were prepared from three individualollections at one week intervals by artificial vaginathermo-regulated at 40 °C) during December-January2007-08). Each ejaculate had previously been keptn the collector tube at 35 °C during initial evaluationf semen quality. The volume (using a collectorube graduated in millilitres), sperm concentrationusing Bürker hemocytometer; Marienfeld GmbH,
arienfeld, Germany) and visual motility (warmingtage at 37 °C, mass motility at x40, score: 0–5; totalotility at 200x, in percentage) were calculated. Only
jaculates of acceptable quality were pooled (volume:0.5 mL.; sperm concentration: � 3000x106 sperma-
tozoa/mL; mass motility: � 4; total motility � 75%).
2.2. Sample processing
After initial evaluation, the samples were diluted inDCO medium (Tris 3.322g, citric acid 1.737g, fructose0.954g in 100 ml distilled water) to a concentration of1600 � 106 spermatozoa/ml and aliquots were taken indifferent fixatives for light and electronic microscopy.
Light microscopy. Samples were diluted 1:10 in 2%glutaraldehyde (in BL-1 medium: glucose 2.9g, sodiumcitrate anhydrous 1.0g, sodium bicarbonate 0.2g, dis-tilled water 100 ml) for 30 min at 4 °C. These sampleswere smeared on microscope slides by placing a 5 �lrop on the clear end of a frosted slide and dragging aecond microscope slide across the drop. The slidesere air dried for at least 2 h and stained with Diff-
uick (QCA, Tarragona, Spain): 10 sec in solution And 15 sec in solution B [30]. The preparations wereinsed in distilled water, air dried and permanentlyounted. These samples were analyzed either with aASMA system (software ISAS, Integrated Semennalysis System, Proiser, Valencia, Spain) or withIS-Elements version 3 (Nikon, Tokyo, Japan), a gen-
ral software for imaging analysis.Scanning Electron Microscopy (SEM). Samples
ere diluted 1:100 in 2.5% glutaraldehyde in PBS andept at 4 °C for 24 h. Samples were washed threeonsecutive times with PBS (600g, 6min centrifuga-ions) to eliminate the fixative, fixed with osmium te-roxide for 45 min in the dark and washed again threeimes with PBS. The samples were filtered (0.2�m,
Millipore, Ireland), dehydrated in rising ethanol con-centrations (50%, 70%, 90%, 96%—twice—, and100% —twice—), dried by the critical point method(CPD 030, Balzers, Balzers, Liechtenstein) and coatedby sputter coater (SCD 004, Balzers, Balzers, Liech-tenstein). The samples were observed using a JEOL6480LW (Tokyo, Japan) scanning electron microscopyat 10kV (x600) and the digital images were captured.
2.3. Morphometric analysis
For the analysis of a sample, 3 slides were preparedand 50 sperm heads per slide were analyzed to mini-mize variation between slides.
Computer-Aided Sperm Morphometric Assessment(CASMA). Samples were observed with a Labophot 2microscope (Nikon, Tokyo, Japan) equipped with aSony XC-75CE video camera (Optical size: 1/2-inchformat, 752 (H) � 582 (V) pixels, unit cell size: 8.6 �mH) � 8.3 �m (V)) (Tokyo, Japan) at a magnification of
60x. From each sample at least 150 properly digitizedcells were analyzed with the software ISAS. All imageswere revised and only the properly digitized were an-alyzed. From each cell, four basic morphometric pa-rameters were calculated: Length (L, �m), Width (W,�m), Area (A, �m2) and Perimeter (P, �m). These data
ere handled with an Excel worksheet and four derivedarameters were calculated [11]: Ellipticity (L/W), Ru-osity (4�*A/P2), Elongation (L-W)/(L�W) and Reg-larity (�*LW/4A).
Light Microscopy (MO-NIS). Samples were ob-served with a Nikon E600 microscope (Tokyo, Japan)at a magnification of 60x and photographed with aNikon DF1200F digital camera (2/3 inc. high-densityCCD, 3,840 (H) x 3,072 (V) pixels, total effectivepixel: 1.45 million) (Tokyo, Japan). From each sampleat least 150 cells were digitized and the pictures were
processed with the image analysis system NIS-Ele-
eufi(p
2
SMc
mpvwupmT(
2s
ptw
actpcstsbKvcmpffuaasdobFesaea
2b
1316 P. de Paz et al. / Theriogenology 76 (2011) 1313–1325
ments version 3 (Nikon, Tokyo, Japan). The analysiswas carried out by a semiautomatic macro that leads theoperator to select on the image the heads of sperm thatdo not meet the technical requirements for study (over-lapping, staining artifacts). We calculated the sameparameters than with CASMA procedure. L and Wwere the largest and the smallest, respectively, of theFeret diameter measured at 30° angles.
Scanning electron microscopy (SEM-NIS). At least150 cells were photographed from each sample and theimages were analyzed with NIS-Elements software(Nikon) applying the above-mentioned macro to obtainthe four basic morphometric parameters and then thefour derived parameters.
2.4. Fertility test
Chilled semen: Semen was obtained from 24 adultAssaf rams of proven fertility, collected with an artifi-cial vagina during of December-January (2006–2008).Only ejaculates with the previously-mentioned charac-teristics were processed. Doses for insemination werediluted with a Tes-Tris-Fructose-egg yolk diluent [25]at a concentration of 1600 � 106 spermatozoa/mL andput into French mini-straws (0.25 ml). The semen waschilled to 15 °C and held in a transportable refrigeratoruntil arrival at the insemination farm (2–6 h).
Vaginal artificial insemination (VAI): 5107 multip-arous Assaf ewes were used to evaluate fertility of 24males from 2006 to 2008. Oestrus synchronization wascarried out with fluorogestone acetate sponges (Chro-nogest, Intervet-Holanda), which were applied at 40 mgper ewes. The time for the withdrawal of the spongesvaried from 14 days after their insertion. At spongewithdrawal, the ewes were treated with 500 IU of eCG(Folligon1, Intervet-The Netherlands) and were insem-inated at 55 � 1 h. VAI was performed by experiencedtechnicians using a speculum with an attached lightsource and an ovine AI catheter (IMVTM). Chilledsemen (400 � 106 spermatozoa) was deposited in thentrance of the cervix. Pregnancy was diagnosed byltrasound scan at 35 to 38 days after insemination. Theertility rate (FR) was expressed as successful lambingf parturition took place between 139 and 158 days laterpositive). It was considered negative (unsuccessful) ifarturition took place after 158 days, or not at all.
.5. Statistical analysis
All statistical analysis was carried out usingTATISTICA v.9 (StatSoft Inc. Tulsa, OK, USA).eans and standard deviation of each parameter were
alculated for each procedure of sperm head morpho- t
etric analysis. Data structure was represented by box-lots to show the shape of the sample distribution, theariability of the sample and the presence of outliers,hich allowed the information provided by each eval-ated procedure to be assessed qualitatively. The mor-hometric measurements were determined to be nor-ally distributed by the Shapiro-Wilk normality test.he means were compared by an analysis of variance
one-way ANOVA method with Tukey HSD test).
.5.1. Analysis 1—Identification of spermubpopulations
The morphometric data from each of the analyticalrocedures applied in this work were analyzed to ex-ract sperm subpopulations, which were then correlatedith fertility.The first step was to perform a principal component
nalysis (PCA) of the morphometry data for each pro-edures using the Principal Components & Classifica-ions Analysis module with default options. The pur-ose of PCA is to derive a small number of linearombinations (principal components or factors) from aet of variables, which retain as much of the informa-ion in the original variables as possible. In order toelect the number of principal components that shoulde used in the next step of our analysis, we followed theaiser criterion of selecting only those with an eigen-alue (variance extracted for that particular principalomponent) higher than 1. Correlations of differentorphometric parameter with factors resulting of
rincipal components analysis and Communalitiesrom two factors were calculated. Secondly, we per-ormed a study with the Cluster Analysis modulesing the selected principal components as variablesnd applying the k-means method. This procedure isn exploratory data analysis tool that finds the mostignificant solution possible which aims at sortingifferent objects into groups in a way that the degreef association between two objects is maximal if theyelong to the same group and minimal otherwise.inally, a Multiple Regression module is applied toxplore the relationship between the subpopulationize (predictor variable) and fertility (explained vari-ble). After clustering analysis, media and standardrror of media is calculated for these subpopulationsnd a ANOVA is performed.
.5.2. Analysis 2—Comparison of morphometric dataetween two fertility groups
To examine relationships between ram fertility and
he morphometric parameters the data were split in 2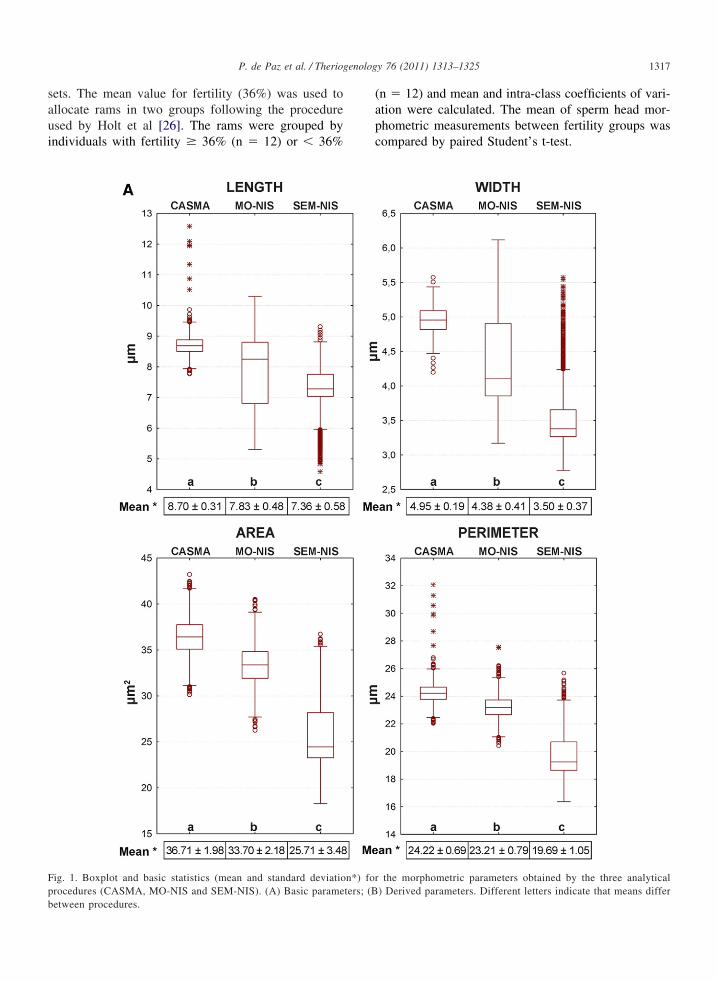
pb
1317P. de Paz et al. / Theriogenology 76 (2011) 1313–1325
sets. The mean value for fertility (36%) was used toallocate rams in two groups following the procedureused by Holt et al [26]. The rams were grouped byindividuals with fertility � 36% (n � 12) or � 36%
Fig. 1. Boxplot and basic statistics (mean and standard deviatiorocedures (CASMA, MO-NIS and SEM-NIS). (A) Basic parame
etween procedures.(n � 12) and mean and intra-class coefficients of vari-ation were calculated. The mean of sperm head mor-phometric measurements between fertility groups wascompared by paired Student’s t-test.
the morphometric parameters obtained by the three analytical) Derived parameters. Different letters indicate that means differ
n*) forters; (B
1318 P. de Paz et al. / Theriogenology 76 (2011) 1313–1325
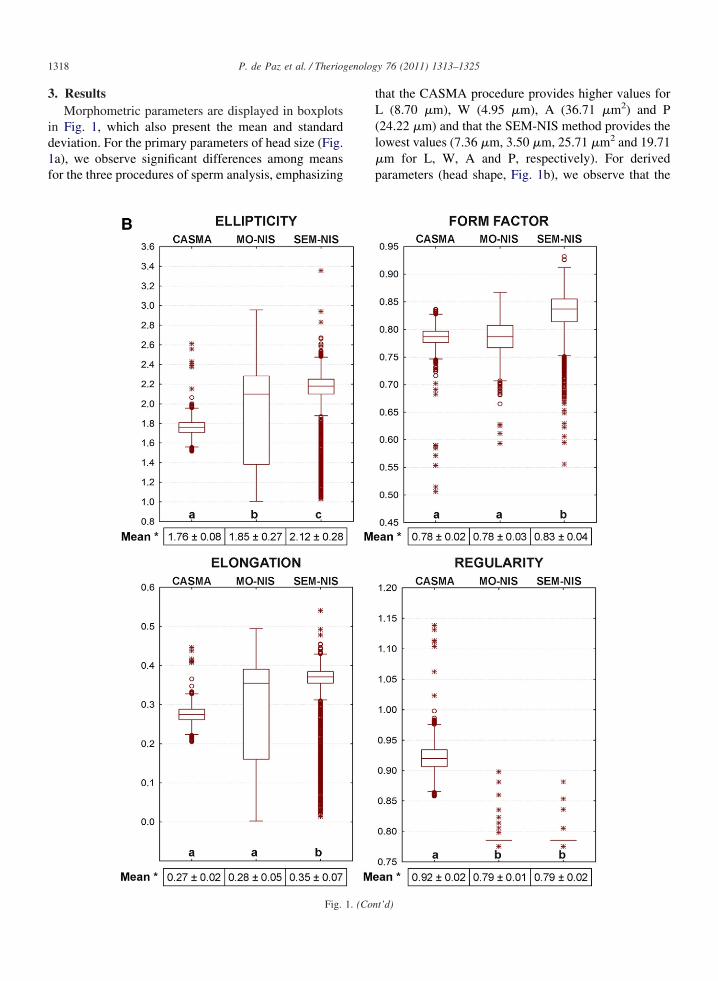
3. ResultsMorphometric parameters are displayed in boxplots
in Fig. 1, which also present the mean and standarddeviation. For the primary parameters of head size (Fig.1a), we observe significant differences among meansfor the three procedures of sperm analysis, emphasizing
Fig. 1. (Con
that the CASMA procedure provides higher values forL (8.70 �m), W (4.95 �m), A (36.71 �m2) and P(24.22 �m) and that the SEM-NIS method provides thelowest values (7.36 �m, 3.50 �m, 25.71 �m2 and 19.71�m for L, W, A and P, respectively). For derivedparameters (head shape, Fig. 1b), we observe that the
t’d)
WAPEFER
xplaine
1319P. de Paz et al. / Theriogenology 76 (2011) 1313–1325
SEM-NIS procedure presents significantly highermeasurements for Ellipticity, Form Factor and Elon-gation (2.12 �m, 0.83 �m and 0.35 �m, respec-tively), while Regularity is significantly higher withthe CASMA procedure than the other two methods(0.92 �m).
3.1. Analysis 1—Morphometric subpopulations andfertility
The multivariant analysis of the morphometricparameters enables to obtain for each proceduresome factors (principal components) that explain themajor part of the total variance of the sample (about80%, Table 1). The Regularity parameter has noeffect on the definition of the principal components.For the CASMA procedure, the two factors accountfor 79.80% of the total variance; the first factor isdefined mainly by derived parameters (Ellipticity,Elongation and Form Factor) and the second factorby primary factors (L, W, A and P). In the MO-NISprocedure, the two factors account for 78.12% of thetotal variance, the first factor is defined by the pa-rameters L, W, Ellipticity and Elongation and thesecond factor is defined by A and P. For the SEM-NIS procedure, the two factors account for 77.37%of the total variance, the first factor is defined by theW, Ellipticity, Form Factor and Elongation parame-ters and the second factor by L, A and P. Theseresults are confirmed by the high correlation of dif-ferent parameters with factors F1 and F2 (exceptRegularity) presented in Table 1. The communalities
Table 1Results (eigenvectors, correlations and communalities -h-) of two faperformed on morphometric data obtained for three analytical proce
Parameter CASMA
Eigenvectors† Correlations‡ h§ Eigenvectors
F1 F2 F1 F2 F1�F2 F1 F
Variance* 40.90 38.90 53.98 24Length �0.33 0.43 �0.61 0.76 0.95 �0.46 0
idth 0.31 0.46 0.56 0.82 0.98 0.46 0rea 0.02 0.54 0.04 0.96 0.91 �0.03 0erimeter �0.16 0.56 �0.30 0.91 0.91 0.15 0llipticity �0.54 �0.06 �0.97 �0.11 0.96 �0.48 0orm factor 0.430 0.02 0.78 0.04 0.61 �0.32 0longation �0.53 �0.07 �0.97 �0.13 0.95 �0.48 0egularity �0.04 0.17 �0.69 0.30 0.09 0.01 �0
* Variance is the proportion of the total variance explained by eac† The eigenvectors are a measure of association of the original pa‡ Correlations of different morphometric parameter with factors re§ Communalities is the proportion of variation in each parameter e
indicate that the variation in all parameters, except
Form Factor and Regularity, is fully explained by thetwo factors identified in the PCA analysis.
The classification of spermatozoa with the new vari-ables defined by the principal components shows threeclusters with a very different distribution in the threeassessed methods (Table 2). Thus, the CASMA proce-dure shows the major part of the data grouped in cluster2 (43.3% of spermatozoa) and 3 (56.5%). With theMO-NIS procedure, we observe that half of the datawere grouped in cluster 1 (51.8 %) while in the SEMprocedure, most of the data are in cluster 3 (65.0%).With few exceptions, the means of each parameterdiffer between the three clusters analyzed for each ofthe procedures studied.
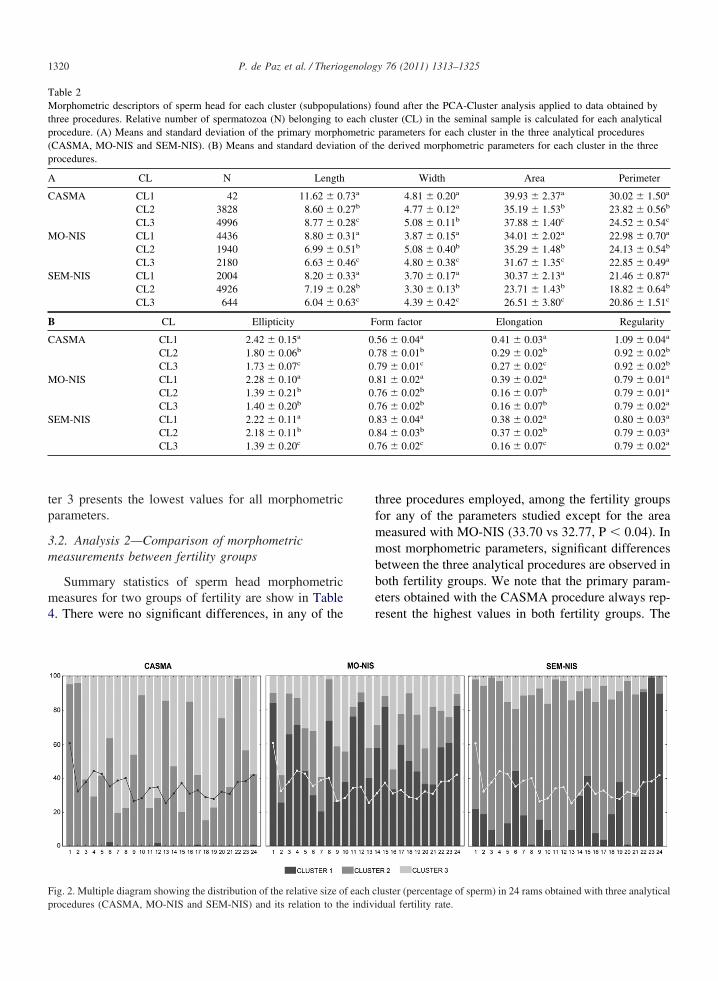
The distribution of the three subpopulations in eachram, as a function of the relative percentage of sper-matozoa within each cluster, is shown in Figure 2. It isnoteworthy that the CASMA procedure defines twosubpopulations in most males, while MO-NIS andSEM-NIS detected a more complex structure with threesubpopulations in all males. Multiple regression anal-ysis revealed a significant relationship between the rel-ative size of subpopulations in each male and the indi-vidual fertility rate in the MO-NIS procedure only(Table 3). In this case, the cluster 1 is positively relatedto fertility (R � 0.56, P � 0.005) while group 3 has anegative correlation (R �- 0.42, P � 0.043). Table 2shows that cluster 1 in the MO-NIS procedure is char-acterized by longer (L� 8.80 vs 6.99 and 6.33) andnarrower (W � 3.87 vs 5.08 and 4.80) spermatozoa,and with significantly higher values for Ellipticity
) obtained with the principal components analysis (PCA)ASMA. MO-NIS, SEM-NIS).
O-NIS SEM-NIS
orrelations h Eigenvectors** Correlations h
F1 F2 F1�F2 F1 F2 F1 F2 F1�F2
42.59 34.780.96 0.28 0.99 0.17 0.57 0.32 0.95 0.990.95 0.17 0.95 �0.52 0.13 �0.95 0.22 0.950.06 0.97 0.95 �0.24 0.53 �0.43 0.88 0.960.30 0.93 0.95 �0.31 0.49 �0.58 0.81 0.990.99 0.06 0.98 0.47 0.27 0.87 0.46 0.970.66 0.01 0.44 0.31 �0.03 0.57 �0.05 0.330.98 0.06 0.97 0.48 0.27 0.87 0.44 0.980.03 �0.10 0.01 0.01 0.03 0.01 0.05 0.01
ipal component.s with the resulting principal components.of principal components analysis.d by the two factors
ctors (Fdures (C
M
** C
2
.14
.20 �
.12
.70 �
.67
.04 �
.01 �
.04 �
.07
h princrametersulting
(2.28), Form Factor (0.81) and Elongation (0.39). Clus-
0.
1320 P. de Paz et al. / Theriogenology 76 (2011) 1313–1325
ter 3 presents the lowest values for all morphometricparameters.
3.2. Analysis 2—Comparison of morphometricmeasurements between fertility groups
Summary statistics of sperm head morphometricmeasures for two groups of fertility are show in Table4. There were no significant differences, in any of the
Table 2Morphometric descriptors of sperm head for each cluster (subpopulathree procedures. Relative number of spermatozoa (N) belonging toprocedure. (A) Means and standard deviation of the primary morpho(CASMA, MO-NIS and SEM-NIS). (B) Means and standard deviatiprocedures.
A CL N Length
CASMA CL1 42 11.62 � 0.CL2 3828 8.60 � 0.CL3 4996 8.77 � 0.
MO-NIS CL1 4436 8.80 � 0.CL2 1940 6.99 � 0.CL3 2180 6.63 � 0.
SEM-NIS CL1 2004 8.20 � 0.CL2 4926 7.19 � 0.CL3 644 6.04 � 0.
B CL Ellipticity
CASMA CL1 2.42 � 0.15a
CL2 1.80 � 0.06b
CL3 1.73 � 0.07c
MO-NIS CL1 2.28 � 0.10a
CL2 1.39 � 0.21b
CL3 1.40 � 0.20b
SEM-NIS CL1 2.22 � 0.11a
CL2 2.18 � 0.11b
CL3 1.39 � 0.20c
Fig. 2. Multiple diagram showing the distribution of the relative size o
procedures (CASMA, MO-NIS and SEM-NIS) and its relation to the indivithree procedures employed, among the fertility groupsfor any of the parameters studied except for the areameasured with MO-NIS (33.70 vs 32.77, P � 0.04). Inmost morphometric parameters, significant differencesbetween the three analytical procedures are observed inboth fertility groups. We note that the primary param-eters obtained with the CASMA procedure always rep-resent the highest values in both fertility groups. The
ound after the PCA-Cluster analysis applied to data obtained byuster (CL) in the seminal sample is calculated for each analyticalparameters for each cluster in the three analytical procedurese derived morphometric parameters for each cluster in the three
Width Area Perimeter
4.81 � 0.20a 39.93 � 2.37a 30.02 � 1.50a
4.77 � 0.12a 35.19 � 1.53b 23.82 � 0.56b
5.08 � 0.11b 37.88 � 1.40c 24.52 � 0.54c
3.87 � 0.15a 34.01 � 2.02a 22.98 � 0.70a
5.08 � 0.40b 35.29 � 1.48b 24.13 � 0.54b
4.80 � 0.38c 31.67 � 1.35c 22.85 � 0.49a
3.70 � 0.17a 30.37 � 2.13a 21.46 � 0.87a
3.30 � 0.13b 23.71 � 1.43b 18.82 � 0.64b
4.39 � 0.42c 26.51 � 3.80c 20.86 � 1.51c
orm factor Elongation Regularity
56 � 0.04a 0.41 � 0.03a 1.09 � 0.04a
78 � 0.01b 0.29 � 0.02b 0.92 � 0.02b
79 � 0.01c 0.27 � 0.02c 0.92 � 0.02b
81 � 0.02a 0.39 � 0.02a 0.79 � 0.01a
76 � 0.02b 0.16 � 0.07b 0.79 � 0.01a
76 � 0.02b 0.16 � 0.07b 0.79 � 0.02a
83 � 0.04a 0.38 � 0.02a 0.80 � 0.03a
84 � 0.03b 0.37 � 0.02b 0.79 � 0.03a
76 � 0.02c 0.16 � 0.07c 0.79 � 0.02a
luster (percentage of sperm) in 24 rams obtained with three analytical
tions) feach clmetricon of th
73a
27b
28c
31a
51b
46c
33a
28b
63c
F
0.0.0.0.0.0.0.0.
f each c
dual fertility rate.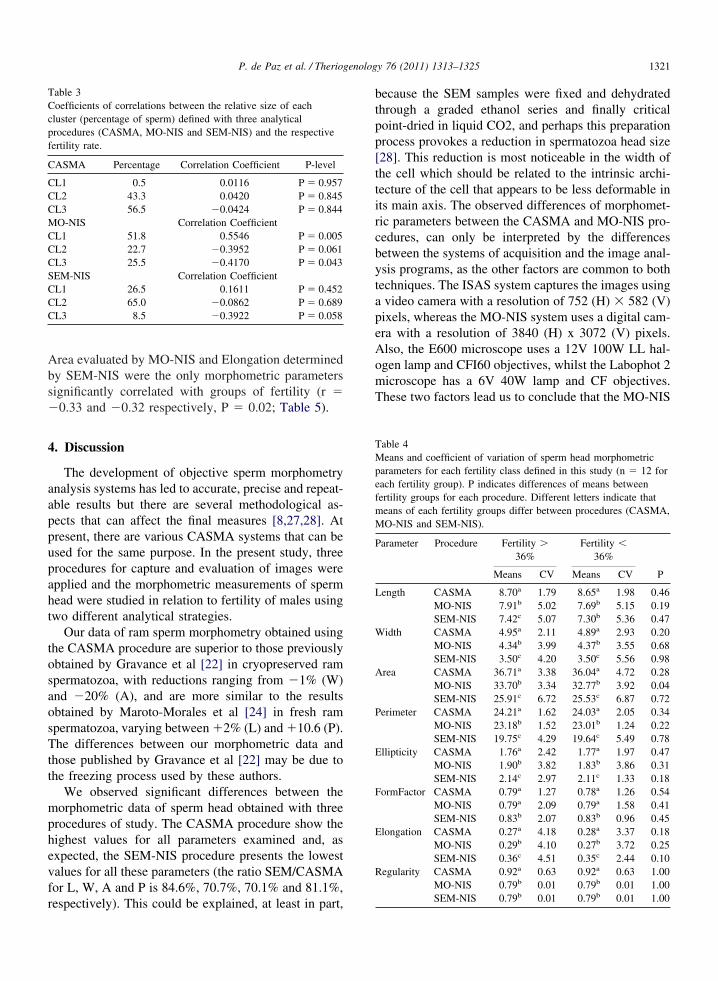
t
mphevfr
peAomT
W
A
P
E
F
E
R
TCcpf
1321P. de Paz et al. / Theriogenology 76 (2011) 1313–1325
Area evaluated by MO-NIS and Elongation determinedby SEM-NIS were the only morphometric parameterssignificantly correlated with groups of fertility (r ��0.33 and �0.32 respectively, P � 0.02; Table 5).
4. Discussion
The development of objective sperm morphometryanalysis systems has led to accurate, precise and repeat-able results but there are several methodological as-pects that can affect the final measures [8,27,28]. Atpresent, there are various CASMA systems that can beused for the same purpose. In the present study, threeprocedures for capture and evaluation of images wereapplied and the morphometric measurements of spermhead were studied in relation to fertility of males usingtwo different analytical strategies.
Our data of ram sperm morphometry obtained usingthe CASMA procedure are superior to those previouslyobtained by Gravance et al [22] in cryopreserved ramspermatozoa, with reductions ranging from �1% (W)and �20% (A), and are more similar to the resultsobtained by Maroto-Morales et al [24] in fresh ramspermatozoa, varying between �2% (L) and �10.6 (P).The differences between our morphometric data andthose published by Gravance et al [22] may be due tohe freezing process used by these authors.
We observed significant differences between theorphometric data of sperm head obtained with three
rocedures of study. The CASMA procedure show theighest values for all parameters examined and, asxpected, the SEM-NIS procedure presents the lowestalues for all these parameters (the ratio SEM/CASMAor L, W, A and P is 84.6%, 70.7%, 70.1% and 81.1%,
able 3oefficients of correlations between the relative size of eachluster (percentage of sperm) defined with three analyticalrocedures (CASMA, MO-NIS and SEM-NIS) and the respectiveertility rate.
CASMA Percentage Correlation Coefficient P-level
CL1 0.5 0.0116 P � 0.957CL2 43.3 0.0420 P � 0.845CL3 56.5 �0.0424 P � 0.844MO-NIS Correlation CoefficientCL1 51.8 0.5546 P � 0.005CL2 22.7 �0.3952 P � 0.061CL3 25.5 �0.4170 P � 0.043SEM-NIS Correlation CoefficientCL1 26.5 0.1611 P � 0.452CL2 65.0 �0.0862 P � 0.689CL3 8.5 �0.3922 P � 0.058
espectively). This could be explained, at least in part,
because the SEM samples were fixed and dehydratedthrough a graded ethanol series and finally criticalpoint-dried in liquid CO2, and perhaps this preparationprocess provokes a reduction in spermatozoa head size[28]. This reduction is most noticeable in the width ofthe cell which should be related to the intrinsic archi-tecture of the cell that appears to be less deformable inits main axis. The observed differences of morphomet-ric parameters between the CASMA and MO-NIS pro-cedures, can only be interpreted by the differencesbetween the systems of acquisition and the image anal-ysis programs, as the other factors are common to bothtechniques. The ISAS system captures the images usinga video camera with a resolution of 752 (H) � 582 (V)ixels, whereas the MO-NIS system uses a digital cam-ra with a resolution of 3840 (H) x 3072 (V) pixels.lso, the E600 microscope uses a 12V 100W LL hal-gen lamp and CFI60 objectives, whilst the Labophot 2icroscope has a 6V 40W lamp and CF objectives.hese two factors lead us to conclude that the MO-NIS
Table 4Means and coefficient of variation of sperm head morphometricparameters for each fertility class defined in this study (n � 12 foreach fertility group). P indicates differences of means betweenfertility groups for each procedure. Different letters indicate thatmeans of each fertility groups differ between procedures (CASMA,MO-NIS and SEM-NIS).
Parameter Procedure Fertility �36%
Fertility �36%
Means CV Means CV P
Length CASMA 8.70a 1.79 8.65a 1.98 0.46MO-NIS 7.91b 5.02 7.69b 5.15 0.19SEM-NIS 7.42c 5.07 7.30b 5.36 0.47
idth CASMA 4.95a 2.11 4.89a 2.93 0.20MO-NIS 4.34b 3.99 4.37b 3.55 0.68SEM-NIS 3.50c 4.20 3.50c 5.56 0.98
rea CASMA 36.71a 3.38 36.04a 4.72 0.28MO-NIS 33.70b 3.34 32.77b 3.92 0.04SEM-NIS 25.91c 6.72 25.53c 6.87 0.72
erimeter CASMA 24.21a 1.62 24.03a 2.05 0.34MO-NIS 23.18b 1.52 23.01b 1.24 0.22SEM-NIS 19.75c 4.29 19.64c 5.49 0.78
llipticity CASMA 1.76a 2.42 1.77a 1.97 0.47MO-NIS 1.90b 3.82 1.83b 3.86 0.31SEM-NIS 2.14c 2.97 2.11c 1.33 0.18
ormFactor CASMA 0.79a 1.27 0.78a 1.26 0.54MO-NIS 0.79a 2.09 0.79a 1.58 0.41SEM-NIS 0.83b 2.07 0.83b 0.96 0.45
longation CASMA 0.27a 4.18 0.28a 3.37 0.18MO-NIS 0.29b 4.10 0.27b 3.72 0.25SEM-NIS 0.36c 4.51 0.35c 2.44 0.10
egularity CASMA 0.92a 0.63 0.92a 0.63 1.00MO-NIS 0.79b 0.01 0.79b 0.01 1.00
SEM-NIS 0.79b 0.01 0.79b 0.01 1.00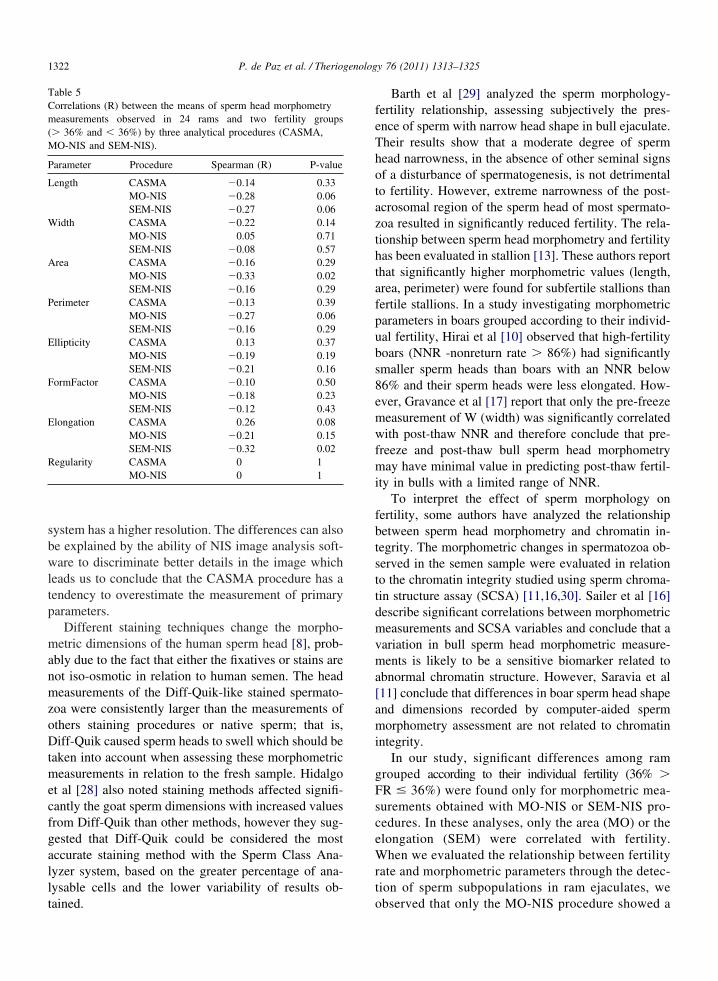
feThotazthtafpubs8emwfmi
fbtsttdmvma[ami
g
W
A
P
E
F
E
R
1322 P. de Paz et al. / Theriogenology 76 (2011) 1313–1325
system has a higher resolution. The differences can alsobe explained by the ability of NIS image analysis soft-ware to discriminate better details in the image whichleads us to conclude that the CASMA procedure has atendency to overestimate the measurement of primaryparameters.
Different staining techniques change the morpho-metric dimensions of the human sperm head [8], prob-ably due to the fact that either the fixatives or stains arenot iso-osmotic in relation to human semen. The headmeasurements of the Diff-Quik-like stained spermato-zoa were consistently larger than the measurements ofothers staining procedures or native sperm; that is,Diff-Quik caused sperm heads to swell which should betaken into account when assessing these morphometricmeasurements in relation to the fresh sample. Hidalgoet al [28] also noted staining methods affected signifi-cantly the goat sperm dimensions with increased valuesfrom Diff-Quik than other methods, however they sug-gested that Diff-Quik could be considered the mostaccurate staining method with the Sperm Class Ana-lyzer system, based on the greater percentage of ana-lysable cells and the lower variability of results ob-
Table 5Correlations (R) between the means of sperm head morphometrymeasurements observed in 24 rams and two fertility groups(� 36% and � 36%) by three analytical procedures (CASMA,MO-NIS and SEM-NIS).
Parameter Procedure Spearman (R) P-value
Length CASMA �0.14 0.33MO-NIS �0.28 0.06SEM-NIS �0.27 0.06
idth CASMA �0.22 0.14MO-NIS 0.05 0.71SEM-NIS �0.08 0.57
rea CASMA �0.16 0.29MO-NIS �0.33 0.02SEM-NIS �0.16 0.29
erimeter CASMA �0.13 0.39MO-NIS �0.27 0.06SEM-NIS �0.16 0.29
llipticity CASMA 0.13 0.37MO-NIS �0.19 0.19SEM-NIS �0.21 0.16
ormFactor CASMA �0.10 0.50MO-NIS �0.18 0.23SEM-NIS �0.12 0.43
longation CASMA 0.26 0.08MO-NIS �0.21 0.15SEM-NIS �0.32 0.02
egularity CASMA 0 1MO-NIS 0 1
tained.
Barth et al [29] analyzed the sperm morphology-ertility relationship, assessing subjectively the pres-nce of sperm with narrow head shape in bull ejaculate.heir results show that a moderate degree of spermead narrowness, in the absence of other seminal signsf a disturbance of spermatogenesis, is not detrimentalo fertility. However, extreme narrowness of the post-crosomal region of the sperm head of most spermato-oa resulted in significantly reduced fertility. The rela-ionship between sperm head morphometry and fertilityas been evaluated in stallion [13]. These authors reporthat significantly higher morphometric values (length,rea, perimeter) were found for subfertile stallions thanertile stallions. In a study investigating morphometricarameters in boars grouped according to their individ-al fertility, Hirai et al [10] observed that high-fertilityoars (NNR -nonreturn rate � 86%) had significantlymaller sperm heads than boars with an NNR below6% and their sperm heads were less elongated. How-ver, Gravance et al [17] report that only the pre-freezeeasurement of W (width) was significantly correlatedith post-thaw NNR and therefore conclude that pre-
reeze and post-thaw bull sperm head morphometryay have minimal value in predicting post-thaw fertil-
ty in bulls with a limited range of NNR.To interpret the effect of sperm morphology on
ertility, some authors have analyzed the relationshipetween sperm head morphometry and chromatin in-egrity. The morphometric changes in spermatozoa ob-erved in the semen sample were evaluated in relationo the chromatin integrity studied using sperm chroma-in structure assay (SCSA) [11,16,30]. Sailer et al [16]escribe significant correlations between morphometriceasurements and SCSA variables and conclude that a
ariation in bull sperm head morphometric measure-ents is likely to be a sensitive biomarker related to
bnormal chromatin structure. However, Saravia et al11] conclude that differences in boar sperm head shapend dimensions recorded by computer-aided spermorphometry assessment are not related to chromatin
ntegrity.In our study, significant differences among ram
rouped according to their individual fertility (36% �FR � 36%) were found only for morphometric mea-surements obtained with MO-NIS or SEM-NIS pro-cedures. In these analyses, only the area (MO) or theelongation (SEM) were correlated with fertility.When we evaluated the relationship between fertilityrate and morphometric parameters through the detec-tion of sperm subpopulations in ram ejaculates, we
observed that only the MO-NIS procedure showed a
Sw
a
1323P. de Paz et al. / Theriogenology 76 (2011) 1313–1325
significant relationship between these two variables.The size of the subpopulation 1 is positively corre-lated with male fertility (R � 0.56) while the sub-population 3 is negatively correlated (R � -0.42).
ubpopulation 1 was characterized by spermatozoahose head is long (8.80 �m) and narrow (3.87 �m)
while those in subpopulation 3 are shorter (6.63 �m)nd wider (4.80 �m). These data suggest that this
measuring technique seem to be more accurate.These morphometric measurements of fresh ramsperm heads are consistent with the ranges of thevarious morphometric parameters (Length: 6.02–10.87, Width: 2.42–7.81) described by Maroto-Mo-rales et al [24] for that species.
Our results are consistent with the conclusions ofGomendio et al [31], who have examined spermato-zoa of Iberian red deer from natural populations totest the hypothesis that the shape of the sperm headand the dimensions of the components of the flagel-lum determine sperm swimming velocity. These au-thors found that sperm with head dimensions of highlength/width ratios swim faster than those with lowerlength/width ratio and that differences in fertilityrates between males were strongly related to spermswimming velocity as well as to the percentage ofmorphologically normal spermatozoa. However, theproportion of motile spermatozoa, the proportion ofacrosome integrity and the proportion of viablesperm did not show a significant association withfertility. Gillies et al [32] investigate this relation anduse a hydrodynamic model as a predictor tool toinvestigate how sperm kinematics are affected bychanges to sperm head morphology. Their resultsindicate the increase in predicted straight-line veloc-ity of the sperm as the head width is reduced and theincrease in lateral movement as the head length isreduced. These authors suggest that head dimensionis a factor in determining the progressive velocityand amplitude of lateral head movement of thesperm.
A qualitative interpretation of three sperm subpopu-lations based on morphometrics properties of sperma-tozoa is outlined by Rubio-Guillen et al [18] in bullejaculates. These authors show that the proportion ofspermatozoa within each of the three subpopulationsvaried significantly throughout the cryopreservationprocedure and that this change presents considerabledifferences among males. Esteso et al [20] also deter-mined that three subtle subpopulations of spermatozoawith different morphometrics characteristics coexist in
Iberian red deer epididymal sperm samples. The con-figuration of subpopulations should have a specificidentity of species and data from these studies are notcomparable with the results described in the presentpaper. A similar study was carried out in fresh boarsemen samples by Peña et al [19] which revealed theexistence of 4 sperm subpopulations. According tothese authors, the combination of sperm morphometryanalysis with a multivariate statistical procedure gavenew information on the biological characteristics ofboar ejaculates that is not given by conventional spermanalysis.
The qualitative information of a semen sampleprovided by the morphometric parameters when onlythe mean is used to describe the cell population, istoo limited to explain, along with others qualityparameters, their fertilizing capacity. It is essential toassess the most complex structure of the samplesthrough the definition of subpopulations. In this anal-ysis, the procedure used in the acquisition and anal-ysis of microscopic images has a significant effect onthe results. Morphometric measures obtained bySEM were significantly smaller compared with thoseof preparations for light microscopy, what has al-ready been observed by other authors [33]. Thisreduction has been explained at least in part becausethe SEM samples were fixed and dehydrated througha graded ethanol series and finally critical point-driedin liquid CO2 [34].
The procedures based on light microscopy (CASMAand MO-NIS) showed significant differences amongthemselves that are due primarily to differences in res-olution capability of the equipment and the differentalgorithms of analysis programs. Of these two proce-dures, only the data obtained with MO-NIS showed asignificant correlation with male fertility and thereforethese data should be integrated into a multifactorialanalysis to explain differences, in their fertility, be-tween males. This multifactorial analysis should allowa classification of the semen sample based on category(normal, questionable, abnormal).
These results lead us to conclude that it is neces-sary to establish an instrumental standard in systemsfor the analysis of sperm morphometry so as toachieve the minimum requirements of resolution toobtain reliable results according the guidelines de-fined by ESHRE [35]. This standard would be aprerequisite in any publication on sperm morphom-etry so that you can compare the results of differentstudies. The MO-NIS system meets the basic require-ments for quality information about the morphology
of the sperm head. To assess this information is
[
[
[
[
[
[
1324 P. de Paz et al. / Theriogenology 76 (2011) 1313–1325
essential the definition and the evaluation of sub-populations defined by sperm morphometric param-eters on the seminal samples.
Acknowledgments
This work was supported by grants from CICYT(AGL2008-03087) and INIA (RZ2007-00011). The au-thors are grateful to the Diputación de León andANCHE for their collaboration in the development ofthis work.
References
[1] Kruger TF, Coetzee K. The role of sperm morphometry inassisted reproduction. Human Reprod Update 1999;5:172–78.
[2] Davis RO, Gravance CG. Consistency of sperm morphologyclassification methods. J Androl 1994;15:83–91.
[3] Phillips NJ, Mcgowan MR, Johnston SD, Mayer DG. Relation-ship between thirty post-thaw spermatozoal characteristics andthe field fertility of 11 high-use Australian dairy AI sires. AnimReprod Sci 2004;81:47–61.
[4] Kuster CE, Singer RS, Althouse GC. Determining sample sizefor the morphological assessment of sperm. Theriogenology2004;61:691–703.
[5] Pesch S, Bostedt G, Failing K, Bergmann M. Advancedfertility diagnosis in stallion semen using transmission elec-tron microscopy, Animal Reproduction Science 2006;91:285–98.
[6] Al-Makhzoomi A, Lundeheim N, Haard M, Rodriguez-Mar-tinez H. Sperm morphology and fertility of progeny-tested AIdairy bulls in Sweden. Theriogenology 2008;70:682–91.
[7] World Health Organization WHO laboratory manual for theexamination and processing of human semen. 5th ed. WHOPress, 2010.
[8] Maree L, du Plessis SS, Menkveld R, van der Horst G.Morphometric dimensions of the human sperm head dependon the staining method used. Hum. Reprod. 2010;25:1369 –382.
[9] Kruger TF, DuToit TC, Franken DR, Acosta AA, Oehniger SC,Menkveld R, Lombard CJ. A new computerized method ofreading sperm morphology (strict criteria) is as efficient astechnician reading. Fertil Steril 1993;59:202–09.
[10] Hirai M, Boersma A, Hoeflich A, Wolf E, Foll J, Aumüller TR,Braun J. Objectively measured sperm motility and sperm headmorphometry in boars (Sus scrofa): relation to fertility andseminal plasma growth factors. J Androl 2001;22:104–10.
[11] Saravia S, Núñez-Martínez I, Morán JM, Soler C, Muriel A,Rodríguez-Martínez H, Peña FJ. Differences in boar sperm headshape and dimensions recorded by computer-assisted spermmorphometry are not related to chromatin integrity. Theriog-enology 2007;68:196–203.
[12] Kruger TF, Du Toit TC, Franken DR, Menkveld R, LombardCJ. Sperm morphology: assessing the agreement between themanual method (strict criteria) and the sperm morphology
analyser IVOS. Fertil Steril 1995;63:134–41.[13] Gravance CG, Champion Z, Liu IK, Casey PJ. Sperm headmorphometry analysis of ejaculate and dismount stallion semensamples. Anim Reprod Sci 1997;47:149–55.
[14] Casey PJ, Gravance CG, Davis RO, Chabot DD, Liu IKM.Morphometric differences in sperm head dimensions of fertileand subfertile stallions. Theriogenology 1997;47:575–82.
[15] Hidalgo M, Rodríguez I, Dorado JM. The effect of cryopreser-vation on sperm head morphometry in Florida male goat relatedto sperm freezability. Anim Reprod Sci 2007;100(1–2):61–72.
[16] Sailer BL, Jost LK, Evenson DP. Bull sperm head morphometryrelated to abnormal chromatin structure and fertility. Cytometry1996;24:167–73.
[17] Gravance CG, Casey ME, Casey PJ. Pre-freeze bull sperm headmorphometry related to post-thaw fertility. Anim Reprod Sci2009;114:81–8.
[18] Rubio-Guillén J, González D, Garde JJ, Esteso MC, Fernández-Santos MR, Rodríguez-Gíl JE, Madrid-Bury N, Quintero-Moreno A. Effects of cryopreservation on bull spermatozoadistribution in morphometrically distinct subpopulations. Re-prod Domest Anim 2007;42:354–57.
[19] Peña FJ, Saravia F, García-Herreros M, Núñez-Martínez I,Tapia JA, Johannisson A, Wallgren M, Rodríguez-Martínez, H.Identification of sperm morphometric subpopulations in twodifferent portions of the boar ejaculate and its relation to post-thaw quality. J Androl 2005;26:716–23.
[20] Esteso MC, Fernández-Santos MR, Soler AJ, Montoro V, Mar-tínez-Pastor F, Garde JJ. Identification of sperm-head morpho-metric subpopulations in iberian red deer epididymal spermsamples. Reprod Domest Anim 2009;44:206–11.
[21] Rodríguez-Martínez H. Laboratory semen assessment and pre-diction of fertility: still utopia? Reprod Dom Anim. 2003;38:312–18.
[22] Gravance CG, Champion ZJ, Casey PJ. Computer-assistedsperm head morphometry analysis (ASMA) of cryopreservedram spermatozoa. Theriogenology 1998;49:1219–230.
[23] Sancho M, Perez-Sanchez F, Tablado L, de Monserrat JJ, SolerC. Computer assisted morphometric analysis of ram spermheads: evaluation of different fixative techniques. Theriogenol-ogy 1998;50:27–37.
[24] Maroto-Morales A, Ramon M, Garcia-Alvarez O, Soler AJ,Esteso MC, Martinez-Pastor F, Perez-Guzman MD, Garde JJ.Characterization of ram (Ovis aries) sperm head morphom-etry using the Sperm-Class Analyzer, Theriogenology 2010;73:437– 48.
25] Anel L, Kaabi M, Abrough B, Alvarez M, Anel E, Boixo JC, dela Fuente J, de Paz P. Factors influencing the success of vaginaland laparoscopic artificial insemination in churra ewes: a fieldassay. Theriogenology 2005;63:1265–247.
26] Holt C, Holt WV, Moore HDM, Reed HCB, Curnock RM.Objectively measured boar sperm motility parameters correlatewith the outcome of on-farm inseminations: results of twofertility trials. J Androl. 1997;18:312–23.
27] Gravance CG, Vishwanath R, Pitt C, Casey PJ. Computer au-tomated morphometric analysis of bull sperm heads. Theriog-enology 1996;46:1205–215.
28] Hidalgo M, Rodriguez I, Dorado JM. Influence of staining andsampling procedures on goat sperm morphometry using theSperm Class Analyzer. Theriogenology 2006;66:996–1003.
29] Barth AD, Bowman PA, Bo GA, Mapletoft RJ. Effect of narrowsperm head shape on fertility in cattle. Can Vet J 1992;33:31–9.
30] Álvarez M, García-Macías V, Martínez-Pastor F, Martínez F,
Borragán S, Mata M, Garde J, Anel L, de Paz P. Effects of
[
[
[
[
[
1325P. de Paz et al. / Theriogenology 76 (2011) 1313–1325
cryopreservation on head morphometry and its relation withchromatin status in brown bear (Ursus arctos) spermatozoa.Theriogenology 2008;70:1498–506.
31] Gomendio M, Malo AF, Garde J, Roldan ERS. Sperm traits andmale fertility in natural populations. Reproduction 2007;134:19–29.
32] Gillies E, Cannon RM, Green RDB, Pacey A. Hydrodynamicpropulsion of human sperm. J Fluid Mech 2009;625:445–74.
33] Van der Horst G, Curry PT, Kitchin RM, Burgess W, Thorne
ET, Kwiatkowski D, Parker M, Atherton RW. Quantitative lightand scanning electron microscopy of ferret sperm. Mol ReprodDev 1991;30:232–40.
34] Marco-Jiménez F, Pérez L, Viudes de Castro MP, Garzón DL,Peñaranda DS, Vicente JS, Jover M, Asturiano JF. Morphom-etry characterisation of European eel spermatozoa with comput-er-assisted spermatozoa analysis and scanning electron micros-copy. Theriogenology 2006;65:1302–310.
35] ESHRE Andrology Special Interest Group. Guidelines on theapplication of CASA technology in the analysis of spermatozoa.
Hum Reprod 1998;13:142–45.
Related Documents