The Relationship between Household Food Gardens and Household Food Security in an Urban Area in Harare, Zimbabwe: A Right to Food Perspective. by Lorner. L. Chikoto Thesis presented in partial fulfilment of the requirements for the Degree Master of Nutrition at Stellenbosch University Supervisor: Prof Milla McLachlan 1 Co-supervisor: Dr Lazarus Zanamwe 2 Statistician: Moleen Zunza 1 (1 –Stellenbosch University; 2- University of Zimbabwe) Faculty of Medicine and Health Sciences Department of Interdisciplinary Health Sciences Division of Human Nutrition March 2016

Welcome message from author
This document is posted to help you gain knowledge. Please leave a comment to let me know what you think about it! Share it to your friends and learn new things together.
Transcript

The Relationship between Household Food Gardens and
Household Food Security in an Urban Area in Harare,
Zimbabwe: A Right to Food Perspective.
by
Lorner. L. Chikoto
Thesis presented in partial fulfilment of the requirements for the Degree Master of
Nutrition at Stellenbosch University
Supervisor: Prof Milla McLachlan1
Co-supervisor: Dr Lazarus Zanamwe2
Statistician: Moleen Zunza1
(1 –Stellenbosch University; 2- University of Zimbabwe)
Faculty of Medicine and Health Sciences
Department of Interdisciplinary Health Sciences
Division of Human Nutrition
March 2016

ii
DECLARATION
By submitting this thesis electronically, I declare that the entirety of the work
contained therein is my work, original work, that I am the sole author thereof (save to
the extent explicitly otherwise stated), that reproduction and publication thereof, by
Stellenbosch University will not infringe any third party rights and that I have not
previously in its entirety or in part submitted it for obtaining any qualification.
Signature: Date:
Copyright © 2016 Stellenbosch University
All rights reserved
Stellenbosch University https://scholar.sun.ac.za
iii
ABSTRACT
Introduction:
It is now widely accepted that hunger constitutes a violation of the human right to
food. Urban agriculture may have a role to play in realising the right to food as it
addresses hunger in the form of urban food insecurity, which is bound to become
increasingly important with the secular trend towards the urbanization of poverty.
This research is focused on Zimbabwe; one of the many African countries in which
urban agriculture is a common occurrence. Urban agriculture in Zimbabwe is not
directly supported by any piece of national legislation and this provides for a poor
foundation in advocating for and promoting its practice. However it would do more
harm to encourage the establishment of food gardens in households if they made no
or insignificant contribution to food security and their maintenance became more of a
burden on households.
Aim:
This study investigated the relationship between household food gardens and
household food security as well as dietary diversity in Zimbabwe’s urban population;
adding to knowledge on whether urban agriculture is indeed one of the solutions to
urban food security concerns and ultimately if it can be considered as a strategy for
implementing the right to adequate food in Harare, Zimbabwe.
Methodology:
This study was cross-sectional and quantitative. A questionnaire consisting of
validated tools and a researcher-designed food garden questionnaire was used to
collect data from 113 households in Harare. The tools captured scores on dietary
diversity, food garden use and food insecurity levels of households. Food garden
scores were correlated with food insecurity scores and dietary diversity scores to
assess whether there was an association between food security, dietary diversity
and urban agriculture.
Stellenbosch University https://scholar.sun.ac.za
iv
Results:
Results show that a significant number of households in the sample population had
food gardens despite experiencing a number of barriers including land tenure, water
supply and the availability of financial resources. High levels of food insecurity also
existed within this population. There were no significant associations found between
household food gardens and household food security or dietary diversity thus this
study did not provide sufficient evidence to support urban agriculture as a solution to
combating food insecurity or improving dietary diversity in Harare.
Conclusion:
Presently, based on available research evidence, urban agriculture cannot be
advocated as an effective approach to realizing the right to food in Harare. However
urban agriculture remains a widespread practice in households in Harare, which may
help them cope with worsening food insecurity. From a human rights perspective,
urban agriculture can be viewed as an entitlement in that people in Harare are using
it to feed themselves in a dignified manner thus claiming their right to food. By
removing barriers impeding urban agriculture, such as prohibitive by-laws, the
potential of urban agriculture may be better realised and observed. More research
should be conducted on how it can be turned into a means of addressing food
insecurity and hidden hunger, ultimately contributing to realizing the right to
adequate food.
Stellenbosch University https://scholar.sun.ac.za

v
OPSOMMING
Inleiding:
Dit word nou algemeen aanvaar dat honger 'n skending is van die mens se reg op
voedsel. Stedelike landbou kan 'n rol speel in die vewesenliking van die reg op
voedsel as dit honger in die vorm van stedelike voedselonsekerheid aanspreek.Met
die sekulêre neiging tot die verstedeliking van armoede word dit al hoe belangriker
om voedselonsekerheid aan te spreek. Hierdie navorsing is gefokus op Zimbabwe,
wat een van die baie Afrika-lande is waarin stedelike landbou algemeen voorkom.
Stedelike landbou in Zimbabwe word nie direk deur enige stuk nasionale wetgewing
ondersteun nie, en daar is dus 'n swak fondament vir die bevodering van die praktyk.
Dit sou meer skade doen om die vestiging van voedseltuine in huishoudings aan te
moedig as dit slegs ‘n geringe bydrae tot voedselsekerheid maak, en hul onderhoud
'n las op huishoudings sou plaas.
Doelwit:
Hierdie navorsingstuk ondersoek die verhouding tussen huishoudelike voedseltuine
en huishoudelike voedselsekerheid, sowel as die dieetdiversiteit van die stedelike
bevolking van Zimbabwe. Die doel voor oë is om by te dra tot die kennis oor
stedelike landbou, en te ondersoek of dit inderdaad een van die oplossings bied vir
stedelike voedselonsekerheid, en of dit uiteindelik beskou kan word as 'n strategie vir
die implementering van die reg op voldoende voedsel in Harare, Zimbabwe.
Metodologie:
Hierdie studie was ‘n deursnit-kwantitatiewe ondersoek. 'n Vraelys wat bestaan uit
gevalideerde instrumente en 'n groentetuin-vraelys (ontwerp deur die navorser) is
gebruik om data van 113 huishoudings in Harare in te samel. Data oor die dieet-
diversiteit, voedselinname, groenteverbouing en voedselonsekerheidsvlakke van
huishoudings is ingesamel. Groentetuinpraktyke is gekorreleer met
voedselonsekerheidsvlakke en dieetdiversiteit om te bepaal of daar 'n verband
bestaan tussen voedselsekerheid, dieetdiversiteit en stedelike landbou.
Stellenbosch University https://scholar.sun.ac.za

vi
Resultate:
Resultate toon dat 'n beduidende aantal huishoudings in die steekproefpopulasie
voedseltuine verbou, ondanks 'n aantal struikelblokke, insluitende grondbesit,
watervoorsiening en die beskikbaarheid van finansiële hulpbronne. Hoë vlakke van
voedselonsekerheid bestaan ook in hierdie bevolking. Daar was geen beduidende
verband tussen huishoudelike voedseltuine en huishoudelike voedselsekerheid of
dieetdiversiteit nie. Die studieresultate ondersteun dus nie die bevording van
stedelike landbou as 'n oplossing vir die bekamping van voedselonsekerheid of
verbetering van dieetdiversiteit in Harare nie.
Gevolgtrekking:
Tans kan stedelike landbou nie op grond van beskikbare navorsingsresultate bepleit
word as 'n effektiewe benadering tot die vewesenliking van die reg op voedsel in
Harare nie. Stedelike landbou bly nietemin 'n algemene praktyk in huishoudings in
Harare wat dit moontlik kan help as die voedselsekerheidsituasie versleg. Uit 'n
menseregteperspektief kan stedelike landbou beskou word as 'n reg, omdat mense
in Harare, as regtehouers, geregtig is daarop om hulself met waardigheid te voed.
Deur hindernisse wat stedelike landbou belemmer, bv streng plaaslike verordeninge,
te verwyder, kan die potensiaal van stedelike landbou beter vewesenlik word. Meer
navorsing moet gedoen word oor hoe stedelike landbou verbeter kan word om
voedselonsekerheid en verborge honger aan te spreek, en by te dra tot die
uiteindelike verwesenliking van die reg op voldoende voedsel.
Stellenbosch University https://scholar.sun.ac.za

vii
ACKNOWLEDGEMENTS
Thank you to my supervisors, Prof McLachlan and Dr Zanamwe who have guided
me through the journey that is my thesis, for putting up with countless emails, missed
deadlines, for sparking ideas which I would have never realized by my own effort, for
being generous with track changes and comments enabling me to complete this
project and for being mentors, teachers and great inspirations.
Thank you to Maritha Marais for seeing in me what I never saw in myself; advising
me to apply for this Masters. Thank you for taking a chance on me and opening my
mind to see endless possibilities.
Thank you to my NOMA coordinators Wenche Barth Eide and Per Ole Iversen for
giving me the opportunity of being part of an amazing, career defining Masters
program in Nutrition, Human Rights and Governance.
Thank you to Janicke Visser for allowing us to torment her with endless questions
(whose answers could be found on the university’s postgraduate website), panic
attacks and for being the bridge between us and the foreign world that is a Masters
and the Ethics committee.
Thank you to my family and friends for being supportive, putting up with my recluse
ways during this time of study and for not asking too many questions about the
completion date of my studies.
Thank you to the City of Harare for granting permission for me to carry out my study.
Thank you to the members of the Division of Human Nutrition who take on the role of
teacher, law enforcement, parent, friend, psychiatrist, document repository, guidance
counsellor, tea/coffee maker, referee and peace keeper to us students as we
navigate through our studies. You are the unsung heroes of society with
superpowers capable of turning moody, rebellious, truants into the future leaders of
the world. Thank you.
Stellenbosch University https://scholar.sun.ac.za
viii
CONTRIBUTION BY PRINCIPAL RESEARCHER AND FELLOW
RESEARCHERS
The principal researcher, Lorner L. Chikoto, developed the idea and the protocol,
planned the study, undertook data collection with the assistance of three
interviewers, captured data for analysis with the assistance of a statistician assigned
by the University of Stellenbosch’s Biostatistics Division, Moleen Zunza. The
principal researcher interpreted the data and drafted the thesis. Prof. M. McLachlan
and Dr. L. Zanamwe provided input and proposed revisions to the protocol and
thesis at all stages.
Stellenbosch University https://scholar.sun.ac.za
ix
TABLE OF CONTENTS
ABSTRACT ............................................................................................................... iii
OPSOMMING ............................................................................................................ v
ACKNOWLEDGEMENTS ......................................................................................... vii
CONTRIBUTION BY PRINCIPAL RESEARCHER AND FELLOW RESEARCHERS ..
............................................................................................................. viii
ACRONYMS AND ABBREVIATIONS ..................................................................... xvii
CHAPTER 1: INTRODUCTION .................................................................................. 1
CHAPTER 2: LITERATURE REVIEW ........................................................................ 4
2.1 FOOD, NUTRITION AND HUMAN RIGHTS ................................................. 4
2.1.1 The right to adequate food ............................................................................ 4
2.1.2 The right to food and food security ................................................................ 5
2.1.3 Food access .................................................................................................. 6
2.1.4 Nutrition security ........................................................................................... 7
2.1.5 The right to food for women .......................................................................... 7
2.1.6 Food supply and cities .................................................................................. 8
2.1.7 The challenge ................................................................................................ 9
2.2 URBAN AGRICULTURE AND THE RIGHT TO FOOD ............................... 10
2.2.1 Rights based approach to urban agriculture ............................................... 10
2.2.2 Pro-Urban Agriculture Movement ................................................................ 11
2.2.3 The Downside of Urban Agriculture ............................................................ 12
2.3 URBAN AGRICULTURE AND THE CITY ................................................... 13
2.3.1 How Urban Agriculture is viewed ................................................................ 13
2.3.2 Policy and urban planning ........................................................................... 14
Stellenbosch University https://scholar.sun.ac.za

x
2.3.3 Land tenure ................................................................................................. 14
2.3.4 Financial investment ................................................................................... 15
2.3.5 The water issue ........................................................................................... 16
2.4 URBAN AGRICULTURE IN ZIMBABWE .................................................... 17
2.4.1 Background ................................................................................................. 17
2.4.2 Urban agriculture and Zimbabwe ................................................................ 17
2.4.3 Urban agriculture policy in Zimbabwe ......................................................... 19
2.4.4 The water situation in Zimbabwe ................................................................. 20
2.5 MEASURING FOOD SECURITY, DIETARY DIVERSITY AND URBAN
AGRICULTURE ....................................................................................................... 21
2.5.1 Measuring food security and dietary diversity ............................................. 21
2.6: Conclusion .................................................................................................. 22
CHAPTER 3: QUESTIONNAIRE DESIGN ............................................................... 23
3.1 INTRODUCTION ......................................................................................... 23
3.2 IDENTIFICATION OF EXISTING TOOLS ................................................... 24
3.2.1 Measuring food security (access) ................................................................ 24
3.2.2 Measuring dietary diversity.......................................................................... 24
3.2.3 Measuring urban agriculture........................................................................ 25
3.4 ADAPTATION OF EXISTING TOOLS: ....................................................... 26
3.4.1 Household Dietary Diversity Score .............................................................. 26
3.4.2: Household Food Insecurity Access Scale. .................................................. 26
3.5 DEVELOPMENT OF ADDITIONAL TOOLS................................................ 28
3.5.1 Demographic questionnaire ........................................................................ 28
3.5.2 Household Food Garden Score ................................................................... 28
Stellenbosch University https://scholar.sun.ac.za
xi
3.6 CONSOLIDATION ...................................................................................... 31
3.7 PRE-TEST STUDY ..................................................................................... 32
3.7.1 Pre-test objectives ....................................................................................... 32
3.7.2 Validity ........................................................................................................ 33
3.7.3 Reliability ..................................................................................................... 34
3.8 PRE- TEST DATA ANALYSIS AND RESULTS .......................................... 34
3.8.1 Data analysis ............................................................................................... 34
3.8.2 Face validity ................................................................................................ 34
3.8.3 Content validity ............................................................................................ 35
3.8.4 Internal reliability ......................................................................................... 36
3.8.5 Conclusion .................................................................................................. 36
CHAPTER 4: METHODOLOGY ............................................................................... 38
4.1 INTRODUCTION ......................................................................................... 38
4.2 AIMS AND OBJECTIVES............................................................................ 38
4.2.1 Aims ............................................................................................................ 38
4.2.2 Objectives: .................................................................................................. 38
4.2.3 Hypotheses ................................................................................................. 39
4.3 STUDY DESIGN ......................................................................................... 40
4.3.1 Sample population ...................................................................................... 40
4.3.2 Sample size................................................................................................. 41
4.3.3 Inclusion and exclusion criteria .................................................................. 42
4.4 DATA COLLECTION TOOL ........................................................................ 42
4.5 RESEARCH ASSISTANT TRAINING ......................................................... 43
Stellenbosch University https://scholar.sun.ac.za
xii
4.6 DATA COLLECTION PROCEDURES ........................................................ 44
4.6.1 Collection of data ........................................................................................ 44
4.6.2 Interviewing ................................................................................................. 44
4.6.3 Securing questionnaires .............................................................................. 45
4.6.4 Duration of data collection ........................................................................... 45
4.6.5 Sample coverage ........................................................................................ 46
4.7 ETHICAL CONSIDERATIONS .................................................................... 46
CHAPTER 5: MAIN STUDY DATA ANALYSIS ........................................................ 48
5.1 INTRODUCTION ......................................................................................... 48
5.2 DATA ANALYSIS ........................................................................................ 48
CHAPTER 6: MAIN STUDY RESULTS .................................................................... 50
6.1 POPULATION CHARACTERISTICS .......................................................... 50
6.1.1 Language .................................................................................................... 50
6.1.2 Household size and age .............................................................................. 50
6.1.3 Suburb and land ownership ........................................................................ 51
6.2 DIETARY DIVERSITY ................................................................................. 52
6.3 HOUSEHOLDS AND FOOD GARDENS .................................................... 54
6.3.1 Households with food gardens .................................................................... 54
6.3.3 Other activities ............................................................................................ 57
6.3.4 Water and Household Food Gardens .......................................................... 57
6.3.5 Household without food gardens ................................................................. 58
6.4 FOOD PURCHASING ................................................................................. 59
6.5 OTHER MEANS OF OBTAINING FOOD .................................................... 60
6.6 HOUSEHOLD FOOD INSECURITY ........................................................... 60
Stellenbosch University https://scholar.sun.ac.za

xiii
6.6.1 Household Food Insecurity Related Conditions .......................................... 60
6.6.2 Household Food Insecurity Related Domains ............................................. 62
6.6.3 Household Food Insecurity Related Categories .......................................... 62
6.7 RELATIONSHIP BETWEEN HOUSEHOLD FOOD GARDENS AND
HOUSEHOLD FOOD SECURITY AND DIETARY DIVERSITY ............................... 63
6.8 RELATIONSHIP BETWEEN HOUSEHOLD DIETARY DIVERSITY AND
FOOD INSECURITY ................................................................................................ 63
6.9 RELATIONSHIP BETWEEN LEVEL OF FOOD PURCHASES AND
HOUSEHOLD FOOD SECURITY, DIETARY DIVERSITY AND FOOD GARDEN
SCORES .................................................................................................................. 63
CHAPTER 7: DISCUSSION ..................................................................................... 65
7.1 INTRODUCTION ......................................................................................... 65
7.2 POPULATION CHARACTERISTICS .......................................................... 65
7.2.1 Number of households involved in urban agriculture .................................. 65
7.3 HOUSEHOLD FOOD GARDENS AND HOUSEHOLD FOOD SECURITY . 66
7.3.1 Contribution of household food gardens to food security ............................ 66
7.3.2 Motivation behind household food gardens ................................................. 67
7.3.3 The state of food insecurity and urban agriculture in Harare ....................... 68
7.3.4 The way forward .......................................................................................... 68
7.4 HOUSEHOLD FOODS GARDEN AND DIETARY DIVERSITY................... 69
7.4.1 Contribution of household food gardens to dietary diversity ........................ 69
7.5 LIMITING FACTORS OF URBAN AGRICULTURE .................................... 70
7.5.1 Land tenure ................................................................................................. 70
7.5.2 Financial resources ..................................................................................... 71
7.5.3 Water resources .......................................................................................... 72
Stellenbosch University https://scholar.sun.ac.za
xiv
7.6 HOW ARE HOUSEHOLDS GAINING ACCESS TO FOOD? ...................... 73
7.6.1 Economic access to food ............................................................................ 73
7.7 OTHER FINDINGS ..................................................................................... 74
7.7.1 An unusual relationship between food security and dietary diversity .......... 74
7.8 CONCLUDING REMARKS ......................................................................... 74
CHAPTER 8: CONCLUSION ................................................................................... 76
8.1 OVERALL CONCLUSION: .......................................................................... 77
8.2 RECOMMENDATIONS ............................................................................... 78
8.3 LIMITATIONS OF THE STUDY .................................................................. 78
8.4 RECOMMENDATIONS FOR FURTHER STUDIES .................................... 79
ADDENDUM A: MAP OF HARARE’S HEALTH DISTRICTS144 ............................... 80
ADDENDUM B: STUDY QUESTIONNAIRE ............................................................ 81
ADDENDUM C: ETHICAL APPROVAL LETTER ................................................... 102
ADDENDUM D: PERMISSION LETTER TO DEPARTMENT OF HOUSING AND
COMMUNITY SERVICE ........................................................................................ 103
ADDENDUM E: PARTICIPANT INFORMATION LEAFLET AND CONSENT FORM ...
........................................................................................................... 104
REFERENCES ....................................................................................................... 109
Stellenbosch University https://scholar.sun.ac.za
xv
LIST OF TABLES
Table 3.1: Questions constituting the household food garden score ........................ 30
Table 3.2: Food purchasing categories .................................................................... 31
Table 3.3: Rating scale for level of understanding of questions ............................... 33
Table 3.4: Terms not understood by households in questionnaire (n = 12) .............. 35
Table 3.5: Reliability co-efficient for questionnaire sections (n = 12) ........................ 36
Table 6.1: Language used for communication in households (n = 113) ................... 50
Table 6.2: Comparison of landownership and occurrence of food gardens (n = 113)
................................................................................................................................. 52
Table 6.3: Percentages of households according to number of different crops or
livestock in their food gardens (n = 65). ................................................................... 56
Table 6.4: Percentages of households with food gardens according to number of
times they consumed crops or livestock from their garden ....................................... 56
Table 6.5: Percentage of households according to the number of times they
purchased fruits and vegetables and meat and meat products (n = 113). ................ 59
Stellenbosch University https://scholar.sun.ac.za

xvi
LIST OF FIGURES
Figure 3.1: Steps in study questionnaire design ....................................................... 23
Figure 3.2: Steps in household food garden section development ........................... 29
Figure 6.1: Percentage of households according to type of land ownership (n = 113)
................................................................................................................................. 51
Figure 6.2: Percentage of households (n = 113) according to the thirteen groups in
dietary diversity score questionnaire ........................................................................ 53
Figure 6.3: Percentage of households (n = 65) according to reason for having food
gardens .................................................................................................................... 54
Figure 6.4: Percentage of households (n = 48) according to main water supply for
their food garden ...................................................................................................... 58
Figure 6.5: Percentage of households (n = 48) according to reason for not having a
food garden .............................................................................................................. 58
Figure 6.6: Percentage of households (n = 113) according to other means they have
of obtaining food ....................................................................................................... 60
Figure 6.7: Percentage of households (n = 113) according to food insecurity related
conditions ................................................................................................................. 61
Figure 6.8: Percentage of households (n = 113) according to food security category
................................................................................................................................ .62
Stellenbosch University https://scholar.sun.ac.za

xvii
ACRONYMS AND ABBREVIATIONS
AFSUN African Food Security Urban Network
ART Anti-retroviral Therapy
DACEL Department of Agriculture, Conservation and Environment
FANTA Food and Nutrition Technical Assistance Project
FAO Food and Agriculture Organisation
FPS Food Purchase Score
GADS Gauteng Agricultural Development Strategy
GDP Gross Domestic Product
GNU Government of National Unity
HDDS Household Dietary Diversity Score
HFIAS Household Food Insecurity Access Scale
HHFGS Household Food Garden Scale
HIV/AIDS Human Immuno-Deficiency Virus/ Acquired Immuno-Deficiency
Syndrome
ICESCR International Covenant on Economic, Social and Cultural Rights
ODA Overseas Development Assistance
RUAF Resources Centres on Urban Agriculture and Food Security
UA Urban Agriculture
UN United Nations
UPA Urban and Peri-Urban Agriculture
Stellenbosch University https://scholar.sun.ac.za
1
CHAPTER 1: INTRODUCTION
Human rights are the basic rights and freedoms that belong to every person in the
world.1 Human rights entail both rights and obligations. States assume obligations
and duties under international law to respect, to protect and to fulfil human rights.2
States create, maintain and provide for an environment in which people can live with
dignity. Poverty is a violation of human dignity.3 Where poverty exists, access to food
is compromised resulting in food insecurity.4
Public understanding of hunger and food insecurity has undergone radical
transformation in the last century.5 It is now widely accepted that poverty should not
be seen only as a lack of income, but also as a deprivation of human rights and that
hunger constitutes a violation of the human right to food.6, 7 This acceptance of
access to healthy food as a human right; that is, inalienable, universal, inter-
dependent with and indivisible from all other human rights, brings with it the modern
understanding of rights based approaches.5
Extreme poverty is not inevitable. It is, at least in part, created, enabled and
perpetuated by acts and omissions of States and other economic actors.8 The
deprivation and indignity of poverty stem from various sources. Persons living in
poverty are confronted by the most severe obstacles – physical, economic, cultural
and social to accessing their rights and entitlements.8 As Nelson Mandela once said;
“overcoming poverty is not an act of charity”.9 Overcoming poverty is a matter of
human rights.
The principles of rights-based approaches include (i) respecting people’s right to
participate in decision-making processes that affect their lives; (ii) understanding and
addressing the root causes of poverty and suffering; (iii) emphasising the equal
dignity and worth of all people and promotion of tolerance, inclusion, non-
discrimination and social justice; and (iv) holding all development actors accountable
for respecting, protecting and fulfilling human rights.10 The human rights approach
attaches as much importance to the processes which enable developmental goals to
Stellenbosch University https://scholar.sun.ac.za

2
be achieved as to the goals themselves.11 Thus it could not only address the
outcome of abolishing hunger, but may also propose ways and tools by which that
goal can be achieved.12
The effort to realise the right to food is not without its challenges; It is expected that
by 2020, 85 % of the poor in Latin America, and about 40 – 45 % of the poor in
Africa and Asia will be concentrated in towns and cities.13 This rapid urbanization
goes together with a rapid increase in urban poverty and urban food insecurity. At
the same time, food producers are experiencing greater competition for land, water,
and energy. Rapid population growth and the need for increase in food production is
exacerbated by the threat of the effects of substantial climate change.14 As the world
population continues to grow, much more effort and innovation will be urgently
needed in order to sustainably increase food production. There is a need to change
the way in which food is produced, stored, processed, distributed, and accessed.14
This is where urban agriculturea is thought to play a role.
The Food and Agriculture Organisation (FAO) suggests that urban agriculture and
peri-urban agriculture contributes to local economic development, poverty alleviation,
in recognition of the human right to food, the social inclusion of the urban poor and
women in particular, as well as to the greening of the city and the productive reuse of
urban wastes.13 Food insecurity has always haunted cities and towns. At times it
would be well-controlled, at other times it would strike more or less significant
portions of the population. At all times, urban agriculture has played some role in
ensuring a food supply for urban residents.15
Urban agriculture is not a new concept in Zimbabwe, by the mid-1950s most urban
centres had effectively taken shape. To supplement his/her meagre and often
sporadic income the urban African had to grow crops around his/her workplace or
the temporary home.16 The practice of urban agriculture is still evident in
Zimbabwean communities today. Many national and local authorities, especially in
developing countries, viewed intra-urban agriculture mainly as a source of problems
and at best as a survival option for the urban poor in times of crisis.17 Presently in
a Urban agriculture: can be defined as the growing of plants and the raising of animals within cities. Source:
http://www.fao.org/urban-agriculture/en/
Stellenbosch University https://scholar.sun.ac.za
3
Zimbabwe urban agriculture is a grey area, often prohibited by the local authorities.
However, to prohibit the practice of urban agriculture can be viewed as a violation of
human rights. But it can also be argued that promoting the practice of urban
agriculture when its contributions are very limited, unsustainable and harmful goes
against human rights.
This paper investigates the relationship between household food gardensb,c and
household food securityd in Zimbabwe’s urban population, exploring whether urban
agriculture is indeed one of the solutions to urban food security concerns and
ultimately if it can be considered as a strategy in implementing the right to adequate
food in Harare, Zimbabwe.
b Household Food Gardens refers to a portion of land which may be around the household or within
walking distance from the family home. Source: http://agricultureandfoodsecurity.biomedcentral.com/articles/10.1186/2048-7010-2-8 c Household food gardens are used interchangeably with urban agriculture in the context of this study
dFood Security defined as a state when all people at all times have access to sufficient, safe,
nutritious food to maintain a healthy and active life. Source: http://www.who.int/trade/glossary/story028/en/
Stellenbosch University https://scholar.sun.ac.za
4
CHAPTER 2: LITERATURE REVIEW
This review will take a global look at the different aspects of food and nutrition
security in the context of the right to food, the problems affecting food and nutrition
security, followed by the idea that urban agriculture is a solution to some of these
problems and can be considered a human right. The last sections of this review will
look at urban agriculture in the context of Zimbabwe, the purpose of this study and
relevance of the tools used in gathering information for the study.
2.1 FOOD, NUTRITION AND HUMAN RIGHTS
2.1.1 The right to adequate food
The International Human Rights system strives to ensure that food is recognized as
a human right not only at national level but at individual level as stipulated in Article
11 of the 1966 United Nations International Covenant of Economic, Social and
Cultural Rights (ICESCR). Article 11 states:
1. The States Parties to the present Covenant recognize the right
of everyone to an adequate standard of living for himself and
his family, including adequate food, clothing and housing, and
to the continuous improvement of living conditions. The States
Parties will take appropriate steps to ensure the realization of
this right, recognizing to this effect the essential importance of
international cooperation based on free consent.
2. The States Parties to the present Covenant, recognizing the
fundamental right of everyone to be free from hunger, shall
take, individually and through international co-operation, the
measures, including specific programmes, which are needed:
a) To improve methods of production, conservation and
distribution of food by making full use of technical and scientific
knowledge, by disseminating knowledge of the principles of
nutrition and by developing or reforming agrarian systems in
such a way as to achieve the most efficient development and
utilization of natural resources;
Stellenbosch University https://scholar.sun.ac.za
5
b) Taking into account the problems of both food-importing and
food-exporting countries, to ensure an equitable distribution of
world food supplies in relation to need. The right to adequate
food is realized when every man, woman and child, alone or in
community with others, have physical and economic access at
all times to adequate food or means for its procurement.18
The right to food is not a right to be fed by government, but primarily the right to feed
oneself with dignity. Like other economic, social and cultural rights, the right to
adequate food confers an obligation on states to respect, protect and fulfil that
right.19 This means that states should not adopt measures that could ultimately
prevent access to adequate food, but that they should adopt measures to ensure
that no individuals are deprived of their access to adequate food, and should
proactively engage in activities to strengthen people’s access to and use of
resources, including means to ensure their livelihood and food security.20
2.1.2 The right to food and food security
According to FAO, the general concept of the right to adequate food can be broken
down into several elements: the food supply should be adequate, which means that
the types of foodstuffs commonly available (nationally, in local markets and
ultimately, at the household level) should be culturally acceptable (fit in with the
prevailing food or dietary culture); the available supply should cover overall
nutritional needs in terms of quantity (energy) and quality (it should provide all the
essential nutrients, including micronutrients such as vitamins and minerals); and, last
but not least, food should be safe (free of toxic elements and contaminants) and of
good quality (in terms of, for example, taste and texture).21
This concept of the right to adequate food assimilates that of food security as evident
in the 1996 definition of food security which characterizes it as a situation that exists
“when all people, at all times, have physical, and economic access to sufficient, safe
and nutritious food to meet their dietary needs and food preferences for an active
and healthy life”.22 The 1996 definition of food security recognizes the multi-faceted
Stellenbosch University https://scholar.sun.ac.za
6
nature of food security by including food availability, stability of food supplies, food
access and food utilization.22
Food is in the first place important for survival-we need it simply to live, food and
eating are also central to our subjectivity, or sense of self.23, 24 Hunger is one of the
worst violations of human dignity and unacceptable in a world which produces
enough food for all and which knows enough about appropriate solutions to the
problem.25 Ensuring food and nutrition security is fulfilling basic needs and ethical
obligations.20 Food security is a pre-condition for the full enjoyment of the right to
food.19
2.1.3 Food access
Hunger and malnutrition remain among the most devastating problems facing the
majority of the world’s poor and needy people, and continues to dominate the health
of the world’s poorest nations.26 Efforts have been made by governments worldwide
to improve food availability in the world, however making food available does not
ensure everyone will have access to it. For the world as a whole, per capita food
availability has risen from about 2220 kcal/person/day in the early 1960s to 2790
kcal/person/day in 2006 - 08, while developing countries recorded a leap from 1850
kcal/person/day to over 2640 kcal/person/day.27 Recent estimates of global food and
nutrition security show that even though hunger is declining, about 805 million
people world-wide were chronically malnourished in the period from 2010 to 2014;
791 million of whom lived in low-income countries.28
Access to food is ensured when all households and all individuals within those
households have sufficient resources to obtain appropriate foods for a nutritious diet.
It is dependent on the level of household resources which consist of capital, labour,
knowledge and on prices.19 As Noble Laureate Amartya Sen wrote in 1983,
“starvation is the characteristic of some people not having enough food to eat. It is
not the characteristic of there being not enough food to eat”.29 Food is available, but
people have limited or no access to it.
Stellenbosch University https://scholar.sun.ac.za
7
2.1.4 Nutrition security
Access to food addresses a household’s demand for food however access does not
guarantee quality. A good nutritional status goes far beyond having access to
sufficient food as explained by General Comment 12 which states that the right to
adequate food implies: “The availability of food in a quantity and quality sufficient to
satisfy the dietary needs of individuals, free from adverse substances, and
acceptable within a given culture”.30, 31
Food insecurity results in the decreased purchase of more expensive foods. These
expensive foods are usually from animal sources (meat, poultry, eggs, fish, and
dairy) or fruits and vegetables. Hence the intake of specific nutrients, in particular
micronutrients is reduced before energy intake is reduced. This causes increased
prevalence and severity of micronutrient deficiencies.32 An estimated 2 billion people
suffer from one or more micronutrient deficiencies demonstrating that hidden hunger
is responsible in part for the global malnutrition burden.33 Measures may therefore
need to be taken to maintain, adapt or strengthen dietary diversity and appropriate
consumption and feeding patterns.34 By adopting such measures, countries and the
world may go a long way in solving micronutrient deficiencies and addressing hunger
as a whole.
2.1.5 The right to food for women
The socially constructed gender roles of men and women interact with their
biological roles to affect the nutrition status of the entire family and of each gender.
Because of women’s cyclical loss of iron and their childbearing, their nutrition status
is particularly vulnerable to deficiencies in diet, care and health or sanitation
services. Poor female nutrition early in life reduces learning potential, increases
reproductive and maternal health risks and lowers productivity. The situation
contributes to women’s diminished ability to gain access to other assets later in life
and undermines attempts to eliminate gender inequalities.35
Stellenbosch University https://scholar.sun.ac.za

8
Women grow or raise much of the world’s food. They could be doing much more, if
they had access to required resources and had a voice in the decisions that have an
impact on their lives and the lives of their families. FAO’s research shows that, if
women had the same access to those resources as men, they would produce 20 -
30 percent more food and their families would enjoy better health, nutrition and
education.36
Investment in women’s nutrition contributes significantly to improving household
nutrition and overall human development capacity of a country.33 In essence well-
nourished women will give birth to well-nourished children, who will become better
educated and more productive adults who in turn will continue the cycle of better
nutrition and productivity. From a human rights based perspective, governments
have an obligation to create an enabling environment to ensure that women have
sufficient access to resources to be able to feed themselves.33 Strengthening the
status of women and their decision-making power within the household over the
family budget in particular, entails important benefits both for household food security
and for children’s health, nutrition and education. This is why no food security
strategy is likely to succeed without taking this dimension into account.37
2.1.6 Food supply and cities
Urban growth is attributed to both natural population growth and rural to urban
migration. Urbanization contributes to sustained economic growth which is critical to
poverty reduction.38 However the rapid growth of cities means that not only will the
majority of the world’s populations in the future be living in cities, but poverty will
increasingly be focused in urban areas.39 Poverty is unmistakably the driving factor in
the lack of resources to purchase or otherwise procure food.40 Globally, food
production and supply are characterized by large-scale commercial farming,
processing and packaging of food products, corporate concentration in retailing and
distribution and the growth of the urban population who rely almost completely on
purchased food.41 Such means of access to food is also prone to risk, especially if
jobs are lost, incomes fall, food prices rise or harvests in rural areas are hampered.42
Stellenbosch University https://scholar.sun.ac.za
9
Urban households reduce both dietary diversity as well as energy intake in response
to increased food prices and reduced income. The ability of different households to
establish access to adequate food can be considered both in terms of production
and in terms of people’s ability to exchange their assets for food.43 In Southern
Africa, almost half (49.6%) of total expenditure by poor urban households is on
food.44
The over-reliance on commercially produced foods may not be the best means of
solving food insecurity issues. Increasing commercial agricultural productivity may
not sufficiently address problems of access for net food buyers and for other
vulnerable groups who may require targeted policy interventions such as
strengthening safety nets and other social protection.28 The right to food could help
propose such interventions as it is an inclusive right. It is not simply a right to a
minimum ration of calories, proteins and other specific nutrients. It is a right to all
nutritional elements that a person needs to live a healthy and active life, and to the
means to access them.19
2.1.7 The challenge
The world now faces the challenge of feeding a growing population, in the face of a
number of hindrances; there is a decrease in availability of agricultural land used for
food production as it competes with other human activities such as bio-fuel crop
production, housing, industry, mining, and recreation. Other factors such as climate
change which negatively impacts agricultural yields, over-exploitation of fisheries and
water scarcity, exacerbate this challenge. To make matters worse there is a decline
in investments in agriculture as this funding competes with the cost of addressing
social and health issues such as the HIV/AIDS pandemic and other communicable
diseases, poverty and under-nutrition, and rising incidence of obesity and non-
communicable diseases.45, 46, 47
Human rights are inter-dependent, and by using a human rights based approach to
tackling poverty and malnutrition, states and the world could solve the majority of its
problems as investment in human rights may result in returns which ensure
Stellenbosch University https://scholar.sun.ac.za
10
participation, empowerment, resilience and sustainability in or of the solutions. The
right to food is a human right recognized under international law that provides
entitlements to individuals to access adequate food and the resources that are
necessary for the sustainable enjoyment of food security. A world where the right to
food is achieved for everyone is a world where people at every level are active
participants in society, have input to government policies and can demand action
from their leaders, and governments are held accountable. It is also a world where
resources are distributed and used more equitably and sustainably.48
2.2 URBAN AGRICULTURE AND THE RIGHT TO FOOD
2.2.1 Rights based approach to urban agriculture
Urban agriculture may have a role to play in addressing urban food insecurity
problems, which are bound to become increasingly important with the secular trend
towards the urbanization of poverty and of the overall population in development
regions.49 It is estimated that 15 – 20 percent of the world’s food is produced in and
close to urban areas.50 Urban agriculture is practiced by as much as 40 percent of
the population in African cities and up to 50 percent in Latin America.51
According to some accounts, 200 million people are employed in urban farming and
related enterprises, contributing to the food supply of 800 million urban dwellers.52
With such a presence, urban agriculture may deserve attention as one of the
strategies for addressing food security.
The state as the primary duty-bearer in realising human rights for its people; has to
respect people’s existing access to food and means of obtaining food. The state has
to proactively strengthen people’s access to food and use resources and means of
ensuring their livelihoods, including food security. The state bears the responsibility
of creating an enabling environment which allows people to choose whether or not
they want to practice urban agriculture.19 Thus, one might argue that to prohibit the
practice of urban agriculture could be viewed as a violation of human rights as the
state would be actively impeding people’s access and means of obtaining food
Stellenbosch University https://scholar.sun.ac.za

11
Conceptually, urban agriculture may contribute to food security, increased food
consumption and enhanced diet composition, dietary diversity and nutritional status
by increasing direct access to locally produced foods as well as increasing freshness
and variety of available foods. It may be time developing countries shifted from the
traditional view of a city and instead explored the idea of a more sustainable view of
a city which accommodates the practices and desires of its inhabitants.
2.2.2 Pro-Urban Agriculture Movement
Those who support urban agriculture see it as having the potential to address urban
poverty, including food security issues and to create sustainable cities in light of
growing urban populations and the reduction in land space available for commercial
agriculture, rising food processing, transport costs and inadvertently food prices.
Urban and peri-urban agriculturee (UPA) is said to have other benefits including low
costs with sales near the point of production. Producers are also responsive to
market demand.53 From an environmental perspective, some say that urban food
gardening reduces the effects of climate change by decreasing greenhouse gas
emissions.54
It is not only in developing countries that citizens see the potential of urban
agriculture. African countries can draw lessons from North America and Europe.
Historically, urban food production in the United States and Britain has flourished in
moments of economic crisis. As we find ourselves once again in the throes of a crisis
of capitalism, the popularity of urban agriculture in the Global Northf has surged and
the discourse surrounding it has shifted from one of recreation and leisure to one of
urban sustainability and economic resilience.55 Some North American cities have
begun to rebuild the tenuous links between food production and consumption by
promoting urban agriculture and farmer’s markets. In Brooklyn’s Greenpoint
neighbourhood for example, a 6000 square foot urban farm has been built atop an
industrial building overlooking the East River. They planned to sell their produce to
e Urban and Peri-Urban Agriculture is defined as the growing of plants and the raising of animals
within and around cities. Source: http://www.fao.org/urban-agriculture/en/ f Global North: socio economic classification of countries which is made up of the United States, Canada, Western Europe and developed parts of East Asia. Source: https://en.wikipedia.org/wiki/North%E2%80%93South_divide
Stellenbosch University https://scholar.sun.ac.za
12
local restaurants and communities and use bicycles to transport produce to
consumers.56
In South America, the Cuban government developed “organoponicos”, rectangular-
walled constructions containing raised beds of a mixture of soil and organic material
such as compost. The “organoponicos” have become one of the mainstays of
vegetable cultivation in the city of Havana’s urban agriculture practices. Some Cuban
diets have benefited from the introduction of locally produced, organic agricultural
products. Havana’s environment has benefited both from the cultivation of crops and
from the fact that it is all done agro-ecologically.57 Providing an enabling pro-poor
framework for urban agriculture is one strategy for implementing the right to
adequate food.58 From a human rights perspective states should be urged to move
away from the benevolence model of food aid and instead emphasize enabling
environments that support people in feeding themselves.20
2.2.3 The Downside of Urban Agriculture
Although urban and peri-urban agriculture (UPA) helps secure urban livelihoods and
combat hunger and poverty, there are concerns that health hazards may undermine
nutritional and social development benefits.59 Health authorities see urban agriculture
as a health hazard. Urban farming systems recycle liquid and solid waste but without
appropriate practices such as co-compostingg or infrastructure. This may lead to soil
and water pollution and compromised food safety as is the case in Kampala, Uganda
where urban agriculture is legalized. A health impact assessment on rearing
livestock in Kampala city revealed that the city is at risk of pollution from effluent from
zero-grazingh animals, poor manure disposal and dust from poultry houses.53 These
bear both physical and mental health side effects such as diarrhoea, respiratory
problems, parasitic diseases and emotional stress on the population with these
conditions in close proximity.60
g Co-composting is the controlled aerobic degradation of organics, using more than one feedstock (faecal sludge
and organic solid waste). Source: http://akvopedia.org/wiki/Co-composting h Zero-grazing is a farming method that involves keeping cows inside and bringing them cut grass, rather than
letting them feed in the fields. Source: http://www.oxfordlearnersdictionaries.com/definition/english/zero-grazing
Stellenbosch University https://scholar.sun.ac.za
13
Some urban planners, policy makers and experts do not support the practice of
urban agriculture. Planners tend to think that urban food growing is a messy
business; it does not fit in with the modern view of an urban area and it poses health
risks.61 In Harare, Zimbabwe, Chibanda cites the lack of policies and regulations, or
inadequate institutional frameworks as the reasons that most cities do not manage
urban agriculture activities to ensure environmental protection, health and safety. He
is of the opinion that water flows and hydrological regimes of rivers, wetlands and
groundwater for boreholes may change as UPA increases. Agricultural chemicals
washed into the water system pollute it. Stream bank cultivation leads to siltation of
dams supplying the city with water.62
Webb reviewed evidence on the practice of urban agriculture in South Africa and
found that some studies showed it had no significant benefit to the urban poor
despite it being actively promoted.63
2.3 URBAN AGRICULTURE AND THE CITY
2.3.1 How Urban Agriculture is viewed
Urban agriculture remains an under-appreciated avenue to food security. Despite its
importance as a potential livelihood source, farming in towns is (still) illegal in many
African countries. By-laws frequently date from colonial times and forbid all
agricultural activity within the boundaries of urban centres, as it did not fit in the
western perception of what constitutes ‘urban’ and because it is believed to cause all
kinds of environmental hazards.64 Cities grow and the demand for food increases,
but areas suitable for agriculture diminish due to competing demands for lands.65
From 1960 to 2010, the African continent’s urban population has grown from 53
million to more than 400 million. In sub-Saharan Africa, the urban population is
projected to double, from 298 million to 595 million between 2010 and 2030.66
Urban agglomerations and their resource uses are becoming the dominant feature of
the human presence on earth, profoundly changing humanity’s relationship to its
host planet and its ecosystems.50 It is unlikely that the planet will be able to
accommodate an urbanized humanity that continues to draw upon resources from
Stellenbosch University https://scholar.sun.ac.za

14
ever more distant hinterlands, or which uses the biosphere, the oceans and the
atmosphere as a sink for its wastes at the current accelerating population growth and
migration rates. The question remains, whether cities can transform themselves into
self-regulating, sustainable systems.61
2.3.2 Policy and urban planning
Urban agriculture has been an integral part of urban livelihoods throughout human
history. The concept only came to the fore in the late 1980s/early 1990s, evoking
interest among international donors and development practitioners.67 However it was
not until the mid-1990s that some local authorities and central governments
recognized urban agriculture as a legitimate land use practice.
With increasing poverty in the urban areas, city planners and national policy makers
are now beginning to consider the role of urban and peri-urban agriculture in the
wider urban economy. Policy, legislation, institutional support and advisory services
are however yet to be designed in the majority of urban areas and countries.68
Municipal authorities often do not understand how to incorporate it into planning or
remain concerned about the environmental effects.66 The lack of national
management policies on urban agriculture, even if they are conservative in nature
(where municipal authorities remove prohibitive laws but do not invest financially in
urban agriculture), may hamper its potential.
2.3.3 Land tenure
In developing countries the majority of urban agriculture is taking place on public
land or on land leased from a local landlord.69 The land use environment is extremely
competitive and role-players in urban and peri-urban food production may not have a
loud voice. They compete with a wide variety of interests on access to land for
agricultural use and their cultivations are seldom protected by secure tenure
arrangements.70
Stellenbosch University https://scholar.sun.ac.za

15
Formal and informal access to land by the urban resource-poor includes share
cropping, squatting, renting, leasing, inheriting and outright purchase.71Without
secure title to land, livelihoods can be terminated by a council order to uproot crops
growing in violation of city by-laws, by a local leader reclaiming land granted under
an unwritten contract, by a real estate developer staking out a subdivision for new
housing, by an invasion of low income families coming to build the first shacks of a
peri-urban settlement or land can be sold to foreign entities for production of bio-fuel
crops.66, 67
Urban populations in Africa are increasing without a proportionate expansion of
infrastructure and services. Within this context, city officials give higher priority to the
more visible aspects of urban life such as office buildings and shopping malls and
lower priority to issues relating to food production, supply and distribution.72 Without
sufficient access to land, urban dwellers may not have any space on which to
practice urban agriculture, should they choose to supplement the dietary intake of
their families.
2.3.4 Financial investment
Urban agriculture (UA) requires increased financial and political legitimacy if it is to
continue developing as a productive force. While political support for urban
agriculture has been steadily increasing, financial support for urban growers has
been more limited.73 Most urban producers lack access to credit and investment
schemes. Urban farmers rely heavily and primarily on the mobilisation of their own
funds.
Insecure land tenure not only stifles vegetable growers’ capacity to build up working
capital, without title to land they have virtually nothing to offer financial institutions as
collateral.66 From 2008 to 2010, local teams from 17 cities in the “Global South”i
carried out applied research, coordinated by the Resource Centres on Urban
Agriculture and Food Security Foundation (RUAF), on financing of small-scale urban
i Global South is a socio economic classification of countries which is made up of Africa, Latin America, and developing Asia including the Middle East. Source: https://en.wikipedia.org/wiki/North%E2%80%93South_divide
Stellenbosch University https://scholar.sun.ac.za
16
and peri-urban agriculture. The study revealed that micro-credits for small-scale
urban farmers are granted mostly for commercially oriented activities such as raising
animals, agro-processing or marketing. 74
Most credit institutions are reluctant to give loans to urban farmers for a number of
reasons. The most common reasons given are a high rate of default, too-high risk
because of possible crop failure essentially for climatic reasons, limited financial
management capacities of farmers and a lack of proper title deeds or collateral.74
Local governments could implement credit and financing policies and instruments,
especially for the poorer and most vulnerable groups, applying conditions that are
compatible with the technical and productive nature of urban agriculture.75 However
this would have to be guided by a cost-benefit analysis of urban agriculture of which
evidence is still conflicting.
2.3.5 The water issue
In addition to these afore mentioned factors that can hinder the success of urban
agriculture, urban and peri-urban farmers often do not have access to a safe and
reliable water supply. As the world population increases, the competition for
freshwater resources between domestic demands, industry, commerce, institutions
such as hospitals, and agriculture is intensifying.76
Global demand for water has tripled since the 1950s, but the supply of fresh water
has been declining due to climate change, drilling of deeper boreholes and inefficient
use of irrigation.77 Seventy percent of surface and groundwater is used for rural
agriculture; agricultural water use has grown substantially and is still increasing. At
the same time, urban areas and industrial development claim an increasing share of
available water resources. Overexploitation and poor management of water
resources threaten the resource base on which agriculture depends.78
There is a need to reconsider water use practices and develop strategies that can
respond to the challenge of increasing water demand and declining fresh water
supply. Globally there is sufficient land and water resources to produce food over the
Stellenbosch University https://scholar.sun.ac.za
17
next 50 years, but only if water for agriculture is better managed. It is no longer
sufficient to build more water storage or harness more surface water without
considering long-term sustainability.79 Urban agriculture could further complicate the
supply and demand for water as households will most likely be using potable water
for these gardens.78 Given the compound challenge of increases in demand for water
and decreases in traditional supply sources it is unlikely that the traditional approach
of one source, one system and one discharge can close the water gap.79
Wastewaterj reuse could be considered, in particular where water is scarce.81
However, the use of waste-water comes with its own health risks such as
contamination of crops by pathogens or heavy metals.76 This leaves more questions
on the sustainable use of potable water for urban agriculture and the feasibility of
using waste-water as an alternative.
2.4 URBAN AGRICULTURE IN ZIMBABWE
2.4.1 Background
This research is focused on Zimbabwe, one of the many African countries in which
urban agriculture is a common occurrence. Once known as the “breadbasket of
Southern Africa”, Zimbabwe is a landlocked country sharing borders with
Mozambique, South Africa, Zambia, and Botswana. It covers a total area of 390 580
square kilometres.80, 81 According to the 2012 national census, Zimbabwe has a total
population of 12 973 808.82
2.4.2 Urban agriculture and Zimbabwe
Urban agriculture was practiced as early as the days of the pioneer settlers, a
reference to the first group of white settlers who colonized Zimbabwe and set up
j Wastewater is a combination of one or more of domestic effluent consisting of blackwater (excreta, urine and faecal sludge) and greywater (kitchen and bathing wastewater); water from commercial establishments and institutions, including hospitals; industrial effluent, stormwater and other urban run-off; agricultural, horticultural and aquaculture effluent, either dissolved or as suspended matter. Source: http://www.unwater.org/fileadmin/user_upload/unwater_new/docs/UN-Water_Analytical_Brief_Wastewater_Management.pdf
Stellenbosch University https://scholar.sun.ac.za
18
their initial settlements at Fort Tuli, Fort Victoria, Fort Charter and Fort Salisbury
respectively in the 1890s. Originally considered rural land, these settlements
gradually developed to become urban settlements. By the mid-1950s most urban
centres had effectively taken shape.80, 83 During this era, the urban African was
considered a temporary ‘fixture’ in the city. They were considered cheap labour
which was reflected in the meagre income they received. To supplement their
meagre and often sporadic income, urban Africans had to grow crops around their
workplaces or the temporary homes to supplement their dietary intake.16
Zimbabwe has three typologies of urban agriculture. “On-plot” agriculture is farming
practised on the plots around houses, like backyard gardening. “Off-plot” agriculture
is conducted in public open spaces, utility service areas and agriculture allotments.
The third typology “Peri-urban” agriculture is the production of crops and livestock in
areas outside the city boundary, formerly rural agricultural land up to a radius of 150
km, which is economically integrated into the city.16
For more than a decade, the country has been dominated by acute social and
political polarization over appropriate policies to address inequitable resource
distribution patterns inherited at independence in 1980 and continued into post-
colonial Zimbabwe.81 The overall outcome of these continuous challenges in the past
decade has been that the country’s real annual Gross Domestic Product (GDP)
growth rate cumulatively declined by approximately 46 percent during the period of
2000 to 2008 and annual hyper-inflation reaching a peak of 231 million percent in
July 2008.84 These challenges together with the perennial droughts, HIV/AIDS
pandemic, declining Foreign Direct Investment (FDI) and low Overseas Development
Assistance (ODA) have left the population vulnerable to poverty and food
insecurity.85
The proportion of households living below the Total Consumption Poverty Line (very
poor and poor) increased from 42 percent in 1995 to 63 percent in 2003. By 2008,
formal sector unemployment was over 80 percent and inflation was running at almost
100 percent per day.81 To survive these hardships, and with the increase in a month
on month inflation rate, urban dwellers had to find alternative strategies to fend for
themselves and their families. Vegetable home gardening became one of the agro-
Stellenbosch University https://scholar.sun.ac.za

19
based safety nets against food shortages and nutritional needs for these urban
dwellers.83
The economic situation has stabilized with the introduction of the multi-currency
system in 2008. The proportion of households considered food insecure decreased
significantly from 33 % in 2009 to 13 % in 2011.86 The country experienced a 5.7 %
growth in GDP in 2009, a shift from the previous year’s negative growth of 17.3 %.87
The question thus arises whether urban dwellers still use urban gardens as a food
source.
2.4.3 Urban agriculture policy in Zimbabwe
Zimbabwe acceded to the ICESCR in May of 1991.88 By virtue of the state acceding
to the ICESCR, it becomes legally bound to observe the rights contained in this
document.89 The right to food is also protected in the Zimbabwean Constitution with
the state proclaiming to take reasonable legislative and other measure, within the
limits of the resources available to it to achieve the progressive realisation of this
right.90
Urban agriculture in Zimbabwe is not directly supported by any piece of national
legislation and this provides for a poor foundation in advocating and promoting its
practice. However it could be argued that it would do more harm to encourage the
establishment of food gardens in households if no strong evidence exists for their
contribution to food security and their maintenance became more of a burden on
urban households in Zimbabwe. Given this lack of evidence the main aim of this
study is to assess whether household food gardens make a contribution to
household food security.
There are a number of Acts in Zimbabwe which can be used indirectly to govern the
practice of urban agriculture, the most influential being the three Acts briefly
described below.
Stellenbosch University https://scholar.sun.ac.za

20
The Urban Councils Acts- Chapter 29:15.91; this act governs the
administration and activities of urban amenities e.g. roads. Section 235 of this
act gives the Minister of Local Government, Rural and Urban Development
the power to prohibit/regulate cultivation of land or keeping of animals if it
threatens urban development or management.
The Environmental Management Act- 20:27.92; sets out principles on the
sustainable management of the environment, thus it can prohibit or encourage
urban agriculture depending on whether or not it is considered sustainable.
The Regional Town and Country Planning Act- 29:12.93; gives the local
planning authority the power to determine how land within its jurisdiction
should be used by either issuing permits or developing “master plans” and
“local plans” which are maps setting out how that land can be used. This
means the local authority can reserve spaces to be used for urban agriculture.
In all these acts, power do not lie with the residents of Harare thus they do not allow
residents to participate in the decisions made regarding urban agriculture. Should
the city council decide to slash crops or change the use of an open space, they can
do so and are not held accountable for such actions. This goes against a rights
based approach.
On a progressive note; local authorities in Zimbabwe have shown that they
recognise the importance of urban agriculture. This was done in the form of two
separate declarations namely the Nyanga Declaration on Urban Agriculture of 2002
and the Harare Declaration on Urban Agriculture in Eastern and Southern Africa of
2003.94, 95 In these documents, local authorities acknowledge the existence and
importance of urban and peri-urban agriculture. They also acknowledge its role in
food security, poverty alleviation, local development and economic empowerment.
However this acknowledgement is yet to translate to actual action.
2.4.4 The water situation in Zimbabwe
Since the 1980’s many urban centres in Zimbabwe have been experiencing water
problems which have been attributed to poor rainfall, insufficiently trained water
Stellenbosch University https://scholar.sun.ac.za

21
resources personnel, population growth, aging infrastructure and a lack of funds.
Water rationing has become common-place with some urban areas going without
water for long periods, ranging from 12 hours to one month or more.96
One such urban centre is Bulawayo, the second largest city in Zimbabwe. This city
has resorted to using various sources of water such as boreholes and wastewater for
urban agriculture purposes as potable water sources (e.g. tap water) are being
reserved for domestic uses such as cooking, bathing and drinking.97
Harare, the capital city of Zimbabwe, has also been facing water quality problems
whilst water scarcity will be a major problem in the next 5 years.98 The city has since
tightened water rationing, causing some residential areas to go without this basic
necessity for an average of two days or more per week.99 Published research
regarding the urban water supply and urban agriculture in Harare has focused on the
use of waste water as a source of water for urban agriculture and has also looked at
solutions to managing the water quality and water scarcity problems the city is
currently facing.82,83 This study will gather current information on water use and its
relationship to household food gardens.
2.5 MEASURING FOOD SECURITY, DIETARY DIVERSITY AND URBAN
AGRICULTURE
Given the rising interest in and potential commitment towards urban agriculture by
academics and decision makers in some governments, there is a need to provide
sufficient evidence of its contributions particularly as a solution to food security and
dietary diversity issues. This will determine whether it can be advocated as an
intervention in the progressive realisation of the right to food
2.5.1 Measuring food security and dietary diversity
Food insecurity is a complex, multidimensional phenomenon which varies through a
continuum of successive stages as the condition becomes more severe.100 In the
Stellenbosch University https://scholar.sun.ac.za

22
past, food security was measured using national food availability figures. However,
as indicated above, national food availability does not guarantee access to food, or
nutritional adequacy. It is thus necessary to use other indicators to measure food
security at household and individual level. Obtaining detailed data on household food
access or individual dietary intake using 24 hours recalls or diet records can be time
consuming and expensive, and requires a high level of technical skill both in data
collection and analysis.101 For this reason, validated food access and dietary diversity
measures are increasingly being used as measures of household food security and
as proxies of nutrient intake.102 These proxy measures will be used to collect data on
the variables for this study.
2.6: Conclusion
In summary, this study is founded on the overall assumption that urban agriculture in
the form of household food gardens is an intervention which could be applied to
improve food security and thus a strategy in realising the right to food. Data will be
collected using proxy measures coupled with a researcher designed tool. Findings
from the study will contribute to knowledge on urban agriculture in Harare and
whether there are associations between household food gardens and household
food security and dietary diversity. One could argue that Harare’s City Council has
an obligation to respect and protect the practice of urban agriculture, however the
obligation to fulfil this in the form of active support of the practice may be difficult as
the economic value of urban agriculture is not yet adequately demonstrated.
Stellenbosch University https://scholar.sun.ac.za
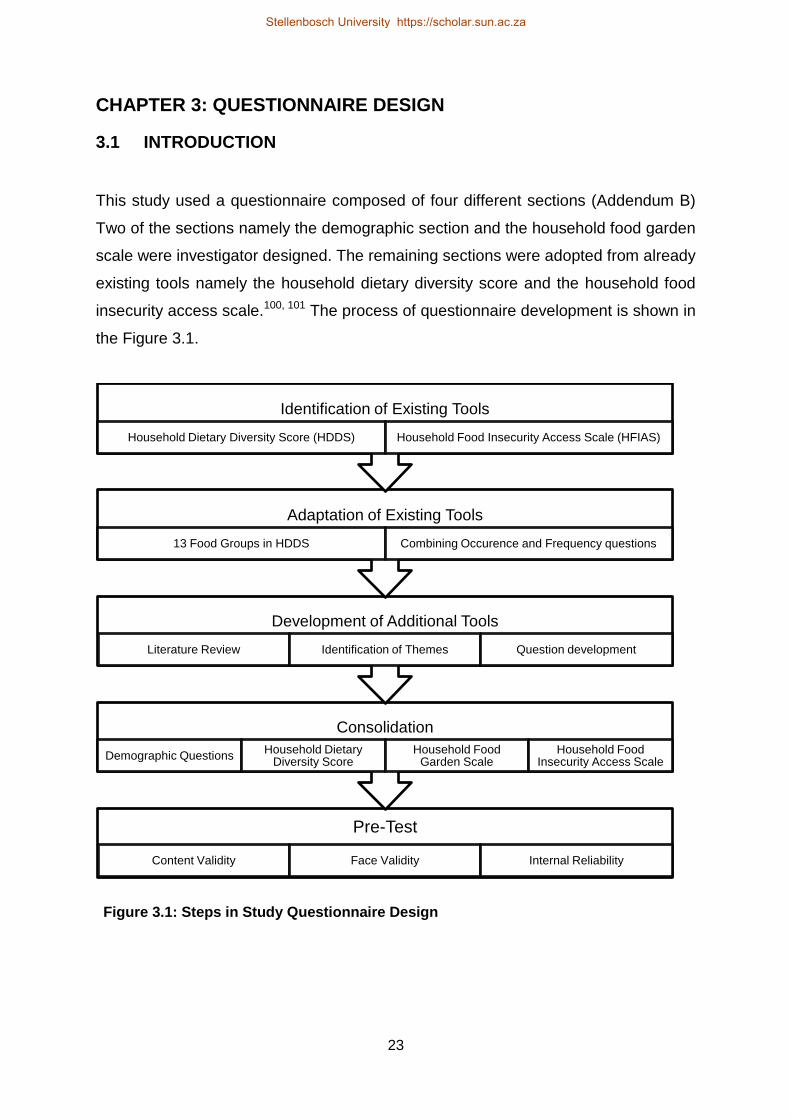
23
CHAPTER 3: QUESTIONNAIRE DESIGN
3.1 INTRODUCTION
This study used a questionnaire composed of four different sections (Addendum B)
Two of the sections namely the demographic section and the household food garden
scale were investigator designed. The remaining sections were adopted from already
existing tools namely the household dietary diversity score and the household food
insecurity access scale.100, 101 The process of questionnaire development is shown in
the Figure 3.1.
Figure 3.1: Steps in Study Questionnaire Design
Pre-Test
Content Validity Face Validity Internal Reliability
Consolidation
Demographic Questions Household Dietary
Diversity Score Household Food
Garden Scale Household Food
Insecurity Access Scale
Development of Additional Tools
Literature Review Identification of Themes Question development
Adaptation of Existing Tools
13 Food Groups in HDDS Combining Occurence and Frequency questions
Identification of Existing Tools
Household Dietary Diversity Score (HDDS) Household Food Insecurity Access Scale (HFIAS)
Stellenbosch University https://scholar.sun.ac.za
24
The aim in designing the questionnaire used in this study was to create a single
instrument which would capture sufficient data on food gardens, food security and
dietary diversity to meet the study objectives. The intention was to create a simple
and easy to use tool for field workers with limited field experience. Questions in the
questionnaire were mainly closed ended with coded responses. Translation of the
questionnaire into Shona was done using back-translation by a qualified local
translator from a local company, Cendel Language Bridge. The questionnaire was
investigator administered and was recall based.
3.2 IDENTIFICATION OF EXISTING TOOLS
After an extensive literature search; the Food and Nutrition Technical Assistance
Project’s (FANTA) Household Dietary Diversity Score (HDDS) and the Household
Food Insecurity Access Scale (HFIAS) were identified as suitable validated tools for
use in measuring dietary diversity and food security respectively for this study. 100, 101
There were no tools found for measuring urban agriculture.
3.2.1 Measuring food security (access)
FANTA’s HFIAS is a simple but methodologically rigorous tool designed to capture
data on the prevalence of food insecurity in households. The questions in the HFIAS
represent universal domains of the household food insecurity (access) experience
and can be used to assign households and populations along a continuum of
severity, from food secure to severely food insecure. The information generated by
the HFIAS can be used to assess the prevalence of household food insecurity
(access) and to detect changes in the household food insecurity (access) situation of
a population over time. 100
3.2.2 Measuring dietary diversity
Dietary diversity is defined as the number of foods consumed across and within food
groups over a reference period. FANTA’s HDDS provides a list of foods which can
be adapted to suit a particular population and has been tested in developing
countries.101, 103 The household dietary diversity score is a measure of food
Stellenbosch University https://scholar.sun.ac.za
25
consumption that reflects household economic access to a variety of foods. An
increase in dietary diversity is associated with improved socio-economic status and
household food security. 101
The decision to use this tool as an indicator of nutrient adequacy and not socio-
economic access to food was based on a discussion paper by Marie Ruel where she
provides evidence from different studies conducted in developing countries which
show that a list of food groups can be used to successfully assess the nutrient
adequacy of a household’s diet with different recall periods.103
Dietary diversity scores are created by summing either the number of individual
foods or food groups consumed over a reference period. To better reflect the quality
of the diet, the number of different food groups consumed is used, rather than the
number of different foods consumed.104 The commonly used reference period for
recall is 24 hours but this can be extended up to 15 days.103
3.2.3 Measuring urban agriculture
Some research studies on urban agriculture focus on all forms of urban agriculture;
off- and on- plot agriculture and they also include peri-urban agriculture in this fold.17,
45, 73 Other studies quantify urban agriculture in terms of the number of people
involved in the practice.45 Some academics refer to many urban agriculture claims
found in the literature as deterministic ‘universalisms’, meaning that general
sweeping statements of the importance and potential of urban agriculture to benefit
the environment and household food security have been based on ‘fragmentary
research’, as opposed to its demonstrated impact ‘on the ground’.105, 106, 107 There is
no standard tool that has been designed or used to quantitatively measure the
practice of urban agriculture or its contribution.
The tool designed and used for this study was designed to provide a quantitative
description of the characteristics of urban agriculture in the form of household food
gardens (e.g. number involved in food gardening, number of crops/livestock and
frequency of consumption of produce), which would be correlated with data collected
on the food security and dietary diversity situations of households.
Stellenbosch University https://scholar.sun.ac.za
26
3.4 ADAPTATION OF EXISTING TOOLS:
3.4.1 Household Dietary Diversity Score
In FANTA’s Household Dietary Diversity Score (HDDS), the number of food groups
used is 12. For this study it was adapted to include local foods such as locally grown
cruciferous vegetables and some not commonly used foods such as yams were
removed. After adaptation it included 13 food groups. This was as a result of the
food group of vegetables being split into two separate groups of “green leafy
vegetables” and “other vegetables”. This was done to avoid the bias by respondents
of assuming the English term “vegetables” is synonymous with just green leafy
vegetables, disregarding other vegetables.
The recall period for this section was 14 days prior to the interview. The participant
was asked if members of the household aged 5 years and above have consumed
any foods falling under certain food groups in the 14 days prior to the interview.
Responses to this section were a “Yes” or a “No” answer. The responses were
coded for by a letter with Y = “Yes” and N = “No”.
To enable analysis the text responses obtained from this section were re-coded into
numerical values; “No = 0 and “Yes” = 1. The re-coded values were then summed up
to give a household dietary diversity score. The minimum score that could be
obtained was 0 and the maximum score was 13. The higher the dietary diversity
score the more diverse the diet of that household, the lower the score the less
diverse the diet of that household.
3.4.2: Household Food Insecurity Access Scale.
The questions from the FANTA’s Household Food Insecurity Access Scale (HFIAS)
gather data on a household’s access to food and subsequent food security status.103
The HFIAS has 9 questions created in a manner where each question in ascending
order represents a generally increasing level of food insecurity. The recall period of
this section was 14 days.
Stellenbosch University https://scholar.sun.ac.za

27
The questions in this section are based on the occurrence and frequency format. For
example, the occurrence question would be; “In the past 2 weeks (14 days), did you
or any household member go to sleep at night hungry because there was not
enough food?” This is followed by a frequency question; “How often did this
happen?” In the questionnaire for the study these two questions are combined into
one question; “In the past 2 weeks (14 days), how often did you or any household
member go to sleep at night hungry because there was not enough food?”
Responses from this section were coded with numerical values. For analysis
responses obtained in the section were re-coded to include zero values. The HFIAS
generated four indicators, namely;
Household Food Insecurity Access Scale Score
Household Food Insecurity Access-related Conditions
Household Food Insecurity Access-related Domains
Household Food Insecurity Access Prevalence
The HFIAS Score was calculated by summing up the re-coded responses. The
minimum score for the HFIAS was 0 and the maximum score was 27.100 The higher
the score the less food secure a household, the lower the score the more food
secure a household. This score would be correlated with scores from the other
sections of the questionnaire.
The indicator on household food insecurity related conditions were generated by
calculating the percentage of households answering positively to each question
regardless of severity. The indicator on household food insecurity related domains
was generated by calculating the percentage of households answering positively to
specific sets of questions regardless of severity. The HFIAS prevalence was
obtained by categorising households by varying levels of food insecurity based on
the responses they gave to particular sets of questions. 100
Stellenbosch University https://scholar.sun.ac.za

28
3.5 DEVELOPMENT OF ADDITIONAL TOOLS
3.5.1 Demographic questionnaire
This section of the questionnaire was designed to gather data on the characteristics
of the population being studied. Information captured included the type of suburb in
which the household is located, the number of people living in that household and
the age distribution of members of the household and the type of landownership.
This was intended to provide a background of the population being studied. The
questions contained in this section were based on questions in the Zimbabwe
Multiple Indicator Monitoring Survey 2009.108
This section had no scoring system. It captured background information on the
population being studied.
3.5.2 Household Food Garden Score
The Household Food Garden questionnaire was designed to quantify the productivity
and frequency of use of food gardens by households by generating a score for each
household. The section also contained questions on the purchasing habits of all
households regardless of whether they had or did not have a food garden. The
design of this tool was necessitated because currently there is no tool to measure
urban agriculture.
The content of questions in this section was designed using themes and information
gathered from literature on the characteristics, typology, practice and financing of
urban agriculture particularly in developing countries including those in Southern
Africa. 15, 16, 42, 65, 69, 73, 109 - 116. The process of this section’s development is shown in
Figure 3.2.
Stellenbosch University https://scholar.sun.ac.za
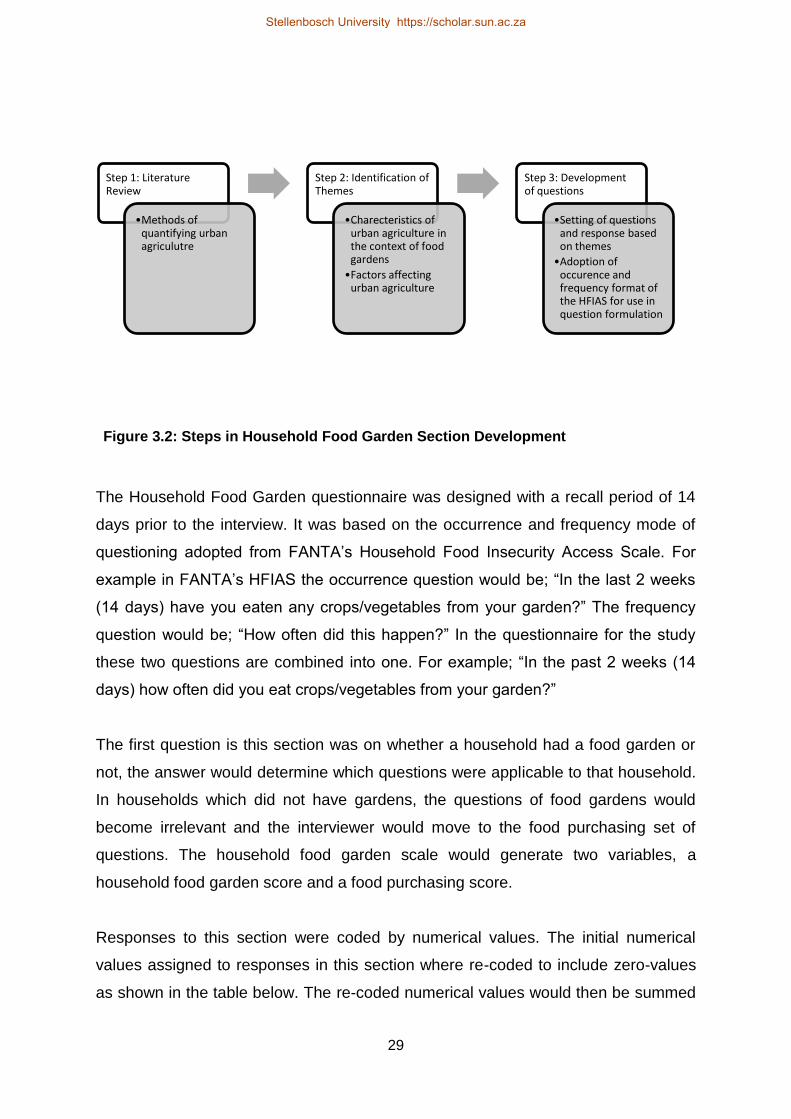
29
Figure 3.2: Steps in Household Food Garden Section Development
The Household Food Garden questionnaire was designed with a recall period of 14
days prior to the interview. It was based on the occurrence and frequency mode of
questioning adopted from FANTA’s Household Food Insecurity Access Scale. For
example in FANTA’s HFIAS the occurrence question would be; “In the last 2 weeks
(14 days) have you eaten any crops/vegetables from your garden?” The frequency
question would be; “How often did this happen?” In the questionnaire for the study
these two questions are combined into one. For example; “In the past 2 weeks (14
days) how often did you eat crops/vegetables from your garden?”
The first question is this section was on whether a household had a food garden or
not, the answer would determine which questions were applicable to that household.
In households which did not have gardens, the questions of food gardens would
become irrelevant and the interviewer would move to the food purchasing set of
questions. The household food garden scale would generate two variables, a
household food garden score and a food purchasing score.
Responses to this section were coded by numerical values. The initial numerical
values assigned to responses in this section where re-coded to include zero-values
as shown in the table below. The re-coded numerical values would then be summed
Step 1: Literature Review
•Methods of quantifying urban agriculutre
Step 2: Identification of Themes
•Charecteristics of urban agriculture in the context of food gardens
•Factors affecting urban agriculture
Step 3: Development of questions
•Setting of questions and response based on themes
•Adoption of occurence and frequency format of the HFIAS for use in question formulation
Stellenbosch University https://scholar.sun.ac.za
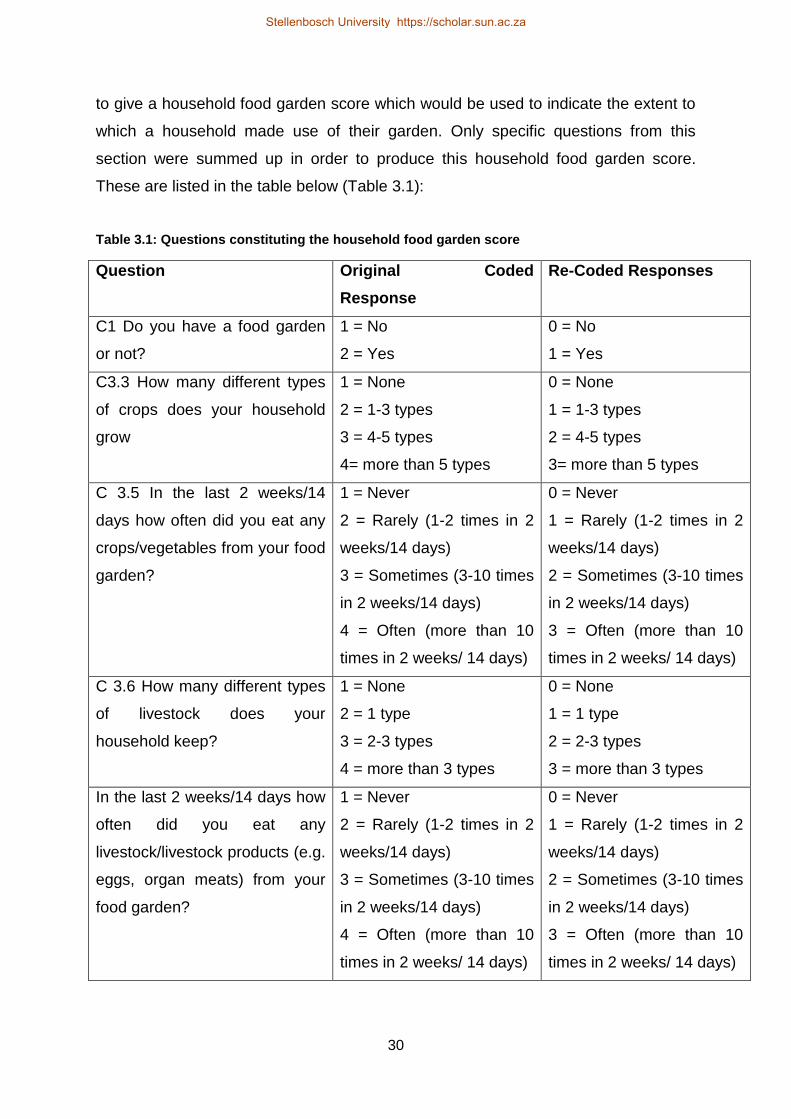
30
to give a household food garden score which would be used to indicate the extent to
which a household made use of their garden. Only specific questions from this
section were summed up in order to produce this household food garden score.
These are listed in the table below (Table 3.1):
Table 3.1: Questions constituting the household food garden score
Question Original Coded
Response
Re-Coded Responses
C1 Do you have a food garden
or not?
1 = No
2 = Yes
0 = No
1 = Yes
C3.3 How many different types
of crops does your household
grow
1 = None
2 = 1-3 types
3 = 4-5 types
4= more than 5 types
0 = None
1 = 1-3 types
2 = 4-5 types
3= more than 5 types
C 3.5 In the last 2 weeks/14
days how often did you eat any
crops/vegetables from your food
garden?
1 = Never
2 = Rarely (1-2 times in 2
weeks/14 days)
3 = Sometimes (3-10 times
in 2 weeks/14 days)
4 = Often (more than 10
times in 2 weeks/ 14 days)
0 = Never
1 = Rarely (1-2 times in 2
weeks/14 days)
2 = Sometimes (3-10 times
in 2 weeks/14 days)
3 = Often (more than 10
times in 2 weeks/ 14 days)
C 3.6 How many different types
of livestock does your
household keep?
1 = None
2 = 1 type
3 = 2-3 types
4 = more than 3 types
0 = None
1 = 1 type
2 = 2-3 types
3 = more than 3 types
In the last 2 weeks/14 days how
often did you eat any
livestock/livestock products (e.g.
eggs, organ meats) from your
food garden?
1 = Never
2 = Rarely (1-2 times in 2
weeks/14 days)
3 = Sometimes (3-10 times
in 2 weeks/14 days)
4 = Often (more than 10
times in 2 weeks/ 14 days)
0 = Never
1 = Rarely (1-2 times in 2
weeks/14 days)
2 = Sometimes (3-10 times
in 2 weeks/14 days)
3 = Often (more than 10
times in 2 weeks/ 14 days)
Stellenbosch University https://scholar.sun.ac.za
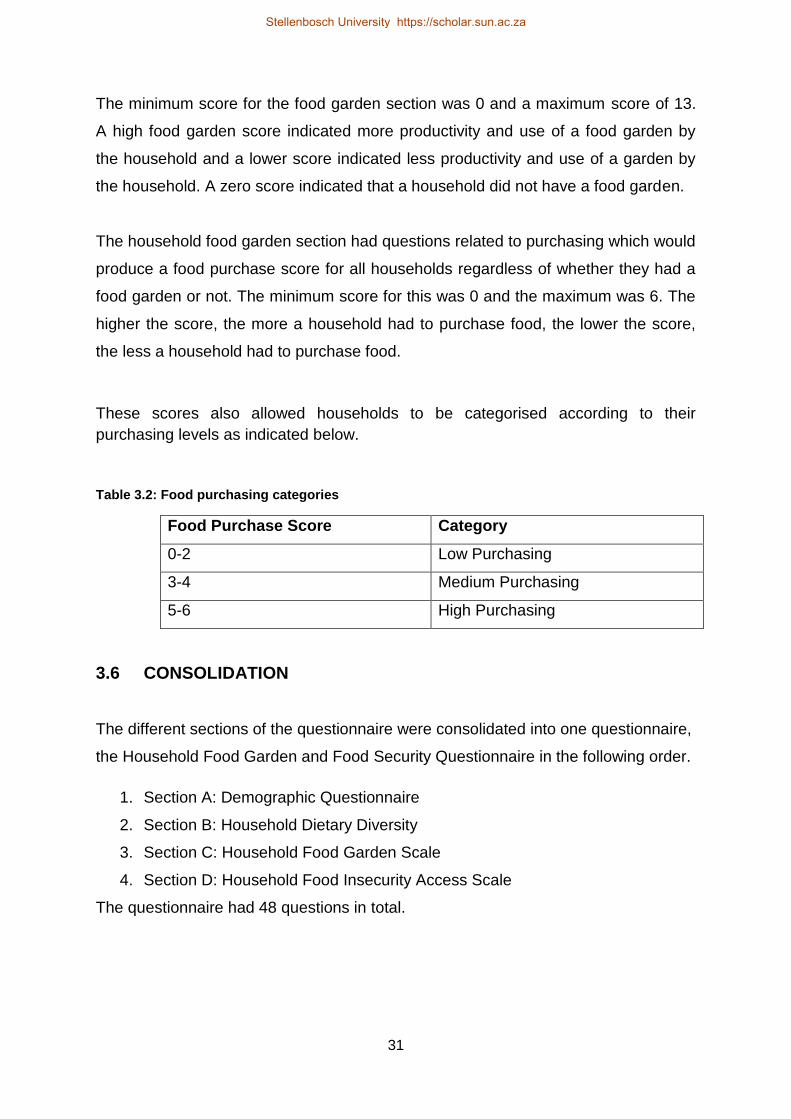
31
The minimum score for the food garden section was 0 and a maximum score of 13.
A high food garden score indicated more productivity and use of a food garden by
the household and a lower score indicated less productivity and use of a garden by
the household. A zero score indicated that a household did not have a food garden.
The household food garden section had questions related to purchasing which would
produce a food purchase score for all households regardless of whether they had a
food garden or not. The minimum score for this was 0 and the maximum was 6. The
higher the score, the more a household had to purchase food, the lower the score,
the less a household had to purchase food.
These scores also allowed households to be categorised according to their
purchasing levels as indicated below.
Table 3.2: Food purchasing categories
Food Purchase Score Category
0-2 Low Purchasing
3-4 Medium Purchasing
5-6 High Purchasing
3.6 CONSOLIDATION
The different sections of the questionnaire were consolidated into one questionnaire,
the Household Food Garden and Food Security Questionnaire in the following order.
1. Section A: Demographic Questionnaire
2. Section B: Household Dietary Diversity
3. Section C: Household Food Garden Scale
4. Section D: Household Food Insecurity Access Scale
The questionnaire had 48 questions in total.
Stellenbosch University https://scholar.sun.ac.za

32
3.7 PRE-TEST STUDY
A pre-test study was conducted to assess the validity and reliability of the
questionnaire. The pre-test sample was selected using convenience sampling from
communities similar to those which were used in the main study. The sample
consisted of 12 participants and extended over eight days. The questionnaire was
administered by the principal investigator and three research assistants. It also
provided a good opportunity to observe if data collection procedures where being
followed, and address any errors in collecting data. The inclusion and exclusion
criterion for the main study was used in selecting households for the pre-test. This
data was excluded from the main study.
The questionnaire was administered to participants on the first day (Day 1) of the
pre-test period and again on the last day (Day 8) of the pre-test period. The
participants’ responses were recorded as well as their understanding of the
questions and language used in the questions in the form of a rating scale on the
first day of the pre-test period. Participants were asked to report any terms or words
they did not understand after each question, these were also recorded. The
questionnaire was then re-administered on the last day of the pre-test period
excluding the rating section.
3.7.1 Pre-test objectives
1. Face validity: Identify terms/questions which were not well understood by
participants.
2. Assess content validity of the questionnaire using comments obtained from
experts with extensive knowledge of urban agriculture.
3. Assess the reliability of the questionnaire by comparing responses from the two
sets of data collected during the test-retest period.
No hypotheses were formulated for the pre-test study.
Stellenbosch University https://scholar.sun.ac.za

33
3.7.2 Validity
Only face and content validity were sought for the questionnaire. This was due to the
fact that the questionnaire contained different tools adapted to suit the study
including two investigator designed sections. It was also due to alterations in the
recall periods for the HDDS and HFIAS which limited how findings of this study could
be compared to those of other studies.
Face validity
Face validity was assessed by administering the questionnaire to participants and
assessing their level of understanding of each question using a rating scale which
also prompted them to report any terms they did not understand in the questions.
The rating scale is shown in the Table 3.3. The responses from this would be
summed up to give a score of understanding. This score has a minimum of 48 and a
maximum of 192. The higher the score, the more understood the questionnaire. In
any questions which were not well understood (questions with ratings of; “not well”
understood or “somewhat” understood), participants were asked to list the terms
which they did not understand.
Table 3.3: Rating scale for level of understanding of questions
1 2 3 4
Not at all Somewhat Well Very Well
Content validity
Content validity of the questionnaire was assessed by submitting the questionnaire
for review by three experts with extensive knowledge of food security and urban
agriculture prior to pre-testing.
Stellenbosch University https://scholar.sun.ac.za

34
3.7.3 Reliability
Reliability of this questionnaire as a single tool could not be assessed as it contained
different sections drawn from different tools thus a reliability co-efficient was
calculated for each section. The questionnaire was administered using a test- retest
method. It was administered on day 1 of the pre-test period and repeated on day 8 of
the pre-test period. Their test score for each section of the questionnaire and for
each of the two interviews were calculated. This provided two sets of scores for each
section of the tool excluding the demographic section
A test-retest reliability co-efficient was calculated for each pair of scores for the
different sections using Pearson’s correlation. The co-efficient values from this
analysis showed that the pairs of scores from each section were closely related
though varying in degree.
3.8 PRE- TEST DATA ANALYSIS AND RESULTS
3.8.1 Data analysis
Data from the pre-test was analysed using IBM’s SPSS program. Frequency tables
were used to generate descriptive statistics for the data set.
Pearson’s correlation was used to assess the relationship between the two sets of
scores from the different sections of the questionnaire. This was to gain
understanding on how close the pairs of data were linked. A p-value of p < 0.05 was
used to represent statistical significance.
3.8.2 Face validity
The questionnaire was well received by respondents in both English and Shona as
shown by a mean score of understanding of 190.3 (± 2.2). For the majority of
questions, there were no difficulties with terms reported. However some questions
had terms with which respondents were not familiar such as wild fruits and
Stellenbosch University https://scholar.sun.ac.za
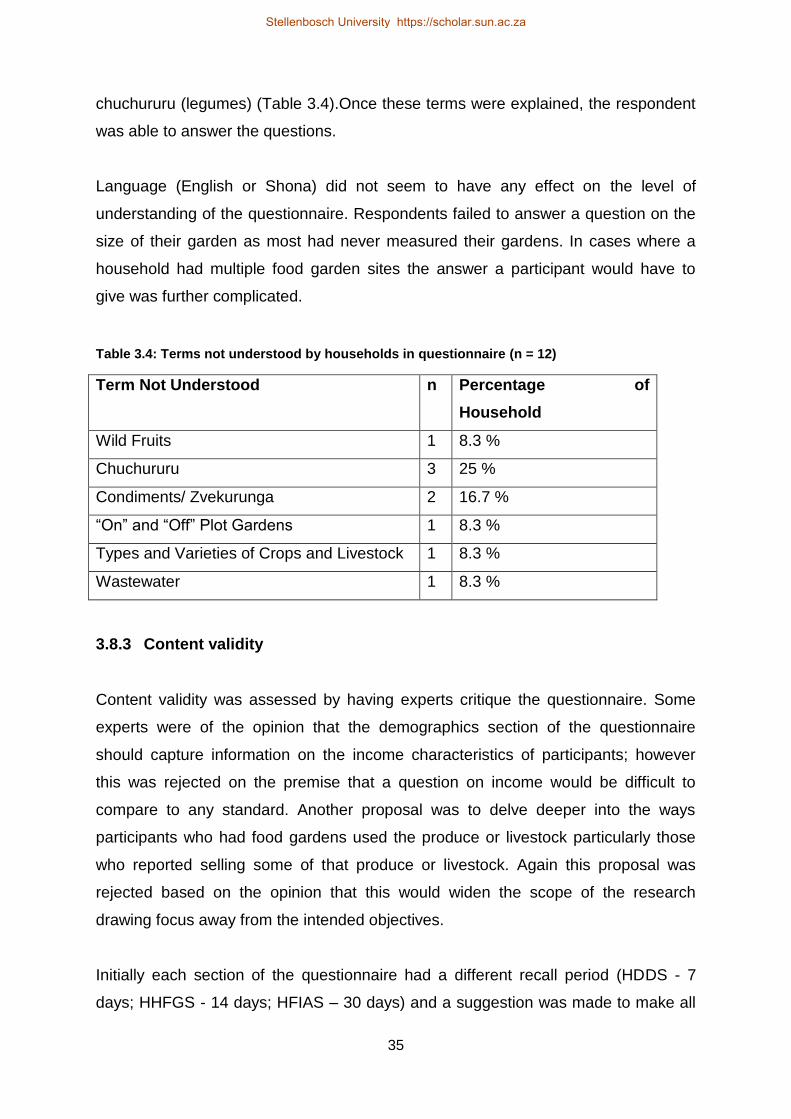
35
chuchururu (legumes) (Table 3.4).Once these terms were explained, the respondent
was able to answer the questions.
Language (English or Shona) did not seem to have any effect on the level of
understanding of the questionnaire. Respondents failed to answer a question on the
size of their garden as most had never measured their gardens. In cases where a
household had multiple food garden sites the answer a participant would have to
give was further complicated.
Table 3.4: Terms not understood by households in questionnaire (n = 12)
Term Not Understood n Percentage of
Household
Wild Fruits 1 8.3 %
Chuchururu 3 25 %
Condiments/ Zvekurunga 2 16.7 %
“On” and “Off” Plot Gardens 1 8.3 %
Types and Varieties of Crops and Livestock 1 8.3 %
Wastewater 1 8.3 %
3.8.3 Content validity
Content validity was assessed by having experts critique the questionnaire. Some
experts were of the opinion that the demographics section of the questionnaire
should capture information on the income characteristics of participants; however
this was rejected on the premise that a question on income would be difficult to
compare to any standard. Another proposal was to delve deeper into the ways
participants who had food gardens used the produce or livestock particularly those
who reported selling some of that produce or livestock. Again this proposal was
rejected based on the opinion that this would widen the scope of the research
drawing focus away from the intended objectives.
Initially each section of the questionnaire had a different recall period (HDDS - 7
days; HHFGS - 14 days; HFIAS – 30 days) and a suggestion was made to make all
Stellenbosch University https://scholar.sun.ac.za

36
the recall period uniform (14 days) thus all the recall period for the all the section of
questionnaire was changed to 14 days. The recall periods were changed because
there were concerns that having different recall periods would require that data from
the sections with shorter recall periods be extrapolated to match the sections with
the longest recall period when correlating findings which would have compromised
the accuracy of these findings.
3.8.4 Internal reliability
Pearson’s correlation yielded different co-efficient values for each section of the
questionnaire. Strong correlations between the pairs of scores were found in three of
the sections of the questionnaire; The Household Food Garden Scores, The Food
Purchase Scores and the Household Food Insecurity Access Score (Table 3.5)
however the concern was that these results may be inaccurate due to the small
sample size of the pre-test population and also because analysis did not look at each
individual question. These results were not used as an indication of reliability thus
the reliability of the questionnaire was not successfully determined.
Table 3.5: Reliability co-efficient for questionnaire sections (n = 12)
Test Scores Pearson’s
Correlation P- value
Household Dietary Diversity Scores 0.674 p = 0.016
Household Food Garden Scores 0.978 p ˂ 0.001
Food Purchase Scores 0.972 p < 0.001
Household Food Insecurity Access Scores 0.762 p = 0.004
3.8.5 Conclusion
The mean time taken to administer the questionnaire was 26 minutes. The question
pertaining to the size of a household food garden was omitted from the final
questionnaire as all households in the pre-test study failed to respond to this
question. Households had never measured the size of their gardens, and this
Stellenbosch University https://scholar.sun.ac.za
37
response would be complicated if a household had both an “on-plot” and “off-plot”
garden.
Comments given by experts suggested that the questionnaire contained sufficient
content to capture data to meet the study objectives, however some grammar
needed correction and the recall periods needed to be uniform.
The questionnaire was well received by participants in the pre-test as the majority
reported that they had understood questions clearly and in instances where they had
experienced difficulties comprehending question they highlighted the terms which
limited their understanding.
To improve the comprehension of questions it was resolved that any terms (e.g. on-
plot or off-plot, varieties, condiments) in the questionnaire would be supported by a
brief explanation when the respondents asked for such an explanation and in some
instances examples to which the respondent could relate e.g. on-plot food garden- a
place located within you property on which you grow crops or keep livestock.
Research assistants were trained in this aspect before data collection for the main
study.
Internal reliability for the questionnaire was not successfully determined.
Stellenbosch University https://scholar.sun.ac.za
38
CHAPTER 4: METHODOLOGY
4.1 INTRODUCTION
In conducting this research, quantitative methods were used to investigate the
relationship between household food gardens and food security. These measures
were employed so as to not only understand the nature of the relationship between
household food garden and food security but also the motivations behind the
practice of household food gardens. This chapter outlines the research questions,
hypotheses, and research methodology used in this study.
4.2 AIMS AND OBJECTIVES
4.2.1 Aims
This study aimed to understand the relationship between household food gardens
and household food security in urban areas. Household food gardens are considered
part of urban agriculture which has played some role in ensuring a food supply for
urban residents. From a human rights perspective, urban agriculture is considered
as an intervention or practice which can assist in realizing the right to food.
4.2.2 Objectives:
To investigate the relationship between having a household food garden and
household food security in the southern districts of Harare (consisting of the
southern, south eastern and south western districts of Harare)
To assess the association between having a household food garden and
household dietary diversity in the southern districts of Harare.
Stellenbosch University https://scholar.sun.ac.za

39
Aligned with these two objectives were two hypotheses:
4.2.3 Hypotheses
1. Literature suggests that with the growth of urban populations in most developing
countries during the last half of the 20th century, urban food production and
distribution systems became less and less reliable. In response, urban agriculture
became increasingly common in an ever-growing number of countries. It can be
considered a coping strategy in response to food insecurity which is the
foundation for the following hypotheses:
H0: There is no association between having a household food garden and
household food security in the southern districts of Harare.
VERSUS
H1: There is an association between having a household food garden and
household food security in the southern districts of Harare.
2. Food security cannot be thought of in terms of quantity alone but also quality of
which dietary diversity can be used as a proxy for dietary quality. It is important to
examine whether urban agriculture contributes to dietary quality thus the
following hypothesis:
H0: There is no association between having a household food garden and
household dietary diversity in the southern districts of Harare.
VERSUS
H1: There is an association between having a household food garden and
household dietary diversity.
To measure variables for this study a questionnaire with four different sections was
used (Chapter 3). This questionnaire had a demographic section, a household
dietary diversity section, a household food garden scale section and a household
food insecurity section.
Stellenbosch University https://scholar.sun.ac.za

40
4.3 STUDY DESIGN
In conducting this research, quantitative methods were used to investigate the
relationship between household food gardens and food security. These measures
were employed so as to understand the nature of the relationship between
household food gardens and food security
4.3.1 Sample population
Multi-stage sampling was used to select the sample population. Purposive sampling
was used to select the districts which would form the sampling frame. Due to
limitations in accessibility and resources, only those districts in the southern part of
Harare were selected namely the southern, south eastern and south western
districts. Using the boundaries used by the City Health Department (Addendum A) to
mark out the chosen health districts on a larger more extensive map of Harare, the
residential suburbs falling under these districts were Arcadia, Braeside, Chadcombe,
Cranborne, Glen Norah, Hatfield, Highfields, Hillside, Houghton Park, Induna,
Lochinvar, Logan Park, Malvern, Mbare, Midlands, Msasa Park, Park Meadow
Lands, Park Town, Prospect, Queensdale, Saint Martin’s, Southerton, Sunningdale,
Waterfalls and Wilmington Park.
The suburbs in the selected districts were divided into three strata namely: low
density, medium density and high density. Classification into strata was based on the
parameters used by the city’s Department of Physical Planning. Low density suburbs
had households which occupied an area between 1000 m2 and 4000 m2, high
density suburbs had households which occupied 200 m2 to 300 m2 and medium
density suburbs had households which occupied an area above 300 m2 but below
1000 m2. 117 This classification would used as a proxy for different income level. The
more populated areas would represent the less affluent households and the less
populated area would represent the more affluent households.
Cluster random sampling was used to draw suburbs from the strata. Thus each
suburb was considered a cluster and one cluster was randomly drawn from each
stratum. The final number of selected clusters was three consisting of Logan Park
Stellenbosch University https://scholar.sun.ac.za
41
(low density suburb), Msasa Park (medium density suburb) and Mbare (high density
suburb).
4.3.2 Sample size
The proportion formula for calculating a sample size was used in determining the
number of households needed in the study. Using a confidence interval of 95 %, a
critical standard z score of 1.96, a probability value of 0.5 and a margin of error of
9%, the sample size was determined using the formula displayed below.
k
Key: z = critical standard z score
p = probability value
ME = margin of error
A sample size of 119 households was obtained which was round up to 120 to ensure
the same number of households would be interviewed in each suburb. This sample
size of households accommodated the resources allocated for the project.
Systematic random sampling was then used to select individual households in each
cluster. From each cluster 40 households had to be interviewed. Using mapping lists
from the City’s Surveyor Offices, the number of households in each suburb was
determined by counting the number of households appearing on the mapping list and
divided by the number of households needed from each cluster (40). The areas to be
sampled were chosen based on the accuracy of the mapping lists obtained from the
City’s Surveyor Office. From these mapping lists it was determined that Logan Park
had 144 households and thus every third household would be interviewed. The area
sampled in Mbare had 197 households and thus every fourth household would be
interviewed and the area sampled in Msasa Park had 190 households and every
fourth household would be interviewed.
kSource: Centre for Statistical Consultation. Sample Sizes Proportion. Stellenbosch University. 2009.
Stellenbosch University https://scholar.sun.ac.za
42
4.3.3 Inclusion and exclusion criteria
A “household” was defined as any group of people residing at a site and sharing the
same eating and sleeping arrangements.
Households that were included in the study sample had to meet all of the following
criteria:
Households with or without a food garden
Households with a person 15 years or older staying in the house at least four
days a week
Households that were excluded from the study sample had to meet the following
criteria:
Institutional households such as hotels, schools, hostels, hospitals etc.
Households with no person older than 15 years staying in the house for at least
four days a week
If a household did not meet the inclusion criteria then the interviewer would have
move on to the next household. Where there were more than one household present
on site the household that agreed to take part in the study would be interviewed.
Respondents were selected based on who was present at the household during the
interview and who agreed to take part in the study.
4.4 DATA COLLECTION TOOL
A household food garden questionnaire was used to collect data. This questionnaire
had four different sections;
Section A: Demographic Questionnaire: collecting information on populations
characteristics.
Section B: Household Dietary Diversity: collecting information on food groups
consumed by households in the 14 days period prior to the interview.
Stellenbosch University https://scholar.sun.ac.za
43
Section C: Household Food Garden Scale: collecting information on characteristics
and use of household food gardens in the 14 days prior to the interview.
Section D: Household Food Insecurity Access Scale: collecting information on the
food security conditions experienced by households in the 14 days period prior to the
interview.
This questionnaire was investigator administered.
4.5 RESEARCH ASSISTANT TRAINING
Research assistants for this study were selected from a local university. The
researcher selected three second-year students who had some exposure to
research data collection. Research assistants were trained for 5 days in
administering the questionnaire with mock interviewing exercises.
The training program was based on information provided in key documents on how
interviews were expected to proceed and ways to avoid leading participants100, 101, 104
For example one of the key points interviewers had to observe and make clear to the
participant when asking questions in the dietary diversity section of the questionnaire
was to only include foods intended for consumption by all members of the household
including food made outside of the home, any deviation from this had to be
documented.
For the HFIAS interviewers were trained to ask a question and give the participant
time to answer. They would only explain a question when the participant requested
further explanation. They were instructed to avoid influencing the participant’s
response.
Stellenbosch University https://scholar.sun.ac.za
44
4.6 DATA COLLECTION PROCEDURES
4.6.1 Collection of data
The research team would meet at a determined location each day of data collection
and each person would receive their set of clean questionnaires for their targeted
households. The team consisted of one principal investigator and three research
assistants. The team was divided into two groups of two members each. The
principal investigator would alternate between the two teams for each day that data
was being collected in a particular area. The principal investigator would observe
each assistant for the first two household visits. This was done as a way of ensuring
assistants were conducting interviews as trained.
Households were organised lining either side of a street. One group would interview
households on one side of the street and the second group would interview
households on the opposite side of the street. This would continue until the street
area included in the mapping list was exhausted, the team would move to the next
street and continue the process of interviewing. When the number of households
required from that suburb was reached, the team would stop the interviews and meet
for consolidation of information from questionnaires.
4.6.2 Interviewing
The interviewers were expected to introduce themselves and explain the purpose of
their visit. If the participants consented, the interviewer would begin the interview by
supplying the participant with a consent form which they would go through and sign
once they understood it. The interviewer would ask the participant which language
they wanted to use for the interview; the choice was between Shona and English.
The interviewer would then give a brief explanation about the questionnaire and the
types of questions it contained. The interviewer would begin to ask questions in the
questionnaire and recorded the response in code form. When the interview was
complete, the interviewer would thank the participant and leave a copy of the signed
consent form with the participant.
Stellenbosch University https://scholar.sun.ac.za
45
4.6.3 Securing questionnaires
Each research group had three plastic folders, one designated for questionnaires
and consent forms, one for signed consent forms and lastly one for completed
questionnaires. After each interview, the interviewer would place the consent in its
designated folder and the completed questionnaire in its designated folder.
In consolidating data, both interviewers in the team were expected to be present with
the set of questionnaires they had administered to ensure accuracy in data input.
The interviewers would go through the questionnaires they had completed, checking
for any errors in their recording. For each questionnaire data was entered into an
excel spread sheet by the principal investigator and the interviewer responsible for
administering that questionnaire would check the data entered against the
information they recorded to check for any errors in inputting data.
4.6.4 Duration of data collection
Data collection was conducted in February 2013. The mean time taken to administer
the questionnaire was 26 minutes. Data collection was conducted over 10 working
days. This was to ensure data would be collected with accuracy and it would also
ensure sufficient time for accurate entry into the excel spreadsheet.
This 10 day period ensured accuracy in that the research team would interview 12
households each day. This would mean each group would interview 6 households
per day. The research team would begin data collection at 8:30 am and finish data
collection at 13:00 pm. The assumption was this would provide sufficient time for the
interviewer to walk from household to household interviewing participants. The
length of time provided seemed sufficient for the interviewer to carry out their duties
without getting exhausted such that they would begin making errors in data
collection. Interviewing a limited number of households each day meant the
interviewer would be able to pay close attention to each participant and the
responses that participant would provide.
Stellenbosch University https://scholar.sun.ac.za

46
After data collection the team would take a break and then reconvene to begin
entering data into excel. The research team would then discuss logistics for the
following day before adjourning for the day.
4.6.5 Sample coverage
The study sample consisted of 120 households from three different suburbs. Forty
households were to be interviewed per suburb however seven households dropped
out of the study (two households from Mbare, three households from Msasa Park
and two households from Logan Park) after data collection was completed resulting
in a sample size of 113. This constituted a response rate of 94.2%.
The main reason for dropping out of the study was the concern that the participant’s
anonymity and confidentiality would not be ensured (1 household from Mbare and 2
Households from Logan Park). Some participants were concerned that the study
may be politically affiliated and may bear future repercussions which could not be
determined (1 Household from Mbare and 2 from Msasa Park). Other participants
were disappointed that the study did not offer future incentives (1 House from Mbare
and 1 from Msasa Park).
4.7 ETHICAL CONSIDERATIONS
This study was conducted in accordance with the ethical guidelines and principles of
the International Declaration of Helsinki, South African Guidelines for Good Clinical
Practice and the Medical Research Council (MRC) Ethical Guidelines for Research.
This study protocol was submitted for ethical approval to the Health Research Ethics
Committee, the Faculty of Medicine and Health Sciences, Stellenbosch University
and approval was received on the 12th of November 2012; Ethical Approval Number:
S12/08/228 (Addendum C). Approval to conduct the study was also sought from
Stellenbosch University https://scholar.sun.ac.za
47
Harare’s Department of Housing and Community Services (Addendum D) which is
the head office for local district offices and approval was received.
Participation in the study was voluntary. Those who agreed to take part in the study
signed their name on an informed consent form (Addendum E) which was kept
separate from the data collected in the study. The consent form was explained in
detail to the participants in this study and sufficient time was given to participants to
read the consent form. It was written in both English and Shona. If a participant could
not read, the principal investigator or research assistant read the consent form to the
participant. If a participant could not write they were allowed to sign the form with an
“X”. No participant was allowed to take part in the study without signing a consent
form. The participant received a copy of the consent form after signing it.
Participant anonymity was maintained by ensuring that no names of any kind were
documented on the questionnaire. Each participant received a questionnaire with an
assigned random number for the purpose of data capturing.
Confidentiality - Each participant was informed that the information they provide
could be used in public presentations or scientific publications and that their identity
would not be exposed. The consent forms and questionnaires for participants who
pulled out of the study were withdrawn from the data entry and destroyed as per their
requests.
Stellenbosch University https://scholar.sun.ac.za
48
CHAPTER 5: MAIN STUDY DATA ANALYSIS
5.1 INTRODUCTION
This chapter details the manner in which data was analysed and the results that
were drawn from this analysis.
5.2 DATA ANALYSIS
Data for the main study was analysed using STATA. A statistician from the
Biostatistics Unit at Stellenbosch University’s Faculty of Medicine and Health
Sciences was consulted for analysis of data.
The first step in data analysis was to clean the data. This was done by rechecking all
the entries against their corresponding questionnaire. This was followed by checking
if any values were missing or if any values existed where there should not be a
value.
Summary statistics were used to describe the variables. Distribution of variables was
presented with frequency tables. Means were used as the measures of central
location for ordinal and continuous responses and standard deviations as indicators
of spread.
Descriptive statistics were mainly used in analysing data from the demographic
section of the questionnaire. These descriptions were used to provide information on
the characteristics of the population.
Data collected in this study was ordinal and was not normally distributed, so to
examine the relationship and the strength of the relationship between the variables,
Spearman’s rank correlation was used. This would produce a correlation coefficient.
Spearman’s correlation measures the strength of an association between two
variables measured on at least an ordinal scale.
Stellenbosch University https://scholar.sun.ac.za
49
Spearman’s rank correlation was used in assessing the relationship between the
different scores obtained from the questionnaire. Spearman’s rank correlation was
used in correlating the household food garden score and i) dietary diversity score; ii)
household food insecurity access score and iii) food purchasing score. It was also
used in correlating dietary diversity scores with food purchasing scores.
The Mann- Whitney U test was used to test for differences between scores for the
two subgroups in this study. The relationship between categorical variables was
analysed using Fisher exact tests. A p-value of p < 0.05 was used to represent
statistical significance in hypothesis testing.
Stellenbosch University https://scholar.sun.ac.za
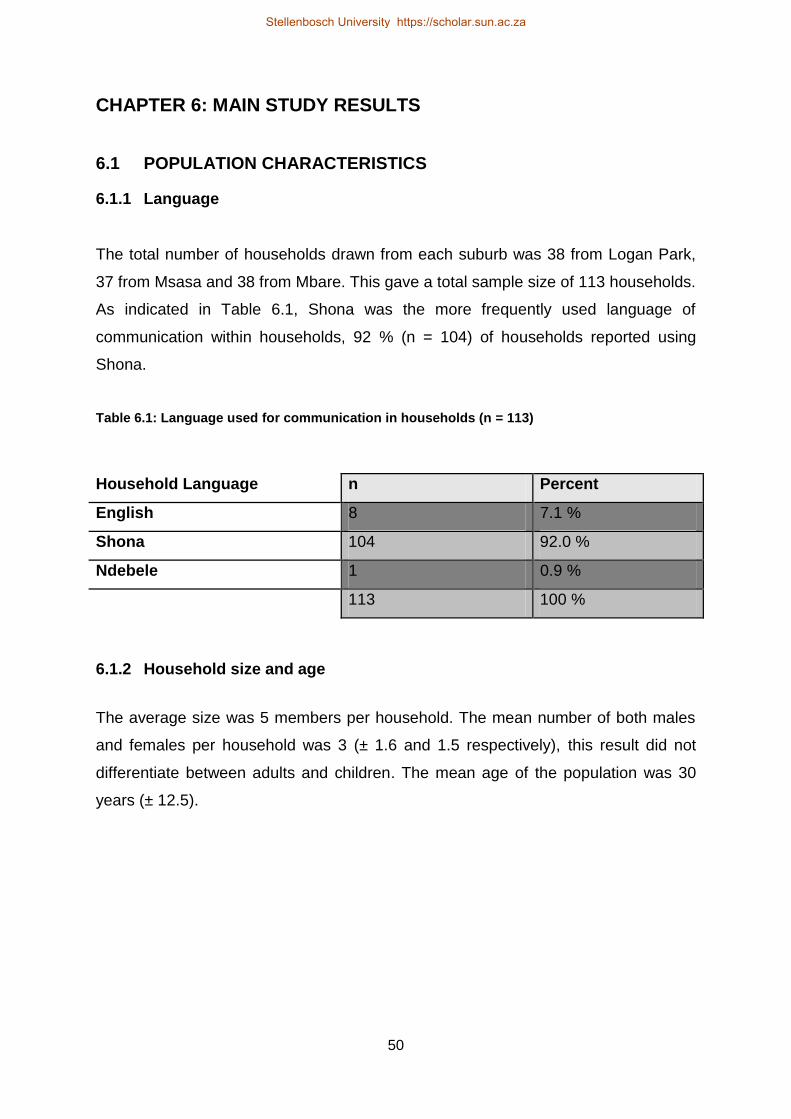
50
CHAPTER 6: MAIN STUDY RESULTS
6.1 POPULATION CHARACTERISTICS
6.1.1 Language
The total number of households drawn from each suburb was 38 from Logan Park,
37 from Msasa and 38 from Mbare. This gave a total sample size of 113 households.
As indicated in Table 6.1, Shona was the more frequently used language of
communication within households, 92 % (n = 104) of households reported using
Shona.
Table 6.1: Language used for communication in households (n = 113)
Household Language n Percent
English 8 7.1 %
Shona 104 92.0 %
Ndebele 1 0.9 %
113 100 %
6.1.2 Household size and age
The average size was 5 members per household. The mean number of both males
and females per household was 3 (± 1.6 and 1.5 respectively), this result did not
differentiate between adults and children. The mean age of the population was 30
years (± 12.5).
Stellenbosch University https://scholar.sun.ac.za

51
6.1.3 Suburb and land ownership
There was no weighting done on the sample population thus households were
evenly distributed amongst the three suburbs included in the study i.e. 40
households per district. A significant number of households 61 % (n = 69), owned the
property on which their household was located. The remaining households were
leasing the property or the property was state owned as shown in Figure 6.1.
Figure 6.1: Percentage of households according to type of land ownership (n = 113)
61.1 %
37.2 %
1.8 %
Private Leased State Owned
Pe
rce
nta
ge
of
Ho
us
eh
old
s
Land ownership
Stellenbosch University https://scholar.sun.ac.za

52
Food gardens were more frequently found in households who owned their property
in comparison to households who were leasing their property (p < 0.001) (Table 6.2).
In households which had food gardens, 81.5 % of them were on land which was
privately owned. For those household without food gardens, 66.7 % these household
occupied leased property. The two households occupying state owned land had a
food garden.
Table 6.2: Comparison of landownership and occurrence of food gardens (n = 113)
6.2 DIETARY DIVERSITY
Findings from dietary diversity questionnaires showed that households generally
reported having highly diverse diets; the mean dietary diversity score was: 11.9
(±1.18). The mean dietary diversity score for household with food gardens was 12 (±
1.13), the mean dietary diversity score for households without food gardens was
11.8 (± 1.24). There was no significant difference between the dietary diversity
scores for households with food gardens or those without food gardens (U = 1353, p
= 0.205)
All households had consumed cereals and meat and meat products in the 14 days
prior to the interview. Vegetable and fruit consumption was also high as over 90 % of
household confirmed they had eaten dark green leafy vegetables, other vegetables
and fruits in the 14 days prior to the interview as can be seen in Figure 6.2.
The least frequently consumed food was fish with only 57.5 % (n = 65) of participants
reporting that their household has consumed fish in the 14 days prior to the
interview. Around 80 % of the population of the population consumed tubers and
roots, eggs and legumes, nuts and seeds.
Privately Owned Leased State Owned Total
No Food Garden 33.3 % (n = 16) 66.7 % (n = 32) 0 % 100 % (n = 48)
Have a Food Garden 81.5 % (n = 53 15.4 % (n = 10 3.1 % (n = 2) 100 % (n = 65)
69 42 2 113
Stellenbosch University https://scholar.sun.ac.za

53
Figure 6.2: Percentage of households according to the thirteen groups in dietary diversity score questionnaire (n = 113)
Cereals Roots and
Tubers
Dark Green Leafy
Vegetables
Other Vegetable
s Fruits
Meat and Organ Meat
Eggs Fish Legumes, Nuts and
Seeds
Milk and Milk
Products
Oils and Fats
Sweets
Spices, Seasonings, Sauces
and Beverages
Yes 100 83.2 98.2 95.6 99.1 100.0 81.4 57.5 85.0 92.9 100.0 99.1 100.0
No 0 16.8 1.8 4.4 0.9 0.0 18.6 42.5 15.0 7.1 0.0 0.9 0.0
0
10
20
30
40
50
60
70
80
90
100
Pe
rce
nta
ge o
f H
ou
seh
old
s
Food Groups
Stellenbosch University https://scholar.sun.ac.za
Stellenbosch University https://scholar.sun.ac.za
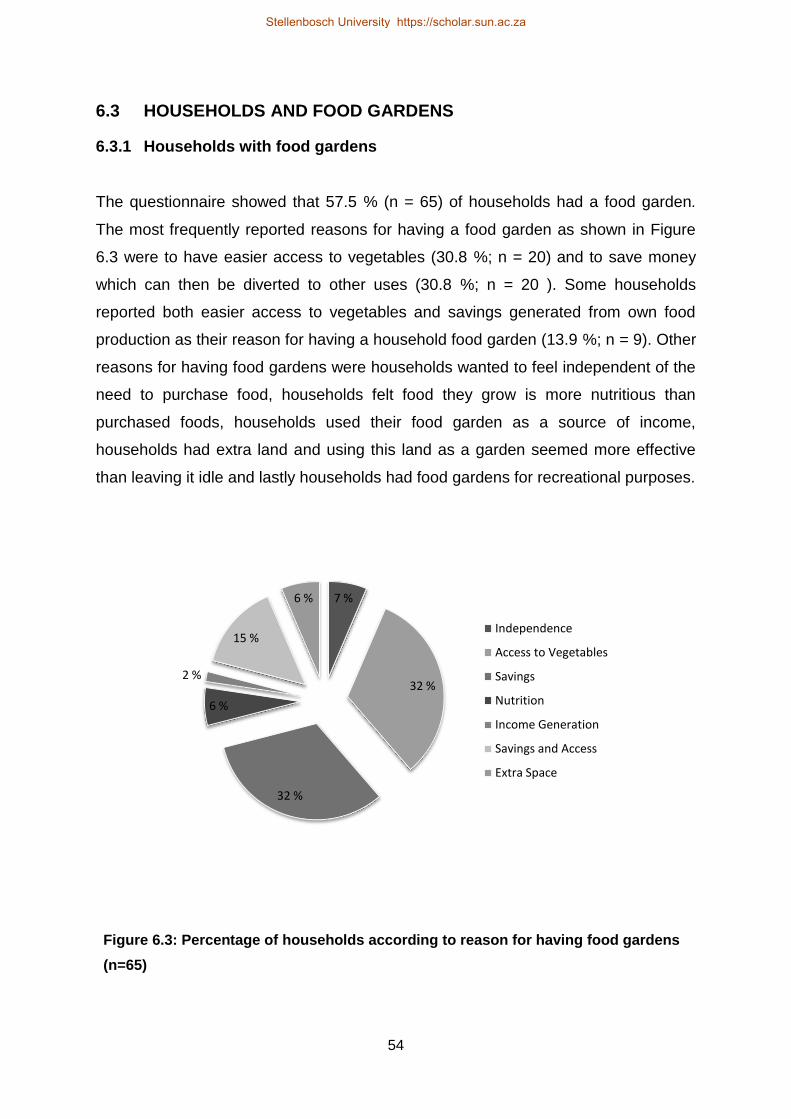
54
6.3 HOUSEHOLDS AND FOOD GARDENS
6.3.1 Households with food gardens
The questionnaire showed that 57.5 % (n = 65) of households had a food garden.
The most frequently reported reasons for having a food garden as shown in Figure
6.3 were to have easier access to vegetables (30.8 %; n = 20) and to save money
which can then be diverted to other uses (30.8 %; n = 20 ). Some households
reported both easier access to vegetables and savings generated from own food
production as their reason for having a household food garden (13.9 %; n = 9). Other
reasons for having food gardens were households wanted to feel independent of the
need to purchase food, households felt food they grow is more nutritious than
purchased foods, households used their food garden as a source of income,
households had extra land and using this land as a garden seemed more effective
than leaving it idle and lastly households had food gardens for recreational purposes.
Figure 6.3: Percentage of households according to reason for having food gardens
(n=65)
7 %
32 %
32 %
6 %
2 %
15 %
6 %
Independence
Access to Vegetables
Savings
Nutrition
Income Generation
Savings and Access
Extra Space
Stellenbosch University https://scholar.sun.ac.za
55
Sixty percent (n = 39) of households had only one type of crop (types of cropsl
included green leafy vegetables, other vegetables such as onions or tomatoes and in
some cases fruits such as guavas or bananas) in their garden of which 95 % of them
had only leafy green vegetables in their garden. This highlighted the bias by food
garden-owning households towards growing green leafy vegetables. Only 12.3 % (n
= 8) of household had four or five types of crops in their garden, (Table 6.3). No
households reported having more than 5 types of crops in their garden. Households
tended to have “on-plot” food gardens, while less that 14 % (n = 9) had both the “on-
plot” and “off plot” gardens.
The majority of household food gardens were self-funded, with 89.2 % (n = 58) of
households paying for the maintenance of their food gardens with their own money.
Other sources of funding/support for household gardens were “family outside the
household”, “friends” and “neighbours”. The most frequently reported purpose for
crops grown in household gardens was own consumption (76.9 %; n = 50), and the
remainder of household used their crops for both own consumption and selling for
profit.
Of the 65 households who had food gardens only 12 households were rearing
livestock. Seventy five percent (9/12) of the livestock rearing households had one
type of livestock (types of livestock ranged from chickens, rabbits, quail, turkey) and
only 25 % (3/12) had between two and three types of livestock.
It was observed that household livestock rearing was biased towards chicken
rearing. 50 % (6/12) of the households were rearing livestock for their own
consumption and for selling/income generation. Only 1 household was rearing
livestock for the sole purpose of selling it for income. The remainder were rearing
livestock for own household consumption.
l Types of crops/livestock meant the different categories of vegetables or livestock a household was growing or rearing e.g. rabbits and chickens or carrots and tomatoes
Stellenbosch University https://scholar.sun.ac.za

56
Table 6.3: Percentages of households according to number of different crops or livestock in their food gardens (n = 65).
6.3.2 Frequency of Use of Household Food Gardens
Households were asked how often they ate produce from their household food
gardens (Table 6.4). Fifty eight percent (n = 38) reported eating crops from their
garden more than 10 times in the 14 days prior to the interview. Only 4.6 % (n = 3) of
households did not eat any crops from their garden within the 14 days prior to the
interview.
Shown in Table 6.4 the frequency of livestock consumption by households which
were rearing did not vary significantly. Sixteen percent (n = 2) of the households had
not consumed any livestock from their garden, and 33.3 % (n = 4) consumed
livestock from their garden between three and 10 times within the 14 days prior to
the interview.
Table 6.4: Percentages of households with food gardens according to number of times they consumed crops or livestock from their garden
Percentage of Households
Number of Crop and
Livestock Types Crops Livestock
None 81.5 % (n = 53)
1 60.0 % (n = 39) 13.9 % (n = 9)
2-3 27.7 % (n = 18) 4.6 % (n = 3)
More than 3 12.3 % (n = 8) 0 0 %
Frequency of
Consumption
Crop Consumption
(n = 65)
Livestock Consumption
(n = 12)
Never 4.6 % (n = 3) 16.7 % (n = 2)
Between 1 and 3 times 15.4 % (n = 10) 25.0 % (n = 3)
Between 3 and 10 times 21.6 % (n = 14) 33.3 % (n = 4)
More than 10 times 58.5 % (n = 38) 25.0 % (n = 3
Stellenbosch University https://scholar.sun.ac.za
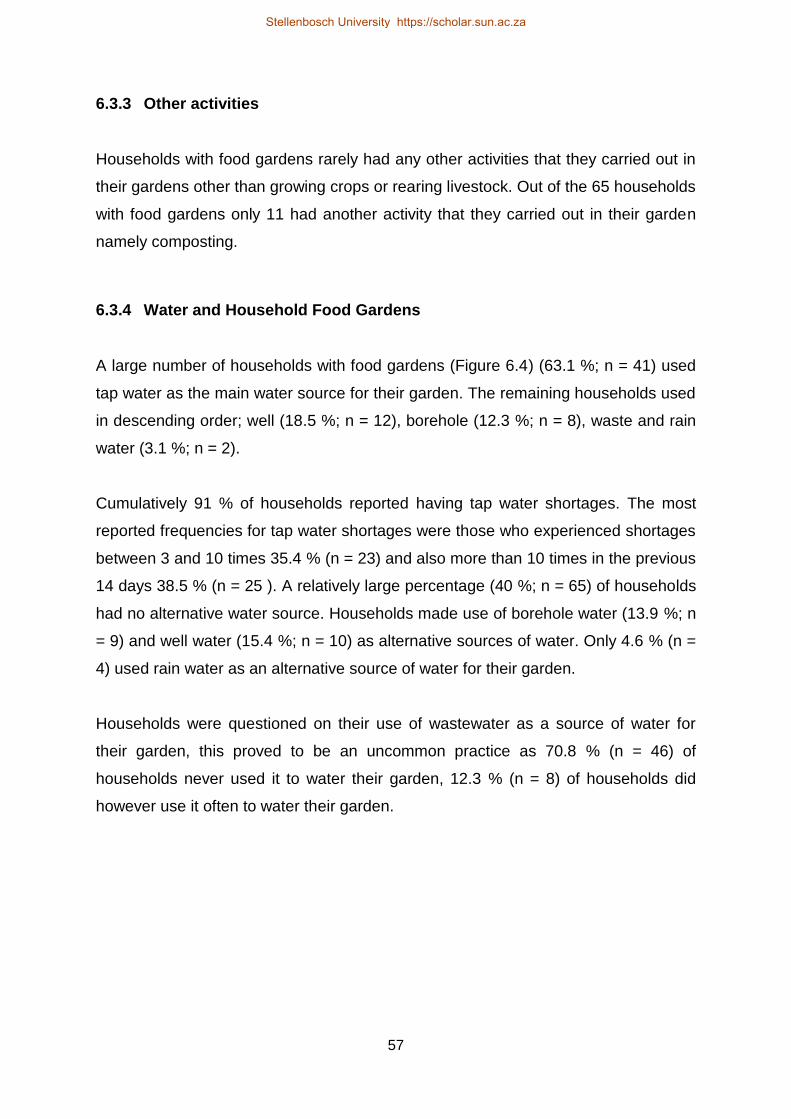
57
6.3.3 Other activities
Households with food gardens rarely had any other activities that they carried out in
their gardens other than growing crops or rearing livestock. Out of the 65 households
with food gardens only 11 had another activity that they carried out in their garden
namely composting.
6.3.4 Water and Household Food Gardens
A large number of households with food gardens (Figure 6.4) (63.1 %; n = 41) used
tap water as the main water source for their garden. The remaining households used
in descending order; well (18.5 %; n = 12), borehole (12.3 %; n = 8), waste and rain
water (3.1 %; n = 2).
Cumulatively 91 % of households reported having tap water shortages. The most
reported frequencies for tap water shortages were those who experienced shortages
between 3 and 10 times 35.4 % (n = 23) and also more than 10 times in the previous
14 days 38.5 % (n = 25 ). A relatively large percentage (40 %; n = 65) of households
had no alternative water source. Households made use of borehole water (13.9 %; n
= 9) and well water (15.4 %; n = 10) as alternative sources of water. Only 4.6 % (n =
4) used rain water as an alternative source of water for their garden.
Households were questioned on their use of wastewater as a source of water for
their garden, this proved to be an uncommon practice as 70.8 % (n = 46) of
households never used it to water their garden, 12.3 % (n = 8) of households did
however use it often to water their garden.
Stellenbosch University https://scholar.sun.ac.za
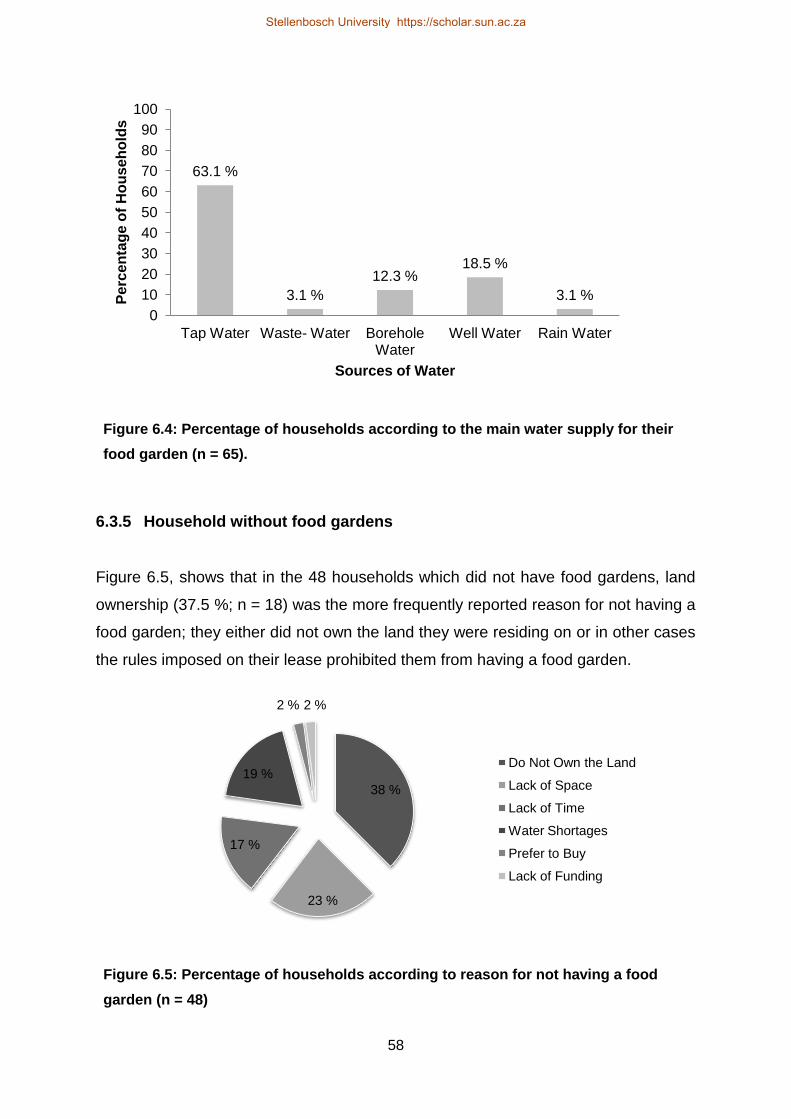
58
Figure 6.4: Percentage of households according to the main water supply for their
food garden (n = 65).
6.3.5 Household without food gardens
Figure 6.5, shows that in the 48 households which did not have food gardens, land
ownership (37.5 %; n = 18) was the more frequently reported reason for not having a
food garden; they either did not own the land they were residing on or in other cases
the rules imposed on their lease prohibited them from having a food garden.
Figure 6.5: Percentage of households according to reason for not having a food
garden (n = 48)
63.1 %
3.1 %
12.3 % 18.5 %
3.1 %
0
10
20
30
40
50
60
70
80
90
100
Tap Water Waste- Water Borehole Water
Well Water Rain Water
Pe
rce
nta
ge
of
Ho
us
eh
old
s
Sources of Water
38 %
23 %
17 %
19 %
2 % 2 %
Do Not Own the Land
Lack of Space
Lack of Time
Water Shortages
Prefer to Buy
Lack of Funding
Stellenbosch University https://scholar.sun.ac.za
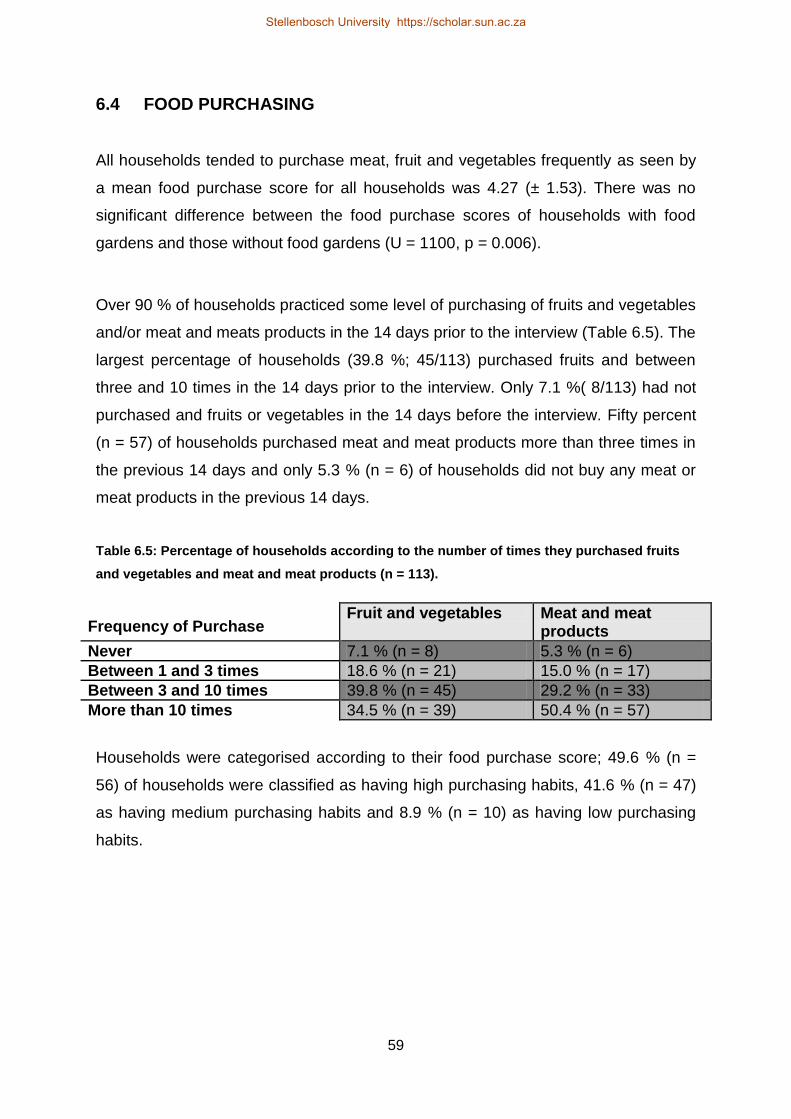
59
6.4 FOOD PURCHASING
All households tended to purchase meat, fruit and vegetables frequently as seen by
a mean food purchase score for all households was 4.27 (± 1.53). There was no
significant difference between the food purchase scores of households with food
gardens and those without food gardens (U = 1100, p = 0.006).
Over 90 % of households practiced some level of purchasing of fruits and vegetables
and/or meat and meats products in the 14 days prior to the interview (Table 6.5). The
largest percentage of households (39.8 %; 45/113) purchased fruits and between
three and 10 times in the 14 days prior to the interview. Only 7.1 %( 8/113) had not
purchased and fruits or vegetables in the 14 days before the interview. Fifty percent
(n = 57) of households purchased meat and meat products more than three times in
the previous 14 days and only 5.3 % (n = 6) of households did not buy any meat or
meat products in the previous 14 days.
Table 6.5: Percentage of households according to the number of times they purchased fruits
and vegetables and meat and meat products (n = 113).
Frequency of Purchase Fruit and vegetables Meat and meat
products
Never 7.1 % (n = 8) 5.3 % (n = 6)
Between 1 and 3 times 18.6 % (n = 21) 15.0 % (n = 17)
Between 3 and 10 times 39.8 % (n = 45) 29.2 % (n = 33)
More than 10 times 34.5 % (n = 39) 50.4 % (n = 57)
Households were categorised according to their food purchase score; 49.6 % (n =
56) of households were classified as having high purchasing habits, 41.6 % (n = 47)
as having medium purchasing habits and 8.9 % (n = 10) as having low purchasing
habits.
Stellenbosch University https://scholar.sun.ac.za
60
6.5 OTHER MEANS OF OBTAINING FOOD
Households were questioned on whether they had other means of obtaining food
other than purchasing or growing from their household food garden. As shown in
Figure 6.6, 55.8 % (n = 63) of households did not have any other means of obtaining
food. Other households obtained food via relatives in the rural areas (24.8 %; n =
28), from neighbours (16.8 %; n = 19) and a few had food gardens in the rural areas
(2.65 %; n = 3).
Figure 6.6: Percentage of households according to other means they have of
obtaining food(n = 113).
6.6 HOUSEHOLD FOOD INSECURITY
6.6.1 Household Food Insecurity Related Conditions
The mean household food insecurity access scale score was 4 (± 4.9). There was no
significant difference between the scores seen in households with foods gardens and
those without food gardens (U = 1309, p = 0.141).
55.8 %
2.7 %
24.8 %
16.8 %
0
10
20
30
40
50
60
70
80
90
100
None Food Garden in Rural Areas
From Relatives in Rural Areas
From Neighbours
Pe
rce
nta
ge
of
Ho
us
eh
old
s
Other means of obtaining food
Stellenbosch University https://scholar.sun.ac.za
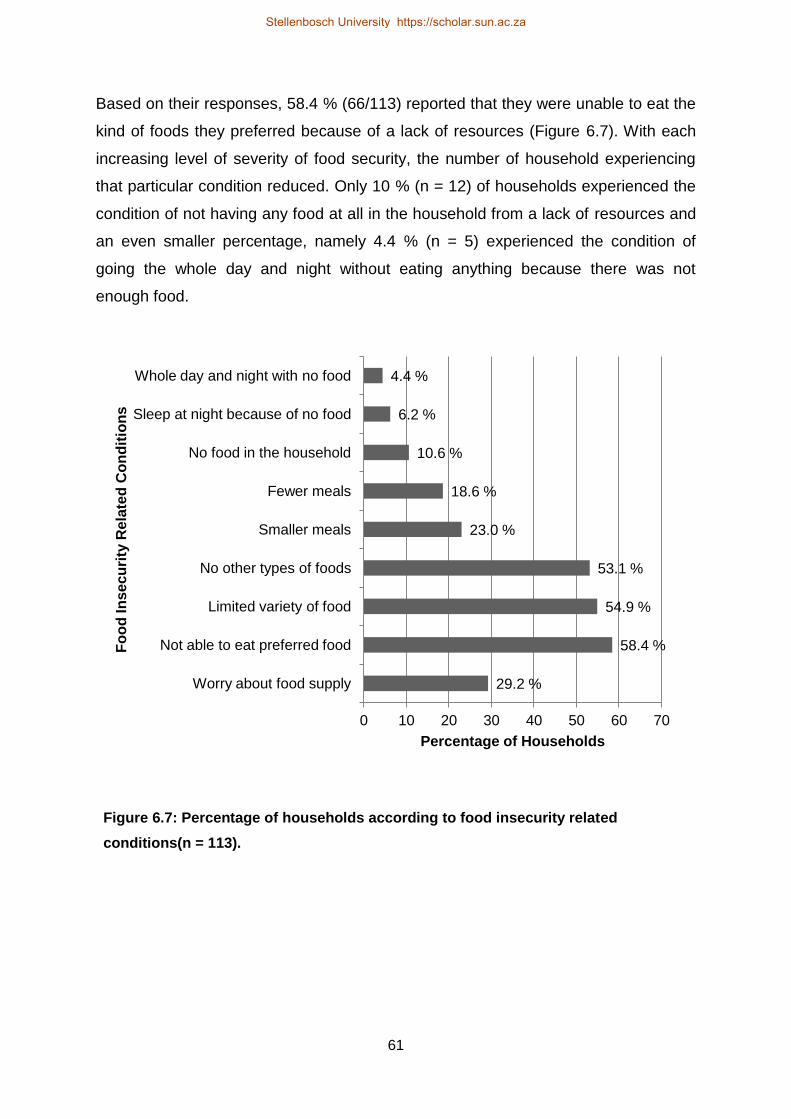
61
Based on their responses, 58.4 % (66/113) reported that they were unable to eat the
kind of foods they preferred because of a lack of resources (Figure 6.7). With each
increasing level of severity of food security, the number of household experiencing
that particular condition reduced. Only 10 % (n = 12) of households experienced the
condition of not having any food at all in the household from a lack of resources and
an even smaller percentage, namely 4.4 % (n = 5) experienced the condition of
going the whole day and night without eating anything because there was not
enough food.
Figure 6.7: Percentage of households according to food insecurity related
conditions(n = 113).
29.2 %
58.4 %
54.9 %
53.1 %
23.0 %
18.6 %
10.6 %
6.2 %
4.4 %
0 10 20 30 40 50 60 70
Worry about food supply
Not able to eat preferred food
Limited variety of food
No other types of foods
Smaller meals
Fewer meals
No food in the household
Sleep at night because of no food
Whole day and night with no food
Percentage of Households
Fo
od
In
se
cu
rity
Re
late
d C
on
dit
ion
s
Stellenbosch University https://scholar.sun.ac.za

62
6.6.2 Household Food Insecurity Related Domains
Households in the study experienced different domains of food insecurity namely
anxiety of food supply, insufficient quality and insufficient quantity; 29.2 % (n = 33) of
them experienced anxiety and uncertainty about household food supply, 69.9 % (n =
79) experienced insufficient quality in the diet in terms of variety and preferences of
the type of food they consumed and lastly 25.7 % (n = 29) experienced insufficient
quantity in their diet.
6.6.3 Household Food Insecurity Related Categories
Based on their household food insecurity access scores, households were placed
into categories classifying their food security status from food secure to severely
food insecure as displayed in Figure 6.8. Cumulatively 70.8 % (n = 100) of
households were food insecure though varying in severity with of these 11.5 % (n =
13) were severely food insecure.
Figure 6.8: Percentage of households according to food security category(n = 113)
29.2 %
36.3 %
23.0 %
11.5 %
0
10
20
30
40
50
60
70
80
90
100
Food Secure Mildly Food Insecure
Moderately Food Insecure
Severely Food Insecure
Pe
rce
nta
ge
of
Ho
us
eh
old
s
Food Security Category
Stellenbosch University https://scholar.sun.ac.za

63
6.7 RELATIONSHIP BETWEEN HOUSEHOLD FOOD GARDENS AND
HOUSEHOLD FOOD SECURITY AND DIETARY DIVERSITY
To examine the relationship between food gardens and food security, the household
food garden scores for households with food gardens were correlated with their
respective household food insecurity access scores. There was a very weak
negative non-significant association between household food garden scores and
household food insecurity scores (rho = - 0.222, n = 65, p = 0.076. This suggested
that as household food garden scores increased, the household food insecurity
scores for households would decrease.
In household with food gardens, spearman’s correlation found a very weak, positive
and non-significant relationship between household food garden scores and dietary
diversity scores (rho = 0.152, n = 65, p = 0.228). As household food garden scores
increased, dietary diversity scores increased minimally.
6.8 RELATIONSHIP BETWEEN HOUSEHOLD DIETARY DIVERSITY
AND FOOD INSECURITY
A very weak negative and non-significant correlation exists between dietary diversity
scores and household food insecurity access scores for all households (rho = -
0.137, n = 113, p = 0.149. This suggested that as the dietary diversity scores of a
household increased, their food insecurity scores decreased.
6.9 RELATIONSHIP BETWEEN LEVEL OF FOOD PURCHASES AND
HOUSEHOLD FOOD SECURITY, DIETARY DIVERSITY AND FOOD
GARDEN SCORES
A very weak negative correlation was observed between food purchase scores and
household food insecurity scores (rho = - 0.163, n = 113, p = 0.085) suggesting that
if households purchased food more frequently, there a marginal increase decrease in
their food insecurity scores.
Stellenbosch University https://scholar.sun.ac.za

64
A very weak positive and non-significant relationship existed between food
purchases scores and their dietary diversity scores (rho = 0.1186, n = 113, p =
0.2110). As the food purchase scores of household increased, their dietary diversity
scores also increased. In households with food gardens, no significant association
between household food garden scores and food purchase scores (rho = 0.073, n =
65, p = 0.563).
Stellenbosch University https://scholar.sun.ac.za

65
CHAPTER 7: DISCUSSION
7.1 INTRODUCTION
Questions are being raised by academics and development organisations on
whether developing countries and their cities in Asia, Africa and Latin America will be
able to cope with the challenge of employing and feeding a rapidly growing urban
population shadowed by increasing city boundaries and a reduction in land available
for food production.120 In all these debates, urban agriculture (UA) is increasingly
celebrated as playing a significant role in promoting food security, income
opportunities and economic growth in developing countries. Urban agriculture is
increasingly being posed as a key contributor to improving food security and
reducing poverty in developing countries.44 Households in Harare are also involved
in urban agriculture under the assumption of improving food security.
Urban agriculture is gaining support from decision makers and academics as a
means of ensuring food supply informally in urban areas however there is limited
evidence to support these claims.17,67,73 This chapter will discuss findings from this
study against the backdrop of literature on urban agriculture and the right to food.
7.2 POPULATION CHARACTERISTICS
7.2.1 Number of households involved in urban agriculture
Agriculture is inextricably linked to the growth of cities, as the establishment of
permanent human settlements was typically associated with permanent nearby
agricultural activities.120 The production of food in and around cities continues to be a
common practice.
Urban agriculture occupies more than 21,000 ha in Cagayan de Oro City
(Philippines), in Havana (Cuba), about 12 percent of urban land is dedicated to
agriculture and more than 11,000 ha are used for agricultural production in Jakarta
(Indonesia).120,121,122 These numbers are however not without criticism, some
Stellenbosch University https://scholar.sun.ac.za
66
scholars are concerned that the actual scale of urban agriculture is difficult to assess
because the limited evidence available is often qualitative and sometimes
anecdotal.123 This study revealed that slightly more than half of the households which
participated in the study had food gardens. This number is similar to those obtained
in an African Food Security Urban Network (AFSUN) study which showed 60 percent
of the households they sampled in Harare were involved in urban household food
production.42
Quantifying urban agriculture can be complicated as witnessed in this study, where
only the numbers of households involved in urban agriculture were quantified after
attempts to quantify the size of household food gardens failed during the pre-test
study. This was because the majority of households had never measured the size of
their food gardens. Urban agriculture is indeed difficult to quantify and this may be in
part due to the multi-faceted nature of urban agriculture. There are many aspects
which can be quantified such as the number of households involved, the size of their
gardens, the amount of produce they grow and all these are influenced by different
factors. Though it is difficult to quantify, the fact remains that for some households, it
remains an important activity.49
7.3 HOUSEHOLD FOOD GARDENS AND HOUSEHOLD FOOD
SECURITY
7.3.1 Contribution of household food gardens to food security
Urban agriculture is strongly viewed as a part of the solution to urban food insecurity,
particularly in developing countries. This study however did not find a significant
relationship between household food security and having a food garden. This study
shared findings with Hilbruner and Egan’s multi-variant study conducted in the small
city of Dinajpur, Bangladesh where practicing urban agriculture and the odds of
being food secure proved insignificant.124 Even closer to home is the study by Frayne
et.al. which also showed insignificant associations between urban agriculture and
food security in Southern African cities, including Harare.125
Stellenbosch University https://scholar.sun.ac.za
67
These findings are however in conflict with the usual trend in most studies. A
systematic review by Warren and co-workers on studies examining the relationship
between household food security and dietary diversity revealed that, in the majority
of studies, there was a tendency towards a positive and significant association
between urban agriculture and food security.126 These conflicting findings show the
need to develop a standardized methodology to investigating urban agriculture and
food security. While this study attempted to quantify the relationship between urban
agriculture and food security, methodological shortcomings limited the power of the
comparison with other studies.
7.3.2 Motivation behind household food gardens
Klemusu, Maxwell and Nugent provide evidence that urban and peri-urban
agriculture is undertaken by farmers for three reasons, namely cash (mainly from
selling vegetable and livestock), food subsistence (savings on food expenditure) and
as a survival or risk buffering strategy.120 Relevant to this study are food subsistence
and risk buffering. The motivations behind food gardens in this study included
access to vegetables and savings in household food expenditure. Findings suggest
that the majority of households in this study who are involved in urban agriculture do
so for subsistence and/or use it as a buffer against shocks to their food supply. This
is not unusual as other studies show that the majority of the produce grown in urban
areas in the developing countries goes to subsistence or is used as a survival
strategy.69
When we take into consideration the motivation behind food gardening and the
insignificant association between food gardening and food security shown in this
study, the significance of food gardening may not lie within the quantifiable aspects
assessed by this study but in the qualitative aspects (such as the social impact of
food gardening) which were not explored here. Olivier puts forth the idea that the
food security benefits of urban agriculture may extend beyond satisfying temporary
food needs, they may lie in qualitative aspects, such as attitudes towards healthy
eating and other social benefits.127
Stellenbosch University https://scholar.sun.ac.za
68
Urban agriculture is said to promote a sense of community and self-determination.128
This may explain why it continues to be part of urban society globally. Food
gardening may be providing households in this study with a sense of control or
autonomy in terms of their access to food. This subjective aspect cannot be ignored
as it is line with the empowerment aspect of a human rights based approach. .
7.3.3 The state of food insecurity and urban agriculture in Harare
In this study we found that nearly three quarters of all households were food
insecure, with one tenth of households being severely food insecure. Such high
levels of food insecurity are not a new occurrence in Harare. In Tawodzera’s 2009
study on Rural-Urban Transfers and Household Food Security in Harare’s crisis
context, nearly all of the 200 sampled households were food insecure with varying
levels of severity.129 This is despite more than half of the households in Tawodzera’s
study having food gardens. Urban agriculture may be preventing households which
are already food insecure or at risk of being food insecure from slipping further into
food insecurity and ill-health. It does however not solve the problem of generalized
food insecurity.120, 42 The weak association between food gardening and food
security despite a large number of households being involved in the activity provides
a different perspective to the idea of urban agriculture as a risk buffering strategy;
Food gardening may not be contributing significantly to food security, but households
involved in it may perceive it as having a positive effect on their food security.
7.3.4 The way forward
From a right to food perspective, the methodology used in this study did not provide
sufficient evidence to support urban agriculture as a strategy for realising the right to
food, however the City’s residents are still involved in food gardening. This may be
for reasons that were not explored in detail in this study. These residents are still
claiming their right to be able to feed themselves in dignity, therefore Harare’s city
officials should respect this practice and do away with by-laws which allow for
slashing of crops at the discretion of city officials. This action would be in line
dimensions of the human rights based approach, which emphasise the promotion of
Stellenbosch University https://scholar.sun.ac.za
69
tolerance, inclusion and non-discrimination. By showing tolerance towards the
practice of urban agriculture, City officials are fulfilling the “respect” obligation of the
right to food.
It is understandable why Harare’s City officials have not implemented any strategies
to support urban agriculture, when findings such as the ones in this study suggest
that urban agriculture has no significant effect of food security; and other findings
suggest that the benefits of urban agriculture are made evident primarily in situations
where institutional support is provided.126 In light of conflicting evidence, institutional
support should rather be directed at activities which benefit all citizens such as
increasing awareness of all Harare residents about their right to food and the
different ways in which they can claim this right and allowing them to take part in the
decision making processes surrounding their right to food.125
7.4 HOUSEHOLD FOODS GARDEN AND DIETARY DIVERSITY
7.4.1 Contribution of household food gardens to dietary diversity
This study showed a positive but non-significant association between household
food gardens and dietary diversity. In contrast, empirical evidence provided by Zezza
and Tasciotti in a review of studies on urban agriculture and dietary diversity shows
that engagement in farming in urban areas is positively and significantly associated
with greater dietary diversity.49
Households in this study tended to grow one type of crop (two thirds of food garden
owning households), usually indigenous cruciferous vegetables. This is a trend also
observed in other parts of Zimbabwe, particularly in the city of Bulawayo, where
Moyo also noted the partiality to growing vegetable of the brassica olaracea
family.130 If households are biased to growing one crop then surely they would
experience monotony in terms of variety of vegetables from their garden, therefore
limiting the contribution food gardens would have towards their dietary diversity.
That said, the association between household food gardens and improved dietary
diversity in this study remains insignificant, thus any interventions aimed at improving
Stellenbosch University https://scholar.sun.ac.za
70
dietary diversity should be directed to all households regardless of whether or not
they have a garden. In the long term, dietary diversification ensures a healthy diet
that contains a balanced and adequate combination of macronutrients
(carbohydrates, fats, and protein), essential micronutrients and other food-based
substances such as dietary fiber.131 The City of Harare or other relevant entities can
facilitate the strengthening of dietary diversity by carrying out programmes aimed at
informing all households about the importance and maintenance of dietary diversity
through the main source of food access namely food procurement.
7.5 LIMITING FACTORS OF URBAN AGRICULTURE
The findings on some of the factors that seemed to affect food gardening in this
study will be discussed in brief.
7.5.1 Land tenure
Nearly two thirds of households interviewed owned the land on which they were
residing. The remaining portion of households was occupying leased land.
Throughout urban Africa, millions of low-income residents have no legal title to the
homes they live in, let alone to the plots many of them use to grow fruit and
vegetables.133
There were more food gardens in those households who owned their land in
comparison to households who were leasing. Crush et al. had similar findings in a
study done on the place of urban agriculture in Southern African cities, households
that owned their property were more likely to engage in urban food production.42 In
households which did not have food gardens in this study, the most frequently
reported reasons for not having food gardens were related to land ownership and
size. Either households did not own the land on which they resided or/and they did
not have enough space for a food garden.
Stellenbosch University https://scholar.sun.ac.za

71
Households which had food gardens is this study were biased towards “on-plot” food
gardens, only fourteen percent of households also had “off-plot” gardens. This trend
could be explained by a number of reasons, namely: The current laws governing the
practice of urban agriculture are accommodating of “on-plot” crop production,
restrictive on any livestock rearing, while “off-plot” gardening can be disallowed at
the discretion of city officials. This means at any time, land being used for “off-plot”
gardens is under threat from competing use or the influence of city officials who do
not agree with urban agriculture. With such conditions the landless urban farmers
are discouraged from actively pursuing or investing in it.
The right to food requires states to provide an enabling environment in which people
can use their full potential to produce or procure adequate food for themselves and
their families.30 From a human rights perspective, the issue of urban agriculture
becomes one of equality and non-discrimination. In Harare’s case, the by-laws are
accommodative of subsistence urban agriculture activities which are usually
practiced on “on-plot” food gardens, usually on privately owned land. They are
however prohibitive to and exclude the landless, who are often the urban poor from
participating in it.
7.5.2 Financial resources
Financial resources may also be limiting the intensity with which households can
practice urban agriculture; this study revealed that household food gardens were
often self-funded. A study carried out in Accra (Ghana) on options for financing
urban agriculture, factors limiting credit access are lack of collateral, lack of
ownership of assets, poor financial management, the risky nature of farming and the
inability of clients to prepare viable project proposals.134 Considering that nine out of
ten of food gardening households had “on-plot” food gardens and four out of five of
these grew crops solely for household consumption, it would be impractical for
financial institutions to offer credit for urban agriculture to households who are
growing food for what appears to be subsistence use. Until urban agriculture is
proven to be an income generating practice, investing financially into it would be ill-
advised.
Stellenbosch University https://scholar.sun.ac.za
72
7.5.3 Water resources
Water is an important component to the right to food, especially for food production
thus it should be made accessible to those desiring to grow their own food. Water
supply challenges were an issue in the study population, the majority of households
with food gardens experienced tap water shortages of varying degrees which would
affect their crop or livestock production. In some of the households without food
gardens, water shortages were reported as being the reason they could not take part
in urban agriculture. Of the households involved in urban agriculture in this study,
almost half did not have an alternative water source if they experienced tap water
shortages. The failure by the City of Harare to provide adequate water for its
residents can be considered a violation of not only the right to water but the right to
food, the right to health and the right to development. However, the solution is not
simply making water available.
In urban areas, households use potable water in their gardens, which is costly for
both the city and the end users. There are two key points when considering the use
of water. First, not all applications require the same quality water, and second, not all
“used” water requires the same level of treatment before it can be reused.135
Wastewater was rarely used in this study for watering food gardens, only a tenth of
households with food gardens used wastewater as a source of water for their
gardens. The current water management system in Harare is already experiencing
challenges, therefore city officials need to consider the idea of reusing water to
improve water supply. According to Nalosco, water management practices such as
rainwater harvesting, grey waterm-to-landscape diversion, sheet mulchingn, swaleso
and basinsp and controlled drip irrigation systemsq are ecologically sound and have
proven to conserve considerable amounts of water.136
mGreywater is all wastewater generated in households or office buildings or from streams without fecal contamination. Source: https://en.wikipedia.org/wiki/Greywater n Sheet mulching: is an agricultural no-dig gardening technique that attempts to mimic natural forests'
processes. Source: https://en.wikipedia.org/wiki/Sheet_mulching o Swale is a low tract of land, especially one that is moist or marshy. Source:
https://en.wikipedia.org/wiki/Swale_%28landform%29 p Basin is an extent or an area of land where surface water from rain, melting snow, or ice converges
to a single point at a lower elevation. Source: https://en.wikipedia.org/wiki/Drainage_basin
Stellenbosch University https://scholar.sun.ac.za
73
In operationalizing the right to food, states are allowed to use ways which they deem
sustainable to improve access to water provided the quality of drinking water is
preserved.12 This leaves provision for the use of harvested rain-water, grey water
and wastewater in agriculture. And as such, the Government of Zimbabwe including
the City of Harare should take advantage of this allowance by considering methods
of water saving and recycling in their efforts to improve access to water in a country
plagued with water shortages.
7.6 HOW ARE HOUSEHOLDS GAINING ACCESS TO FOOD?
7.6.1 Economic access to food
All households were purchasing some food from the market (formal and informal).
Nearly half of households in the study did not have food gardens and relied mostly
on purchasing food from the market for access to food. Both these findings can be
explained by three factors; the first being that a large number of households did not
have food gardens and relied on food purchasing; secondly of the households with
food gardens a small number reared livestock implying that the remaining
households also relied on purchasing to access meat and other animal source foods,
and lastly there is a limited number of livestock and crops that households could rear
within the confines of an urban area therefore some crops particularly cereals and
meat and meat products still needed to be obtained by purchasing.
Food purchasing is considered economic accessibility to food, it will remain the main
means of obtaining food in urban areas and thus people should have purchasing
power sufficient to procure food from the market.137 The economic rebound
experienced by Zimbabwe has slowed to around 3 % in 2014. As the economy has
continued to weaken, many businesses have closed and employees have been laid
off. The manufacturing sector saw a drop in activity between 2011 and 2014: at least
4 610 companies closed down, resulting in a loss of 55 443 jobs.138 Considering that
qis an irrigation method that saves water and fertilizer by allowing water to drip slowly to the roots of
plants, either onto the soil surface or directly onto the root zone, through a network of valves, pipes, tubing, and emitters. Source: https://en.wikipedia.org/wiki/Drip_irrigation
Stellenbosch University https://scholar.sun.ac.za
74
all households in this study relied on some level of purchasing to ensure access to
food, the current prevailing economic environment may impede sufficient access to
food.
Given that a large percentage of the sample population experienced food insecurity
in a prevailing environment with a weak economy, the fulfilment of the right to food
by the Government of Zimbabwe may shift from one of facilitation to become one of
provision of food to those vulnerable groups whose numbers may increase should
the economy remain weakened.
7.7 OTHER FINDINGS
7.7.1 An unusual relationship between food security and dietary diversity
There is however a quandary in the findings. A large number of households were
food insecure. This varied between mild, moderate and severely food insecure with a
large percentage falling between mild and moderately food insecure. However,
households still reported highly diverse diets. Literature shows that households with
low levels of dietary diversity are likely to have low levels of consumption per person
and low caloric availability. Increases in dietary diversity are associated with
increases in consumption caloric availability, and calories from staples and non-
staples.139
These findings may be as a result of alterations in recall periods for the different
tools used in the study. A lengthy recall period for the household dietary diversity
question may have resulted in higher dietary diversity scores as household would
have accessed a wider variety of food over 14 days in comparison to the 24 hour
recall period advised for use in the tool.
7.8 CONCLUDING REMARKS
Conceptually, urban agriculture in the sampled areas of Harare may seem like a
solution addressing all the components encompassing food security and dietary
Stellenbosch University https://scholar.sun.ac.za
75
diversity however the methods used in this study did not show any significant
association with food security or dietary diversity. Harare residents are however
allowed to claim their right to food by whatever means they deem fit and if urban
food gardens provide them with such an opportunity then efforts should be made not
to go against their existence. The contributions of urban agriculture may be
noticeable to those households who practice it albeit not necessarily in the popular
sense of quantifiable and statistically significant contributions.127
Poulsen et al. are of the opinion that a lack of supportive policies may be
constraining the potential of urban agriculture, making it appear incapable of
eliminating the pressure urban households face in obtaining food.140 However
considering the conflicting evidence regarding urban agriculture and the numerous
methodologies used is assessing its benefits including the methods used in this
study, the City of Harare does not have a strong evidence base to support urban
agriculture. Efforts should be made to create a more standardized way of measuring
urban agriculture and its effects on food security and dietary diversity which
combines both quantitative and qualitative aspects.
Stellenbosch University https://scholar.sun.ac.za
76
CHAPTER 8: CONCLUSION
In this study household food gardens were not significantly associated with food
security. Nevertheless, some the findings of this study did suggest that in the
sampled population of Harare, which included a substantial number of severely food
insecure households, household food gardens may be serving as a means to
provide minimal food subsistence and may hold a more subjective significance such
as giving household a sense of self-determination.
The benefits of urban agriculture require further research using standardised
methods which go beyond simple quantification and correlation. That said, Harare’s
residents still use it, claiming their right to feed themselves in dignity. Therefore
urban agriculture should be respected as a means of obtaining food and the City’s
socially selective by-laws which are a violation of the right to food which must be
revised.
Household food gardens were not shown to correlate with household dietary
diversity despite other studies showing that household food gardens have been
associated with improved dietary diversity. If it is true as proposed by Zezza and
Tasciotti that urban and peri-urban agriculture contributes to improved health among
the urban population by providing highly nutritious and fresh foods, then in terms of
dietary diversity they present an opportunity which requires further exploration.49 In
the meantime efforts to improve dietary diversity in Harare should be take on a
facilitation role focused on food that is accessed through procurement.
Webb and Kasumba find that UA practised informally in low-income areas makes an
insignificant contribution to food security.141 This is especially the case when key
assets such as knowledge, land and financial resources are limited.142, 143 For
developing countries such as Zimbabwe who are resource constrained, active
support of the urban agriculture including making land available and financial support
need to be undertaken with caution while more concise evidence is made available
on the contributions of urban agriculture.
Stellenbosch University https://scholar.sun.ac.za

77
8.1 OVERALL CONCLUSION:
There was no association between household food gardens and household food
security or dietary diversity. On the basis of these findings, urban agriculture cannot
be considered a solution to food insecurity or a method of addressing the right to
adequate food in the southern districts of Harare, Zimbabwe. Urban agriculture may
have a considerable role to play in combating household food insecurity in Harare,
Zimbabwe but this may not lie primarily in its potential economic or food supply
benefits but rather in its social benefits.
From a human rights perspective, urban agriculture can be viewed as an entitlement
in that people in Harare are using it to for subsistence and possibly as a risk-
buffering strategy and these people are entitled to claim their right to feed
themselves in dignity. Looking at the motivations behind food gardens, they provide
households with a sense of empowerment. Based on the observations urban
agriculture cannot be promoted as a strategy to realise the right to adequate food in
Harare but it can be respected as a mean of obtaining food.
In addition, a regulatory framework for urban agriculture needs to be formulated
which shifts from prohibitive by-laws to more tolerant stance. In designing these
strategies, legal frameworks and policies, all actors, including governments, aid
agencies and local officials, have a responsibility to ensure full participation by the
people they seek to benefit.10 Harare residents should be able to claim their right to
food through practicing food gardening. When the authorities act in contravention of
the regulations, residents should hold them accountable. Under these
circumstances, the City of Harare can be viewed as realising the right to food for its
inhabitants
Stellenbosch University https://scholar.sun.ac.za

78
8.2 RECOMMENDATIONS
The following can be considered when viewing the use of urban agriculture as a
strategy to achieving the right to food in Harare, Zimbabwe:
Urban agriculture does not have to be prohibited by the City of Harare. The
residents of Harare have traditionally been involved in this practice. By-laws
restricting the practice should be abolished by Harare’s city council. In their place,
practical recommendations and regulations covering the manner in which urban
agriculture can be practiced and where it can be practiced. Safety and
conservation measures must be designed to exercise some level of control on
the practice.
8.3 LIMITATIONS OF THE STUDY
There are some limitations observed in the design and analysis of this study, which
may have affected the quality of data and findings.
There were a number of flaws in the study design namely;
o The sample size was not weighted/proportionate to the density of the
population in each suburb.
o The tools used in the study were manipulated by changing the recall
periods usually advised for these tools. This may also account for the high
levels of dietary diversity seen in findings and the discrepancy between
high dietary diversity scores and high levels of food insecurity.
o Due to resource constraints only purposely selected areas of Harare were
sampled and findings could not be generalized to all the areas of Harare.
o The questionnaire used in the study combined different tools. The section
capturing information on household food gardens were investigator
designed thus only face and content validity could be obtained for the
questionnaire.
o The information we received from the city’s Surveyor office was out of date
and did not accurately represent the number of households in each
suburb; there were different numbers of households on the ground than
were shown on paper and this distorted the random selection of
Stellenbosch University https://scholar.sun.ac.za
79
households. In hindsight, a physical household listing and mapping
exercise would have helped avert this issue.
The study did not collect information on incomes of households, market access
and caloric intake, nor nutritional status, which limited the scope of findings in
terms of their physiological and monetary benefits.
The study was cross-sectional; it did not take into consideration the issue of
seasonality in urban agriculture.
8.4 RECOMMENDATIONS FOR FURTHER STUDIES
This study was limited to the southern area of Harare. A larger study area, using
proportional sampling, would be beneficial as findings could then be generalised
to Harare as a whole. This study focused only on the practices of households and
therefore the position of Harare City Officials was not obtained. A more holistic
approach would be to interview these officials and get their perspective.
Further studies should be conducted using standardised and validated tools
which can be applied to different settings to ensure that findings can be
comparable between the studies. These studies should collect both quantitative
and qualitative data to provide insight on the extent and contribution of food
gardens and the knowledge households possess regarding food gardens and the
attitudes toward food gardens.
Stellenbosch University https://scholar.sun.ac.za

80
ADDENDUM A: MAP OF HARARE’S HEALTH DISTRICTS144
Stellenbosch University https://scholar.sun.ac.za
81
ADDENDUM B: STUDY QUESTIONNAIRE
Household Garden and Food Security Questionnaire
Participant Code
______________________________
Stellenbosch University https://scholar.sun.ac.za
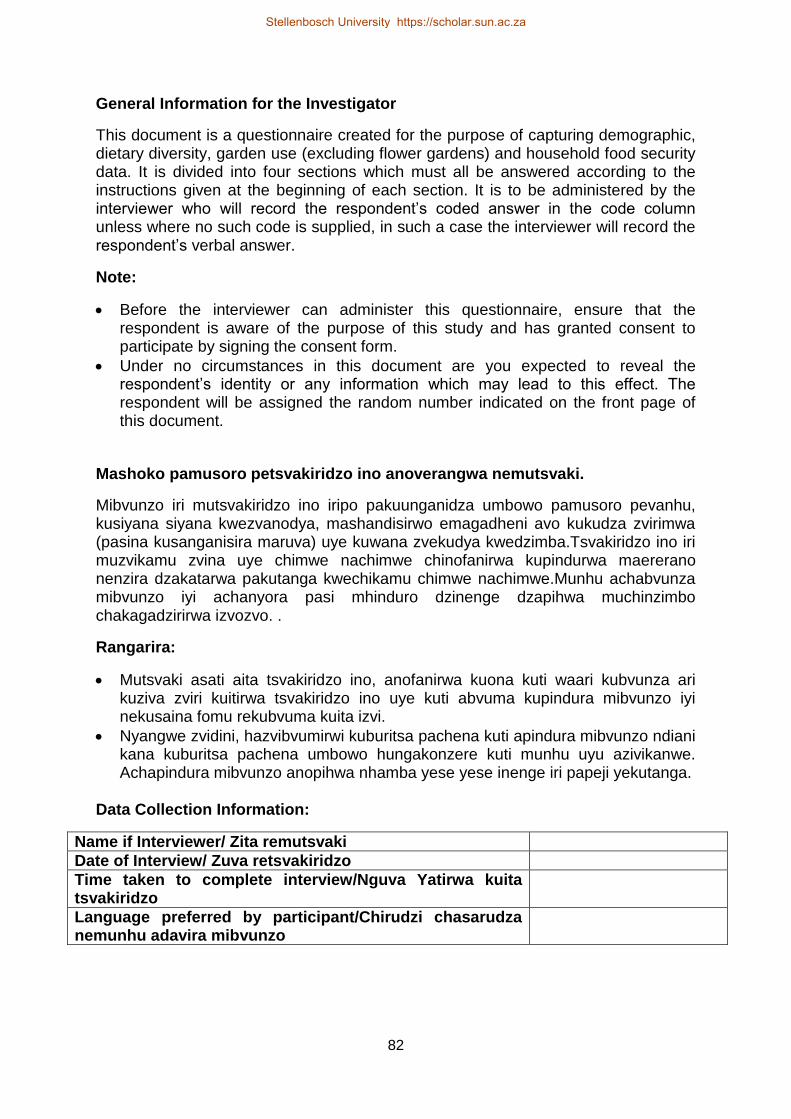
82
General Information for the Investigator
This document is a questionnaire created for the purpose of capturing demographic, dietary diversity, garden use (excluding flower gardens) and household food security data. It is divided into four sections which must all be answered according to the instructions given at the beginning of each section. It is to be administered by the interviewer who will record the respondent’s coded answer in the code column unless where no such code is supplied, in such a case the interviewer will record the respondent’s verbal answer.
Note:
Before the interviewer can administer this questionnaire, ensure that the respondent is aware of the purpose of this study and has granted consent to participate by signing the consent form.
Under no circumstances in this document are you expected to reveal the respondent’s identity or any information which may lead to this effect. The respondent will be assigned the random number indicated on the front page of this document.
Mashoko pamusoro petsvakiridzo ino anoverangwa nemutsvaki.
Mibvunzo iri mutsvakiridzo ino iripo pakuunganidza umbowo pamusoro pevanhu, kusiyana siyana kwezvanodya, mashandisirwo emagadheni avo kukudza zvirimwa (pasina kusanganisira maruva) uye kuwana zvekudya kwedzimba.Tsvakiridzo ino iri muzvikamu zvina uye chimwe nachimwe chinofanirwa kupindurwa maererano nenzira dzakatarwa pakutanga kwechikamu chimwe nachimwe.Munhu achabvunza mibvunzo iyi achanyora pasi mhinduro dzinenge dzapihwa muchinzimbo chakagadzirirwa izvozvo. .
Rangarira:
Mutsvaki asati aita tsvakiridzo ino, anofanirwa kuona kuti waari kubvunza ari kuziva zviri kuitirwa tsvakiridzo ino uye kuti abvuma kupindura mibvunzo iyi nekusaina fomu rekubvuma kuita izvi.
Nyangwe zvidini, hazvibvumirwi kuburitsa pachena kuti apindura mibvunzo ndiani kana kuburitsa pachena umbowo hungakonzere kuti munhu uyu azivikanwe. Achapindura mibvunzo anopihwa nhamba yese yese inenge iri papeji yekutanga.
Data Collection Information:
Name if Interviewer/ Zita remutsvaki
Date of Interview/ Zuva retsvakiridzo
Time taken to complete interview/Nguva Yatirwa kuita tsvakiridzo
Language preferred by participant/Chirudzi chasarudza nemunhu adavira mibvunzo
Stellenbosch University https://scholar.sun.ac.za
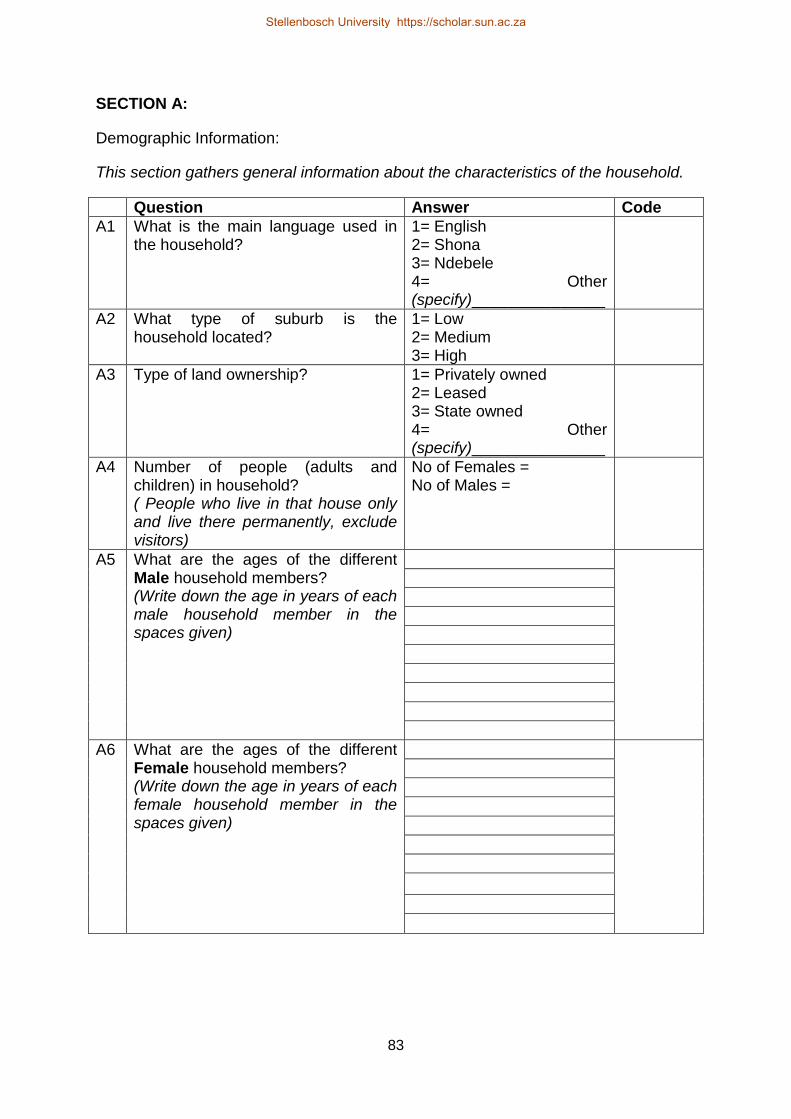
83
SECTION A:
Demographic Information:
This section gathers general information about the characteristics of the household.
Question Answer Code
A1 What is the main language used in the household?
1= English 2= Shona 3= Ndebele 4= Other (specify)_______________
A2 What type of suburb is the household located?
1= Low 2= Medium 3= High
A3 Type of land ownership? 1= Privately owned 2= Leased 3= State owned 4= Other (specify)_______________
A4 Number of people (adults and children) in household? ( People who live in that house only and live there permanently, exclude visitors)
No of Females = No of Males =
A5 What are the ages of the different Male household members? (Write down the age in years of each male household member in the spaces given)
A6 What are the ages of the different Female household members? (Write down the age in years of each female household member in the spaces given)
Stellenbosch University https://scholar.sun.ac.za
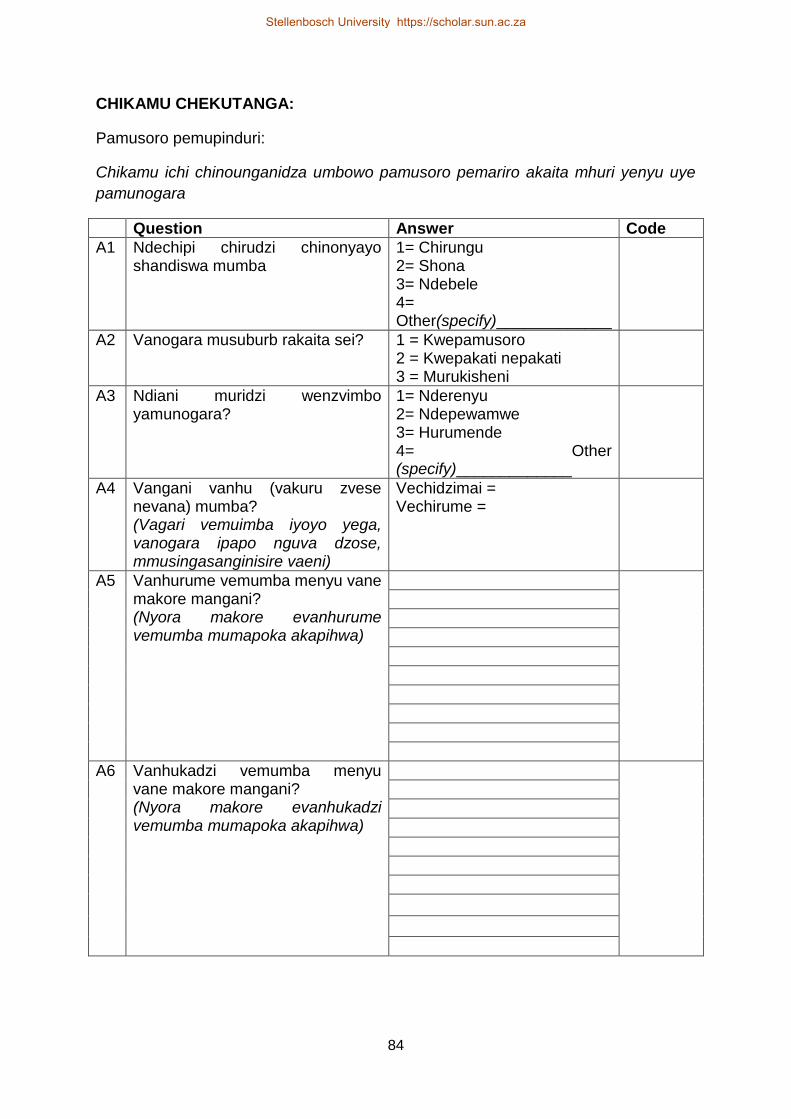
84
CHIKAMU CHEKUTANGA:
Pamusoro pemupinduri:
Chikamu ichi chinounganidza umbowo pamusoro pemariro akaita mhuri yenyu uye
pamunogara
Question Answer Code
A1 Ndechipi chirudzi chinonyayo shandiswa mumba
1= Chirungu 2= Shona 3= Ndebele 4= Other(specify)_____________
A2 Vanogara musuburb rakaita sei? 1 = Kwepamusoro 2 = Kwepakati nepakati 3 = Murukisheni
A3 Ndiani muridzi wenzvimbo yamunogara?
1= Nderenyu 2= Ndepewamwe 3= Hurumende 4= Other (specify)_____________
A4 Vangani vanhu (vakuru zvese nevana) mumba? (Vagari vemuimba iyoyo yega, vanogara ipapo nguva dzose, mmusingasanginisire vaeni)
Vechidzimai = Vechirume =
A5 Vanhurume vemumba menyu vane makore mangani? (Nyora makore evanhurume vemumba mumapoka akapihwa)
A6 Vanhukadzi vemumba menyu vane makore mangani? (Nyora makore evanhukadzi vemumba mumapoka akapihwa)
Stellenbosch University https://scholar.sun.ac.za
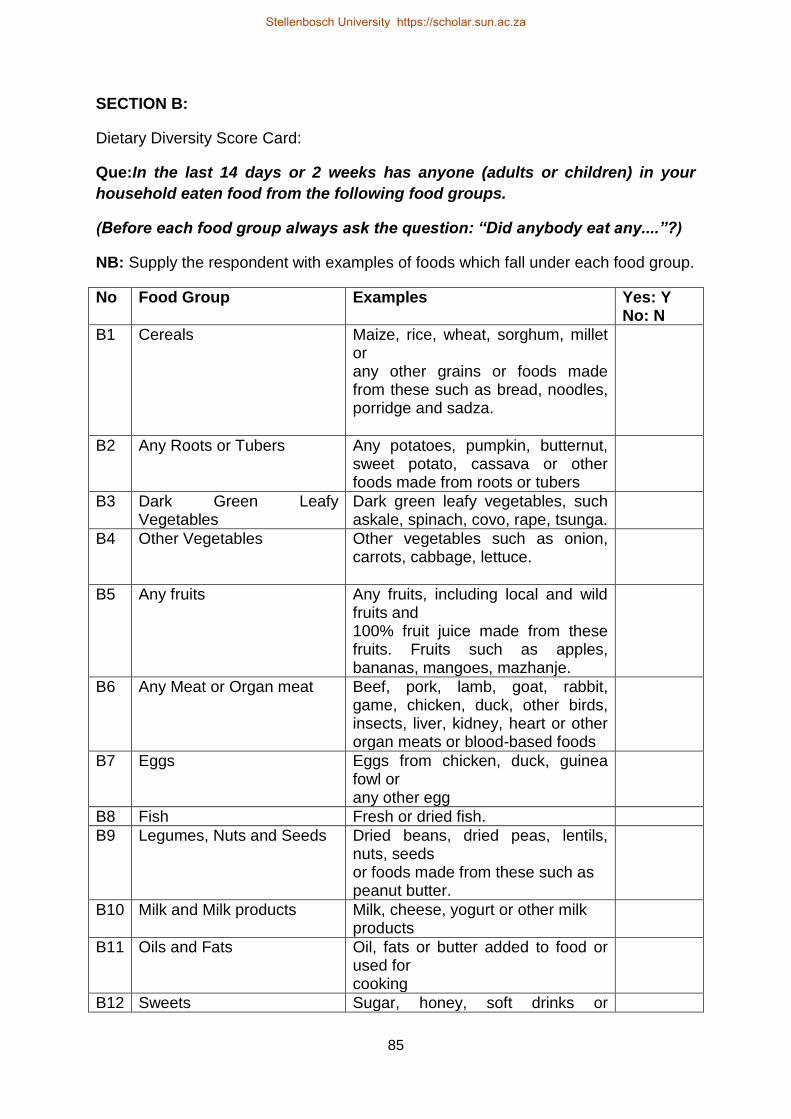
85
SECTION B:
Dietary Diversity Score Card:
Que:In the last 14 days or 2 weeks has anyone (adults or children) in your
household eaten food from the following food groups.
(Before each food group always ask the question: “Did anybody eat any....”?)
NB: Supply the respondent with examples of foods which fall under each food group.
No Food Group Examples Yes: Y No: N
B1 Cereals Maize, rice, wheat, sorghum, millet or any other grains or foods made from these such as bread, noodles, porridge and sadza.
B2 Any Roots or Tubers Any potatoes, pumpkin, butternut, sweet potato, cassava or other foods made from roots or tubers
B3 Dark Green Leafy Vegetables
Dark green leafy vegetables, such askale, spinach, covo, rape, tsunga.
B4 Other Vegetables Other vegetables such as onion, carrots, cabbage, lettuce.
B5 Any fruits Any fruits, including local and wild fruits and 100% fruit juice made from these fruits. Fruits such as apples, bananas, mangoes, mazhanje.
B6 Any Meat or Organ meat Beef, pork, lamb, goat, rabbit, game, chicken, duck, other birds, insects, liver, kidney, heart or other organ meats or blood-based foods
B7 Eggs Eggs from chicken, duck, guinea fowl or any other egg
B8 Fish Fresh or dried fish.
B9 Legumes, Nuts and Seeds Dried beans, dried peas, lentils, nuts, seeds or foods made from these such as peanut butter.
B10 Milk and Milk products Milk, cheese, yogurt or other milk products
B11 Oils and Fats Oil, fats or butter added to food or used for cooking
B12 Sweets Sugar, honey, soft drinks or
Stellenbosch University https://scholar.sun.ac.za

86
sweetened juice drinks, sugary foods such as chocolates, candies, cookies and cakes
B13 Spices, Seasonings, Sauces and Beverages
Salt, spices (black pepper, coriander, condiments (soy sauce, hot sauce), coffee, tea, alcoholic beverages
Final Score
Chikamu chechipiri
Kadhi riri maererano nekusiyana-siyana kwezvinodyiwa:
Mubvunzo:Mumazuva manomwe apfuura, mumba menyu mune munhu (vakura
kana vadiki) akadya here chikafu chinobva mumapoka ekudya anotevera.
(Kumberi kweboka rega rega isa mubvunzo wekuti...”Makadyiwa here....”
NB: Mupinduri anofanirwa kupihwa mienzaniso yezvekudya zvinowanikwa muboka
rimwe narimwe rezvekudya.
No Boka rezvekudya Mienzaniso Hongu: Y Kwete: N
B1 Ma Cereals Chibage, mupunga, gorosi, njera, mapfunde kana zvimwewo zvekudya zvinogadzirwa kubva mune izvi zvakafanana nechingwa, manoodles, bota, sadza.
B2 Midzi kana zvimwe zvemuvhu
Mbatata, madhumbe, manhanga, mbambaira, bhatanati, mufarinya, nezvimwewo zvekudya zvinobva mune izvi
B3 Muriwo wemashizha Mashizha anosanganisira emusango nemamwewo akaita sekovho, repi netsunga
B4 Mamwewo mavheji Hanyanisi. makerotsi, cabbage, lettuce nezvimwewo
B5 Michero Michero yese yese ichisanganisira yemusango nezvinwiwa zvakagadzirwa nemuto wemichero chete. Zvakafana ne maple, mabanana, mazhanje kana mango.
B6 Nyama Nyama yemombe, yenguruve, yehwai, mbudzi, tsuro, dhadha, dzimwe shiri, tupuka, chiropa, itsvo, mwoyo
B7 Mazai Mazai anobva kuhuku, madhadha
Stellenbosch University https://scholar.sun.ac.za
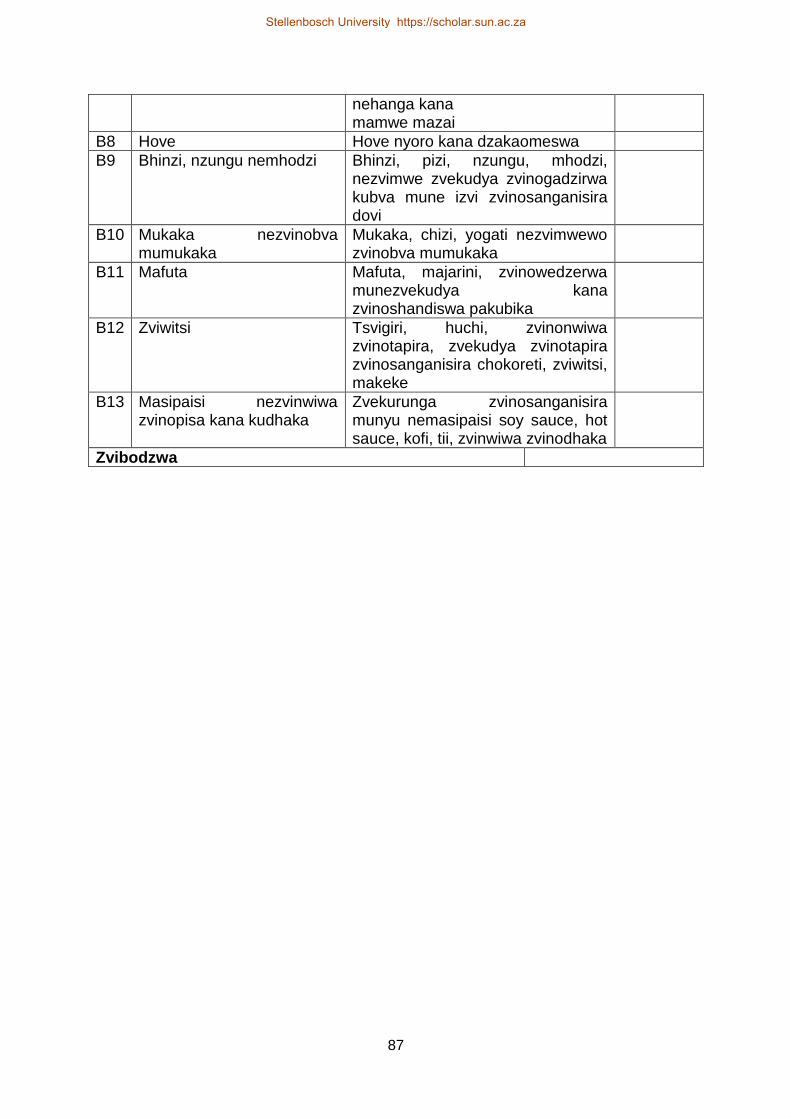
87
nehanga kana mamwe mazai
B8 Hove Hove nyoro kana dzakaomeswa
B9 Bhinzi, nzungu nemhodzi Bhinzi, pizi, nzungu, mhodzi, nezvimwe zvekudya zvinogadzirwa kubva mune izvi zvinosanganisira dovi
B10 Mukaka nezvinobva mumukaka
Mukaka, chizi, yogati nezvimwewo zvinobva mumukaka
B11 Mafuta Mafuta, majarini, zvinowedzerwa munezvekudya kana zvinoshandiswa pakubika
B12 Zviwitsi Tsvigiri, huchi, zvinonwiwa zvinotapira, zvekudya zvinotapira zvinosanganisira chokoreti, zviwitsi, makeke
B13 Masipaisi nezvinwiwa zvinopisa kana kudhaka
Zvekurunga zvinosanganisira munyu nemasipaisi soy sauce, hot sauce, kofi, tii, zvinwiwa zvinodhaka
Zvibodzwa
Stellenbosch University https://scholar.sun.ac.za

88
SECTION C:
Household Food Garden Score Card:
This section will gather information about the way households use their garden for those who have gardens and how households
who do not have gardens acquire their food.
Instruction: Ask the participant the questions in the question column and proceed to the next relevant. Take note of
additional instructions within the questions or response options.
No Question Response Options (Fill response in code column) Code
C1 Does your household have a food garden? N = No: Proceed to Que C2 Y = Yes: Proceed to Que C3
C2 Why does your household not have a food garden? Record response here: (Proceed to Que C4)
C3.0 Why does your household have a food garden? Record response here: (Proceed to Que C3.1)
No Question Response Options (Fill response in code column)
Code
C3.1 Which type of food garden does your household have? 1= “On-Plot” Garden (explain the term on-plot) 2= “Off-Plot” Garden (explain the term off-plot) 3= Both “On-Plot” and “Off- Plot” Garden
C3.2 Who funds/supports your food garden 1= Self
Stellenbosch University https://scholar.sun.ac.za
Stellenbosch University https://scholar.sun.ac.za

89
2= Family members outside the household 3= Friends 4= Neighbours 5= Local organisations, charities or NGO’s 6= Government 7= Religious organisations 8= Other (specify) _________________________________
C3.3 How many varieties/different types of crops does your household grow?
1 = None (if “none”,move to que 3.6) 2 = 1-3 types 3 = 4-5 types 4= more than 5 types
C3.4 What is the main purpose of your crop production? 1 = Own- Consumption 2 = Sell 3 = Own consumption and Sell 4 = Exchange for other foods
C3.5 In the last 2 weeks/14 days how often did you eat any crops/vegetables from your food garden?
1 = Never 2 = Rarely (1-2 times in 2 weeks/14 days) 3 = Sometimes (3-10 times in 2 weeks/14 days) 4 = Often (more than 10 times in 2 weeks/ 14 days)
C3.6 How many different types of livestock does your household keep 1= None (if “none” move to que 3.9) 2 = 1 type 3 = 2-3 types 4 = more than 3 types
C3.7 What is the main purpose of your animal production? 1 = Own- Consumption 2 = Sell 3 = Own consumption and Sell 4 = Exchange for other foods
Stellenbosch University https://scholar.sun.ac.za
Stellenbosch University https://scholar.sun.ac.za
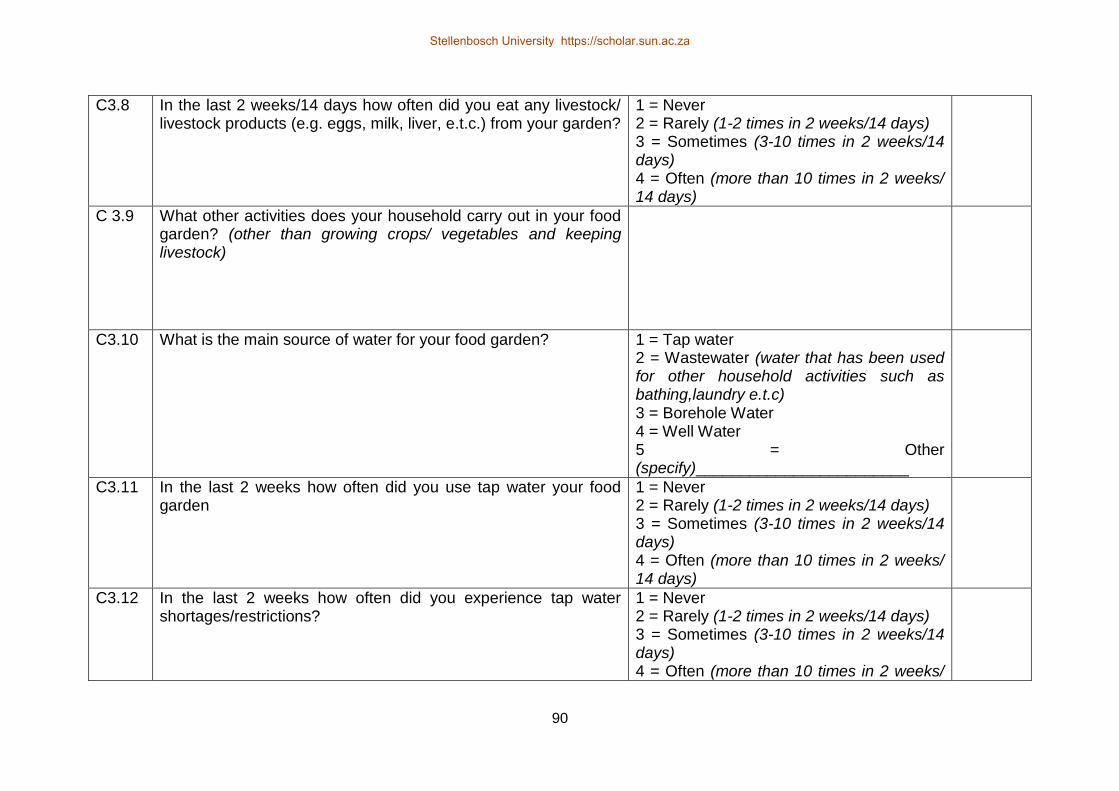
90
C3.8 In the last 2 weeks/14 days how often did you eat any livestock/ livestock products (e.g. eggs, milk, liver, e.t.c.) from your garden?
1 = Never 2 = Rarely (1-2 times in 2 weeks/14 days) 3 = Sometimes (3-10 times in 2 weeks/14 days) 4 = Often (more than 10 times in 2 weeks/ 14 days)
C 3.9 What other activities does your household carry out in your food garden? (other than growing crops/ vegetables and keeping livestock)
C3.10 What is the main source of water for your food garden? 1 = Tap water 2 = Wastewater (water that has been used for other household activities such as bathing,laundry e.t.c) 3 = Borehole Water 4 = Well Water 5 = Other (specify)________________________
C3.11 In the last 2 weeks how often did you use tap water your food garden
1 = Never 2 = Rarely (1-2 times in 2 weeks/14 days) 3 = Sometimes (3-10 times in 2 weeks/14 days) 4 = Often (more than 10 times in 2 weeks/ 14 days)
C3.12 In the last 2 weeks how often did you experience tap water shortages/restrictions?
1 = Never 2 = Rarely (1-2 times in 2 weeks/14 days) 3 = Sometimes (3-10 times in 2 weeks/14 days) 4 = Often (more than 10 times in 2 weeks/
Stellenbosch University https://scholar.sun.ac.za
Stellenbosch University https://scholar.sun.ac.za

91
14 days)
C3.13 What is your alternative/other source of water for your food garden?
1 = None (move to que 3.15) 2 = Tap 3 = Wastewater 4 = Borehole Water 5 = Well Water 6 = Other (specify)________________________
C3.14 In the last 2 weeks how often did you use your alternative/other water source your food garden
1 = Never 2 = Rarely (1-2 times in 2 weeks/14 days) 3 = Sometimes (3-10 times in 2 weeks/14 days) 4 = Often (more than 10 times in 2 weeks/ 14 days)
C3.15 In the last 2 weeks how often did you use wastewater for your food garden? explain the term wasterwater( water that has been used for other household activities such as bathing,laundry e.t.c)
1 = Never 2 = Rarely (1-2 times in 2 weeks/14 days) 3 = Sometimes (3-10 times in 2 weeks/14 days) 4 = Often (more than 10 times in 2 weeks/ 14 days)
No Question Response Options (Fill response in code column)
Code
C4 In the past 2 weeks (14 days) how often have you or any household member purchased any fruit or vegetables for consumption in the household
1 = Never (0 times in 2 weeks/14 days) 2 = Rarely (1-2 times in 2 weeks/14 days) 3 = Sometimes (3-10 times in 2 weeks/14 days) 4 = Often (more than 10 times in 2 weeks/ 14 days)
C5 In the past 2 weeks (14 days) how often have you or any household member purchased any meat or meat products (e.g.
1 = Never (0 times in 2 weeks/14 days) 2 = Rarely (1-2 times in 2 weeks/14 days)
Stellenbosch University https://scholar.sun.ac.za
Stellenbosch University https://scholar.sun.ac.za
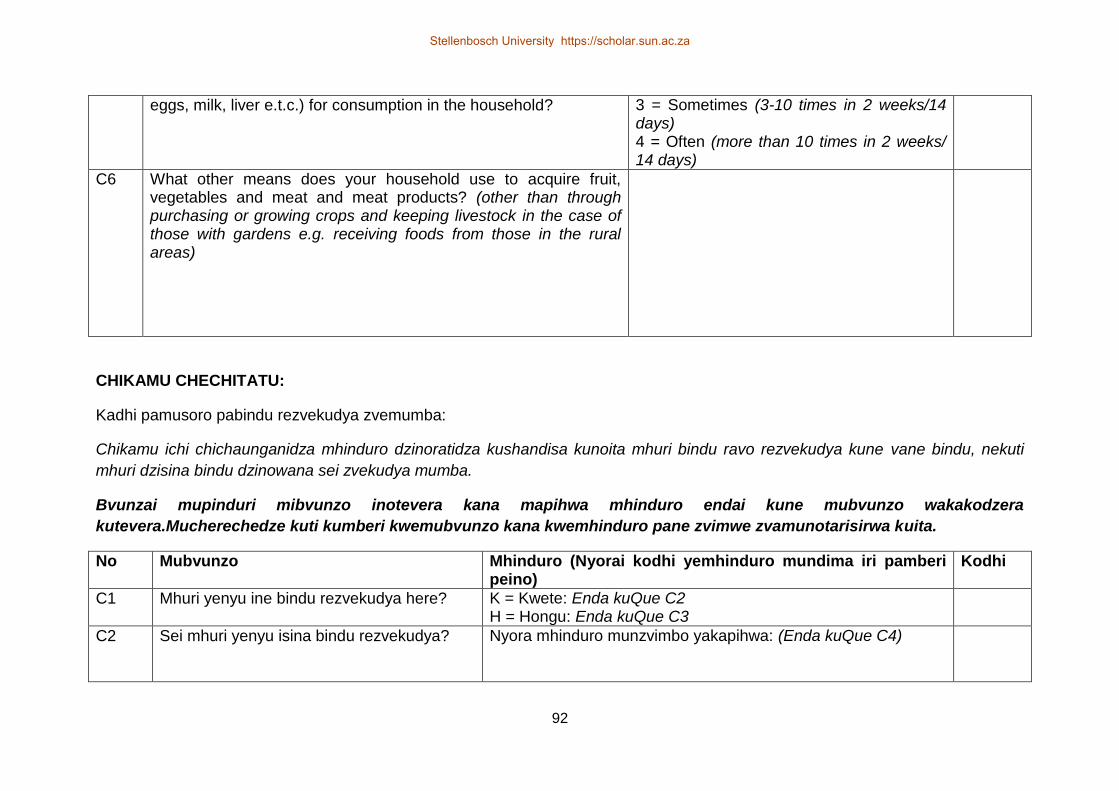
92
eggs, milk, liver e.t.c.) for consumption in the household? 3 = Sometimes (3-10 times in 2 weeks/14 days) 4 = Often (more than 10 times in 2 weeks/ 14 days)
C6 What other means does your household use to acquire fruit, vegetables and meat and meat products? (other than through purchasing or growing crops and keeping livestock in the case of those with gardens e.g. receiving foods from those in the rural areas)
CHIKAMU CHECHITATU:
Kadhi pamusoro pabindu rezvekudya zvemumba:
Chikamu ichi chichaunganidza mhinduro dzinoratidza kushandisa kunoita mhuri bindu ravo rezvekudya kune vane bindu, nekuti
mhuri dzisina bindu dzinowana sei zvekudya mumba.
Bvunzai mupinduri mibvunzo inotevera kana mapihwa mhinduro endai kune mubvunzo wakakodzera
kutevera.Mucherechedze kuti kumberi kwemubvunzo kana kwemhinduro pane zvimwe zvamunotarisirwa kuita.
No Mubvunzo Mhinduro (Nyorai kodhi yemhinduro mundima iri pamberi peino)
Kodhi
C1 Mhuri yenyu ine bindu rezvekudya here? K = Kwete: Enda kuQue C2 H = Hongu: Enda kuQue C3
C2 Sei mhuri yenyu isina bindu rezvekudya? Nyora mhinduro munzvimbo yakapihwa: (Enda kuQue C4)
Stellenbosch University https://scholar.sun.ac.za
Stellenbosch University https://scholar.sun.ac.za

93
C3.0 Sei mhuri yenyu ine bindu rezvekudya Nyora mhinduro munzvimbo yakapihwa: (Enda kuQue C3.1)
Table 1:
No Mubvunzo Mhinduro (Nyorai kodhi yemhinduro mundima iri pamberi peino)
Kodhi
C3.1 Mhuri yenyu ine bindu rakaita sei? 1= Bindu repamba 2= Risiri repamba 3= Repamba nerisiri pamba
C3.2 Ndiani anokupai zvekushandisa mubindu renyu rezvekudya? 1= Vanhu vemumba menyu 2= Hama dzisiri dzemumba menyu 3= Shamwari 4= Vavakidzani 5= Local organisations, charities or NGO’s 6= Hurumende 7= Religious organisations 8= Other (specify) _________________________________
C3.3 Munorima mhando ngani dzezvirimwa mubindu renyu rezvekudya?
1 = Hatina (vakati “hatina” enda ku que 3.6) 2 = 1-3 3 = 4-5 4= dzinopfuura 5
C3.4 Zvirimwa zvamunowana zvinozoshanda sei? 1 = Zvinodyiwa nevanhu vemumba menyu 2 = Munotengesa 3 = Zvinodyiwa nevanhu vemumba menyu uye nekutengeswa 4 = Munochinjana nevanhu vanechimwewo
Stellenbosch University https://scholar.sun.ac.za
Stellenbosch University https://scholar.sun.ac.za
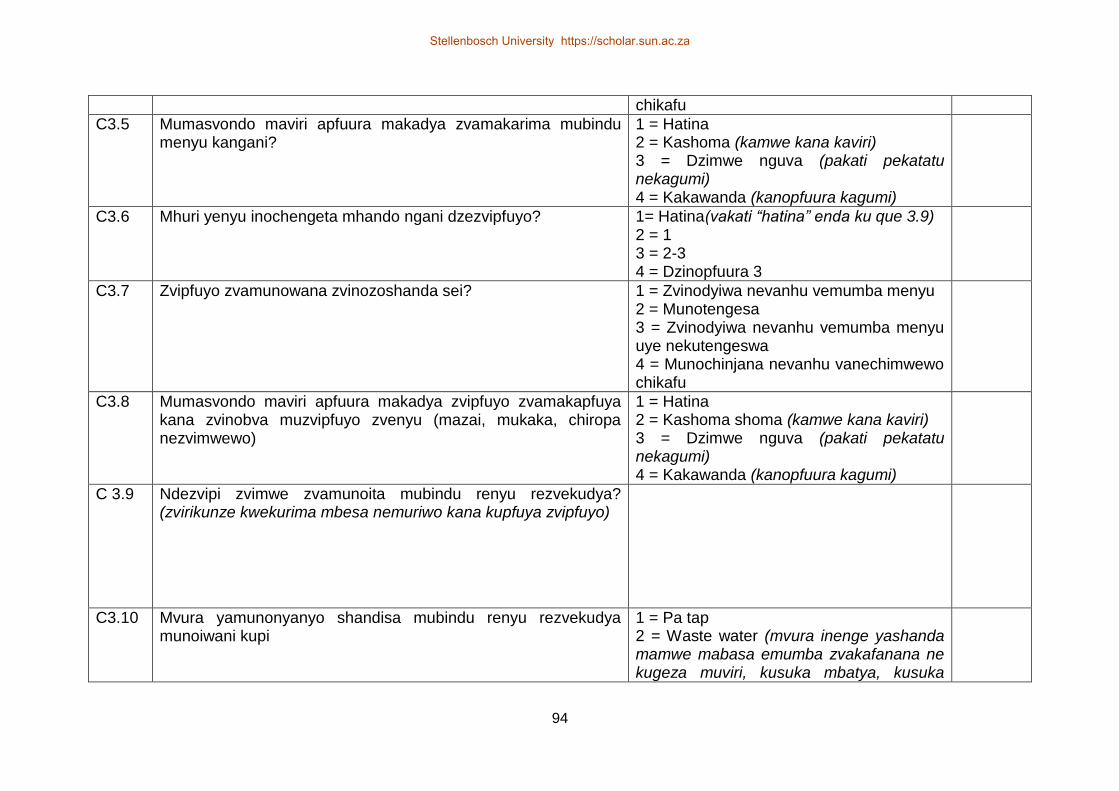
94
chikafu
C3.5 Mumasvondo maviri apfuura makadya zvamakarima mubindu menyu kangani?
1 = Hatina 2 = Kashoma (kamwe kana kaviri) 3 = Dzimwe nguva (pakati pekatatu nekagumi) 4 = Kakawanda (kanopfuura kagumi)
C3.6 Mhuri yenyu inochengeta mhando ngani dzezvipfuyo? 1= Hatina(vakati “hatina” enda ku que 3.9) 2 = 1 3 = 2-3 4 = Dzinopfuura 3
C3.7 Zvipfuyo zvamunowana zvinozoshanda sei? 1 = Zvinodyiwa nevanhu vemumba menyu 2 = Munotengesa 3 = Zvinodyiwa nevanhu vemumba menyu uye nekutengeswa 4 = Munochinjana nevanhu vanechimwewo chikafu
C3.8 Mumasvondo maviri apfuura makadya zvipfuyo zvamakapfuya kana zvinobva muzvipfuyo zvenyu (mazai, mukaka, chiropa nezvimwewo)
1 = Hatina 2 = Kashoma shoma (kamwe kana kaviri) 3 = Dzimwe nguva (pakati pekatatu nekagumi) 4 = Kakawanda (kanopfuura kagumi)
C 3.9 Ndezvipi zvimwe zvamunoita mubindu renyu rezvekudya? (zvirikunze kwekurima mbesa nemuriwo kana kupfuya zvipfuyo)
C3.10 Mvura yamunonyanyo shandisa mubindu renyu rezvekudya munoiwani kupi
1 = Pa tap 2 = Waste water (mvura inenge yashanda mamwe mabasa emumba zvakafanana ne kugeza muviri, kusuka mbatya, kusuka
Stellenbosch University https://scholar.sun.ac.za
Stellenbosch University https://scholar.sun.ac.za

95
midziyo) 3 = Mvura yemuchibhorani 4 = Mvura yemugodhi 5 = Other (specify)________________________
C3.11 Mumasvondo maviri apfura makashandisa mvura yepaTap kangani mubindu renyu rezvekudya
1 = Hatina 2 = Kashoma (kamwe kana kaviri) 3 = Dzimwe nguva (pakati pekatatu nekagumi) 4 = Kakawanda (kanopfuura kagumi)
C3.12 Mumasvondo maviri apfura makashaya mvura yepaTap kangani?
1 = Hatina 2 = Kashoma (kamwe kana kaviri) 3 = Dzimwe nguva (pakati pekatatu nekagumi) 4 = Kakawanda (kanopfuura kagumi)
C3.13 Ndeipi imwe mvura yamunoshandisa kudiridza bindu renyu rezvekudya?
1 = Hatina (enda ku que 3.15) 2 = YepaTap 3 = Wastewater 4 = Mvura yemuchibhorani 5 = Mvura yemugodhi 6 = Other (specify)________________________
C3.14 Mumasvondo maviri apfura makashandisa mvura imwewo kangani mubindu renyu rezvekudya?
1 = Hatina 2 = Kashoma (kamwe kana kaviri) 3 = Dzimwe nguva (pakati pekatatu nekagumi) 4 = Kakawanda (kanopfuura kagumi)
C3.15 Mumasvondo maviri apfura makashandisa wastewater kangani mubindu renyu rezvekudya? taura zvinoreva izwi rekuti “wastewater”-(mvura inenge yashanda mamwe mabasa emumba zvakafanana ne kugeza muviri, kusuka mbatya, kusuka midziyo)
1 = Hatina 2 = Kashoma (kamwe kana kaviri) 3 = Dzimwe nguva (pakati pekatatu nekagumi) 4 = Kakawanda (kanopfuura kagumi)
Stellenbosch University https://scholar.sun.ac.za
Stellenbosch University https://scholar.sun.ac.za
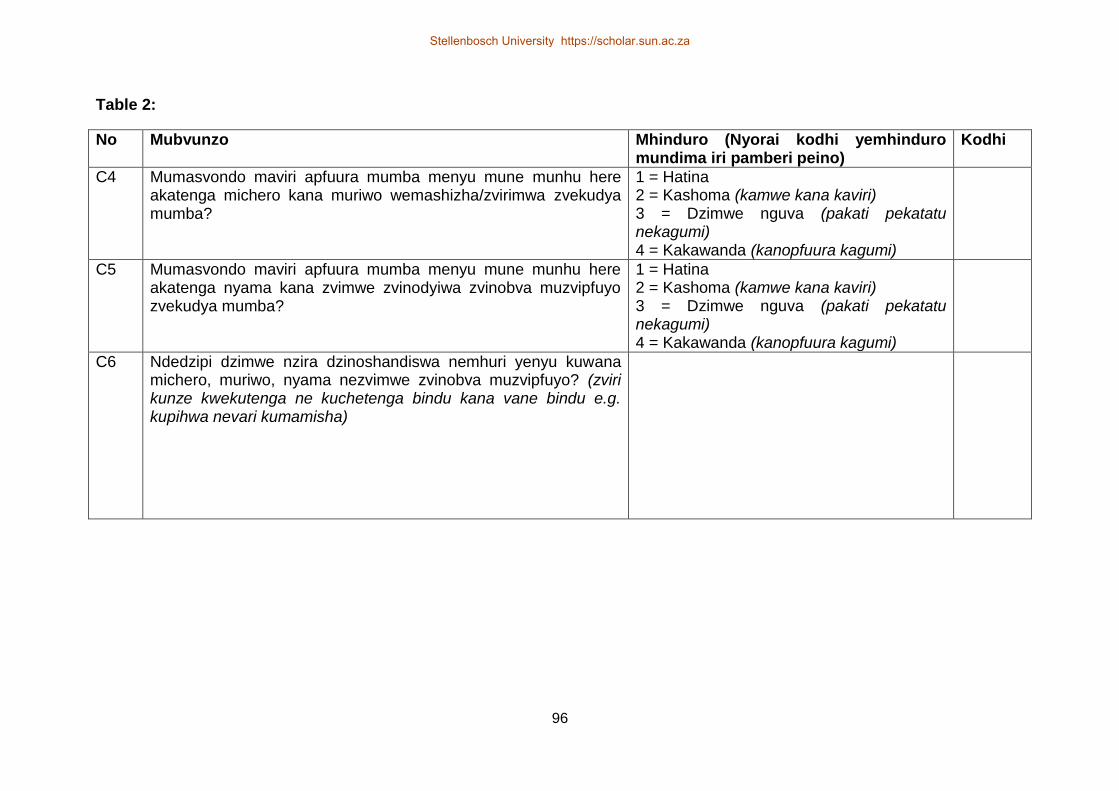
96
Table 2:
No Mubvunzo Mhinduro (Nyorai kodhi yemhinduro mundima iri pamberi peino)
Kodhi
C4 Mumasvondo maviri apfuura mumba menyu mune munhu here akatenga michero kana muriwo wemashizha/zvirimwa zvekudya mumba?
1 = Hatina 2 = Kashoma (kamwe kana kaviri) 3 = Dzimwe nguva (pakati pekatatu nekagumi) 4 = Kakawanda (kanopfuura kagumi)
C5 Mumasvondo maviri apfuura mumba menyu mune munhu here akatenga nyama kana zvimwe zvinodyiwa zvinobva muzvipfuyo zvekudya mumba?
1 = Hatina 2 = Kashoma (kamwe kana kaviri) 3 = Dzimwe nguva (pakati pekatatu nekagumi) 4 = Kakawanda (kanopfuura kagumi)
C6 Ndedzipi dzimwe nzira dzinoshandiswa nemhuri yenyu kuwana michero, muriwo, nyama nezvimwe zvinobva muzvipfuyo? (zviri kunze kwekutenga ne kuchetenga bindu kana vane bindu e.g. kupihwa nevari kumamisha)
Stellenbosch University https://scholar.sun.ac.za
Stellenbosch University https://scholar.sun.ac.za
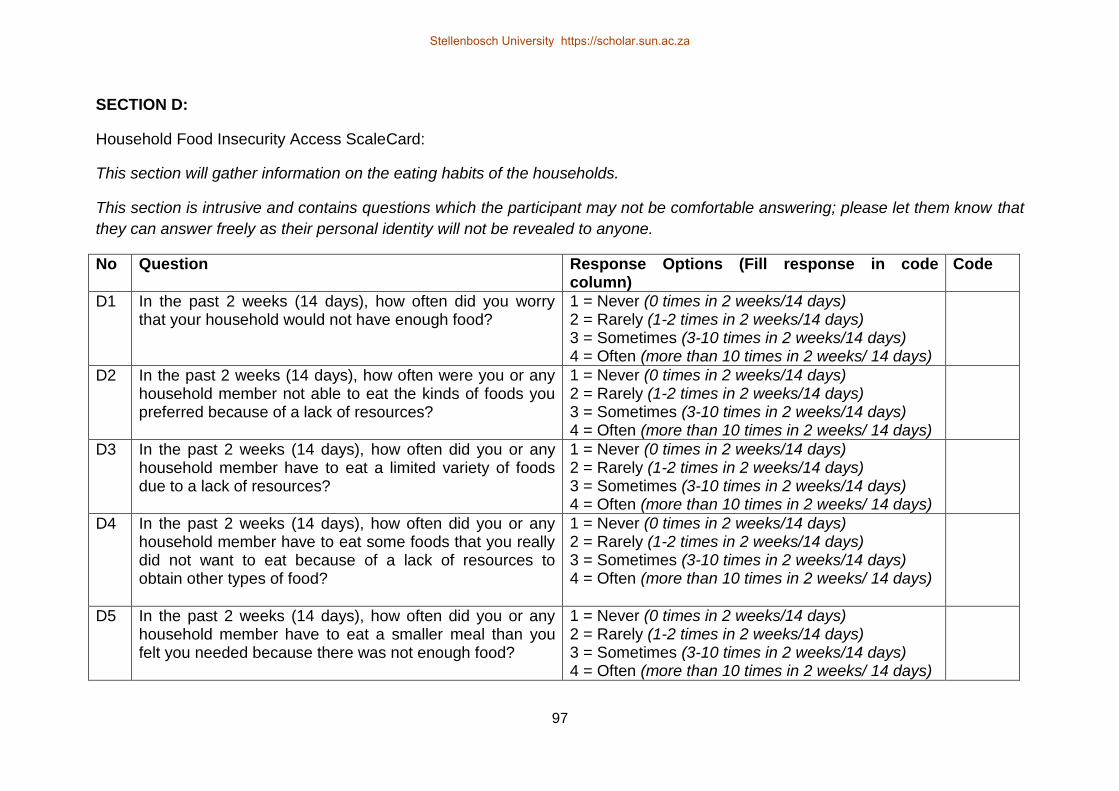
97
SECTION D:
Household Food Insecurity Access ScaleCard:
This section will gather information on the eating habits of the households.
This section is intrusive and contains questions which the participant may not be comfortable answering; please let them know that
they can answer freely as their personal identity will not be revealed to anyone.
No Question Response Options (Fill response in code column)
Code
D1 In the past 2 weeks (14 days), how often did you worry that your household would not have enough food?
1 = Never (0 times in 2 weeks/14 days) 2 = Rarely (1-2 times in 2 weeks/14 days) 3 = Sometimes (3-10 times in 2 weeks/14 days) 4 = Often (more than 10 times in 2 weeks/ 14 days)
D2 In the past 2 weeks (14 days), how often were you or any household member not able to eat the kinds of foods you preferred because of a lack of resources?
1 = Never (0 times in 2 weeks/14 days) 2 = Rarely (1-2 times in 2 weeks/14 days) 3 = Sometimes (3-10 times in 2 weeks/14 days) 4 = Often (more than 10 times in 2 weeks/ 14 days)
D3 In the past 2 weeks (14 days), how often did you or any household member have to eat a limited variety of foods due to a lack of resources?
1 = Never (0 times in 2 weeks/14 days) 2 = Rarely (1-2 times in 2 weeks/14 days) 3 = Sometimes (3-10 times in 2 weeks/14 days) 4 = Often (more than 10 times in 2 weeks/ 14 days)
D4 In the past 2 weeks (14 days), how often did you or any household member have to eat some foods that you really did not want to eat because of a lack of resources to obtain other types of food?
1 = Never (0 times in 2 weeks/14 days) 2 = Rarely (1-2 times in 2 weeks/14 days) 3 = Sometimes (3-10 times in 2 weeks/14 days) 4 = Often (more than 10 times in 2 weeks/ 14 days)
D5 In the past 2 weeks (14 days), how often did you or any household member have to eat a smaller meal than you felt you needed because there was not enough food?
1 = Never (0 times in 2 weeks/14 days) 2 = Rarely (1-2 times in 2 weeks/14 days) 3 = Sometimes (3-10 times in 2 weeks/14 days) 4 = Often (more than 10 times in 2 weeks/ 14 days)
Stellenbosch University https://scholar.sun.ac.za
Stellenbosch University https://scholar.sun.ac.za

98
D6 In the past 2 weeks (14 days), how often did you or any other household member have to eat fewer meals in a day because there was not enough food?
1 = Never (0 times in 2 weeks/14 days) 2 = Rarely (1-2 times in 2 weeks/14 days) 3 = Sometimes (3-10 times in 2 weeks/14 days) 4 = Often (more than 10 times in 2 weeks/ 14 days)
D7 In the past 2 weeks (14 days), how often was there ever no food to eat of any kind in your house because of lack of resources to get food?
1 = Never (0 times in 2 weeks/14 days) 2 = Rarely (1-2 times in 2 weeks/14 days) 3 = Sometimes (3-10 times in 2 weeks/14 days) 4 = Often (more than 10 times in 2 weeks/ 14 days)
D8 In the past 2 weeks (14 days), how often did you or any household member go to sleep at night hungry because there was not enough food?
1 = Never (0 times in 2 weeks/14 days) 2 = Rarely (1-2 times in 2 weeks/14 days) 3 = Sometimes (3-10 times in 2 weeks/14 days) 4 = Often (more than 10 times in 2 weeks/ 14 days)
D9 In the past 2 weeks (14 days), how often did you or any household member go a whole day and night without eating anything because there was not enough food?
1 = Never (0 times in 2 weeks/14 days) 2 = Rarely (1-2 times in 2 weeks/14 days) 3 = Sometimes (3-10 times in 2 weeks/14 days) 4 = Often (more than 10 times in 2 weeks/ 14 days)
Any Comments:
________________________________________________________________________________________________________
________________________________________________________________________________________________________
________________________________________________________________________________________________________
________________________________________________________________________________________________________
________________________________________________________________________________________________________
____________________________________________________________
Stellenbosch University https://scholar.sun.ac.za
Stellenbosch University https://scholar.sun.ac.za
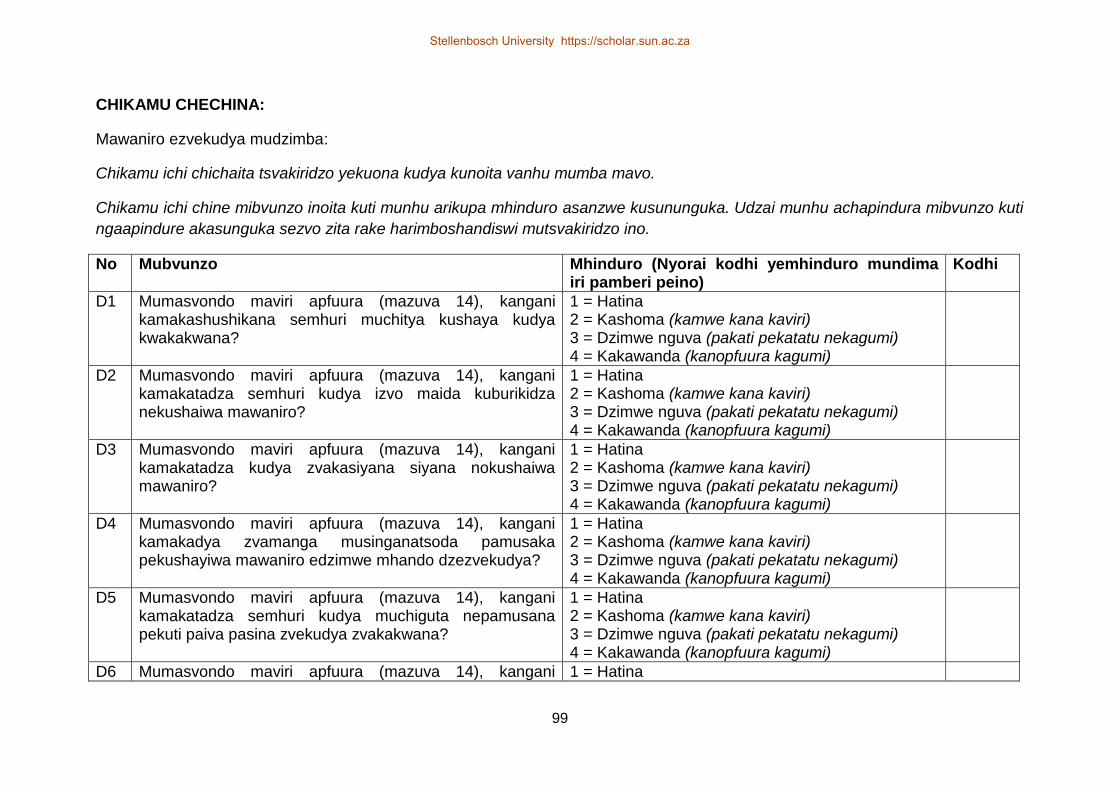
99
CHIKAMU CHECHINA:
Mawaniro ezvekudya mudzimba:
Chikamu ichi chichaita tsvakiridzo yekuona kudya kunoita vanhu mumba mavo.
Chikamu ichi chine mibvunzo inoita kuti munhu arikupa mhinduro asanzwe kusununguka. Udzai munhu achapindura mibvunzo kuti
ngaapindure akasunguka sezvo zita rake harimboshandiswi mutsvakiridzo ino.
No Mubvunzo Mhinduro (Nyorai kodhi yemhinduro mundima iri pamberi peino)
Kodhi
D1 Mumasvondo maviri apfuura (mazuva 14), kangani kamakashushikana semhuri muchitya kushaya kudya kwakakwana?
1 = Hatina 2 = Kashoma (kamwe kana kaviri) 3 = Dzimwe nguva (pakati pekatatu nekagumi) 4 = Kakawanda (kanopfuura kagumi)
D2 Mumasvondo maviri apfuura (mazuva 14), kangani kamakatadza semhuri kudya izvo maida kuburikidza nekushaiwa mawaniro?
1 = Hatina 2 = Kashoma (kamwe kana kaviri) 3 = Dzimwe nguva (pakati pekatatu nekagumi) 4 = Kakawanda (kanopfuura kagumi)
D3 Mumasvondo maviri apfuura (mazuva 14), kangani kamakatadza kudya zvakasiyana siyana nokushaiwa mawaniro?
1 = Hatina 2 = Kashoma (kamwe kana kaviri) 3 = Dzimwe nguva (pakati pekatatu nekagumi) 4 = Kakawanda (kanopfuura kagumi)
D4 Mumasvondo maviri apfuura (mazuva 14), kangani kamakadya zvamanga musinganatsoda pamusaka pekushayiwa mawaniro edzimwe mhando dzezvekudya?
1 = Hatina 2 = Kashoma (kamwe kana kaviri) 3 = Dzimwe nguva (pakati pekatatu nekagumi) 4 = Kakawanda (kanopfuura kagumi)
D5 Mumasvondo maviri apfuura (mazuva 14), kangani kamakatadza semhuri kudya muchiguta nepamusana pekuti paiva pasina zvekudya zvakakwana?
1 = Hatina 2 = Kashoma (kamwe kana kaviri) 3 = Dzimwe nguva (pakati pekatatu nekagumi) 4 = Kakawanda (kanopfuura kagumi)
D6 Mumasvondo maviri apfuura (mazuva 14), kangani 1 = Hatina
Stellenbosch University https://scholar.sun.ac.za
Stellenbosch University https://scholar.sun.ac.za
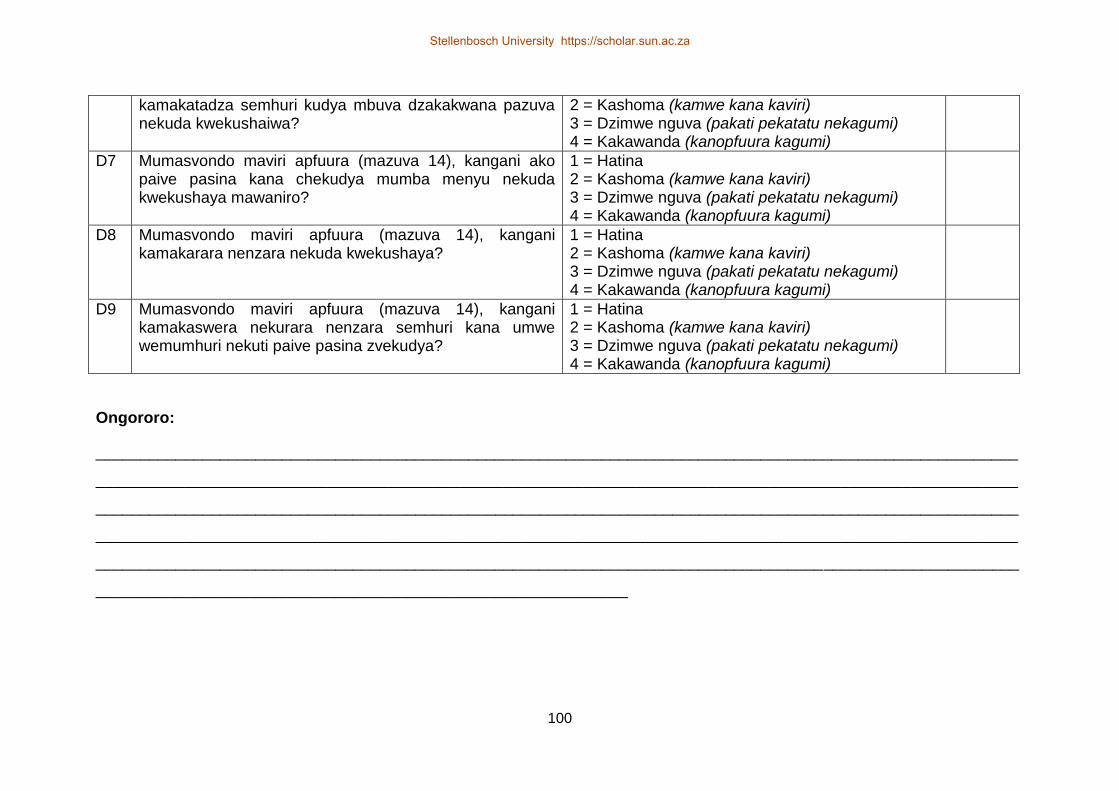
100
kamakatadza semhuri kudya mbuva dzakakwana pazuva nekuda kwekushaiwa?
2 = Kashoma (kamwe kana kaviri) 3 = Dzimwe nguva (pakati pekatatu nekagumi) 4 = Kakawanda (kanopfuura kagumi)
D7 Mumasvondo maviri apfuura (mazuva 14), kangani ako paive pasina kana chekudya mumba menyu nekuda kwekushaya mawaniro?
1 = Hatina 2 = Kashoma (kamwe kana kaviri) 3 = Dzimwe nguva (pakati pekatatu nekagumi) 4 = Kakawanda (kanopfuura kagumi)
D8 Mumasvondo maviri apfuura (mazuva 14), kangani kamakarara nenzara nekuda kwekushaya?
1 = Hatina 2 = Kashoma (kamwe kana kaviri) 3 = Dzimwe nguva (pakati pekatatu nekagumi) 4 = Kakawanda (kanopfuura kagumi)
D9 Mumasvondo maviri apfuura (mazuva 14), kangani kamakaswera nekurara nenzara semhuri kana umwe wemumhuri nekuti paive pasina zvekudya?
1 = Hatina 2 = Kashoma (kamwe kana kaviri) 3 = Dzimwe nguva (pakati pekatatu nekagumi) 4 = Kakawanda (kanopfuura kagumi)
Ongororo:
________________________________________________________________________________________________________
________________________________________________________________________________________________________
________________________________________________________________________________________________________
________________________________________________________________________________________________________
________________________________________________________________________________________________________
____________________________________________________________
Stellenbosch University https://scholar.sun.ac.za
Stellenbosch University https://scholar.sun.ac.za
101
THANK YOU
NOTE: THE IDENTITY OF THE PARTICIPANT WILL REMAIN CONFIDENTIAL.
ANY FINDINGS FROM THIS QUESTIONNAIRE MAY BE PUBLISHED IN A
SCIENTIFIC JOURNAL OR USED IN A PUBLIC PRESENTATION BUT THERE
WILL BE NO REFERENCE TO THE PARTICIPANTS PERSONALLY
TATENDA
CHIZIVISO: MASHOKO PAMUSORO PEMUNHU ACHAPINDURA MIBVUNZO
ACHACHENGETWA MUCHIVANDE UYE HAAZOSHAMBADZWI. MHINDURO
DZICHAPIHWA DZINOGONA KUTSIKISWA MUBHUKU KANA KUSHANDISWA
MUKUDZIDZISA VANHU ASI MAZITA EVANENGE VAPA MHINDURO IDZI
HAATAURWI
Stellenbosch University https://scholar.sun.ac.za
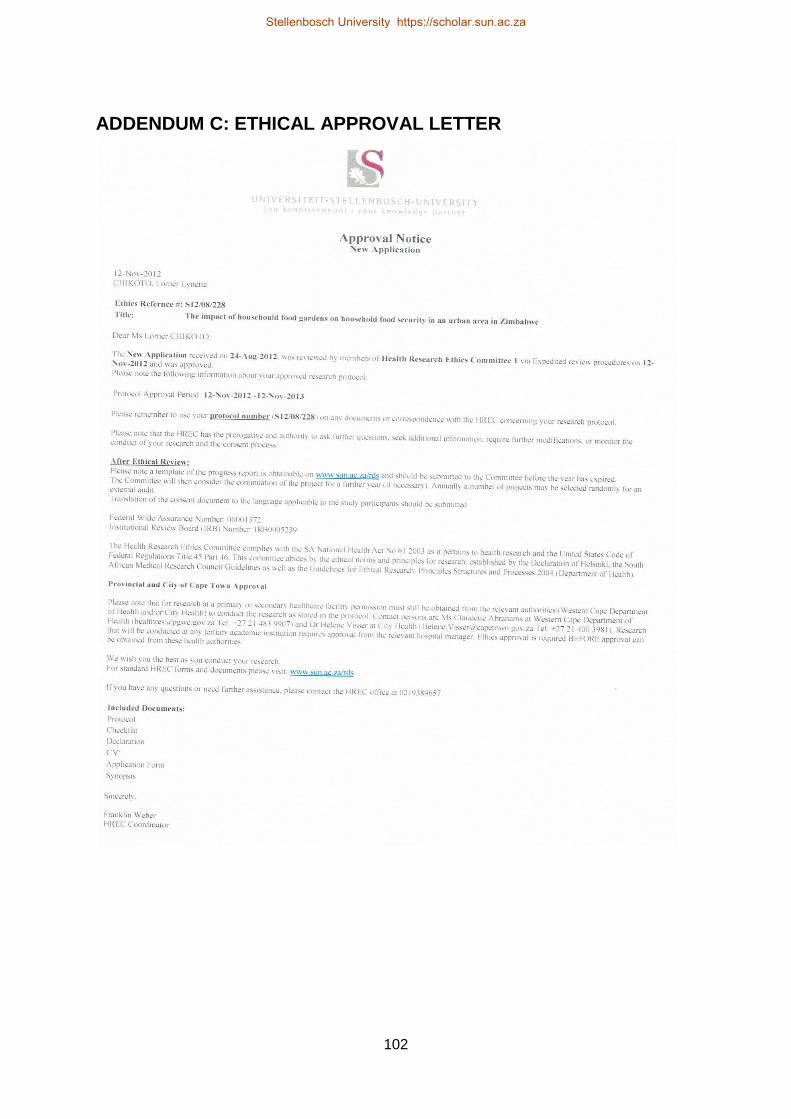
102
ADDENDUM C: ETHICAL APPROVAL LETTER
Stellenbosch University https://scholar.sun.ac.za
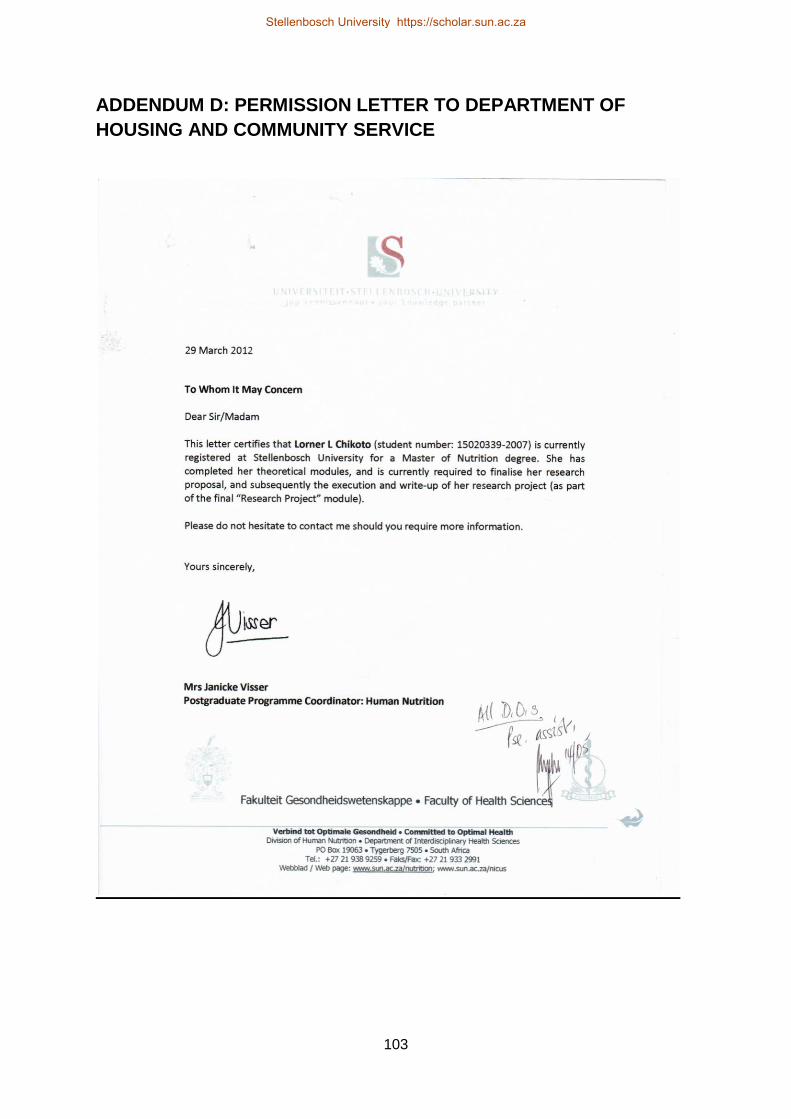
103
ADDENDUM D: PERMISSION LETTER TO DEPARTMENT OF
HOUSING AND COMMUNITY SERVICE
Stellenbosch University https://scholar.sun.ac.za
104
ADDENDUM E: PARTICIPANT INFORMATION LEAFLET AND
CONSENT FORM
TITLE OF THE RESEARCH PROJECT:
The Impact of Household Food Gardens on Household Food Security in an Urban
Area in Zimbabwe.
REFERENCE NUMBER:
PRINCIPAL INVESTIGATOR: Lorner. L. Chikoto
ADDRESS:18B Caledon Avenue, Hatfield, Harare, Zimbabwe.
CONTACT NUMBER:(+2634) 576720, +263772724457.
You are being invited to take part in a research project. Please take some time to
read the information presented here, which will explain the details of this project.
Please ask the study staff any questions about any part of this project that you do
not fully understand. It is very important that you are fully satisfied that you clearly
understand what this research entails and how you could be involved. Also, your
participation is entirely voluntary and you are free to decline to participate. If you
say no, this will not affect you negatively in any way whatsoever. You are also free to
withdraw from the study at any point, even if you do agree to take part.
This study has been approved by the Health Research Ethics Committee at
Stellenbosch University and will be conducted according to the ethical guidelines
and principles of the international Declaration of Helsinki, South African Guidelines
for Good Clinical Practice and the Medical Research Council (MRC) Ethical
Guidelines for Research.
Stellenbosch University https://scholar.sun.ac.za
105
What is this research study all about?
This study will be conducted in the suburbs of Mbare, Prospect and Msasa Park.
A total of 120 households will be asked to participate from these areas, 33
households from each area will be interviewed by a field worker who will ask
them a number of questions listed in the questionnaire they will have with them.
This study aims to gather information on food gardens in the area and how
people use them. The fieldworker will ask some question about:
o The number, gender and ages of people who live in the household
o How and what thepeople in your household eat.
o How you use your backyard garden if you have one.
o How you obtain you vegetables, meat and animal products If you have ever had
times in which you could not obtain all the food you wanted
We will need to interview 33/34 households in this area. To make sure we
interview the households without favour, we have to interview every ____
household in this area. Your household has been chosen because your house is
the ______ household in this area.
Why have you or any household member been invited to participate?
You have been invited to participate in this research because you are a resident
of this area.
What will your responsibilities be?
Your responsibility will be to answer all the questions asked by the fieldworker to
the best of your knowledge.
Will you benefit from taking part in this research?
This research will help people responsible for planning the activities people can
carry out in the residential areas understand how people get food for their
households and whether they use their gardens for food.
Are there any risks involved in taking part in this research?
Stellenbosch University https://scholar.sun.ac.za
106
There are currently no risks associated with taking part in this study.
Who will have access to your records?
If you agree to take part in this study your identity will not be revealed or
shared with anyone. Your contact details will not be required This form will
be kept separate from all your answers
The information you give in this study may be published in a scientific journal
or used in a public presentation but there will be no reference to you
personally.
Will you be paid to take part in this study and are there any costs involved?
You will not be paid to take part in this study.
Is there anything else that you should know or do?
You can contact the Health Research Ethics Committee at +2721-938 9207 if
you have any concerns or complaints that have not been adequately
addressed by your study staff
You will receive a copy of this information and consent form for your own
records.
Declaration by participant
By signing below, I …………………………………..…………. agree to take part in a
research study entitled; The Impact of Household Food Garden on Household
Food Security in an Urban Area in Zimbabwe.
I declare that:
I have read or had read to me this information and consent form and it is
written in a language in which I am fluent and comfortable.
Stellenbosch University https://scholar.sun.ac.za
107
I have had a chance to ask questions and all my questions have been
adequately answered.
I understand that taking part in this study is voluntary and I have not been
pressurised to take part.
I may choose to leave the study at any time and will not be penalised or
prejudiced in any way.
Signed at (place) ......................…........…………….. on (date) …………....………..
2012.
.............................................................. ............................................................
Signature of participant Signature of witness
Declaration by investigator
I (name) ……………………………………………..……… declare that:
I explained the information in this document to …………………………………..
I encouraged him/her to ask questions and took adequate time to answer
them.
I am satisfied that he/she adequately understands all aspects of the research,
as discussed above
I did/did not use an interpreter. (If an interpreter is used then the interpreter
must sign the declaration below.
Signed at (place) ......................…........…………….. on (date) …………....………..
2012.
Stellenbosch University https://scholar.sun.ac.za

108
.............................................................. ............................................................
Signature of investigator Signature of witness
Declaration by interpreter
I (name) ……………………………………………..……… declare that:
I assisted the investigator (name) ………………………………………. to
explain the information in this document to (name of participant)
……………..…………………………….. using the language medium of
English/Shona
We encouraged him/her to ask questions and took adequate time to answer
them.
I conveyed a factually correct version of what was related to me.
I am satisfied that the participant fully understands the content of this informed
consent document and has had all his/her question satisfactorily
answered.
Signed at (place) ......................…........…………….. on (date)
…………....………………..
.............................................................. ............................................................
Signature of interpreter Signature of witness
Stellenbosch University https://scholar.sun.ac.za
109
REFERENCES
1. Equality and Human Rights Commission. What are human rights? [Online]
Available at: http://www.equalityhumanrights.com/your-rights/human-
rights/what-are-human-rights. [Accessed 15 January 2016]
2. The Office of the High Commissioner for Human Rights. What are human
rights? [Online] Available at
http://www.ohchr.org/EN/Issues/Pages/WhatareHumanRights.aspx.
[Accessed 15 January 2016]
3. The Office of the High Commissioner for Human Rights. Human rights
dimension of poverty. [Online] Available at
http://www.ohchr.org/EN/Issues/Poverty/DimensionsOfPoverty/Pages/.
[Accessed,17 January 2016]
4. Beddington J, Asaduzzaman M, Clark M, et al. Achieving food security in the
face of climate change: Final report from the Commission on Sustainable
Agriculture and Climate Change. Copenhagen: CCAFS; 2012. Available at:
www.ccafs.cgiar.org/commission. [Accessed 26 October 2014]
5. Anderson M D. Beyond food security to realizing food rights in the US. J Rural
Stud 2013; 29: 113-122.
6. The Office of the High Commissioner for Human Rights. Human rights,
Poverty reduction and sustainable development: health, food and water. A
Background Paper. World Summit on Sustainable Development.
Johannesburg: OHCHR; 2002. Available at:
www.ohchr.org/Dcouments/Publications/HRPovertyReductionen.pdf.
[Accessed, 20 January 2016]
7. The Office of the High Commissioner for Human Rights. Hunger is a violation
of human rights. [Online]. Available at:
Stellenbosch University https://scholar.sun.ac.za
110
http://www.ohchr.org/EN/NewsEvents/Pages/Food Crisis.aspx. [Accessed, 5
January 2016]
8. The Office of the High Commissioner for Human Rights. The guiding
principles on extreme poverty and human rights. Geneva: OHCHR; 2012.
Available at:
http://www.ohchr.org/Documents/Publications/OHCHR_ExtremePovertyandH
umanRights_EN.pdf. [Accessed 24 January 2016]
9. The Office of the High Commissioner for Human Rights. Human rights and
poverty reduction. [Online] Available at:
http://www.undp.org/content/undp/en/home/ourwork/povertyreduction/focus_a
reas/focus_inclusive_development/human_rights_andpovertyreduction.html.
[Accessed 10 December 2015]
10. De Schutter O, Robinson M, Shine T. Human rights: their role in achieving
climate justice and food and nutrition security. In: A new dialogue: putting
people at the heart of global development: thematic papers; rights. hunger,
nutrition, climate change. Dublin: Irish Aid, WFP, CCFAS, CGIAR, Mary
Robinson Foundation; 2013. Available at:
http://www.mrfcj.org/media/pdf/Human-Rights-FNS-Climate-Justice.pdf.
[Accessed 12 January 2016]
11. The Office of the High Commissioner for Human Rights. Principles and
guidelines for a human rights approach to poverty reduction strategies.
Geneva: OHCHR; 2006. Available at :
http://www.ohchr.org/Documents/Publications/PovertyStrategiesen.pdf.
[Accessed 25 June 2013]
12. Food and Agriculture Organisation. Voluntary guidelines to support the
progressive realization of the right to adequate food in the context of national
food security. Rome: FAO; 2004.
Stellenbosch University https://scholar.sun.ac.za

111
13. Food and Agriculture Organisation. Urban agriculture for sustainable poverty
alleviation and food security. Rome: FAO/World Bank; 2008. Available at:
http://www.fao.org/fileadmin/templates/FCIT/PDF/UPA_-WBpaper-
Final_October_2008.pdf [Accessed 28 September 2014].
14. Charles H, Godfray J, Beddington JR et al. Food security: the challenge of
feeding 9 billion people. Science 2010; 327(5967): 812-818. Available at:
http://science.sciencemag.org/content/327/5967/812.full-text.pdf+html.
[Accessed 15 May 2012].
15. Smit J, Nasr J, Ratta A. Chapter 2: Urban agriculture yesterday and today. in:
urban agriculture: In: Food, jobs and sustainable cities, Second Revision.
Urban Agriculture Network 2001.
16. Mbiba B. Institutional response to uncontrolled urban cultivation in harare;
prohibitive or accommodative. Environ Urban 1994; 6 (1). p. 188-202.
Available online at: http://eau.sagepub.com/content/6/1/188. [Accessed 3
February 2012]
17. Cofie. O O, Van Veehuizen R, Drechsel P. Contribution of urban and peri-
urban agriculture to food security in sub-Saharan Africa. Paper presented at:
Africa Session of the 3rd WWF. Kyoto: WWF; 2003.
18. The Office of the High Commissioner on Human Rights. International
covenant on economic, social and cultural rights. Rome: OHCHR; 1996.
Available at: http://www2.ohchr.org/english/law/pdf/cescr.pdf. [Accessed, [12
December 2011]
19. The Office of the High Commissioner on Human Rights. Fact Sheet No 34:
The Right to Adequate Food. Geneva: OHCHR; 2010. Available at:
http://www.ohchr.org/Documents/Publications/FactSheet34en.pdf. [Accessed
23 September 2015]
Stellenbosch University https://scholar.sun.ac.za
112
20. McClain Nhlapo C. Implementing a human rights approach to food security.
2020 African conference brief. Washington D.C: International Food Policy
Research Institute; 2004. Available at:
http://www.ifpri.org/publication/implementing-human-rights-approach-food-
security. [Accessed 16 May 2013]
21. Eide A. The human right to adequate food and freedom from hunger. in; the
right to food in theory and practice. Rome: FAO;1998 Available at:
http://www.fao.org/docrep/w9990e/w9990e03.htm. [Accessed 18 December
2011]
22. World Food Summit. Rome declaration on world food security. Rome: FAO;
1996. Available at: http://www.fao.org/docrep/003/w3613e/w3613e00.htm.
[Accessed 20 November 2011]
23. Brand D. Chapter 9: Food rights In: Khoza S, editor. Socio-economic rights in
South Africa. Cape town: University of the Western Cape; 2007; p. 311-341.
24. Lupton D. Introduction. In, Food, the body, the self. London: Sage
Publications; 1996; p. 1-175.
25. Lioba. W. The concept of food and nutrition security. In: Klennert K editor.
achieving food and nutrition security: actions to meet the global challenge, a
training course reader. Feldafing: Internationale Weiterbildung und
Entwicklung gGmbH;. 2005. pp 3-26. Available
at:http://www.fao.org/docs/eims/upload/219148/food_reader_engl.pdf.
[Accessed, 27 June 2014]
26. World Health Organisation. Nutrition for health and development: a global
agenda for combating malnutrition. Geneva: WHO; 2000. Available at:
https://www.who.int/mip2001/files/2231/NHDprogressreport2000.pdf.
[Accessed 18 March 2013]
Stellenbosch University https://scholar.sun.ac.za

113
27. Food and Agriculture Organisation. Statistical yearbook 2012. Rome: FAO;
2012. Available at:
http://www.fao.org/docrep/015/i2490e/i2490e03a.pdf.[Accessed 6 February
2016]
28. Food and Agriculture Organisation. The state of food insecurity in the world
2014. rome. strengthening the enabling environment for food security and
nutrition. Rome: FAO: 2014. Available at: http://www.fao.org/3/a-i4030e.pdf.
[Accessed 3 November 2015]
29. Sen A. Poverty and Famines, an Essay on Entitlement and Deprivation.
Oxford: Claredon Press; 1983.
30. Andersen Pinstrup P. Food security: definition and measurement. Food Secur.
2009; 1: 5-7. Available at:
http://observatorioseguridadalimentaria.org/sites/default/files/publicaciones/ar
chivos/Pinstrup-Andersen_Food%20Security-Definiition-
Measurement_2009.pdf. [Accessed 20 May 2014]
31. Brinkman HJ, de Pee S, Sanogo I, Subran L, Bloem MW. High food prices
and the global financial crisis have reduced access to nutritious food and
worsened nutritional status and health. J Nutr. 2010; 140(1):153S-161S.
32. Burchi F, Fanzo J, Frison E. The role of food and nutrition system approaches
in tackling hidden hunger. Int J Environ Res Public Health. 2011; 8(2):358-
373.
33. Rae I. Women and the right to food. International law and state practice.
Rome: FAO: 2008. Available at:
http://www.fao.org/docrep/016/ap549e/ap549e.pdf. [Accessed, 8 July 2014]
34. The Office of the High Commissioner for Human Rights; General comment 12
on the Right to Food. Adopted May 12 1999. Geneva: OHCHR; 1999.
Available at:
Stellenbosch University https://scholar.sun.ac.za
114
http://www.unhchr.ch/tbs/doc.nsf/0/3d02758c707031d58025677f003b73b9.
[Accessed 6 November 2011]
35. Oniang R, Mukudi E. Nutrition and gender. In: Nutrition: A foundation for
development. Geneva: ACC/SCN; 2002.
36. Food and Agriculture Organisation. Women- key to food security, FAO at work
2010-2011. Rome: FAO, 2011.
37. De Schutter O. Our secret weapon against hunger: Gender equality and
women’s empowerment. E-newsletter of the gender network. 2012; 6(2).
Available at:
http://www.srfood.org/images/stories/pdf/otherdocuments/104051371-our-
secret-weapon-against-hunger-gender-equality-and-women-s-
empowerment.pdf. [Accessed 26 September 2015]
38. The World Bank. Urban poverty: an overview. [Online] Available at:
http://web.worldbank.org/WBSITE/EXTERNAL/TOPICS/EXTURBANDEVELO
PMENT/EXTURBANPOVERTY/0,,contentMDK:20227679~menuPK:7173704
~pagePK:148956~piPK:216618~theSitePK:341325,00.html. [Accessed 17
January 2016]
39. Federal Ministry for Economic Cooperation and Development. Managing
urbanisation towards sustainable cities. BMZ Information Brochure 3.Berlin:
BMZ; 2014. Available at:
http://www.bmz.de/en/publications/type_of_publication/information_flyer/infor
mation_brochures/Materialie237_Information_Brochure_3_2014.pdf.
[Accessed 17 December 2015]
40. Food and Agriculture Organisation . The state of food insecurity in the
world: How does international price volatility affect domestic economies and
food security.. Canada: FAO; 2011
Stellenbosch University https://scholar.sun.ac.za
115
41. Faber M, Witten C, Drimie S. Community-based agricultural interventions in
the context of food and nutrition security in South Africa. S Afr J Clin Nutr,
2011; 24(1): 21-30.
42. Crush J, Hovorka A, Tevera D. Food insecurity in Southern African cities; The
place of urban agriculture. J Dev Stud, 2011; 11 (4): 285-305. [Available at:
http://pdj.sagepub.com/content/11/4/285. [Accessed, 10 November 2015 ]
43. Temple N, Steyn NP, editors. Chapter 5: Food and nutrition security. In:
Community nutrition textbook for South Africa: A rights based approach:
Tygerberg: Chronic Diseases of Lifestyle Unit, Medical Research Council;
2008.
44. Frayne B, Pendleton W, Crush J et al. The state of urban food insecurity in
Southern Africa. Urban Food Security Series 2.Cape Town: Unity Press:
2010.
45. Mougeot LJA. Urban agriculture: definition, presence, potential and risks,
main policy challenges. Report presented at: International workshop on
growing cities growing food: Urban Agriculture on the Policy Agenda. Cuba:
IDRC; 1999. Available at: https://idl-
bnc.idrc.ca/dspace/bitstream/10625/26429/12/117785.pdf. [ Accessed 18
November 2011]
46. Eval A. The feeding of the nine billion people: Global food security for the 21st
century. A Chatman house report. London: Royal Institute of International
Affairs; 2009.
47. Rosegrant MW, Cline SA, Global food security: Challenges and policies.
Science, 2003; 302. p 1917-1919.
48. Food and agriculture organisation. Achieving the right to food: the human
rights challenge of the twenty first century. Rome: FAO; 2007. Available at:
Stellenbosch University https://scholar.sun.ac.za

116
http://www.fao.org/fileadmin/templates/wfd2007/pdf/WFDLeaflet2007E.pdf.
[Accessed 15 July 2013]
49. Zezza A, Tasciotti L. Urban agriculture, poverty and food security: Empirical
evidence from a sample of developing countries. Food Policy 2010; 35(4):
265-273.
50. Van Veenhuizen R, Danso G. Profitability and sustainability of urban and peri-
urban agriculture. Food and Agriculture Organisation, Marketing and Finance
Occasional Paper No 19. Rome: FAO; 2009. Available at:
ftp.fao.org/../a1471e00.pdf. [Accessed, 6 August 2013]
51. Ruel MT, Garret JL, Hawkes C, Cohen MJ. The food, fuel and financial crises
affect the urban and rural poor disproportionately. A review of the evidence.
J.Nutr 2010; 140(1): 170S-176S.
52. Smit J, Nasr J, Ratta A. Chapter 8: Problems related to urban agriculture. In:
Urban agriculture; food, jobs and sustainable cities. Fourth Revision. Urban
Agric Network; 2001.
53. Redwood M. Chapter 15: Urban agriculture and changing food markets. In;
The global food crisis: governance, challenges and opportunities. Wildfrid
Laurier, Ontario: University; Press 2009.
54. Peter KA. Creating a sustainable urban agriculture revolution. J Envtl. L. &
Litig 2010; 25: 203.
55. McClintock MN. Why farm the city. Theorizing urban agriculture through a lens
of metabolic rift. Cambridge. Jnl. Regions. Econ and Society. 2009; 3(2): 191-
207.
56. Broadway M. Growing urban agriculture in North American cities: The
example of Milwaukee. Focus on Geography. 2009; 52(3-4): 23-30.
Stellenbosch University https://scholar.sun.ac.za
117
57. Koont S. The urban agriculture of Havana. Monthly Review 2009;60(8).
[Online]. Available at: http://monthlyreview.org/2009/01/01/the-urban-
agriculture-of-havana/. [Accessed 20 December 2015]
58. Cabannes Y. Pro-poor and institutional frameworks for urban and peri-urban
agriculture. FAO Legislative Study 108. Rome: FAO; 2012. Available at:
http://www.fao.org/docrep/017/i3021e/i3021e.pdf. [Accessed 27 October
2013]
59. Lee Smith D, Prain G. Urban agriculture and health. In: Hawkes C, Ruel MT,
Understanding the links between agriculture and health. Rome: FAO; 2006.
Available at: http://ebrary.ifpri.org/cdm/ref/collection/p15738coll2/id/126912.
[Accessed 4 December 2013]
60. Nasinyama GW, Azuba MS, Prossy M, Nabulo G, Kyagolinza J. Perceptions
of health risks and benefits of urban and peri-urban livestock production in
Kampala. In: Boischio A, Clegg A, Mwagore D. Health risks and benefits of
urban and peri-urban agriculture and livestock (UA) in Sub-Saharan Africa.
Ontario: IDRC; 2006. Available at: http://idl-
bnc.idrc.ca/dspace/bitstream/10625/35531/1/127428.pdf. [Accessed 5
December 2013]
61. Deelstra T, Girardet H. Urban agriculture and sustainable cities. Thematic
Paper 2. RUAF. Available at:
http://www.ruaf.org/sites/default/files/Theme2_1_1.PDF. [Accessed 3
November 2014]
62. Chibanda D. Health risks and benefits of urban agriculture in the city of
Harare. In: Boischio A, Clegg A, Mwagore D. Health risks and benefits of
urban and peri-urban agriculture and livestock (UA) in Sub-Saharan Africa.
Ontario: IDRC; 2006. Available at: http://idl-
bnc.idrc.ca/dspace/bitstream/10625/35531/1/127428.pdf. [Accessed 7
October 2015]
Stellenbosch University https://scholar.sun.ac.za

118
63. Webb NL. When is enough, enough: Advocacy, evidence and criticism in the
field of urban agriculture in South Africa. Dev South Afr 2011; 28(2): 195-208
64. Foeken DWJ. Legislation, policies and the practice of urban farming in
Nakuru, Kenya: Contradictions abound. Urban Agriculture Magazine. 2006;
16:41-44.
65. Food and Agriculture Organisation. Food for the cities: land tenure and food
production. Rome: FAO; 2011. Available at:
ftp://ftp.fao.org/docrep/fao/011/ak003e/ak003e11.pdf. [Accessed 10 July
2014]
66. Lutaladio N, Thomas G. Overview. In: Thomas G, editor. Growing greener
cities in Africa. First status report on urban and peri-urban horticulture in
Africa, Food and Agriculture Organisation of the United Nations. Rome: FAO;
2012.
67. Stewart R, Korth M, Langer L. What are the impacts of urban agriculture
programs of food security in low and middle- income countries?
Environmental Evidence 2013; 2(7).
68. Haddad LJ, Oshuag A. How Does the Humans Rights Perspective Help to
Shape the Food and Nutrition Policy Research Agenda. Food Consumption
and Nutrition Division Discussion Paper No 56. Washington D.C: International
Food Policy and Research Institute; 1999.
69. Bryld E. Potentials, problems and policy implication for urban agriculture in
developing countries. Agric and Human Values 2003; 20. p.79-86.
70. Cabannes Y, Dubbeling M. Land management and physical planning No 3. 1
Edition. In: Sanchez N, Rhon MD, editors. Guidelines for municipal
policymaking on urban agriculture. Canada: IDRC/IPES/PGU-ALC/UN-
HABITAT; 2003.
Stellenbosch University https://scholar.sun.ac.za

119
71. Mubvami T, Mashamba S, Va Veenhuizen R. Availability, access and usability
of land for urban agriculture. Urban Agriculture Magazine 2003; 11. Available
at: http://www.alnap.org/resource/7369. [Accessed 9 August 2012]
72. Arku G, Mkandawire P, Aguda N, Kuuire V. Africa’s quest for food security:
what is the role of urban agriculture. Occasional Paper 19.Harare: The Africa
Capacity Building Foundation; 2012.
73. De Zeeuw H, Van Veenhuizen R, Dubbeling M. The role of urban agriculture
in building resilient cities in developing countries. Cambridge: Cambridge
University Press. J Agric Sci, 2011. p1-11.
74. Cabannes Y. Financing urban agriculture: Environment and Urbanisation
2012; 24(2):665-683. Available at:
http://eau.sagepub.com/content/24/2/665.full.pdf+html. [Accessed 23 August
2013]
75. Dubbeling M, Santandreu A. Urban agriculture, a tool for sustainable
development. In: Rhon D M, editor. Guidelines for municipal policy making on
urban agriculture. DRC, IPES, PGU-ALC,UN-HABITAT; 2003. Available at:
http://www.ruaf.org/sites/default/files/Guideline%201%20Urban%20Agriculture
%20-%20a%20tool%20for%20sustainable%20municipal%20development.pdf.
[Accessed 10 May 2014]
76. Buechler S, Mekala GD, Keraita B. Wastewater use for urban and peri-urban
agriculture. In: Van Veehuizen R, editor. Cities farming for the future: urban
agriculture for green and productive cities. The Philippines: RUAF
Foundation/IDRC/IIRR; 2006. p243-273.
77. Gleick PH. Global fresh water resources: Soft path solutions for the 21st
Century. Science 2003; 52(1524).
78. De Fraiture C, Wichelns D. Satisfying future water demands for agriculture.
Agricultural Water Management 2010; 97: 502-511.
Stellenbosch University https://scholar.sun.ac.za

120
79. Jacobsen M, Webster M, Vairavamoorthy K. The future of water in African
Cities: Why waste water? Washington DC: International Bank for
Reconstruction and Development; 2012.
80. Maphosa. B. Lessons from the 1992 drought in Zimbabwe: The quest for
alternative food policies. Nor J Afr Studies 1994; 3 (1). p53-58.
81. Chinogwenya. W. Zimbabwe rural livelihood baselines. Final Report.
ZIMVAC/DFID/EC/Save the Children; 2011. (unpublished).
82. The Government of Zimbabwe. Zimbabwe Census 2012. ZIMSTAT, Harare
2012.
83. Mrema M, Chitiyo F. Home gardening as a coping strategy for urban and peri-
urban households: The case of Mutare city, Manicaland Province, Zimbabwe
during the 2008 hyperinflation period. Conference Paper. Addis Ababa: IFPRI;
2011.
84. Zimbabwe: Multiple indicator monitoring survey (MIMS) 2009: Report.
Government of Zimbabwe-UNICEF; 2009. Available from: Zimbabwe National
Statistics Agency (ZIMSTAT).
85. World fit for children; mid-decade progress report: Zimbabwe 2002-2006.
Harare: UNICEF/Government of Zimbabwe; 2007. Available at:
http://www.unicef.org/worldfitforchildren/files/Zimbabwe_WFFC5_Report.pdf.
[Accessed 7 June 2013]
86. Food and Nutrition Council of Zimbabwe. Zimbabwe Vulnerability Assessment
Committee (ZimVac). Urban livelihood assessment report; April 2011. Harare:
FNC/ZimVac/SIRDC; 2011.
87. World Bank. Zimbabwe at a glance 2011. [Online]. Available at:
devdata.worldbank.org/AAG/zwe_aag.pdf. [Accessed 17 July 2010].
Stellenbosch University https://scholar.sun.ac.za
121
88. Economic and Social Council. Implementation of the international covenant on
economic, social and cultural rights; initial reports submitted by state parties
under Article 16 and 17 of the Covenant: Zimbabwe. June 1995. Rome:
OHCHR; 1996.
89. Office of the United Nations High Commissioner for Human Rights. Glossary
of Terms. Accession. [Online]. Available at:
www2.ohchr.org/English/bodies/treaty/glossary.htm. [Accessed 12 December
2011]
90. The Government of Zimbabwe. The Constitution of the Republic of Zimbabwe
Amendment (No 20) 2013. Harare: Government of Zimbabwe. 2013
91. The Government of Zimbabwe. Urban Councils Act Chapter 29:15. Available
Harare: Government Printer
92. The Government of Zimbabwe. The Environmental Management Act Chapter
20:27. Harare: Government Printer
93. The Government of Zimbabwe. The Regional Town and Country Planning Act
Chapter 29:12. Harare: Government Printer
94. Nyanga Declaration on Urban and Peri-Urban Agriculture in Zimbabwe. June
2002. Nyanga: MDPESA; 2002.
95. The Harare Declaration on Urban Agriculture in Eastern and Southern Africa.
August 2003. Harare: MDPESA/Government of Zimbabwe; 2003.
96. Mangizvo RV, Kapungu Never. Urban domestic water crisis in Zimbabwe: The
Case of Kadoma City. Journal of Sustainable Development in Africa, 2012; 12
(8). p254-263.
97. Mubvami T, Toriro P. Water supply and urban agriculture in Bulawayo. Urban
Agriculture Magazine,2008; 10. p31-32.
Stellenbosch University https://scholar.sun.ac.za
122
98. Nhapi I, Hoko Z. A cleaner production approach to urban water management:
potential for application in Harare, Zimbabwe. Physics and Chemistry of the
Earth, 2004; 29. p1281-1289.
99. Madungwe E, Sakuringwa S. Greywater Reuse: A strategy for water demand
management in Harare. Physics and Chemistry of the Earth, 2007; 32. p1231-
1236.
100. Coates. J, Swindale. A, Bilinsky. P. Household food insecurity access scale
(hfias) for measurement of household food access: indicator guide (v. 3).
Washington, D.C: FANTA; 2007.
101. Swindale. A, Bilinsky. P. Household dietary diversity score (hdds) for
measurement of household food access: Indicator Guide (v.2). Washington,
D.C: FANTA; 2006.
102. Andrew L, Thorne L, Valpiani N, et al. Household dietary diversity and food
expenditures are closely linked in rural Bangladesh, increasing the risk of
malnutrition due to the financial crisis. Journal of Nutrition 2009; 140(1) 182S-
188S.
103. Ruel, Marie. Is dietary diversity an indicator of food security or dietary quality:
a review of measurement issues and research needs discussion paper 140,
.IFPRI FCND; 2002. Available at:
http://ageconsearch.umn.edu/bitstream/16386/1/fc030140.pdf. [Accessed 17
March 2012]
104. Food and Agriculture Organisation. Guidelines for Measuring Household and
Individual Dietary Diversity. Rome: FAO; 2007 [
105. Webb N. Urban cultivation: Food crops and their importance. Development
Southern Africa 1998; 15(2):201-213.
Stellenbosch University https://scholar.sun.ac.za

123
106. Hovorka AJ. The reproduction of gendered positionality in Botswana’s
commercial urban agricultural sector. Annals of the Association of American
Geographers 2005; 95(2):294-313.
107. Kenny L. Rural-urban interaction in the developing world. In: Binns T editor.
Routledge Perspectives on Development. 2005. [Online]. Available at:
http://samples.sainsburysebooks.co.uk/9781134513987_sample_535421.pdf.
[Accessed 31 October 2015]
108. Zimbabwe: multiple indicator monitoring survey (MIMS) 2009: Report.
Government of Zimbabwe-UNICEF. 2009. Available from: Zimbabwe National
Statistics Agency (ZIMSTAT).
109. Crush J, Drimie S, Frayne B et al. The hiv and urban food security nexus in
Africa. Food Sec, 2011; 3. p 347-362
110. Gonzalez Novo M, Murphy C. Urban agriculture in the city of havana: a
popular response to a crisis. In: Bakker N, Dubbeling M, Gundel S, Sabel
Koschella U, De Zeeuw H, editors. Growing cities, growing food: urban
agriculture on the policy agenda. a reader on urban agriculture. Feldafing:
DSE/ETC; 2000; p 329-347.
111. Dubbeling M, Caton Campbell M, Hoekstra F, Van Veehuizen R. Editorial:
building resilient cities. Urban Agriculture Magazine 22; p 3-11.
112. Cabannes Y. Chapter 4: Financing and investment for urban agriculture. In:
Van Veehuizen R, editor. Cities farming for the future: urban agriculture for
green and productive cities. RUAF/IDRC/IIRR; 2006. p 87-123.
113. Cabannes Y. Financing urban agriculture: current challenges and innovations.
Urban Agriculture Magazine, 2011; 25. p 32-34.
114. Kutiwa S, Boon E, Devuyst D. Urban agriculture in low income households of
harare; an adaptive response to economic crisis. J. Hum. Ecol, 2010. 32(2).
p.85-96.
Stellenbosch University https://scholar.sun.ac.za
124
115. Mbiba B. City Case Study; Urban agriculture in harare between suspicion and
repression. Env and Urb, 1994. 6(1). p. 188-202.
116. Hellen Keller International. Homestead food production model contributes to
improved household food security, nutrition and female empowerment –
Experience from scaling-up programs in Asia (Bangladesh, Cambodia, Nepal
and Philippines). Nut Bul, 2010. 8(1). p. 1-8.
117. Circular No70 of 2004. Department of physical planning. Mukwati Building.
Harare: Government Printer.
118. De Bon H, Parrot L, Moustier P. Sustainable urban agriculture in developing
countries. A review. Agronomy for Sustainable Development 2010; 30(1):21-
32.
119. Food and Agriculture Organisation. Agriculture and cities: Challenges of food
and nutrition security, agriculture and ecosystem management in an
urbanizing world. Rome: FAO; 2011.
120. Cruz Caridad M, Medina Sanchez R. Agriculture in the city: A key to
sustainability in Havana, Cuba. Kingston: IDRC; 2003.
121. Potutan GE, Schnitzler WH, Arnado JM, Janubas LG, Holmer RJ. Urban
agriculture in Cagayan de Oro: A favourable response of city, government and
NGOs. In: Bakker N, Dubbeling M, Koschella US, Gundel S, De Zeeuw H
editors. Growing cities, growing food, urban agriculture on the policy agenda.
Feldafing: DSE; 2000. p 413-428.
122. Purnomohadi N. Jakarta: Urban agriculture as an alternative strategy to face
the economic crisis. In: Bakker N, Dubbeling M, Koschella US, Gundel S, De
Zeeuw H editors. Growing cities, growing food, urban agriculture on the policy
agenda. Feldafing: DSE; 2000. p 452-466.
Stellenbosch University https://scholar.sun.ac.za
125
123. Martellozzo F, Landry J S, Plouffe D et al. Urban agriculture: A global analysis
of the space constraint to meet urban vegetable demand. Environmental
Research Letters 2014;9(6):8.
124. Hillbruner C, Egan R. Seasonality, household food security and nutritional
status in Dinajpur, Bangladesh. Food and Nutrition Bulletin 2008; 29(3):221-
231.
125. Frayne B, McCordic C, Shimboleleni H. Growing out of poverty: Does urban
agriculture contribute to household food security in Southern African Cities?
Urban Forum 2014; 25:177-189.
126. Warren E, Hawkesworth S, Knai C. Investigating the association between
urban agriculture and food security, dietary diversity and nutritional status: A
systematic literature review. Food Policy 2015; 53:54-66.
127. Olivier DW. The physical and social benefits of urban agriculture projects run
by non-governmental organisations in Cape Town. Cape towm: University of
Stellenbosch; 2015. [unpublished thesis]
128. Grewal P. Urban agriculture III: Effects of UA; Agriculture in an Urbanizing
Society. AICARE. [Online]. Available at:
http://www.agricultureinanurbanizingsociety.com/?p=647. [Accessed 18
February 2016].
129. Tawodzera G. Rural-urban transfers and household food security in Harare’s
crisis context. J. Food. Nutr, Disor 2013; 2(5).
130. Moyo P. Urban agriculture and poverty mitigation in Zimbabwe: Prospects and
obstacles in Bulawayo townships. J. Hum. Ecol 2013; 42(2):125-133.
131. Von Grebmer K, Saltzman A, Birol E, Wiesmann D, et al. The Global Hunger
Index 2014: The challenge of hidden hunger. Bonn: Welthungerhilfe; 2014.
Stellenbosch University https://scholar.sun.ac.za

126
132. Percival R. The importance of dietary diversity. Live Well for Live [Online]
2014 Available at: http://livewellforlife.eu/blogs/the-importance-of-food-
diversity. [Accessed 11 October 2015]
133. Economic Commission for Africa. Land tenure systems and their impacts on
food security and sustainable development in Africa. Addis Ababa: ECA;
2004.
134. Egyir S, Cofie OO, Dubbeling M. Chapter 12: Options for financing urban
agriculture. In: Dreschel P, Keraita B editors. Irrigated urban vegetable
production in Ghana, characteristics, benefits and risk mitigation. Colombo:
International Water Management Institute; 2014.pp145-161.
135. Russo T, Alfredo K, Fisher J. Sustainable water management in urban,
agricultural and natural systems. Water 2014; 6: 3934-3956.
136. Nalasco J. Sustainable water management for urban agriculture: Planting
justice, Oakland: Pacific Institute; 2011 Available at: http://pacinst.org/wp-
content/uploads/2013/02/sustainable_water_management_for_urban_agricult
ure3.pdf. [Accessed 12 August 2015].
137. Mechlem K, Muehlhoff E, Simmersbach F. The Voluntary Guidelines, Brief 5:
Nutrition, Food Safety and Consumer Protection. Rome: FAO; 2005.
138. Monyau M, Bandara A. African economic outlook: Zimbabwe 2015. Harare:
AfDB; 2015. Available at:
http://www.africaneconomicoutlook.org/fileadmin/uploads/aeo/2015/CN_data/
CN_Long_EN/Zimbabwe_GB_2015.pdf. [Accessed 12 August 2015].
139. Hoddinott J, Yohannes Y. Dietary diversity as a food security. Food and
nutrition technical assistance project. Academy for Educational Development.
Washington D.C: FANTA; 2002.
Stellenbosch University https://scholar.sun.ac.za

127
140. Poulsen. MN, McNab PR, Clayton ML, Neff RA. A systematic review of urban
agriculture and food security impacts in low-income countries. Food Policy
2015; 55:131-146.
141. Webb NL, Kasumba H. Urban agriculture in Ezibeleni (Queenstown):
Contributing to the empirical base in the Eastern Cape. Africanus 2009; 39(1):
27-39.
142. Rogerson CM. Urban agriculture and public administration: institutional
context and local response in Gauteng. Urban Forum 2011; 22:183-198.
143. Nell W, Wessels B, Mokoka J, Machedi S. A creative multidisciplinary
approach towards the development of food gardening. Development Southern
Africa 2000; 17(5):807-819.
144. City of Harare. Health Districts of Harare. Harare 2011. [unpublished].
Stellenbosch University https://scholar.sun.ac.za
Related Documents