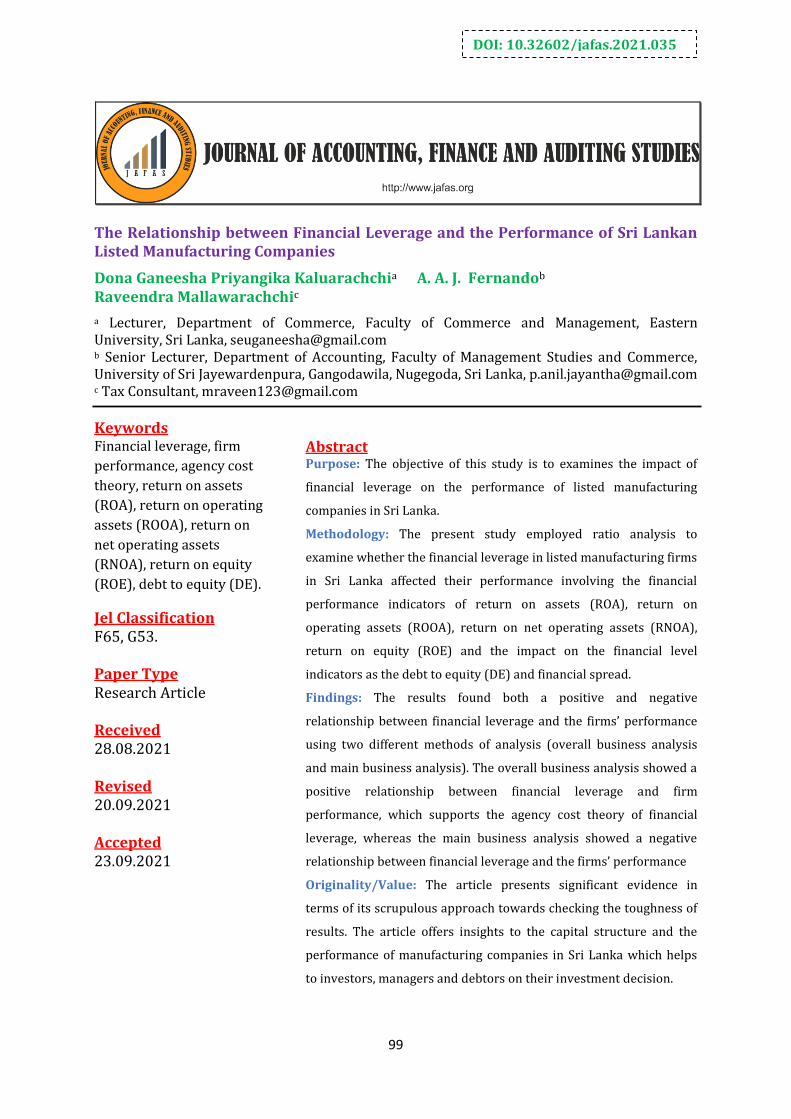
99 The Relationship between Financial Leverage and the Performance of Sri Lankan Listed Manufacturing Companies Dona Ganeesha Priyangika Kaluarachchi a A. A. J. Fernando b Raveendra Mallawarachchi c a Lecturer, Department of Commerce, Faculty of Commerce and Management, Eastern University, Sri Lanka, [email protected] b Senior Lecturer, Department of Accounting, Faculty of Management Studies and Commerce, University of Sri Jayewardenpura, Gangodawila, Nugegoda, Sri Lanka, [email protected] c Tax Consultant, [email protected] Keywords Financial leverage, firm performance, agency cost theory, return on assets (ROA), return on operating assets (ROOA), return on net operating assets (RNOA), return on equity (ROE), debt to equity (DE). Jel Classification F65, G53. Paper Type Research Article Received 28.08.2021 Revised 20.09.2021 Accepted 23.09.2021 Abstract Purpose: The objective of this study is to examines the impact of financial leverage on the performance of listed manufacturing companies in Sri Lanka. Methodology: The present study employed ratio analysis to examine whether the financial leverage in listed manufacturing firms in Sri Lanka affected their performance involving the financial performance indicators of return on assets (ROA), return on operating assets (ROOA), return on net operating assets (RNOA), return on equity (ROE) and the impact on the financial level indicators as the debt to equity (DE) and financial spread. Findings: The results found both a positive and negative relationship between financial leverage and the firms’ performance using two different methods of analysis (overall business analysis and main business analysis). The overall business analysis showed a positive relationship between financial leverage and firm performance, which supports the agency cost theory of financial leverage, whereas the main business analysis showed a negative relationship between financial leverage and the firms’ performance Originality/Value: The article presents significant evidence in terms of its scrupulous approach towards checking the toughness of results. The article offers insights to the capital structure and the performance of manufacturing companies in Sri Lanka which helps to investors, managers and debtors on their investment decision. DOI: 10.32602/jafas.2021.035

Welcome message from author
This document is posted to help you gain knowledge. Please leave a comment to let me know what you think about it! Share it to your friends and learn new things together.
Transcript
99
The Relationship between Financial Leverage and the Performance of Sri Lankan Listed Manufacturing Companies
Dona Ganeesha Priyangika Kaluarachchia A. A. J. Fernandob
Raveendra Mallawarachchic
a Lecturer, Department of Commerce, Faculty of Commerce and Management, Eastern University, Sri Lanka, [email protected] b Senior Lecturer, Department of Accounting, Faculty of Management Studies and Commerce, University of Sri Jayewardenpura, Gangodawila, Nugegoda, Sri Lanka, [email protected] c Tax Consultant, [email protected]
Keywords Financial leverage, firm
performance, agency cost
theory, return on assets
(ROA), return on operating
assets (ROOA), return on
net operating assets
(RNOA), return on equity
(ROE), debt to equity (DE).
Jel Classification F65, G53. Paper Type Research Article Received 28.08.2021 Revised 20.09.2021 Accepted 23.09.2021
Abstract Purpose: The objective of this study is to examines the impact of
financial leverage on the performance of listed manufacturing
companies in Sri Lanka.
Methodology: The present study employed ratio analysis to
examine whether the financial leverage in listed manufacturing firms
in Sri Lanka affected their performance involving the financial
performance indicators of return on assets (ROA), return on
operating assets (ROOA), return on net operating assets (RNOA),
return on equity (ROE) and the impact on the financial level
indicators as the debt to equity (DE) and financial spread.
Findings: The results found both a positive and negative
relationship between financial leverage and the firms’ performance
using two different methods of analysis (overall business analysis
and main business analysis). The overall business analysis showed a
positive relationship between financial leverage and firm
performance, which supports the agency cost theory of financial
leverage, whereas the main business analysis showed a negative
relationship between financial leverage and the firms’ performance
Originality/Value: The article presents significant evidence in
terms of its scrupulous approach towards checking the toughness of
results. The article offers insights to the capital structure and the
performance of manufacturing companies in Sri Lanka which helps
to investors, managers and debtors on their investment decision.
DOI: 10.32602/jafas.2021.035
Journal of Accounting, Finance and Auditing Studies 7/4 (2021): 99-118
100
Introduction
Financial leverage gives value to the organization because of the interest tax shield
offered with corporate tax by most governments. Organizations need to evaluate the
amount of debt capital they require by examining their needs and the financial
market. To achieve this, they can decide on the appropriate capital structure policy
on the basis of the financial instruments available in the financial market. The use of
financial leverage varies according to the functions of business activities. The
evaluation of the capital market structure is important for the success of the
organizational process. However, borrowing incurs interest expense and risk, it can
also yield rewards. Even debt capital indicates the risk due to interest and
unexpected bankruptcy and helps to increase organisations’ routine business
activities. Therefore, an examination of the capacity for leverage in an organization is
important for the sustainability and success of its organizational activities.
The debt capital structure decisions of an organization depend mainly on its
company policy. Some organizations are interested in both equity capital and debt
capital, while some are highly interested in the former and not so much the latter,
and vice versa. Company policy on capital structure can be affected by market
conditions and the capacity of the company. Therefore, the percentage of debt capital
and equity capital in the capital structure is essential for the progress of business
operations and the sustainability of the business process.
Capital structure in an organization depends on the nature of the industry. If new
firms can enter the industry without barriers, then the profit margins of existing
firms in the industry could be badly affected. Therefore, the firms will find risky
securities on their investments in business operations. Thus, the stability of cash flow
in an organization will affect its capital structure. If an organization’s cash flow is
relatively stable, there may be no difficulties in covering the organization’s fixed
assets obligations. Therefore, many organizations that have stable cash flows can
make use of the benefit of using leverage on their business operations. The sources
of financing used by organizations can be affected by the maturity structure of the
assets of the organization. It follows that, if the organization has a higher amount of
Journal of Accounting, Finance and Auditing Studies 7/4 (2021): 99-118
101
long-term assets in their business operations, then the firm will have to have more
long-term debt.
It has been argued that equity capital should be increased in a company (Leon, 2013)
because the higher leverage can help to increase the financial performance measures.
However, some organizations have been afraid to receive debt capital due to the risk
of debt and, therefore, have had zero leverage in their organizations. Lee and Moon
(2011) found that after adjusting for the Fama-French and Carhart factors, debt-free
organizations had a tendency to have higher performances in the long-term, which
suggests that to maintain a zero-leverage policy in an organization, it is necessary to
gain equity returns.
A considerable portion of companies in developed countries have preferred zero
leverage while having equity capital in their capital structure (Ghose and Kabra,
2016), and have obtained certain benefits in being zero leveraged. These
organizations have studied the benefits of zero leverage before preparing the
documents that contain the capital structure of the organization. While some
organizations have preferred zero leverage, there are some who need debt for their
business operations. Therefore, organizations need to estimate the optimal level of
company debt and maintain control over their debt capital. However, agency theory
suggests that the choices of capital structure in an organization helps to reduce the
agency cost (Berger and Patti, 2006). Accordingly, the agency cost hypothesis
proposes that high a level of leverage in an organization reduces the agency cost of
outside equity and increases the firm’s value (Berger and Patti, 2006; Jensen and
Meckling, 1976)
Previous studies have shown evidence of the impact of leverage on many disciplines,
such as, the relationship between leverage and firm growth (Lang et al., 1996),
relationship between leverage and firm investment (Aivazian et al., 2005; Myers,
1977), financial leverage among competitive companies (Yang et al., 2019), leverage
and market competition (Seo, 2018), financial leverage and customer satisfaction
(Malshe and Agarwal (2015), zero leverage (Devos et al., 2012; Lee and Moon, 2011;
Journal of Accounting, Finance and Auditing Studies 7/4 (2021): 99-118
102
Morais et al., (2019), and leverage and firm performances (Arafat et al., 2013; Berger
and Patti, 2006; Fosu, 2013; Seo, 2018) in different regions.
Despite a number of studies have shown evidence of a positive and negative
relationship between financial leverage and firm performance for different regimes,
there has been no agreement to date on this question. It is worth noting that studies
have found a lack of evidence for the relationship between financial leverage and
firm performance in the Sri Lankan capital market. The present study helps to
provide additional evidence to the existing literature and for the investors in Sri
Lanka in order to identify over- and underleveraged firms in the market. Hence, the
objective of this study was to assess the impact of elements of financial leverage on
firms’ performances with respect to the following research question: how has
leverage contributed to the performance of manufacturing companies in Sri Lanka.
Studying manufacturing companies may make a significant evidence to the investors
since manufacturing represents the growth of the country (Aivazian et al., 2005).
Accordingly, this paper extends previous analyses by using ratio analysis derived
from the reformulated financial statements among the manufacturing firms in Sri
Lanka to examine the relationship between financial leverage and firm performance,
and to provide evidence to existing literature through Sri Lankan market.
Literature Review
It is difficult to find a universal theory for capital structure since there is no value
reason to decide the debt and equity level in a firm; however, previous studies that
have investigated firm debt that have included trade-off theory (Myers, 2001), free
cash flow theory (Aivazian et al., 2005) and agency cost theory (Aivazian et al., 2005;
Berger and Patti, 2006; Myers, 2001). Among these, agency cost theory has been one
of the most popular among researchers who have used it to identify the debt impact
in a firm (Aivazian et. al., 2005; Arafat et al., 2013; Berger & Patti 2006; Myers, 2001).
Agency cost theory proposes that a high level of leverage reduces the agency cost
while increasing a firm’s performance, (Aivazian et al., 2005; Berger and Patti, 2006;
Journal of Accounting, Finance and Auditing Studies 7/4 (2021): 99-118
103
Jensen and Mackling 1976). Agency cost is reduced through higher leverage because
of the pressure from generating cash inflow (Jensen, 1986). Furthermore, leverage
can reduce the conflict of interest between managers and shareholders when it is
used to make investment decisions (Myers, 1977). The literature has revealed a
positive relationship between firm leverage and firm performance with the
assumption of agency cost theory (Berger and Patti, 2006; Fosu, 2013) in different
countries, and the present study examined the relationship between firm leverage
and firm performance using agency cost theory.
Stakeholders often consider a company’s debt ratios when they make investment
decisions. This is because a higher debt equity ratio is an indication of the higher
amount of leverage in an organization. Thus, Safieddine and Titman (1999, p. 548)
stated that the “leverage increases appear to be part of the targets' defensive
strategies”. They believed that the when the leverage increases in a firm there is a
higher probability of a decrease in its performance. Therefore, companies must be
careful when deciding on the amount of leverage they take since it is controversial to
make the decision based on financial leverage.
One study has noted that zero leverage is good in the initial stage of a business
(Devos et al., 2012), while explaining that zero-leverage firms are risk-free, including
the disadvantage of a higher tax return and less likelihood of building up their
reputation. Most of the traditional and self-disciplined companies have preferred
zero leverage while considering low over-investment because they have liked to
away from borrowing. Eventually, they have preferred huge investments which make
more profit in order to match their debt capital. Therefore, the management
decisions in firms have supported the maintenance of zero leverage while expecting
high performance in the long-term (Lee and Moon, 2011).
Furthermore, Morais et al., (2019) discussed the external and internal factors which
can cause zero leverage and found that it was influenced by the financial system and
macro-economic conditions of a country. However, the financial structure of an
organization can impacts on the success of its business operations. Furthermore,
Journal of Accounting, Finance and Auditing Studies 7/4 (2021): 99-118
104
Gonzalez (2012) discussed in his results that the financial structure can influence the
relationship between leverage and firm operating performance in an organization.
Moreover, it is very important to a company to be listed in the market, which as this
makes it easier for them to acquire debt financing (Schoubben and Hulle, 2011).
Furthermore, it is much vulnerable for all listed firms to consider the factors that
influence them when they decide the level of debt. Weill (2007) discussed
institutional factors that may influence the relationship between leverage and
performance; one such factor is a firm’s access to bank credit. This is because firms
facing difficulties in accessing credit. It defines access to banking credit as the ratio
between the claims of deposit banks in the private sector and the gross domestic
production. Eventually the access to bank credit, and the powers of the legal system
will also influence the relationship between leverage and performance. Moreover, the
principal amount and interest payments on a business loan, which are classified as
business expenses, thus, can be deducted from company income taxes. With the
payback of the debt obtained, organizations have to pay interest, sometimes at a high
interest rate. With this payment of high interest and debt, organizations may face
financial distress due to higher expenses. As a result, if the organizations are poor in
their business operations, they may face higher financial distress.
Other than internal factors which may affect firm leverage and firm performance,
other external factors also need to be considered. Ghosh (2008) explained that
weaknesses in macroeconomic policies and financial market frictions can lead to
higher instability in the operating activities in emerging markets compared to those
in mature markets. Morais et al. (2019) also supported the evidence that macro-
economic factors can have significant influence on firm leverage. Furthermore,
Kizildag and Ozdemir (2017) argued that firm-specific factors can have a significant
influence on a firm’s short-term leverage, and that macroeconomic indicators are the
most influential factors in the long-term leverage in a firm. This also makes financial
contracting complicated and can limit the available sources of funding for local firms.
Finally, the firm should consider the entire external environment, such as the
Journal of Accounting, Finance and Auditing Studies 7/4 (2021): 99-118
105
political situation (Gonzalez, 2012), economic conditions and socio-cultural
tendencies, before using debt financing for the organization (Hussan, 2016).
As one reason for growth of organizational performance, higher debt capital can
cause financial distress and bankruptcy due to the large interest payments. Because if
firms more reliable on debt can cause higher cash outflow as interest payment and
with the unconcern market condition this can cause bankruptcy (Malshe and
Agarwal, 2015). Financial distress can become more important than the disciplinary
role of debt because firms with more debt may have greater operating difficulties
(Gonzalez, 2012). Ghosh (2008) pointed out that one weakness of organizations is
finding equity financing for their organization. Therefore, when the company faces
difficulties in finding equity financing, it is likely to moves to debt financing.
Consequently, such a company takes loans beyond its debt limit, it may face
bankruptcy. Furthermore, Weill (2007) explained that public policy can show a
significant relationship with firm performance because policy implications that
promote equity can help firms to be financed. Singha and Faircloth (2005) suggested
that higher leverage can influence lower long-term capital investments, which can
cause low corporate performance in the future. The findings of their study supported
the evidence (Gonzalez, 2012; Leon, 2013) of significant and negative correlations
between leverage and the future growth rate in earnings per share, between leverage
and future growth opportunities, and between leverage and net profit margins.
On the other hand, Ghosh (2008) found that the organizations with a low leverage
ratio can lead to a low cost of foreign borrowing, which can cause a sudden failure in
investor confidence. Furthermore, some studies have found a positive relationship
between financial leverage and firm performance (Al-Duais, 2016; Fosu, 2013;
Gonzalez, 2012; Weill, 2007). Al-Duais (2016) found a positive relationship between
financial leverage and corporate performance. Al-Duais (2016) also confirmed that
companies can manage and finance various operations in the long- and short-term
using a mixture of both long- and short-term debt.
Journal of Accounting, Finance and Auditing Studies 7/4 (2021): 99-118
106
Determining the capital structure mix in order to improve a firm’s performance has
been a contentious topic in the financial literature. A number of studies have
investigated the relationship between firm leverage and firm performance, and have
also discussed the positive, negative and null relationships that can exist between
these variables. For the companies registered on the Colombo Stock Market, the
research has shown an inverse relationship between firm leverage and firm
performance. Therefore, investigating the impact of firm leverage on firm
performance is significant for sound organizational success.
Research Methodology
This study used regression analysis to test the agency cost hypothesis that a higher
leverage decreases the agency cost with the association of improvement in firms’
performances. The literature employees’ different approaches to measure the firm’s
performance with the prediction of agency cost hypothesis.
Previous researchers have identified different variables to examine the impact of
financial leverage on firm performance. Most of these studies have employed return
on assets (Arafat et al., 2013; Aruna and Warokka, 2013), return on equity (Arafat et
al., 2013; Berger and Patti, 2006), and return on operating assets (Gonzalez, 2012) to
describe the firms’ performance, and debt to equity (Aivazian et al, 2005; Arafat et al.,
2013; Aruna and Warokka, 2013) to examine financial leverage. The present study
extended these variables by adding return on net operating assets to the model as a
firm performance indicator.
This study used a different approach to measure financial leverage. The degree of
financial leverage and financial spread were used to measure the impact of financial
leverage in the analysis. The analysis aimed to identify the components of the degree
of financial leverage and spread that changed the financial leverage impact in the
business. The regression analysis was used to identify the decomposition of the
financial leverage impact for the purpose of organizational decision-making. Firms’
performance indicators were explained using financial ratios which explain the
Journal of Accounting, Finance and Auditing Studies 7/4 (2021): 99-118
107
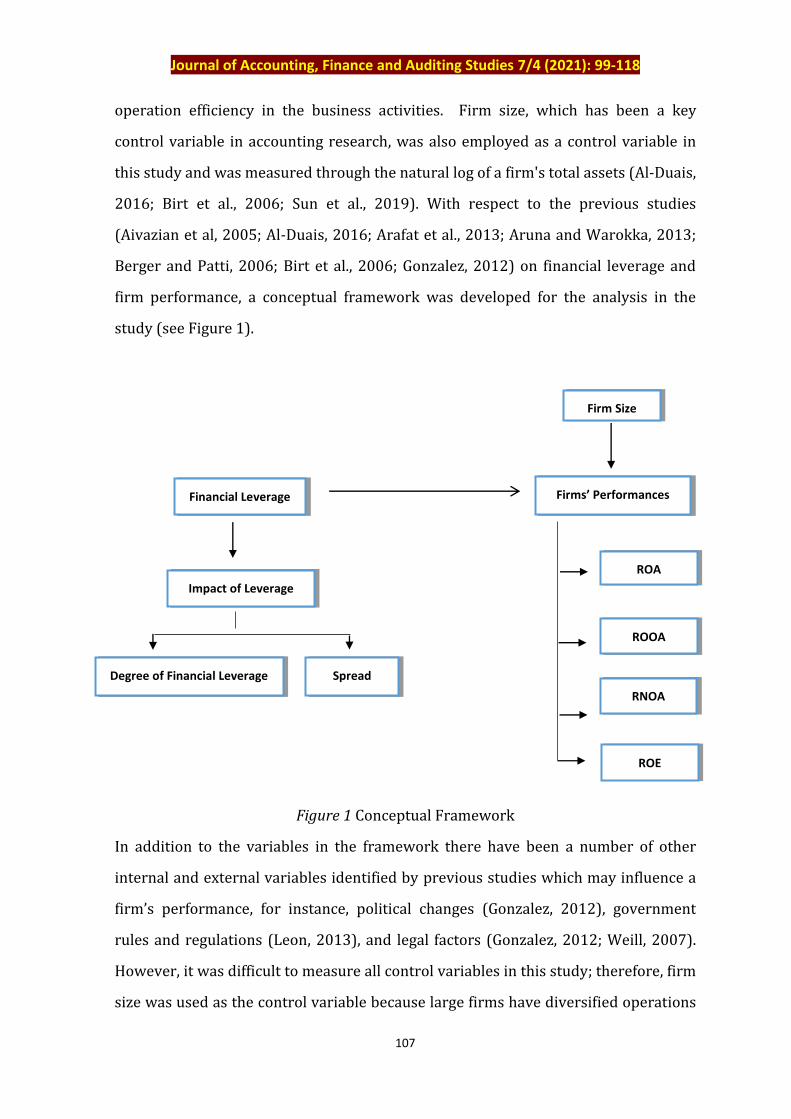
operation efficiency in the business activities. Firm size, which has been a key
control variable in accounting research, was also employed as a control variable in
this study and was measured through the natural log of a firm's total assets (Al-Duais,
2016; Birt et al., 2006; Sun et al., 2019). With respect to the previous studies
(Aivazian et al, 2005; Al-Duais, 2016; Arafat et al., 2013; Aruna and Warokka, 2013;
Berger and Patti, 2006; Birt et al., 2006; Gonzalez, 2012) on financial leverage and
firm performance, a conceptual framework was developed for the analysis in the
study (see Figure 1).
Figure 1 Conceptual Framework
In addition to the variables in the framework there have been a number of other
internal and external variables identified by previous studies which may influence a
firm’s performance, for instance, political changes (Gonzalez, 2012), government
rules and regulations (Leon, 2013), and legal factors (Gonzalez, 2012; Weill, 2007).
However, it was difficult to measure all control variables in this study; therefore, firm
size was used as the control variable because large firms have diversified operations
Financial Leverage
Impact of Leverage
Degree of Financial Leverage
Spread
Firms’ Performances
ROA
ROE
Firm Size
RNOA
ROOA
Journal of Accounting, Finance and Auditing Studies 7/4 (2021): 99-118
108
activities and business operations that are specifically controlled by managers (Frank
and Goyal, 2003).
Research Hypothesis
According to the agency cost theory, a positive relationship between financial
leverage and firm performance is expected (Berger and Patti, 2006; Jensen and
Meckling, 1976; Myers, 2001). However, in some cases a negative relationship has
also been found as a result of the significant financial limitation of high debt (Berger
and Patti, 2006). The present study assumed that there was a positive relationship
between financial leverage and firm performances in the use of the regression model.
Accordingly, the following hypothesis was formed:
H1: There is a significant relationship between financial leverage and
firms’ performances:
H1a: There is a significant positive relationship between
financial leverage and return on assets
H1b: There is a significant positive relationship between
financial leverage and return on operating assets
H1c: There is a significant positive relationship between
financial leverage and return on net operating assets
H1d: There is a significant positive relationship between
financial leverage and return on equity
The regression models showed the impact of financial leverage on return on assets,
return on operating assets, return on net operating assets and return on equity of the
listed manufacturing companies in Sri Lanka according to the overall business
operation analysis using publicly available accounting information based on
published financial statements in each listed companies in Colombo Stock Exchange
(CSE). The main business operation analysis was based on reformulated financial
Journal of Accounting, Finance and Auditing Studies 7/4 (2021): 99-118
109
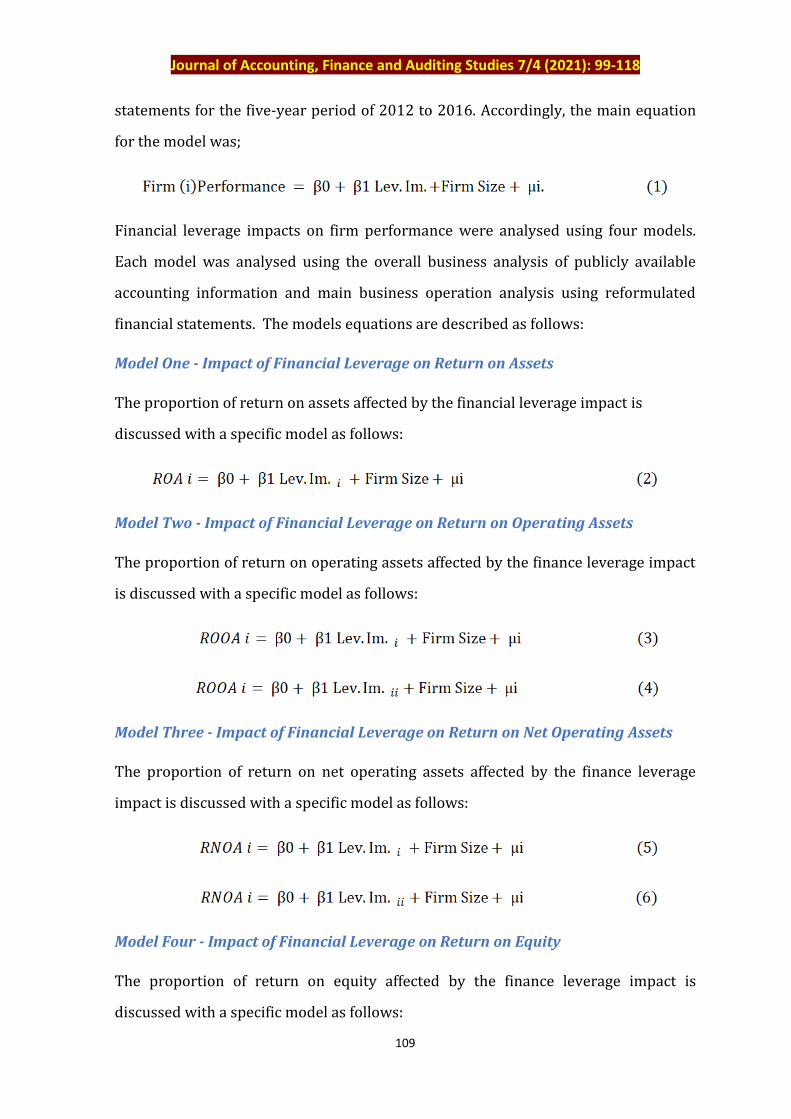
statements for the five-year period of 2012 to 2016. Accordingly, the main equation
for the model was;
Financial leverage impacts on firm performance were analysed using four models.
Each model was analysed using the overall business analysis of publicly available
accounting information and main business operation analysis using reformulated
financial statements. The models equations are described as follows:
Model One - Impact of Financial Leverage on Return on Assets
The proportion of return on assets affected by the financial leverage impact is
discussed with a specific model as follows:
Model Two - Impact of Financial Leverage on Return on Operating Assets
The proportion of return on operating assets affected by the finance leverage impact
is discussed with a specific model as follows:
Model Three - Impact of Financial Leverage on Return on Net Operating Assets
The proportion of return on net operating assets affected by the finance leverage
impact is discussed with a specific model as follows:
Model Four - Impact of Financial Leverage on Return on Equity
The proportion of return on equity affected by the finance leverage impact is
discussed with a specific model as follows:
Journal of Accounting, Finance and Auditing Studies 7/4 (2021): 99-118
110
Where;
i = firm
ROA i = return on assets in firm i
ROOA i = return on operating assets in firm i
RNOA i = return on net operating assets in firm i
ROE i = return on equity in firm i
Lev.Im. i = impact of financial leverage (overall business operation analysis)
Lev.Im. ii = impact of financial leverage (main business operation analysis)
µi = the error term
Research Sample
The study sample consisted of the manufacturing sector in Sri Lanka involving total
32 firms which were listed companies on the Colombo Stock Exchange (CSE) among
20 sectors in the CSE. The manufacturing companies were selected based on their
business activities; because manufacturing companies were less likely to be affected
by the regulations when compared to financial firms (Aivazian et al., 2005). The data
was obtained from the financial statements disclosed by the manufacturing
companies annually for the five-year period from 2012 to 2016.
Data Presentation
The data analysis used Pearson correlations and regression analysis to identify the
correlations and impact among the financial leverage indicators and also to examine
the impact of financial leverage on firms’ performances.
Journal of Accounting, Finance and Auditing Studies 7/4 (2021): 99-118
111
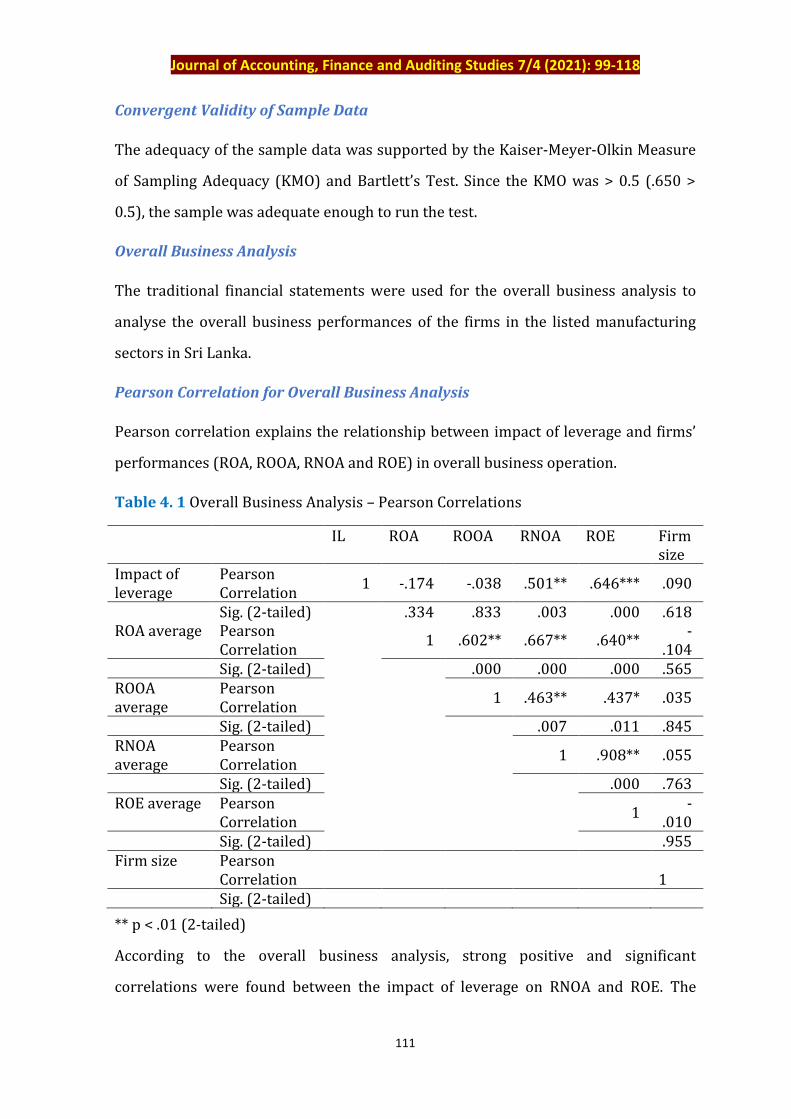
Convergent Validity of Sample Data
The adequacy of the sample data was supported by the Kaiser-Meyer-Olkin Measure
of Sampling Adequacy (KMO) and Bartlett’s Test. Since the KMO was > 0.5 (.650 >
0.5), the sample was adequate enough to run the test.
Overall Business Analysis
The traditional financial statements were used for the overall business analysis to
analyse the overall business performances of the firms in the listed manufacturing
sectors in Sri Lanka.
Pearson Correlation for Overall Business Analysis
Pearson correlation explains the relationship between impact of leverage and firms’
performances (ROA, ROOA, RNOA and ROE) in overall business operation.
Table 4. 1 Overall Business Analysis – Pearson Correlations
IL ROA ROOA RNOA ROE Firm size
Impact of leverage
Pearson Correlation
1 -.174 -.038 .501** .646*** .090
Sig. (2-tailed)
.334 .833 .003 .000 .618 ROA average Pearson
Correlation 1 .602** .667** .640**
-.104
Sig. (2-tailed)
.000 .000 .000 .565 ROOA average
Pearson Correlation
1 .463** .437* .035
Sig. (2-tailed)
.007 .011 .845 RNOA average
Pearson Correlation
1 .908** .055
Sig. (2-tailed)
.000 .763 ROE average Pearson
Correlation 1
-.010
Sig. (2-tailed) .955 Firm size Pearson
Correlation
1 Sig. (2-tailed)
** p < .01 (2-tailed)
According to the overall business analysis, strong positive and significant
correlations were found between the impact of leverage on RNOA and ROE. The
Journal of Accounting, Finance and Auditing Studies 7/4 (2021): 99-118
112
correlations between ROA, ROOA and leverage impact were non-significant.
Similarly, the correlation between firm size and financial leverage impact was non-
significant (see Table 4.1).
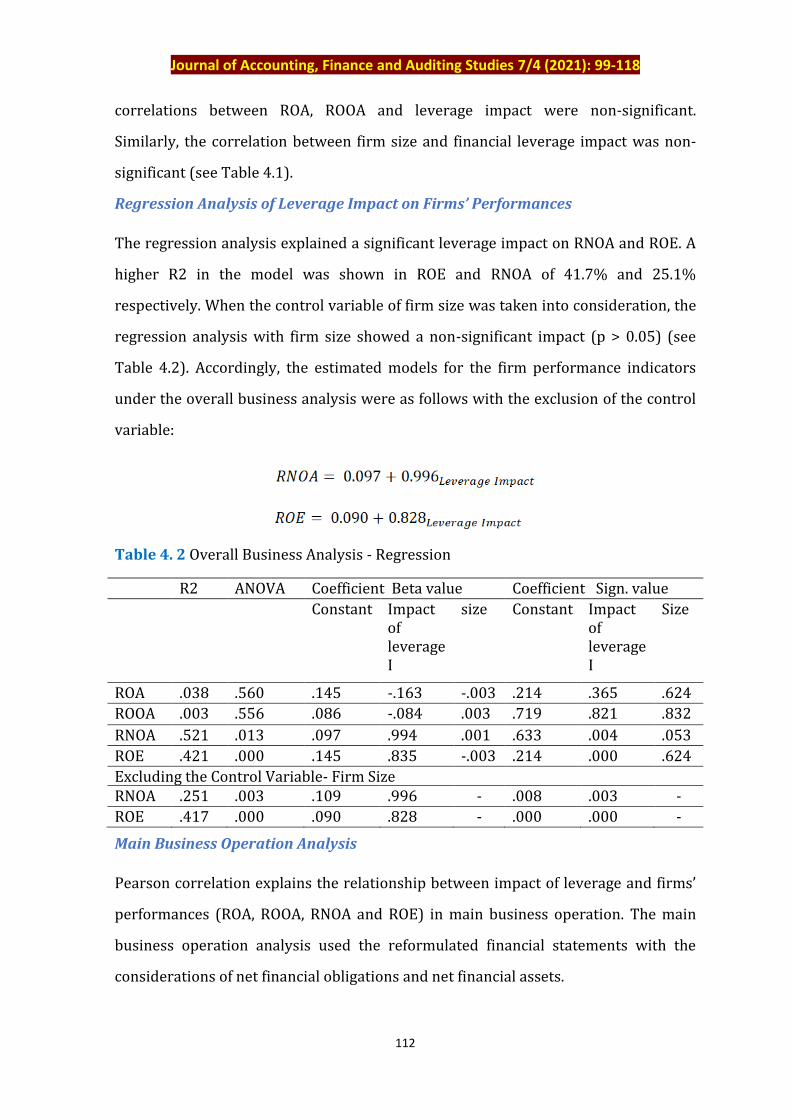
Regression Analysis of Leverage Impact on Firms’ Performances
The regression analysis explained a significant leverage impact on RNOA and ROE. A
higher R2 in the model was shown in ROE and RNOA of 41.7% and 25.1%
respectively. When the control variable of firm size was taken into consideration, the
regression analysis with firm size showed a non-significant impact (p > 0.05) (see
Table 4.2). Accordingly, the estimated models for the firm performance indicators
under the overall business analysis were as follows with the exclusion of the control
variable:
Table 4. 2 Overall Business Analysis - Regression
R2 ANOVA Coefficient Beta value Coefficient Sign. value
Constant Impact of leverage I
size Constant Impact of leverage I
Size
ROA .038 .560 .145 -.163 -.003 .214 .365 .624
ROOA .003 .556 .086 -.084 .003 .719 .821 .832
RNOA .521 .013 .097 .994 .001 .633 .004 .053
ROE .421 .000 .145 .835 -.003 .214 .000 .624
Excluding the Control Variable- Firm Size RNOA .251 .003 .109 .996 - .008 .003 -
ROE .417 .000 .090 .828 - .000 .000 -
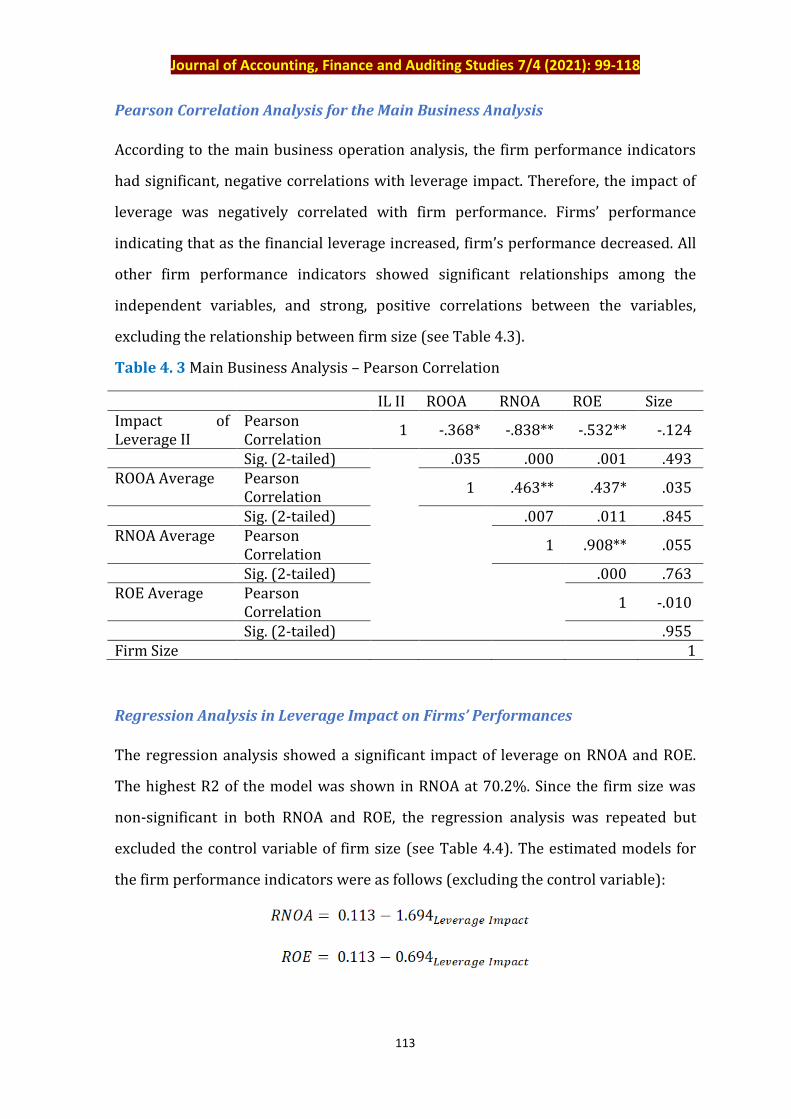
Main Business Operation Analysis
Pearson correlation explains the relationship between impact of leverage and firms’
performances (ROA, ROOA, RNOA and ROE) in main business operation. The main
business operation analysis used the reformulated financial statements with the
considerations of net financial obligations and net financial assets.
Journal of Accounting, Finance and Auditing Studies 7/4 (2021): 99-118
113
Pearson Correlation Analysis for the Main Business Analysis
According to the main business operation analysis, the firm performance indicators
had significant, negative correlations with leverage impact. Therefore, the impact of
leverage was negatively correlated with firm performance. Firms’ performance
indicating that as the financial leverage increased, firm’s performance decreased. All
other firm performance indicators showed significant relationships among the
independent variables, and strong, positive correlations between the variables,
excluding the relationship between firm size (see Table 4.3).
Table 4. 3 Main Business Analysis – Pearson Correlation
IL II ROOA RNOA ROE Size Impact of Leverage II
Pearson Correlation
1 -.368* -.838** -.532** -.124
Sig. (2-tailed)
.035 .000 .001 .493 ROOA Average Pearson
Correlation 1 .463** .437* .035
Sig. (2-tailed)
.007 .011 .845 RNOA Average Pearson
Correlation 1 .908** .055
Sig. (2-tailed)
.000 .763 ROE Average Pearson
Correlation 1 -.010
Sig. (2-tailed) .955 Firm Size 1
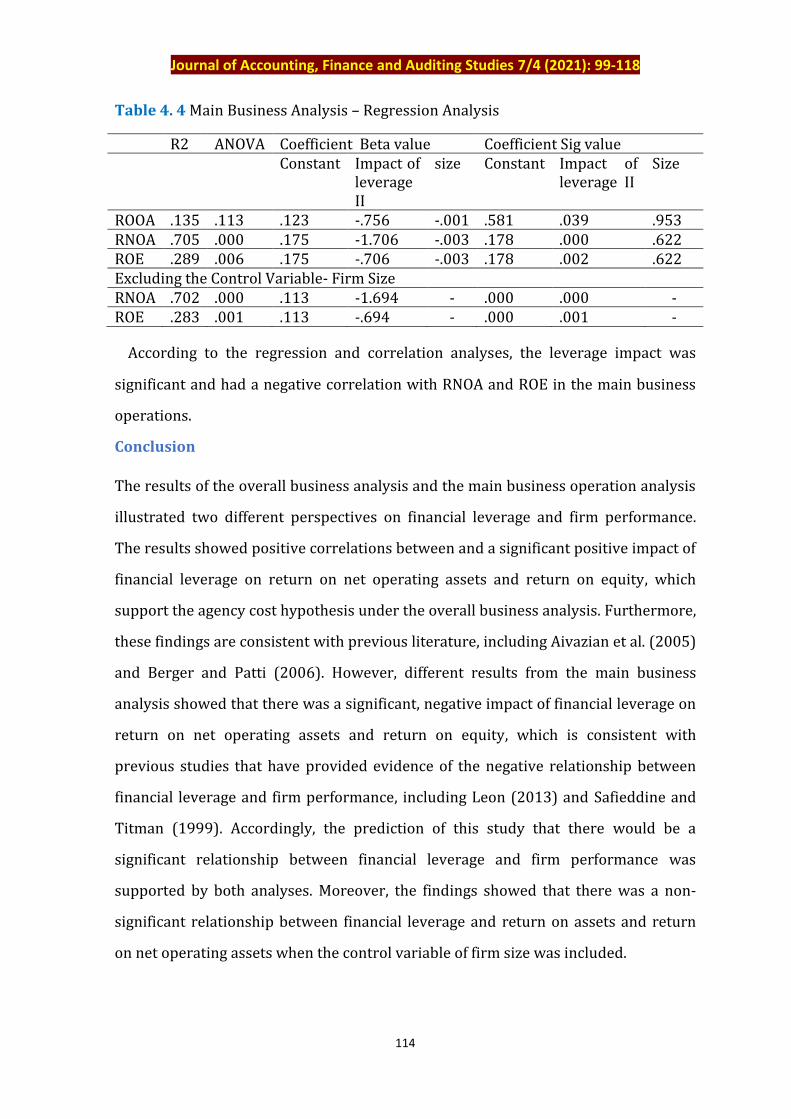
Regression Analysis in Leverage Impact on Firms’ Performances
The regression analysis showed a significant impact of leverage on RNOA and ROE.
The highest R2 of the model was shown in RNOA at 70.2%. Since the firm size was
non-significant in both RNOA and ROE, the regression analysis was repeated but
excluded the control variable of firm size (see Table 4.4). The estimated models for
the firm performance indicators were as follows (excluding the control variable):
Journal of Accounting, Finance and Auditing Studies 7/4 (2021): 99-118
114
Table 4. 4 Main Business Analysis – Regression Analysis
R2 ANOVA Coefficient Beta value Coefficient Sig value Constant Impact of
leverage II
size Constant Impact of leverage II
Size
ROOA .135 .113 .123 -.756 -.001 .581 .039 .953 RNOA .705 .000 .175 -1.706 -.003 .178 .000 .622 ROE .289 .006 .175 -.706 -.003 .178 .002 .622 Excluding the Control Variable- Firm Size RNOA .702 .000 .113 -1.694 - .000 .000 - ROE .283 .001 .113 -.694 - .000 .001 -
According to the regression and correlation analyses, the leverage impact was
significant and had a negative correlation with RNOA and ROE in the main business
operations.
Conclusion
The results of the overall business analysis and the main business operation analysis
illustrated two different perspectives on financial leverage and firm performance.
The results showed positive correlations between and a significant positive impact of
financial leverage on return on net operating assets and return on equity, which
support the agency cost hypothesis under the overall business analysis. Furthermore,
these findings are consistent with previous literature, including Aivazian et al. (2005)
and Berger and Patti (2006). However, different results from the main business
analysis showed that there was a significant, negative impact of financial leverage on
return on net operating assets and return on equity, which is consistent with
previous studies that have provided evidence of the negative relationship between
financial leverage and firm performance, including Leon (2013) and Safieddine and
Titman (1999). Accordingly, the prediction of this study that there would be a
significant relationship between financial leverage and firm performance was
supported by both analyses. Moreover, the findings showed that there was a non-
significant relationship between financial leverage and return on assets and return
on net operating assets when the control variable of firm size was included.
Journal of Accounting, Finance and Auditing Studies 7/4 (2021): 99-118
115
Managerial Implications
The importance of an optimal capital structure is that it helps to maximize the firm
owner’s wealth. One of the key factors of an optimal capital structure is the
maintenance of an optimal gearing ratio in the organization. Even the owners in the
organization can invest more equity capital in the organization, while debt capital
can also contribute to their wealth maximization. The expectation of the company is
to increase the percentage of return on the capital invested by its owners along with
mitigating the agency cost between managers and owners.
It has been revealed by this study’s results that management may have been missing
wealth maximization opportunities due to the neglect of these factors. Therefore, it
can be concluded from the research findings that manufacturing companies in Sri
Lanka may have to be very aware of their capital structures. If management pays due
attention to its company capital structure, it can contribute both to society and to the
economy of the country. Consideration of the optimal capital structure in the
manufacturing sector in these time series may help performances in the
manufacturing sector to develop, and in this way contribute to the development of
the country’s economy.
Limitations and Research Recommendations
The sample was based on the observations of listed manufacturing companies in Sri
Lanka; thus, the results may not be applicable to other business sectors.
Furthermore, the control variable of firm size was excluded from the regression
analysis because of the non-significant results, which suggests that firm size was not
a control factor for financial leverage and firm performance. Therefore, this study’s
results for these variables may be less reliable for the large global segment.
There are a number of avenues for future research. Alternative research methods
could be used, such as questionnaires, interviews, case studies, and experimental
designs to further explore the relationship between financial leverage and firm
performance. This exploration could help to obtain deepen insight into the
Journal of Accounting, Finance and Auditing Studies 7/4 (2021): 99-118
116
relationship between financial leverage and firm performance. Further research is
needed to examine other relevant factors which may influence financial leverage and
firm performance.
References
AIVAZIAN, V.A., GE, Y. and QIU, J., 2005. The impact of leverage on firm investment:
Canadian evidence, Journal of corporate finance, 11(1-2), pp. 277-291.
Al-Duais, F., 2016. An Empirical Study on Capital Structure and Corporate
Performance of Chinese Listed Companies, Journal of Commerce and Accounting
Research, 5 (3), pp. 18-21.
ARAFAT, M. Y., WAROKKA, A., BUCHDADI, A. D., and SUHERMAN., 2013. Banking
efficiency and performance: a test of banking characteristics in an emerging
market, Journal for Global Business Advancement, 6(1), pp. 13-23.
ARUNA, D.C. and WAROKKA, A., 2013. Systematic risk and accounting determinants:
a new perspective from an emerging market, Journal for Global Business
Advancement, 6(1), pp. 24–37.
BERGER, A.N. and PATTI, D.E.B., 2006. Capital structure and firm performance: A new
approach to testing agency theory and an application to the banking industry,
Journal of Banking & Finance, 30(4), pp. 1065-1102.
BIRT, J. L., BILSON, C. M., SMITH, T., and WHALEY, R. E., 2006. Ownership,
competition, and financial disclosure, Australian Journal of Management, 31(2),
pp. 235-263.
DEVOS, E., DHILLON, U., JAGANNATHAN, M. and KRISHNAMURTHY, S., 2012. Why are
firms unlevered? Journal of corporate finance, 18(3), pp 664-682.
FRANK M.Z. and GOYAL V.K., 2003.Testing the pecking order theory of capital
structure, Journal of financial economics, 67(2), pp. 217–248.
FOSU, S., 2013. Capital structure, product market competition and firm performance:
Evidence from South Africa, The quarterly review of economics and
finance, 53(2), pp.140-151.
GHOSE, B. and Kabra, K.C., 2016. What determines firms’ zero-leverage policy in
India? Managerial Finance, 42(12), pp. 1138-1158.
Journal of Accounting, Finance and Auditing Studies 7/4 (2021): 99-118
117
GONZALEZ, V. M., 2012. Leverage and corporate performance: International
Evidence, International Review of Economics and Finance, pp. 169-184.
HUSSAN J. MD., 2016. Impact of Leverage on Risk of the Companies, Journal of Civil &
Legal Sciences, 5(4), pp. 1 -3.
JENSEN, M.C., 1986. Agency costs of free cash flow, corporate finance and takeovers,
American Economic Review, 76(2), pp. 323–339.
JENSEN, M.C. and MECKLING, W., 1976. Theory of the firm: Managerial behavior,
agency costs, and capital structure, Journal of Financial Economics, 3, pp. 305–
360.
KIZILDAG, M. and OZDEMIR, O., 2017. Underlying factors of ups and downs in
financial leverage overtime, Tourism Economics, 23(6), pp.1321-1342.
LEE, H. and MOON, G., 2011. The long run equity performance of zero leverage firms,
Managerial Finance, 37(10), pp. 872-889.
LEON, J. S. A., 2013. The impact of Capital Structure on Financial Performance of the
listed manufacturing firms in Sri Lanka, Global Journal of Commerce and
Management perspective, 2(5), pp. 56-62.
LANG, L.E., OFEK, E. and STULZ, R., 1996. Leverage, investment and firm growth,
Journal of Financial Economics 40, pp. 3–29.
MALSHE, A. and AGARWAL, M.K., 2015. From finance to marketing: The impact of
financial leverage on customer satisfaction, Journal of Marketing, 79(5), pp.21-
38.
MORAIS, F., SERRASQUEIRO, Z. and RAMALHO, J.J., 2019. The zero-leverage
phenomenon in European listed firms: A financing decision or an imposition of
the financial market? BRQ Business Research Quarterly, pp.1-23.
MYERS, S.C., 1977. The determinants of corporate borrowing, Journal of Financial
Economics 5, pp. 147–175.
MYERS, S.C., 2001. Capital Structure, Journal of Economic Perspectives, 15(2), pp. 81–
102.
SAFIEDDINE, A. and TITMAN, S., 1999. Leverage and corporate performance:
Evidence from unsuccessful takeovers, The Journal of Finance, 54(2), pp. 547-
580.
Journal of Accounting, Finance and Auditing Studies 7/4 (2021): 99-118
118
SCHOUBBEN, F. and HULLE, V. C., 2011. Stock listing and financial flexibility, Journal
of Business Research, 64(5), pp. 483-489.
SEO, K., 2018. Excessive leverage and firm performance in competitive casino
markets, Tourism and Hospitality Research, 18(4), pp.498-504.
SINGH, M. and FAIRCLOTH, S., 2005. The impact of corporate debt on long term
investment and firm performance, Applied Economics, 37(8), pp. 875-883.
SUN, J., KENT, P., QI, B. and WANG, J., 2019. CFO Demographic Characteristics and
Fraudulent Financial Reporting in China, Accounting and Finance, 59(4), pp.
2705–2734.
WEILL, L., 2008. Leverage and corporate performance: does institutional
environment matter? Small Business Economics, 30(3), pp. 251-265.
Related Documents