DSpace Institution DSpace Repository http://dspace.org Sport Science Thesis and Dissertations 2020-02-24 THE RELATIONSHIP BETWEEN ANTHROPOMETRIC CHARACTERISTICS AND PHYSICAL FITNESS TRAITS OF JUNIOR VOLLEYBALL PLAYERS IN WEST GOJAM, ETHIOPIA GASHU, DEMISSIE http://hdl.handle.net/123456789/10122 Downloaded from DSpace Repository, DSpace Institution's institutional repository

Welcome message from author
This document is posted to help you gain knowledge. Please leave a comment to let me know what you think about it! Share it to your friends and learn new things together.
Transcript
DSpace Institution
DSpace Repository http://dspace.org
Sport Science Thesis and Dissertations
2020-02-24
THE RELATIONSHIP BETWEEN
ANTHROPOMETRIC
CHARACTERISTICS AND PHYSICAL
FITNESS TRAITS OF JUNIOR
VOLLEYBALL PLAYERS IN WEST
GOJAM, ETHIOPIA
GASHU, DEMISSIE
http://hdl.handle.net/123456789/10122
Downloaded from DSpace Repository, DSpace Institution's institutional repository
i
THE RELATIONSHIP BETWEEN ANTHROPOMETRIC
CHARACTERISTICS AND PHYSICAL FITNESS TRAITS OF
JUNIOR VOLLEYBALL PLAYERS IN WEST GOJJAM, ETHIOPIA
BY:
DEMISSIE GASHU WALLE
(Asst. professor)
DEPARTEMENT OF SPORT SCIENCE
SPORT ACADEMY
BAHIR DAR UNIVERSITY
JULY, 2019
ii
THE RELATIONSHIP BETWEEN ANTHROPOMETRIC
CHARACTERISTICS AND PHYSICAL FITNESS TRAITS OF
JUNIOR VOLLEYBALL PLAYERS IN WEST GOJAM, ETHIOPIA
BY:
DEMISSIE GASHU WALLE
(Asst. professor)
DEPARETEMENT OF SPORT SCIENCE
SPORT ACADEMY
BAHIR DAR UNIVERSITY
JULY, 2019
iii
THE RELATIONSHIP BETWEEN ANTHROPOMETRIC
CHARACTERSTICS AND PHYSICAL FITNESS TRAITS
OF JUNIOR VOLLEYBALL PLAYERS IN WEST GOJJAM, ETHIOPIA
By:
DEMISSIE GASHU WALLE
(Assistant professor)
A Dissertation Submitted to the Sport Academy Bahir Dar University
for fulfillment of the requirements for the degree of Doctor of Philosophy in
Sport Science (volleyball coaching)
JULY, 2019
iv
v
i
ACKNOWLEDGEMENTS
Firstly, I would like to express my sincere gratitude to my principal advisor Dr.
Kaleemulla Angadi (Associate professor, PhD) for the continuous support throughout
my study from the beginning up to its completion. Without his kindness, motivation
and suggestions on the various phases of this research, it would not have been
completed on time and successfully.
Besides my principle advisor, I would like to thank my co-advisor Dr. Zelalem
Melkamu (Assistant professor) for his insightful comments, enormous knowledge and
encouragement, but also for the hard question which incited me to widen my research
from various perspectives. I could not have imagined having a better advisor for my
PhD study.
I would like to extend my thanks to Prof. Alemayehu Bishaw and Dr. Teffera Tadesss,
Dr.Amare Sahelie and Dr. Zerihun Birhanu for their encouragement, critical comments
and suggestions. I am also very much grateful to volleyball experts in the Amhara
volleyball federation, coaches, players and officers in West Gojjam zone of Ethiopia
who participated in the study.
Last but not the least; I would like to thank my friend, Dagnachew Negeru, for editing
and supporting me in every aspect throughout this dissertation report.
ii
ABSTRACT
Anthropometric characteristics and physical fitness are the key predictors for
identifying talent in junior volleyball players. However, volleyball players and
coaches in Ethiopia, particularly junior volleyball players in the west Gojjam zone of
Ethiopia were not familiar with these parameters. Hence, the purpose of the study
was to compare whether there exists a significant mean difference between junior
volleyball players in the West Gojjam, Ethiopia and international players with
respect to some selected anthropometric characteristic and physical fitness traits.
Further, examine the relationship between the anthropometrics characteristics and
physical fitness traits of players. In this study, 54 junior (U-19) volleyball players
from three volleyball teams participated in the study. Secondary data were also
obtained from the databases of the world championships 2017 on the official FIVB
website and journals and books. A total of 34 anthropometric variables and six
physical fitness components were selected, measured and tested based on the
procedure set by international society for kin-anthropometry, ISAK procedure, and
copper institute respectively. Independent t- test, one sample t- test, one way ANOVA,
Pearson Product Moment correlation test and multiple linear regression method were
used for analysis and Alpha Value of 0.05 was set for statistical significance. The
results of the study reveal that there were significantly difference between junior
volleyball players at the West Gojjam zone of Ethiopia and international players in
some selected anthropometric characteristic and physical fitness traits (p<.001).
There were significant relationship between most of anthropometric characteristics
and fitness traits of junior volleyball players in the west Gojjam zone of Ethiopia (r >
.275, p<.05). The findings suggest that flexibility of lower back and hummestring
muscles of junior volleyball players were predicted by block reach height, waist girth
and abdominal skin folds at about 39.6 %. Upper body strength of players was
predicted by the stature, flexed & tensed arm girth of players. Anthropometric
characteristics which predict strength of abdominal and hip muscles, speed runs,
agility and explosive power of lower extremities were also identified. Volleyball
coach and related bodies should consider this relationship while identifying talented
players.
iii
TABLE OF CONTENTS
Page
ACKNOWLEDGEMENT………………………………………………….……...…...i
ABSTRACT.…………………………………………………………….…….…...…..ii
TABLE OF CONTENTS……………………………………………………………...iii
LIST OF TABLES………………………………………………………………..........x
LIST OF FIGURES …………………………………………………….……….....vii
LIST OF TABLE IN THE APPENDIX………………………………………...……xiv
ABBRIVATIONES……………………………………………………..………...…..xvi
CHAPTER ONE: INTRODUCTION …………………………………………………1
1.1. Background of the study ………………………………………………………… 1
1.2. A statement of the problem ………………………………………………………...7
1.3. Objective of the study …………………………………………………………….. 9
1.3.1. General objective of the study………………………………………………...9
1.3.2. The specific objective of the study………………………………………...….9
1.4. Research questions ………………………………………………………….….....10
1.5. The significance of the study.…………………………………………….……..10
1.6. Delimitations of the study….…………………………………………………....11
1.7. Limitation of the study……………………………….……………………..…...12
1.8. Operational definition of key terms …………………….………………………13
CHAPTER TWO: REVIEW OF RELATED LITRATURE ………………………..14
2.1. Historical development of Volleyball sport ………………….…………………14
2.2. Theoretical framework of anthropometric characters…………………………...19
2.3. Anthropometric characteristics of junior volleyball players ………………...….21
2.3.1. Stature of junior volleyball players……………………………………….23
2.3.2. Body weight of junior volleyball players…………………………………26
iv
2.3.3. Body mass index (BMI) of junior volleyball players.................................28
2.4. Theoretical framework of Physical fitness traits …………………………….....32
2.5. Physical fitness traits of junior volleyball players……………………...……….33
2.5.1. Flexibility of junior volleyball players…………………………………...34
2.5.2. Upper, abdominal and hip muscle strength of junior volleyball players....36
2.5.3. Speed and agility of junior volleyball player…………………………….40
2.5.4. Explosive power of junior volleyball players ……….…………………...42
2.6. Theoretical framework of the relationship between anthropometric
characteristics and physical fitness traits of volleyball players……………........44
2.7. The relationship between anthropometric characteristics and physical
fitness traits of junior volleyball players………………………………………..45
Summery.……………………………………...……………...………………….48
CHAPTER THREE: RESEARCH METHOD ……………..……………………… 49
3.1. Research Design …………………………………………...……………… 49
3.2. The Population of the study ………………………………………………….49
3.3. Source of data……………………………….………………………………..49
3.4. Ethical Considerations ………………………………….……………………50
3.5. Data gathering tools and procedures. …………...……………………………50
3.5.1. Data gathering tools for anthropometric characteristics……….………50
3.5.2. Data gathering procedure for anthropometric characteristics………….51
3.5.2.1. Basic anthropometric variable measurement procedure ….…51
3.5.2.2. Skin folds measurement Procedure……………………….....53
3.5.2.3. Girth measurement procedure …………………………….…55
3.5.2.4. Length measurement procedure ………………………...…...60
3. 5.2.5. Breadth measurement procedure…………………………......61
v
3.6. Data gathering tools and procedure for the physical fitness test ………..……….63
3.6.1. Data gathering instrument for physical fitness.…………….……..63
3.6.2. Data gathering procedure for physical fitness tests ………………63
3.6.2.1. Flexibility testing procedure ……………………………….…...63
3.6.2.2. Upper body strength test strength testing procedure ..................64
3.6.2.3. Abdominal and hip muscles strength testing procedure ……..…65
3.6.2.4. Speed testing procedure ….…………………………...………. 66
3.6.2.5. Agility testing procedure..……..…………………………….….66
3.6.2.6. Explosive power testing procedure . . . …..………………….….67
3.7. Tester‟s Competency …………………………………………………………...68
3.8. Methods of data analysis ……………………………………………………….68
CHAPTER FOUR: RESULTS ANALYSIS AND DISCUSSION OF FINDINGD..70
4.1. Results …………………………………………………………………...…70
4.1.1. Results of some anthropometric characteristic of junior volleyball
players in West Gojam, Ethiopia and international norms…………..….70
4.1.1.1. Comparative result on anthropometric characteristics
of junior volleyball players in West Gojjam zone, Ethiopia,
and the international norm……………………………………….70
4.1.1.2. Comparative result on anthropometric characteristics among
junior volleyball players in West Gojjam zone, Ethiopia………..73
4.1.1.3. Comparative results on anthropometric characteristics
among junior volleyball players in the west Gojjam, Ethiopia..…75
4.1.1.4. Multiple Comparison results on anthropometric characteristics
of junior volleyball players in the west Gojjam, Ethiopia…….…77
vi
4.1.2. Results on physical fitness traits of junior volleyball players in the west
Gojjam, Ethiopia………………………………………...…………………...80
4.1.2.1. Descriptive statistics result on the physical fitness traits
of junior volleyball players in the west Gojjam,
Ethiopia………………..................................................................80
4.1.2.2. Comparative statistical results on physical fitness traits
of junior volleyball players in West Gojjam zone of
Ethiopia and international norms………………………………...81
4.1.2.3. Comparison result on physical fitness traits of junior
volleyball players in the West Gojjam zone of Ethiopia………...83
4.1.3. Correlations between anthropometric characteristics and physical fitness traits
of junior volleyball players in the west Gojjam, Ethiopia. …...………85
4.1.3.1. Correlations between anthropometric characteristics
and flexibly of lower back and hamstring muscles
performance traits of junior volleyball players…..……...…..86
4.1.3.2. Correlations between anthropometric characteristics
and upper body strength of junior volleyball players…..……87
4.1.3.3. Correlations between anthropometric characteristics
and strength of abdominal and hip muscles of junior
volleyball players………………………………………….....87
4.1.3.4. Correlations between anthropometric characteristics and
moving speed of junior volleyball players……………….......88
4.1.3.5. The correlations between anthropometric characteristic
and agility of junior volleyball players……………………....88
4.1.3.6. The Correlations between anthropometric characteristic
and explosive power of junior volleyball players……………88
vii
4.1.4. Result of Regression analysis and prediction of physical fitness
traits of junior volleyball players. …………………………..…………..….89
4.1.4.1. Regression prediction of lower back and hamstring muscle
flexibility traits based on anthropometric variables…………….89
4.1.4.2. Regression prediction of the upper body strength traits
based on anthropometric variables………………….…………..91
4.1.4.3. Regression prediction of the abdominal and hip muscle
strength traits based on anthropometric variable………………..93
4.1.4.4. Regression production of 10m sprint runs performance
traits based on anthropometric variables……………...………..94
4.1.4.5. Regression prediction of agility traits based on
anthropometric variables ……..………………………………...96
4.1.4.6. Regression prediction of explosive power of lower
extremities based on anthropometric variables ………………...97
4.2. Discussion …………………………………………………………………......90
4.2.1. Comparative analysis of some anthropometric characteristics
of junior volleyball players in West Gojjam, Ethiopia and
international norms…………………………………………………..…100
4.2.1.1. The Stature of junior volleyball players …………………….….100
4.2.1.2. Body weight of junior volleyball players ………………………101
4.2.1.3. Body mass index of junior volleyball players ……………….....102
4.2.1.4. Spike and block reach heights of junior volleyball players ……103
4.2.2. Comparative analysis of some basic anthropometric characteristics
among junior volleyball players in the west Gojjam, Ethiopia…...…….104
4.2.3. Comparative analysis of most anthropometric characteristics of junior
volleyball players in the west Gojjam, Ethiopia…………………...…...105
4.2.4. Multiple comparative analyses of most anthropometric characteristics
among junior volleyball players in the west Gojjam, Ethiopia…….......108
4.2.5. Analysis of physical fitness traits of junior volleyball players…………110
viii
4.2.5.1. Comparative analysis of physical fitness traits of junior
volleyball players ………………………………………………111
4.2.5.2. Comparative analysis of physical fitness traits of junior
volleyball players in the west Gojjam of Ethiopia………….…..116
4.2.6. Co-relational analysis of anthropometric characteristics and physical
fitness traits of junior volleyball players………………………...…….. 118
4.2.6.1. Correlations between anthropometric characteristic and
flexibility of lower back and hamstring muscles of junior
volleyball players…………………………………………….....118
4.2.6.2. Correlations between anthropometric characteristic and
strength of the upper body of junior volleyball players……….119
4.2.6.3. Correlations between anthropometric characteristic and
strength of abdominal and hip muscle of junior volleyball
players…………………………………………………………..119
4.2.6.4. Correlations between anthropometric characteristic and
moving speed of junior volleyball players……...……………....119
4.2.6.5. The correlations between anthropometric characteristic and
moving agility of junior volleyball players………………….….120
4.2.6.6. The Correlations between anthropometric characteristic and
the explosive power of junior volleyball players……..………...120
4.2.7. Regression models for anthropometric characteristics and
physical fitness traits of junior volleyball players found in
West Gojjam, Ethiopia………..…..………………………………….121
4.2.7.1. Analysis of regression model of flexibility of lower back
and hamstring muscle traits and anthropometric
characteristics of junior volleyball players……………………..122
4.2.7.2. Analysis of regression model of upper body strength traits
and anthropometric characteristics of junior volleyball
players………………………………………………………….124
ix
4.2.7.3. Analysis of regression model of abdominal and hip muscle
strength traits and anthropometric characteristics of junior
volleyball players…………………………………………….....125
4.2.7.4. Analysis of regression model of speed performance traits
and anthropometric characteristics of junior volleyball
players…………………………………………………….…….126
4.2.7.5. Analysis of regression model of agility traits and anthropometric
characteristics of junior volleyball
players……………………………………………………….….127
4.2.7.6. Analysis of regression model of explosive power of lower
extremities traits and anthropometric characteristics of junior
volleyball players……………………………………………….128
CHAPTER FIVE: SUMMARY, CONCLUSION AND RECOMMENDATION...130
5.1. Summary………………………….………………………………...…...130
5.2. Conclusions…………………….…………………………………...…...133
5.3. Recommendations for practitioner and researchers……….………..…...133
REFERENCES ………………………………………………….………...........…135
APPENDICES
APPENDIX A: DEFINATIONES OF TERMS AND PHRASES
USED IN THESTUDY…………………………………..….161
APPENDIX B: INFORMED CONSENT FOR………………..................….162
APPENDIX C: ANTROPOMETRIC ASSESSMENT SHEET……….….....163
APPENDIX D: FITNESS ASSESMENT SHEET……..………….………....165
APPENDIX E: LIST OF TABLES ………………………….………….........166
APPENDIX F: LIST OF FIGURES……………………………............188
x
LIST OF TABLES page
Table 2.1: Suggested Volume in Metric Tons (1,000 kg) of Strength
Training for junior volleyball players per session and year……….... 39
Table 2.2: Intensity zones, Intensity, repetitions and sets of strength training …. 40
Table 2.3 Training Zone Intensities for Sprint Training………………………… 42
Table 3.1: Anthropometric category and variables ....………………………...… 51
Table 3.2 selected physical fitness components, testing methods and purpose…..63
Table 4.1: Independent sample t- test between junior volleyball players in West
Gojjam zone of Ethiopia and junior national team players of 2017
World championships ………………………………...……..…....…71
Table 4.2: One way analysis of variance (ANOVA) among junior volleyball
players in West Gojjam zone of Ethiopia and national team players
of the world .……………………………………………………….... 72
Table 4.4 Analysis of variance (ANOVA) among junior volleyball players
of the West Gojjam zone, Ethiopia, with regards to some
anthropometric characteristic……………….…………..…………….74
Table 4.9: Multiple comparison of skin folds characteristic difference
among three junior volleyball team players in west Gojjam zone
of Ethiopia (n-54)……………………………………..……….……....79
Table 4.10: Descriptive statistics on physical fitness traits of junior volleyball
players in West Gojjam zone of Ethiopian (n-54) ………..….…..……81
Table 4.11: Comparison of fitness traits of junior volleyball players in west
Gojjam with international mean value of their counterpart…………83
Table 4.12: A comparison of physical fitness traits among junior volleyball
players in west Gojjam zone of Ethiopia (n-54)……..……………...…83
Table 4.19: Summary of regression prediction of sits and reaches performance
traits with anthropometric variables. . …………………………..…….90
Table 4.20: Coefficients of regression prediction of sit and reaches
performance with anthropometric variables………………..………….90
xi
Table 4.21: Summary of regression prediction upper body strength,
performance traits with anthropometric variables ……………………92
Table 4.22: Coefficients of regression prediction of upper body strength,
performance traits with anthropometric variables .........................…...92
Table 4.23: Summary of regression prediction of abdominal and hip muscle
strength traits with anthropometric variables ………………………..93
Table 4.24: Coefficients of regression prediction of abdominal and hip muscle
strength traits with anthropometric variables………………..……….93
Table 4.25: Summary of regression prediction of 10m sprint run
traits with anthropometric variables ……………………….…………94
Table 4.26: Summary of regression prediction of the 10m sprint run
traits with anthropometric variables…..…………………………..…..95
Table 4.27: Summary of regression prediction of agility, performance traits
with anthropometric variables ...……………………………………...96
Table 4.28: Coefficients of regression prediction of agility performance
traits with anthropometric variables……………….……..………........96
Table 4.29: Summary of regression prediction of vertical jump performance
traits with anthropometric variables..………….…..…………….......98
Table 4.30: Coefficients of regression prediction of vertical jump
performance traits with anthropometric variables..………………..…. 98
Table 4.31: Summaries of the regression models for physical fitness
performance traits to anthropometric characteristics of Ethiopian
junior volleyball players…………………………………...…….…...122
xii
LIST OF FIGURES page
Figure 2.1: Conceptual framework of anthropometric characteristics. ………..…... 21
Figure 2.2: Conceptual framework of physical fitness. . ………………………......32
Figure 2.3: Conceptual framework of the relationship between
anthropometric characteristics and physical fitness traits ………..........45
Figure 3.1, standing reach heights ……………………………………………...…...52
Figure 3.2, triceps skin folds …………………………………...……………………53
Figure 3.3, Sub scapular skin folds……………………………….…………...……..53
Figure 3.4, iliac crest skin folds …………………………..….……………...………54
Figure 3.5, abdominal skin folds………………………………………………….….54
Figure 3.6, Mid-thigh skin folds…………………………………………...………...54
Figure 3.7 Mid- Calfskin folds………………………………………...…………….55
Figure 3.8 Neck girth………………………….……………………………..………55
Figure 3.9 Arm relaxed girth ……………………………………………….……...55
Figure 3.10 Arm flexed and tensed girth………………………………..…………..56
Figure 3.11 Forearm girth……………………………………………….…………..56
Figure 3.12 Wrist girth…………………………………………………….…..…….57
Figure 3.13 Chest girth……………………………………………………..….…….57
Figure 3.14 Waist girth…………………………………………………….………..58
Figure 3.15 Gluteus girth…………………………………………………….…...…58
Figure 3.16 mid thigh girth…………………………………………………..….…. 59
Figure 3.17 Calf girth………………………………………………………….……59
xiii
Figure 3.18 Ankle girth……………………………………..……………………….60
Figure 3.19 Radial-stylion lengths ………………………………………………......60
Figure 3.20 Acromiale-radiale lengths…………………………………………........60
Figure 3.21 Midstylion-dactylion lengths…………………………………………...61
Figure 3.22 Biacromial………………………….………………………………..….61
Figure 3.23 Transverse chests…………………………………………….………....61
Figure 3.24 Biiliocristal breadths. …………………………………………. ………62
Figure 3.25 sit and reach test………………………………………………… ……..64
Figure 3.26 push-up tests . …………………………………………………..………64
Figure 3.27 sit-up test…………………………………………….……………..….. 65
Figure 3.29 Block reach height……………………………………….………...……67
Figure 3.30, Spike reach height……………………………………….………..……67
xiv
LIST OF TABLE IN THE APPENDIX
Table 4.3: Multiple comparisons of some anthropometric characteristic
difference between junior volleyball players in West Gojjam zone
of Ethiopia and overseas…………………...……………………...……168
Table 4.5 Multiple comparisons of some anthropometric characteristic
among junior volleyball players in the west Gojjam,
Ethiopia……….…………………………………………………….…..171
Table 4.6: Descriptive statistics of anthropometric characteristic of junior
volleyball players in west Gojjam zone of Ethiopia (N-54)………...….172
Table 4.7: A comparison of anthropometric characteristic among three junior
volleyball team players in West Gojjam, Ethiopia …………..………...174
Table 4.8: multiple comparisons of anthropometric characteristic difference
among junior volleyball teams players in west Gojjam zone
of Ethiopia……………………………………………………………..176
Table 4 12: Multiple comparisons of physical fitness difference among three
junior volleyball team players in west Gojjam zone of Ethiopia…….....177
Table 4.13: The correlation between anthropometric variables and sit &
reach the performance traits of junior volleyball players
in the West Gojjam zone of Ethiopia (N=54)……………….……….…178
Table 4.14: The Correlation between anthropometric variables and
push up the performance traits of junior volleyball players in
the West Gojjam zone of Ethiopia (n=54)…………………………….180
Table 4.15: The Correlation between anthropometric variables and sit
up the performance traits of junior volleyball players in the
West Gojjam zone of Ethiopia (N=54)…………….………………182
Table 4.16: The Correlation between anthropometric variables and 10m
sprint run performance traits of junior volleyball players in
the West Gojjam zone of Ethiopia (n=54)……………………………184
xv
Table 4.17: The Correlation between anthropometric variables and
T- shuttle run agility, performance traits of junior volleyball
players in the West Gojjam zone of Ethiopia (n=54)…………….......186
Table 4.18: The Correlation between anthropometric variables and
vertical jump performance traits of junior volleyball players
in West Gojjam zone of Ethiopia (n=54)………………...………..….188
xvi
ABBREVIATIONS
ACS - Anthropometric Characteristics,
APTA - America Physical Therapist Association
AR - Acromiale radial
BEFB - Biepicondylar femur breads
BMI - Body Mass Index
BRH - Block Reach Heights
CAVB - Confederation Africaine de Volleyball
CDCP - Centers for Disease Control and Prevention,
DJVT - Durbietie Junior Volleyball Team,
FAG - Forearm girth
FIVB - International Volley Ball Federations
HB - Hand breads.
ISAK -International Societies for Advancement Kin Anthropometrics,
MSD - Midstylion – dactyl ion length
PFV - Physical Fitness Variables
PFTS - Physical Fitness Testes
QJVT - Qunzla junior volleyball team,
SH - Sitting height
SRH - Spike Reach Heights
SWJVT - Shendie Wenbrma Junior Volleyball Team,
UNITSDP - United Nations Inter-agency Taskforce on Sport for Development and Peace
1
CHAPTER 1
INTRODUCTION
1.1. Background of the study
Sports are an organized competitive activities governed by a set of rule and through
which the participation improves fitness, mental well-being, social relationships and
refreshment (ASC, 2017; UNITSDP, 2017). Today, there are about 28 Olympic
sports and most of them are developed in the 19th
and 20th
century. Volleyball is the
second most popular sport in advanced nations, including China, Brazil and USA and
it‟s the fifth most popular sports in the world, next to soccer, crickets, hockey and
tennis (Redding, 2011; wood, 2017). It has been a part of the Olympic Games since
1964 Tokyo Olympiad (IOC, 2016; FIVB, 2016). Its well practiced sport in 220
associated countries worldwide and played by 500 million players‟ in addition to a
vast number of players playing it for enjoyment without being registered to any clubs.
The total number of people playing volleyball as a free time activity may approach to
one billion (Vuorinen & Mero, 2018 Yadav, 2015; Kinda, Lenberg & Laskey, 2011).
The volleyball game promotes peace and unity throughout the globe and played a
great role in the formation of socialization, shaping personality and providing friendly
relationship among the participants (Ahlm & Lindgren, 2013). It also contributes a lot
for development of a country (Singh & Behera, 2013). Moreover, Volleyball alone
added 202 million dollars for growth, create job opportunity for 6.8 million people
and provide 493 million dollars in the form of turnover tax in United Kingdome
within 2014 (UK sport, 2017).
Volleyball sport is short, intense, power and lovely ball game activities characterized
by two teams on a playing court divided by a net and each team play the ball over the
net to ground it on the opponent's court, and to prevent the ball from being grounded
on its own court (Yadav, 2015; Singh & Behera, 2013). To attack, the players try
their best to make the ball fall down onto the opposite side and to defend; they
prevent the ball from falling down onto their own court (Kinda Lenberg & Laskey,
2
2011). In volleyball games, a team is allowed to hit the ball three times, in addition to
the block contact, to return it to the opponent's court. In a game each team players
arrange in two rows with three players in each zone of the court. The players‟
standing position on the court will rotate clockwise except the libero, which means
every player should be able to serve, set, pass, spike and block (LA84, foundation,
2012; Kinda, Lenberg & Laskey, 2011). A player is not permitted to touch the ball
twice consecutively, except when trying a block. The rally continues until the ball
touches the floor (Vuorinen & Mero, 2018).
In performance wise, the superiority of nations have been changed from time to time.
The Japanese and the Soviet Union teams dominated from 1964-1984. Since then the
balance of power has shifted to Cuba, then to China and now to Brazil. The United
States men‟s teams were famous in the 1980s, Italy in the 1990s and Brazil in the
2000s (FIVB, 2016). Egypt, Tunisia, and Cameron are 1st, 2nd and 3rd
ranked nations
from all African countries (FIVB, 2017).
The performance of volleyball player depends on technical, tactical, physical fitness,
psychological and anthropometrical characteristics (Yadav, 2015; Fattahi, Ameli,
Sadeghi &, Mahmoodi, 2012; Pridal & Hancák, 2012; Gabbett, Georgieff, &
Domrow 2007). The success of a volleyball player greatly depends on anthropometric
characteristics and physical fitness traits of players (Milić, Grgantov, Chamari,
Ardigò, Bianco & Padulo, 2016; Catagay, Pinar & Sibel, 2008; Gualdi-Rosso &
Zaccogni, 2009). That means, anthropometric characteristics and physical fitness
traits of players have been recognized as critical factors for outstanding performance
in volleyball. That is why, they are considered as important prerequisites for
successful participation of players (Gualdi-Russo & Zaccagni, 2001). They are also
used as basic circumstance for selection of talented players (Gaurav, Singh & Singh,
2010; Malousaris, Bergeles, Barzouka, Bayios, nurses & Koskoloub, 2008; Bayios,
Bergeles, Apostolidis, Postolidis, Noutsos & Koskolou, 2006).
3
According to international societies for advancement kin anthropometrics, ISAK,
(2007) among 39 anthropometric variables, the stature, body weight, body mass
index, spike and block reach height are considered as the most basic variables that
determine talent as well as the success of volleyball players (Jin, Liu, Zhang & Ge
2007; Jose, Palau, Policarpo, Manzanares & David, 2014; Wood, 2015; Michael,
2016; Andrea, 2017). Therefore, it‟s important to use anthropometric characteristic to
recruit talented and gifted volleyball players.
Previous studies have determined the anthropometric characteristic of a junior
volleyball players (Petroski, Fraro, Fidelix, Silva, Pires-Neto, Dourado,Rocha,
Stanganelli, Oncken &Viera, 2013; Hadzic, raised, Bjelica, Dusko, Popovic & Stevo,
2012; Gaurav, Singh, & Singh, 2010; Bandyopadhya, 2007; Gabbett, Georgieff &
Domrow, 2007; Duncan, field & AL-Nakeeb,2006). The mean stature of Turkish
junior national team volleyball players was 198 cm (Aytek, 2007). It was almost
similar to the top junior national team in the world, including Brazilian, Italian and
Russian junior volleyball ball players. The stature of England junior volleyball
players was also similar to the best performed nations of the world, 193cm (Duncan,
field & al-Nakeeb, 2006). The stature of the United States of American junior
volleyball players (184 cm) was also almost similar to Indians junior volleyball
players (187cm) as reported by Gabbett, Georgieff and Domrow (2007) and Manna,
Khanna and Dhara (2012) respectively.
The tallest player in volleyball has an advantage in both defensive and offensive
actions over the top of the net (Stamm, Veldre, Stamm, Thomson, karma & Loko,
2003). Effective execution of overall volleyball performance greatly depend on the
height that players can reach (Silva, Mello, & Mota,2013). The heights of players
highly influence spiking and blocking actions. Thus, there has been a tendency to
recruit the tallest players in the volleyball sport (Zhang, 2010).
As the literature indicates, due to the density of bones and the higher proportion of
lean muscle mass rather than fat accumulation, top junior volleyball players were
4
heavier. Heavier volleyball players with normal adipose tissue (until 10%) were
becoming more preferable for volleyball sports (Stamm, Stamm & Jairus, 2017).
There are studies conducted to find out the body weight of junior volleyball players
(Audio, Mohammed & Alanazi, 2015; Manna, Khanna & Dhara, 2012; Aytek, 2007;
Gabbett, Georgieff & Domrow, 2007; Wood field and al-Nakeeb, 2006). The weight
of England junior nation team volleyball players was between 71.2kg and 77.9kg
(Wood field and al-Nakeeb, 2006). It was similar to Americans and most European
countries. The mean body weight of American junior volleyball players was 71.1 kg,
+9.6kg (Gabbett, Georgieff & Domrow, 2007). The weight of Australian junior
volleyball players participated in continental, world championships and World Cup
were 88.4 kg, + 7.7 kg (Jeremy, Sheppard, Nolan & Newton, 2012). The mean body
weight of Brazilian junior national team players was 84.3 kg, +5.1 kg in 1995 and
their weights increased to 90.3 kg, +13.0 kg in 2005 (Petroski, et al., 2013). It was
heavier than the previous years. This indicates, the requirement of heavier, muscular
players increased from time to time.
The skin folds thickness also the other anthropometric factor which determines the
talent of volleyball players. Both high and low fat tissues negatively affect the players
(Mooses & Hackney, 2017). The Normal percentage of fat for players is between 7%
and 13% (Cespedes, 2017).
Few studies have been conducted to evaluate the body composition or percentage of
body fat among junior volleyball players (Aouadi, et al., 2015; Manna, Khanna &
Dhara, 2012; Gabbett, et al., 2007; Duncan, Wood field & al- Nakeeb, 2006). The fat
percentage of England junior nation volleyball players were between 11.5-12.9 %
(Duncan, field & al- Nakeeb, 2006). The body fat percent of Indian junior volleyball
players were also normal and almost similar to the England junior volleyball players
(Manna, Khanna & Dhara, 2012). The body mass index (BMI) and the percentage
body fat in relation to Turkish junior volleyball players were 20.72, + 2.14 or 7.49%,
+ 2.69 (Aytek, 2007). This is the least and more advantages. The Sum of six skin
5
folds of American junior volleyball players was 83.1 mm, + 23.9 mm as reported by
Gabbett, Georgieff and Domrow, (2007).
In volleyball, 80% of the points obtained in international volleyball matches are due
to spiking and blocking actions (Marques, Van den Tyler, Vescovi, & Gonzalez-
Badillo, 2008; Lobietti, Michele & Merni, 2006; Voigt & Vetter, 2003). This
indicates, the significant importance of the spike and block reach heights of the
players. The highest spike reaches height scored by the Canadian junior volleyball
player. His spike reach height was 382 cm (Keith, 2017). In this particular study, the
stature, weight, skin folds, spike and block reach heights as well as other
anthropometric characteristics of junior volleyball players in the west Gojjam,
Ethiopia, were assessed and compared with international norms.
Physical fitness traits of a volleyball player can be described as the ability of the players
to perform a given task without being too tired (Tey, Kwong, Russia & Ooi1, 2010;
Kenneth & Wills, 2018). In a volleyball match, every player should change their
position to serve, set, pass, spike and block. So, it is essential for the players possess a
high traits of physical fitness that allows them to play their roles more effectively in
each position. Hence, volleyball sport considered as the game of flexibility, strength,
speed, agility and power ( Gaurav, Kumar, Singh, & Bhanot, 2015; Zhang, 2010).
In Volleyball game, players require performing vigorous activities including, starting,
stopping, changing direction and diving movements, Players also suddenly in the
forward direction, sideways or downward directions, all this requires an optimum
traits of flexibility (Fattahi, Shamsabadi, Kalani, Khalifeh & Ghofrani, 2014; Dale,
2017). So flexibility of the body, particularly, flexibility of lower back and hamstring
muscles is very important to increase the range of movement of the joints, to play the
game in a good manner, to reduce risk of injuries, to decrease recovery time (Fischer,
2004; Dale, 2017). Additionally, lower back and hamstring flexibility in very
essential for volleyball players to execute the required skills successfully (Hamilton,
6
2018; Kim & Jean, 2016; Erica, Johnson, James & Thomas, 2010; Buschbacher,
Prahlow & Dave, 2009; Arnheim, 2005).
The flexibility traits of junior volleyball players were studied by few researchers
(Sameer Kumar & Yadav, 2015; Silva, Petroski & Gaya, 2013; Duncan, Woodsfield
& al-Nakeeb, 2006). The sit and reach test score of Indian junior volleyball players
were 19.07 +3.77cm as reported by Sameer Kumar and Yadav (2015). Whereas the
sit and reach test score of Brazilian junior volleyball players were 25.5cm, + 01 cm
(Silva, Petroski & Gaya, 2013). Their mean sit and reach score of England junior
volleyball players were a little bit greater than Brazilians. It was about 29.23cm as
reported by Duncan, Woodsfield and al-Nakeeb, (2006).
Strength also studied by researchers in the field. Particularly strength of upper body is
important physical quality to perform jump serve, dig, spike and to demonstrate
aggressive blocking in volleyball and they are considered as the key predictor for
successful volleyball performance (Mermier, Janot, Parker & Swan, 2000, Singh,
Chengappa & Banerjee, 2011; Ben-Zaken, Meckel, Lidor, Nemet & Alon,
2013).Very few studies determine the strength of upper and abdominal muscles of
volleyball players (Rameshkannan & Chittibabu, 2014; Bag, Borman, Das &
Chawdhury, 2015). The one minute sit-ups performance traits of Indian junior
volleyball players were 39.86 as reported by, Bag, Borman, Das and Chawdhury (
2015).This is an average performance with reference to standard norms set by,
Australian College of Sport and Fitness (2013). Similarly, Rameshkannan and
Chittibabu (2014) measured the set up the performance traits of junior volleyball
players and reported that the mean sit-ups performance traits of junior volleyball
players as 39.10 repetitions. This is also considered as average performance.
Volleyball game is mostly characterized by jumping-serve, attack from the back row
and aggressive blocking and a probability of winning the game which largely depend
on predominance over the net (Tian, 2006, Deporte, 2016; Gaurav, Kumar, Singh, &
Bhanot, 2015; Women & Wic, 2010; Zhang, 2010). These activities require
7
Explosive power of lower extremities. In this regard, various researches were
conducted. For instance, the mean vertical jump height traits of junior male volleyball
players in Brisbane, USA were 46.0 cm, +11.2cm (Gabbett, Georgieff & Domrow,
2007). In the other study, relatively a little bit less performance traits were reported.
The vertical jump performance traits of junior volleyball players in England were
42.0cm, + 49.0 cm (Duncan, Wood field & al-Nakeeb, 2006).
Generally, the physical fitness traits of players, particularly upper body strength and
power of the lower extremities of the players determine the success of spiking and
blocking actions together with anthropometric characteristics and technical abilities
(Palao, 2007; Vint, 1994). Attacking and blocking performance represent 45% of the
total actions in a game and 80% of the scores obtained in international matches (Voigt
& Vetter, 2003; Zhang, 2010). Therefore, anthropometric characteristic and fitness
traits of Ethiopians junior volleyball players was studied and reported by the research.
1.2. Statement of the problem
Anthropometric characteristics of players are mainly determined by genetic makeup
of the players (Jafari, 2006; National Academies Press, 2006; National Academies
Press, 2004; Norton & olds, 2001). This means that the stature, weight, size, shape,
length and breadth of different body part cannot be changed significantly with
training and diets. That is why; volleyball coaches, physical educators and sport
science experts have used anthropometric characteristic and physical fitness traits to
select talented players (Eskandarnejad, 2000).
In Ethiopia, there are research works on anthropometry characteristics and physical
fitness traits of sportsmen and women. Particularly, on athletics (Abdu & Pallavi,
2018; Abebe & Kumar, 2017; Zerihun & Rediet, 2017; Wishnizer, Inbar, Klinman,
& Fink, 2013; Hailu, Yekoye, Egidio & Miserocchi, 2011), soccer (Wale, & Ibrahim,
2018; Reda, 2017; Bereded & Singh, 2016a; Bereded & Singh (2016b) and
basketball sports (Endris & Kumar, 2018). To the researchers‟ knowledge, there was
8
no study conducted on anthropometric characteristic and physical fitness traits of
volleyball players at any traits. Particularly, anthropometric characteristics and
physical fitness traits of junior volleyball players are clearly absent in the literatures.
- Amhara region volleyball federations together with other stakeholders have been
organized youth and junior volleyball championship every year. In the championship,
Most of the cup and medals has been taken by teams from west Gojjam zone. Due to
this reason, expert in the region believed that, this zone as a talented area in this
specific sport. But Scholars of the field associate talent of volleyball players with
anthropometric characteristics and fitness traits of players (Ahmed & AlMaghawry,
2012; Gaurav, Singh & Singh, 2010; Malousaris, Bergeles, Barzouka, Bayios, nurses
& Koskoloub, 2008; Bayios, Bergeles, Apostolidis, Postolidis, Noutsos & Koskolou,
2006; Tokuyama, Ohashi, Iwamoto, Takaoka & Okubo, 2004).
- Anthropometric characteristics and physical fitness traits of players are considered as
prerequisites for successful participation and talent identification in volleyball
(Ahmed & AlMaghawry, 2012; Gaurav, Singh & Singh, 2010; Malousaris, Bergeles,
Barzouka, Bayios, nurses & Koskoloub, 2008; Bayios, Bergeles, Apostolidis,
Postolidis, Noutsos & Koskolou, 2006; Tokuyama, Ohashi, Iwamoto, Takaoka &
Okubo, 2004; Gualdi-Russo & Zaccagni, 2001).
Experts, coaches, as well as junior volleyball Player in the given zone knows the
positive contribution of these two factors for talent identification and successful
participation. But they don‟t know how near or far their players from international
players interns of both anthropometric characteristic and fitness traits. Information, in
this regard, is very important to check the presence or absence of talented players in
their team as well as in their zone. It also helps the coaches to select talented players
who are parallel to international players in terms of both anthropometric characteristic
and fitness traits.
The relationships between anthropometric characteristic and physical fitness traits of
volleyball players are also important to develop effective training plan. However the
9
relationship between these two variables was not studied very well among the
scholars. Zhang (2010) studied the relationship between anthropometric
characteristic and physical performance of women volleyball players. The
relationship between anthropometric characteristic and specific physical fitness traits
of male volleyball players is not clearly known. Study in this regard is very important
to identify the specific Anthropometric variables which predict specific fitness traits
of players. Hence, this study examined the relationship between anthropometric
characteristics and physical fitness traits of the junior volleyball players.
1.3. Objectives of the study
1.3.1. The general objective of the study
The general objective of the study was to examine the relationship between
Anthropometrics characteristics and physical fitness traits of junior volleyball players.
1.3.2. The Specific objectives of the study
The Specific objectives of the study were to:
1. Compare whether there exists a significant mean difference between junior volleyball
players in the West Gojjam, Ethiopia and international players with respect to some
selected anthropometric characteristic.
2. Identify whether there exists statistically a significant mean score difference among
junior volleyball players, in the West Gojjam, Ethiopia in relation selected
anthropometric characteristics.
3. Compare whether there exists statistically significant mean difference between junior
volleyball players in the West Gojjam zone of Ethiopia and international players with
respect to selected physical fitness traits.
4. Identify whether there exists statistically significant mean difference among junior
volleyball players in the teams found in the west Gojjam, Ethiopia in relation to
physical fitness traits.
10
5. Examine whether there exist statistically significant relationship between
anthropometric characteristics and physical fitness traits of junior volleyball players
in the West Gojjam zone of Ethiopia.
6. Determine the extent that anthropometric characteristic significantly predict physical
fitness performance traits of junior volleyball players in the West Gojjam zone of
Ethiopia
1.4. Research questions
The research questions of the study were as follows
1. Is there a significant mean difference of anthropometric characteristics between
junior volleyball players in West Gojjam zone of Ethiopia and international
players?
2. Is there a statistically significant mean difference of anthropometric
characteristics among junior volleyball players in west Gojjam, Ethiopia?
3. Is there a statistically significant mean difference between junior volleyball
players in west Gojjam, Ethiopia and international players in relation to some
selected physical fitness traits?
4. Is there a statistically significant mean difference of physical fitness traits
among junior volleyball players in the teams found in west Gojjam, Ethiopia?
5. Is there a statistically significant relationship between anthropometric
characteristics and physical fitness traits of junior volleyball players in West
Gojjam zone of Ethiopia?
6. Which of the anthropometric characteristic significantly predict the selected
physical fitness traits of junior volleyball players?
1.5. Significance of the research
The finding of the study will contribute greatly to the benefit of all those who
involved in volleyball sports. Firstly, players benefited a lot from this study. A player
may be nearer or far away from international players, in terms of both anthropometric
and fitness variables. The information may help each and every player to make early
11
decision on their carrier and personal plan. It helps to make a right decision with full
confidence so that they can save their time, energy and money.
Volleyball coaches also will benefit a lot from study. It may help them to recognize
the anthropometric and fitness gap between their players and international
counterparts. This information used as an input to select the right players in a
scientific way. Moreover, it helps the coaches to plan their selection mechanism and
training plans so that they can produce outstanding players relatively within a short
period of time for zones, for regional as well as for a country as a whole.
Additionally, the outcome of the study also provided for sport experts, physical
education specialist, sport academy, the media and volleyball teams. They may use it
for educational and related consumptions. The outcome of the study also given to
sport governing bodies of the country, higher educational institutes, as well as
regional and city administrative volleyball federations of the country. They may use it
as reference for further and broader study and can easily identify the talented areas in
this particular sport, as well as to design long term policy plans related to volleyball
sport (Duncan, Wood field & AL-Nakeeb, 2006; Warner, Fornetti, Jallo, & Pivarnik,
2004; Gualdi-Russo & Zaccagni, 2001).
The study report could be used as a reference material for other researchers in the
area. It may pave the way for other researchers to study the issues, at regional or
country traits.
1.6. Delimitation of the study
The study had the following delimitations:
1. The study was delimited to Durbietie, Shendie Wenbrema and Qunzla wereda in
West Gojjam zone of Amhara regional state of Ethiopia.
2. Only junior (U-19) male junior volleyball players were involved in the study.
12
3. Despite the presence of 39 variables, 34 of them were measured. i.e., all basic
anthropometric variables, stature, weight, BMI (Body mass index), spike and
block reach heights plus sitting height, standing reach height , Six skin folds (
Namely triceps, sub-scapular, abdominal, iliac crest , Mid-thigh and calf skin
folds), eleven girth (namely neck, chest, relaxed arm , flexed tense arm, forearm,
wrist, waist, gluteus, tight, calf and ankle ) four length (namely, radiale-stylion,
acromiale-radiale, midstylion-dactylion and acromiale-dactylion length) and the
six breadth (Biacromial, transverse chest, biilocristal, Biepicondylar femur,
biepicondylar humerus and hand) of junior players were measured using
procedure set by International standard for advancement of Kin anthropometry
(ISAK) protocol to determine anthropometric characteristic of junior volleyball
players.
4. Physical fitness traits, i.e. flexibility of lower back and hamstring muscles,
strength of upper body muscles, strength of the abdominal and hip muscles,
moving speed, agility and explosive power of lower extremes were selected in the
study.
5. Test and measurement procedure were adapted from International standard for
advancement of Kin anthropometry (ISAK) protocol for anthropometric
measurement and cupper institute, 2007 standard procedures for fitness tests.
1.7 Limitations of the study
It was planned to involve junior volleyball players from most Woredas in the given
zone. Due to different reasons most of them could not organize players who
completed U-17 project in 2010 E.C. as a junior teams. Only three Woredas, such as
Shendie Wenbrema, Durbietie and Qunzla woredas organized junior volleyball teams.
Hence, anthropometric characteristics and fitness data were collected from the three
junior volleyball teams.
13
1.8. Definition of Operational terms
The terms, which were often used in this study, are defined as follows:
Anthropometric characteristics: are the traits that describe body dimensions of
junior volleyball players, such as height, weight, body fat composition
circumference of the chest, etc. (American physical therapy association, 2017).
Physical fitness traits: is the ability of junior volleyball players to perform a certain
physical activity without being too tired. This includes, the ability of the
players to jump vertically high (explosive power) or the ability of the players to
cover a certain distance within a short period of time, moving speed (Health
reviser, 2010).
Junior volleyball players: under 19 years of age male volleyball players
International players: volleyball players who play volleyball at national team level.
14
CHAPTER 2
REVIEW OF RELATED LITRATURE
Overview
The review of literature that is given in this chapter provides a frame of reference for
understanding anthropometric characteristics, physical fitness traits and the
relationship between anthropometric characteristics and physical fitness traits of
junior volleyball players. The literature review composed of six sub topics. Firstly,
historical development of Volleyball sport is reviewed. Then, theoretical framework
of anthropometric characteristics is outlined. Thirdly, anthropometric characteristics
of a junior volleyball player are reviewed. Fourthly, the theoretical framework of
physical fitness is delineated. Then fifthly, physical fitness traits of junior volleyball
players are reviewed. Lastly, the link between anthropometric characteristics and
physical fitness traits of junior volleyball players are reviewed.
2.1. Historical development of Volleyball sport
Volleyball sport was made-up at Springfield faculty in Massachusetts at intervals of
years in 1895, by William G. Morgan, once observation basketball, develop; he
determined to create a less exhausting sport for older folks. He had known as this
game "Mignonette". However, a neighborhood businessperson and faculty member
named Dr. Hallstead contemplate the movement of the take a back cyber web, and
therefore the sport was nearly instantly renamed as volleyball. In 1900, a modification
of the foundations was advised. The peak of cyber web goes up to seven feet half
dozen inches and match length is about at twenty one points (LA84 foundation, 2012;
FIVB, 2016).
The rules of volleyball were conjointly modified once more in 1912. The court size
became thirty five feet by sixty feet and an identical size and weight of the ball was
established, occupation for a circumference of twenty six inches and a weight of
between seven and nine ounces. To boot, the amount of players on every team was set
at six and therefore the players should rotate before service (FIVB 2008). The gap of
15
war brought volleyball to worldwide, together with Africa; Egypt became the primary
country from Africa to find out the official rules in 1915.
In 1916, the score for a game was modified from twenty one to15, and it had been
determined that so as to win a match, a team had to win 2 out 3 games. net height was
raised yet again, now to eight feet, whereas the quality ball weight escalated from
eight to ten ounces. it had been conjointly determined that if a player holds onto the
ball or the contacts the ball doubly during a row, it'd be thought of a foul. The 1920's
marked several vital advances in volleyball's history. The foundations modified once
more. The court size went all the way down to thirty six feet, and therefore the ball
can be competing by the other a part of the body on top of the waist. Grading rules
were conjointly modified, providing that, with the score at 14-14, two consecutive
points were required to win (Volleyball worldwide, 2011).
After the Second war, international volleyball federation passed off in Paris, France in
1946 and assigned French person Paul Libaud because the 1st President. He
consonant the European rules of the sport and the court becomes nine x eighteen
meters and the net height was to be 2.43 meters for the males and 2.24 meter for the
ladies. Since its innovation, different nations have joined, and currently over one
hundred twenty national federations attached with the federation of international
American state volleyball (FIVB, 2016). In 1948, the primary European
Championship was control in Rome and won by geographical area. A year later, the
primary public World Championship was control in Prag and won by the USSR. In
1963, European Confederation was founded; volleyball created its 1st official look
within the Olympic Games in 1964 . Today, Volleyball becomes the fifth most well
liked sports within the world next to association football, crickets, hockey and court
game. It involves over 900 million folks at intervals two hundred national federations
throughout the planet (IOC, 2016; Wood, 2017).
Volleyball in Africa
Confederation Africaine de Volleyball or CAVB is the continental governing body
for the sport of volleyball in Africa. Its head office is situated in Cairo, Egypt. The
16
CAVB was the last governing body to be established in 1972. The CAVB is
responsible for organizes continental competitions such as the African Volleyball
Championship in 1967. It also takes part in the organization of qualification
tournaments for major events such as the Olympic Games, World Championships and
international competitions hosted by allied federations (Solomon Addis Getahun,
2019)
In Africa, no national team had been able to obtain impressive results in international
competitions neither in women‟s nor in men‟s events, until 2004. However, countries
like Egypt and Tunisia have maintained consistent Olympic participation in recent
years. From the African continent, Egypt and Tunisia in men‟s and women‟s
volleyball and Kenya, in women‟s volleyball, dominate (Abiy wendeferaw, 2018;
Tadele Yidnekachew Tessema, 1998)
Volleyball in Ethiopia
Ethiopia is located in the north-eastern part of Africa commonly known as the Horn
of Africa. Neighboring countries include Djibouti and Somalia in the east, Kenya in
the south, Sudan in the west, south Sudan in the south-west and Eritrea in the north.
Population of Ethiopia is expected to be 110,000,000 people. In terms of the age
structure of the population, 70 percent of Ethiopians are younger than 30 years of age.
Around 20 percent of the population lives in urban areas. The population of Ethiopia
is extremely heterogeneous (diverse). In total, there are more than 80 different ethnic
groups within Ethiopia. Numerous other local languages are also spoken. Many of the
languages are from the Semitic or Cushitic linguistic groups. Amharic is the countries
only working language, while English is the major foreign language taught to
Ethiopians in the educational system. Ethiopia is the second most populous country in
sub-Saharan Africa. The total area of Ethiopia covers approximately 472,000 square
miles is the ninth largest country in Africa. The country is divided into nine
ethnically-based administrative regions and two chartered cities (Henze, Paul B.,
2005; Yilmaz, Serdar; Venugopal, Varsha, 2008).
17
Volleyball introduced in our country Ethiopia in 1943 by foreign academics. Ethiopia
is one of the founding members of the African Volleyball Commission founded in
1967, and the African Volleyball Confederation established in 1972. Volleyball has
been one of the most popular sports in Ethiopia since the 1970s. It has the potential to
be the second most popular sport next to football in Ethiopia. The country
participated in continental competition both in the men and women‟s category until
the late 1990s. These days, volleyball no longer enjoys popularity among Ethiopian
sports fans. In the 1970s, volleyball was the most popular sport activity in the
country. The sport was first introduced and practiced in schools (Michael & Araya
2005). At that time, the best and most well known volleyball players and coaches
were recruited from such schools (https://en.wikipedia.org/wiki/Sport_in_Ethiopia).
Until the late 1990s, the country participated in continental competition in both the
men and women‟s category. Even during the political transitions in 1991 and 1993,
the Ethiopian women‟s national volleyball team qualified for the Women‟s African
Volleyball Championship. There were also, a few domestic championships between
schools, weredas, zones and regions from which some excellent players were
recruited for the national team (Abiy wendeferaw, 2018)
Volleyball is suffering now. It is very sad to see volleyball fading at the top traits. It
has been a few years since the Ethiopian National Volleyball Team regularly
participated in continental, zonal or East African and other tournaments. Currently,
Players do have a very small opportunity to play for the national team. This makes it
really difficult to motivate players to work hard and improve their skills. Budget
constraint is the biggest challenge like many sport federations, the annual subsidy of
ETB350, 000 endowed by the government, is insignificant. Along with the premier
league, the Ethiopian volleyball federation organizes training for referees, coaches
and others technical personnel (www.ethiosport.com.).
Currently, the federation seems busy with projects at the lower traits. It works with
many project sites, most of which have been formed all over the country. They have
the ability to recruit the best young talent seen in over a decade; however, the
outcomes of projects have not been good enough. Finding just two or three youths in
18
a year to join the sport academy isn‟t adequate. In some areas of the country,
volleyball has long been like a cultural sport. The s Southern Nations, Nationalities
and Peoples region is believed to be the most productive one for volleyball. The
men‟s volleyball premier league champions‟ team, Wolaita Dicha, is from there. In
the Southern region, volleyball is still a very popular sport. One can see volleyball
pitches in schools, residential areas and even market places (Solomon Addis Getahun,
2019)
Volleyball Game
Volleyball is a team sport in which two teams of six players are separated by a net of
2.43m height in the middle (Kinda, Lenberg and Laskey, 2011). Each team tries to
score points by grounding a ball on the other team's 9m x 9m court under organized
rules. Two teams in the match, as opponents, exercised various Techniques and
tactics to attack and to defend (Jackson, 2017a).
To attack in volleyball, the players try their best to make the ball fall down onto the
opposite side. To defend, they prevent the ball from falling down onto their own
court. In a game each team players arrange in two rows with three players in each
zone of the court. The players‟ standing position on the court will rotate clockwise
except the libero, which means every player should be able to serve, set, pass, spike
and block. So it is essential for the players possess high traits of fitness that allows
them to play their roles more effectively in each position. So, volleyball is the game
of power, agility as well as speed (Govind, Taware, Milind, Bhutkar, Anil & Surdi,
2013).
The advanced technique of volleyball, such as attack from the back row, aggressive
blocking and powerful Jump serve are very critical to winning the game and their
execution requires high physical performance (Hayrinen, Hayrinen, Lahtinen,
Mikkola & Blomqvist, 2017). Spike reach height and block reach height also
frequently used as an important index to estimate the performance of the volleyball
players (Zhang, 2010). Thakur and Sinha (2010) pointed out that; “world‟s top most
19
sporting nations are very much aware on physical performance factors which are
supposed to play a dominant role in its future performance in all sports and games”.
Scholars in the field demonstrated a significant correlation between physical
performance and overall performance of players in the game. The vertical jump
performance had a positive correlation with the number of spiking, blocking, serving
and overall success rate of the game (Tian, 2006, Jackson, 2017b &Wood, 2017).
Attacking and blocking represent 45% of the total actions of the players and
contribute 80% of the scores obtained in an international game (Zhang, 2010).
Therefore, the performance of the players depends on the height that the players can
reach (Stanganelli, Dourado, Oncken, Mançan & Costa, 2008)
2.2. Theoretical framework of anthropometric characteristics
According to, Stanley and Komlos (2010) The word “anthropometry” is derived from
the Greek word “entrap” meaning “human” and “metro” meaning “measure”.
Therefore; anthropometry is the study of systematic measurement of the human body,
size and shape. Particularly, dimensional measurement of stature, weight, and body
mass index, body composition, bone and muscle. It also includes various organs,
connective and nervous tissue of a human being.
Stewart (2010) defined anthropometric characteristic as “the quality that describe
body size in relation to human movement, physiology or applied health sciences.”
America physical therapist Association (APTA, 2018) defines anthropometric
characteristics as follows: “the traits that describe body dimensions, such as height,
weight, girth, and body fat composition”. Centers for Disease control and prevention,
CDCP (2007) build on this definition, stating that anthropometric characteristics
determined by the behavior of the human body measurements. Such as Weight,
stature (standing height), lengths, circumferences (head, waist, limb, etc.), skin fold
thicknesses, limb lengths, and breadths (shoulder, wrist, and so on).
20
The international societies for advancement kin anthropometrics, ISAK, (2007)
classified anthropometric characteristics of players into five categories. The first
category called Basic anthropometrics characteristics. It includes Stature, body
weight and sitting height. The second category, known as Skin folds and it consists of
triceps, Sub scapular, Biceps, Iliac Crest, Supra spinal, abdominal, front thigh and
Medial calf. The third category is known as girth. It is composed of thirteen
variables (namely of head, neck, arm (relaxed), arm (flexed & tensed), forearm
(maximum), wrist (distal steroids), chest (mesosternale), waist (minimum), flutes
(hips), mid-thigh , mid-calf (maximum), ankle (minimum). The fourth category is
called Lengths, which consists of acromiale radial, radial styling, midstylion - dactyl
ion, iliospinale height, trochanterion height and trochanterion-tibial and tibial lateral
height and tidal lateral-sphyrion. The fifth anthropometric category is collectively
known as Breadth. It is consists of Biacromial, Biilocristal, Foot length, Transverse
chest, A-P chest depth, Humerus and Femur.
The definition of Stewart (2010) is little bit general and it does not indicate the
detailed anthropometric characteristic of players. The definition given by the centers
for disease control and prevention, (CDCP, 2007) is a relatively specific and indicate
some variation of anthropometric characteristic. The description anthropometric
characteristics given by the international society for advancement for kin
anthropometrics, ISAK, (2007) were more specific and pointed out each and every
variable included under anthropometric characteristic. Therefore, it is more relevant
to the current study.
21
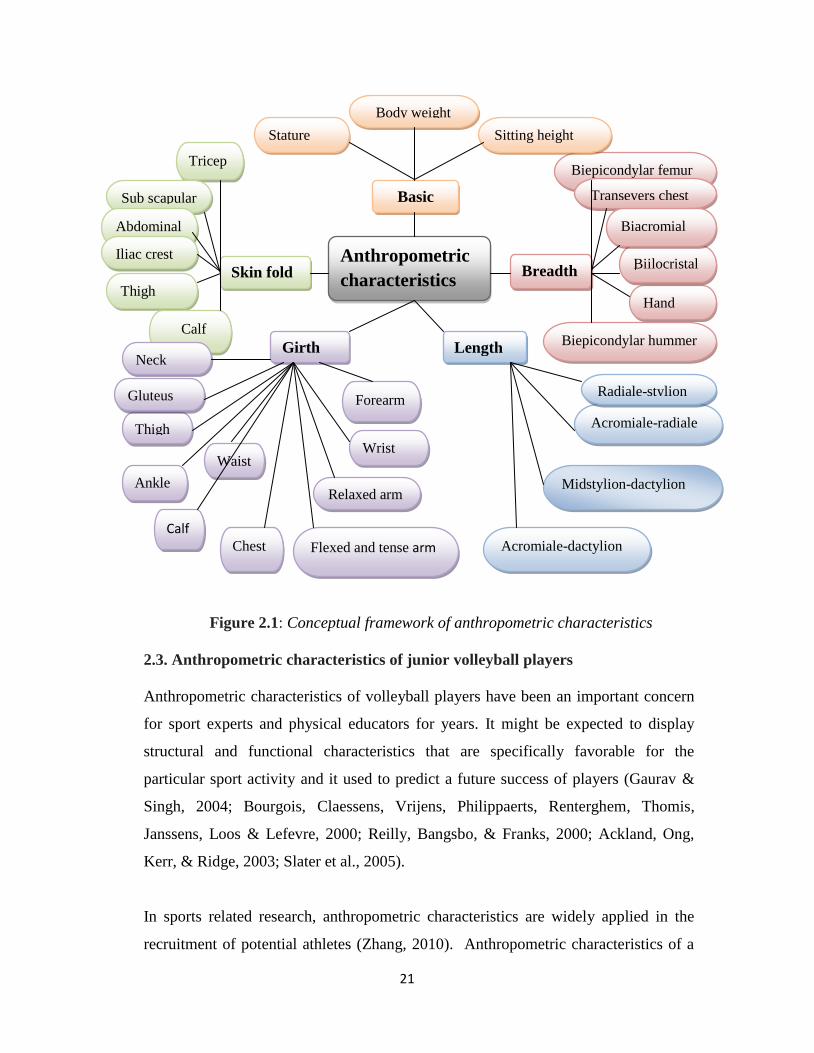
Figure 2.1: Conceptual framework of anthropometric characteristics
2.3. Anthropometric characteristics of junior volleyball players
Anthropometric characteristics of volleyball players have been an important concern
for sport experts and physical educators for years. It might be expected to display
structural and functional characteristics that are specifically favorable for the
particular sport activity and it used to predict a future success of players (Gaurav &
Singh, 2004; Bourgois, Claessens, Vrijens, Philippaerts, Renterghem, Thomis,
Janssens, Loos & Lefevre, 2000; Reilly, Bangsbo, & Franks, 2000; Ackland, Ong,
Kerr, & Ridge, 2003; Slater et al., 2005).
In sports related research, anthropometric characteristics are widely applied in the
recruitment of potential athletes (Zhang, 2010). Anthropometric characteristics of a
Anthropometric
characteristics Skin fold
Basic
Breadth
Length Girth
Tricep
s Sub scapular
Abdominal
Iliac crest
Thigh
Calf
Acromiale-dactylion
Midstylion-dactylion
Acromiale-radiale
Hand
Biepicondylar hummer
Biepicondylar femur
Biilocristal
Transevers chest
ce Biacromial
Sitting height
Body weight
Stature
Chest
Neck
Relaxed arm
Flexed and tense arm
Radiale-stylion
Thigh
Gluteus
Calf
Ankle
Wrist
Forearm
Waist
22
particular player also used to understand the growth of the body and muscles, to
predict his or her overall and physical performance (Zhang, 2010). Moreover, it is
also important to identify nutritional and supplementary requirement for a particular
athlete, to make the training more scientists and support talented athletes in various
sport discipline Chatterjee, Chatterjee, & Bandhyopadhyay, 2006). Anthropometric
characteristics also used for talent identification and success in different sports
discipline (Wilmore & Costill, 1999). Therefore, using anthropometric characteristics
of volleyball players during recruitment and training helped a lot to make the training
more scientific, effective and efficient (Barbieri, 2013).
In volleyball, Anthropometric characteristics of players are necessary to ensure
success (Viswanathan & Chandrasekaran, 2011). It influences the performance traits
of the players (Gaurav & Singh, 2004). Hence, it is understood that volleyball players
have distinctive anthropometric characteristics (Ugarkovic, 2004). Players have to
meet these unique anthropometric features to be successful in their carrier.
As indicated by researches in the area of volleyball, basic anthropometric variables
have a direct effect on the overall performance of players (Sameer Kumar & Yadav,
2015). Standing reach height, skin folds thickness, spike and block reach heights also
have their Owen contribution to determine the talent as well as the performance of
volleyball players (Jin, Liu, Zhang & Gai, 2007; Jose, Palau, Policarpo Manzanares &
Valades, 2014). All these characteristics determine the success or failure of
volleyball players and teams (Michael & Joyner, 2016; Cespedes, 2017).
Previous studies have reported anthropometric characteristics of junior volleyball
players. Particularly, the stature, body weight and body fat content of junior
volleyball player studied very well. Muniz, Cossio-Bolaños, Campos, Gonçalves,
Lázari, Urra-Albornoz, & de Arruda, 2017; Aouadi, Mohammed & Alanazi, 2015;
Petroski , Del Fraro , Fidelix ,Silva ,Pires-Neto , Dourado , Rocha , Stanganelli,
Oncken & Viera, 2013; Manna, khanna & Dhara , 2012; Jeremy, Sheppard Nolan &
Newton , 2012; Nejic & Markovic,2011; Duncan, Wood field & al-Nakeeb ,2006;
23
Aytek,2007; Gabbett, Georgieff & Domrow, 2007. Relevant findings are discussed
as follows.
2.3.1. Stature of junior volleyball players
Effective execution of volleyball skills as well as the serves depend on the height that
the players can reach (Stanganelli, Dour ado, Oncken, Mancan, & Costa, 2008). The
heights of volleyball players also influence their spiking and blocking heights (Wood,
2015). The height of the players over the net is the combination of the stature of the
players and his jumping performance. During competition, the height of the player
over the net always played a vital role to win the game. Attacking and blocking
represent 45% of the total actions in a game and 80% of the scores obtained in
international matches (Zhang, 2010). Therefore, a team will lose its capacity of
winning if there is a lack of predominance over the net (Tian, 2006).
In recent years anthropometric characteristics of junior (age less than 19 years)
volleyball players have been studied by various researchers. Muniz, Cossio-Bolaños,
Campos, Gonçalves, Lázari, Urra-Albornoz, and De Arruda (2017), Aouadi,
Mohammed and Alanazi (2015), Petroski , Del Fraro , Fidelix ,Silva ,Pires-Neto ,
Dourado , Rocha , Stanganelli, Oncken and Viera ( 2013), Manna, khanna and Dhara
( 2012), Jeremy, Sheppard Nolan and Newton (2012) , Nejic and Markovic (2011),
Aytek (2007) ,Gabbett, Georgieff and Domrow, (2007) and Duncan, Wood field and
al-Nakeeb (2006).
Muniz, Cossio-Bolaños, Campos, Gonçalves, Lázari, Urra-Albornoz and de Arruda,
(2017) examined the height of junior male volleyball players selected from a first
division professional team from the Brazilian volleyball league. The mean height of
29 junior male volleyball players (mean age= 18.1years) selected from a first division
professional team was 193.8cm, + 7.3cm. They further examined sitting height of the
players. They revealed that, the mean sitting height of junior Brazilian professional
volleyball players (mean age= 18.1years) was 150.1cm, + 3.8 cm. In the other study,
24
Gabbett, Georgieff and Domrow (2007) measured the Standing reach height of junior
(mean age, 15.5 years) American volleyball players. They examined that the men
standing reaches height of Twenty-eight junior volleyball players were 240.8cm,
+10.9cm. Which was 10 cm lesser than Brazilian. Greater sitting heights are
advantages for volleyball players and have got direct relationship with better
performance of a team (Zhang, 2010).
Audio, Mohammed and Alanazi (2015) investigated the mean height of Fifty two
Saudi Arabian young (mean age: 15.45 ± 0.51years) volleyball players and they
found that the mean height of Saudi Arabian young volleyball players was 181.75 cm,
± 6.36 cm. It was still a little bit less than Indians (Gabbett, Georgieff & Domrow,
2007) and United States of Americans and (Manna, Khanna & Dhara, 2012).
Petroski, Del Faro, Fidelix, Silva, Pires-Neto, Dourado, Rocha, Stanganelli, Oncken
and Viera (2013) studied the height of junior Brazilian nation team volleyball players
from 1995 to 2005. According to them, the mean height of Brazilian junior national
team (Age=17.0±0.3 years) in 1995 was 194.4 cm (+6. 2 cm). Whereas the mean
height of junior national team members found in 1999 and 2005 were 196.1 cm, + 6.7
cm) and 197.0 cm, +8.0 cm) respectively. This shows that the number of players
having greater height becomes increased in their national team from year to year. The
secret behind their outstanding performance in international tournament might be
related to it.
Jeremy, Sheppard, Nolan and Newton (2012) measured the height of junior
Australian volleyball players. They confirmed that the mean height of Sixteen (age:
18.5, +1.5years) junior volleyball players participated in continental championship,
the World Cup and World Championships were 2.00 m + 0.06m. It was similar to
Turkish, Brazilian, Italian and Russian junior volleyball players (Aytek, 2007).
Manna, Khanna and Dhara (2012) examined that the stature / height of 30 Indian
juniors (average age 17.7+ 0.5) volleyball players. They found out that the height of
25
junior Indians volleyball players was 187.1 cm. As a research, when it compared to
world average leave, it was less up to 13cm. The other study, Gabbett, Georgieff &
Domrow (2007) measured the height of Twenty-eight junior secondary school
volleyball players (mean age, 15.5 years) within Brisbane (USA). They found that the
height of junior American volleyball players were 184cm + 0.08cm. It was similar to
Indians junior volleyball players (Manna, Khanna & Dhara, 2012).
Magic and Markovic (2011) compared the height of Serbian junior club volleyball
players with that of the general population and the represented volleyball players. The
authors found that those players who represented in volleyball sport were tallest of
all. The mean height, junior volleyball players found in the club was 183.50 cm (±6.
14 cm), whereas the mean height general population and the representative players
were 177.04 cm (±7.57 cm) and 189, 40 cm (± 6.70cm) respectively. The height of
the youngsters who represent for volleyball sports were taller than the general
population and junior volleyball players played in different volleyball clubs. From
their finding, we can understand that, the minimum height recommended for
volleyball sport at junior traits was 189.40cm in Serbia.
In another study, Aytek, (2007) compared the height or stature of Turkish junior
volleyball national team players with Brazilian, Italian and Russian counterparts, the
result shows, the mean height of the Turkish junior national team (n= 18) volleyball
players was 198 cm. According to Aytek, (2007), the height or stature of Turkish
junior volleyball player‟s were similar Brazilian 194.41 cm (world ranking 1st Place),
Italy 195.81 cm (world ranking 2nd
Place) and Russia 201.81 cm (world ranking 3rd
Place) junior volleyball players. Three to five cm difference in stature seems similar
but it may bring a difference in performance.
Duncan, Wood field and al-Nakeeb (2006) have been measured stature of England
junior nation team volleyball players. They found that the stature of England junior
nation team volleyball players was between 192 cm - 193 cm. They conclude that the
stature of England junior volleyball players was similar to their counterpart
26
throughout the world. However, as a research, their mean stature was 8cm less from
Australian junior volleyball players (Jeremy, Sheppard Nolan & Newton (2012).
The above revised studies indicated that the mean height of Turkish junior national
team volleyball players was 198 cm. It was almost similar to junior volleyball ball
players of the Brazilian (194.41 cm), Italian (195.81 cm) and Russian (201.81 cm) as
stated by Aytek (2007). It was also similar to the England junior volleyball players
(193cm) as studied by, Duncan, Wood field and al-Nakeeb (2006). The stature of
Indians was 187cm as studied by Manna, Khanna and Dhara (2012) and the stature of
the United States of American junior volleyball players was 184 cm as reported by
Gabbett, Georgieff and Domrow (2007).
The described differences in stature among junior volleyball players were probably
due to genetics difference, environmental factors and selection of taller players. The
height of players largely (80%) determined by genetic makeup of players and the rest
20% related to environmental factors, including, physical activity climates, dietary
habits, health states and lifestyle (Jafari, 2006). The tallest player in volleyball has an
advantage in both defensive and offensive actions over the top of the net (Gaurav,
Singh & Singh, 2010; Stamm, Veldre, Stamm, Thomson, karma & Loko, 2003).
Thus, there has been a tendency to recruit the tallest players in the volleyball sport
(Jankovic & Marelic, 1995; Reilly, Secher, Snell & Williams, 1990). Viviani (2004)
said “Volleyball players were taller than non athletes” more studies on the heights,
sitting height and Standing reach height of junior volleyball players in each and every
country needed and research in this area will continue.
2.3.2. Body weight of junior volleyball players
Due to the density of their bones and the higher proportion of lean muscle mass,
most of international junior volleyball players were heavier and having a greater body
weight (Stamm, Stamm & Jairus, 2017). Heavier volleyball players with normal
adipose tissue (until 10%) are more efficient at attacking than light players (Raini et
27
al., 2017). Researchers were conducted studies and showed the weight of junior
volleyball players. Muniz, Cossio-Bolaños, Campos, Gonçalves, Lázari, Urra-
Albornoz and de Arruda (2017), Petroski, Fraro, Fidelix, Silva, PiresNeto, Dourado,
Rocha, Stanganelli, Oncken and Viera (2013), Manna, Khanna and Dhara (2012),
Aytek (2007), Gabbett, Georgieff and Domrow (2007), Wood field and al-Nakeeb
(2006) measured and reported the weight of junior volleyball players.
Muniz, Cossio-Bolaños, Campos, Gonçalves, Lázari, Urra-Albornoz and de Arruda
(2017) found that the mean weight of 29 Brazilian junior professional volleyball
players (mean age= 18.1years) were 84.9 kg, +10 .7kg). Similarly, Petroski, Fraro,
Fidelix, Silva, Pires, Neto, Dourado, Rocha, Stanganelli, Oncken and Viera (2013)
have been measured the weight of Brazilian junior national team volleyball players
since 1995. They reported that the mean body weight of Brazilian junior
(Age=17.0±0.3 years) national team volleyball players was 84.3 kg, +5.1 kg in 1995.
Whereas the weights of junior (age=17.7±0.7 years).national team volleyball players
in 2005 were raised to 90.3 kg, +13. 0 kg. It was increased by 5kg within ten years.
This indicates that the requirement of heavier, muscular players increased from time
to time. Jeremy, Sheppard, Emily Nolan and Robert U Newton (2012), in their part,
reported the weight of Australian junior volleyball players participated in continental
and world championships, as well as world Cup. The weight of Sixteen junior (age:
18.5, +1.5 years) volleyball players participated in continental and world
championships as well as the world Cup were 88.4 kg, + 7.7 kg.
Manna, Khanna and Dhara (2012) measured the weight of Indian junior volleyball
players. The result shows than the mean weights of 30 Indian junior (average age
17.7+ 0.5) volleyball players were 67.2 kg. It was much more less than world class
junior volleyball players. The other study conducted by Gabbett, Georgieff &
Domrow (2007) found that the weight of Twenty-eight American junior volleyball
players was 71.1 kg, +9.6kg.
28
Wood field and al-Nakeeb (2006) measured the weight of England junior nation team
volleyball players. They found that the mean body weight of volleyball players was
between 71.2kg and 77.9kg. In the other study, Aytek (2007) compared the weight of
Turkish junior (16-19-year-old) volleyball players with the international counterpart
and he found that their body weight of Turkish players was 74.8 kg. It was similar to
most European countries.
From what has been reviewed above, we can see that the mean weight of junior male
volleyball players was greater. It was between 67.2 kg and 90kg. The mean weight of
Brazilian was between 84kg and 90 kg, as studied by Petroski, et al (2013) and
Muniz, et al (2017). The mean weight of Australian junior volleyball players was 88.4
kg, as studied by Jeremy, et al (2012), it was almost the same as Brazilian and world
class junior players. The mean weight of Turkish and England junior volleyball
players was about 74.8 kg, as studied by Aytek (2007) and Wood field and al-Nakeeb
(2006). The mean weight of Indians was much more less than Brazilian, Australian,
Turkish and England junior volleyball players. It was about 67.2 kg. Indians junior
volleyball players were relatively lighter than most European countries, But they
qualified and participated in world championship and world cups in frequent years.
So, research should continue.
2.3.3. Body mass index (BMI) of junior volleyball players
The most well-known indicator of body fatness is the body mass index or “BMI.” It
has been one of the most commonly utilized indices in the assessment of body mass
to height ratio. Its values are calculated by body mass in kilogram divided by height
in meter square (ventures, 2017)
BMI = Body mass (kg) / height (m x m)
According to, Ventures (2017) and Cespedes (2017) the body mass to height ratio can
be categorized as follows.
Underweight = <18.5
Normal weight = 18.5–24.9
29
Overweight = 25–29.9
Obesity = BMI of 30 or greater
Body mass index (BMI) often describes muscular athletes as overweight or obese
because of the density of muscle tissue, because it doesn‟t distinguish between lean
tissue and fatty tissue. Therefore, BMI is not always a reliable indicator of body
fatness, Nonetheless, it is still commonly used as a guide of the nutritional status and
body condition of the players (Barbieri, Zaccagni, Cogo, & Gualdi-Russo, 2013;
Romero-Corral, Somers, Sierra-Johnson, Thomas, Collazo - Clavell, & Korinek,
2008).
As indicated by Wood (2008) the most appropriate equation used to calculate
percentage body fat from various skins fold measurement site was founded by
Yuhasz, His formula is:
Percentage Body Fat for men = (0.1051 x sum of triceps, sub scapular, supra spinal,
abdominal, thigh, calf) + 2.585
According to, Body ventures (2017) Athletes have a body fat percentage that's lower
than that of the general population. A normal body fat percentage of men's volleyball
players are from 6 % to 13 % percent (Cespedes, 2017). Having lean muscles has got
a number of advantages for players. It‟s important to maintain a higher metabolism,
to control weight easily, to increase mobility and strength, to reduce injuries and
strengthens joints. It‟s also helpful to have more energy and greater self-esteem, as
well as less stress and depression (Mayo Clinic, 2019).
Few studies have been conducted to show the body composition of junior volleyball
players by using simple, low costs and easy mechanizes. Like skin folds thickness
and or body mass index (Moon, Tobkin, Smith, Lockwood, Walter, Cramer, Beck &
Stout, 2009; Bentzur, Kravitz & Lockner, 2008; Heyward & Wagner, 2004).
30
Muniz, Cossio-Bolaños, Campos, Gonçalves, Lázari, Urra-Albornoz and de Arruda,
(2017) assessed the percentage of body fat among junior volleyball players in Brazil.
The result indicated that the mean fat percentage of Brazilian junior (mean age=
18.1years) volleyball players were 16.4 %, + 3.7%. It was almost the same as the
Saudi Arabian volleyball players (Aouadi, Mohammed & Alanazi, 2015). A similar
study conducted by Muniz, et al. (2017). They pointed out that the mean skin folds
thickness of junior (mean age= 18.1years) male volleyball players for Biceps,
Triceps, sub scapular, Iliac crest, abdomen, Front thigh and calf were 5.2 mm,
+2.3mm, 10.9 mm, +3.3mm , 11.8 mm, +2.4mm, 13.4 mm, +4.8mm, 15.3mm,
+6.0mm, 12.9mm, +4.5mm and 9.4 mm, +3.3mm respectively. Their average is
around 12 mm. It's normal.
In the other study, Petroski, Fraro, Fidelix, Silva, Pires-Neto, Dourado, Rocha,
Stanganelli, Oncken and Viera (2013) calculated the body mass index of Brazilian
junior volleyball players. The mean body mass index of Brazilian junior national
volleyball players in 2002, 2003 and 2004 were 22.0, + 2.2, 22.1, +1.6 and 22.8 +1.8
respectively, they found out normal and almost constant body mass index through
consecutive the study years.
In Saudi Arabia, Aouadi, Mohammed and Alanazi, (2015) measured the fat traits of
junior volleyball players. According to them, the mean percentage of body fat among
Fifty two young (mean age: 15.45 ± 0.51years) volleyball players were 16.3 % ±
7.3%. It was a little bit above the normal body fat traits. The normal body fat
boundary was between 7 -13% (Kattouf, 2013). In India, Manna, Khanna and Dhara
(2012) reported the body fat percentage of 30 Indian (age 17.7+ 0.5) junior volleyball
players. They found that the average fat percentage of players were 13.8%. That was
exactly on the edges of the normal fat boundary.
In the other study, Petroski, Fraro, Fidelix, Silva, Pires-Neto, Dourado, Rocha,
Stanganelli, Oncken and Viera (2013) Analyzed the skin folds of Brazilian junior
national team volleyball players. The result showed that the mean skin folds, score of
31
Triceps, sub scapular, supra Iliad, abdomen and calves was 7.9mm, +1.3mm, 9.0 mm,
+1.4mm, 11.4mm,+3.5mm,10.7mm, +2.9mm and 7.3mm, +1.7mm respectively. The
sum of this five skin folds were 46.2 mm, +8.5 mm. The data shows, there is uneven
distribution of fat in our body.
The other study, made by Aytek (2007) examined the body mass index (BMI) of
junior volleyball players in Turkish. The outcome of the study indicated that the mean
body mass index (BMI) of junior volleyball players in Turkish (n=20) were 20.72, +
2.14 or 7.49%, + 2.69. It is the least of all in fat percentage. The normal body mass
index a player is between 18.5 and 24.9 (Ventures, 2017; Cespedes, 2017). The
author concludes that the percentage of body fat of Turkish Volleyball players was
similar to world class junior volleyball players all over the world.
In England also , Duncan, Wood field and al- Nakeeb (2006) study the fat percentage
of junior volleyball nation team players, the result indicated that the mean percentage
of body fat of junior volleyball players were between 11.5-12.9 %. It was more
normal and acceptable. The normal percentage of junior volleyball players were
between 6 % and 13 % (Cespedes, 2017).
Generally, in relation to junior men's volleyball players, researchers have emphasized
for stature / height, weight and percentage of body fat. The numbers of body
dimensions examined have been very limited, being restricted in height, weight and
body fat content. Lengths of extremities, girth and breadth of hands, legs and trunk
have been ignored. . There is no definite answer to the question what the girth, length
and breadth of junior volleyball players should be like? , These questions were not
studied yet. Besides, there were no study has compared the anthropometric
characteristics of Ethiopian junior volleyball players with international counterparts.
Hence, one of the objectives of this study was to compare the anthropometric
characteristics of junior volleyball players in West Gojjam, Ethiopia with
international counterparts.
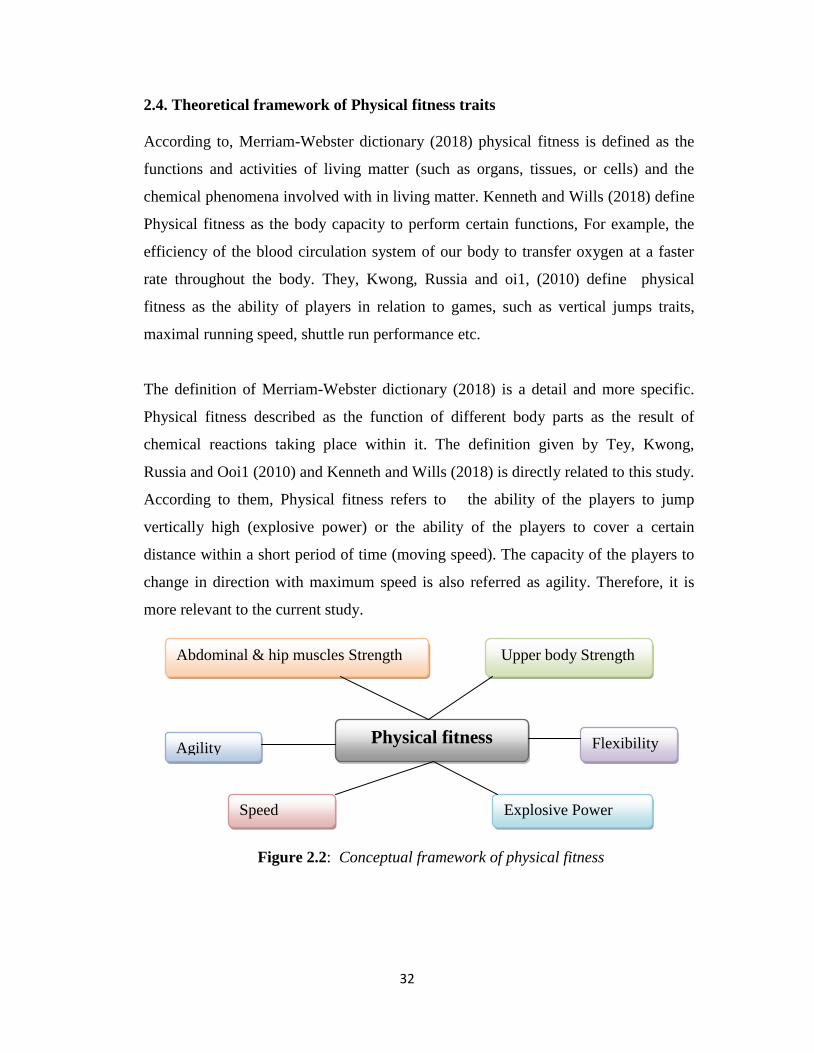
32
2.4. Theoretical framework of Physical fitness traits
According to, Merriam-Webster dictionary (2018) physical fitness is defined as the
functions and activities of living matter (such as organs, tissues, or cells) and the
chemical phenomena involved with in living matter. Kenneth and Wills (2018) define
Physical fitness as the body capacity to perform certain functions, For example, the
efficiency of the blood circulation system of our body to transfer oxygen at a faster
rate throughout the body. They, Kwong, Russia and oi1, (2010) define physical
fitness as the ability of players in relation to games, such as vertical jumps traits,
maximal running speed, shuttle run performance etc.
The definition of Merriam-Webster dictionary (2018) is a detail and more specific.
Physical fitness described as the function of different body parts as the result of
chemical reactions taking place within it. The definition given by Tey, Kwong,
Russia and Ooi1 (2010) and Kenneth and Wills (2018) is directly related to this study.
According to them, Physical fitness refers to the ability of the players to jump
vertically high (explosive power) or the ability of the players to cover a certain
distance within a short period of time (moving speed). The capacity of the players to
change in direction with maximum speed is also referred as agility. Therefore, it is
more relevant to the current study.
Figure 2.2: Conceptual framework of physical fitness
Physical fitness Agility Flexibility
Abdominal & hip muscles Strength
Explosive Power Speed
Upper body Strength
33
2.5. Physical fitness traits of junior volleyball players
Physical capacity is an important element of success in many sports such as
volleyball and other sports (Elahe, Narges, Somayeh and Mahdieh, 2013). Volleyball
involves both aerobic and anaerobic energy systems and a special physical ability is
needed to perform it very well (Kalinski, Norkowski, Kerner & Tkaczuk, 2002).
Volleyball, like several other ball games, requires not only technical and tactical
skills, but also required better performance traits of fitness (Fattahi, Shamsabadi,
Kalani, Khalifeh & Ghofrani, 2014). Volleyball involves frequent, intense activities
such as jumping, diving, side movement and these activities are joined by short rest
periods throughout 60-120 minute games (Fattahi, Shamsabadi, Kalani, Khalifeh &
Ghofrani, 2014). It‟s the game illustrated by fast movement that needs relatively
maximum physical exertion (Stamm, 2007). Players „skill also influenced by their
physical fitness traits (Trajkovic, Milanovic, spores, Milic & Stankovic, 2012; Gale,
2007). That is why; it‟s the game of aerobic and anaerobic performance (Elahe,
Narges, Somayeh, & Mahdieh, 2013; Fitness health 101, 2018).
Dale (2017) reported that to be effective in volleyball, a player needs to demonstrate
a better Physical fitness traits. Particularly, Speed, agility, power, flexibility and
muscular strength is very critical. Successful volleyball player possesses greater
speed, upper and abdominal strength and flexibility of lower back and hamstring
muscles (Stamm, Veldre & Stamm, 2003). Jumping skills, speed and upper and
middle body muscle strength are necessary for successful blocking and spikeing
(Ana, Costa, Santosd, Figueiredo, & Joaobd, 2015; Dale, 2017; Gantois,
de Castro, Dantas, Cabral, Pinto & Joao, 2017; Pristine, 2014).
Volleyball serves and smashes result in very fast ball speed, so players also need to be
speedy to get to the right position and pass the ball (Dale, 2017). Without a better
agility the player cannot be the right place at the right time and cannot make dodge,
duck and dive movement to make successful plays. The volleyball net is 10 feet high,
34
so players also need leg power to be able to jump high enough to block and smash the
ball. Hitting the ball with plenty of heat requires upper body power. Squatting or
lunging down low to return volleyball requires limbs flexibility (Wood, 2010).
Volleyball matches are usually played to the best of 21 points and takes some time.
To play continuously with full energy, muscle strength is very useful. The strength of
the arms is favorable for spiking and serving. The power of the lower extremities is
also critical to jumping in volleyball (LA84, foundation, 2012; Wood.2010; Gabbett
& Georgieff, 2007; Zhang, 2006; Scates &Linn, 2003).
From the reviewed literature, it‟s simple to understand the effect of better fitness traits
on volleyball performance. Particularly, the influence of the flexibility of lower back
and hamstring muscles, strength of upper, abdominal and hip muscles, speed, agility
and power of lower extremes. Few studies have been undertaken to determine
physical fitness traits of junior volleyball players. In this particular study, flexibility,
muscular strength, speed, agility and explosive power of junior volleyball players has
been reviewed.
2.5.1. Flexibility of junior volleyball players
Flexibility is the capacity of players to move the body and its parts from side to side
and in a wide range of motion without neuromuscular tension (Shuchi, Drogemuller,
Kleinschmidt, 2012). Flexibility of certain joints does not essentially point to
flexibility in other joints and there is no universal flexibility test for total body. That
means, flexibility is specific for a given joint and to a particular sport.
In volleyball, lower back and hamstring muscles flexibility is essential to execute the
required skills successfully (Erica, Johnson, James & Thomas, 2010; Kim & Jung,
2016). It can easily accessed by direct the use of sit-and-reach test (López-Miñarro ,
Andújar, García & Toro, 2007; Mermier et al., 2000; Grant et al., 2001; Nelson &
Bandy, 2004; Bradley & Portas, 2007). Better performance traits of sit and reach test
increased physical efficiency, overall performance, blood supply and nutrients to the
35
joints and neuromuscular structures. Particularly, Static flexibility is important to
decrease risk of injury during the game and decrease risk of low-back pain. Dynamic
flexibility in its part has a great role in the efficient exchange of nutrient, to keep
muscular balance and posture (Dominique & Gummelt, 2015; Knudson, Magnusson
& McHugh2000). That is why, it‟s become the key physical fitness component and
the part of all conditioning programs in many sports including volleyball (Bradley &
Portas, 2007; Nelson & Bandy, 2004; Chandler, 2000; Kirkendall, 2000).
Volleyball players require to perform vigorous activities including, starting, stopping,
changing direction and diving movements, all this requires high to an optimum traits
of flexibility (Fattahi, Shamsabadi, Kalani, Khalifeh & Ghofrani, 2014; Dale, 2017;
Fitness health 101, 2018). Players have to move suddenly in forward direction,
sideways or downward directions, so flexibility of the body, particularly, flexibility of
lower back and hamstring muscles is very importance to increase the range of
movement from the joints, to play the game in a good manner, to reduce risk of
injuries and to decrease recovery time (Fischer, 2004; Dale, 2017). Additionally,
lower back and hamstring flexibility in very essential for volleyball players to execute
the required skills successfully (Hamilton, 2018; Kim & Jean, 2016; Erica, Johnson,
James & Thomas, 2010; Buschbacher, Prahlow & Dave, 2009; Arnheim, 2005).
There are limited studies have been undertaken to compare the flexibility traits of
junior volleyball players According to, Duncan, Woodsfield and al-Nakeeb, (2006)
The sit and reach test score of England setter, hitters, central and opposites were
26.1cm, + 6.9cm, 37cm, +10.7cm, 34.5cm,+ 9.4cm and 19.3cm,+8.3cm respectively
The figure indicates that their mean sit and reach score of players were about
29.23cm. This is a good traits of performance (Canadian society for exercise
physiology, 1998). Similarly, the other standard set by Elizabeth Quinn (2018) also
confirmed this sit and reach score was taken as good or above average performance.
In the other study, Silva, Petroski and Gaya (2013) reported the flexibility of lower
back and hamstring muscles of junior volleyball players. The result indicates that the
36
average sit and reach test score of players was 25.5cm, + 01 cm. That is at a medium
traits of performance in normative standards. In contrast, the sit and reach test score
of junior volleyball players reported by Sameer Kumar Yadav (2015) was 19.07
3.77cm. This is below average or poor performance traits when compared with the
age matched standards (Elizabeth Quinn, 2018; Canadian society for exercise
physiology, 1998).
The traits difference of performance in sits and reach test score depends on various
factors. The nature of the joints, the types of muscle fiber possessed by the players
and the characteristic of their tendons and ligaments determines the flexibility traits of
lower back and hamstring muscles. Additionally, the intensity and the nature of
training given to the players determine the sit and reach the performance traits of the
players at great extent (Horst, 2017).
2.5.2. Upper body, abdominal and hip muscle strength of junior volleyball
players
Muscular strength refers to the ability to perform a specific muscular action against
resistance and it‟s directly related to the cross-sectional area (girth) of the skeletal
muscle of the players (Suchomel, Memphis & Stone, 2016; Jones, Bishop, Woods, &
Green, 2008; Siff, 2001). Skeletal muscle is an organ that produces movement of an
organism by contractions and relaxation (WAN, 2008).
The volleyball sport demands repetitive movement of the upper and middle muscle
groups. Upper and middle body muscle strength is required to perform jump serve,
dig and spike and to demonstrate aggressive blocking in volleyball (LA84 foundation,
2012) .Arm and shoulder girdle strength is important in offensive, defensive and in
minimizing mistakes in basic skills of volleyball (Zhang, Y 2010).
Abdominal and hip muscle strength also played an important role for explosive
jumping and powerful hitting in volleyball. It provides the muscular link between the
upper and lower body and by this means assists force Summation (Hughes, 2014) Its
37
assessment has been considered in volleyball due to the movements of explosive
characteristics (Hespanhol, Neto, de Arruda & Dini, 2007). Overall Muscular
strength is a key predictor for successful volleyball performance (Mermier, Janot,
Parker & Swan, 2000, Singh, Chengappa & Banerjee, 2011; Ben-Zaken, Meckel,
Lidor, Nemet & Alon, 2013).
The strength of the upper and middle body of junior volleyball players as not been
studied very well. Very few studies were undertaken to determine the strength traits
of junior volleyball players. In relation to this, Govind, Taware, Milind, and Bhutkar
(2013) measured the push up and sit up the performance traits of volleyball players
and compared the finding with the international norms. The mean push-up and sit up
performance scores of players was 28.9 and 38.8 repetitions respectively. The
researchers conclude that the push up performance exhibited by their players were
poor when compared with international norms. While, the set up the performance
traits of the players were average or fair to their age groups (Australian College of
Sport & Fitness 2013; Wood, 2017).
The upper body strength difference between players may happen because of the
strength of the shoulder muscles (anterior and medial deltoids), the Chest muscles
(pectorals) and back of the upper arm (triceps) of the players (Sifferman, 2017).
Research also indicates that the strength of the upper body is directly related to the
girth of the chest and shoulder muscle groups (Jones, Bishop, Woods, & Green,
2008).
In the other study, then sit up mean performance traits of the players were 39.86
repetitions as reported by, Ajoy Bag et al, (2015), which is also averagely performed
with reference to standard norms set by, Australian College of Sport & Fitness
(2013). Similarly, Rameshkannan and Chittibabu (2014) measured the set up the
performance of volleyball players and reported that the average set up performance of
the players were 39.10 repetitions. This is also average performance.
38
According to the normative standard set by the copper institute (2002) for male age
players age between 18-29 years, the push up score above 61 = super, 47-61=
Excellent, 37 to 46 = good, 29-36 = fair/average, 22-28 = Poor 4 -10.
The set up performance normative standards also set by, Wood,(2017) he adapted the
normative reference produced by Golding, et al. (1986).in this regard, Above 49 =
Excellent, 44 to 49 = good, 39 to 43= above average, 35 to 38= average, 31-34 =
below average, 25-30= poor and <25 = very Poor. The set up performance standards
set by Australian College of Sport & Fitness 2013, also the same as the above
standards. The strength endurance of middle body muscle groups can easily measure
by using sit up tests (Noguchi, Demura & Takahashi, 2013; Childs, et al., 2009).
There are a number of muscle groups around the hip and abdomen. These are rectus
abdominals, external Oblique‟s, internal Oblique‟s, transverse abdominals and hip
flexor muscles, including psoas major, illiacus, rectus femoris, pectins and Sartorius
(Elizabeth Quinn, 2018; Sifferman, 2017).
There are seven factors that determine the strength of the players, this includes, the
number of motor units involved the motor unit firing frequency, the amount of motor
unit synchronization, the use of the stretch shortening cycle, the degree of
neuromuscular reserve, the muscle fiber type, and the degree of muscle hypertrophy
(Bumper & Huff, 2009; Bourne, 2008).
According to Bumper and Huff (2009) the methods used to develop strength of player
can be categorized into seven. The first is Body Weight. Body weight resistance can
be used to increase strength because of the actions of gravity on the body. Some
examples are pushups, pull-ups, chin-ups, dips, and stair climbing. The second
method is Elastic Bands: When stretched, elastic bands create resistive forces. The
third is Weighted Objects. It involves medicine balls, kettle balls, and bags of sand.
Weight Stack Machines Is the fourth one and resistance is provided by the action of
gravity on the resistance. The fifth is a fluid resistance machine, where fluid
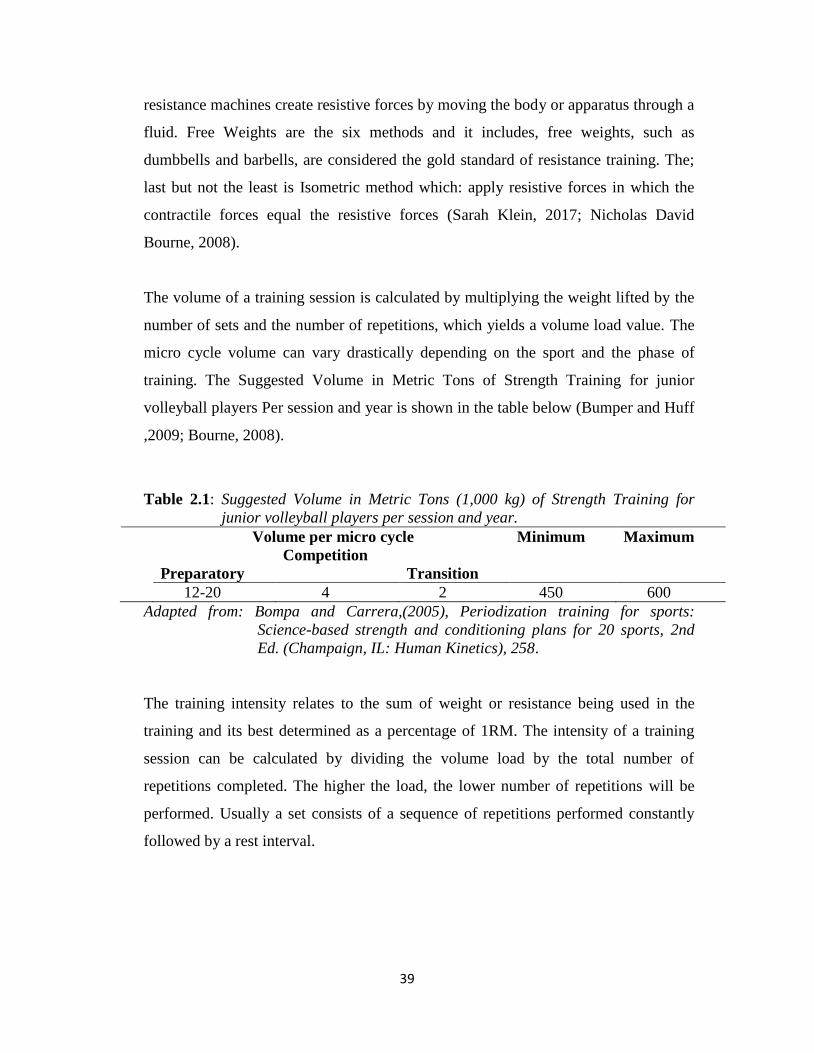
39
resistance machines create resistive forces by moving the body or apparatus through a
fluid. Free Weights are the six methods and it includes, free weights, such as
dumbbells and barbells, are considered the gold standard of resistance training. The;
last but not the least is Isometric method which: apply resistive forces in which the
contractile forces equal the resistive forces (Sarah Klein, 2017; Nicholas David
Bourne, 2008).
The volume of a training session is calculated by multiplying the weight lifted by the
number of sets and the number of repetitions, which yields a volume load value. The
micro cycle volume can vary drastically depending on the sport and the phase of
training. The Suggested Volume in Metric Tons of Strength Training for junior
volleyball players Per session and year is shown in the table below (Bumper and Huff
,2009; Bourne, 2008).
Table 2.1: Suggested Volume in Metric Tons (1,000 kg) of Strength Training for
junior volleyball players per session and year.
Volume per micro cycle Minimum Maximum
Preparatory
Competition
Transition
12-20 4 2 450 600
Adapted from: Bompa and Carrera,(2005), Periodization training for sports:
Science-based strength and conditioning plans for 20 sports, 2nd
Ed. (Champaign, IL: Human Kinetics), 258.
The training intensity relates to the sum of weight or resistance being used in the
training and its best determined as a percentage of 1RM. The intensity of a training
session can be calculated by dividing the volume load by the total number of
repetitions completed. The higher the load, the lower number of repetitions will be
performed. Usually a set consists of a sequence of repetitions performed constantly
followed by a rest interval.
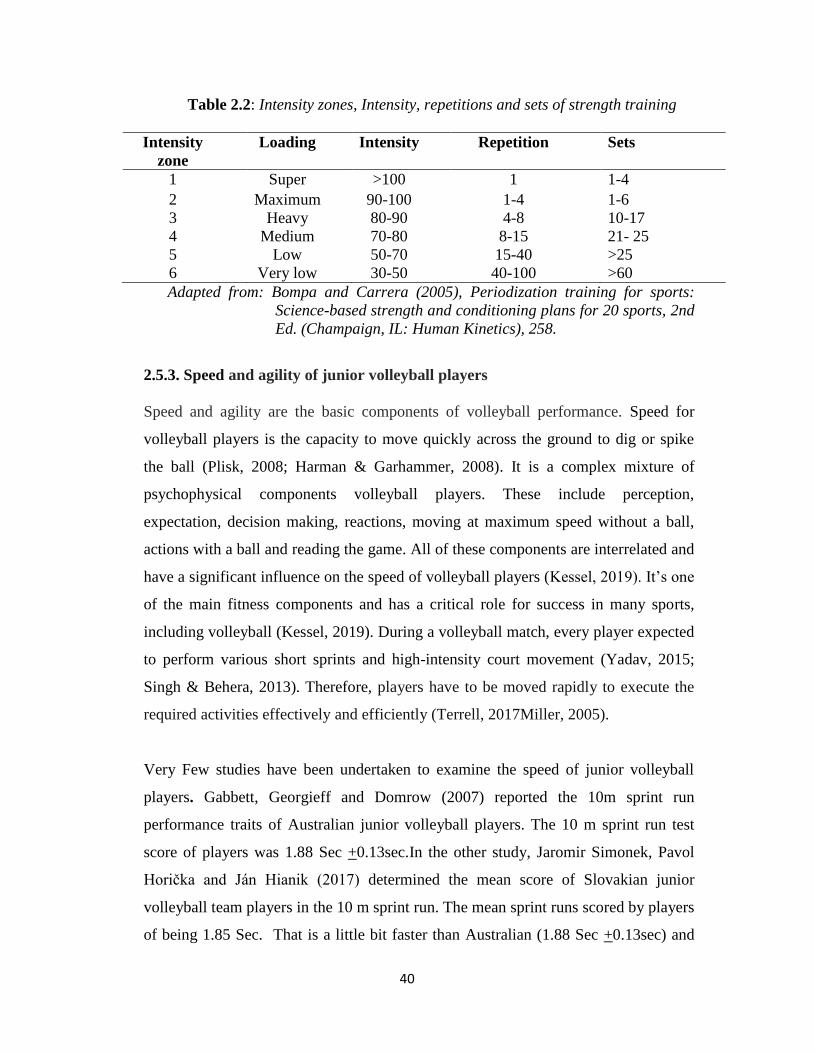
40
Table 2.2: Intensity zones, Intensity, repetitions and sets of strength training
Intensity
zone
Loading Intensity Repetition Sets
1 Super >100 1 1-4
2 Maximum 90-100 1-4 1-6
3 Heavy 80-90 4-8 10-17
4 Medium 70-80 8-15 21- 25
5 Low 50-70 15-40 >25
6 Very low 30-50 40-100 >60
Adapted from: Bompa and Carrera (2005), Periodization training for sports:
Science-based strength and conditioning plans for 20 sports, 2nd
Ed. (Champaign, IL: Human Kinetics), 258.
2.5.3. Speed and agility of junior volleyball players
Speed and agility are the basic components of volleyball performance. Speed for
volleyball players is the capacity to move quickly across the ground to dig or spike
the ball (Plisk, 2008; Harman & Garhammer, 2008). It is a complex mixture of
psychophysical components volleyball players. These include perception,
expectation, decision making, reactions, moving at maximum speed without a ball,
actions with a ball and reading the game. All of these components are interrelated and
have a significant influence on the speed of volleyball players (Kessel, 2019). It‟s one
of the main fitness components and has a critical role for success in many sports,
including volleyball (Kessel, 2019). During a volleyball match, every player expected
to perform various short sprints and high-intensity court movement (Yadav, 2015;
Singh & Behera, 2013). Therefore, players have to be moved rapidly to execute the
required activities effectively and efficiently (Terrell, 2017Miller, 2005).
Very Few studies have been undertaken to examine the speed of junior volleyball
players. Gabbett, Georgieff and Domrow (2007) reported the 10m sprint run
performance traits of Australian junior volleyball players. The 10 m sprint run test
score of players was 1.88 Sec +0.13sec.In the other study, Jaromir Simonek, Pavol
Horička and Ján Hianik (2017) determined the mean score of Slovakian junior
volleyball team players in the 10 m sprint run. The mean sprint runs scored by players
of being 1.85 Sec. That is a little bit faster than Australian (1.88 Sec +0.13sec) and
41
Serbian (1.92 + 0.02Sec.) counterparts, as reported by Gabbett, Georgieff and
Domrow (2007) and Nebojs, Trajkovic, Milanovic, Sporis, Milic and Stankovic
(2012) respectively. Based on the above findings, the average normative score of
junior volleyball players in the 10m sprint run is about for 1.88 Sec.
On the other hand, Volleyball games demand that the player has the capability to
accelerate quickly in every direction, this is what we call it agility (Miller, 2005;
Terrell, 2017). Agility is the ability to move your body quickly and efficiently into a
position of our choice (Dale, 2017). Volleyball games is characterized by high speed
actions and players should take fast decisions and perform sport-specific tasks
occurred during the game. Moreover, without better traits of speed and agility, it‟s not
possible to be getting into the right place at the right time and perform the required
skill properly in volleyball. , Players often have to move, bend and dive to make
successful plays and the better their agility, the better they will be able to do this.
In relation to agility test scores of the junior volleyball player, Very Few studies have
been undertaken to determine the agility performance of junior volleyball players.
The shuttle runs agility test score of Australian junior volleyball players was 10.49
Sec +0.96sec, as reported by Gabbett, Georgieff and Domrow (2007). This is better
performance with reference to normative standard set by Wood (2008). The agility T-
shuttle run sprint test score of junior volleyball players was 11.55 and 11.35 seconds,
as reported by Jatinder et al., (2017) and Akilana et al., (2014) respectively.
Sprinting ability of a player is affected by several physiological and performance
factors. These are the energy system, neuromuscular system, technical system and
fatigue. The body meets the energy demands of muscle under sprinting conditions by
(a) altering the enzymatic activity of specific energy-producing pathways, (b)
increasing the amount of energy stored within the muscle, and (c) Increasing the
muscles‟ ability to overcome the accumulation of fatigue-inducing metabolites.
Neuromuscular system involves, muscular composition, nerves and muscles Stretch
activities. The technical abilities like starts, acceleration and maximum velocity affect
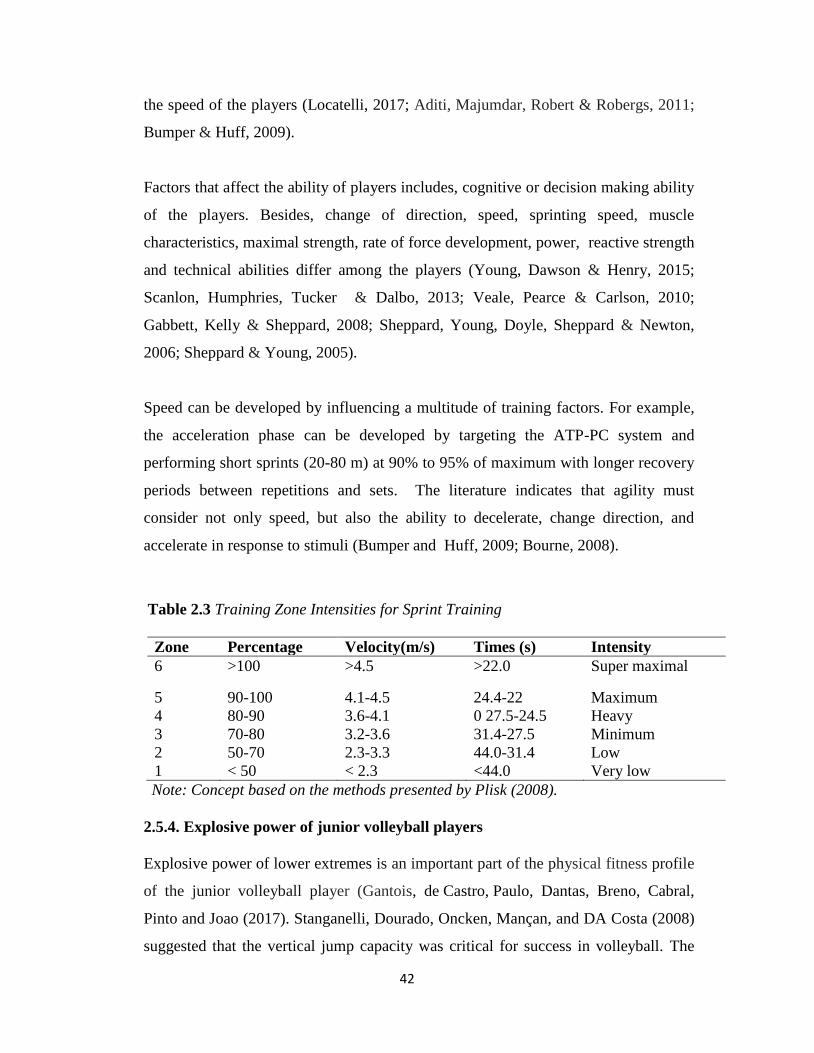
42
the speed of the players (Locatelli, 2017; Aditi, Majumdar, Robert & Robergs, 2011;
Bumper & Huff, 2009).
Factors that affect the ability of players includes, cognitive or decision making ability
of the players. Besides, change of direction, speed, sprinting speed, muscle
characteristics, maximal strength, rate of force development, power, reactive strength
and technical abilities differ among the players (Young, Dawson & Henry, 2015;
Scanlon, Humphries, Tucker & Dalbo, 2013; Veale, Pearce & Carlson, 2010;
Gabbett, Kelly & Sheppard, 2008; Sheppard, Young, Doyle, Sheppard & Newton,
2006; Sheppard & Young, 2005).
Speed can be developed by influencing a multitude of training factors. For example,
the acceleration phase can be developed by targeting the ATP-PC system and
performing short sprints (20-80 m) at 90% to 95% of maximum with longer recovery
periods between repetitions and sets. The literature indicates that agility must
consider not only speed, but also the ability to decelerate, change direction, and
accelerate in response to stimuli (Bumper and Huff, 2009; Bourne, 2008).
Table 2.3 Training Zone Intensities for Sprint Training
Zone Percentage Velocity(m/s) Times (s) Intensity
6 >100 >4.5 >22.0 Super maximal
5 90-100 4.1-4.5 24.4-22 Maximum
4 80-90 3.6-4.1 0 27.5-24.5 Heavy
3 70-80 3.2-3.6 31.4-27.5 Minimum
2 50-70 2.3-3.3 44.0-31.4 Low
1 < 50 < 2.3 <44.0 Very low
Note: Concept based on the methods presented by Plisk (2008).
2.5.4. Explosive power of junior volleyball players
Explosive power of lower extremes is an important part of the physical fitness profile
of the junior volleyball player (Gantois, de Castro, Paulo, Dantas, Breno, Cabral,
Pinto and Joao (2017). Stanganelli, Dourado, Oncken, Mançan, and DA Costa (2008)
suggested that the vertical jump capacity was critical for success in volleyball. The
43
vertical jump is a basic ability required in many sports including volleyball (Scott,
Briscoe, Craig, Murkowski, Samuel, & Saville, 2003). Vertical jump is common, very
vital and essential fitness quality for volleyball players and it‟s the key capabilities for
both attacking and blocking actions, (Singh & Behera, 2013; Sheppard et al., 2009)
Lower limb muscle power, expressed by the numerous jumps performed during
volleyball games, which are important for both attacking and blocking actions and
complicated part of this game (Singh & Behera, 2013; Sheppard et al., 2009, 2008,
2007).
Vertical jump is an essential part in performing spike and block as well as jumping
service skills in volleyball game (Gaurav, Singh & Sandeep, 2015). Players‟ excellent
performances are widely associated with efficiency of jumping or lower extremity
explosive power which lastly introduces a vertical jump as one of the most important
characteristics of physical performance in volleyball players (Zhang, 2010). Vertical
jump performance tests are one of the major criteria for volley ball players‟ power
capability (Engel, Zenhäusern, Colombani, Frey and Schack, 2001).
A few studies have been undertaken to determine the explosive power of junior
volleyball players. Duncan, Woodsfield and al-Nakeeb (2006) measured the vertical
jump performance of junior (Age = 16–19 years) volleyball players. Their finding
demonstrated that the vertical height of the central players (blockers) was higher than
the others. The vertical jump height of setters‟ hitters centers and opposites were:
(42.8 ± 8.1 cm), (49.0 ±5.7 cm), (47.2 ± 5.1 cm) and (42.0 ± 5.1 cm) respectively.
In the other study, Gabbett, Georgieff and Domrow (2007) used the vertical jump in
measuring power of lower extremities among junior male volleyball players in
Brisbane USA. The mean vertical jump value was 46.0 cm, +11.2cm. In the other
study, Duncan, Wood field and al-Nakeeb (2006) measured power of the lower
extremities of junior volleyball players in England. They point out that the mean
vertical jump performance of junior volleyball players was 42.0cm, + 49.0 cm. It is
44
almost the same as in the previous study conducted by Gabbett, Georgieff and
Domrow (2007).
Gabbett and Georgieff (2007) also measured Vertical jump performance of junior
(age 16 –19 years) novice, state and national team volleyball players. In their study,
they demonstrated that the mean vertical jump performance of novice, state and
national team volleyball players were 53.6 ± 1.1 cm, 65.8 ± 3.7 cm and 71.9 ± 2.9 cm
respectively. They concluded that junior national team players have got a better
explosive power than the state and novice junior volleyball players. This indicated
that the overall volleyball performance of volleyball players largely depended on
explosive power performance.
In the other study, Gaurav, Singh and Sandeep (2015) measured the vertical jump
performance of junior (age 18.35 ± 0.56) year volleyball players playing at different
position of play. The result shows that the vertical jump performance of blocker and
libros were 58.58cm, + 9.77cm and 50.83cm, + 4.06cm respectively. The researchers
conclude that blockers had better explosive leg power than their counterparts; it is
clear that higher jumping performance is more advantageous for blockers, spikes and
setters (Vuleta, Jerak & Sporis, 2016). From the literature and findings, the mean
normative score of junior volleyball players in relation to vertical jump was about
47.7 cm. There are factors which affect the vertical jump performance of players.
These include technical ability of players, their muscular strength and power
difference and their anthropometric characteristics (Al-Fadhli, Makki Ali, Fuad &
Saleeh, 2015; Aouadi, glide, Khalifa, Hermassi, Chelly, van den Tillaar, & Gabbet,
2012).
2.6. Theoretical frame for the relationship between anthropometric
characteristics and physical fitness traits of volleyball players
The international societies for advancement kin anthropometrics, ISAK, (2007)
classified anthropometric characteristics of players into five categories. The first
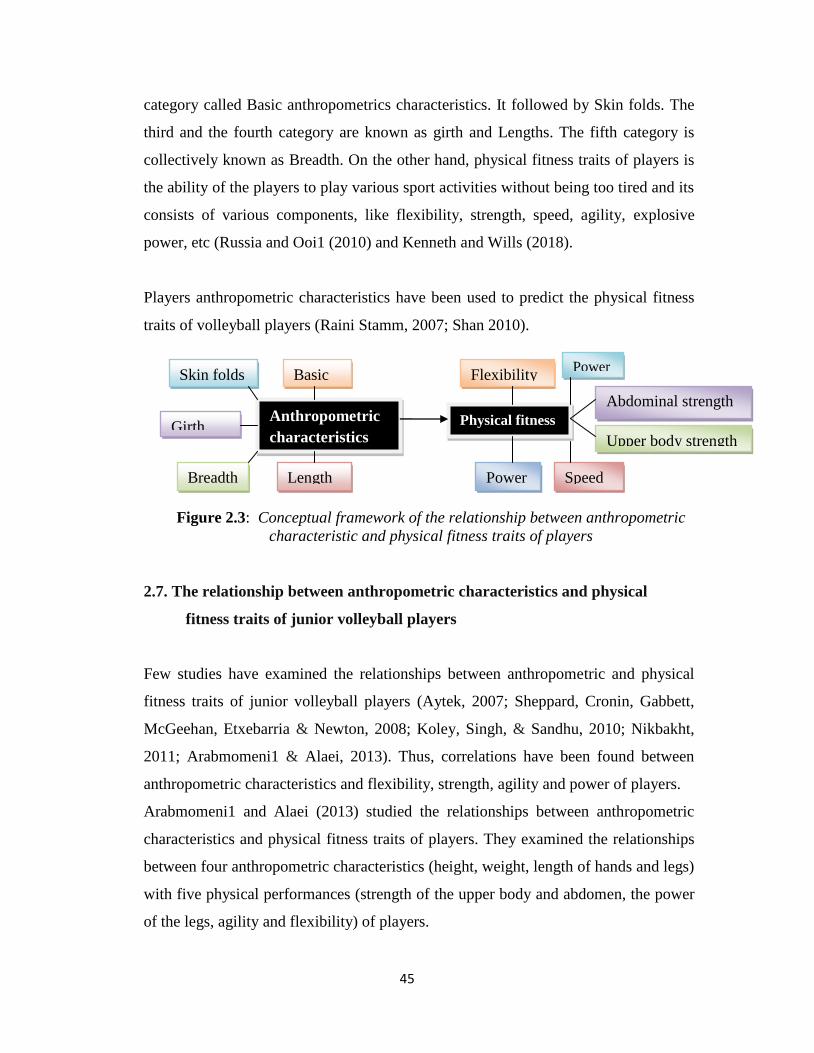
45
category called Basic anthropometrics characteristics. It followed by Skin folds. The
third and the fourth category are known as girth and Lengths. The fifth category is
collectively known as Breadth. On the other hand, physical fitness traits of players is
the ability of the players to play various sport activities without being too tired and its
consists of various components, like flexibility, strength, speed, agility, explosive
power, etc (Russia and Ooi1 (2010) and Kenneth and Wills (2018).
Players anthropometric characteristics have been used to predict the physical fitness
traits of volleyball players (Raini Stamm, 2007; Shan 2010).
Figure 2.3: Conceptual framework of the relationship between anthropometric
characteristic and physical fitness traits of players
2.7. The relationship between anthropometric characteristics and physical
fitness traits of junior volleyball players
Few studies have examined the relationships between anthropometric and physical
fitness traits of junior volleyball players (Aytek, 2007; Sheppard, Cronin, Gabbett,
McGeehan, Etxebarria & Newton, 2008; Koley, Singh, & Sandhu, 2010; Nikbakht,
2011; Arabmomeni1 & Alaei, 2013). Thus, correlations have been found between
anthropometric characteristics and flexibility, strength, agility and power of players.
Arabmomeni1 and Alaei (2013) studied the relationships between anthropometric
characteristics and physical fitness traits of players. They examined the relationships
between four anthropometric characteristics (height, weight, length of hands and legs)
with five physical performances (strength of the upper body and abdomen, the power
of the legs, agility and flexibility) of players.
Anthropometric
characteristics Physical fitness
Flexibility Power
Abdominal strength
Upper body strength
Power Speed
Skin folds
Girth
Breadth
Basic
Length
46
They report that there is a positive relationship between stature and upper, abdominal
and hip muscle strength, agility and lower body power of players (p<0.01).
Furthermore, there was a significant positive correlation between length of hands and
the strength of the upper body and power of lower extremities (p<0.05). Besides,
there was a highly positive relationship between length of legs and power of lower
extremities (p<0.01). Moreover, there was a significant correlation between stature
and upper body strength, agility and power of lower extremities There was a
negative correlation between weight and flexibility of lower back and hamstring
muscles (p<0.05).
Nikbakht (2011) studied the relationship between some anthropometric variables and
physical fitness performance traits of players. The research, focus up only few
anthropometric characteristics (body mass, percentage of fat) and physical
performance (power of legs and hand and speed). The result indicated that the
relationship between body weight and power of lower extremes was negative.
Similarly, the relationships between percentage of body fat, foot power and speed
were negative.
Kali, Singh and Sandhu (2010) studied the relationship between anthropometric
characteristics and physical fitness of volleyball players. The results indicated that
significant positive correlations were found with BMI (body mass index) and Weight,
Chest circumference, Hip girth., femur breadth, hummer breadth, Biceps skin folds,
Triceps skin fold, Sub scapular skin folds, Right hand grip strength, Left hand grip
strength, Basal metabolic rate, Water, Lower arm length, Arm circumference, Arm
muscle area, Upper arm area, Upper arm bone free muscle area and Upper arm Fat
area (p<. 001). Additionally, the result also shown that there was significant
negative correlations were found with percent body fat and stature, weight, femur
breadth, Hummer breadth, upper arm length, lower arm length, Total arm length, arm
circumference (p<. 05).
47
The other study, Białoskórska, Tomczyk, Tomczyk and Szafraniec (2016) also found
out similar finding the researches, tried their best to examine only the relationship
between percent body fat and BMI (body mass index) with the detail anthropometric
characteristic of players. They Indicated that there were significant negative
correlations between body fat and explosive power (p <. 001) and BMI (p < 05).
However, Sheppard, Cronin, Gabbett, McGeehan, Etxebarria and Newton (2008)
studied the relationship of volleyball performance, strength, power and
anthropometric variables with counter-movement vertical jump and spike jump.
Their finding revealed that there are Very strong correlations between spike reach
heights and bock reach heights. There was also moderate correlations (0.53–0.65; p >
0.01) were reported between the strength, vertical jump and relative spike jump.
Additionally Very strong correlations were observed between standing reach height
and spiking reach heights (0.85; p > 0.01) and blocking reach heights (0.93; p > 0.01).
Zhang (2010) investigated the relationship between anthropometry characteristic and
physical fitness performance of elite Chinese women volleyball players'. The
anthropometry variables that correlated with sit up the performance traits of players
were gluteus girth (r = - 0.240, p < 0.05), forearm girth (r = 0.160, p < 0.05), forearm
length (r = 0.230, p < 0.05) and ankle girth (r = 0.080, p < 0.05). These variables
determine the strength of the abdomen and hip muscles at about 19.8% and the
regression equation was 14.671-0.159 X1 + 0.251 X2 + 0.366 X3 + 0.042X4: where
x1: Gluteus Girth, x2: forearm girth, x3: forearm length and x4: ankle girth. The only
anthropometric variables which were significantly correlated with the agility of
female volleyball players was sub scapular skin fold (r = 0.288, p < 0.008). These
variables determine the strength of the abdomen and hip muscles only by 7.2 % and
the regression equation was 9.550-0.035Subscapular skin folds. There were three
variables which were significantly correlated with the explosive power of players.
These were standing reach height (r = - 0.17, p < 0.05), femur breadth (r = - 0.16, p <
0.05), and calf girth (r = - 0.12, p < 0.05), These variables determine the strength of
the abdomen and hip muscles at about 33.6% and the regression equation which
48
determine vertical jump performance traits of players was 253.63-1.547 X1 +5.538
X2-1.023 X where X1: standing reach height, x2: femur breadth and x3: calf girth.
Summery
Still, very few studies have been carried out on physical fitness traits of junior
volleyball players. This shows that researchers have not been given that much
emphasis for physical fitness traits of junior volleyball players. Moreover, it is clear
that no study conducted on the relationship between the anthropometric
characteristics and the physical fitness traits of junior volleyball players. Whether
some specific anthropometry characteristics would give to the increase of physical
fitness traits still needs to be revealed. Recently, scholars have shown more interests
in studying the relationship between anthropometric characteristics and physical
fitness traits so as to influence fitness traits of players.
49
CHAPTER 3
RESEARCH METHODS
3.1. Research Design
This study used cross-sectional research design and its correlation as well as
descriptive in nature. According to Gratton and Jones (2004) cross sectional research
design is used to compare many different variables at the same time with little or no
additional cost. In this study, the researcher compared anthropometric characteristics
and physical fitness traits of junior volleyball players in West Gojjam zone of
Ethiopia in relation to the international norm. Additionally, the relationship between
anthropometric characteristics and physical fitness traits of junior volleyball players
were examined and the most relevant anthropometric variables that used to predict
specific physical fitness traits of players were identified and establish standards that
used to identify talented players. .
3.2. Population and sampling techniques of the study
The target populations of the study were junior volleyball players found in the West
Gojjam zone of Ethiopia. There are three junior volleyball teams in the three Wereda
of the given zone. The Players, who completed under 17 youth volleyball projects in
2018 , organize themselves as a junior team and continued their training. Available
sampling or all the players who are regularly trained and free from injuries were
involved in the study. Totally, 54 junior male players involved in the study. 60
international players who participated in the world championships 2017 also part of
this study as a secondary data. .
3.3. Sources of data
Anthropometric and physical fitness primary data were directly collected from the
three junior volleyball team players in the West Gojjam zone of Ethiopia. Secondary
data also assessed from official websites, journals and books of international society.
50
3.4. Ethical Considerations
Before the test and measurement the researcher informed the purpose of the research
for experts in regional volleyball federation experts. Then the researcher, in
collaboration with experts of the federation had given awareness to the coaches and
volleyball players. Eventually, the players voluntarily were involved in the study and
informed written consent was taken from the players and coaches. .
3.5. Data gathering instrumentation
The anthropometric characteristics and physical fitness test of each volleyball player
are measured and tested by using International standard instruments and procedures.
Namely, International Standard for Advancement of Kin anthropometry (ISAK,
2009) procedure for anthropometric characteristics and standards and procedure set
by the Cooper Institute (2007) for physical fitness tests.
3.5.1. Data gathering instrument for anthropometric characteristics.
The international standard for advancement of the Kin anthropometry protocol
(ISAK) was taken to determine anthropometric characteristics. Around thirty four
(34) anthropometric measurements were taken from volleyball players by using the
procedure set by International standard for advancement of the Kin anthropometry
protocol (Marfell-Jones , Olds , Stewart , Cater (2006) shown in the table 3.2 below.
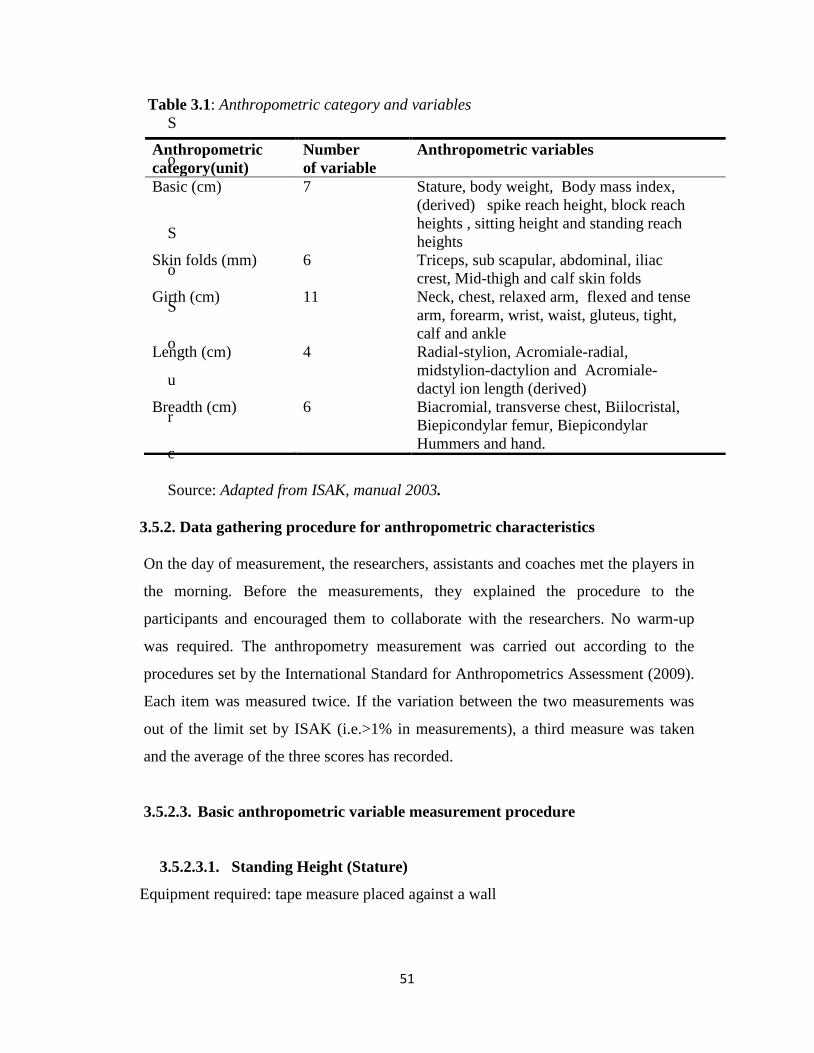
51
Table 3.1: Anthropometric category and variables
S
o
S
o
S
o
u
r
c
Source: Adapted from ISAK, manual 2003.
3.5.2. Data gathering procedure for anthropometric characteristics
On the day of measurement, the researchers, assistants and coaches met the players in
the morning. Before the measurements, they explained the procedure to the
participants and encouraged them to collaborate with the researchers. No warm-up
was required. The anthropometry measurement was carried out according to the
procedures set by the International Standard for Anthropometrics Assessment (2009).
Each item was measured twice. If the variation between the two measurements was
out of the limit set by ISAK (i.e.>1% in measurements), a third measure was taken
and the average of the three scores has recorded.
3.5.2.3. Basic anthropometric variable measurement procedure
3.5.2.3.1. Standing Height (Stature)
Equipment required: tape measure placed against a wall
Anthropometric
category(unit)
Number
of variable
Anthropometric variables
Basic (cm) 7 Stature, body weight, Body mass index,
(derived) spike reach height, block reach
heights , sitting height and standing reach
heights
Skin folds (mm) 6 Triceps, sub scapular, abdominal, iliac
crest, Mid-thigh and calf skin folds
Girth (cm) 11 Neck, chest, relaxed arm, flexed and tense
arm, forearm, wrist, waist, gluteus, tight,
calf and ankle
Length (cm) 4 Radial-stylion, Acromiale-radial,
midstylion-dactylion and Acromiale-
dactyl ion length (derived)
Breadth (cm) 6 Biacromial, transverse chest, Biilocristal,
Biepicondylar femur, Biepicondylar
Hummers and hand.
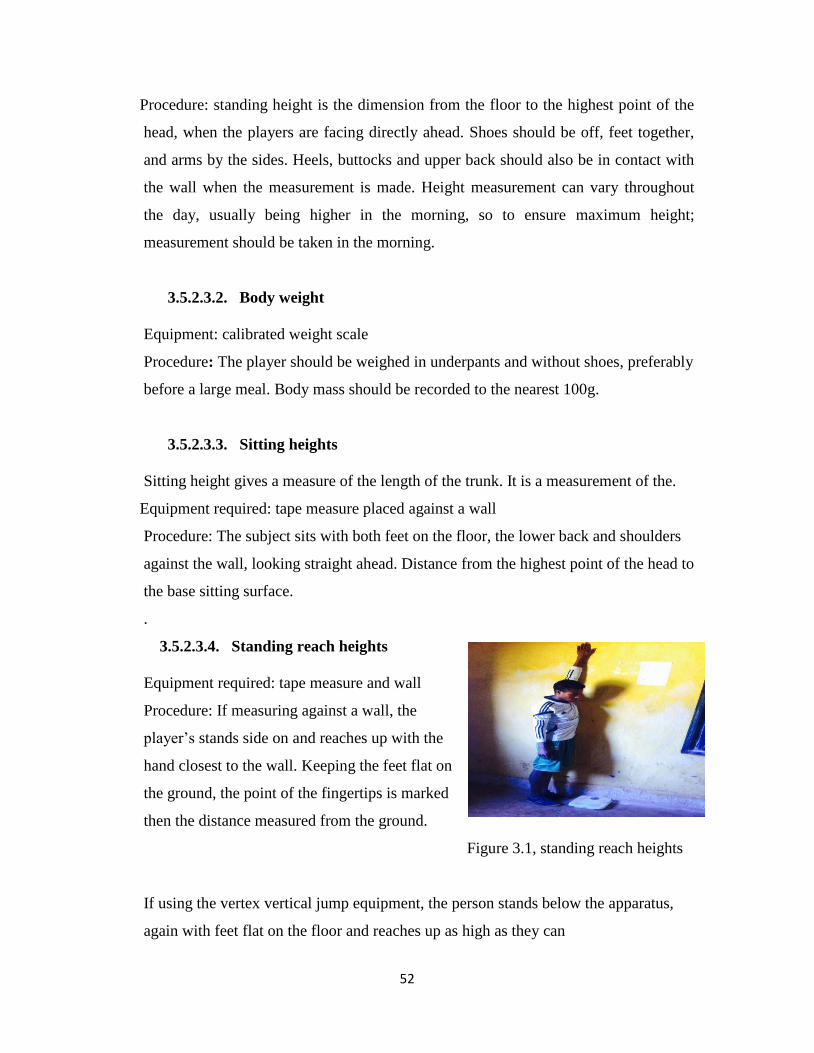
52
Procedure: standing height is the dimension from the floor to the highest point of the
head, when the players are facing directly ahead. Shoes should be off, feet together,
and arms by the sides. Heels, buttocks and upper back should also be in contact with
the wall when the measurement is made. Height measurement can vary throughout
the day, usually being higher in the morning, so to ensure maximum height;
measurement should be taken in the morning.
3.5.2.3.2. Body weight
Equipment: calibrated weight scale
Procedure: The player should be weighed in underpants and without shoes, preferably
before a large meal. Body mass should be recorded to the nearest 100g.
3.5.2.3.3. Sitting heights
Sitting height gives a measure of the length of the trunk. It is a measurement of the.
Equipment required: tape measure placed against a wall
Procedure: The subject sits with both feet on the floor, the lower back and shoulders
against the wall, looking straight ahead. Distance from the highest point of the head to
the base sitting surface.
.
3.5.2.3.4. Standing reach heights
Equipment required: tape measure and wall
Procedure: If measuring against a wall, the
player‟s stands side on and reaches up with the
hand closest to the wall. Keeping the feet flat on
the ground, the point of the fingertips is marked
then the distance measured from the ground.
Figure 3.1, standing reach heights
If using the vertex vertical jump equipment, the person stands below the apparatus,
again with feet flat on the floor and reaches up as high as they can
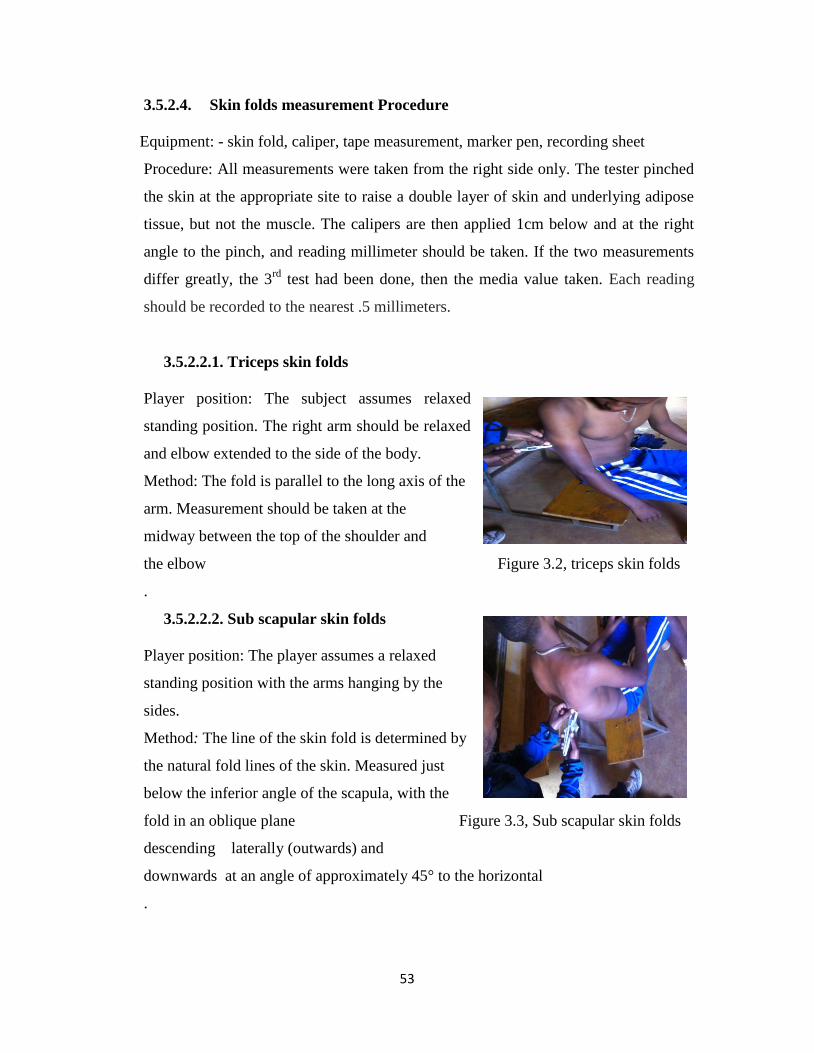
53
3.5.2.4. Skin folds measurement Procedure
Equipment: - skin fold, caliper, tape measurement, marker pen, recording sheet
Procedure: All measurements were taken from the right side only. The tester pinched
the skin at the appropriate site to raise a double layer of skin and underlying adipose
tissue, but not the muscle. The calipers are then applied 1cm below and at the right
angle to the pinch, and reading millimeter should be taken. If the two measurements
differ greatly, the 3rd
test had been done, then the media value taken. Each reading
should be recorded to the nearest .5 millimeters.
3.5.2.2.1. Triceps skin folds
Player position: The subject assumes relaxed
standing position. The right arm should be relaxed
and elbow extended to the side of the body.
Method: The fold is parallel to the long axis of the
arm. Measurement should be taken at the
midway between the top of the shoulder and
the elbow Figure 3.2, triceps skin folds
.
3.5.2.2.2. Sub scapular skin folds
Player position: The player assumes a relaxed
standing position with the arms hanging by the
sides.
Method: The line of the skin fold is determined by
the natural fold lines of the skin. Measured just
below the inferior angle of the scapula, with the
fold in an oblique plane Figure 3.3, Sub scapular skin folds
descending laterally (outwards) and
downwards at an angle of approximately 45° to the horizontal
.
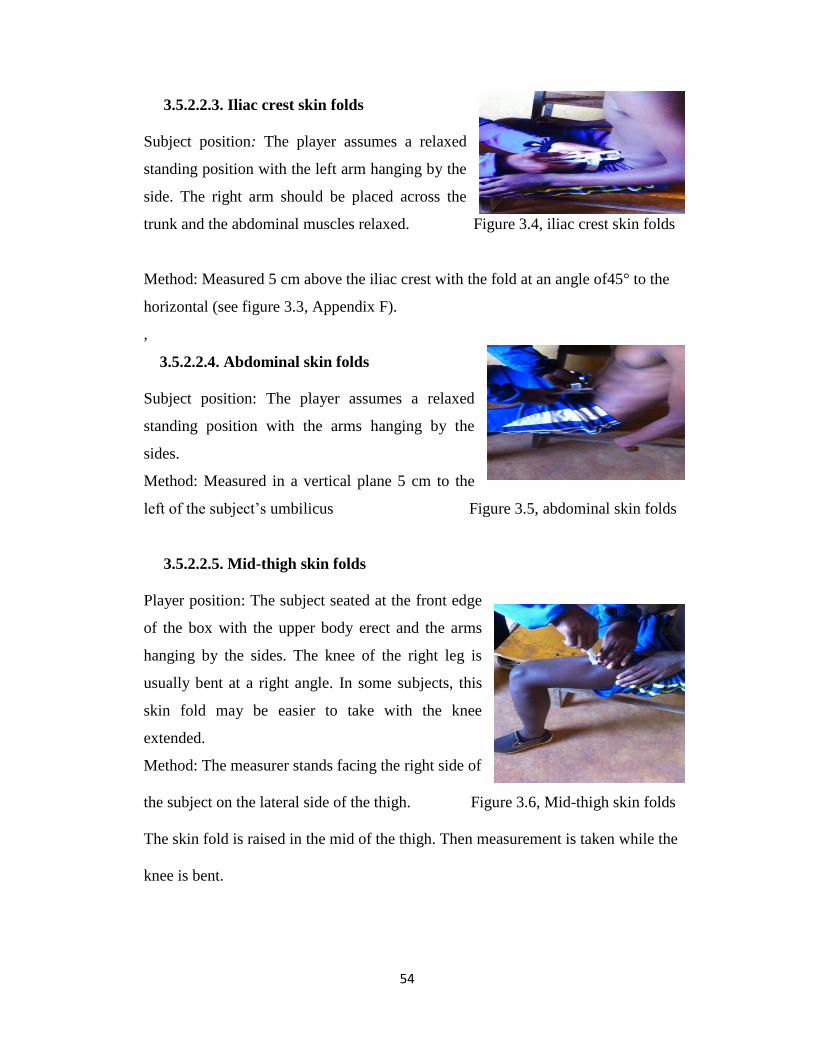
54
3.5.2.2.3. Iliac crest skin folds
Subject position: The player assumes a relaxed
standing position with the left arm hanging by the
side. The right arm should be placed across the
trunk and the abdominal muscles relaxed. Figure 3.4, iliac crest skin folds
Method: Measured 5 cm above the iliac crest with the fold at an angle of45° to the
horizontal (see figure 3.3, Appendix F).
,
3.5.2.2.4. Abdominal skin folds
Subject position: The player assumes a relaxed
standing position with the arms hanging by the
sides.
Method: Measured in a vertical plane 5 cm to the
left of the subject‟s umbilicus Figure 3.5, abdominal skin folds
3.5.2.2.5. Mid-thigh skin folds
Player position: The subject seated at the front edge
of the box with the upper body erect and the arms
hanging by the sides. The knee of the right leg is
usually bent at a right angle. In some subjects, this
skin fold may be easier to take with the knee
extended.
Method: The measurer stands facing the right side of
the subject on the lateral side of the thigh. Figure 3.6, Mid-thigh skin folds
The skin fold is raised in the mid of the thigh. Then measurement is taken while the
knee is bent.
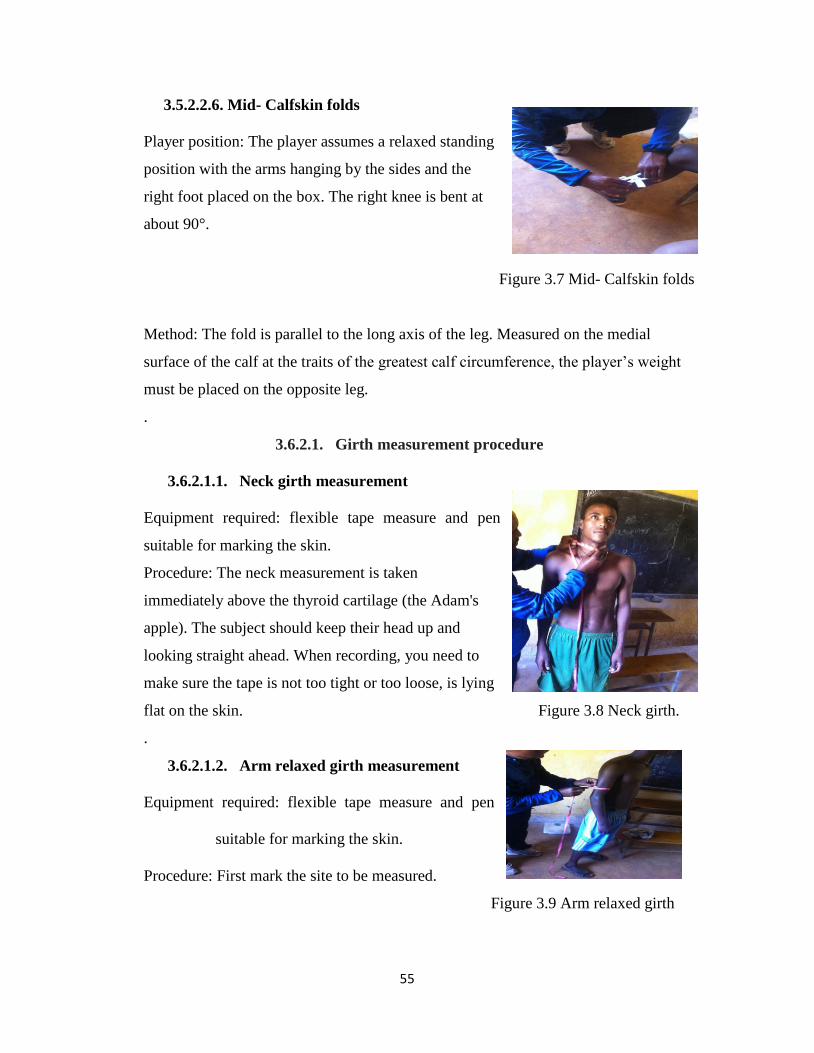
55
3.5.2.2.6. Mid- Calfskin folds
Player position: The player assumes a relaxed standing
position with the arms hanging by the sides and the
right foot placed on the box. The right knee is bent at
about 90°.
Figure 3.7 Mid- Calfskin folds
Method: The fold is parallel to the long axis of the leg. Measured on the medial
surface of the calf at the traits of the greatest calf circumference, the player‟s weight
must be placed on the opposite leg.
.
3.6.2.1. Girth measurement procedure
3.6.2.1.1. Neck girth measurement
Equipment required: flexible tape measure and pen
suitable for marking the skin.
Procedure: The neck measurement is taken
immediately above the thyroid cartilage (the Adam's
apple). The subject should keep their head up and
looking straight ahead. When recording, you need to
make sure the tape is not too tight or too loose, is lying
flat on the skin. Figure 3.8 Neck girth.
.
3.6.2.1.2. Arm relaxed girth measurement
Equipment required: flexible tape measure and pen
suitable for marking the skin.
Procedure: First mark the site to be measured.
Figure 3.9 Arm relaxed girth
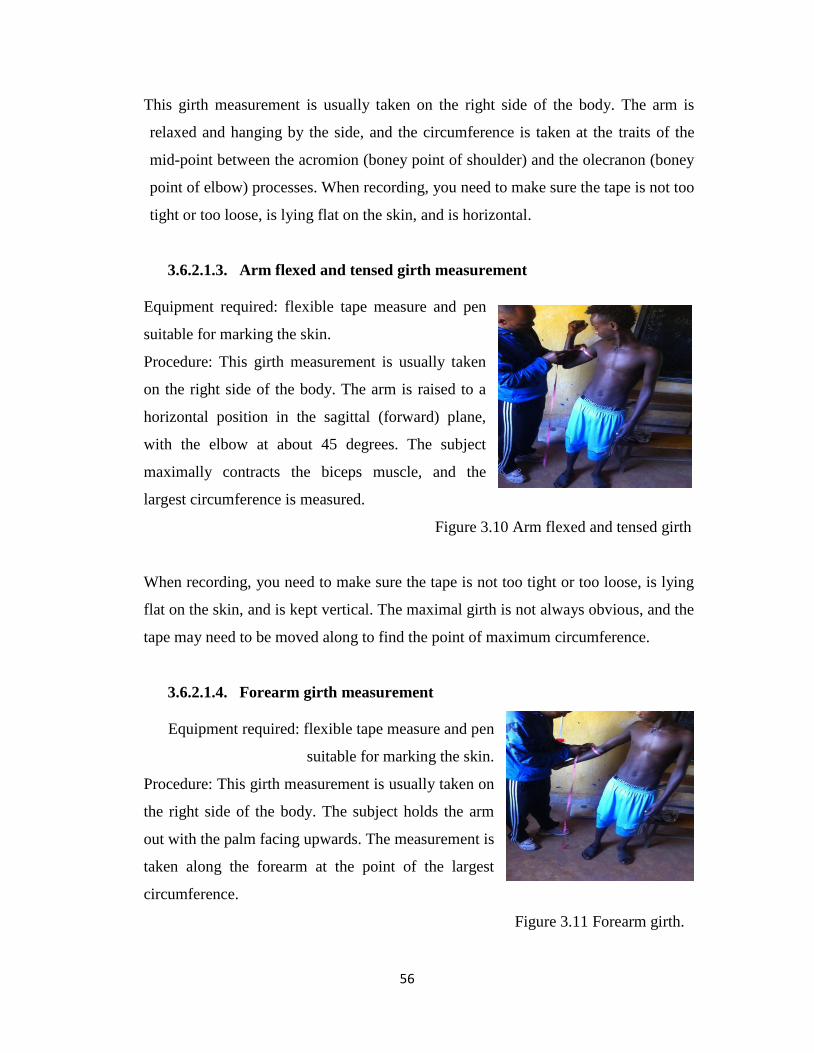
56
This girth measurement is usually taken on the right side of the body. The arm is
relaxed and hanging by the side, and the circumference is taken at the traits of the
mid-point between the acromion (boney point of shoulder) and the olecranon (boney
point of elbow) processes. When recording, you need to make sure the tape is not too
tight or too loose, is lying flat on the skin, and is horizontal.
3.6.2.1.3. Arm flexed and tensed girth measurement
Equipment required: flexible tape measure and pen
suitable for marking the skin.
Procedure: This girth measurement is usually taken
on the right side of the body. The arm is raised to a
horizontal position in the sagittal (forward) plane,
with the elbow at about 45 degrees. The subject
maximally contracts the biceps muscle, and the
largest circumference is measured.
Figure 3.10 Arm flexed and tensed girth
When recording, you need to make sure the tape is not too tight or too loose, is lying
flat on the skin, and is kept vertical. The maximal girth is not always obvious, and the
tape may need to be moved along to find the point of maximum circumference.
3.6.2.1.4. Forearm girth measurement
Equipment required: flexible tape measure and pen
suitable for marking the skin.
Procedure: This girth measurement is usually taken on
the right side of the body. The subject holds the arm
out with the palm facing upwards. The measurement is
taken along the forearm at the point of the largest
circumference.
Figure 3.11 Forearm girth.
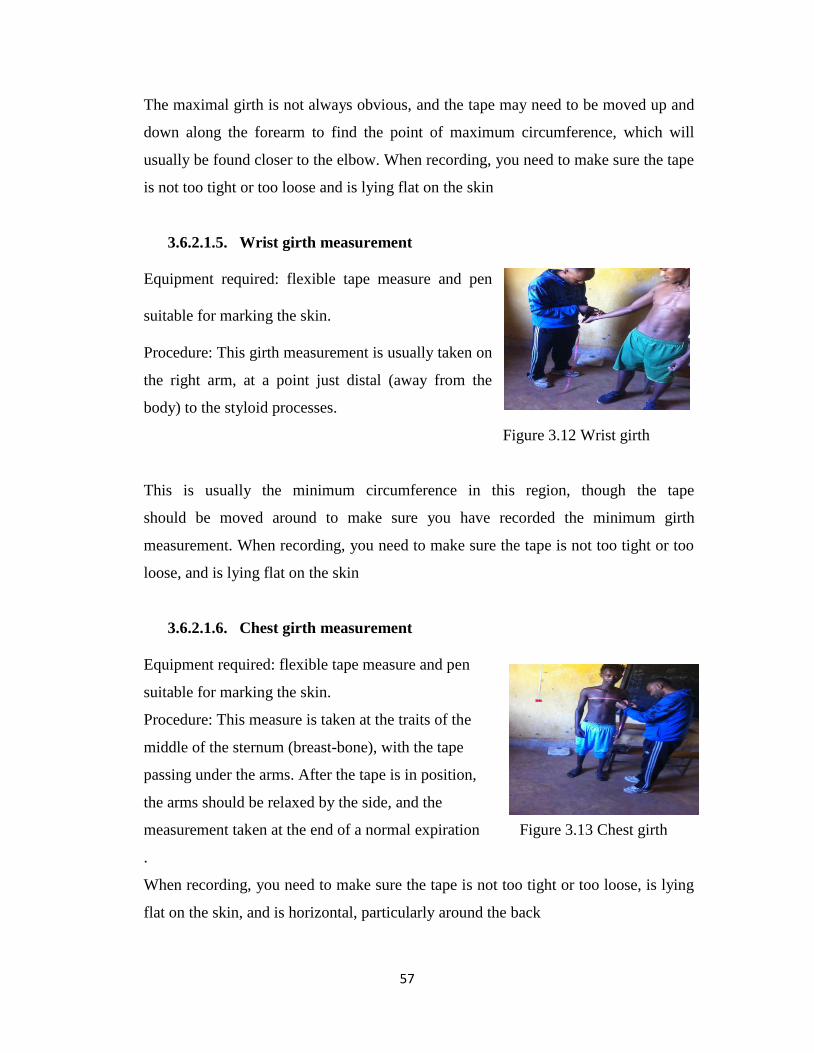
57
The maximal girth is not always obvious, and the tape may need to be moved up and
down along the forearm to find the point of maximum circumference, which will
usually be found closer to the elbow. When recording, you need to make sure the tape
is not too tight or too loose and is lying flat on the skin
3.6.2.1.5. Wrist girth measurement
Equipment required: flexible tape measure and pen
suitable for marking the skin.
Procedure: This girth measurement is usually taken on
the right arm, at a point just distal (away from the
body) to the styloid processes.
Figure 3.12 Wrist girth
This is usually the minimum circumference in this region, though the tape
should be moved around to make sure you have recorded the minimum girth
measurement. When recording, you need to make sure the tape is not too tight or too
loose, and is lying flat on the skin
3.6.2.1.6. Chest girth measurement
Equipment required: flexible tape measure and pen
suitable for marking the skin.
Procedure: This measure is taken at the traits of the
middle of the sternum (breast-bone), with the tape
passing under the arms. After the tape is in position,
the arms should be relaxed by the side, and the
measurement taken at the end of a normal expiration Figure 3.13 Chest girth
.
When recording, you need to make sure the tape is not too tight or too loose, is lying
flat on the skin, and is horizontal, particularly around the back
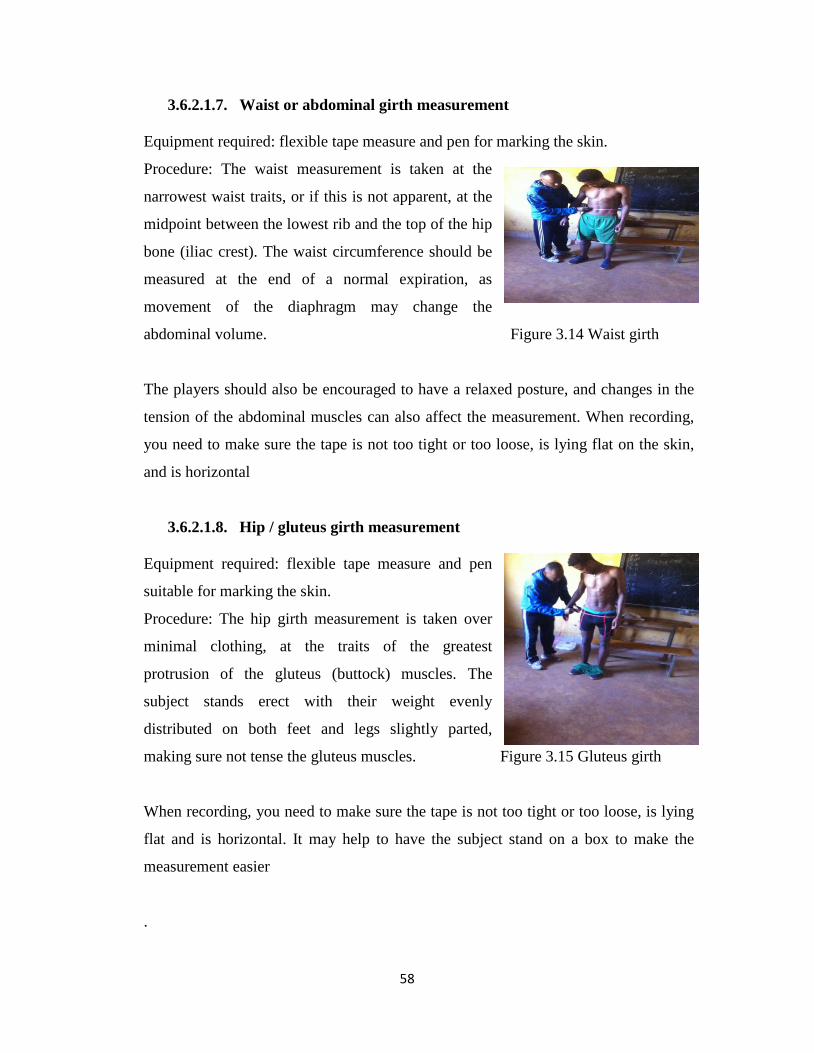
58
3.6.2.1.7. Waist or abdominal girth measurement
Equipment required: flexible tape measure and pen for marking the skin.
Procedure: The waist measurement is taken at the
narrowest waist traits, or if this is not apparent, at the
midpoint between the lowest rib and the top of the hip
bone (iliac crest). The waist circumference should be
measured at the end of a normal expiration, as
movement of the diaphragm may change the
abdominal volume. Figure 3.14 Waist girth
The players should also be encouraged to have a relaxed posture, and changes in the
tension of the abdominal muscles can also affect the measurement. When recording,
you need to make sure the tape is not too tight or too loose, is lying flat on the skin,
and is horizontal
3.6.2.1.8. Hip / gluteus girth measurement
Equipment required: flexible tape measure and pen
suitable for marking the skin.
Procedure: The hip girth measurement is taken over
minimal clothing, at the traits of the greatest
protrusion of the gluteus (buttock) muscles. The
subject stands erect with their weight evenly
distributed on both feet and legs slightly parted,
making sure not tense the gluteus muscles. Figure 3.15 Gluteus girth
When recording, you need to make sure the tape is not too tight or too loose, is lying
flat and is horizontal. It may help to have the subject stand on a box to make the
measurement easier
.
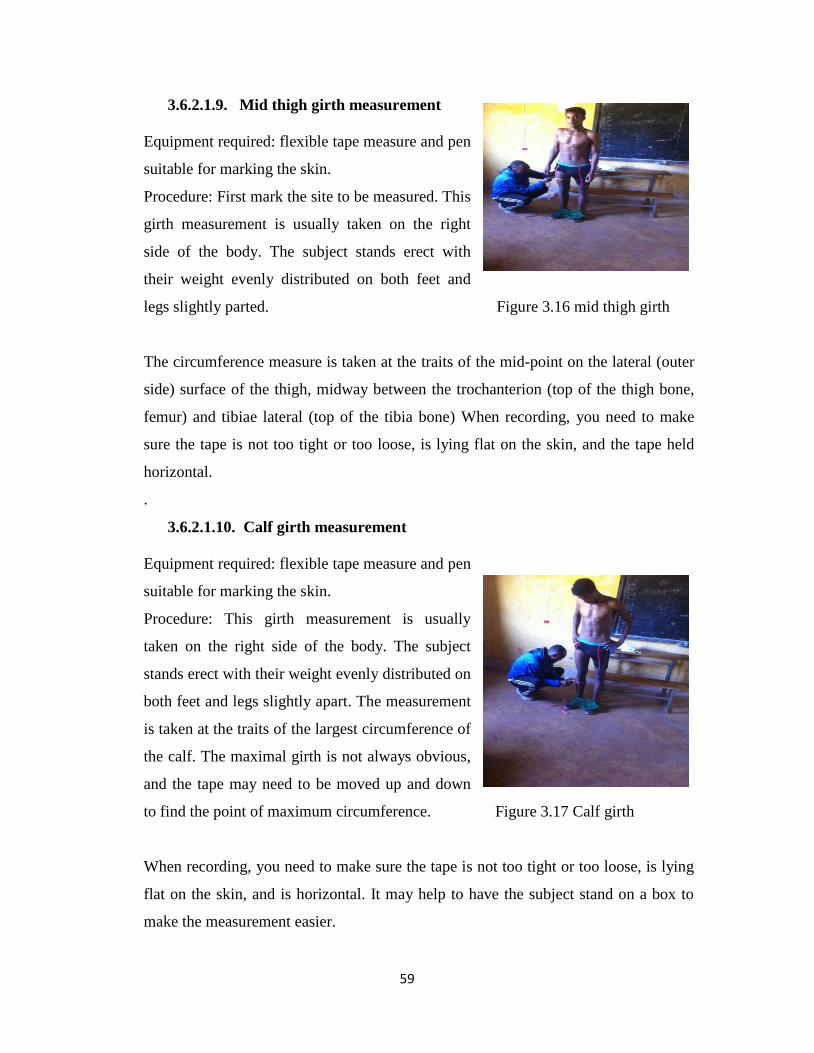
59
3.6.2.1.9. Mid thigh girth measurement
Equipment required: flexible tape measure and pen
suitable for marking the skin.
Procedure: First mark the site to be measured. This
girth measurement is usually taken on the right
side of the body. The subject stands erect with
their weight evenly distributed on both feet and
legs slightly parted. Figure 3.16 mid thigh girth
The circumference measure is taken at the traits of the mid-point on the lateral (outer
side) surface of the thigh, midway between the trochanterion (top of the thigh bone,
femur) and tibiae lateral (top of the tibia bone) When recording, you need to make
sure the tape is not too tight or too loose, is lying flat on the skin, and the tape held
horizontal.
.
3.6.2.1.10. Calf girth measurement
Equipment required: flexible tape measure and pen
suitable for marking the skin.
Procedure: This girth measurement is usually
taken on the right side of the body. The subject
stands erect with their weight evenly distributed on
both feet and legs slightly apart. The measurement
is taken at the traits of the largest circumference of
the calf. The maximal girth is not always obvious,
and the tape may need to be moved up and down
to find the point of maximum circumference. Figure 3.17 Calf girth
When recording, you need to make sure the tape is not too tight or too loose, is lying
flat on the skin, and is horizontal. It may help to have the subject stand on a box to
make the measurement easier.
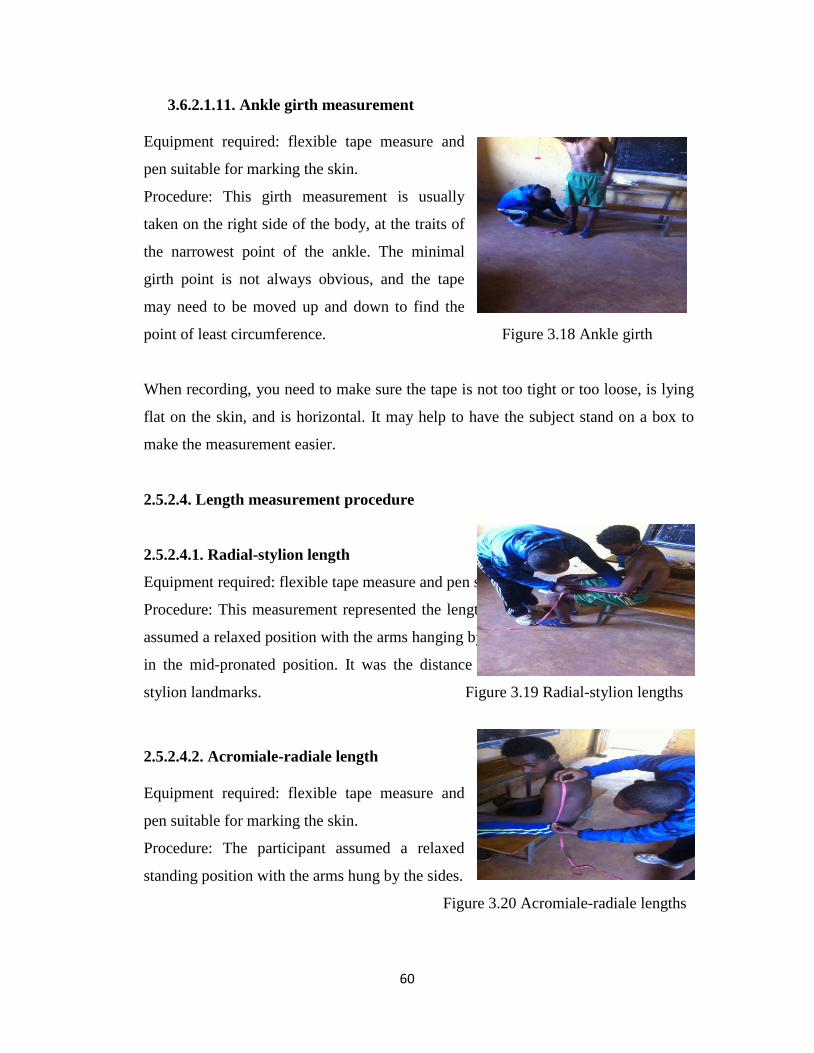
60
3.6.2.1.11. Ankle girth measurement
Equipment required: flexible tape measure and
pen suitable for marking the skin.
Procedure: This girth measurement is usually
taken on the right side of the body, at the traits of
the narrowest point of the ankle. The minimal
girth point is not always obvious, and the tape
may need to be moved up and down to find the
point of least circumference. Figure 3.18 Ankle girth
When recording, you need to make sure the tape is not too tight or too loose, is lying
flat on the skin, and is horizontal. It may help to have the subject stand on a box to
make the measurement easier.
2.5.2.4. Length measurement procedure
2.5.2.4.1. Radial-stylion length
Equipment required: flexible tape measure and pen suitable for marking the skin.
Procedure: This measurement represented the length of the forearm. The participant
assumed a relaxed position with the arms hanging by the sides. The right forearm was
in the mid-pronated position. It was the distance between the marked radiale and
stylion landmarks. Figure 3.19 Radial-stylion lengths
2.5.2.4.2. Acromiale-radiale length
Equipment required: flexible tape measure and
pen suitable for marking the skin.
Procedure: The participant assumed a relaxed
standing position with the arms hung by the sides.
Figure 3.20 Acromiale-radiale lengths
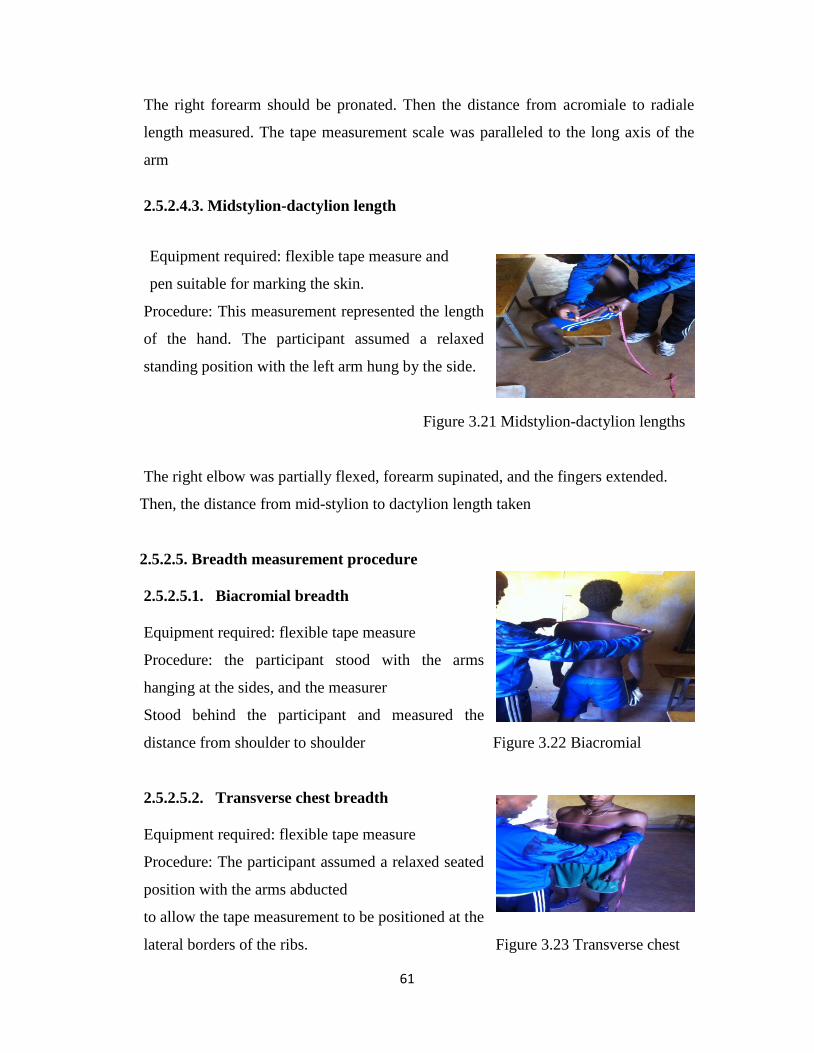
61
The right forearm should be pronated. Then the distance from acromiale to radiale
length measured. The tape measurement scale was paralleled to the long axis of the
arm
2.5.2.4.3. Midstylion-dactylion length
Equipment required: flexible tape measure and
pen suitable for marking the skin.
Procedure: This measurement represented the length
of the hand. The participant assumed a relaxed
standing position with the left arm hung by the side.
Figure 3.21 Midstylion-dactylion lengths
The right elbow was partially flexed, forearm supinated, and the fingers extended.
Then, the distance from mid-stylion to dactylion length taken
2.5.2.5. Breadth measurement procedure
2.5.2.5.1. Biacromial breadth
Equipment required: flexible tape measure
Procedure: the participant stood with the arms
hanging at the sides, and the measurer
Stood behind the participant and measured the
distance from shoulder to shoulder Figure 3.22 Biacromial
2.5.2.5.2. Transverse chest breadth
Equipment required: flexible tape measure
Procedure: The participant assumed a relaxed seated
position with the arms abducted
to allow the tape measurement to be positioned at the
lateral borders of the ribs. Figure 3.23 Transverse chest
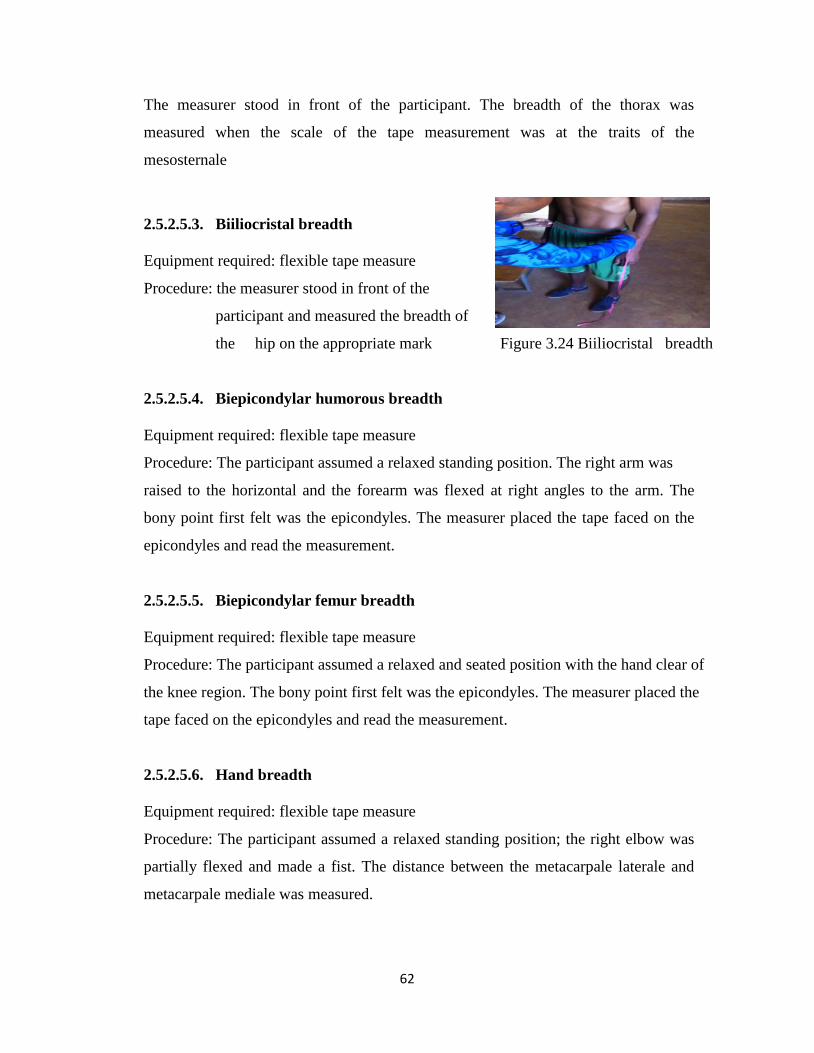
62
The measurer stood in front of the participant. The breadth of the thorax was
measured when the scale of the tape measurement was at the traits of the
mesosternale
2.5.2.5.3. Biiliocristal breadth
Equipment required: flexible tape measure
Procedure: the measurer stood in front of the
participant and measured the breadth of
the hip on the appropriate mark Figure 3.24 Biiliocristal breadth
2.5.2.5.4. Biepicondylar humorous breadth
Equipment required: flexible tape measure
Procedure: The participant assumed a relaxed standing position. The right arm was
raised to the horizontal and the forearm was flexed at right angles to the arm. The
bony point first felt was the epicondyles. The measurer placed the tape faced on the
epicondyles and read the measurement.
2.5.2.5.5. Biepicondylar femur breadth
Equipment required: flexible tape measure
Procedure: The participant assumed a relaxed and seated position with the hand clear of
the knee region. The bony point first felt was the epicondyles. The measurer placed the
tape faced on the epicondyles and read the measurement.
2.5.2.5.6. Hand breadth
Equipment required: flexible tape measure
Procedure: The participant assumed a relaxed standing position; the right elbow was
partially flexed and made a fist. The distance between the metacarpale laterale and
metacarpale mediale was measured.
63
3.6. Data gathering instrument and procedure for physical fitness test
3.6.1. Data gathering instrument for physical fitness
Six Physical fitness traits plus spike and block reach height of junior volleyball
players were tested by using the standard procedure set by the Cooper Institute
(2007). The detail is shown in table below 3.2.
Table 3.2 selected physical fitness components, testing methods and purpose
2
.
5
2
3.6.2 Data gathering procedure for physical fitness tests
According to the procedure set by Cooper Institute, 2007, each and every physical
fitness test has got different procedure.
3.6.2.1. Flexibility testing procedure
In volleyball, the players have to move suddenly in the forward direction, sideways or
downward directions, so the flexibility of hip and back is important. So, the
researchers decided to go to sit and reach test.
Equipment: A mat and a ruler
Fitness
component
Name of tests Purpose of the test
1.Flexibility
(cm)
Sit and reach test To test the flexibility of hip and back
flexion & extension of the hamstring
muscles
2.Upper body
Strength
(rep.)
Push-up test To test the strength of the upper body
muscle group
3.Abdominal
Strength
(rep.)
Sit-up test To test the strength of the abdominal
and hip muscle groups.
4.Explosive
Power
(cm)
Vertical jump
test
To test the explosive power of lower
extremities, plus spiking and blocking
height of volleyball ball players.
5.Agility(sec.) T-shuttle run To test the agility of the body
6. Speed(sec.) 10 m sprint run To test the speed of volleyball players
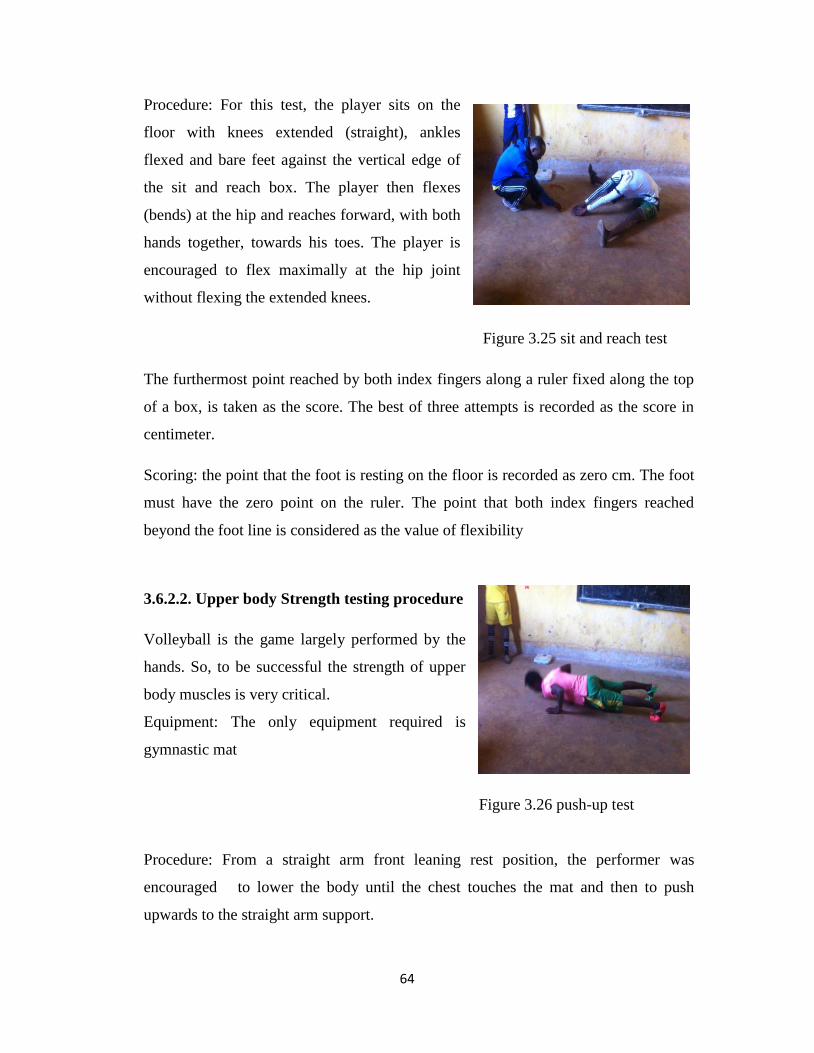
64
Procedure: For this test, the player sits on the
floor with knees extended (straight), ankles
flexed and bare feet against the vertical edge of
the sit and reach box. The player then flexes
(bends) at the hip and reaches forward, with both
hands together, towards his toes. The player is
encouraged to flex maximally at the hip joint
without flexing the extended knees.
Figure 3.25 sit and reach test
The furthermost point reached by both index fingers along a ruler fixed along the top
of a box, is taken as the score. The best of three attempts is recorded as the score in
centimeter.
Scoring: the point that the foot is resting on the floor is recorded as zero cm. The foot
must have the zero point on the ruler. The point that both index fingers reached
beyond the foot line is considered as the value of flexibility
3.6.2.2. Upper body Strength testing procedure
Volleyball is the game largely performed by the
hands. So, to be successful the strength of upper
body muscles is very critical.
Equipment: The only equipment required is
gymnastic mat
Figure 3.26 push-up test
Procedure: From a straight arm front leaning rest position, the performer was
encouraged to lower the body until the chest touches the mat and then to push
upwards to the straight arm support.
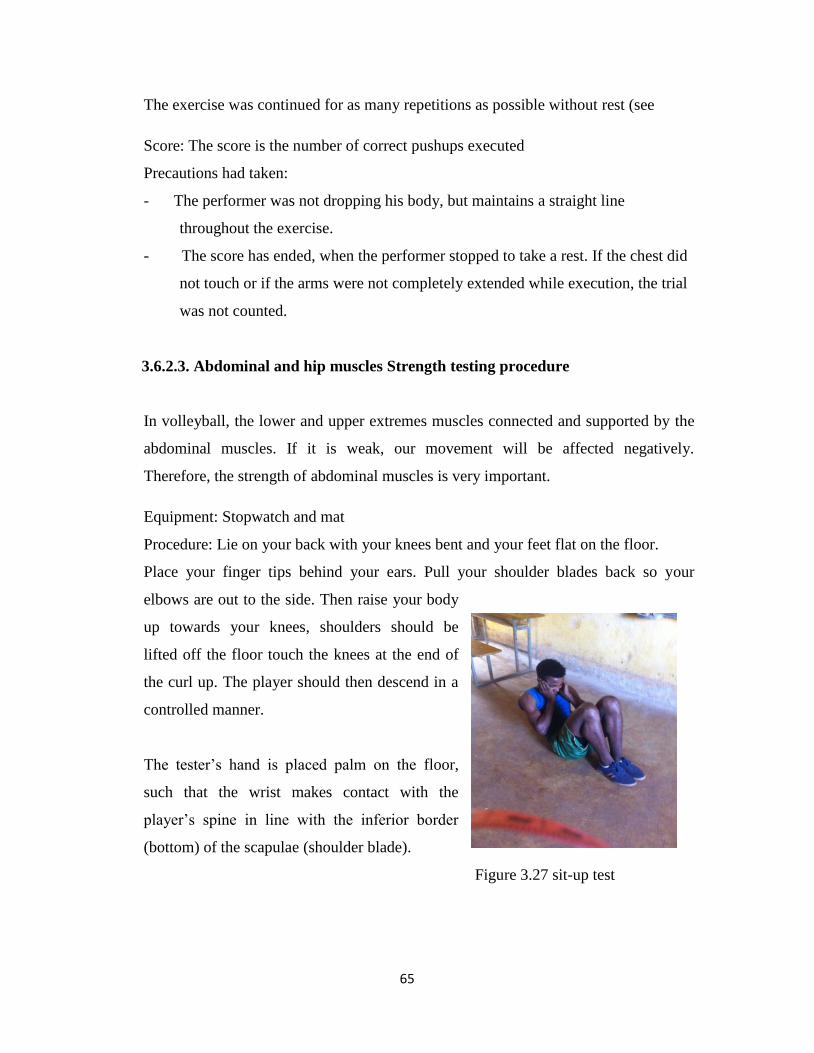
65
The exercise was continued for as many repetitions as possible without rest (see
Score: The score is the number of correct pushups executed
Precautions had taken:
- The performer was not dropping his body, but maintains a straight line
throughout the exercise.
- The score has ended, when the performer stopped to take a rest. If the chest did
not touch or if the arms were not completely extended while execution, the trial
was not counted.
3.6.2.3. Abdominal and hip muscles Strength testing procedure
In volleyball, the lower and upper extremes muscles connected and supported by the
abdominal muscles. If it is weak, our movement will be affected negatively.
Therefore, the strength of abdominal muscles is very important.
Equipment: Stopwatch and mat
Procedure: Lie on your back with your knees bent and your feet flat on the floor.
Place your finger tips behind your ears. Pull your shoulder blades back so your
elbows are out to the side. Then raise your body
up towards your knees, shoulders should be
lifted off the floor touch the knees at the end of
the curl up. The player should then descend in a
controlled manner.
The tester‟s hand is placed palm on the floor,
such that the wrist makes contact with the
player‟s spine in line with the inferior border
(bottom) of the scapulae (shoulder blade).
Figure 3.27 sit-up test
66
If the hands are taken off the ears, the elbows do not touch the knees, or the back does
not touch the tester‟s hand, the sit-up is not counted.
Scoring: Players complete setups for 1 minute. The player may rest within the 1
minute period as desired. The time is not paused during a rest. The subject was
motivated to repeat the exercise as many times as possible.
3.6.2.4. Speed testing procedure
Equipment required: measuring tape, stopwatch, cone markers, flat and clear surface
of 20 meters.
Procedure: The test involves running a single maximum sprint over 10 meters, with
the time recorded. A thorough warm up should be given, including some practice
starts and accelerations. Start from a stationary position, with one foot in front of the
other. The front foot must be on or behind the starting line. This starting position
should be held for 1 second prior to starting, and no rocking movements are allowed.
The tester should provide hints for maximizing speed (such as keeping low, driving
hard with the arms and legs) and encourage them to continue running hard through
the finish line.
Score: Two trials are allowed, and the best time is recorded to the nearest 2 decimal
places. The timing starts from the first movement (if using a stopwatch) or when the
timing system is triggered, and finishes when the chest, crosses the finish line and/or
the finishing timing gate is triggered.
3.6.2.5. Agility testing procedure
Volleyball is the game of getting into the right place at the right time. So being better
agile players is critically important.
Equipment: Cones, whistle, tape-measure, stop watch
Procedure: Three lines will be marked on the floor with distance of five meters
between them, and labeled as “A”, “B”, “C” and “D” respectively. The participant
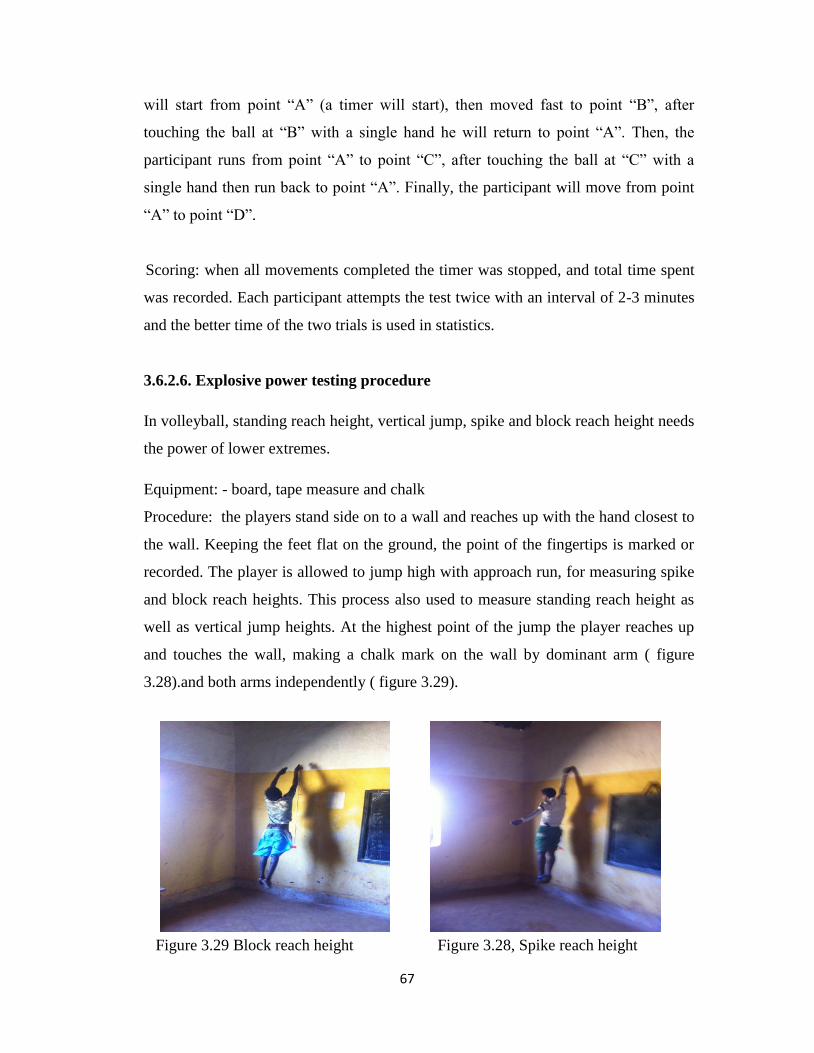
67
will start from point “A” (a timer will start), then moved fast to point “B”, after
touching the ball at “B” with a single hand he will return to point “A”. Then, the
participant runs from point “A” to point “C”, after touching the ball at “C” with a
single hand then run back to point “A”. Finally, the participant will move from point
“A” to point “D”.
Scoring: when all movements completed the timer was stopped, and total time spent
was recorded. Each participant attempts the test twice with an interval of 2-3 minutes
and the better time of the two trials is used in statistics.
3.6.2.6. Explosive power testing procedure
In volleyball, standing reach height, vertical jump, spike and block reach height needs
the power of lower extremes.
Equipment: - board, tape measure and chalk
Procedure: the players stand side on to a wall and reaches up with the hand closest to
the wall. Keeping the feet flat on the ground, the point of the fingertips is marked or
recorded. The player is allowed to jump high with approach run, for measuring spike
and block reach heights. This process also used to measure standing reach height as
well as vertical jump heights. At the highest point of the jump the player reaches up
and touches the wall, making a chalk mark on the wall by dominant arm ( figure
3.28).and both arms independently ( figure 3.29).
Figure 3.29 Block reach height Figure 3.28, Spike reach height
68
Score: The player‟s vertical jump score is measured as the distance between the
standing height and the jump height. The player spike reach height is the distance
from the jump chalk mark made by the dominant arm up on the floor. The block
reaches height is the distance from the jump chalk mark made by both arms up on the
floor.
3.7. Tester’s Competency
All the measurements were taken by the researchers with the assistances. Before the
actual test and measurement, the researcher practiced pilot study and applied test-
retest method to prove his ability. The average results demonstrated a high traits of
reliability coefficient for both anthropometric (r = 0.941, P< 0.05) and physical
fitness test (r = 0.954, P< 0.05).
3.8. Methods of data analysis
SPSS statistical software package (SPSS Inc., Chicago, and HIM (IT) 23.0) was used
in statistical analysis for the anthropometry characteristic and physical fitness traits of
players. Descriptive and inferential statistics were given to both anthropometric
characteristics and physical fitness traits of junior volleyball players.
Some anthropometric characteristics and fitness traits of junior volleyball players in
the West Gojjam zone of Ethiopian were compared with international players by
using independent sample t – test and one sample t- test respectively. Then, one way
ANOVA test was performed to compare anthropometric characteristics of players
among the teams and it was followed by post hoc multiple comparison analysis to
identify mean difference among the junior volleyball player in the teams. Alpha
Value of 0.05 was set for statistical significance.
69
Pearson Product Moment correlation test was also used to analyze the relationship
between anthropometry measurement and physical fitness traits of players. Lastly, the
multiple linear regression analysis method was used, to identify the most relevant
anthropometry variables that would be most important to predict the fitness traits of
junior volleyball players.
70
CHAPTER 4
ANALYSIS OF THE RESULTS AND DISCUSSION OF FINDINGS
4.1. Results
Introduction
This study has provided descriptive and inferential statistics for anthropometric
characteristic, physical fitness traits and the relationship between anthropometric
characteristics and physical fitness traits of junior volleyball players. Hence, the
analysis of the results related to anthropometric characteristics, physical fitness traits
of players followed by the results of correlation between anthropometric
characteristic and physical fitness traits and regression analysis to predict physical
fitness of junior volleyball players in the West Gojjam zone of Ethiopia.
4.1.1. Results of anthropometric characteristic of junior volleyball players in
West Gojjam, Ethiopia and the international norms.
In volleyball, the success of players has been largely determined by his or her
anthropometric characteristics. Particularly, the influence their stature, weight, body
mass index, spikes and block reach height are very great (Andrea, 2017; Michael,
2016; Wood, 2015; Jose, Palau, Policarpo, Manzanares & David, 2014; Jin Liu,
Zhang & Gai 2007). Hence, firstly, we presented the stature, body weight; body
mass index, spikes and block reach height of junior volleyball players in the West
Gojjam zone of Ethiopia and overseas.
4.1.1.1. Comparative result on selected anthropometric characteristics of junior
volleyball players in West Gojjam zone, Ethiopia, and the international
norm.
One of the objectives of the study was to compare whether there exists a significant
mean score difference between junior volleyball players in the West Gojjam zone of
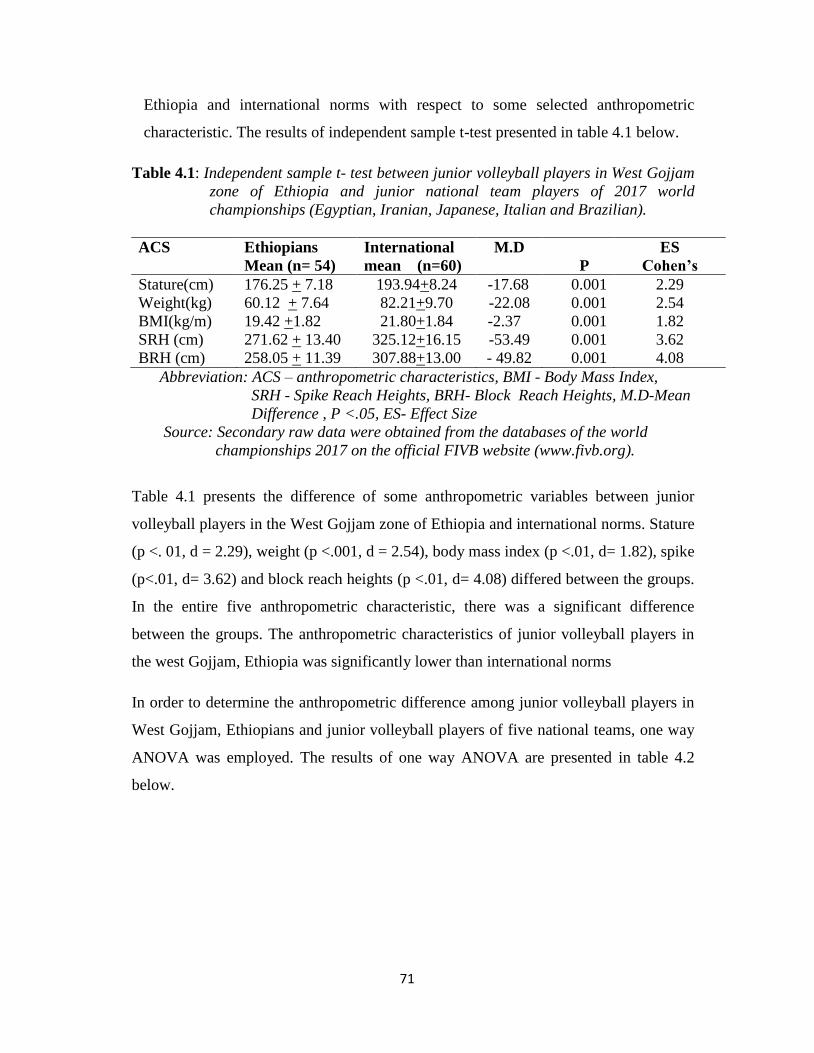
71
Ethiopia and international norms with respect to some selected anthropometric
characteristic. The results of independent sample t-test presented in table 4.1 below.
Table 4.1: Independent sample t- test between junior volleyball players in West Gojjam
zone of Ethiopia and junior national team players of 2017 world
championships (Egyptian, Iranian, Japanese, Italian and Brazilian).
ACS Ethiopians
Mean (n= 54)
International
mean (n=60)
M.D
P
ES
Cohen’s
Stature(cm) 176.25 + 7.18 193.94+8.24 -17.68 0.001 2.29
Weight(kg) 60.12 + 7.64 82.21+9.70 -22.08 0.001 2.54
BMI(kg/m) 19.42 +1.82 21.80+1.84 -2.37 0.001 1.82
SRH (cm) 271.62 + 13.40 325.12+16.15 -53.49 0.001 3.62
BRH (cm) 258.05 + 11.39 307.88+13.00 - 49.82 0.001 4.08
Abbreviation: ACS – anthropometric characteristics, BMI - Body Mass Index,
SRH - Spike Reach Heights, BRH- Block Reach Heights, M.D-Mean
Difference , P <.05, ES- Effect Size
Source: Secondary raw data were obtained from the databases of the world
championships 2017 on the official FIVB website (www.fivb.org).
Table 4.1 presents the difference of some anthropometric variables between junior
volleyball players in the West Gojjam zone of Ethiopia and international norms. Stature
(p <. 01, d = 2.29), weight (p <.001, d = 2.54), body mass index (p <.01, d= 1.82), spike
(p<.01, d= 3.62) and block reach heights (p <.01, d= 4.08) differed between the groups.
In the entire five anthropometric characteristic, there was a significant difference
between the groups. The anthropometric characteristics of junior volleyball players in
the west Gojjam, Ethiopia was significantly lower than international norms
In order to determine the anthropometric difference among junior volleyball players in
West Gojjam, Ethiopians and junior volleyball players of five national teams, one way
ANOVA was employed. The results of one way ANOVA are presented in table 4.2
below.
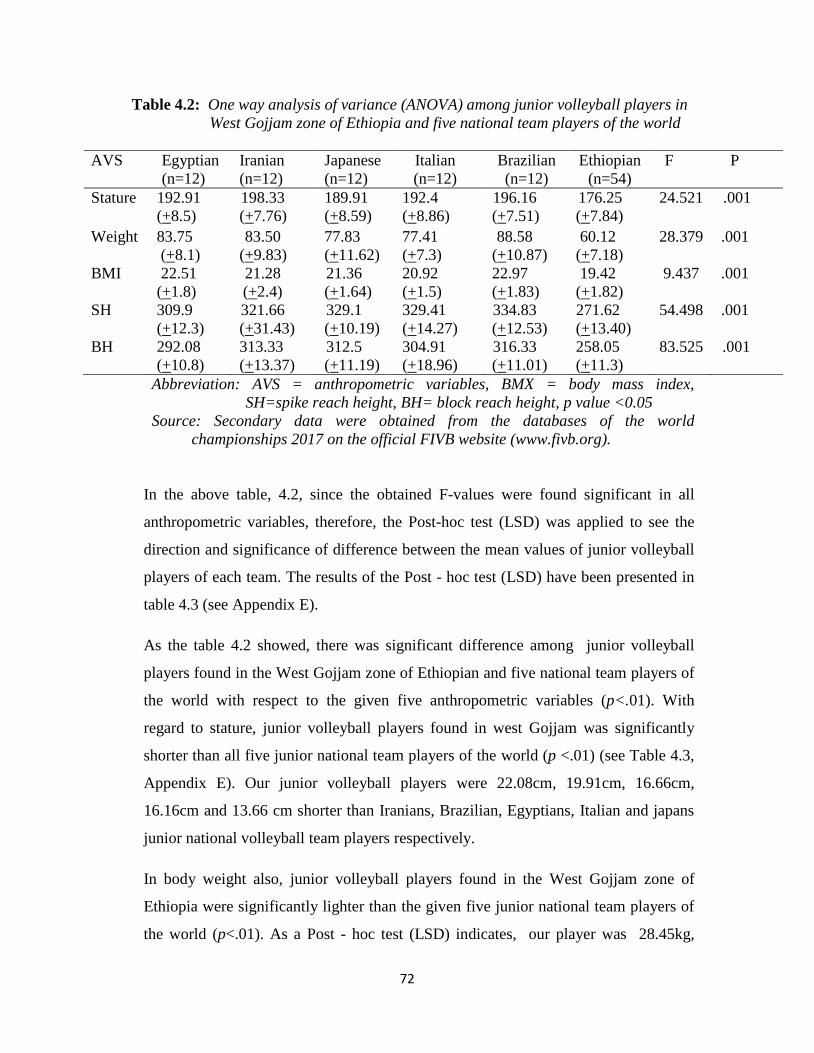
72
Table 4.2: One way analysis of variance (ANOVA) among junior volleyball players in
West Gojjam zone of Ethiopia and five national team players of the world
AVS Egyptian
(n=12)
Iranian
(n=12)
Japanese
(n=12)
Italian
(n=12)
Brazilian
(n=12)
Ethiopian
(n=54)
F P
Stature 192.91
(+8.5)
198.33
(+7.76)
189.91
(+8.59)
192.4
(+8.86)
196.16
(+7.51)
176.25
(+7.84)
24.521 .001
Weight 83.75
(+8.1)
83.50
(+9.83)
77.83
(+11.62)
77.41
(+7.3)
88.58
(+10.87)
60.12
(+7.18)
28.379 .001
BMI 22.51
(+1.8)
21.28
(+2.4)
21.36
(+1.64)
20.92
(+1.5)
22.97
(+1.83)
19.42
(+1.82)
9.437 .001
SH 309.9
(+12.3)
321.66
(+31.43)
329.1
(+10.19)
329.41
(+14.27)
334.83
(+12.53)
271.62
(+13.40)
54.498 .001
BH 292.08
(+10.8)
313.33
(+13.37)
312.5
(+11.19)
304.91
(+18.96)
316.33
(+11.01)
258.05
(+11.3)
83.525 .001
Abbreviation: AVS = anthropometric variables, BMX = body mass index,
SH=spike reach height, BH= block reach height, p value <0.05
Source: Secondary data were obtained from the databases of the world
championships 2017 on the official FIVB website (www.fivb.org).
In the above table, 4.2, since the obtained F-values were found significant in all
anthropometric variables, therefore, the Post-hoc test (LSD) was applied to see the
direction and significance of difference between the mean values of junior volleyball
players of each team. The results of the Post - hoc test (LSD) have been presented in
table 4.3 (see Appendix E).
As the table 4.2 showed, there was significant difference among junior volleyball
players found in the West Gojjam zone of Ethiopian and five national team players of
the world with respect to the given five anthropometric variables (p<.01). With
regard to stature, junior volleyball players found in west Gojjam was significantly
shorter than all five junior national team players of the world (p <.01) (see Table 4.3,
Appendix E). Our junior volleyball players were 22.08cm, 19.91cm, 16.66cm,
16.16cm and 13.66 cm shorter than Iranians, Brazilian, Egyptians, Italian and japans
junior national volleyball team players respectively.
In body weight also, junior volleyball players found in the West Gojjam zone of
Ethiopia were significantly lighter than the given five junior national team players of
the world (p<.01). As a Post - hoc test (LSD) indicates, our player was 28.45kg,
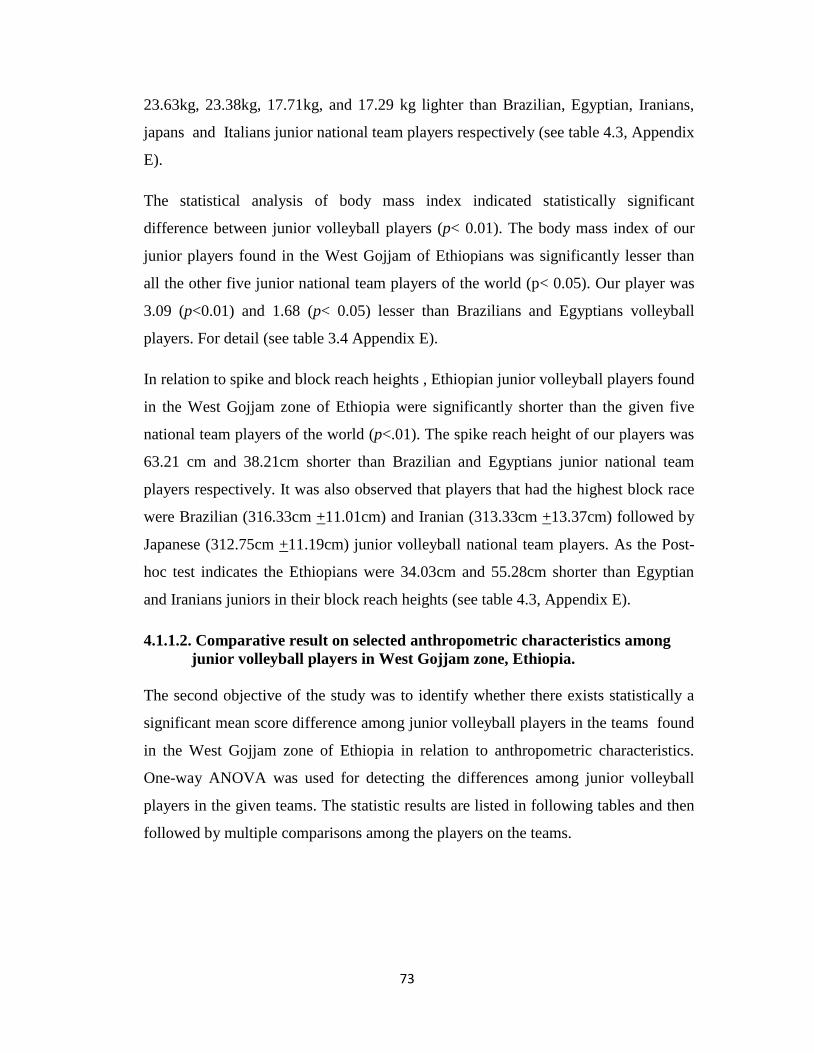
73
23.63kg, 23.38kg, 17.71kg, and 17.29 kg lighter than Brazilian, Egyptian, Iranians,
japans and Italians junior national team players respectively (see table 4.3, Appendix
E).
The statistical analysis of body mass index indicated statistically significant
difference between junior volleyball players (p< 0.01). The body mass index of our
junior players found in the West Gojjam of Ethiopians was significantly lesser than
all the other five junior national team players of the world (p< 0.05). Our player was
3.09 (p<0.01) and 1.68 (p< 0.05) lesser than Brazilians and Egyptians volleyball
players. For detail (see table 3.4 Appendix E).
In relation to spike and block reach heights , Ethiopian junior volleyball players found
in the West Gojjam zone of Ethiopia were significantly shorter than the given five
national team players of the world (p<.01). The spike reach height of our players was
63.21 cm and 38.21cm shorter than Brazilian and Egyptians junior national team
players respectively. It was also observed that players that had the highest block race
were Brazilian (316.33cm +11.01cm) and Iranian (313.33cm +13.37cm) followed by
Japanese (312.75cm +11.19cm) junior volleyball national team players. As the Post-
hoc test indicates the Ethiopians were 34.03cm and 55.28cm shorter than Egyptian
and Iranians juniors in their block reach heights (see table 4.3, Appendix E).
4.1.1.2. Comparative result on selected anthropometric characteristics among
junior volleyball players in West Gojjam zone, Ethiopia.
The second objective of the study was to identify whether there exists statistically a
significant mean score difference among junior volleyball players in the teams found
in the West Gojjam zone of Ethiopia in relation to anthropometric characteristics.
One-way ANOVA was used for detecting the differences among junior volleyball
players in the given teams. The statistic results are listed in following tables and then
followed by multiple comparisons among the players on the teams.
74
Table 4.4 Analysis of variance (ANOVA) among junior volleyball players in the West
Gojjam zone, Ethiopia, with regards to some anthropometric characteristic
AVS DJVT
(n=18)
SWJVT
(n=18)
QJVT
(n=18)
F P
Stature 179.66 ( +5.08) 178.00 ( +8.96) 171.11 (+6.49) 7.483 .001
Weight 61.61 ( +6.52) 59.05( +8.44) 59.72 (+6.58) .603 .551
BMI 19.14( +1.74) 18.84( +1.93) 20.28 (+1.53) 3.397 .041
SRH 275.27( +11.29) 277.66( +15.99) 261.94 (+4.97) 9.499 .001
BRH 259.66 (+8.73) 265.66 (+12.40) 248.83(+4.52) 15.69 .001
Abbreviation: AVS = anthropometric variables, DJVT= Durbietie Junior Volleyball
Team, SWJVT= Shendie Wenbrma Junior Volleyball Team, QJVT= Qunzla
junior volleyball team, p<0.05, BMX= body mass index, SRH=Spike Reach
Height and BRH= Block Reach Height , p value< 0.05
As the above table 4.4 shown, the statistical analysis indicates that there was
significant differences observed on stature (p<.01), spike reach heights (p<.01) and
block reach heights (p<.01) of the players in the teams. There was no significant
difference among the players in the teams in relation to their body weight (p < .05).
In the above table, since the obtained p-values of most variables were established
significant difference among the players, therefore, the Post-hoc test (LSD) was
applied to see the direction and significance of difference between junior volleyball
players of the three teams. The results of the Post - hoc test (LSD) have been
presented in table 4.5 (see the appendix).
In table 4.5, the stature of junior volleyball players in the West Gojjam zone of
Ethiopia was significantly different (p<. 01), Qunzla team players were significantly
shortest of all teams (p<.01). Durbietie junior volleyball team players were the
tallest, 179.66cm +5.08cm, followed by Shendie Wenbrma, 178.00 cm +8.96cm and
Qunzla, 171.11cm +6.49cm, team players.
There were also significant differences between the player with regard to the spike
reach height (p<.01). Qunzla team players were significantly shorter than both
Durbietie (p<. 01) And Shendie Wenbrma (p<. 01) team players. The spike reaches
heights of Durbietie and Shendie Wenbrma team were 13.33 cm (p<.01) And 15.72
cm (p<.01) greater than Qunzla team players.
75
With regard to the block reach height; there were significant differences among the
players in the West Gojjam zone of Ethiopia (p<. 01). The block reaches heights of
Durbietie (p<.01) and Shendie Wenbrma (p<. 01) team were significantly greater than
Qunzla team players. The block reaches heights of Durbietie and Shendie Wenbrma
team players were 10.83 cm and 16.83cm greater than Qunzla team players.
Volleyball players that had the highest block reach height were belong to Shendie
Wenbrma players, 265.66 +12.40cm, followed by Durbietie, 259.66 +8.73 and
Qunzla, 248.83 +4.52cm team players.
4.1.1.3. Comparative results on most anthropometric characteristics among
junior volleyball players in the west Gojjam, Ethiopia.
One-way ANOVA was used for detecting the anthropometric differences among the
players in their teams. The statistic results of 29 anthropometric variables of junior
volleyball players in the West Gojjam zone of Ethiopia are presented in Table 4.6
(see Appendix E).
In this study, there were no significant differences among junior volleyball players in
18 anthropometric characteristics (see table 4.6, Appendix E), together with body
weight it becomes 19 (see table 4.3). Significant differences among the players were
observed on only 11 anthropometric characteristics (see table 4.7, Appendix E)
significant difference observed on sitting height (p< 0.01), standing reach height
(p<.05), mid calf skin fold (p =.005), sub scapula skin folds (p<.05), mid- thigh skin
fold (p =.004), iliac crest skin folds (p< .001),forearm girth (p< .01), acromiale radial
length (p<.05), midstylion-dactyl ion length (p<.05), biepicondylar femur breads
(p<.05) and hand breads, (p=. 001) of junior volleyball players in the West Gojjam
zone of Ethiopia (table 4.7, Appendix E). There was also a significant difference in
stature, body mass index, spike and block reach heights of junior players (see table
4.3). Totally, there were significant differences observed on 15 anthropometric
characteristics.
The rest 19 anthropometric variables were not significantly different among the
players in the teams (p< 0.05). Therefore, we can conclude that junior volleyball
76
players in the West Gojjam zone of Ethiopia were similar in most of their
anthropometric characteristics.
There was statistically significant difference in sitting heights (p<.001) and standing
reach height of the players in the three teams (p<.05). The magnitude of standard
deviations on sitting height (89.24+6.23cm) and standing reach height
(232.09+12.13cm) of junior players confirmed the presence of variability among the
players in relation to these variables (see table 4.6, Appendix E).
As the table 4.7(see Appendix E) with regard to skin folds, there was a significant
difference among players in the teams, in terms of calfskin fold (p =.005), sub scapula
skin folds (p<.05), mid thigh skin folds (p=.004), and iliac crest skin folds (p<.001).
There was no significant difference among players in terms of abdominal skin fold
(p<.05) and triceps skin fold (p<.05). The mean skin folds thickness on the six
selected sites of the players were 12.07+3.53mm. That is normal. Relatively, the
higher skin fold thickness observed on the abdomen, 13.22+4.41mm, and the minimal
skin folds found around their Mid-thigh, 11.75+3.81mm (see table 4.6, Appendix E).
This clearly reflected that the junior volleyball players‟ has lean muscle. This implies
that junior volleyball players found in the west Gojjam, Ethiopia experienced almost
the same training situation, lifestyle, diet and genetic make-ups.
The statistical analyses also disclosed the presence of greater homogeneity on the
girth of the players. The only significant difference among the players in the teams
observed on forearms girth (p<.05) (see table 4.7, Appendix E). There was no
significant difference among the players in the teams in relation to the other 10 girth
measurements. The neck girth, chest girth, relaxed arm girth, flexed and tense arm
girth, waist girth, wrist girth, gluteus girth, thigh girth, calf girth and ankle girth of the
players in the teams were not significantly different.
With regard to length measurements, significant difference observed on Acromiale-
radial (p< .05) and Midstylion – Dactylion length of players in the teams (p< .05).
77
The statistical result of acromiale-dactylion lengths (86.66+4.85cm) also indicates the
presence of variability among the players. Its range was from 82.68cm to 89.76cm
(for detail, see table 4.6, Appendix E). Moreover, the deviation of Radiale-styling
(forearm length), acromiale-radial (upper arm length) and midstylion-dactylion (hand
length) from the mean were +1.91cm, +2.24cm and 0.95cm respectively. This
confirmed the presence of variability on upper limbs of junior players in the teams
and it was also parallel to significant difference on standing reach heights of the
players (for detail, see table 4.7, Appendix E).
The statistical analysis of the breadth of players showed significant differences
among the players observed on Biepicondylar femur breads (p<. 0.05) and hand
breads (p<. 0.001). The rest (66.7%) of breadth variables were not significantly
different among the players in the teams (p<. 0.05) (See table 4.7, Appendix E).
4.1.1.4. Multiple Comparison of anthropometric characteristics among junior
volleyball players in the west Gojjam, Ethiopia.
Since the obtained F-values were found significant, therefore, the Post-Hoc test
(LSD) was applied to see the direction and significance of difference between the
mean values of junior volleyball players in each team. The results of the Post - Hoc
test (LSD) have been presented in table 4.8 (see the appendix).
As the table 4.8 indicates, the sitting heights of Shendie Wenbrma team players were
significantly higher than Durbietie team players (p˂ .01) and insignificantly different
from Qunzla team players (p = .373). There was also a significant difference in sitting
height between Qunzla and Durbietie team players (p˂ .01). The sitting heights of
Durbietie junior volleyball team players were 8.22cm and 6.66 cm lesser than
Shendie Wenbrma and Qunzla volleyball team players respectively.
With regard to standing reach heights of players in the west Gojjam, Ethiopia,
Durbietie team players were significantly higher than Qunzla team players (p = .007).
78
There were about 10.83 cm differences in standing reach heights between them.
There was no significant difference between Durbietie and Shendie Wenbrma team
players in their standing reach heights (p = .223).
In relation to forearm girth, Durbietie team players had a significantly bigger forearm
girth than both Shendie Wenbrma (p = .007) and Qunzla (p˂=.01) junior volleyball
team players. The forearm girth of Durbietie team players was 1.11cm and 1.38 cm
bigger than Shendie Wenbrma and Qunzla team players respectively. There was no
significant difference between the players in their team in the other ten girth variables
(p˂ 0.05).
The length Acromiale-radial bone of Durbietie team players was significantly longer
than both Shendie Wenbrma (p˂.05) and Qunzla (p˂ .05) team players. There is about
1.61cm difference in Acromiale-radial length between them (see the table 4.8 in the
appendix). Additionally, The length of Midstylion – Dactylion of Shendie Wenbrma
team players were also significantly longer (p = .008) than Durbietie team players.
There was no significant difference between the players in their team in the other two
length variables (p˂ .05).
In breads, Biepicondylar femurs of Qunzla team players were significantly wider than
both Durbietie (p =. 004) and Shendie Wenbrma (p = .033) team players. There was
about 1cm and 0.72 cm difference respectively. With regard to hand breads, Shendie
Wenbrma team players had significantly wider hand breads than both Durbietie (p ˂
.05) and Qunzla (p˂.001) team players .The hand breadth of Shendie Wenbrma team
players were 0.44cm and 0.77 cm greater than Durbietie and Qunzla team players
respectively There was no significant difference among the players in their team in
the other four breadth variables (p˂ .05) (see table 4.8 in the appendix).
With respect to skin folds, the statistical results indicate that the Skin fold of
Durbietie team players was significantly thicker than Qunzla team players.
Particularly, on mid calf skin folds (p = .003), sub scapula skin folds (p˂ .05), mid
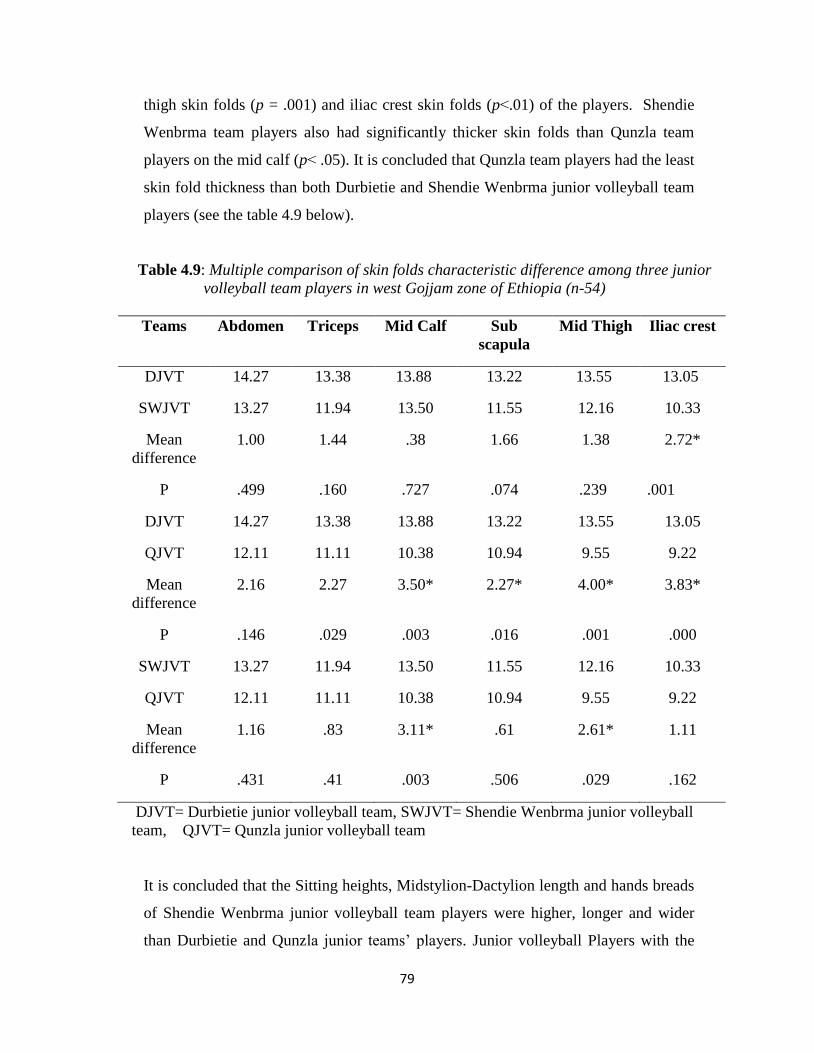
79
thigh skin folds (p = .001) and iliac crest skin folds (p˂.01) of the players. Shendie
Wenbrma team players also had significantly thicker skin folds than Qunzla team
players on the mid calf (p˂ .05). It is concluded that Qunzla team players had the least
skin fold thickness than both Durbietie and Shendie Wenbrma junior volleyball team
players (see the table 4.9 below).
Table 4.9: Multiple comparison of skin folds characteristic difference among three junior
volleyball team players in west Gojjam zone of Ethiopia (n-54)
Teams Abdomen Triceps Mid Calf Sub
scapula
Mid Thigh Iliac crest
DJVT 14.27 13.38 13.88 13.22 13.55 13.05
SWJVT 13.27 11.94 13.50 11.55 12.16 10.33
Mean
difference
1.00 1.44 .38 1.66 1.38 2.72*
P .499 .160 .727 .074 .239 .001
DJVT 14.27 13.38 13.88 13.22 13.55 13.05
QJVT 12.11 11.11 10.38 10.94 9.55 9.22
Mean
difference
2.16 2.27 3.50* 2.27* 4.00* 3.83*
P .146 .029 .003 .016 .001 .000
SWJVT 13.27 11.94 13.50 11.55 12.16 10.33
QJVT 12.11 11.11 10.38 10.94 9.55 9.22
Mean
difference
1.16 .83 3.11* .61 2.61* 1.11
P .431 .41 .003 .506 .029 .162
DJVT= Durbietie junior volleyball team, SWJVT= Shendie Wenbrma junior volleyball
team, QJVT= Qunzla junior volleyball team
It is concluded that the Sitting heights, Midstylion-Dactylion length and hands breads
of Shendie Wenbrma junior volleyball team players were higher, longer and wider
than Durbietie and Qunzla junior teams‟ players. Junior volleyball Players with the
80
biggest forearm girth, longest Acromiale-radial bone and highest standing reach
heights belonged to Durbietie junior volleyball team players. The Biepicondylar
femur breads of Qunzla junior teams‟ players were the widest of all teams. Their skin
folds thickness also the list of all junior volleyball players in the three teams.
4.1.2. Results on physical fitness traits of junior volleyball players in the west
Gojjam, Ethiopia
One of the objectives of the study was to Compare whether there exists statistically
significant mean score difference between junior volleyball players in the West
Gojjam zone of Ethiopia and international norms with respect to selected physical
fitness traits. From the vast category of fitness, the most important fitness component
for volleyball players are a flexibility of lower back and hamstring muscles, strength
of upper body parts , abdominal and hip muscles, agility of the body and explosive
power of lower extremities (wood, 2010) . Therefore, the researchers selected sit and
reach, pushups, sit ups, 10m sprint run, T- shuttle run agility and vertical jump tests
were used to compare physical fitness traits of junior volleyball players in the West
Gojjam zone of Ethiopia and international norms.
The descriptive statistics of these physical fitness traits of junior volleyball players in
the west Gojjam zone of Ethiopian are presented first in the table 4.10 below. Then it
was followed by one sample T- test to compare it with international norms and one-
way ANOVA for detecting the differences on physical fitness traits of players found
in the West Gojjam zone of Ethiopia.
4.1.2.1. Descriptive statistics result on the physical fitness traits of junior
volleyball players in the west Gojjam, Ethiopia.
Descriptive Physical fitness traits of junior volleyball players in the west Gojjam zone
of Ethiopia are shown in the table 4.10 below.
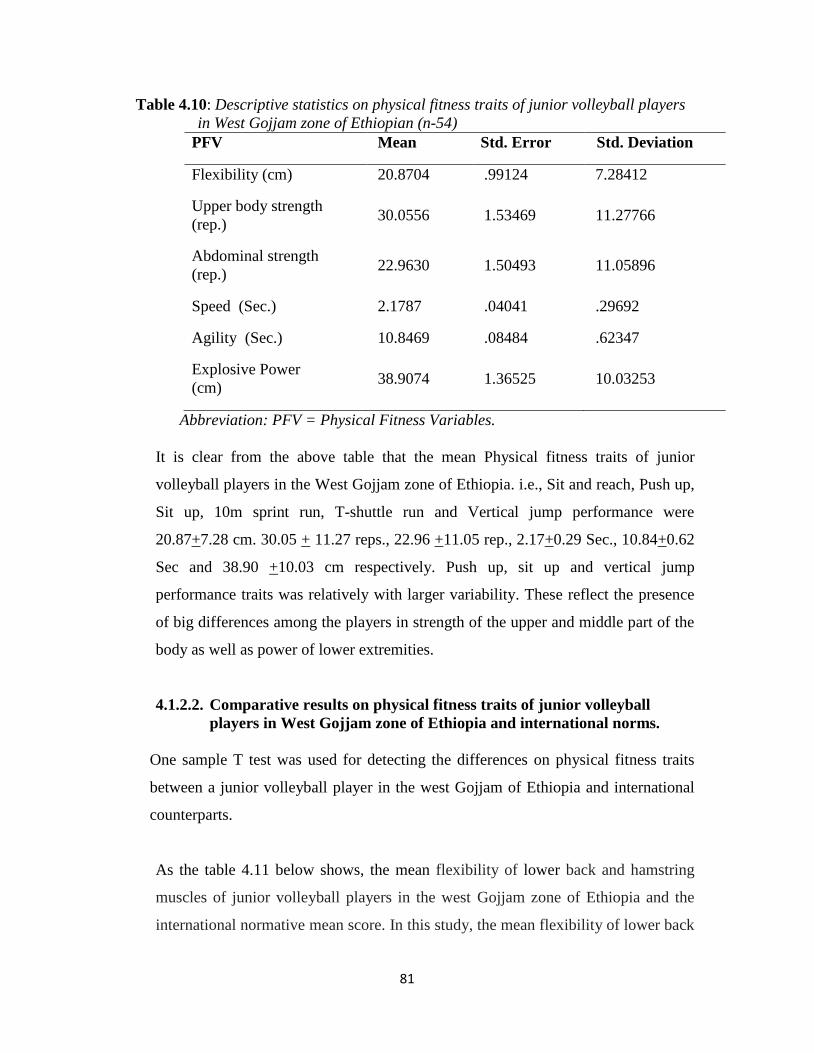
81
Table 4.10: Descriptive statistics on physical fitness traits of junior volleyball players
in West Gojjam zone of Ethiopian (n-54)
PFV Mean Std. Error Std. Deviation
Flexibility (cm) 20.8704 .99124 7.28412
Upper body strength
(rep.) 30.0556 1.53469 11.27766
Abdominal strength
(rep.) 22.9630 1.50493 11.05896
Speed (Sec.) 2.1787 .04041 .29692
Agility (Sec.) 10.8469 .08484 .62347
Explosive Power
(cm) 38.9074 1.36525 10.03253
Abbreviation: PFV = Physical Fitness Variables.
It is clear from the above table that the mean Physical fitness traits of junior
volleyball players in the West Gojjam zone of Ethiopia. i.e., Sit and reach, Push up,
Sit up, 10m sprint run, T-shuttle run and Vertical jump performance were
20.87+7.28 cm. 30.05 + 11.27 reps., 22.96 +11.05 rep., 2.17+0.29 Sec., 10.84+0.62
Sec and 38.90 +10.03 cm respectively. Push up, sit up and vertical jump
performance traits was relatively with larger variability. These reflect the presence
of big differences among the players in strength of the upper and middle part of the
body as well as power of lower extremities.
4.1.2.2. Comparative results on physical fitness traits of junior volleyball
players in West Gojjam zone of Ethiopia and international norms.
One sample T test was used for detecting the differences on physical fitness traits
between a junior volleyball player in the west Gojjam of Ethiopia and international
counterparts.
As the table 4.11 below shows, the mean flexibility of lower back and hamstring
muscles of junior volleyball players in the west Gojjam zone of Ethiopia and the
international normative mean score. In this study, the mean flexibility of lower back
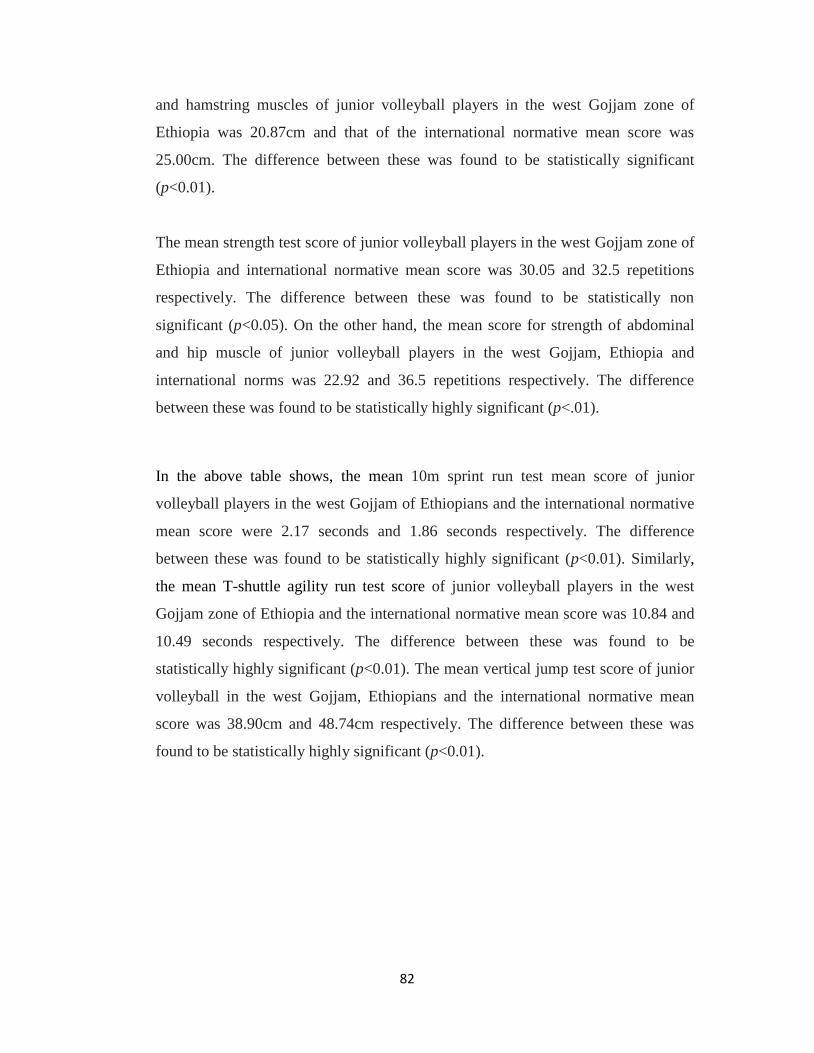
82
and hamstring muscles of junior volleyball players in the west Gojjam zone of
Ethiopia was 20.87cm and that of the international normative mean score was
25.00cm. The difference between these was found to be statistically significant
(p<0.01).
The mean strength test score of junior volleyball players in the west Gojjam zone of
Ethiopia and international normative mean score was 30.05 and 32.5 repetitions
respectively. The difference between these was found to be statistically non
significant (p<0.05). On the other hand, the mean score for strength of abdominal
and hip muscle of junior volleyball players in the west Gojjam, Ethiopia and
international norms was 22.92 and 36.5 repetitions respectively. The difference
between these was found to be statistically highly significant (p<.01).
In the above table shows, the mean 10m sprint run test mean score of junior
volleyball players in the west Gojjam of Ethiopians and the international normative
mean score were 2.17 seconds and 1.86 seconds respectively. The difference
between these was found to be statistically highly significant (p<0.01). Similarly,
the mean T-shuttle agility run test score of junior volleyball players in the west
Gojjam zone of Ethiopia and the international normative mean score was 10.84 and
10.49 seconds respectively. The difference between these was found to be
statistically highly significant (p<0.01). The mean vertical jump test score of junior
volleyball in the west Gojjam, Ethiopians and the international normative mean
score was 38.90cm and 48.74cm respectively. The difference between these was
found to be statistically highly significant (p<0.01).
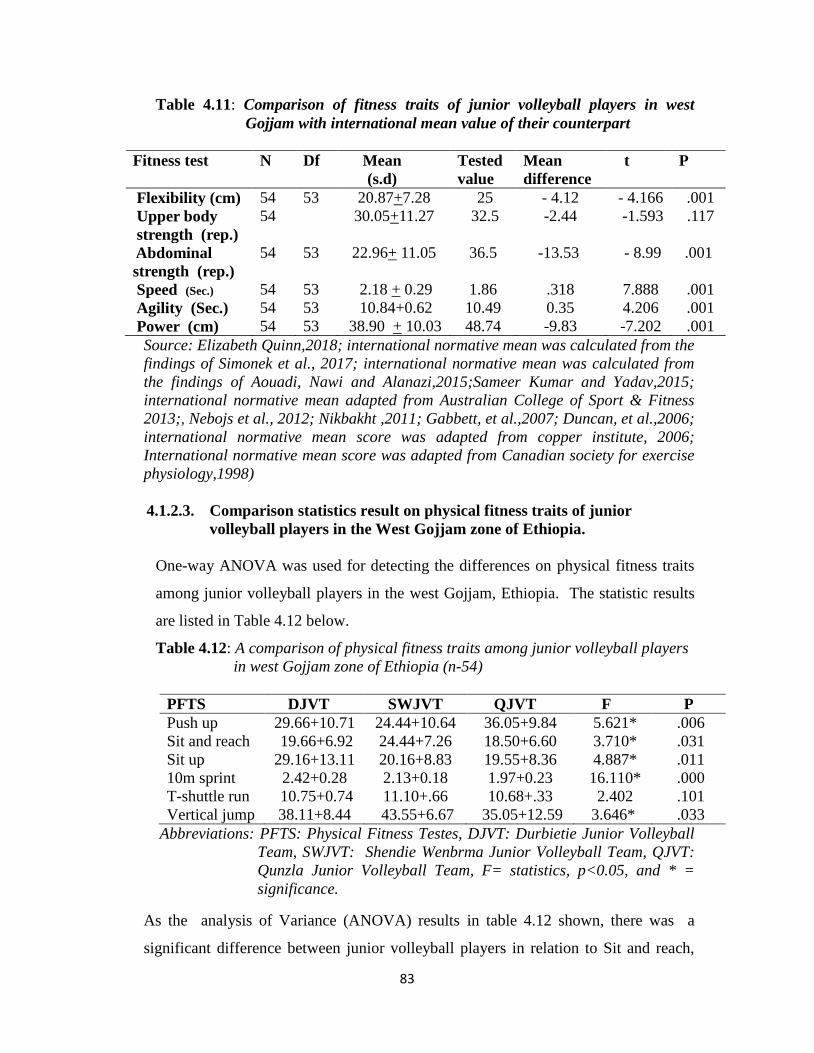
83
Table 4.11: Comparison of fitness traits of junior volleyball players in west
Gojjam with international mean value of their counterpart
Fitness test N Df Mean
(s.d)
Tested
value
Mean
difference
t P
Flexibility (cm) 54 53 20.87+7.28 25 - 4.12 - 4.166 .001
Upper body
strength (rep.)
54 30.05+11.27 32.5 -2.44 -1.593 .117
Abdominal
strength (rep.)
54 53 22.96+ 11.05 36.5 -13.53 - 8.99
.001
Speed (Sec.) 54 53 2.18 + 0.29 1.86 .318 7.888 .001
Agility (Sec.) 54 53 10.84+0.62 10.49 0.35 4.206 .001
Power (cm) 54 53 38.90 + 10.03 48.74 -9.83 -7.202 .001
Source: Elizabeth Quinn,2018; international normative mean was calculated from the
findings of Simonek et al., 2017; international normative mean was calculated from
the findings of Aouadi, Nawi and Alanazi,2015;Sameer Kumar and Yadav,2015;
international normative mean adapted from Australian College of Sport & Fitness
2013;, Nebojs et al., 2012; Nikbakht ,2011; Gabbett, et al.,2007; Duncan, et al.,2006;
international normative mean score was adapted from copper institute, 2006;
International normative mean score was adapted from Canadian society for exercise
physiology,1998)
4.1.2.3. Comparison statistics result on physical fitness traits of junior
volleyball players in the West Gojjam zone of Ethiopia.
One-way ANOVA was used for detecting the differences on physical fitness traits
among junior volleyball players in the west Gojjam, Ethiopia. The statistic results
are listed in Table 4.12 below.
Table 4.12: A comparison of physical fitness traits among junior volleyball players
in west Gojjam zone of Ethiopia (n-54)
PFTS DJVT SWJVT QJVT F P
Push up 29.66+10.71 24.44+10.64 36.05+9.84 5.621* .006
Sit and reach 19.66+6.92 24.44+7.26 18.50+6.60 3.710* .031
Sit up 29.16+13.11 20.16+8.83 19.55+8.36 4.887* .011
10m sprint 2.42+0.28 2.13+0.18 1.97+0.23 16.110* .000
T-shuttle run 10.75+0.74 11.10+.66 10.68+.33 2.402 .101
Vertical jump 38.11+8.44 43.55+6.67 35.05+12.59 3.646* .033
Abbreviations: PFTS: Physical Fitness Testes, DJVT: Durbietie Junior Volleyball
Team, SWJVT: Shendie Wenbrma Junior Volleyball Team, QJVT:
Qunzla Junior Volleyball Team, F= statistics, p<0.05, and * =
significance.
As the analysis of Variance (ANOVA) results in table 4.12 shown, there was a
significant difference between junior volleyball players in relation to Sit and reach,
84
Push up, Sit up, 10m sprint run and Vertical jump performance traits of players
(p<0.05). There were no significant difference in T- shuttle agility run performance
traits of players in the west Gojjam, Ethiopia (p<.05).
Since the obtained F-values were found significant, therefore, the Post-hoc test (LSD)
was applied to see the direction and significance of difference between the mean
values of junior volleyball players in each team. The results of the Post - hoc test
(LSD) are presented in table 4.12 in the appendix.
As table 4.12 indicates, the flexibility of lower back and hammering muscle
performance traits of Shendie Wenbrma team players were significantly better than
Durbietie and Qunzla team players (p<.05). The sit and reach the performance traits
of Shendie Wenbrma team players were 4.77cm and 5.94cm greater than Durbietie
and Qunzla team junior players respectively.
In push up performance traits also, there were significant differences between Qunzla
and Shendie Wenbrma junior volleyball team players (p<.01). The mean push up
performance of Shendie Wenbrma team players was 24 reps. that are 11 repetitions
lesser than Qunzla team players.
With regard to sit ups performance traits, There were also significant differences
among the players in the West Gojjam zone of Ethiopia (p<.05). The mean sits up
performance of Durbietie team players were 29.16 repetitions, that is exactly 9
repetitions greater than Shendie Wenbrma team players. Additionally, Durbietie team
players were also performed 6.61 more sit ups than Qunzla team players.
As table 4.12 indicates, there was also great significant differences among the junior
volleyball players in West Gojjam, Ethiopia, in relation to to10m sprint run
performance traits (p<.001). Shendie Wenbrma team players were 0.285 Sec faster
than Durbietie team players. Similarly, Qunzla junior team players were also 0.44 Sec
faster than Durbietie team players. The vertical jump test score of Shendie Wenbrma
junior volleyball team players was also significantly greater (8.50cm) than Qunzla
junior volleyball team players (p<.05).
85
It is concluded that Qunzla junior volleyball players had better strength on upper
body, moving speed and agility performance traits than the other two teams. Shendie
Wenbrma team players on their part also had better performance traits in relation to
flexibility and explosive power of lower extremities. The abdominal and hip muscle
strength of Durbietie junior volleyball team players were the best of all teams in the
zone.
4.1.3. Correlations between anthropometric characteristics and physical fitness
traits of junior volleyball players in the west Gojjam, Ethiopia.
One of the objectives of the present study was to examine the relationship between
anthropometric characteristics and physical fitness traits of junior volleyball players.
The relationship between anthropometric and physical fitness traits of junior
volleyball players in the west Gojjam zone of Ethiopia are shown in tables 4.13 to
4.18 (see Appendix E).
The statistical analyses indicated that most 21 (61.75%) of the anthropometric
characteristics of junior volleyball players in the west Gojjam zone of Ethiopia were
significantly correlated with the selected physical fitness performance traits of
players. These were stature, body weight, body mass index (derived), sitting height,
standing reach height, spiking height, blocking height, sub scapula skin folds, triceps
skin folds, abdomen skin folds, iliac crest skin folds, mid-thigh skin folds, mid calf
skin folds, flexed and tense arm girth, forearm girth, wrist girth, waist girth, gluteus
girth, biepicondylar hummers breadth and Hand breadth. The rest 13 (38.25%)
anthropometric variables were not significantly correlated with the selected physical
fitness components. These were the Neck girth, chest girth, relaxed arm girth mid-
tight girth, mid calf girth, ankle girth, radial- styling, acromiale - radial, acromiale -
dactylion length (derived), biacromial, transverse chest breadth, Biilocristal breadth,
and biepicondylar femur breadth of players. This indicates that there were many
other factors that might have contributed to the physical fitness performance traits of
players.
86
4.1.3.1. Correlations between anthropometric characteristics and flexibly of
lower back and hamstring muscles traits of junior volleyball players.
The statistical results revealed that, among the anthropometric variables, only four of
them were being significantly correlated with the flexibility, lower back and
hamstring muscles of junior volleyball players. More specifically, Blocking height (r
= .384, p < .01), abdominal skin folds (r =-. 305, p < .05), waist girth (r =.347, p <.
05) and gluteus girth (r = - 0.309, p < .05). These disclosed that volleyball players
with higher blocking reach height and larger waist girth are more likely to be elastic
in their lower back and hamstring muscles and scored better flexibility performance
traits than the other. These junior volleyball players with more subcutaneous adipose
tissue around the abdomen are less likely to be flexible in their lower back and
hamstring muscles. This means that, the abdominal skin folds has got negative
relationship with flexibility of lower back and hamstring muscles. The other skin
folds are with correlation coefficient less than 0.275 (See table 4.13, Appendix E).
Similarly, gluteus girth have negative relationship with flexibility of lower back and
hamstring muscles.
The waist girth has direct relation with the amount of fat accumulated around the
pelvis, which is what flexibility of lower back needs as well, and this is why waist
girth variables correlated with the flexibility of lower back and hamstring muscles.
The other anthropometric variables were not significantly correlated with sit and
reach test score of junior volleyball players (See table: 4.13, Appendix E).
4.1.3.2. Correlations between anthropometric characteristics and upper body
strength of junior volleyball players.
There are about six anthropometric variables, which were significant correlation with
push up performance traits of junior volleyball players. More specifically, Stature (r =
-.393, p<.01), Standing reach height (r = -.272, p<.05), Flexed and tense arm girth(r =
.312, p<.05), Wrist girth (r =- .270, p<.05), Waist girth (r = - .306, p<.05) and hand
breads (r =- .327, p<.05) correlated with the push up the performance traits of junior
volleyball players (see table 4.14, Appendix E). These disclose that the players with
87
bigger flexed and tense arm girth are usually prepared with stronger upper body and
better push up performance traits. As the players flexed and tense arm girth increases,
the force required to carry the whole body only by upper body will also increase. As
the correlation coefficient indicates, all the other five variables are inverse
relationship with push up the performance traits of players. The players with greater
stature, standing reach height, and wrist and waist girth will have strong upper body
parts. Any of skin folds didn‟t have significant correlation with push up test score of
junior volleyball players. All the other anthropometric variables were also
insignificantly correlated with push up the performance traits of players (See table:
4.14, Appendix E).
4.1.3.3. Correlations between anthropometric characteristics and strength of
abdominal and hip muscles of junior volleyball players
The statistical results also pointed out that, among the anthropometric variables, only
two of them being significantly correlated with the Sit up performance of junior
volleyball players. Specifically, sitting height (r =. - 0.271, p < .05) and flexed and
tense arm girth(r = 0.358, p < .01), with the Sit-up performance. These reflected that
volleyball players with higher flexed and tense arm girth is more likely to be strong in
abdominal and waist muscles and scored better performance in Sit up tests. In
contrast, an increment in sitting height will have a inverse relationship with sit up
performance. Any of skin folds didn‟t have significant correlation with Sit up test
score of junior volleyball players. All of the other anthropometric variables are also
with correlation coefficient less than 0.275 (See table: 4.15, Appendix E).
4.1.3.4. Correlations between anthropometric characteristics and speed of junior
volleyball players.
The statistical results also revealed that, among the anthropometric variables, nine of
them being significantly correlated with the testing result of 10m sprint run
performance traits of junior volleyball players. More specifically, Standing reach
height (r =. 289, p < .05), sitting height (r =.337, p < .05), waist girth (r =.355, p <
.01), forearm girth (r = .505, p < .01), triceps skin folds (r =.286, p <.05), sub scapular
88
skin folds (r = .285, p < .05), tight skin folds (r = .297, p <.05), lilac crest skin folds
(r = .479, p < .001), and biepicondylar hummers breadth (r=.352, p<.01), correlated
significantly with 10m sprint run performance traits of players. These revealed that
Biepicondylar hummers, waist girth, forearm girth and higher standing reach height
and sitting height have direct relationship with the speedy of the players. From the
perspective of sport physiology, the one with bigger biepicondylar hummers, forearm
girth and higher standing reach height and sitting height are more likely to have
bigger muscles; this is why these variables correlated with the 10m sprint run
performance.
The statistical result indicates, having thicker skin folds (until 10 %) on triceps, sub
scapular, mid- tight and lilac crest sites positive correlation with 10m sprint run.
This implies that, normal adipose tissue accumulation around iliac crest, mid-thigh
and sub scapula has direct relationship with physiology of the muscles fiber and
neuron muscular coordination‟s of the players. The other anthropometric variables are
with correlation coefficient less than 0.275 (See table: 4.16, Appendix E).
4.1.3.5. The correlations between anthropometric characteristic and agility of
junior volleyball players.
The correlation analyses revealed that the T-shuttle run agility test had significant
correlation with abdominal skin fold (r =. 356, p < .01), mid calf skin folds (r =. 491,
p < .01), iliac crest skin folds (r =. 339, p < .05), and mid tight skin folds (r =. 408, p
< .03). The ability of the body only correlated with various skin fold thickness of
junior volleyball players. The rest anthropometric characteristics, including the
various girths, breadth and length variables were not significantly correlated with
agility traits of players (see table 4.17, Appendix E).
4.1.3.6. The Correlations between anthropometric characteristic and explosive
power of junior volleyball players.
Our analyses indicated that only spike (r =. 527, p < .001) and block reach heights (r
=. 535, p < .001), were highly correlated with vertical jump performance traits of
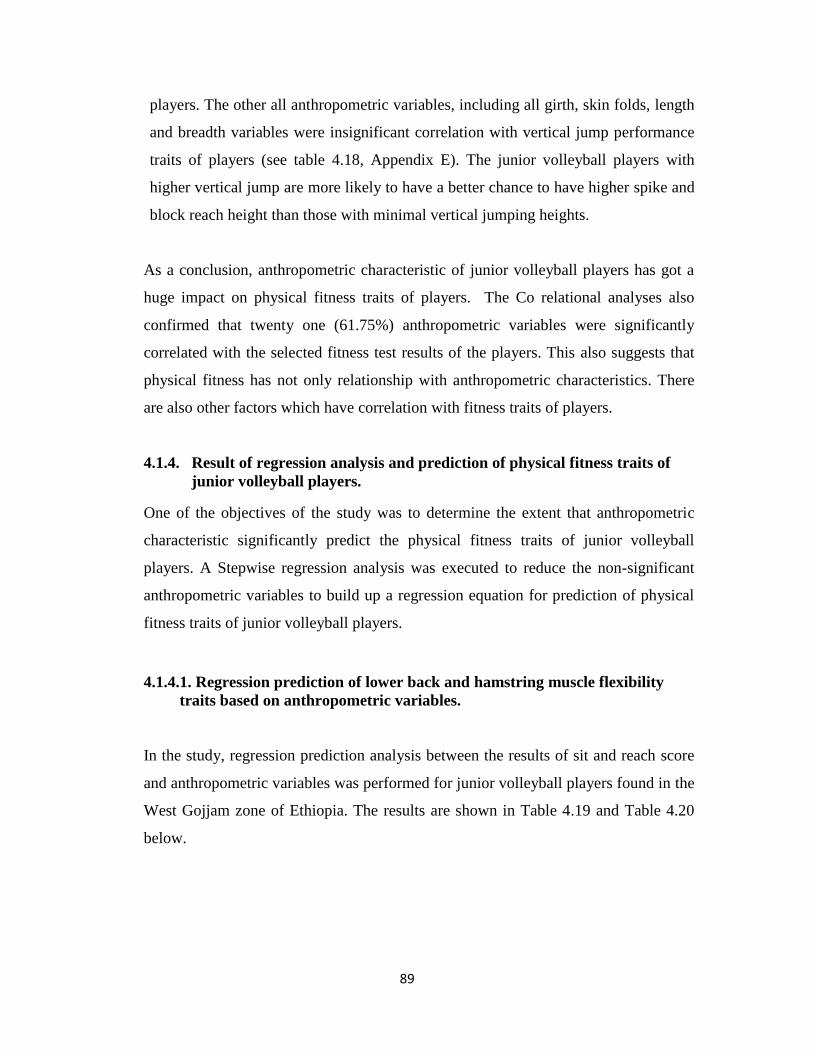
89
players. The other all anthropometric variables, including all girth, skin folds, length
and breadth variables were insignificant correlation with vertical jump performance
traits of players (see table 4.18, Appendix E). The junior volleyball players with
higher vertical jump are more likely to have a better chance to have higher spike and
block reach height than those with minimal vertical jumping heights.
As a conclusion, anthropometric characteristic of junior volleyball players has got a
huge impact on physical fitness traits of players. The Co relational analyses also
confirmed that twenty one (61.75%) anthropometric variables were significantly
correlated with the selected fitness test results of the players. This also suggests that
physical fitness has not only relationship with anthropometric characteristics. There
are also other factors which have correlation with fitness traits of players.
4.1.4. Result of regression analysis and prediction of physical fitness traits of
junior volleyball players.
One of the objectives of the study was to determine the extent that anthropometric
characteristic significantly predict the physical fitness traits of junior volleyball
players. A Stepwise regression analysis was executed to reduce the non-significant
anthropometric variables to build up a regression equation for prediction of physical
fitness traits of junior volleyball players.
4.1.4.1. Regression prediction of lower back and hamstring muscle flexibility
traits based on anthropometric variables.
In the study, regression prediction analysis between the results of sit and reach score
and anthropometric variables was performed for junior volleyball players found in the
West Gojjam zone of Ethiopia. The results are shown in Table 4.19 and Table 4.20
below.
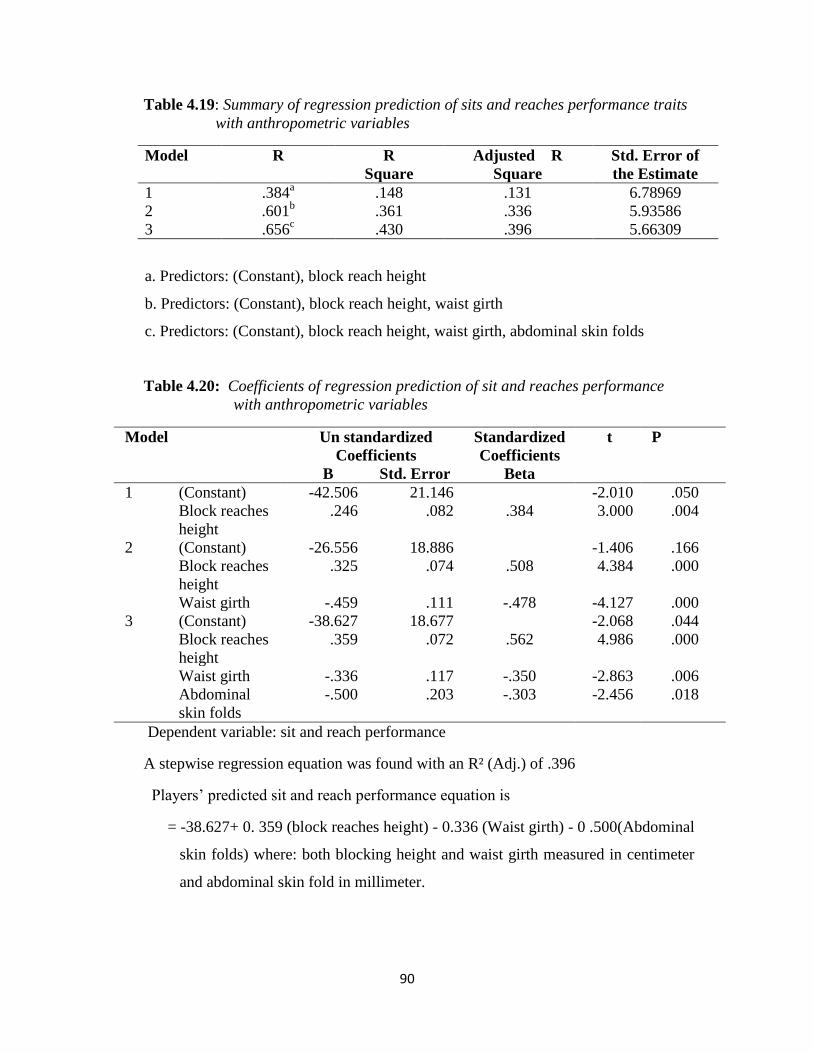
90
Table 4.19: Summary of regression prediction of sits and reaches performance traits
with anthropometric variables
Model R R
Square
Adjusted R
Square
Std. Error of
the Estimate
1 .384a .148 .131 6.78969
2 .601b .361 .336 5.93586
3 .656c .430 .396 5.66309
a. Predictors: (Constant), block reach height
b. Predictors: (Constant), block reach height, waist girth
c. Predictors: (Constant), block reach height, waist girth, abdominal skin folds
Table 4.20: Coefficients of regression prediction of sit and reaches performance
with anthropometric variables
Model Un standardized
Coefficients
Standardized
Coefficients
t P
B Std. Error Beta
1 (Constant) -42.506 21.146 -2.010 .050
Block reaches
height
.246 .082 .384 3.000 .004
2 (Constant) -26.556 18.886 -1.406 .166
Block reaches
height
.325 .074 .508 4.384 .000
Waist girth -.459 .111 -.478 -4.127 .000
3 (Constant) -38.627 18.677 -2.068 .044
Block reaches
height
.359 .072 .562 4.986 .000
Waist girth -.336 .117 -.350 -2.863 .006
Abdominal
skin folds
-.500 .203 -.303 -2.456 .018
Dependent variable: sit and reach performance
A stepwise regression equation was found with an R² (Adj.) of .396
Players‟ predicted sit and reach performance equation is
= -38.627+ 0. 359 (block reaches height) - 0.336 (Waist girth) - 0 .500(Abdominal
skin folds) where: both blocking height and waist girth measured in centimeter
and abdominal skin fold in millimeter.
91
If blocking height and waist girth held constant, then the sit and reach traits decreased
by 0.500 cm for each millimeter increment in abdominal skin folds, Whereas, if the
waist girth and abdominal skin fold held constant, then sit and reach the performance
traits of players increased by 0.357 cm for each centimeter increment in blocking
heights.
A multiple linear regression was calculated to predict sit and reach or flexibility of
lower back and hamstrings muscle performance for junior volleyball players based on
the selected anthropometric variables. As a result blocking reach height, Waist girth
and abdominal skin fold were found to predict of sit and reach (flexibility)
performance traits of junior volleyball players. These factors explain about 39.6 % of
the variation of flexibility of lower back and hamstring muscles of for junior
volleyball players. 0.396 were the composite score of the three anthropometric
variables (Block reach height, Waist girth and abdominal skin folds)
The independent contribution of Block reach height was scored 0 .138 of the total 0
.396 predicted the flexibility of lowers back and hamstring muscles of for junior
volleyball players. The independent contribution of Waist girth was scored - .116 of
the total .396 predicted the flexibility of lower back and hamstring muscles of for
junior volleyball players. The independent contribution of abdominal skin folds was
scored -.152 of the total .396 predicted the flexibility of lower back and hamstring
muscles of for junior volleyball players. From the three independent variables
(anthropometric variables) the most predictable variable was abdominal skin folds.
4.1.4.2. Regression prediction of the upper body strength traits based on
anthropometric variables.
In this study regression prediction analysis between the results of the push up test and
anthropometric variables was performed for junior volleyball player. The result is
shown in Table 4.21 and Table 4.22 below.
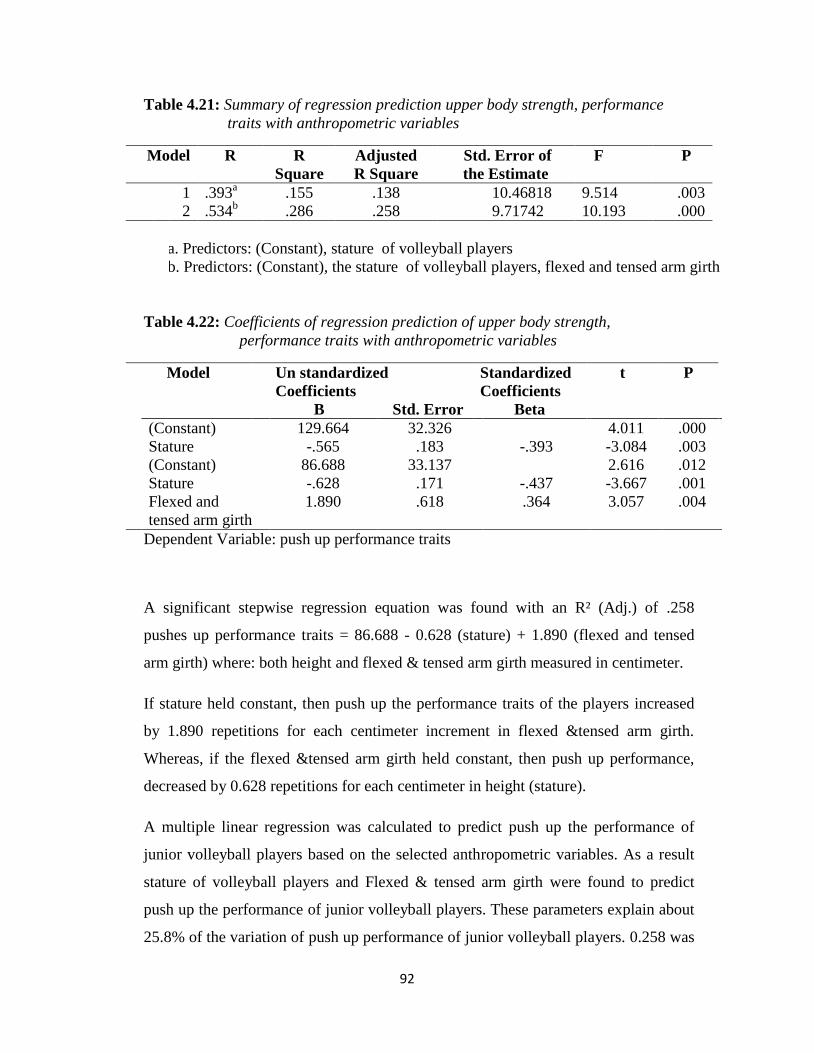
92
Table 4.21: Summary of regression prediction upper body strength, performance
traits with anthropometric variables
Model R R
Square
Adjusted
R Square
Std. Error of
the Estimate
F P
1 .393a .155 .138 10.46818 9.514 .003
2 .534b .286 .258 9.71742 10.193 .000
a. Predictors: (Constant), stature of volleyball players
b. Predictors: (Constant), the stature of volleyball players, flexed and tensed arm girth
Table 4.22: Coefficients of regression prediction of upper body strength,
performance traits with anthropometric variables
Model Un standardized
Coefficients
Standardized
Coefficients
t P
B Std. Error Beta
1 (Constant) 129.664 32.326 4.011 .000
Stature -.565 .183 -.393 -3.084 .003
2 (Constant) 86.688 33.137 2.616 .012
Stature -.628 .171 -.437 -3.667 .001
Flexed and
tensed arm girth
1.890 .618 .364 3.057 .004
Dependent Variable: push up performance traits
A significant stepwise regression equation was found with an R² (Adj.) of .258
pushes up performance traits = 86.688 - 0.628 (stature) + 1.890 (flexed and tensed
arm girth) where: both height and flexed & tensed arm girth measured in centimeter.
If stature held constant, then push up the performance traits of the players increased
by 1.890 repetitions for each centimeter increment in flexed &tensed arm girth.
Whereas, if the flexed &tensed arm girth held constant, then push up performance,
decreased by 0.628 repetitions for each centimeter in height (stature).
A multiple linear regression was calculated to predict push up the performance of
junior volleyball players based on the selected anthropometric variables. As a result
stature of volleyball players and Flexed & tensed arm girth were found to predict
push up the performance of junior volleyball players. These parameters explain about
25.8% of the variation of push up performance of junior volleyball players. 0.258 was
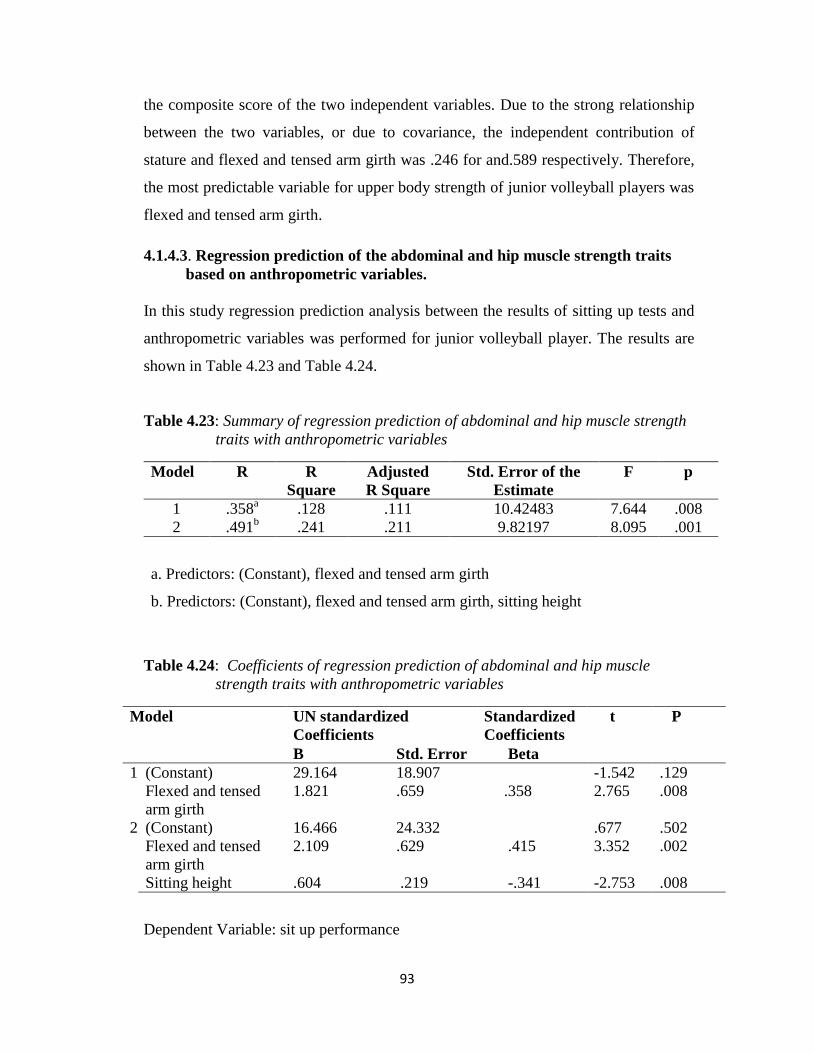
93
the composite score of the two independent variables. Due to the strong relationship
between the two variables, or due to covariance, the independent contribution of
stature and flexed and tensed arm girth was .246 for and.589 respectively. Therefore,
the most predictable variable for upper body strength of junior volleyball players was
flexed and tensed arm girth.
4.1.4.3. Regression prediction of the abdominal and hip muscle strength traits
based on anthropometric variables.
In this study regression prediction analysis between the results of sitting up tests and
anthropometric variables was performed for junior volleyball player. The results are
shown in Table 4.23 and Table 4.24.
Table 4.23: Summary of regression prediction of abdominal and hip muscle strength
traits with anthropometric variables
Model R R
Square
Adjusted
R Square
Std. Error of the
Estimate
F p
1 .358a .128 .111 10.42483 7.644 .008
2 .491b .241 .211 9.82197 8.095 .001
a. Predictors: (Constant), flexed and tensed arm girth
b. Predictors: (Constant), flexed and tensed arm girth, sitting height
Table 4.24: Coefficients of regression prediction of abdominal and hip muscle
strength traits with anthropometric variables
Model UN standardized
Coefficients
Standardized
Coefficients
t P
B Std. Error Beta
1 (Constant) 29.164 18.907 -1.542 .129
Flexed and tensed
arm girth
1.821 .659 .358 2.765 .008
2 (Constant) 16.466 24.332 .677 .502
Flexed and tensed
arm girth
2.109 .629 .415 3.352 .002
Sitting height .604 .219 -.341 -2.753 .008
Dependent Variable: sit up performance
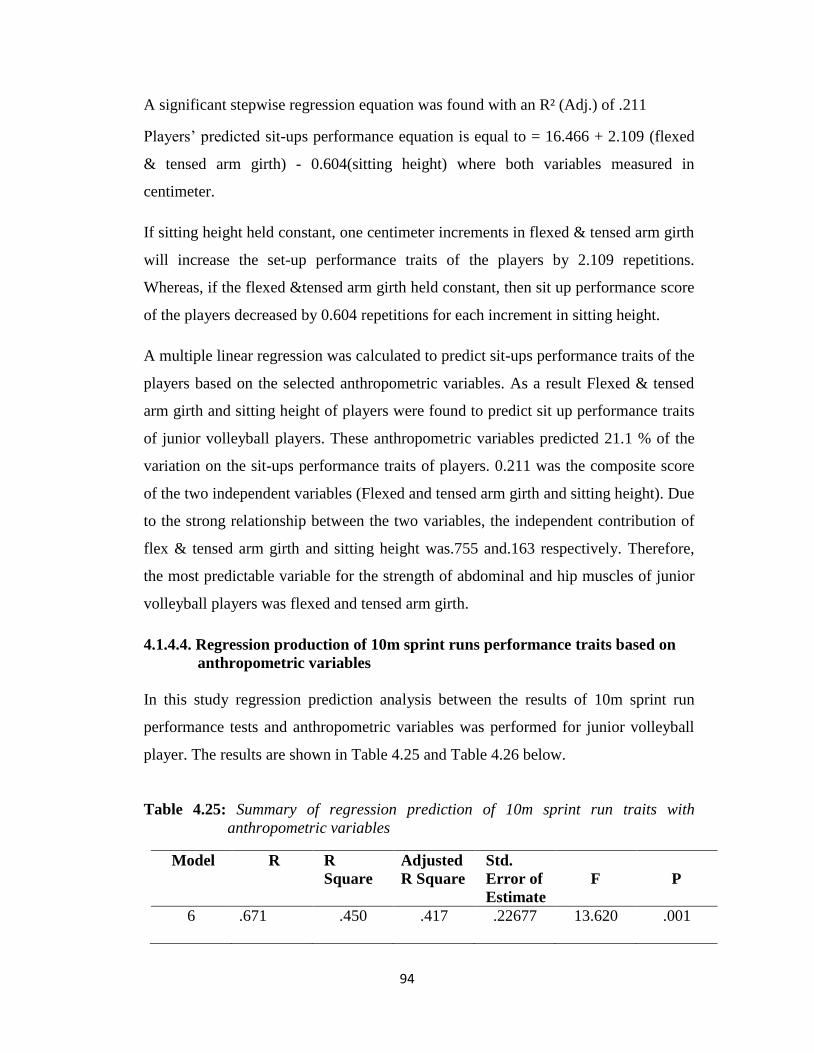
94
A significant stepwise regression equation was found with an R² (Adj.) of .211
Players‟ predicted sit-ups performance equation is equal to = 16.466 + 2.109 (flexed
& tensed arm girth) - 0.604(sitting height) where both variables measured in
centimeter.
If sitting height held constant, one centimeter increments in flexed & tensed arm girth
will increase the set-up performance traits of the players by 2.109 repetitions.
Whereas, if the flexed &tensed arm girth held constant, then sit up performance score
of the players decreased by 0.604 repetitions for each increment in sitting height.
A multiple linear regression was calculated to predict sit-ups performance traits of the
players based on the selected anthropometric variables. As a result Flexed & tensed
arm girth and sitting height of players were found to predict sit up performance traits
of junior volleyball players. These anthropometric variables predicted 21.1 % of the
variation on the sit-ups performance traits of players. 0.211 was the composite score
of the two independent variables (Flexed and tensed arm girth and sitting height). Due
to the strong relationship between the two variables, the independent contribution of
flex & tensed arm girth and sitting height was.755 and.163 respectively. Therefore,
the most predictable variable for the strength of abdominal and hip muscles of junior
volleyball players was flexed and tensed arm girth.
4.1.4.4. Regression production of 10m sprint runs performance traits based on
anthropometric variables
In this study regression prediction analysis between the results of 10m sprint run
performance tests and anthropometric variables was performed for junior volleyball
player. The results are shown in Table 4.25 and Table 4.26 below.
Table 4.25: Summary of regression prediction of 10m sprint run traits with
anthropometric variables
Model R R
Square
Adjusted
R Square
Std.
Error of
Estimate
F
P
6 .671
.450 .417 .22677 13.620 .001
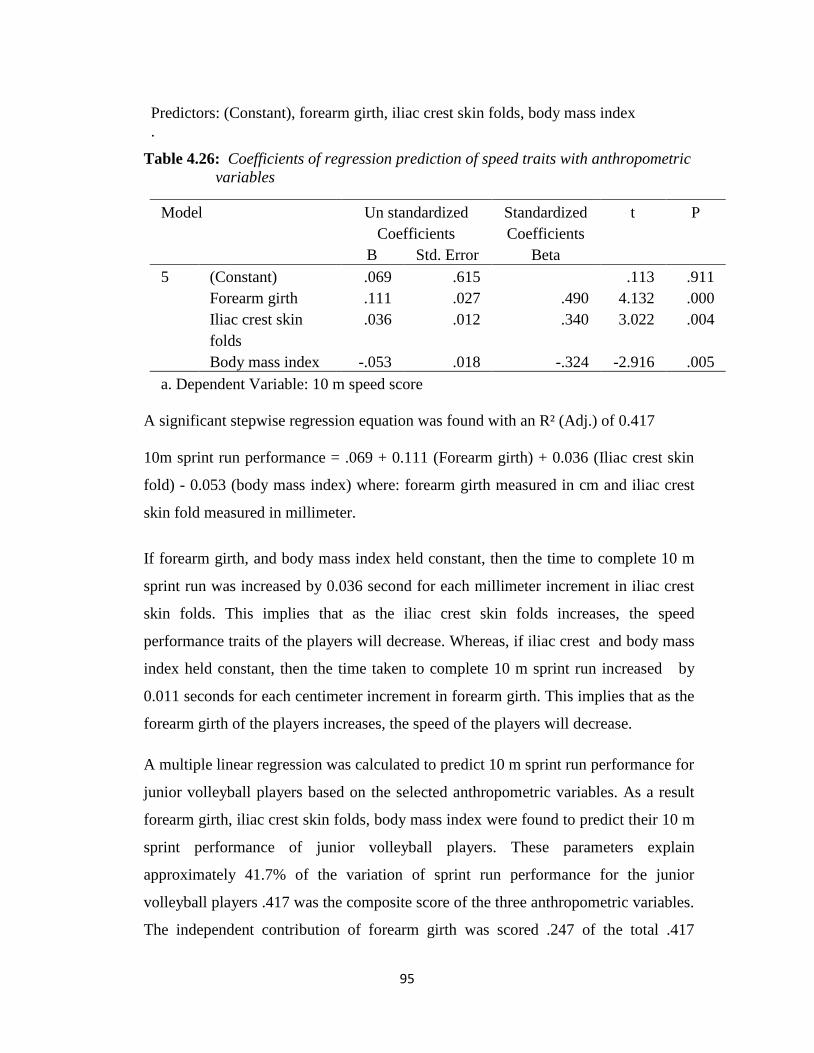
95
Predictors: (Constant), forearm girth, iliac crest skin folds, body mass index
.
Table 4.26: Coefficients of regression prediction of speed traits with anthropometric
variables
Model Un standardized
Coefficients
Standardized
Coefficients
t P
B Std. Error Beta
5 (Constant) .069 .615 .113 .911
Forearm girth .111 .027 .490 4.132 .000
Iliac crest skin
folds
.036 .012 .340 3.022 .004
Body mass index -.053 .018 -.324 -2.916 .005
a. Dependent Variable: 10 m speed score
A significant stepwise regression equation was found with an R² (Adj.) of 0.417
10m sprint run performance = .069 + 0.111 (Forearm girth) + 0.036 (Iliac crest skin
fold) - 0.053 (body mass index) where: forearm girth measured in cm and iliac crest
skin fold measured in millimeter.
If forearm girth, and body mass index held constant, then the time to complete 10 m
sprint run was increased by 0.036 second for each millimeter increment in iliac crest
skin folds. This implies that as the iliac crest skin folds increases, the speed
performance traits of the players will decrease. Whereas, if iliac crest and body mass
index held constant, then the time taken to complete 10 m sprint run increased by
0.011 seconds for each centimeter increment in forearm girth. This implies that as the
forearm girth of the players increases, the speed of the players will decrease.
A multiple linear regression was calculated to predict 10 m sprint run performance for
junior volleyball players based on the selected anthropometric variables. As a result
forearm girth, iliac crest skin folds, body mass index were found to predict their 10 m
sprint performance of junior volleyball players. These parameters explain
approximately 41.7% of the variation of sprint run performance for the junior
volleyball players .417 was the composite score of the three anthropometric variables.
The independent contribution of forearm girth was scored .247 of the total .417
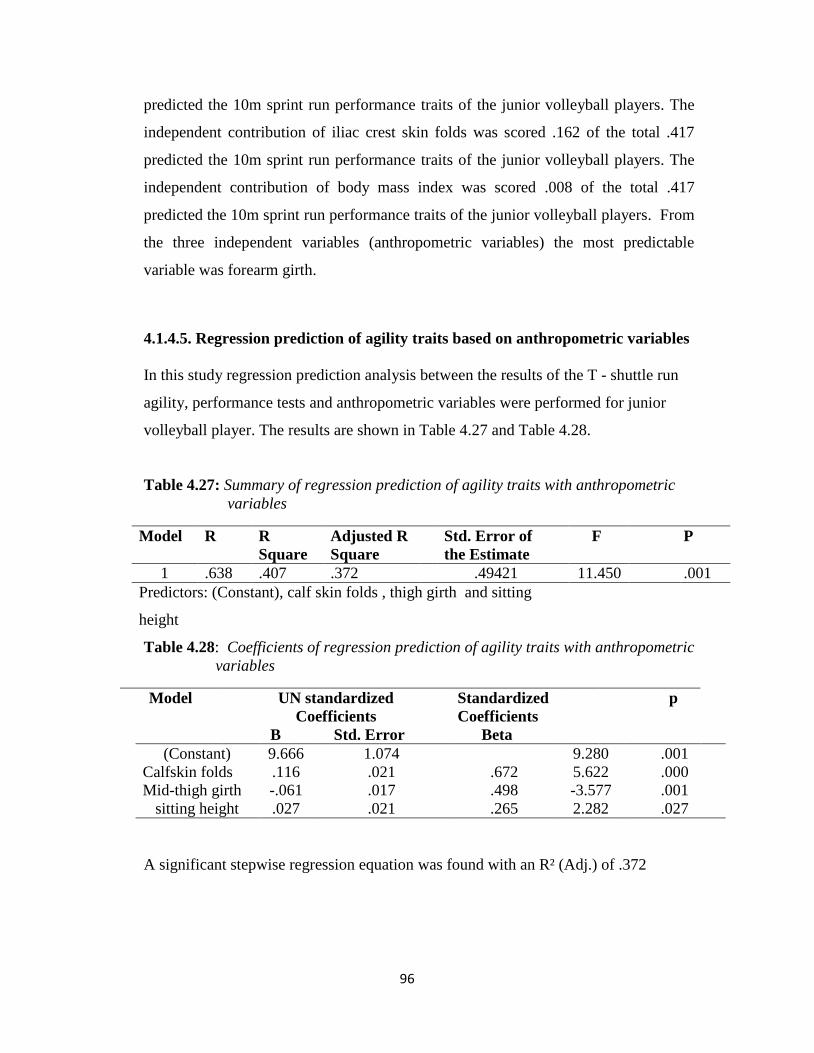
96
predicted the 10m sprint run performance traits of the junior volleyball players. The
independent contribution of iliac crest skin folds was scored .162 of the total .417
predicted the 10m sprint run performance traits of the junior volleyball players. The
independent contribution of body mass index was scored .008 of the total .417
predicted the 10m sprint run performance traits of the junior volleyball players. From
the three independent variables (anthropometric variables) the most predictable
variable was forearm girth.
4.1.4.5. Regression prediction of agility traits based on anthropometric variables
In this study regression prediction analysis between the results of the T - shuttle run
agility, performance tests and anthropometric variables were performed for junior
volleyball player. The results are shown in Table 4.27 and Table 4.28.
Table 4.27: Summary of regression prediction of agility traits with anthropometric
variables
Model R R
Square
Adjusted R
Square
Std. Error of
the Estimate
F P
1 .638 .407 .372 .49421 11.450 .001
Predictors: (Constant), calf skin folds , thigh girth and sitting
height
Table 4.28: Coefficients of regression prediction of agility traits with anthropometric
variables
Model UN standardized
Coefficients
Standardized
Coefficients
t p
B Std. Error Beta
1 (Constant) 9.666 1.074 9.280 .001
Calfskin folds .116 .021 .672 5.622 .000
Mid-thigh girth -.061 .017 .498 -3.577 .001
sitting height .027 .021 .265 2.282 .027
A significant stepwise regression equation was found with an R² (Adj.) of .372
97
Players‟ predicted T- shuttle run agility performance equation is = 9.666 +.116 (calf
skin folds) - .061 (Mid-thigh girth) + .027 (sitting height) where: calf skin folds
measured in millimeter. Mid-thigh girth and sitting height measured in centimeter.
The time taken to complete T- shuttle agility run was increased by .116 seconds for
each millimeter increment in calf skin folds. This implies that greater skin fold
thickness on the mid calf has a negative effect on agility performance traits of the
players. Whereas, if calf skin folds and sitting height held constant, then the time
taken to complete T- shuttle agility run decreased by 0.061 seconds for each
centimeter increment in mid-thigh girth. This implies that as the mid-thigh girth of the
players increases, the speed of the players will also increase.
A multiple linear regression was calculated to predict T- shuttle agility run
performance for junior volleyball players based on the selected anthropometric
variables. As a result calf skin folds, Mid-thigh girth and sitting height were found to
predict the T shuttle agility run of junior volleyball players. These variables explain
37.2 % of the variation on agility performance traits of players.
The independent contribution of calf skin folds was scored .055 to predict the T
shuttle agility run of junior volleyball players. The independent contribution of Mid-
thigh girth and sitting height was scored .006 and .002 respectively. From the three
independent variables (anthropometric variables) the most predictable variable was
calf skin folds.
4.1.4.6. Regression prediction of explosive power of lower extremities based on
anthropometric variables
In this study regression prediction analysis between the results vertical jump
performance tests and anthropometric variables was performed for junior volleyball
player. The results are shown in Table 4.29 and Table 4.30 below.
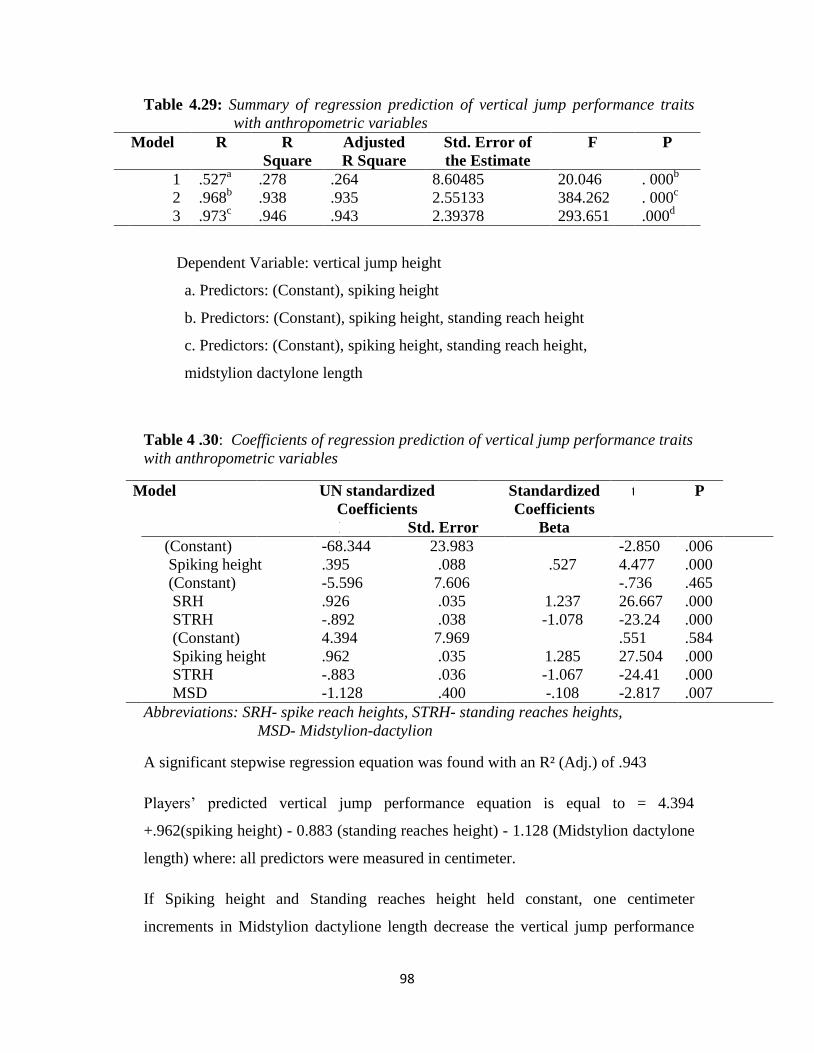
98
Table 4.29: Summary of regression prediction of vertical jump performance traits
with anthropometric variables
Model R R
Square
Adjusted
R Square
Std. Error of
the Estimate
F P
1 .527a .278 .264 8.60485 20.046 . 000
b
2 .968b .938 .935 2.55133 384.262 . 000
c
3 .973c .946 .943 2.39378 293.651 .000
d
¤
Dependent Variable: vertical jump height
a. Predictors: (Constant), spiking height
b. Predictors: (Constant), spiking height, standing reach height
c. Predictors: (Constant), spiking height, standing reach height,
midstylion dactylone length
Table 4 .30: Coefficients of regression prediction of vertical jump performance traits
with anthropometric variables
Model UN standardized
Coefficients
Standardized
Coefficients
t P
B Std. Error Beta
1 (Constant) -68.344 23.983 -2.850 .006
Spiking height .395 .088 .527 4.477 .000
2 (Constant) -5.596 7.606 -.736 .465
SRH .926 .035 1.237 26.667 .000
STRH -.892 .038 -1.078 -23.24 .000
3 (Constant) 4.394 7.969 .551 .584
Spiking height .962 .035 1.285 27.504 .000
STRH -.883 .036 -1.067 -24.41 .000
MSD -1.128 .400 -.108 -2.817 .007
Abbreviations: SRH- spike reach heights, STRH- standing reaches heights,
MSD- Midstylion-dactylion
A significant stepwise regression equation was found with an R² (Adj.) of .943
Players‟ predicted vertical jump performance equation is equal to = 4.394
+.962(spiking height) - 0.883 (standing reaches height) - 1.128 (Midstylion dactylone
length) where: all predictors were measured in centimeter.
If Spiking height and Standing reaches height held constant, one centimeter
increments in Midstylion dactylione length decrease the vertical jump performance
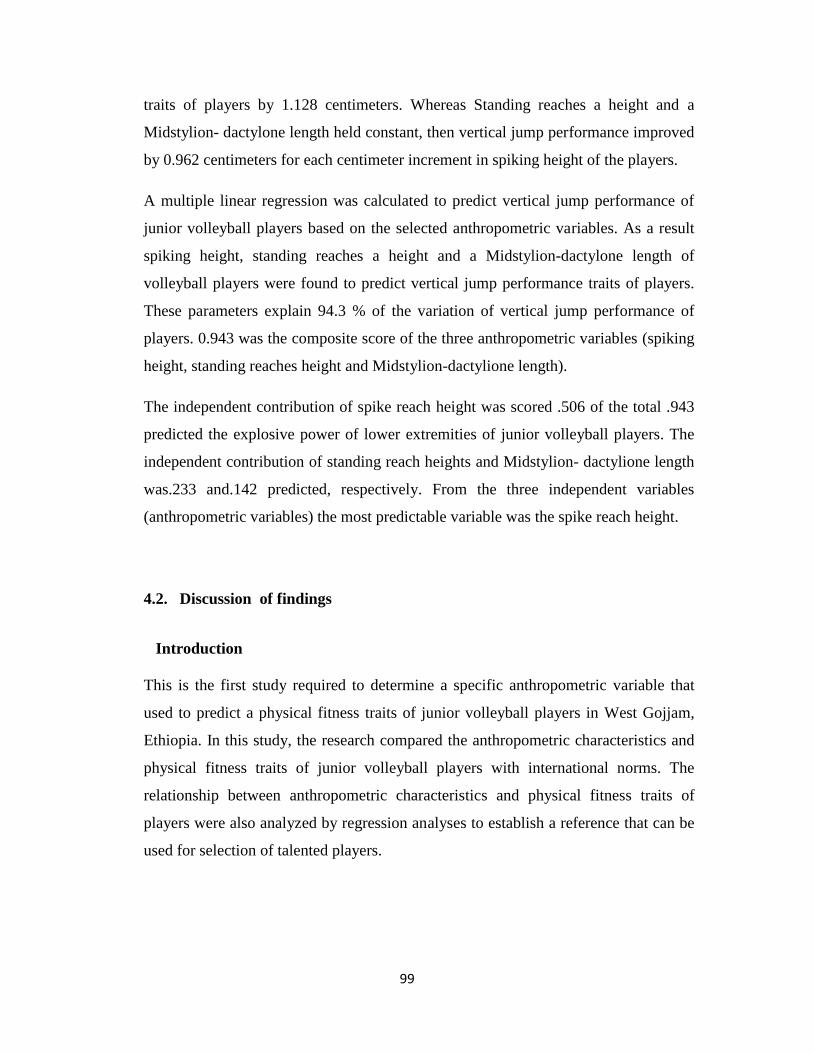
99
traits of players by 1.128 centimeters. Whereas Standing reaches a height and a
Midstylion- dactylone length held constant, then vertical jump performance improved
by 0.962 centimeters for each centimeter increment in spiking height of the players.
A multiple linear regression was calculated to predict vertical jump performance of
junior volleyball players based on the selected anthropometric variables. As a result
spiking height, standing reaches a height and a Midstylion-dactylone length of
volleyball players were found to predict vertical jump performance traits of players.
These parameters explain 94.3 % of the variation of vertical jump performance of
players. 0.943 was the composite score of the three anthropometric variables (spiking
height, standing reaches height and Midstylion-dactylione length).
The independent contribution of spike reach height was scored .506 of the total .943
predicted the explosive power of lower extremities of junior volleyball players. The
independent contribution of standing reach heights and Midstylion- dactylione length
was.233 and.142 predicted, respectively. From the three independent variables
(anthropometric variables) the most predictable variable was the spike reach height.
4.2. Discussion of findings
Introduction
This is the first study required to determine a specific anthropometric variable that
used to predict a physical fitness traits of junior volleyball players in West Gojjam,
Ethiopia. In this study, the research compared the anthropometric characteristics and
physical fitness traits of junior volleyball players with international norms. The
relationship between anthropometric characteristics and physical fitness traits of
players were also analyzed by regression analyses to establish a reference that can be
used for selection of talented players.
100
4.2.1. Comparative analysis of selected anthropometric characteristics of
junior volleyball players in West Gojjam, Ethiopia and international
norms.
Among the various anthropometric variables of volleyball players, the stature or body
height, body weight, body mass index, spike and block reach height are the most
important anthropometric characteristics and used to determine talent and success of
players (Jin, Liu, Zhang & Ge 2007; Jose, Palau, Policarpo, Manzanares & David,
2014; Wood, 2015; Michael, 2016; Andrea, 2017). Hence, firstly discussed on these
anthropometric variables of junior volleyball players found in the west Gojjam,
Ethiopia, and junior national team of the world championships.
4.2.1.1. The Stature of junior volleyball players
In the present study, the mean body heights (stature) of junior volleyball players in
the West Gojjam zone of Ethiopia were significantly shorter than international norms
(p˂ 0.001). The stature of junior volleyball players in the West Gojjam zone of
Ethiopia and the international norms was 176.25+7.18cm and 193.94 + 8.24cm
respectively. There was about 17.69cm gap between them. The mean stature of our
players was almost similar to the finding of the study reported by Bandyopadhyay
(2007), 173.10 ± 4.19 cm, and Mandal, Maity and Sahu (2015), 176.34 ± 3.54cm. In
contrast, the finding of this study was not alien with the findings reported by Duncan
et al., (2006) and Petro ski et al., (2013). The stature of England and Brazilian junior
national team players were 191.00 ±5.0 cm, Duncan et al., (2006) and 197.0 ± 8.0 cm,
Petro ski et al (2013). The height of players largely (80%) determined by genetic
makeup of players and the rest 20% related to environmental factors, including,
physical activity climates, dietary habits, health states, traits of players and lifestyle
(Jafari,2006).
In volleyball, unique anthropometric characteristics are required for the highest traits
of performance (Bourgeois et al., 2000; Reilly, Bangsbo, & Franks, 2000; Ackland,
Ong, Kerr, & Ridge, 2003; Slater et al., 2005; Gaurav, Singh & Singh, 2010; Singh,
& Behera, 2013). Stature is the most vital anthropometric characteristic. The tallest
101
player in volleyball has an advantage in both defensive and offensive actions and to
dominate over the net (Gaurav, Singh, Singh, 2010; Stamm, et al 2003). Effective
execution of volleyball skills as well as the service depends on the stature of the
players (Stanganelli, Dour ado, Oncken, Mancan, & DA Costa, 2008).
During competition, the height of the player over the net always played a vital role to
win the game. Attacking and blocking represent 45% of the total actions in a game
and 80% of the scores obtained in international matches (Zhang, 2010). Therefore, a
team will lose its capacity of winning if there is a lack of predominance over the net
(Tian, 2006), and hence, it has been used as the base for selection of players
(Tokuyama, Ohashi, Iwamoto, Takaoka & Okubo, 2004; Ahmed & AlMaghawry,
2012).
4.2.1.2. Body weight of junior volleyball players
In our study, the mean body weight of junior volleyball players in the West Gojjam
zone of Ethiopia was significantly lower than international norms (p˂ .001). The
mean body weight of junior volleyball players in the West Gojjam zone of Ethiopia
and the international norms was 60.12+7.64 kg and 82.21 + 9.70 kg respectively.
There was about 22.09 kg difference between them. Our player was 28.45kg,
23.63kg, 23.38kg, 17.71kg, and 17.29 kg lighter than Brazilian, Egyptian, Iranians,
japans and Italians junior national team players respectively (see table 4-3,
appendix). the body weight of our players was not parallel to the finding reported by
Mandal, Maity and Sahu, (2015), 65.07 ± 9.82kg, and Koley, Singh and Sandhu,
(2010), 69.09+ 69.09kg. Additionally, the mean body weight of our junior volleyball
players was inconsistent with other findings. The mean body weight of England
junior volleyball players was between 71.2kg and 77.9kg, as reported by Wood field
and al-Nakeeb (2006). The average body weight of Turkish junior volleyball players
was also similar to the England junior volleyball players, (74.8kg) as reported by
Aytek (2007). The mean body weight of American junior volleyball players was also
similar to the mean weight of Europeans junior players, which was 71.1kg +9.6kg as
102
reported by Gabbett, Georgieff & Domrow (2007). The mean body weight of
Australian junior national team volleyball players was greater than world average
norms. That is 88.4 + 7.7 kg (Newton, 2012).
The body weight of players is affected by genetic makeup, traits of players, physical
activity, availability of a balanced diet, environmental condition and social factors
(National Academies Press, 2006; National Academies Press, 2004). The quantity and
quality of foods eaten and meal patterns affect the weight of the players at a great
extent. Therefore, the minimal weight of our players might be related to traits of
players, eating habits of their parents and the society. Besides, the minimal weight of
our players might be also associated with genetic make and socioeconomic status of
players.
As research indicates, international junior volleyball players were heavier because of
the density of their bones and higher proportion of lean muscle mass rather than fat
accumulation (Stamm, Stamm, & Jairus, 2017).There for, heavier volleyball players
with normal adipose tissue (until 10%) are more preferable than lighter players and
they are more efficient at attack than light players (Stamm et al., 2017). The heavier
player in volleyball has an advantage in offensive actions and significantly heavier
body weight among volleyball players might be disadvantageous to them in attaining
a good jumping height as they have to lift a great weigh. Therefore, coaches and
related bodies should carefully consider the weight of players while selecting players.
4.2.1.3. Body mass index of junior volleyball players
In this study, the mean body mass index of junior volleyball players, West Gojjam,
Ethiopia, was 19.42+1.82. It was significantly (p˂ 0.001) lower than world average
traits 21.80+1.84. The mean body mass index of Ethiopia junior volleyball players
was almost similar to junior volleyball players reported by Kali, Singh and Sandhu,
(2010), 20.66 +2.46 and Aytek (2007), 20.72, + 2.14. The body mass index of
Turkish junior Volleyball players was similar to world class junior volleyball players
103
(Aytek, 2007). The mean body mass index of Brazilian junior national volleyball
players was not aligned with our findings. The mean body mass index of Brazilian
junior national volleyball players in 2002, 2003 and 2004 were 22.0 + 2.2, 22.1 +1.6
and 22.8+1.8 respectively (Petroski, et al.,2013). It was normal but relatively greater
than the body mass index of Ethiopians. Our players mean body mass index were
3.09 (p<0.001) and 1.68 (p< 0.05) lesser than Brazilians and Egyptians junior
national team players respectively.
The normal body mass index of players is between 18.5and 24.9 (Ventures,
2017).Since Body mass index (BMI), does not distinguish lean tissue from fatty tissue
and often describes muscular players as overweight. Therefore, body mass index is
not always a reliable indicator of body fatness (Romero-Corral et al. 2008). However,
volleyball players with normal body mass index are more successful in serving
(Maghsoud, Rezvan and Hassan (2013). Players with lean muscles have got a number
of advantages. In terms of metabolic rate, weight control, mobility, strength, self-
esteem and injury reductions (Clinic, 2019).
4.2.1.4. Spike and block reach heights of junior volleyball players
The statistical analysis of this study confirmed that the mean spike and block reach
heights of junior volleyball players in the West Gojjam zone of Ethiopia were
significantly lower than world average traits (p˂ 0.001). The result confirmed that the
spike and block reach a height of junior volleyball players in the West Gojjam zone
of Ethiopians were 271.62+13.40cm and 258.05+11.39cm respectively. The world
average spike and block reach height was 325.12+16.15cm and 307.88+13.00cm
respectively. There was about 43.5 cm and 49.83 cm gaps in both spike and block
reach heights of players respectively. To be more specific, the spike reach height of
our players was 63.21 cm and 38.21cm shorter than Brazilian and Egyptians junior
national team players respectively. The highest spike reaches height scored by the
Canadian junior volleyball player. His spike reach height was 382 cm (Keith, 2017).
This is 111cm greater than our junior volleyball players.
104
It was also observed that players that the highest block reach heights were belong to
Brazilian (316.33cm +11.01cm) and Iranian (313.33cm +13.37cm) players, followed
by Japanese (312.75cm +11.19cm) national team players. The block reaches heights
of our players were 34.03cm and 55.28cm shorter than Egyptian and Iranians junior
volleyball players.
The spike and block reach heights of players is determined by the stature of the
players, their technical ability of jumping , including the joint angle, the take off
phase and the resistance of air or gravitational force (Rupesh, 2010). Therefore, the
minimal spike and block reach heights of our players might be associated with their
minimal height and their technical limitations while jumping to spike and block the
ball.
In volleyball, the spike and block reach heights represent 45% of total actions and
80% of the points obtained within international matches (Marques, Van den Tyler,
Vescovi, & Gonzalez- Badillo, 2008; Lobietti, Michele & Merni ,2006; Voigt &
Vetter, 2003).There for, it‟s very vital to consider spike and block reach height of
players while searching talented players. Volleyball Coaches, physical educators and
sport directors should focus on these activities during the selection of players.
In summary, junior volleyball players found in the West Gojjam zone of Ethiopians
are demonstrated minimum heights, weights, spike and block reach heights when
compared to a top national team of the world. These indicate that junior volleyball
players found in west Gojjam Ethiopians are disadvantaged for volleyball sport.
4.2.2. Comparative analysis of selected basic anthropometric characteristics
among junior volleyball players in the west Gojjam, Ethiopia.
In our study, there was a significant difference in stature (p˂ .01), in spike (p˂ .01)
and block reaches heights (p˂.01), among junior volleyball player in the West Gojjam
105
zone of Ethiopia. There wasn‟t any significant difference in body weight among
junior players in the West Gojjam zone of Ethiopia (p˂ .05).
In stature, there was a significant difference between the player in the West Gojjam
zone of Ethiopia (p˂0.01).Durbietie junior volleyball team players were the tallest,
179.66+5.08cm, followed by Shendie Wenbrma players, 178.00 +8.96cm and
Qunzla, 171.11cm+6.49cm, team players. This means, the height of Qunzla team
players was 8.55cm and 6.89cm lesser than Durbietie and Qunzla team players
respectively.
In weight, there was no significant difference in body weight among junior players in
the West Gojjam zone of Ethiopia (p˂.05). This implies that the weight of junior
volleyball players in the West Gojjam zone, Ethiopia was almost similar. The
statistical analysis also revealed the presence of significant differences in both spike
and block reach heights among the players in the three teams found in the West
Gojjam zone of Ethiopia (p˂.001). The significant differences in spike (p˂.001) and
block (p˂ .001) reach heights found only between Durbietie and Qunzla team players.
The spike and block reach heights of Durbietie team players were 275.27+11.29 cm
and 259.66 +8.73 cm respectively, which was 13.33 cm and 10.83cm greater than that
of Qunzla team players. There was also a significant difference in both spike and
block reach heights between Shendie Wenbrma and Qunzla team players (p˂.001).
The spike and block reach heights of Shendie Wenbrma team players were 15.72 cm
and 16.83cm greater than that of Qunzla players.
4.2.3. Comparative analysis of selected anthropometric characteristics of junior
volleyball players in the west Gojjam, Ethiopia.
The present study verified that the mean sitting height and standing reach height of
junior players in the west Gojjam of Ethiopia, was 89.24+6.23cm and
232.09+12.13cm respectively. The mean skin folds thickness on the six selected sites
of the junior volleyball players in the west Gojjam was 12.07+3.53mm. The girth, the
length and the breadth mean values of junior volleyball players also discussed below.
106
4.2.3.1. Sitting and standing reaches height of junior volleyball players.
This study confirmed that the sitting height of junior players in the west Gojjam of
Ethiopia was 89.24+6.23cm. It was lesser than the findings of previous researches.
The mean sitting height of Indian junior volleyball players was 91.84 ± 4.36cm and
95.61 + 2.87cm, as reported by Aouadi, Nawi and Alanazi (2015) and Sameer Kumar
and Yadav (2015) respectively. It was also significantly less than the Sitting height of
Brazilian junior volleyball players 150.1+3.8 cm (Muniz, Cossio-Bolaños, Gomez
Campos, Gonçalves, Lázari, Urra-Albornoz, & De Arruda, 2017).
The Standing reaches height of junior players in the West Gojjam zone of Ethiopia
was 232.09+12.13cm. This was lesser than Australian junior volleyball players, 240.8
+10.9cm, as reported by Tim Gabbett, Boris Georgie and Domrow (2007). There was
very strong correlations (r = 0.85; p <.01) Observed between standing reach height
and jump performance traits of volleyball players (Sheppard et al., 2008) That means,
as the standing height increases, the vertical jumping height of the players will also
increase. By implication, players with greater standing reach heights are better for
spiking and blocking actions in volleyball.
4.2.3.2. The skin folds thickness of junior volleyball players.
The mean skin folds thickness on the six selected sites of the junior volleyball players
in the west Gojjam was 12.07+3.53mm. Our results were inconsistent with the
findings reported by Petroski, et al., (2013), and consistent with the report made by
Muniz et al., (2017). The mean skin folds thickness of Brazilian junior volleyball
players was 9.24+ 2.16 mm (Petroski, et al., 2013). Whereas, the mean skin folds
thickness of Brazilian junior volleyball players reported by Muniz et al., (2017) was
12.28mm. That was similar to our players.But lesser than those reported by Koley,
Singh and Sandhu (2010) and Bandyopadhyay (2007).
The maximum and minimal skin folds thickness observed in the abdomen and mid-
thigh of junior volleyball players. That was 13.22+4.41mm, and 11.75+3.81mm
107
respectively. In contrast, the maximum and minimal skin fold thickness reported by
Petroski, et al., (2013), was observed on super iliac, 11. 4 + 3.5 mm and calf 7.3+1.7
mm skin folds sites, respectively.
Our result was similar to those reported by Muniz et al., (2017) and in junior
Brazilian volleyball players, 12.28mm, Having lean muscles is important to maintain
a higher metabolism rate so that it‟s easier to control weight, to have more energy and
increase mobility of players, it also used to have strong bodies and reduce injuries of
the joints (Clinic, 2019).
4.2.3.3. The girth of junior volleyball players
In our study, the mean girth measurements, particularly, the chest, forearm, waist,
gluteus and thigh girth of junior volleyball players in the west Gojjam, Ethiopia was
88.46+7.22cm, 24.72+1.30cm, 77.46+6.19cm, 89.74+6.91cm and 48.07+4.57cm
respectively. It was almost similar to Indian counterparts; their Chest, forearm and
thigh girth was 89.87 +11.91cm, 24.16 +1.65 cm and 51.73 + 4.36cm respectively as
reported by Gaurav and Singh (2014).
4.2.3.4. The lengths of junior volleyball players
The statistical analyses indicated that the mean lengths of the acromiale-dactylion
(derived) of our junior players were 86.66+4.85cm. It was a little bit greater than a
junior volleyball player in India. Their acromiale-dactylion (arm's length) was 82.85
2.73cm and, 81.40 + 4.04 cm as report by, Sameer, Kumar and Yadav (2015) and
Gaurav and Singh (2014) respectively. The mean length of acromiale-radial (upper
arm) of our players were 39.53+2.24cm, whereas acromiale-radial of Indian
counterparts were 33.69 +2.25cm (Gaurav & Singh, 2014), which was 5.85 + 0.01cm
lesser than our players.
108
4.2.3.5. The breadth of junior volleyball players
With regard to breadth, the mean breadth of the players at the shoulder to shoulder
(Biacromia), the chest (transverse chest) the hip width (Biilocristal), Knee, elbow and
hand breads were 48.42 + 3.99 cm, 34.61+4.44cm ,32.53+4.04cm , 11.92+1.06cm,
9.53+0.71cm and 10.81+0.64cm, respectively. This was inconsistent with the findings
reported by Gaurav and Singh, (2014). The mean elbow, shoulder, hip and knee
breadth of junior Indians volleyball players were 8.09 +0.59cm, 43.51 + 2.22cm,
29.05+ 4.57 and 9.96 + 0.59cm respectively. This is lesser than our junior players.
4.2.4. Multiple comparative analyses of selected anthropometric characteristics
among junior volleyball players in the west Gojjam, Ethiopia.
There was a significant difference among the players in terms of setting height (p<
.01), standing reach a height (p<. 0.05), skin folds, particularly, iliac crest skin folds
(p<. 01), calf skin folds (p<. 01), thigh skin folds (p<. 01), and sub scapular skin folds
(p<. 05). The only significant difference among the players observed on forearm girth
(p<. 05). In length measurement, significant difference reflected in upper arm length
(p <. 05), acromiale-radial bone (p˃ 0.05), the midst lion – dactyl ion and hand
length, (p ˂. 01). There was also a significant difference between junior volleyball
players in the West Gojjam zone in relation to the Biepicondylar femur (knee) breads,
(p <.05) and hand breads (p<.01).
In setting height, there was a significant difference among the players in West
Gojjam, Ethiopia (p<. 01). Shendie Wenbrma team players were significantly
different from Durbietie team players (p˂. 01) & insignificant differences from
Qunzla team players (p˃. 05). There were also significant differences (p˂ .01).
Among Qunzla and Durbetie team players in their sitting height. Durbietie junior
volleyball team players were 8.22cm and 6.66 cm lesser than Shendie Wenbrma and
Qunzla volleyball team players respectively.
In standing reach height also, there was a significant difference among the players in
the west Gojjam (p<.05). Durbietie team players were significantly higher than
109
Qunzla team players (p <.01) and insignificantly greater than Shendie Wenbrma team
players (p <.05). That was about 10.83 cm gaps between Durbietie and Qunzla team
players in relation to standing reach heights. Moreover, the length of their Midstylion
– Dactylion, Shendie Wenbrma team players were significantly longer than Durbietie
team players (p< .01) but insignificantly longer than Qunzla team players (p<.05).
There were no significant differences among the players on abdominal and triceps
skin folds sites (p˂ .05). There was a significant difference among players on iliac
crest skin folds (p<.01), calf skin folds (p< .01), thigh skin folds (p< .01), and sub
scapular skin folds (p<.05). Skin folds of Durbietie team players were significantly
thicker than Qunzla team players, particularly on calf (p˂.01), sub scapula (p˂ .05),
thigh (p˂ .01) and the iliac crest (p˂.01) sites. Shendie Wenbrma team players also
had shown significantly thicker skin folds than Qunzla team players on the calf (p˂
.01) and thigh p˂ .05) skin fold sites. It is concluded that Qunzla team players had the
least skin fold thickness than Durbietie and Shendie Wenbrma junior volleyball team
players. This implies that junior volleyball players found in the west Gojjam
experienced a little bit different training load situation, lifestyle, diet and sleeping
habits (Quinn, 2018).
With regard to girth, there was a significant difference among the players only on
forearm girth measurements (p˃.05). The other ten girth variables were not
significantly different among the players in the teams. Durbietie team players had
significant longer forearm girth than both Shendie Wenbrma (p˂.01) and Qunzla
(p˂.01) team players. That was 1.11cm and 1.38 cm greater forearm girth than
Shendie Wenbrma and Qunzla team players respectively.
In length variables, there was a significant difference among the players in upper arm
length or acromiale-radial bone (p˃.05) the Midst lion – dactyl ion (p˃. 05) and hand
length, (p˂.01). The length acromiale-radial bone of Durbietie team players was
significantly longer than both Shendie Wenbrma (p˂. 05) and Qunzla (p˂.05) team
players (p˂. 05). That was 1.61cm longer than the Acromiale-radial length both
110
Shendie Wenbrma and Qunzla team players. Additionally, the Midst lion – dactyl ion
length of Durbietie team players was also significantly longer than Shendie
Wenbrma team players (p˂. 01). There was about 0.83 cm difference.
There was a significant difference among the players in relation to the Biepicondylar
femur (knee) breads, (p˃. 05) and hand breads (p<.01) among junior volleyball
players in the West Gojjam zone. In relation to Biepicondylar femur breads, Qunzla
volleyball team players were significant wider than both Durbietie (p˂. 01) and
Shendie Wenbrma (p˂. 05) players. That was about 1cm and 0.72 cm greater than
Durbietie and Shendie Wenbrma junior volleyball team players respectively. Shendie
Wenbrma junior volleyball team players having significantly wider hand breads than
both Durbietie (p˂. 05) & Qunzla (p˂. 01) players. That was 0.44cm and 0.77 cm
greater than Durbietie and Qunzla team players.
It is concluded that the hands breads of Shendie Wenbrma junior volleyball players
were wider than that of Durbietie and Qunzla junior teams‟ players. Diabetes junior
volleyball team players on their part have got the largest forearm girth than the two
team players. Qunzla junior teams‟ players also had largest Biepicondylar femur
breads than Shendie Wenbrma and Durbietie team players.
4.2.5. Analysis of physical fitness traits of junior volleyball players
In recent times, volleyball game analysts, sport physiologists, sport psychologists and
sports medicine specialists have a focus on the fitness traits of players. Researchers
also underline the contribution of high traits fitness for the overall performance of the
players together with anthropometric characteristics, technical, tactical, psychological
and external factors, including equipment, ground, sportswear, climate and so on
(Waghmare, bonded, & Surdi, 2012).
Volleyball requires high physical challenges during the game and its achievement
also largely determined by the physical fitness traits of players (Peeri, Sharif &
111
Matinhomaee, 2013; Faude & et al.2007; Manrique & et al.2003). The most
important physical fitness components for volleyball players are a flexibility of lower
back and hammering muscles, strength of upper & middle body parts, speed, agility
and power of lower extremities (Gabbett, Georgie & Domrow, 2007). The fitness
traits of junior volleyball players are discussed below.
4.2.5.1. Comparative analysis of physical fitness traits of junior volleyball
players
Comparative analysis on flexibility of lower back and hammering muscles, upper
body strength, abdominal and hip muscle strength, speed, agility and explosive power
traits of junior volleyball players discussed below.
4.2.5.1.1. Flexibility of lower back and hammering muscles of junior
volleyball players
In the present study, the mean lower back and hamstring flexibility of junior
volleyball players in the West Gojjam zone of Ethiopia was 20.87cm and 25.00cm for
an international standard. The difference between these was found to be statistically
significant (p<.01).
A similar finding was reported by Sameer, Kumar and Yadav (2015), 19.07 3.77cm,
and Govind, et al., (2013) 20.38+2.83cm. While, higher flexibility score of junior
volleyball players reported in England by Duncan, et al., (2006), which is
29.22+8.8cm. These values indicate that lower back and hamstring flexibility of our
players is still needed to be improved.
This difference in flexibility in the lower back and hamstring muscles related to the
nature of their joints, the types of muscle fiber, the characteristic of tendons and
ligaments of the players together with the nature of training given to the players
(Horst, 2017).
112
In volleyball, the players have to move suddenly in the forward direction, sideways or
downward directions, so the flexibility of hip and back are very important. It is used
Increase the range of movement of the joints, to play in a good manner, to reduce
injuries, to decrease recovery time and to increase speed and agility of the players
(Fischer, 2004; Dale, 2017). On the other hand, Poor flexibility will boost the risk of
injury, decrease the range of movement, damage skilled movement, and extend
recovery time and decrease speed and agility of the players (Arnheim, 2005;
Buschbacher, Prahlow & Dave, 2009; Hamilton, 2018)
4.2.5.1.2. Upper body Strength of junior volleyball players
In our study, the mean pushups traits of junior volleyball players in the West Gojjam
zone of Ethiopia and international norm were 30.05 and 32.50 repetitions
respectively. The difference between these was found to be statistically insignificant
(p<.05). Our player‟s performance traits was a little bit better than the performance of
Indian junior volleyball players, 28.90 + 4.174, reported by Govind, et al., (2013).
The performance difference in push up is related to the difference in the strength of
the shoulder muscles (anterior and medial deltoids), the Chest muscles (pectorals) and
back of the upper arm (triceps) of the players (Sifferman, 2017). Research also
indicates that the strength of the upper body is directly related to the girth of the chest
and shoulder muscle groups (Jones, Bishop, Woods & Green, 2008).
In volleyball, there is aggressive blocking, spiking and repetitive jump serves. All
these actions needs optimum strength of muscle groups found in the shoulder and
around the chests (Ben-Zaken, & seal., 2013; LA84 foundation, 2012; Singh, et al.,
2011; Mermier, et al., 2000). Offensive and defensive actions also nothing without
having strong muscle groups on shoulders, around the chest and arms (Zhang, 2010).
All these indicate that the strength of the upper body is vital for successful volleyball
participation. It is one of the vital fitness components for volleyball players and it
113
contribute a lot for better spike, block and dig action during the game (Athletic, 2017,
Keshav & Harmandee, 2014).
4.2.5.1.3. Abdominal and hip muscles Strength of junior volleyball players
In this study, the mean sit-ups traits of junior volleyball players in the West Gojjam
zone of Ethiopia was 22.92 and 36.5 repetitions for international players. The
difference between these was found to be statistically highly significant (p<.05). In
this study, the sit ups mean score of our junior volleyball players was 22.92
repetitions. It was inconsistent with the sit-up performance of junior volleyball
players in India, their sit-up test score was 41repititions as reported by Keshav and
Harmandee (2014). In the other study, Bag, et al., (2015) reported 38.73 repetitions
for the mean sit-up performance of junior volleyball players.
This difference in sit ups performance is related to the difference in the strength of
waist and abdominal muscles, including rectus abdominals, external Oblique‟s,
internal Oblique‟s, transverse abdominals and hip flexor muscles, including psoas
major, illiacus, rectus femoris, pectins and Sartorius ( Quinn, 2018; Sifferman, 2017).
The Strength of the abdominal and hip muscles provides the muscular link between
the upper and lower body and thereby assists force Summation (Hughes, 2014). It is
the key to successful volleyball performance (Singh, et al., 2011; Ben-Zaken, et. al.,
2013). It also contributes a lot for proper successful execution of dig actions,
explosive jumping and powerful spiking actions (LA84 foundation, 2012).
4.2.5.1.4. Speed of junior volleyball players
In our study, the mean score of our junior players to 10m sprint run test was 2.17
seconds and 1.86 seconds for international counterparts. The difference between these
was found to be statistically highly significant (p<.01). This means, our junior
volleyball players were not as fast as their international counterparts.
114
In this study, the mean score of our junior players in the 10m sprint run test was 2.17
seconds. It was inconsistence with the findings reported by Tim et al, (2007), the
mean 10 m sprint test score of Australian junior volleyball players was 1.88 +0.13sec
(Tim et al, 2007). It was also not in agreement with, the finding, 1.85 seconds,
reported by simonek, et al., 2017).
This difference in movement speed of players might be related to the difference
performance on in reaction speed/ time, stride length, stride frequency, muscle
strength, power, sprint technique, neuromuscular coordination difference, muscle
composition, anthropometrics characteristics, other environmental conditions and
efficiency of the anaerobic energy system of the players (Locatelli, 2017; Aditi,
Majumdar, Robert, & Robergs, 2011).
Speed for volleyball players is the capacity to move quickly across the ground to dig
or spike the ball (Plisk, 2008; Harman & Garhammer, 2008). It is a complex mixture
of psychophysical components volleyball players. These include perception,
expectation, decision making, reactions, moving at maximum speed without a ball,
actions with a ball and reading the game. All of these components are interrelated and
have a significant influence on the speed of volleyball players (Kessel, 2019). It‟s one
of the main fitness components and has a critical role for success in many sports,
including volleyball (John Kessel, 2019). During a volleyball match, every player
expected to perform various short sprints and high-intensity court movement (Yadav,
2015; Singh & Behera, 2013). Therefore, players have to be moved rapidly to execute
the required activities effectively and efficiently (Miller, 2005; Terrell, 2017).
4.2.5.1.5. Agility of junior volleyball players
In our study, the mean score of our junior volleyball players in relation to shuttle run
agility test score was 10.84 seconds. While the normative mean of international
counterparts was 10.49 seconds. The difference between these was found to be
statistically highly significant (p<.05). This means that our players were less agile
than the international normative mean. The agility, performance traits of our junior
115
volleyball was lesser than Australian junior volleyball players, 10.49 +0.96 Sec (Tim
et al., 2007) and better than Indian counterpart, 11.55 seconds, as reported by Jatinder
,Kumar, Basanti and Bamaniya (2017).
This difference in their agility test performance may be related to the difference in
cognitive or decision making ability (knowledge of the situation, pattern recognition,
anticipation and visual scanning) of the players. Physical capability, particularly,
strength, and power of the leg muscles and technical abilities difference, like foot
placement, adjustment of step to accelerate and body position also affect their
performance (Young , Dawson , Henry , 2015; Scanlon, Humphries, Tucker &
Dalbo, 2013; Veale, Pearce & Carlson,2010; Gabbett, Kelly & Sheppard, 2008;
Sheppard, Young, Doyle, Sheppard & Newton, 2006; Sheppard & Young, 2005). It‟s
much more complex, involving speed, balance, coordination, fluidity of movement
and the ability to react to a change of the environment (BBC sports, 2018; Plisk,
2008).
In volleyball, to get into the right place at the right time is very critical. To move in
every direction quickly, to bend and dive to make successful plays is common in
volleyball game. All these activities emphasize the needs of better agility,
performance traits (Dale, 2017). In volleyball, agility does not only include changing
in direction, but also involves the ability to predict the movement of the ball, players
and react to the game specific situations (Gamble, 2013). That means that, The ability
to start, stop and change directions rapidly and efficiently is essential for volleyball
players (Lloyd, et al, 2015; Scanlan, et al., 2014; Young, et al., 2011; Lockie, et al.,
2013; Kutlu, et al.,, 2012; Serpell, et al., 2011; Sporis, et al., 2010; Little and
Williams, 2005).
4.2.5.1.6. Explosive power of junior volleyball players
In our study, the mean vertical jump score of junior volleyball players in the West
Gojjam zone of Ethiopia was 38.90cm and that of the international normative mean
116
was 48.74 cm. The difference between these was found to be statistically highly
significant (p<.001). This means that the explosive power of our junior volleyball
players was less than the international counterparts.
In this study, the mean vertical jump score of junior volleyball players in the West
Gojjam zone of Ethiopia was 38.90cm. It was not alien with the finding, 33.47 + 6.11
cm, reported by Aouadi, Nawi and Alanazi (2015). Greater explosive power was
reported by Indian and Iranian junior volleyball players. Their vertical jump test score
was 69cm +7.44cm and 50.0cm + 8.4 cm respectively as reported by Sameer , Kumar
and Yadav (2015) and Masoud and Nikbakht (2011). Additionally, the vertical jump
test score of England and Australia junior volleyball players was also much greater
than our players. It was 45.25+6.0cm and 46.0 +11.2cm, respectively as reported by,
Duncan, Wood field, and al-Nakeeb,(2006) and Gabbett, Georgie and Domrow,
(2007).
This much amount of difference in vertical jump is associated with different factors.
Such factors include the technical ability of players, their muscular strength and
power difference and their anthropometric characteristics (Al-Fadhli, Ali & Saleeh,
2015; Aouadi, glide, Khalifa, Hermassi, Chelly, Tillaar, and Gabbet, 2012).
The vertical jump is a basic ability required in many sports including volleyball
(Scott, Briscoe, Craig, Murkowski, Samue & Saville, 2003). Vertical jump is
common, very vital and essential fitness quality for volleyball players and it‟s the key
capabilities for both attacking and blocking actions, (Singh & Behera, 2013;
Sheppard et al., 2009).
4.2.5.2. Comparison analysis of physical fitness traits of junior volleyball
players in the west Gojjam of Ethiopia
In this study, a significant difference was observed on flexibility of lower back and
hamstring muscles (p<.05), upper body strength (p<.01), abdominal and hip muscle
strength (p<.05), speed (p<.01), agility (p<.05) and explosive power of lower
117
extremities (p<.05) in relation to junior volleyball players in the West Gojjam zone of
Ethiopia. .
Inflexibility of lower back and hamstring muscles, there was significant differences
among the junior players in the West Gojjam zone of Ethiopia (p<. 05). Shendie
Wenbrma team players were greater than Durbietie and Qunzla team players. There
were also significant differences among the players in the West Gojjam zone of
Ethiopia in relation to upper body strength (p<. 01). The average push up test score
of the Qunzla junior volleyball team was better than the mean performance traits of
their counterpart at international traits. Statistically significant differences observed
only between Qunzla and Shendie Wenbrma junior volleyball team players (p<.01).
That is, the mean push up test score of Shendie Wenbrma team players was lesser
than Qunzla team players
With regard to abdominal strength traits, There were significant differences among
the players in the West Gojjam zone of Ethiopia (p<.05). The mean abdominal
strength traits of Shendie Wenbrma team players were less than Durbietie team
players. Additionally, Durbietie team players were also performed more sit ups than
Qunzla team players.
There were also significant differences among the players in the West Gojjam zone of
Ethiopia in relation to 10m sprint run performance (p<.01). Send Wenbrma team
players were faster than Durbietie team players. Qunzla junior team players were also
faster than Durbietie team players. Durbietie team players examined the least sprint
run performance than the others.
On the T – shuttle run agility, there were significant differences among players in the
three teams found in the West Gojjam zone of Ethiopia (p<. 05). The mean agility,
performance of Qunzla junior volleyball team players was more agile than shendie
wenbrma junior volleyball team players. In explosive power also, there was
significant differences between Qunzla and shendie wenbrma team players (p<.05).
118
The vertical jump test score of Qunzla team players was lesser than shendie wenbrma
team players.
It is concluded that, in relation to upper body strength, moving speed and agility
traitss of the players Qunzla team players was better than both Durbietie and Shendie
Wenbrma junior team players. Shendie Wenbrma junior volleyball team players on
their part scored better performance in explosive power in their lower extremities and
flexibility of lower back and hamstring muscles. Durbietie junior teams‟ players also
had strongest abdominal and hip muscles than Shendie Wenbrma and Qunzla team
players.
4.2.6. Co-relational analysis of anthropometric characteristics and physical
fitness traits of junior volleyball players.
One of the focuses on coaches, trainers and sport scientists is finding a relationship
between anthropometric characteristics and physical fitness traits of players. This
study specified that most of the anthropometric characteristics of junior volleyball
players were significantly correlated with their physical fitness traits. The
relationship between anthropometric characteristics and six selected physical fitness
traits of junior volleyball players are discussed below.
4.2.6.1. Correlations between anthropometric characteristic and flexibility of
lower back and hamstring muscles of junior volleyball players.
The results of this study indicated that the sit and reach test score of junior volleyball
player‟s significantly correlated with blocking height (r = 0.384, p<.05), waist girth (r
= 0.347, p<.05), gluteus girth (r = - 0.309, p<.05), and abdominal skin folds of players
(r = - 0.305, p<.05). This means, as the blocking height and waist girth increase, the
sit and reach test score of players will increase. While, as the gluteus girth and
abdominal skin folds of junior volleyball players increase, the sit and reach test score
of players will decrease. These results were partly consistent with the research results
119
reported by Fernandes, Christopher, Cucato and Junior (2007) maintained an inverse
relationship between being over fat at the waist and sits and reaches performance.
4.2.6.2. Correlations between anthropometric characteristic and strength of
upper body part of junior volleyball players.
The results of the present study also indicated the existence of a significant positive
relationship between push up test score and flexed and tense arm girth of players
(p<.05). Which means, whether a player is with large flexed and tense arm girth, he
would have a relatively better performance in pushups. Additionally, there was also a
significant negative relationship between pushups performance traits and five
anthropometric characteristics of junior volleyball players. These were stature
(p<.001), standing reach height (p<.05), wrist girth (p<.05), waist girth (p<. 05), hand
breads (p<. 05). This means, whether a player is with large height, standing reach
height, wrist girth, waist girth and hand breads, he would have a poor performance in
push up. This result is inconsistent with the findings of Binder, Singh and Soodan
(2016) and partly consistent with the result reported by Caroline, Allen, Katie, Dean,
Alan, Jung, John and Petrella (2013).
4.2.6.3. Correlations between anthropometric characteristic and strength of
abdominal and hip muscle of junior volleyball players.
Our study also showed the presence of negative significant correlation between sit-
ups test score and sitting height of junior volleyball players (r = - 0.271, p<. 05).
When a player is with large sitting height, he would have poor performance in sit-ups.
On the other hand, there‟ was also a positive relationship between sit up performance
traits and flexed & tense arm girth (r = 0.358, p<.001) of junior volleyball player,
which means, whether a player is with large flexed and tense arm girth, he would
have a better performance in sit-ups. There was not any significant connection,
among other anthropometric characteristics and sit-ups test score. This finding is
consistent with the finding reported by Binder, Singh and Soodan (2016).
120
4.2.6.4. Correlations between anthropometric characteristic and moving speed
of junior volleyball players.
The result of the present study indicated that 10m sprint run traits of junior volleyball
players significantly and positively correlated with sitting height (r = 0.337, p<.05),
standing reach a height (r = 0.289, p<.05), iliac crest skin folds (r = 0. 479, p<. 001),
Sub scapula skin folds (r = 0.285, p<. 05), triceps skin fold (r = 0 .286 , p<.05),
mid-thigh skin folds (r = 0. 297, p<. 05), for. Arm girth (r = 0. 505, p<. 001), waist
girth (r = 0. 355, p<.001), biepicondylar hummers (r = 0. 352, p<.01), That means,
10m sprint run performance of junior volleyball increases with increments of sitting
height, standing reach height, iliac crest skin folds , Sub scapula skin folds, triceps
skin fold, mid-tight skin folds, forearm, girth, waist girth and biepicondylar
hummers. Since previously done findings are not available in the literature, we could
not compare our results with the findings of others.
4.2.6.5. The correlations between anthropometric characteristic and moving
agility of junior volleyball players.
The present research showed that there was a significant relationship between agility
and four skin folds. Mid Calf skin folds (r = 0. 491, p<.001), Mid-thigh skin fold (r =
0. 408, p<.01), abdomen skin fold (r = 0. 356, p<.01) and Iliac crest skin fold (r = 0.
339, p<. 05). That means, the agility of junior volleyball increases with increments of
mid calf skin fold, Mid-thigh skin folds, abdomen folds fold and Iliac folds skin folds
until 13 % of the body. The other anthropometric characteristics of junior volleyball
players haven‟t any effect on movement agility. Since previously done findings are
not available in the literature, we could not compare our results with the findings of
others.
4.2.6.6. The Correlations between anthropometric characteristic and explosive
power of junior volleyball players.
The analysis of the results demonstrated the existence of a significant relationship
between vertical jump height and two anthropometric variables. The spike reach
height (r = 0. 527, p<.01) and block reach heights(r = 0. 535, p<.01) of junior
121
volleyball players were positive and significantly correlated with vertical jump
performance traits of players. This implies, as the spike reach height and block reach
heights of junior volleyball players increases, their vertical jump height also
increases. This finding was not alien with the findings reported by Maghsoud, Rezvan
and Hassan (2013) where Vertical jump increases by increments of height and weight
of players. The non-significant correlation between anthropometric characteristics
and vertical jump height indicates that they are not the major contributors to the
power of lower extremities.
4.2.7. Regression models for anthropometric characteristics and physical fitness
traits of junior volleyball players found in West Gojjam, Ethiopia.
To recognize the correlation between the anthropometric characteristics and physical
fitness traits of junior volleyball players, the researchers performed stepwise
regression analyses between the anthropometric variables and selected physical
fitness components to identify the most important anthropometric characteristics and
physical fitness component that can be used in the talent identification process.
The statistical results revealed that all selected physical fitness components were
closely associated with at least with two anthropometric characteristics, as indicated
by a moderate correlation coefficient (r > 0.275) with the anthropometric variables.
Since our investigation only analyzed the anthropometric factors among multiple
factors that might have influenced physical fitness traits of junior volleyball players,
therefore it is not unexpected to find low to moderate correlation coefficients.
The regression models for specific physical fitness performance traits of Ethiopian
junior volleyball players found in the west Gojjam are shown in Table 4.31 below.
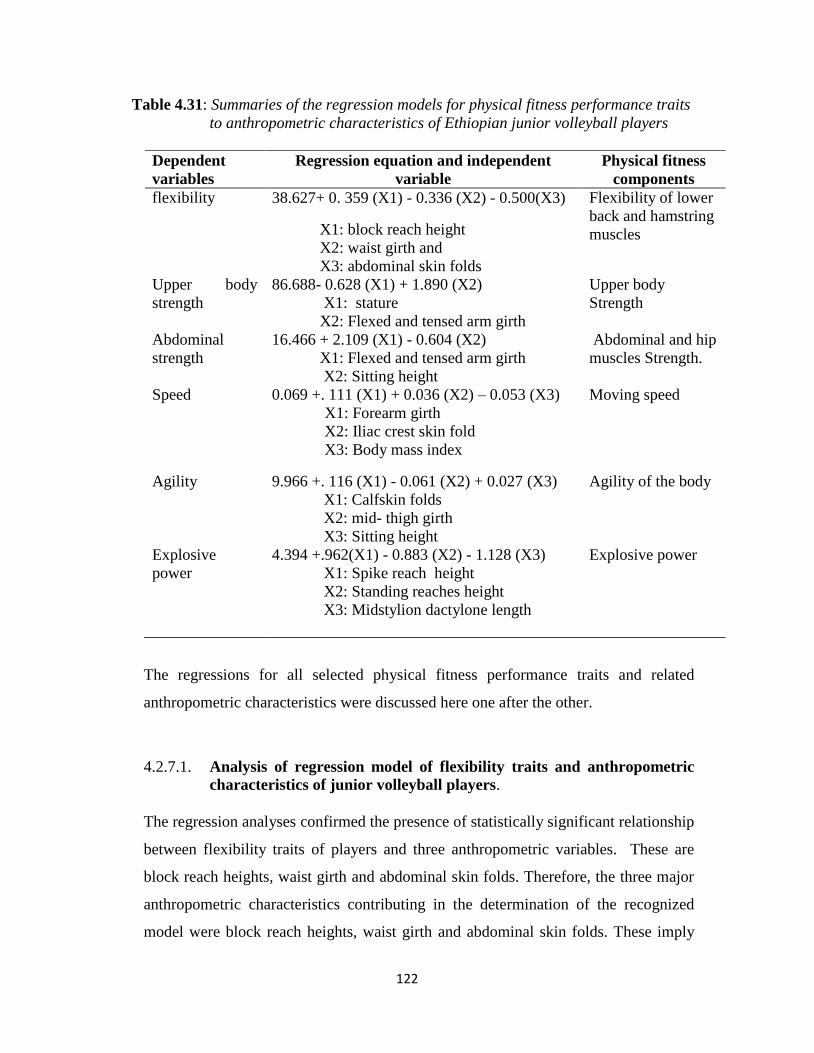
122
Table 4.31: Summaries of the regression models for physical fitness performance traits
to anthropometric characteristics of Ethiopian junior volleyball players
Dependent
variables
Regression equation and independent
variable
Physical fitness
components
flexibility 38.627+ 0. 359 (X1) - 0.336 (X2) - 0.500(X3)
X1: block reach height
X2: waist girth and
X3: abdominal skin folds
Flexibility of lower
back and hamstring
muscles
Upper body
strength
86.688- 0.628 (X1) + 1.890 (X2)
X1: stature
X2: Flexed and tensed arm girth
Upper body
Strength
Abdominal
strength
16.466 + 2.109 (X1) - 0.604 (X2)
X1: Flexed and tensed arm girth
X2: Sitting height
Abdominal and hip
muscles Strength.
Speed 0.069 +. 111 (X1) + 0.036 (X2) – 0.053 (X3)
X1: Forearm girth
X2: Iliac crest skin fold
X3: Body mass index
Moving speed
Agility 9.966 +. 116 (X1) - 0.061 (X2) + 0.027 (X3)
X1: Calfskin folds
X2: mid- thigh girth
X3: Sitting height
Agility of the body
Explosive
power
4.394 +.962(X1) - 0.883 (X2) - 1.128 (X3)
X1: Spike reach height
X2: Standing reaches height
X3: Midstylion dactylone length
Explosive power
The regressions for all selected physical fitness performance traits and related
anthropometric characteristics were discussed here one after the other.
4.2.7.1. Analysis of regression model of flexibility traits and anthropometric
characteristics of junior volleyball players.
The regression analyses confirmed the presence of statistically significant relationship
between flexibility traits of players and three anthropometric variables. These are
block reach heights, waist girth and abdominal skin folds. Therefore, the three major
anthropometric characteristics contributing in the determination of the recognized
model were block reach heights, waist girth and abdominal skin folds. These imply
123
that as the players block reach height increases, the flexibility of lower back and
hamstring muscles of the players will also increase. Contrary, as the waist girth and
the abdominal skin fold increases, the flexibility of lower back and hamstring muscles
of the players will decrease. As the correlation coefficient indicates, players with
greater waist girth and abdominal skin folds correlates negatively with sit and reach
performance traits of players.
A multiple linear regression was calculated to predict sit and reach or flexibility of
lower back and hamstrings muscle performance for junior volleyball players based on
the selected anthropometric variables. As a result blocking reach height, Waist girth
and abdominal skin fold were found to predict of sit and reach (flexibility)
performance traits of junior volleyball players. These factors explain about 39.6 % of
the variation of flexibility of lower back and hamstring muscles of for junior
volleyball players.
The independent contribution of Block reach height, Waist girth and abdominal skin
folds was scored was 0 .138, -.116 and -.152 respectively. From the three independent
variables (anthropometric variables) the most predictable variable was abdominal
skin folds.
Players‟ predicted sit and reach performance equation is - 38.627+ 359 (blocking
height) - 0.336 (waist girth) - 0.500(abdominal skin fold) where: both blocking height
and waist girth measured in centimeter and abdominal skin fold in millimeter.
If blocking height and waist girth held constant, then sit and reach the performance
traits of the players decreased by 0.500 cm for each millimeter increment in
abdominal skin folds. Whereas, if the waist girth and abdominal skin fold held
constant, then sit and reach the performance traits of players increased by 0.357 cm
for each centimeter increment in blocking heights.
124
4.2.7.2. Analysis of regression model of upper body strength traits and
anthropometric characteristics of junior volleyball players.
The regression analysis of the results demonstrated the existence of statistically
significant correlation between two anthropometric variables, namely, stature and
flexed and tense arm girth and push-up performance traits of players. Therefore, the
two main anthropometric characteristic contributing in the determination of the
established model was the stature of the players and flexed and tense arm girth of the
players. These imply that the players with bigger Flexed and tense arm girth are
usually prepared with stronger upper body and better push up performance traits. As
the players flexed and tense arm girth increases, the force required to carry the whole
body only by the upper body part will also increase. As the correlation coefficient
indicates players with greater stature correlates negatively with push up the
performance traits of players. This means that as the stature of the player‟s increases,
their upper body strength will decrease.
A multiple linear regression was calculated to predict push up the performance of
junior volleyball players based on the selected anthropometric variables. As a result
stature of volleyball players and Flexed & tensed arm girth were found to predict
push up the performance of junior volleyball players. These parameters explain about
25.8% of the variation of push up performance of junior volleyball players. 0.258 was
the composite score of the two independent variables. Due to the strong relationship
between the two variables, the independent contribution of stature and flexed and
tensed arm girth was .246 for and.589 respectively. Therefore, the most predictable
variable for upper body strength of junior volleyball players was flexed and tensed
arm girth
Players‟ predicted push up performance equation is equal to = 86.688- 0.628(height)
+ 1.890 (flexed & tensed arm girth) where: both height and flexed & tensed arm girth
measured in centimeter.
125
If height held constant, then push up the performance traits increased by 1.890
repetitions for each centimeter increment in flexed &tensed arm girth. Whereas, if
the flexed &tensed arm girth held constant, then push up the performance traits
decreased by 0.628 repetitions for each centimeter increment in height (stature).
4.2.7.3. Analysis of regression model of abdominal and hip muscle strength
traits and anthropometric characteristics of junior volleyball players.
The regression analysis on the sit-ups performance traits verified that the sit-ups
performance traits was correlated with flexed and tensed arm girth and sitting height
of junior volleyball players. This implies that a player with bigger flexed and tensed
arm girth usually means stronger abdominal and hip muscles, which may directly
influence the sit-ups performance traits of players. Contrary, as the sitting height
increases, the strength of the abdominal and hip muscles will decrease.
A multiple linear regression was calculated to predict sit-ups performance traits of the
players based on the selected anthropometric variables. As a result Flexed & tensed
arm girth and sitting height of players were found to predict sit up performance traits
of junior volleyball players. These anthropometric variables predicted 21.1 % of the
variation on the sit-ups performance traits of players. The independent contribution of
the flexed & tensed arm girth and the sitting height was 0.755 and 0.163 respectively.
Therefore, the most predictable variable for the strength of abdominal and hip
muscles of junior volleyball players was flexed and tensed arm girth
Players‟ predicted sit and reach performance traits equation is equal = 16.466 +
2.109(flexed and tensed arm girth) - 0.604 (sitting height) where: both flexed and
tensed arm girth and sitting height measured in centimeter.
If sitting height held constant, one centimeter increments in flexed & tensed arm girth
will increase the set-up performance traits of the players by 2.109 repetitions.
Whereas, if the flexed &tensed arm girth held constant, then sit up performance score
of the players decreased by 0.604 repetitions for each increment in sitting height.
126
The finding of our study was not alien the finding reported by Zhang, Y 2010.
Gluteus Girth, forearm girth, forearm length and ankle girth of female volleyball
players determine the strength of the abdomen and hip muscles around 19.8% and the
regression equation was 14.671-0.159 (Gluteus Girth) + 0.251 (forearm girth) + 0.366
(forearm length) + 0.042(ankle girth):
4.2.7.4. Analysis of regression model of speed performance traits and
anthropometric characteristics of junior volleyball players.
From the regression equation for the 10m sprint run traits of players, it can be seen
that the speed of players is determined by forearm girth, iliac crest skin folds and
body mass index of the players. Here, a multiple linear regression was calculated to
predict 10 m sprint run performance for junior volleyball players based on the
selected anthropometric variables. As a result forearm girth, iliac crest skin fold and
body mass index were found to predict their 10m sprint performance of players. As
the correlation coefficient indicates players with greater forearm girth, iliac crest skin
folds correlates negatively with 10m sprint run performance traits of players. This
means that as the forearm girth and iliac crest skin folds of the player‟s increases,
their 10m sprint run performance traits will decrease. Contrary, as the body mass
index increases, with in the normal boundary, the 10m sprint run performance traits
will also increase.
A multiple linear regression was calculated to predict 10 m sprint run performance for
junior volleyball players based on the selected anthropometric variables. As a result
forearm girth, iliac crest skin folds, body mass index were found to predict their 10 m
sprint performance of junior volleyball players. These parameters explain
approximately 41.7% of the variation of sprint run performance for the junior
volleyball players. Independent contribution of forearm girth iliac, crest skin folds
and body mass index was 0.247, 0.162 and 0.008 respectively. Therefore, from the
three independent variables (anthropometric variables) the most predictable variable
was forearm girth.
127
The 10m sprint run performance = .069 + 0.111 (Forearm girth) + 0.036 (Iliac crest
skin fold) - 0.053 (body mass index) where: forearm girth measured in cm and iliac
crest skin fold measured in millimeter.
If forearm girth, and body mass index held constant, then the time to complete 10 m
sprint run was increased by 0.036 second for each millimeter increment in iliac crest
skin folds. This implies that as the iliac crest skin folds increases, the speed
performance traits of the players will decrease. Whereas, if iliac crest and body mass
index held constant, then the time taken to complete 10 m sprint run increased by
0.011 seconds for each centimeter increment in forearm girth. This implies that as the
forearm girth of the players increases, the speed of the players will decrease.
4.2.7.5. Analysis of regression model of agility traits and anthropometric
characteristics of junior volleyball players.
The regression analyses established statistically significant correlation between three
anthropometric variables and T-shuttle run agility performance traits of players.
These are calf skin fold, mid-thigh girth and sitting height. Hence, the main
anthropometric characteristic contributing in the determination of the standard model
was calf skin fold, mid-thigh girth and Sitting height of the players. These means that
as the players calf skin fold and sitting height increases, the time taken to complete
the T-shuttle agility run will also increase. This implies that greater skin fold
thickness on the mid calf has a negative effect on agility of the players. In contrast,
as the player‟s tight girth increases, the time taken to complete the T-shuttle agility
run will decrease. This implies that as the mid-thigh girth of the players increases, the
speed of the players will also increase.
A multiple linear regression was calculated to predict T- shuttle agility run
performance for junior volleyball players based on the selected anthropometric
variables. As a result calf skin folds, Mid-thigh girth and sitting height were found to
predict the T shuttle agility run of junior volleyball players. These variables explain
37.2 % of the variation on agility performance traits of players. The independent
contribution of calf skin folds was scored .055 to predict the T shuttle agility run of
128
junior volleyball players. The independent contribution of Mid-thigh girth and sitting
height was scored .006 and .002 respectively. Therefore, the most predictable
variable was calf skin folds.
Players‟ predicted T- shuttle run agility performance equation is = 9.666 +.116 (calf
skin folds) - .061 (Mid-thigh girth) + .027 (sitting height) where: calf skin folds
measured in millimeter. Mid-thigh girth and sitting height measured in centimeter.
If calf skin folds and sitting height held constant, one centimeter increments in mid-
thigh girth decrease the time taken to complete the T- shuttle agility run performance
traits of players by 0.061 seconds. This implies that as the mid tight girth increases,
the agility performance traits of the players will also increase. Whereas, mid-thigh
girth and sitting height held constant, then the time used to complete the T- shuttle
agility run performance traits increased by 0.116 seconds for each millimeter
increment in mid calf skin folds. This implies that greater skin fold thickness on the
mid calf has a negative effect on agility of the players. Our study finding was not
alien the finding reported by Zhang, (2010). Sub scapular skin fold was the only
significant anthropometric variables that determine the ability of players at about 7.2
% and the regression equation was 9.550-0.035 x Sub scapular skin folds.
4.2.7.6. Analysis of regression model of explosive power of lower extremities
traits and anthropometric characteristics of junior volleyball players.
The analysis of the results demonstrated the existence of a significant relationship
between three anthropometric variables and vertical jump performance of the players
(p<0.01). Spiking height, standing reach height and midstylion-dactylone lengths
significantly correlated with vertical jump performance of the players (p<0.01).
Therefore, the main anthropometric characteristic contributing in the determination of
the established model was the spiking height, standing reach heights and midstylion-
dactylone length of the players. As the correlation coefficient indicates players with
greater spike reach heights, correlates positively with vertical jump performance traits
of players. This means that as the spike reach heights of the player‟s increases, their
vertical jump performance traits or explosive power of lower extremities will also
129
increase. Contrary, as the standing reaches height and Midstylion dactylone length
increases, the vertical jump performance traits will decrease.
A multiple linear regression was calculated to predict vertical jump performance of
junior volleyball players based on the selected anthropometric variables. As a result
spiking height, standing reaches a height and a Midstylion-dactylone length of
volleyball players were found to predict vertical jump performance traits of players.
These parameters explain 94.3 % of the variation of vertical jump performance of
players. 0.943 was the composite score of the three anthropometric variables (spiking
height, standing reaches height and Midstylion-dactylione length). The independent
contribution of spike reach height was scored .506 of the total .943 predicted the
explosive power of lower extremities of junior volleyball players. The independent
contribution of standing reach heights and Midstylion- dactylione length was.233
and.142 predicted, respectively. Therefore, from the three independent variables
(anthropometric variables) the most predictable variable was the spike reach height.
Players‟ predicted vertical jump performance equation is equal to = 4.394
+.962(spiking reach height) - 0.883 (standing reaches height) - 1.128 (midstylion
dactylone lengths) where: all predictors were measured in centimeter.
If spiking height and standing reaches height held constant, one centimeter
increments in midstylion dactylone lengths decrease the vertical jump performance of
players by 1.128 centimeters. Whereas standing reaches a height and a midstylion
dactylone length held constant, then vertical jump performance improved by 0.962
centimeters for each centimeter increment in spiking height. Our study finding was
not alien the finding reported by Zhang, Y 2010. Standing reach height, femur
breadth and calf girth of female volleyball players were significantly correlated with
vertical jump performance of players. These variables predict 33.6 % of jumping
performance of players and the regression equation was 253.63-1.547 (Standing reach
height) +5.538 (femur breadth) -1.023 (calf girth).
130
CHAPTER 5
SUMMARY, CONCLUSION AND RECOMMENDATION
Introduction
The objective of this study was to compare some anthropometric characteristic of
junior volleyball players, in the West Gojjam zone of Ethiopia and international
norms. Identify whether there exists statistically significant mean score difference
between junior volleyball teams in the West Gojjam zone of Ethiopia in relation to
some anthropometric characteristics. Additionally, this study was designed to
determine the traits of physical fitness traits of players in the West Gojjam zone of
Ethiopia and to identify whether there exists statistically significant mean score
difference in fitness among junior volleyball teams in the West Gojjam zone of
Ethiopia. This study also designed to examine whether there exist statistically
significant relationship between anthropometric characteristics and physical fitness
traits of junior volleyball players and to determine the extent that anthropometric
characteristic significantly predict physical fitness traits of junior volleyball players.
Based on the findings of this study, the following conclusions have been drawn.
5.1. Summary
Anthropometric characteristics and physical fitness are the key predictors for
identifying talent in junior volleyball players. However, there is no data about
anthropometric characteristics and physical fitness traits of junior volleyball players
in the West Gojjam zone of Ethiopia. The purpose of the study was to compare the
anthropometric characteristics and physical fitness traits of junior volleyball players
in West Gojjam, Ethiopia and overseas. Further, examine the relationship between
their anthropometrics characteristics and physical fitness traits to establish a standard
for talent identification in volleyball.
In this study, 54 junior (U-19) volleyball players from three teams participated in the
study. Secondary data were also obtained from the databases of the world
championships 2017 on the official FIVB website and other journals and books .34
131
anthropometric variables and six physical fitness components were measured and
tested based on the procedure set by international society for kin-anthropometry,
ISAK, and copper institute respectively. The independent t- test, one way ANOVA,
post- hoc multiple comparison, one sample T- test, person product correlation
momentum and stepwise regression methods were used for analysis. Level of
significance was set as 0.05.
Based on the results of this study, there was significant difference between junior
volleyball players in the West Gojjam zone of Ethiopian and international players in
relation to stature, body weight, body mass index, spike and block reach the heights
(p<.001). The stature, the body weight, the spike and block reach heights of players in
the west Gojjam was significantly lower than international players (p<.001). It was
also concluding that, there was no significant difference among the junior volleyball
players in the West Gojjam zone of Ethiopia on most (58.82%) anthropometric
characteristics (p˂.05). Significant difference observed only on (41.18%)
anthropometric variables.
Based on the results of study, it was also concluded that, there was significant
difference between junior volleyball players in the West Gojjam zone of Ethiopian
and international players in relation to the selected physical fitness traits of players
(p<.01). junior volleyball players in the West Gojjam zone of Ethiopian were
significantly lower than international players, particularly on flexibility of lower back
and hamstring muscles, strength of the abdomen and hip muscles, speed, agility and
explosive power of lower extremities (p<.001). It was also concluded that Qunzla
junior volleyball players had significantly better strength in their upper body parts and
speed traits than Shendie Wenbrma and Durbietie team players. Shendie Wenbrma
team players in their part had significantly better in flexibility and explosive power
than Durbietie and Qunzla team players. The abdominal and hip muscle strength of
Durbietie junior volleyball team players was significantly better than both Qunzla and
Shendie Wenbrma team junior volleyball players.
132
Upper body strength traits of junior volleyball players were also significantly
correlated with six anthropometric variables. Among them the stature and flexed and
tense arm girth were determined the upper body strength of players. The most
important predictor of upper body strength was flexed and tense arm girth. On the
other hand, the set up performance traits of players were significantly correlated
with only two anthropometric variables. These were sitting height and flexed and
tense arm girth, similarly, the most important predictor for strength of abdominal
and hip muscles was flexed and tense arm girth.
Speed of junior volleyball players was significantly correlated with nine
anthropometric variables. Its performance traits largely predicted by forearm girth,
lilac crest skin folds and body mass index. The most important predictor of 10m
sprint run performance traits was forearm girth. The most important predictor for
agility and explosive power of lower extremities of junior volleyball players were
calf skin folds and spike reach heights respectively.
The multiple linear regression analysis confirmed the correlations between
anthropometric characteristic of junior volleyball players and their physical fitness
traits. Predictive equations for the six physical fitness traitss were developed as
follows.
Flexibility = -38.627+ 0. 359 (block reach height) - 0.336 (Waist girth) - 0.500
(abdominal skin folds)
Upper body strength = 86.688- 0.628 (stature) + 1.890 (Flexed and tensed arm
girth)
Abdominal strength = 16.466 + 2.109 (Flexed and tensed arm girth) - 0.604
(Sitting height)
Speed = - 1.951 + 0.133 (Forearm girth) + 0.31 (Iliac crest skin folds) - 0.023
(body weight) + 0.011(stature).
Agility = 9.966 +. 116 (calf skin folds) - 0.061 (Mid tight girth) + 0.027(Sitting
height)
133
Approach run vertical jump = 4.394 +.962(Spiking height) - 0.883 (Standing
reaches height) - 1.128 (Midstylion dactylone length)
It must be stressed out that physical fitness traits of junior volleyball players is
determined by multiple factors, this study gives new references for talent
identification in volleyball.
5.2. Conclusions
Based on the results of study, it was concluded that most of the anthropometric
characteristics of junior volleyball players in the west Gojjam zone of Ethiopia were
significantly correlated with the physical fitness traits of players. It was revealed
that, Blocking height, abdominal skin folds and waist girth were significantly
correlated and predicts the flexibility of lower back and hummestring muscles of
junior volleyball players. The most important predictor of flexibility of lower back
and hummestring muscles was abdominal skin folds.
5.3. Recommendations for practitioner and researchers.
1. It is vital to consider anthropometric characteristic of players while searching
talented volleyball players. Volleyball coach and related bodies should consider
anthropometric characteristic of players during selection of talented players. 14
anthropometric variables were identified as significant contributors to the selected
physical fitness traits of junior volleyball players. Volleyball coaches, physical
education teachers and sport science experts should recognize theses relationship
and apply during selection of talented players.
2. It‟s also recommended that further research can be conducted by including the
delimited variables so as to use it with full confidence in the talent identification
practice or further expand the study at a regional or country traits to set up better
talent-identifying models that will be applicable for most Ethiopian juniors.
134
3. To achieve excellent flexibility traits or set and reach performance, junior
volleyball players must engaged in scientifically designed training program which
includes static and dynamic stretching activities. This might facilitate them to
achieve better flexibility ability that will help them to perform better in volleyball
game (Zakas et al., (2003).
4. Similarly, to improve the strength of the abdominal and hip muscle groups, the
coaches should engage the players in various strength exercises, such as a Supine
leg raise, jackknife Sit-up, bent-leg sit-up, bent-knee crunch, incline bench sit-up
with variations, vertical bench, bent-knee raise, vertical bench straight-leg raise,
incline leg raise, side bends with dumbbells, side bends and straight-Leg sit-up
activities with caution as recommended by Grice (2017) and Biswas (2018).
5. The speed training also should focus on leg strength, power and sprint technique
that utilizes strength and power development. these include, weight lifting,
sprinting drills, running uphill and downhill, acceleration activates, sprinting,
Plyometric exercises, resistance and over speed training (Wood, 2010). Plyometric
exercises also increase strength of the legs, explosive speed and agility of the
players. Doing these exercises regularly can not only increase vertical jump
performance of players, but also improve their overall volleyball game capabilities
(Woodrup, 2009; Anderson, Corey, Sforzo, Gary, Sigg & John, 2008).
135
BIBLIOGRAPHY
BOOKS
1. Anil R. Waghmare, Anil K. Bonded, Anil D. Side (2012) Study of Flexibility,
agility and reaction time with handball players , Indian Medical Gazette,
Medical College, Solapur, Maharashtra.
2. Aristotelis goddesses, Evangelos Bakeries, Ioannis Gissis ,(2014) Playing
Position: Anthropometric and Fitness Demands in Youth Soccer , Sport Science
Review, vol. XXIII, no. 3-4, 151 – 168
3. Barbieri, D., Zaccagni, L., Cogo, A., Gualdi-Russo E (2013) Body composition
and somatotype of experienced mountain climbers, High Altitude Medicine &
Biology: South Yarra, Vic: Palgrave Macmillan. 46-50,
4. Bumper To and Carrera, M.C. (2005) Periodization training for sports: Science-
based strength and conditioning plans for 20 sports, 2nd Ed. (Champaign, IL:
Human Kinetics), 258.
5. Bompa TO. (1999) Periodization, theory and methodology of training. 4th
edition. Illinois: Human Kinetics, Champaign
6. Canadian society for exercise physiology (1998) the Canadian physical activity,
fitness and lifestyle appraisal. CSEP, so plan for healthy activity living, 2nd
Ed.,
Ottawa.
7. Cooper Institute (2007) fitness gram activity, gram Test Administration Manual,
Fourth Edition (Champaign, IL: Human Kinetics)
8. Chris gratton and ian jones (2004) research methods for sport studies ,
Routledge , New York, pp-94
9. Chandler, T.J. (2000) Physiology of racquet sports, Exercise and Sports Science
(edited by W.E. Garret and D.T. Kirkendall), pp 905-917. Philadelphia, PA:
Lippincott, Williams and Wilkins.
136
10. Elaine Roque, Jacqueline Hansen, Bobbie Estes, Ellen Coleman, Robert Forster,
Ron Arenz, Sue Gozansk, (2012) volleyball coaching manual, LA84 foundation.
2141 West Adams Boulevard, Los Angeles, pp 57, Accessed 11/3/2018
11. Gamble, P. (2013) Strength and Conditioning for Team Sports: Sport-Specific
Physical Preparation for High Performance. 2nd Ed., London and New York,
Routledge: Taylor and Francis, pp. 291.
12. Ge CL (2003) the Newly Advanced Training Theories and Practices of
Volleyball Sport. Pp. 452-471, Beijing Sports University.
13. Giles Warrington, 2010, planning for performance, coaching Ireland the
Lucozade sport, education program, empowering Irish sport, performance layout
14. Gamble, P. (2011) Technical Aspects of Acceleration and Straight-Line Speed
Development. In: Training for Sports Speed and Agility – An Evidence-Based
Approach, Abington, UK: Rout ledge.
15. Harman, E., & Garhammer, J. (2008) Administration, Scoring, and
Interpretation of Selected Tests, Essentials of Strength Training and
Conditioning, 3rd Ed., Edited by T. R. Beach, and R.W. Earle, pp.250-292.
Champaign, IL: Human Kinetics.
16. Heyward VH, Wagner DR.(2004) Applied Body Composition Assessment. (2nd
Edition).Champaign, IL: Human Kinetics,
17. Henze, Paul B. (2005) Layers of Time: A History of Ethiopia, pp, 522-7.
18. International Standards for Anthropometric Assessment manual (ISAA, 2001),
International Society for the Advancement of Kin anthropometry (ISAK) School
of Physical Education, Exercise and Sport Studies, The University of South
Australia Holbrooks Rd, Underdale, SA, Australia
19. John Kessel (2019) seven speeds of volleyball, USA Volleyball Director of Sport
development, united States Olympic Committee.
20. Justin Durant. (2009) Fitness testing and the physical profile of players, book
smart, south Africa
21. Kirkendall, D.T. (2000) Physiology of soccer, In Exercise and Sports Science
(edited by W.E. Garret and D.T. Kirkendall), Philadelphia, pp 875-884.,
137
22. Liu XL (2006) Measurement and evaluation in sports. Beijing: Beijing
University Press.
23. Lobietti, R.DI Michele R. & Merni F. (2006) Relationships between performance
parameters and final ranking in professional volleyball. Society of Performance
Analysis in Sport VII, Szombathey, Hungary
24. Malina RM, Bouchard C, Bar-Or O. (2004) Growth, maturation and physical
activity. 2Nd Ed. Champaign (IL): Human kinetics.
25. LA84 foundation (2012) volleyball coaching manual, La84. Crag/WP-content,
26. Lori Rice, M.S., C.N. (2004) Weight, BMI, and Body Fat, cooperative Extension
service, university of Kentucky, college of agriculture.
27. Marfell-Jones M, Olds T, Stewart A, Cater LJE (2006) International Standard
for Anthropometry Assessment, ISAK, Potchefstroom
28. National Academies Press (US); 2006.Institute of Medicine (US) Committee on
Assessing Interactions among Social, Behavioral, and Genetic Factors in
Health; Hernandez LM, Blazer DG, editors. Washington (DC)
29. National Health and Nutrition Examination Survey (NHANES 2007)
Anthropometry Procedures Manual
30. National Academies Press (2004) Institute of Medicine (US) Subcommittee on
Military Weight Management. Washington (DC)
31. Plisk, S. (2008) Speed, Agility, and Speed-Endurance Development. In:
Essentials of Strength Training and Conditioning, 3rd Ed., Edited by T. R.
Beach, and R.W. Earle, 458-485. Champaign, IL: Human Kinetics.
32. Rainy Stamm, Meelis Stamm, Aleksander Jairus, (2017), Do height and weight
play an important Role in block and attack efficiency in high -traits Mens
volleyball? Papers on Anthropology XXVI/1, pp. 64–71
33. Reilly T., Secher N., Snell P., Williams C. (1990), Physiology of Sports. London:
Spon Press.
34. Salemichael Bezuneh, and Araya Dechasa, (2015) physical education, student
text book grade 9, revised edition, and mega publishing enterprise. Addis Ababa
35. Shuchi, S; Drogemuller, R; Kleinschmidt, T. (2012) Flexible Airport Terminal
Design: Asian Conference 2012, Furama Riverfront Hotel, Singapore, 348-356.
138
36. Tian MJ (2006) Sports training. Beijing: Higher Education Press, Accessed on
9/6/2018
37. Tudor O. Bumper, and. Gregory G. Huff (2009) Per iodization, Theory and
Methodology of Training, Fifth Edition, York University West Virginia
University
38. Visa Gaurav, Mandeep Singh and Sukhdev Singh, (2010) Anthropometric
characteristics, somatotyping and body composition of volleyball and basketball
players, Department of Physical Education (T), Guru Nanak Dev University,
Amritsar, and Punjab, India.
39. UK Sport (2017) Economic impact of Olympic and Para Olympic sports, sport
industry research center, Sheffield Hallam university, London
40. Vent P. (1994) the mechanics of motion: Scientific aspects of jumping Coaching
Volleyball. Pp 26–27
41. Wilmore, J.H., and Costill, (1999) D.L. Physiology of Sports and Exercise. 2nd
Ed. Champaign, Human Kinetics
42. Zhang YB (2006) Modern training method of physical ability. PP. 3. Beijing:
Beijing Sports University Press
JOURNALES
1. Abebe Eshetu Degati, Harish Kumar (2017) The Relationship between Selected
Physical Fitness Variables with the Performance of Ethiopian Junior Sprinters
and Middle Distance Athletes Across Genders, OSR Journal of Sports and
Physical Education, Volume 4, Issue 1, PP 06-10
2. Abdu Mohammed Asfaw and Pallavi A. (2018)A comparative analysis of
selected anthropometric variables and somatotyping components of Ethiopian
female jumpers, International Journal of Applied Research 4 (2): 195- 200
3. Ackland Tr.,ong Kb., Kerr Da., Ridgb B. 2003;, Morphological characteristics
of Olympic sprint canoe and kayak paddlers. Journal of Science and Medicine
in Sport. 6:285-294.
139
4. Ali Wale, Semir Ibrahim (2018) Compare the Anthropometric measurements of
Tesfa Football Players according to Their Playing Positions International
Journal of Health, Physical Education and Computer Science in Sports, Volume
No.32, No.1pp81-87
5. Aditi S. Majumdar and Robert A. Roberts (2011) the Science of Speed:
Determinants of Performance in the 100 m Sprint, International Journal of
Sports Science & Coaching Volume 6 · Number 3.
6. Ajoy Bag, Aloke Sen Borman, Suprakash Das and Binod Chawdhury (2015)
Comparative Study on Physical Fitness of Volleyball and Football Players in
University Traits, Journal of Sports and Physical Education Volume 2, Issue 5,
PP 01-05,
7. Ahmed AlMaghawry (2012) Using Motor Anticipation Exercises and its
Physical and Cognitive Components to Improve the Effectiveness of the
Defensive Skills of Volleyball Players, World Journal of Sport Sciences 6 (3):
215-221.
8. Akilana N and Mohd Shafi Shahb (2014) comparison of speed and agility
between handball and volleyball players, International Journal of Physical
Education, Fitness and Sports, Vol.3. No.1 |
9. Aouadi R, Jlid MC, Khalifa R, Hermassi S, Chelly MS, Van Den Tillaar R,
Gabbett T. (2012), Association of anthropometric qualities with vertical jump
performance in elite male volleyball players. Journal of Sports Medicine,
Physiology and Fitness. Feb; Vol 52 (1): 11-17.
10. Anderson, Corey E; Sforzo, Gary A; Sigg, John A (2008).The Effects Of
Combining elastic and Free Weight Resistance On Strength And Power In
Athletes. Journal of Strength & Conditioning Research. 22(2):567-574,
11. Arvind Bahadur Singh, Satchidananda Behera (2013) Relationship of
Anthropometric Characteristics and Kinematic Variables with Spiking of
Volleyball Players, Journal of Education and Practice Vol.4, No.10,
12. Bayes, Bergeles, Apostolidis, Postolidis Ng, Noutsos K s, Koskolou Md (2006)
Anthropometric, body composition and somatotype differences of Greek elite
140
female basketball, volleyball and handball players, Journal of Sports Media &
Physical Fitness. 2006; 46(2):271-280.
13. Bag Ajoy, Aloke Sen Borman, Suprakash Das and Binod Chawdhury
(2015)Comparative Study on Physical Fitness of Volleyball and Football
Players in University Traits, IOSR Journal of Sports and Physical Education
(IOSR-JSPE. Volume 2, Issue 5 (Sep. – Oct.), PP 01-05,
14. Bandyopadhya, A. (2007) Anthropometry and body composition in soccer and
volleyball players in West Bengal, India, Journal of Physiological
Anthropology‟s Physiological Anthropology.26 (4), 501-505.
15. Bourgois J, classens al, vrijens j, philippaerts r,renterghem bv, thomis m.
janssens m.loss r.lefevre j. (2000) Anthropometric characteristics of elite male
junior rowers. British Journal of Sports Medicine.; 34:213-216.
16. Ben Abdelkrim N, Chaouachi A, Chamari K, Chtara M, Castagna C. (2010)
Positional Role and Competitive-Traits Differences in Elite-Traits Men's
Basketball Players. Journal of Strength and Conditioning Research. 24(5):1346-
1355,
17. Bradley, P.S. And Portas, M.D (2007) the relationship between precision range
of motion and muscle strain injury in elite soccer players. Journal of Strength
and Conditioning Research, 21, 1155-1159. https://www.researchgate.nets,
Accessed 7/7/2018
18. Bentzur KM, Kravitz, L, Lockner DW (2008) Evaluation of the BOD POD for
estimating percent body fat in collegiate track and field female athletes: A
comparison of four methods. Journal Strength Conditioning Res. 22(6):1985-
1991
19. Cabello Manrique, D, Gonzalez-Badillo J. (2003) Analysis of the characteristics
of competitive badminton. Br Journal of Sports Medicine v. 37. P 62-66
20. Category B., Pinar D, Sibel (2008) Evaluation of hand anthropometric
measurements and grip strength in basketball, volleyball and handball players,
International Journal of Experimental & clinical anatomy. 2:55-60.
21. Caroline C., Allen, Katie A. Dean, Alan P. Jung and John K., Petrella (2013)
Upper Body Muscular Activation during Variations of Pushups in Healthy Men,
141
International Journal of Exercise Science, Department of Kinesiology and
Nutrition Science, Samford University, Birmingham, Alabama,USA
22. Childs JD, Teyhen S. Benedict TM, et al. (2009) Effects sit-up training verses
core stabilization exercise on sit-up performance, journal of Medical science of
sports and exercise 41 (11) 2072-83
23. Claudio Luis Toledo Fonseca, Paula Roquetti Fernandes, José Fernandes
Filho(2010) Analysis of Anthropometrical Profile of Brazilian Junior Volleyball
Team, journal of research Gate
24. Duncan, M.J., Woodfield, L and AL-Nakeeb, Y. (2016) Anthropometric and
physiological characteristics of junior elite volleyball players, British Journal of
Sports MED. 40(7), 640-651.
25. Doppler, Terry, Amonette, William, E Coleman, Alfred, Hoffman, Jay, Wenzel,
Troy (2010) Anthropometric and Performance Differences Among High school
Football Players, Journal of strength and conditioning research / National
Strength & Conditioning Association,
26. Esco MR, Williford WN, Russell AR. (2011) Cross-validation of BMI-based
equations for predicting percent body fat in female collegiate athletes. Journal
of exercise physiology,; 14 (3): 43-52
27. Eom HJ, Schutz RW (1992) Statistical analyses of volleyball team performance,
Research Quarterly for Exercise and Sport. 63(1):11–18.
28. Faude, O, Meyer, T, Rosenberger, F, Fries, M, Huber, G, Kindermann,W.
(2007) Physiological characteristics of badminton match play. Europian Journal
of Applied Physiology, v. 100, p.479-485.
29. Duncan M J, L Woodfield, and Y al‐Nakeeb, (2006), Anthropometric and
physiological characteristics of junior elite volleyball players, British Journal of
Sports Medicine. Newman College of Higher Education, Birmingham, UK
30. Fattahi A., Ameli M., Sadeghi H., Mahmoodi B. (2012), Relationship between
anthropometric parameters with vertical jump in male elite volleyball players
due to game‟s position, Journal of Human Sport and Exercise, 7(3), 714–726.
142
31. Gabbett T.,Georgieff B.,Domrow N.(2007) The use of physiological,
anthropometric and skill data to predict selection in a talent-identified junior
volleyball squad. Journal of Sports Sciences, 25 (12), 1337–1344.
32. Gabbett T, Georgieff B (2007) Physiological and anthropometric characteristics
of Australian junior national, state, and novice volleyball players. Journal of
Strength & Conditioning Research, 21, 902-908
33. Gaurav V, Singh M, Singh S. (2010) Anthropometric characteristics,
somatotyping and body composition of volleyball and basketball players.
Journal of Physical Education and SportsManagement.1 (3): 28-32,
34. Gabbett, T.J., Kelly, J.N and Sheppard, J.M., Speed (2008) Change of Direction
Speed, and Reactive Agility of Rugby League Players, Journal of Strength and
Conditioning Research, , 22, 174-181.
35. Gabbett T, Georgieff B, Anderson S, Cotton B, Savovic D, Nicholson L (2006)
Changes In skill and physical fitness following training in talent-identified
volleyball players. Journal of Strength & Conditioning Research, 20, 29-35
36. Govind B. Taware1, Milind V. Bhutkar1, Anil D. Side (2013) Profile of Fitness
Parameters and Performance of Volleyball Players, JKIMSU, Vol. 2, No. 2.
India
37. Grant, S., Hasler, T., Davies, C., Aitchison, T.C., Wilson, J and Whittaker, A.R.
(2001) A comparison of the anthropometric strength, endurance and flexibility
characteristics of female elite and recreational climbers and non-climbers.
Journal of Sports Science, 19, 499-505.
38. Gualdi-Russo E, Zaccagni L. (2001) Somatotype role and performance of elite
volleyball players, Journal of Sports MED Phys Fitness.; 41 (2): 256-262
39. Hailu Kinfu, Yekoye Abebe, Egidio Beretta, Giuseppe Miserocchi, (2011)
Correlation of Heart Rate and Anthropometric Parameters with Performance
Scores Obtained From IAAF Tables in Elite Ethiopian Middle Distance
Runners ,The open sports medicine journal 5,12-18
40. Häkkinen K. (1993) Changes in physical fitness profile in female volleyball
players during the competitive season. J. Sports MED. Phys. Fitness., 33 (3):
223-232.
143
41. Hadzic, raised, Bjelica, Dusko, Popovic, Stevo, (2012) Comparative study of
anthropometric measurement and body composition between elite basketball
and volleyball players, Research in physical education, sport and health, 1:103-
108 https://www.researchgate.net ,Accessed 4/9/2018
42. Hertogh C, Hue O (2002) Jump evaluation of elite volleyball players using two
methods: jump power equations and force platform. Journal of Sports Medicine
& Physical Fitness 42, 300-303.
43. Jaromir Simonek, Pavol Horička and Ján Hianik (2017)The differences in
acceleration, maximal speed and agility between soccer, basketball, volleyball
and handball players, Journal of Human Sport and Exercise 12(1) ·
44. James RS, Carlos A, Navas A, and Herrel A. (2007). How important are skeletal
muscle mechanics in setting limits on jumping performance? Journal of
Experimental Biology; 210: 923-933.
45. Jogbinder Singh Soodan (2016) Relationship between anthropometric indices
and physical fitness of male cross-country athletes, International Journal of
Physical Education, Sports and Health 2016; 3 (5): 519-521
46. Ilias Z, Ioannis V, Marina G, Panagiotis K, (2009) Physical Fitness and
Anthropometric Characteristics in Different Traitss of Young Team Handball
Players, the Open Sports Sciences Journal. 2: 22-28
47. Lloyd RS, Oliver JL, Radnor JM, et al. (2015) Relationships between functional
movement screen scores, maturation and physical performance in young soccer
players, Journal of Sports Science.; 33 (1): 11–9.8.
48. Little, T.; Williams, A (2005) Specificity of acceleration, maximum speed and
agility in professional soccer players, Journal of Strength Cond. Res., 19, 76–78.
49. Lockie, R.; Shultz, A.; Callaghan, S.; Jeffriess, M.; Berry, S. (2013)Reliability
and validity of a new change-of-direction speed for field based sports; the
change-of-direction and acceleration tests (CODAT), Journal of Sports Science,.
MED. 12, 88–96.
50. Luke Reda Hailu (2017) Selected anthropometric profiles of U-17 male youth
soccer premier league players, Ethiopia, International Journal of Physiology,
Nutrition and Physical Education 2(2): 391-395
144
51. López-Miñarro, P. A., Andújar, P. S. B., García, P. L. R., & Toro, E. O. (2007)
A Comparison of the Spine Posture among Several Sit-and reach Test Protocols.
Journal of Science and medicine In Sport, 10, 456-462
52. Jain S, Pathmanathan G (2012) Importance of Anthropometry of Designing
User-Friendly Devices: Mobile Phones. Journal of Ergonomics, J Ergonomics ,
Retrieved from https://www.omicsonline.org, Accessed 1/1/2019
53. Jatinder Kumar, Basanti Bamaniya (2017) Estimation of motor abilities of
different traitss of Chandigarh male volleyball players, International Journal of
Logic, Human Movement and Sports Sciences 2017; 2 (2): 115-117
54. José M. Palau, Policarpo Manzanares, and David Valadés (2014)
Anthropometric, Physical, and Age Differences by the Player Position and the
Performance Traits in Volleyball, Journal of Human kinesiology, Vol. 9; 44:
223–236.
55. Jin XB, Liu Y, Zhang ZB, Gai Y (2007) Investigation on the features of young
female volleyball players and important body shape and specific fitness in our
country, Journal of Xi‟an Physical Education University, 24, 94-97
56. Koley S, Singh J, Sandhu JS. 2010. Anthropometric and physiological
characteristics of Indian inter-university volleyball players. Journal of Humanity
and Sport Exercise, Vol. 5, No. 3, pp. 389-399,
57. Kohli Keshav and Singh Harmandee (2014) A Comparative Study of Physical
Fitness Variables of male Volleyball Players and Football Players Journal of
Physical Education Sciences, Vol. 2(1), 5-7,
58. Lidor, R, and Ziv, G. (2010) Physical and Physiological Attributes of female
volleyball players-A review”, Journal of Strength & Conditioning Research, 24:
1963-1973.
59. Kutlu, M.; Yapici, H.; Yoncalik, O.; Celik, S. (2012) Comparison of a new test
of agility and skill in soccer with other agility tests, Journal Human kinesiology.
33, 143–150.
60. Liliana-Elisabeta Radu, Ileana-Monica Popovici, Alexandru-Rares P (2015)
Comparison of Anthropometric Characteristics Between Athletes and Non-
athletes, journal of Social and Behavioral Sciences volume. 191 pp 495 – 499
145
61. Marques, MC, van den Tillaar, R, Gabbett, TJ, Reis, VM, and Gonzalez-
Badillo, JJ., (2009) physical fitness quality of professional volleyball players:
determination of positional difference, The Journal of Strength and
Conditioning Research, Vol. 01,
62. Malousaris Gg, bergeles Nk, Barzouka Kg, Bayios La, Nassis Gp. Koskoloub
Md, (2008) Somatotype, size and body composition of competitive female
volleyball players. Journal of Science and Medicine in Sport, 11:337-344
63. Mandal N., Maity S., D. Sahu (2015) A study of Correlations between dominant
hand grip strength with some selected anthropometric and physiological
characteristics in inter-college male volleyball players of West Bengal, India
International Journal of Physical Education, Sports and Health; 1(5): 17-22
64. Maghsoud Peeri, Rezvan Sharif and Hassan Matinhomaee (2013), Relations of
some corporeal properties with performances of volleyball players who
participated in Japan world competitions, European Journal of Experimental
Biology, 3(5):88-94
65. Mermier, C.M., Janot, J.M., Parker, D.L and Swan, J.G. (2000), Physiological
and anthropometric determinants of sport climbing performance. British Journal
of Sports Medicine, 34, 359-366
66. Milić M1, Grgantov Z1, Chamari K2, Ardigò LP3, Bianco A4, Padulo J(2016)
Anthropometric and physical characteristics allow differentiation of young
female volleyball players according to playing position and traits of expertise,
Biol. Sport 33: pp-pp
67. M.C. Marques, D.A. Marinho (2009) Physical parameters and performance
values in starters and non-starters volleyball players: A brief research note.
Journal Motricidade. Vol 5, No 3 Retrieved from http://revistas.rcaap.pt
68. Mirkov DM1, Kukolj M, Ugarkovic D, Koprivica VJ, Jaric S. (2010)
Development of anthropometric and physical performance profiles of young
elite male soccer players: a longitudinal study. Journal of strength and
conditioning research / National Strength & Conditioning Association, Oct;
24(10):2677-82.
146
69. M Milić,Z Grgantov,K Chamari, LP Ardigò, A Bianco, and J Padulo, (2017)
Anthropometric and physical characteristics allow differentiation of young
female volleyball players according to playing position and traits of expertise
biology of sport, journal of sport and exercise science Mar; vol. 34: 19–26.
70. Mikko Häyrinen, Mikko Häyrinen, P Lahtinen, T Mikkola, Minna Blomqvist,
(Oct 2017), Serve efficiency in men‟s volleyball. European College of Sport
Sciencehttps://www.researchgate.net, Accessed on 7/1/2017
71. M Zadraznik, E Dervisevi, (2011) Performance Traits of play related
anthropometric differences in volleyball players. British journal of sport
medicine, Volume 45, Issue 6, http://bjsm.bmj.com,,Accessed 4/1/2017
72. Masoud Nikbakht (2011)Relationships between somatotype, anthropometry
and physical fitness variation in untrained university students, Journal of
Physical Education and Sport, JPES, 11 (2), Art 32, pp. 211-214
73. Moon JR, Tobkin SE, Smith AE, Lockwood CM, Walter AA, Cramer JT, Beck
TW, Stout JR (2009) Anthropometric estimations of percent body fat in NCAA
Division I female athletes: A 4-compartment model validation. Journal of
Strength Cond Res.; 23:Accessed 7/7/2018
74. Mohammed Endris, Dr. Harish Kumar, Dr. Harish Kumar (2018)Relationship
of Physical Fitness with Skill Performance of Ethiopian Basketball Players in
Reference to Amhara Region, International Journal of Physical Education and
Sports Sciences, Vol. 13, Issue No. 02, ISSN 2231-3745
75. Mooses M, Hackney AC (2017) Anthropometrics and Body Composition in
East African Runners: Potential Impact on Performance, international journal of
sports physiology and performance. 12 (4): 422–30.
76. Nebojša Trajković, Nebojsa, Zoran Milanović, Milivoje (2011) Positional
differences in body composition and jumping performance among youth elite
volleyball players, Acta Kinesiologica 5 (2011) 1: 62-66
77. Nelson, R.T and Bandy, W.D. (2004). Eccentric training and static stretching
improve hamstring flexibility of high school males. Journal of Athletic
Training, 39, 254-258
147
78. Nebojs A Trajkovic, Ebojs A Trajkovic, Zoran Milanovic, Goran Sporis, Milic
Stankovic Ratko, Vladan (2012) The effect of 6 weeks of precision skill based
conditioning on physical performance in male volleyball players, Journal of
Strength and Conditioning Research, Vol. 26 (6).
79. Nevin Utkualp and Ilker Ercan (2015) Anthropometric Measurements Usage in
Medical Sciences. Journal of biomedicine research internationally. Retrieved
from https://www.ncbi.nlm.nih.gov, Accessed 7/9/2018
80. Norton K, Olds T. (2001) Morphological evolution of athletes over the 20th
century. Sports Medicine, 31: 763-783
81. Petroski, E.L., Fraro, J.D., Fidelix ,Y.L., Silva,D.A.S., Piresneto, C.S.,
Dourado, A.C.,Rocha, M.A., Stanganelli,L.C.R and Oncken,P., Viera,F.S.
(2013) Anthropometric, morphological and somatotype characteristics of
athletes on the Brazilian Men‟s volleyball team: Rev Bras Cineantropom
Desempenho Hum.15 (2), 184-192.
82. Ostojic SM, Mazic S, Dikic N (2006) Profiling in basketball: physical and
physiological characteristics of elite players, Journal of Strength and
Conditioning Research / National Strength & Conditioning Association, 20,
740-744.
83. Palau JM, Santos JA, Ureña A (2004) Effect of team traits on skill performance
in volleyball. International Journal of Performance Analysis in Sport. 4(2):50–
60.
84. Palau JM, Santos JA, Ureña A (2007) Effect of the manner of spike execution
of spike performance in volleyball. International Journal of Performance
Analysis in Sport. 7(2):126–138.
85. Pridal V., Hancák J. (2012) Effects of selected kinds of game skills of an
individual on the set outcome in men‟s top-traits volleyball, Acta Facultatis
Educationis Physicae Universitatis Comenianae, 52(1), 49–60.
148
86. Raul Garrido-Chamorro;José Enrique Sirvent-Belando;Marta González-
Lorenzo; Cristina Blasco-Lafarga &Enrique Roche (2012.) Skinfold Sum:
Reference Values for Top Athletes. Sumatorio de Pliegues Subcutáneos:
Valores de Referencia para Atletas de Élite, International journal of
Morphology. Vol. 30 (3): 803-809,
87. Ridha Aouadi, Homoud Mohammed Nawi Alanazi (2015) the relationship
between lower limb length and vertical jump in young volleyball players. The
Swedish Journal of Scientific Research ISSN: 2001-9211.Vol. 2. Issue 4. Saudi
Arabia.
88. Ricarte Batista G., Freire De Araujo R, Oliveira Guerra R. (2008) comparison
between vertical jump of high performance athletes on the Brazilian men's
beach volleyball team. Journal of sports medicine and physical fitness, volume
48(2)172-176
89. Reilly T. Bangsbo J, Franks A. (2000) Anthropometric and physiological
predispositions for elite soccer, Journal of Sports Sciences. 18(9):669-683
90. Romero-Corral, A., Somers, V., Sierra-Johnson, J., Thomas, R., Collazo-
Clavell, M., Korinek, J (2008), Accuracy of body mass index in diagnosing
obesity in the adult general population. International Journal of Obesity, 32,
959-966
91. Rafael Wishnizer R., Omri Inbar, Eliezer Klinman, Gershon Fink (2013)
Physiological Differences between Ethiopian and Caucasian Distance Runners
and Their Effects on 10 km Running Performance, scientific research,
Advances in Physical Education, Vol.3, No.3, 136-144
92. Rômulo Araújo Fernandes, Diego Giuliano Destro Christofaro, Gabriel Grizzo
Cucato, Ismael Forte Freitas Júnior (2007) Nutritional status, physical activity
traits, waist circumference, and flexibility in Brazilian boys, Brazilian journal of
kin anthropometry, volume 9, number 4.
93. Sporis, G.; Jukic, I.; Milanovic, L.; Vucetic, V. (2010) Reliability and factorial
validity of agility tests for soccer players. J. Strength Cond. Res. 24, 679–686.
149
94. Sareeh Abdulkarim Al-Fadhli S.A., Makki Ali A., Israa Fuad Saleeh. (2015).
Influence of instantaneous torque exercises according to absolute angles for
certain body parts in some of the variables biomechanics to take off to vault and
jumping events of athletics.The Swedish Journal of Scientific Research ISSN:
2001-9211.Vol. 2. Issue 1. Jan. p.11-15.
95. Sanjib Mridha (2010), A comparative study of body composition of male and
female national traits sub-junior volleyball players, British journal of sports
medicine,Vol.44. Issue. Sup 1 retrieved from http://bjsm.bmj.com
96. Sheppard, J.M. Nolan, E and Newton, R.U. (2012), “Changes in strength and
power qualities over years in volleyball players transitioning from junior to the
senior national team”, Journal of Strength & Conditioning Research, 26 (1),
152-157. Retrieved from http://www.bcjms.bhattercollege.ac.
97. Sameer Kumar Yadav (2015) Relationship of selected anthropometric and
physical fitness variables with the volleyball playing performance, Indian
journal of applied research Volume: 5 | Issue: 3 |
98. Samantha Fawkner (2013) Use of anthropometry – its importance and critical
use in the assessment of growth, Journal of sport science. Volume 31, 2013 -
Issue 15. Pages 1625-1626 Retrieved from http://dx.doi.org, Access on
08/8/2018
99. Scott Davis D., David Briscoe, Craig A., Markowski, Samuel T., Saville E and
Christopher Taylor J. (2003) Physical characteristics that predict VJP in
recreational male athletes. Physical Therapy in Sport, 4:167-174.
100. Scanlan AT, Tucker PS, Dalbo VJ. (2014) A comparison of linear speed,
closed-skill, agility, and open-skill, agility qualities between backcourt and
frontcourt adult semiprofessional male basketball players, J Strength Cond Res.;
28 (5): 1319–27.9.
101. Serpell BG, Young WB, Ford M. (2011)Are the perceptual and decision-making
components of agility trainable?, A preliminary investigation. J Strength Cond
Res.; 25 (5): 1240–8
150
102. S. Rameshkannan and B. Chittibabu (2014) Comparison of abdominal strength,
endurance between handball and volleyball players, International Journal of
Life Sciences and Educational Research, Vol. 2 (4), pp. 129 - 130,
103. Sotiropoulos Kostas, Ilias Smilios, Christou A. Marios, Savvas P. Tokmakidis
(2009) Jumping ability, reactive strength and anthropometric characteristics of
elite junior women volleyball players, Research gate.
https://www.researchgate.net, Accessed on 5/6/2018
104. Sheppard JM1, Cronin JB, Gabbett TJ, McGuigan MR, Etxebarria N, Newton
RU. (2008) Relative importance of strength, power, and anthropometric
measures to jump performance of elite volleyball players, Journal of Strength
and Conditioning Research / National Strength & Conditioning Association,
May; vol. 22 (3): 758-65.
105. Sheppard JM, Dingley AA, Janssen I, Spratford W, Chapman DW, Newton RU.
(2011) the effect of assisted jumping on vertical jump height in high-
performance volleyball players. J Sci MED Sport. Jan; 14 (1): 85-9.
106. Sheppard JM, Young WB. (2005) Agility literature review: classifications,
training and testing. J Sports Sci. 2006 Sep; 24 (9): 919-32.
107. Scanlon, A., Humphries, B., Tucker, P.S and Dalbo, V(2013) The Influence of
Physical and Cognitive Factors on Reactive Agility Performance in Men
Basketball Players, Journal of Sports Sciences, , 32 (4): 367-74
108. Šimonek, J., Horička, P., & Hianik, J. (2017) the differences in acceleration,
maximal speed and agility between soccer, basketball, volleyball and handball
players. Journal of Human Sport and Exercise, 12 (1), 73-82. Do:
10.14198/cheese. 2017.121.06
109. Sheppard, J.M., Young, W.B., Doyle, T.L.A., Sheppard, T.A and Newton, R.U.,
An Evaluation of a New Test of Reactive Agility and its Relationship to Sprint
Speed and Change of Direction Speed, Journal of Science and Medicine in
Sport, 2006, 9, 342-349.
110. Self M (2001) Biomechanical foundations of strength and power training,
Biomechanics in Sport. Lon-don: Blackwell Scientific Ltd; p. 103–39
151
111. Sheppard, J.M., & Young, W.B. (2006) Agility Literature Review:
Classifications, Training and Testing, Journal of Sports Sciences, 24(9), pp.919-
932.
112. Shyamal Koley, Jarnail Singh, Jaspal Singh Sandhu, (2010) Anthropometric and
physiological characteristics of India inter university volleyball players, Journal
of human sport and exercise, Faculty of Education. University of Alicante ISSN
1988-5202
113. Slater Gael, Rice AJ., Mujikal Hahn Ag, Sharp K. Jenkins Dg (2005)Physique
traits of lightweight rowers and their relationship to competitive success, British
Journal of Sports Medicine. 39:736-741.
114. Stamm, R., Veldre, G., Stamm, M., Thomson, K., Kaarma, H., Loko, J.(2003)
Dependence of young female volleyballers performance of their body builds,
physical abilities, and psycho-physiological properties, .Journal Sports MED
Phys Fitness. 43(3), 291-299.
115. Stamm, R, Stamm, M, Koskel S, Karma H, (2002) Testing of Estonian young
female volleyballers' (aged 13-16) physical abilities considering their body
build. Acta Kinesiology Universitatis Tartuensi, 7, 177-181.
116. Stanganelli LCR, Dourado AC, Oncken P, Mançan S, DA Costa SC (2008)
Adaptations on Jump Capacity in Brazilian Volleyball Players Prior to the
Under-19 World Championship. Journal of Strength & Conditioning Research
22, 741-749.
117. Stewart At (2010) Kin anthropometry and body composition: A natural home
for three dimensional photonic scanning. Journal of Sport Science; 28(5): 455–
457.)
118. Takanori Noguchi, Shinichi Demura, Kenji Takahashi (2013) Relationships
between Sit-ups and abdominal flexion strength tests and the thickness of each
abdominal muscle, advances in Physical Education, scientific research, Vol.3,
No.2, 84-88
119. Tilahun Bereded and Paramvir Singh (2016a) Determinants of vertical jump on
football in Ethiopian youth sport academy International Journal of Physical
Education, Sports and Health; 3 (6): 460-465
152
120. Tilahun Bereded, Prof. Paramvir Singh (2016b) Physiological Characteristics of
Female Ethiopian Youth Sport Academy Football Players at Different Age
Groups, IOSR, Journal of Sports and Physical Education, Volume 3, Issue 6,
PP 25-29
121. Thakur, J.S and Sinha, A. (2010), “Relationship of Physical Fitness
Components to Basketball Performance”, PERSIST, 1 (1), 59-63.
http://www.bcjms.bhattercollege.ac.Accessed on 5/5/2018
122. Tim Gabbett, Boris Georgie & Nathan Domrow (2007) The use of
physiological, anthropometric, and skill data to predict selection in a talent
identified junior volleyball squad, journal of Sports Sciences, October; 25 (12):
1337 – 1344
123. Timothy J. Suchomel, Sophia Nimphius, Michael Henry Stone (2016) The
Importance of Muscular Strength in Athletic Performance, journal of Sports
Medicine 46 (10)
124. Tokuyama M, Ohashi H, Iwamoto H, Takaoka K, Okubo M (2004)
Individuality and reproducibility in high-speed motion of volleyball spike jumps
by phase-matching and averaging, Journal of Biomechanics, Nov, 38 (10):
2050-2057
125. Utkualp N and Ercan I. (2015) Anthropometric Measurements Usage in Medical
Sciences, BioMed Research International.7.
126. Visa Gaurav, Amandeep Singh (2014) Anthropometric characteristics of Indian
volleyball players in relation to their performance traits, Turkish Journal of
Sport and Exercise, Volume: 16 - Issue: 1 - Pages: 87-89
127. Visa Gaurav and Amandeep Singh (2014b) comparison of selected physical
fitness variability among basketball players of different playing position,
International journal of human movement’s sports and allied sciences.
Volume1- Issue II
128. Visa Gaurav, Amandeep Singh, Sukhdev Singh (2015) Comparison of selected
physical fitness components among male football players of different playing
positions, Turkish journal of sport and exercise Vol 17, No 2
153
129. Voigt HF, Vetter K (2003) The Value of Strength-Diagnostic for the Structure
of Jump Training in Volleyball. European Journal of Sport Science, 3, 1
130. Veale JP, Pearce AJ, and Carlson JS (2010) Reliability and Validity of a
Reactive Agility Test for Australian Football. International Journal of Sports
Physiology and Performance, 5, 239-248.
131. Voigt, H. F., & Vetter, K. (2003) The value of strength-diagnostic for the
structure of jump training in volleyball. European Journal of Sport Science, 3
(3), 1-10
132. Visa Gaurav and Amandeep Singh (2014) Anthropometric characteristics of
Indian volleyball players in relation to their performance traits, Turkish Journal
of Sport and Exercise Volume: 16 - Issue: 1 - Pages: 87-89
133. Warner ER, Fornetti WC, Jallo JJ, Pivarnik JM (2004) A skin fold model to
predict fat-free mass in female athletes. Journal of Athletic Train; 39 (3): 259-
262.
134. Wong, Del p, camera, Karim A, Della well-off, Ulrik (2009) relationship
between anthropometric and physical characteristic in youth soccer players,
journal of strength and conditioning research
135. Yilmaz, Serdar; Venugopal, Varsha (2008) Local Government Discretion and
Accountability in Ethiopia, research gate, Retrieved 22 June 2013.
136. Yuri Germano Muniz, Marco Cossio-Bolaños, Rossana GómezCampos,
Ezequiel Moreira Gonçalves, Evandro Lázari, Camilo Urra-Albornoz, Miguel
De Arruda (2017) Estimate of Body Fat Percentage in Male Volleyball Players:
Assessment Based on Skin folds, Journal of Exercise Physiology, Volume 20
Number 3
137. Young W, Farrow D, Pyne, D, et al. (2011) Validity and reliability of agility
tests in junior Australian football players. J Strength Cond Res.; 25 (12): 3399–
403.10.
138. Young WB, Dawson B, Henry GJ (2015) Agility and Change-of-Direction
Speed are Independent Skills: Implications for Training for Agility in Invasion
Sports. International Journal of Sports Science & Coaching,10 (1). 159-169
154
139. You YQ, Huang Y (2000) some problems of physical characteristics analyzed
for volleyball players. Journal of Zhou Kou Teachers College, 17, 88-90.
140. Zakas A, Vergou A, Grammatikopoulou MG, Zakas N, Sentelidis T,
Vamvakoudis S(2003) The effect of stretching during warming-up on the
flexibility of junior handball players, Journal of Sports Medicine Phys Fitness.
Jun; 43 (2): 145-9.
141. Zerihun Birhanu and Rediet Mesfin (2017) The association between
anthropometric, physiologic and physical fitness variables with 5000m running
performance for junior female athletes, International Journal of Physiology,
Nutrition and Physical Education 2017; 2 (1): 162-166
PUBLISHED THESIS
1. Davide Barbieri (2013) Kin anthropometry and Sport Practice (doctorate in
science, biomedical) University degli Studi DI Ferrara, Scientific-Disciplinary
sectors: BIO/08 retrieved from http://eprints.unife.it, Accessed 9/8/2018
2. Eskandarnejad M, (2000)Comparing anthropometric characteristics and aerobic
capacity of selected female badminton players of Iran and Julian, MSc Thesis,
University of Guilan, Faculty of Physical Education.
3. Jafari A, (2006) Evaluating anthropometric, bio-movement and bioenergetics
characteristics of elite female Iranian taekwondo players and the determining
relationship between these characteristics and their success. MSc Thesis,
Faculty of Humanities, Tarbiat Modaress University, Tehran.
4. Nicholas David Bourne (2008) A history of training theory and methods for the
elite runner through 1975, Dissertation, Presented to the Faculty of the Graduate
School of The University of Texas at Austin in Partial Fulfillment of the
Requirements for the Degree of doctor e of philosophy, The University of Texas
at Austin.
5. Rupesh p. (2010) Performance about a two foot vertical jump: what is more
important hip or knee dominance? A thesis presented to the University of
155
Waterloo in fulfillment of the thesis requirement for the degree of Master of
Science in Kinesiology;
6. Zhang, Y 2010, 'An investigation on the anthropometry profile and its
relationship with physical performance of elite Chinese women volleyball
players', MSc thesis, pp 33 Southern Cross University, Lismore, NSW.
WEBSITS
1. Abiy wendeferaw (2018) A Long Road to Revival the attempt to resurrect
Ethiopia‟s Volleyball scene, retrieved from https://ethiopianbusinessreview.net
Accessed on 7/5/2019, Accessed 7/1/2018
2. Andrea Cespedes (Jul 18, 2017) How to Calculate BMI for Athletes.
Livestrong.com. retrieved from https://www.livestrong.com, Accessed 7/8/2018
3. American physical therapy association, (APTA, 2017) Anthropometric
characteristics, A guide to physical therapists practice, retrieved from
http://guidetoptpractice.apta.org ,Accessed 7/8/2018
4. Australian Sports Commission, (ASC. 2017) what is sport? Retrieved from:
https://www.ausport.gov, Assessed on 3/5/2018
5. BBC sports (2018) Why's agility important? Retrieved from:
http://news.bbc.co.uk,Accessed 7/7/2018
6. Braden Keith (2017) Canadian Volleyball, International Volleyball,
https://volleymob.com, Accessed 7/9/2018
7. Bridge Athletic (2017) Three Reasons Why Volleyball Players Need Strength
and Conditioning, Junior Volleyball Association, retrieved from:
https://community.sportsengine.com,Accessed 7/9/2018
8. Beverly Oden (2017) The Opposite in Volleyball Positions, thought co.
https://www.thoughtco.com, Accessed 7/6/2018
9. Body ventures (2017) BMI for Athletes, Diet and fitness today.
http://www.dietandfitnesstoday.com, Accessed 7/3/2018
156
10. Charushila Biswas (2018) Eight correct ways to do sit-ups to get a flat tummy
and prevent Injuries, retrieved from https://www.stylecraze.com, Accessed on
1/2/2019,
11. Dennis Jackson (2017a) volleyball Positions Terms of the Volleyball Court
,Retrieved from http://www.strength-and-power-for-volleyball.com ,Accessed on
11/9/2018
12. Dennis Jackson (2017b) volleyball player Positions and court position Terms of
the Volleyball Court, retrieved from: http://www.strength-and-power-for-
volleyball.com, Accessed on 13/6/2018
13. Dennis Jackson (2017c) How to Play Volleyball Skills, Positions, Rules, and
Strategy, retrieved from http://www.strength-and-power-for-volleyball.com,
Accessed 12/9/2018
14. Dominique Gummelt (2015) the Impact of Flexibility Training on Performance,
retrieved from: https://www.acefitness.org, Accessed on 2/2/2019.
15. Duane V Knudson, Peter Magnusson and Malachy McHugh (2000) Current
Issues in Flexibility, Fitness, Retrieved from: https://www.researchgate.netn,
Accessed on 11/8/2018
16. Elio Locatelli (2017) Factors influencing speed and sprint performance,
European athletics, your sport for life, retrieved from:
http://www.europeanathletics.org, Accessed on 2/2/2018
17. Elizabeth Quinn, (2018) Test Your Upper Body Fitness with the Pushup Test;
retrieved from https://www.verywellfit.com,Accessed 12/6/2018
18. Elizabeth Quinn (2018) How to Perform the Sit and Reach Flexibility Test, Sit
and reach are a simple measurement of lower back and hamstring flexibility,
https://www.verywellfit.com,Accessed 22/9/2018
19. Elizabeth Quinn (2018) Abdominal Muscles Location and Function, retrieved
from: https://www.verywellfit.com ,Accessed 12/9/2018
20. Elizabeth Quinn (2018) Health and safety, measuring Skin folds for Determining
Body Fat Percentage, retrieved from: https://www.verywellfit.com Accessed
12/2/2018
157
21. Federation International de Volleyball (FIVB, 2012) Height of the 4 top Men
Volleyball teams per player position in 2012 Olympic Games. Retrieved from
http://www.fivb.org, Accessed 12/5/2018
22. Federation international volleyball, (FIVB, 2016) volleyball at the Olympic.
http://rio2016.fivb.com, Accessed 18/4/2018
23. Federation International de Volleyball (FIVB, 2017) Senior World Ranking
(Men), Retrieved from http://www.fivb.org.asp ,Accessed 12/5/2018
24. Guardian sport (2016) could you be an athlete? Olympics 2012 by age, weight
and height, Sport London 2012 data, Retrieved from https://www.theguardian,
Accessed 4/9/2018
25. Health reviser, (2010) fitness traits, health assessment tool, Retrieved from:
http://www.healthreviser.com,Accessed 6/9/2019
26. Historical background of volleyball teams in Ethiopia, retrieved from
www.ethiosport.com, Accessed on 23/4/2019
27. History of volleyball in Africa, https://en.wikipedia.org/wiki/African Volleyball
Confederation, Accessed on 6/4/2019
28. Horn of Africa, available at; https://en.wikipedia.orga, Accessed on 6/4/2019
29. John Sifferman (2017), Physical Living, How Many Pushups Should I Be Able
To Do?, retrieved from http://physicalliving.com, Accessed 2/3/2019
30. Igor utsumi (July 2014) most popular sport in Brazil, the Brazil business,
http://thebrazilbusiness.com, Accessed 4/9/2018
31. International Olympic committee (IOC, 2016) volleyball was conceived as less
strenuous alternatives to basketball. The sport became popular very quickly and
made its Olympic debut in 1964. Retrieved from https://www.olympic.org,
Accessed 1/2/2019
32. International volleyball federation, (FIVB, 2008) retrieved from
http:www.five.org , Accessed on 1/2/2019
33. Jay Hoffman, (2006) Norms for fitness, performance and health, college of new
jersey, https://www.haffman,org, Accessed 1/1/2019
34. Jack Woodrup (2009) Vertical mastery, retrieved from: https://jumpshigher.com
, Accessed on: 1/7/2018
158
35. Jason Anderson (2008) for fitness you can do at home. Spark people live health
& fitness. Retrieved from https://www.sparkpeople.com,Accessed on 4/3019
36. Kelly Baggett (2005) The Vertical Jump Development Bible, higher, faster
sports, available at, http://www.fitnesslife.com Accessed on 24/2/2019
37. Kasper Vuorinen, Antti Mero (2018) modern volleyball analysis and training per
iodization website, retrieved from https://jyx.jyu.fiper. Accessed on 9/2/2018
38. Mayo Clinic (2019) Mayo Foundation for Medical Education and Research
(MFMER) web site: https://www.mayoclinic.org Accessed 7/7/2018
39. Mike Behnken (2016) Components of Physical Fitness. Ask the trainer
.Retrieved from https://www.askthetrainer.com, Accessed 7/2/2019
40. Michael Morelli Ir., six pack finishers complete guide, How to eat and train for
six-pack ABS, available at. http://www.sixpackfinishers.com ,Accessed on
2/3./2019
41. Michael Joyner (August, 2016) the age of Olympians: Rio 2016 highlights
younger, older athlete performances. Retrieved from https://www.si.com,
Accessed 7/1/2017
42. Natalie Digate Muth (December 02, 2009) what are the guidelines for percentage
of body fat loss? American council of exercise, https://www.acefitness.org,
Accessed 7/2/2019
43. Nick van der Horst (2017) Prevention of hamstring injuries in male soccer,
retrieved from https://www.sportengeneeskunde.nl, Accessed 9/7/2018
44. Patrick Dale (2017) five fitness component for volleyball, livestrong.com.
Retrieved from https://www.livestrong.com Accessed 7/9/2018
45. Robert Wood (2017 October) History of sport. Top end Sports, website
http://www.topendsports.com ,Accessed 28/8/ 2017
46. Robert Wood (2012) Sit and reach norms. Top end Sports, available at
http://www.topendsports.com,Accessed13/ 7/2017
47. Robert Wood (2008b) Body Fat Equations Top end Sports, website
http://www.topendsports.com: Accessed 31/9/ 2017
48. Robert Wood (2017), sit and reach test Scores, Top end Sports, available at,
http://www.topendsports.com, Accessed 10/ 02017
159
49. Robert Wood (2008d), push up test Scores, Top end Sports, available at,
http://www.topendsports.com,Accessed 03/9/ 2017
50. Robert Wood, (2008e), T-Test of Agility, Top end Sports, available at,
http://www.topendsports.com, Accessed 08/8/ 2017
51. Robert Wood (2017b), sit up test: testing your fitness at home, Top end Sports,
available at, http://www.topendsports.com,.htm Accessed 03/9/ 2017
52. Robert Wood (2017c), vertical jump test: testing your fitness at home, Top end
Sports, available at ,http://www.topendsports.com,Accessed 03/8/ 2017
53. Robert Wood (2008a), Skin folds Body fat Test Scores, Top end Sports, website
http://www.topendsports.com, Accessed 30/3/2017
54. Robert Wood (2010), components of fitness, Top end Sports, website
http://www.topendsports.com, Accessed 28/7/ 2017
55. Robert Wood (2015), Anthropometry of Volleyball Players, Top end Sports,
available at: http://www.topendsports.com, Accessed 31/7/2017
56. Robert Wood (2010) "Speed Training: How to Get Faster." Top end Sports
Website, https://www.topendsports.com, Accessed 2/19/2019
57. Rick cutoff (Feb, 21, 2013) How Important is a Low Body Fat Percentage?,
training peaks, https://www.trainingpeaks.com,Accessed 7/6/2018
58. Robert Wood, (2008) "T-Test of Agility." Top end Sports Website,
https://www.topendsports.com, Accessed 2/15/2019
59. Rachel Grice (2017) 21 Sit-Ups You Won't Totally Hate, Live strong sport and
fitness ABS exercise, retrieved from : https://www.livestrong.com, Accessed on
2/3/2019
60. Robert Wood, (2015) Anthropometry of Volleyball Players, Top end Sports,
available at; http://www.topendsports.com.Essays, UK.
61. Robert Wood (2016), List of Sports at the 1896 Olympic Games, Top end Sports,
available at http://www.topendsports.com, Accessed on 2/3/2018
62. S A Khadar, (2012) Premier League, Collins dictionary, available at
https://www.collinsdictionary.com, Accessed on 2/3/2018
63. Sam Redding (2011) what extent did the industrial revolution change sports?
Retrieved from https://prezi.com, Accessed on 2/7/2018
160
64. Sarah Klein (2017) life wellness, Why The Pushup Is The World's Greatest
Exercise, retrieved from: https://www.huffpost.com,. Accessed on 08/28/2018
65. Solomon Addis Getahun,(2019) A History of Sport in Ethiopia, available at
Sport in Ethiopia, https; sport history.org, accessed on 2/6/2019
66. Tadele Yidnekachew Tessema (1998) In The World and in the World of sports
:http://www.ethiosports.com,Accessed April 16, 2019
67. Tim Newman (July 2017) what is fitness? What does being physically fit mean?
Medical news today. Retrieved from https://www.medicalnewstoday.comp
Accessed on 5/6/2018
68. Volleyball worldwide (2011) History of volleyball. Retrieved from
http://www.volleyball.org, Accessed on 6/9/2018
69. Volleyball worldwide (n.d) http://www.Volleyball.ORG, Accessed on 4/6/2018
70. United Nations Inter-agency Taskforce on Sport for Development and Peace
(UNITSDP, 2017) what is 'sport'? Retrieved from https://www.sportanddev.org,
Accessed on 5/2/2019
71. US national library of medicine (2017) is height determined by genetics?
Retrieved from https://ghr.nlm.nih.gov,Accessed on 5/6/2018
72. Wikipedia, the free encyclopedia, (2017) Volleyball at the 2016 Summer
Olympics, available at: https:// Wikipedia.com. Accessed on 3/6/2018
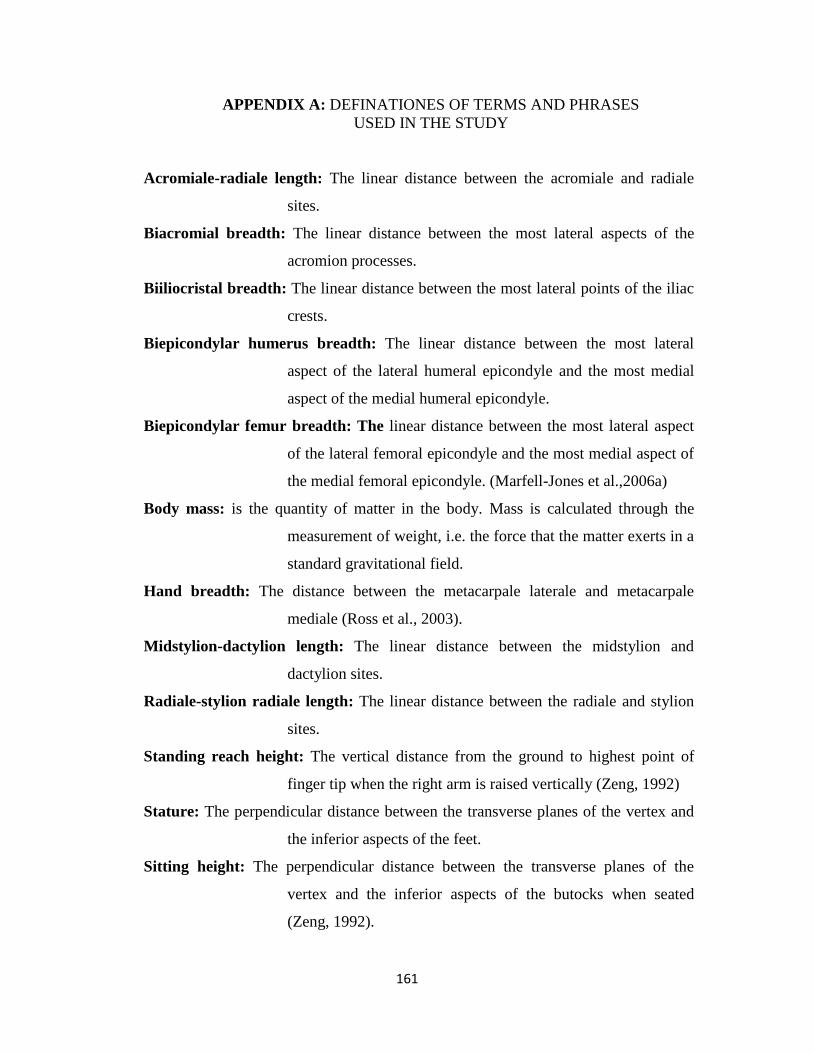
161
APPENDIX A: DEFINATIONES OF TERMS AND PHRASES
USED IN THE STUDY
Acromiale-radiale length: The linear distance between the acromiale and radiale
sites.
Biacromial breadth: The linear distance between the most lateral aspects of the
acromion processes.
Biiliocristal breadth: The linear distance between the most lateral points of the iliac
crests.
Biepicondylar humerus breadth: The linear distance between the most lateral
aspect of the lateral humeral epicondyle and the most medial
aspect of the medial humeral epicondyle.
Biepicondylar femur breadth: The linear distance between the most lateral aspect
of the lateral femoral epicondyle and the most medial aspect of
the medial femoral epicondyle. (Marfell-Jones et al.,2006a)
Body mass: is the quantity of matter in the body. Mass is calculated through the
measurement of weight, i.e. the force that the matter exerts in a
standard gravitational field.
Hand breadth: The distance between the metacarpale laterale and metacarpale
mediale (Ross et al., 2003).
Midstylion-dactylion length: The linear distance between the midstylion and
dactylion sites.
Radiale-stylion radiale length: The linear distance between the radiale and stylion
sites.
Standing reach height: The vertical distance from the ground to highest point of
finger tip when the right arm is raised vertically (Zeng, 1992)
Stature: The perpendicular distance between the transverse planes of the vertex and
the inferior aspects of the feet.
Sitting height: The perpendicular distance between the transverse planes of the
vertex and the inferior aspects of the butocks when seated
(Zeng, 1992).
162
APPENDIX B: INFORMED CONSENT FORM
I (print name) ______________________________ hereby consent to participating in
the anthropometric and fitness assessment on the following terms: I have been
informed about the anthropometric and fitness assessment procedures and understand
what I will be required to do. I understand that I will be partaking in physical
exercise, some of which are at maximal intensity. I have told the testing personnel
about any illness or physical defect I have that may contribute to the traits of risk.
I understand that the information obtained from the test will be treated confidentially,
with my right to privacy assured. However, the information obtained may be used for
statistical analysis or scientific purpose with my right to privacy retained. I accept
however that the testing personnel will take every precaution to ensure that no
incidents will occur.
Participant signature ___________________Date_____________________________
Coach Signature ______________________ Date________________________
Witness _____________________________Date____________________________

163
APPENDIX C: ANTROPOMETRIC ASSESSMENT SHEET
NAME OF THE TEAM ………………………………
CODE OF PLAYERS: …………………………………
Anthropometric variables Measurements (cm)
1. Basic measurements
1.1. Stature
1.2. Body weight
1.3. Sitting height
1.4. Standing reach height
1.5. Body mass index(derived)
2. Skin folds
2.1. Triceps
2.2. Sub scapular
2.3. Abdominal
2.4. Iliac crest
2.5. Mid-thigh
2.6. Calf
3 Girth
3.1. Neck
3.2. Chest
3.3. Relaxed arm
3.4. Flexed and tense arm
3.5. Forearm
3.6. Wrist
3.7. Waist
3.8. Gluteus
3.9. Tight
164
3.10 Café
3.11 Ankle
4 Length
4.1. Radiale-stylion radiale,
4.2. Acromiale- radiale
4.3. Midstylion- dactylion
4.4. Acromiale-dactylion length (derived)
5. Breadth
5.1. Biacromial
5.2. Transverse chest
5.3. Biilocristal
5.4. Biepicondylar femur
5.5. Biepicondylar humerus
5.6. Hand
Name and signature of the instructor……………………………………….
Date …………………….
Name and signature of the coach‟s…………………………………………..
Date…………………….
165
APPENDIX D: FITNESS ASSESMENT SHETT
NAME OF THE TEAM: ----------------------------------------------------------------
CODE OF PLAYERS: ---------------------- Age…………….. Training age …………………
Fitness components Fitness score
1 Flexibility performance
Sit and reach test score
2
Upper & Middle body Strength
Push up test score
Sit up test score
4 Speed
10 m sprint
5 Agility
T-shuttle run score
6 Exclusives power
Vertical jump height with powerful
hand only (spike reach height )
Vertical jump height with both hand
(Block reach height)
Name and signature of coach ---------------------------------------------------
Date: ---------------------------
Name and signature of instructor ---------------------------------------
Date: ---------------------------
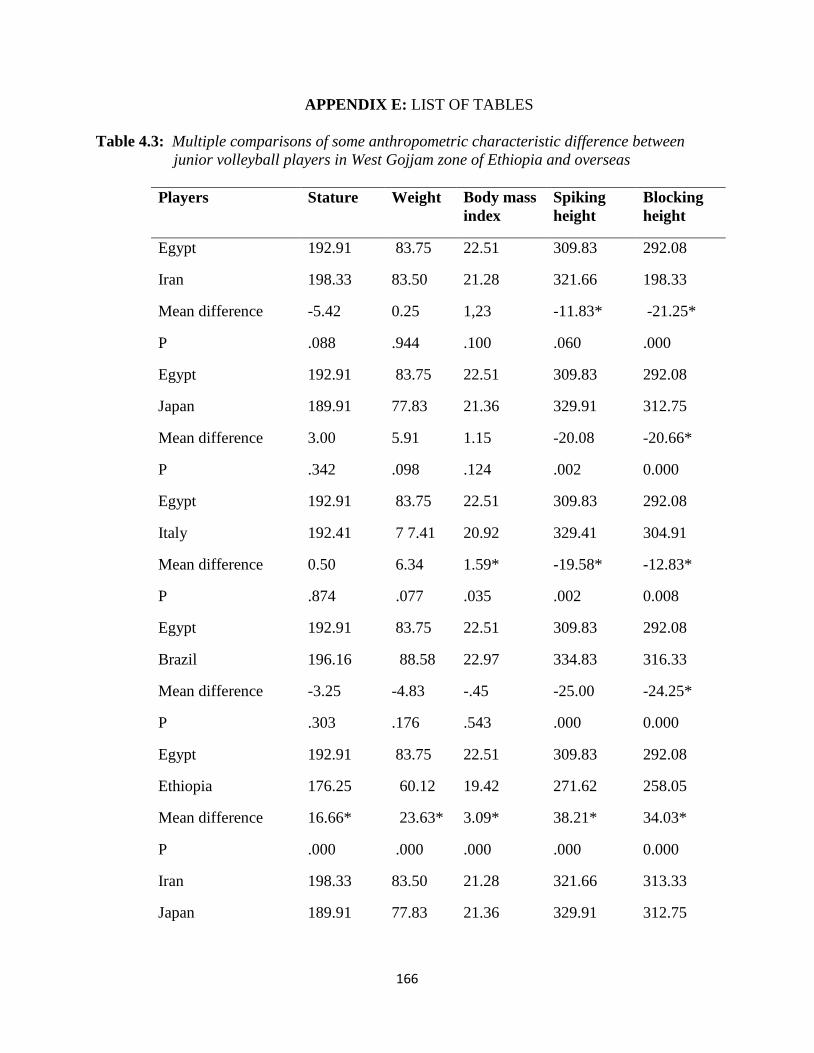
166
APPENDIX E: LIST OF TABLES
Table 4.3: Multiple comparisons of some anthropometric characteristic difference between
junior volleyball players in West Gojjam zone of Ethiopia and overseas
Players Stature Weight Body mass
index
Spiking
height
Blocking
height
Egypt 192.91 83.75 22.51 309.83 292.08
Iran 198.33 83.50 21.28 321.66 198.33
Mean difference -5.42 0.25 1,23 -11.83* -21.25*
P .088 .944 .100 .060 .000
Egypt 192.91 83.75 22.51 309.83 292.08
Japan 189.91 77.83 21.36 329.91 312.75
Mean difference 3.00 5.91 1.15 -20.08 -20.66*
P .342 .098 .124 .002 0.000
Egypt 192.91 83.75 22.51 309.83 292.08
Italy 192.41 7 7.41 20.92 329.41 304.91
Mean difference 0.50 6.34 1.59* -19.58* -12.83*
P .874 .077 .035 .002 0.008
Egypt 192.91 83.75 22.51 309.83 292.08
Brazil 196.16 88.58 22.97 334.83 316.33
Mean difference -3.25 -4.83 -.45 -25.00 -24.25*
P .303 .176 .543 .000 0.000
Egypt 192.91 83.75 22.51 309.83 292.08
Ethiopia 176.25 60.12 19.42 271.62 258.05
Mean difference 16.66* 23.63* 3.09* 38.21* 34.03*
P .000 .000 .000 .000 0.000
Iran 198.33 83.50 21.28 321.66 313.33
Japan 189.91 77.83 21.36 329.91 312.75
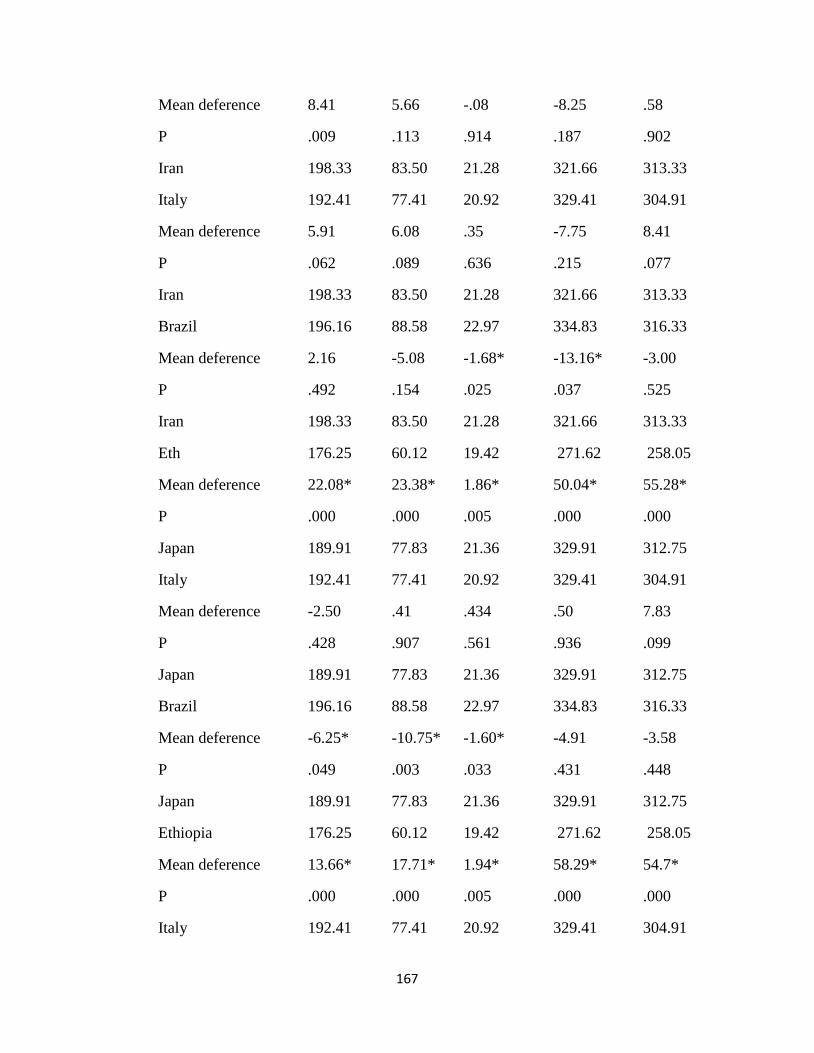
167
Mean deference 8.41 5.66 -.08 -8.25 .58
P .009 .113 .914 .187 .902
Iran 198.33 83.50 21.28 321.66 313.33
Italy 192.41 77.41 20.92 329.41 304.91
Mean deference 5.91 6.08 .35 -7.75 8.41
P .062 .089 .636 .215 .077
Iran 198.33 83.50 21.28 321.66 313.33
Brazil 196.16 88.58 22.97 334.83 316.33
Mean deference 2.16 -5.08 -1.68* -13.16* -3.00
P .492 .154 .025 .037 .525
Iran 198.33 83.50 21.28 321.66 313.33
Eth 176.25 60.12 19.42 271.62 258.05
Mean deference 22.08* 23.38* 1.86* 50.04* 55.28*
P .000 .000 .005 .000 .000
Japan 189.91 77.83 21.36 329.91 312.75
Italy 192.41 77.41 20.92 329.41 304.91
Mean deference -2.50 .41 .434 .50 7.83
P .428 .907 .561 .936 .099
Japan 189.91 77.83 21.36 329.91 312.75
Brazil 196.16 88.58 22.97 334.83 316.33
Mean deference -6.25* -10.75* -1.60* -4.91 -3.58
P .049 .003 .033 .431 .448
Japan 189.91 77.83 21.36 329.91 312.75
Ethiopia 176.25 60.12 19.42 271.62 258.05
Mean deference 13.66* 17.71* 1.94* 58.29* 54.7*
P .000 .000 .005 .000 .000
Italy 192.41 77.41 20.92 329.41 304.91
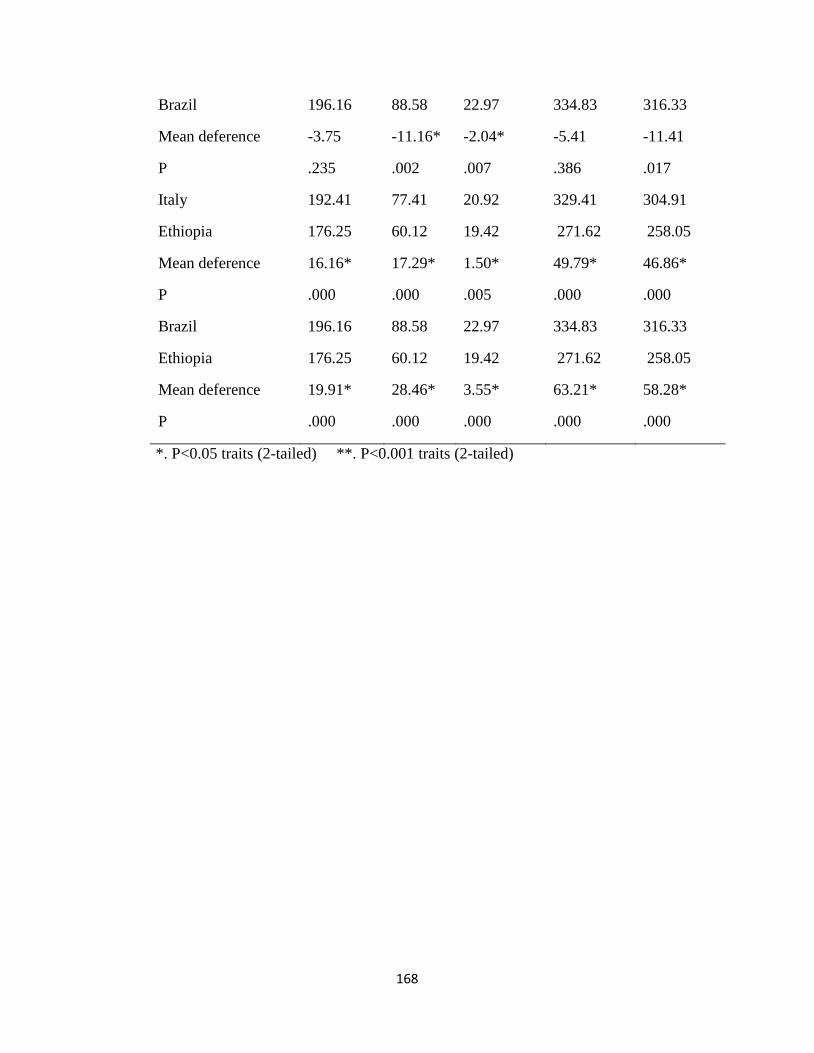
168
Brazil 196.16 88.58 22.97
-2.04*
334.83 316.33
Mean deference -3.75 -11.16* -5.41 -11.41
P .235 .002 .007 .386 .017
Italy 192.41 77.41 20.92 329.41 304.91
Ethiopia 176.25 60.12 19.42 271.62 258.05
Mean deference 16.16* 17.29* 1.50* 49.79* 46.86*
P .000 .000 .005 .000 .000
Brazil 196.16 88.58 22.97 334.83 316.33
Ethiopia 176.25 60.12 19.42 271.62 258.05
Mean deference 19.91* 28.46* 3.55* 63.21* 58.28*
P .000 .000 .000 .000 .000
*. P<0.05 traits (2-tailed) **. P<0.001 traits (2-tailed)
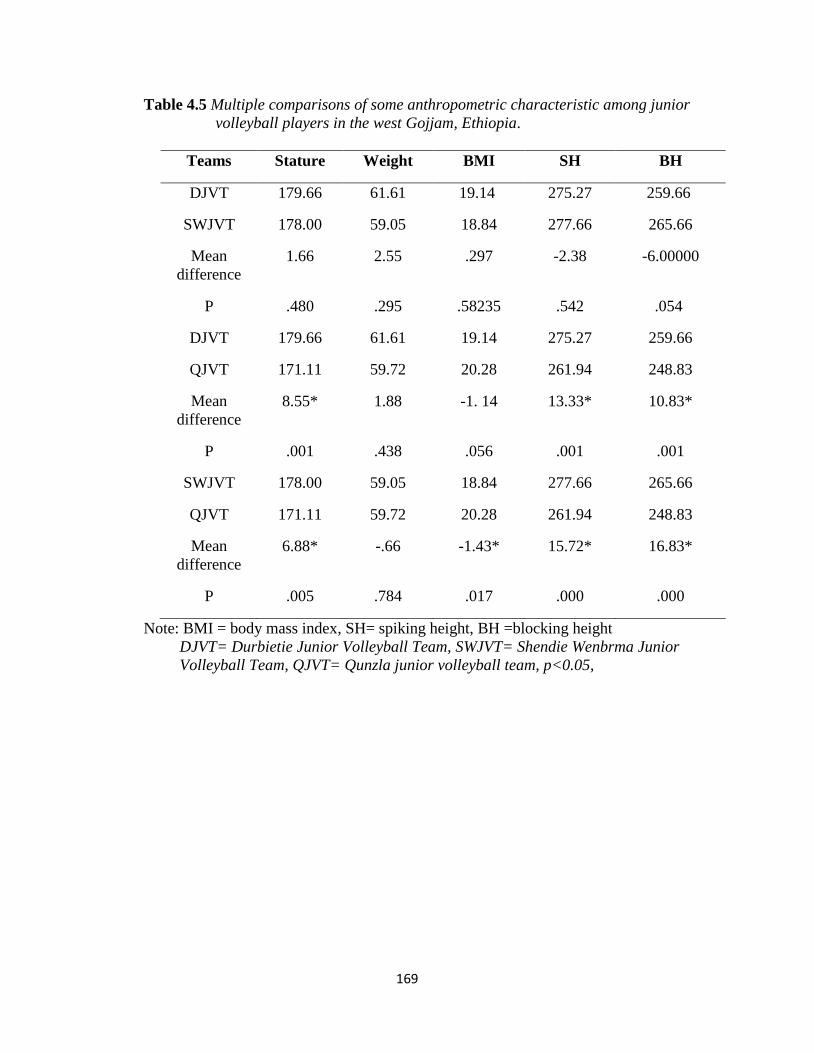
169
Table 4.5 Multiple comparisons of some anthropometric characteristic among junior
volleyball players in the west Gojjam, Ethiopia.
Teams Stature Weight BMI SH BH
DJVT 179.66 61.61 19.14 275.27 259.66
SWJVT 178.00 59.05 18.84 277.66 265.66
Mean
difference
1.66 2.55 .297 -2.38 -6.00000
P .480 .295 .58235 .542 .054
DJVT 179.66 61.61 19.14 275.27 259.66
QJVT 171.11 59.72 20.28 261.94 248.83
Mean
difference
8.55* 1.88 -1. 14 13.33* 10.83*
P .001 .438 .056 .001 .001
SWJVT 178.00 59.05 18.84 277.66 265.66
QJVT 171.11 59.72 20.28 261.94 248.83
Mean
difference
6.88* -.66 -1.43* 15.72* 16.83*
P .005 .784 .017 .000 .000
Note: BMI = body mass index, SH= spiking height, BH =blocking height
DJVT= Durbietie Junior Volleyball Team, SWJVT= Shendie Wenbrma Junior
Volleyball Team, QJVT= Qunzla junior volleyball team, p<0.05,
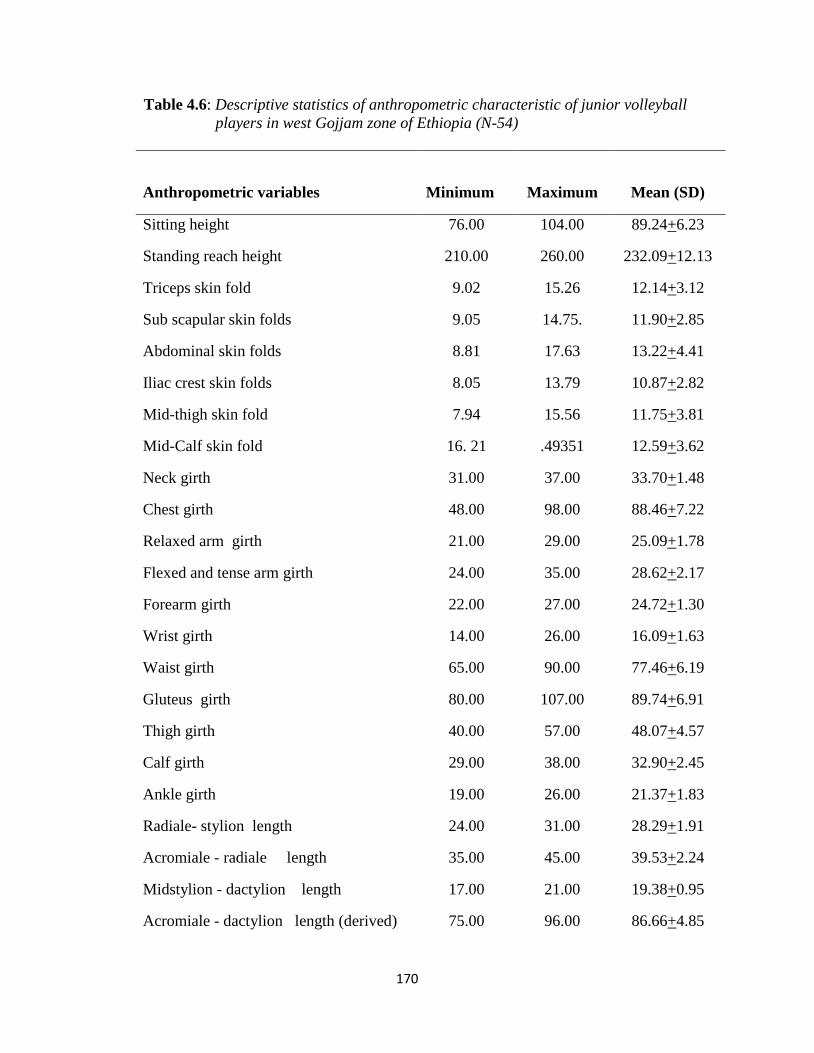
170
Table 4.6: Descriptive statistics of anthropometric characteristic of junior volleyball
players in west Gojjam zone of Ethiopia (N-54)
Anthropometric variables Minimum Maximum
Mean (SD)
Sitting height 76.00 104.00 89.24+6.23
Standing reach height 210.00 260.00 232.09+12.13
Triceps skin fold 9.02 15.26 12.14+3.12
Sub scapular skin folds 9.05 14.75. 11.90+2.85
Abdominal skin folds 8.81 17.63 13.22+4.41
Iliac crest skin folds 8.05 13.79 10.87+2.82
Mid-thigh skin fold 7.94 15.56 11.75+3.81
Mid-Calf skin fold 16. 21 .49351 12.59+3.62
Neck girth 31.00 37.00 33.70+1.48
Chest girth 48.00 98.00 88.46+7.22
Relaxed arm girth 21.00 29.00 25.09+1.78
Flexed and tense arm girth 24.00 35.00 28.62+2.17
Forearm girth 22.00 27.00 24.72+1.30
Wrist girth 14.00 26.00 16.09+1.63
Waist girth 65.00 90.00 77.46+6.19
Gluteus girth 80.00 107.00 89.74+6.91
Thigh girth 40.00 57.00 48.07+4.57
Calf girth 29.00 38.00 32.90+2.45
Ankle girth 19.00 26.00 21.37+1.83
Radiale- stylion length 24.00 31.00 28.29+1.91
Acromiale - radiale length 35.00 45.00 39.53+2.24
Midstylion - dactylion length 17.00 21.00 19.38+0.95
Acromiale - dactylion length (derived) 75.00 96.00 86.66+4.85
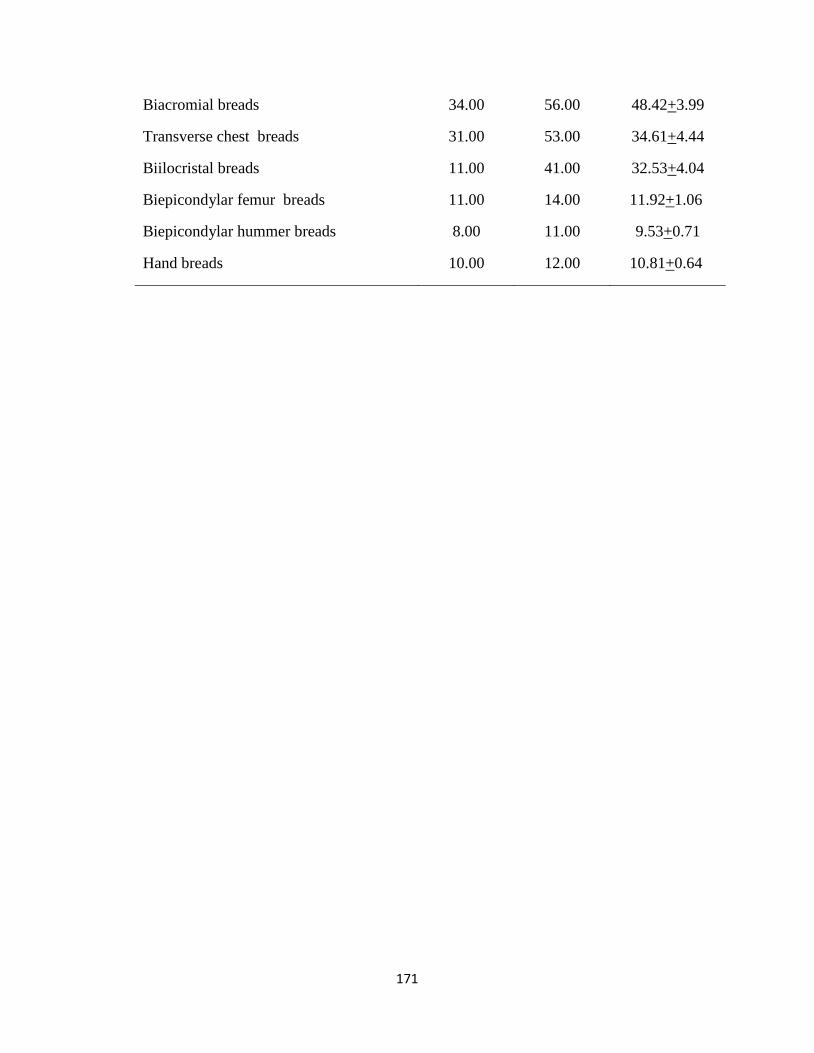
171
Biacromial breads 34.00 56.00 48.42+3.99
Transverse chest breads 31.00 53.00 34.61+4.44
Biilocristal breads 11.00 41.00 32.53+4.04
Biepicondylar femur breads 11.00 14.00 11.92+1.06
Biepicondylar hummer breads 8.00 11.00 9.53+0.71
Hand breads 10.00 12.00 10.81+0.64
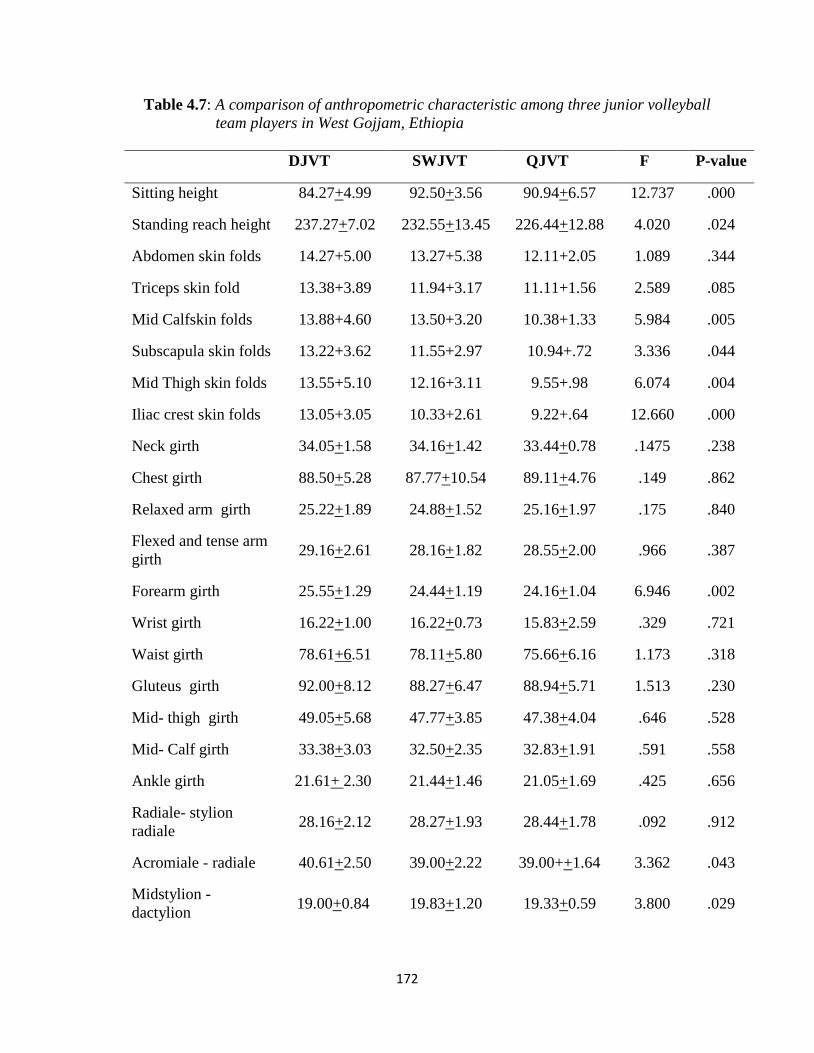
172
Table 4.7: A comparison of anthropometric characteristic among three junior volleyball
team players in West Gojjam, Ethiopia
DJVT SWJVT QJVT F P-value
Sitting height 84.27+4.99 92.50+3.56 90.94+6.57 12.737 .000
Standing reach height 237.27+7.02 232.55+13.45 226.44+12.88 4.020 .024
Abdomen skin folds 14.27+5.00 13.27+5.38 12.11+2.05 1.089 .344
Triceps skin fold 13.38+3.89 11.94+3.17 11.11+1.56 2.589 .085
Mid Calfskin folds 13.88+4.60 13.50+3.20 10.38+1.33 5.984 .005
Subscapula skin folds 13.22+3.62 11.55+2.97 10.94+.72 3.336 .044
Mid Thigh skin folds 13.55+5.10 12.16+3.11 9.55+.98 6.074 .004
Iliac crest skin folds 13.05+3.05 10.33+2.61 9.22+.64 12.660 .000
Neck girth 34.05+1.58 34.16+1.42 33.44+0.78 .1475 .238
Chest girth 88.50+5.28 87.77+10.54 89.11+4.76 .149 .862
Relaxed arm girth 25.22+1.89 24.88+1.52 25.16+1.97 .175 .840
Flexed and tense arm
girth 29.16+2.61 28.16+1.82 28.55+2.00 .966 .387
Forearm girth 25.55+1.29 24.44+1.19 24.16+1.04 6.946 .002
Wrist girth 16.22+1.00 16.22+0.73 15.83+2.59 .329 .721
Waist girth 78.61+6.51 78.11+5.80 75.66+6.16 1.173 .318
Gluteus girth 92.00+8.12 88.27+6.47 88.94+5.71 1.513 .230
Mid- thigh girth 49.05+5.68 47.77+3.85 47.38+4.04 .646 .528
Mid- Calf girth 33.38+3.03 32.50+2.35 32.83+1.91 .591 .558
Ankle girth 21.61+ 2.30 21.44+1.46 21.05+1.69 .425 .656
Radiale- stylion
radiale 28.16+2.12 28.27+1.93 28.44+1.78 .092 .912
Acromiale - radiale 40.61+2.50 39.00+2.22 39.00++1.64 3.362 .043
Midstylion -
dactylion 19.00+0.84 19.83+1.20 19.33+0.59 3.800 .029
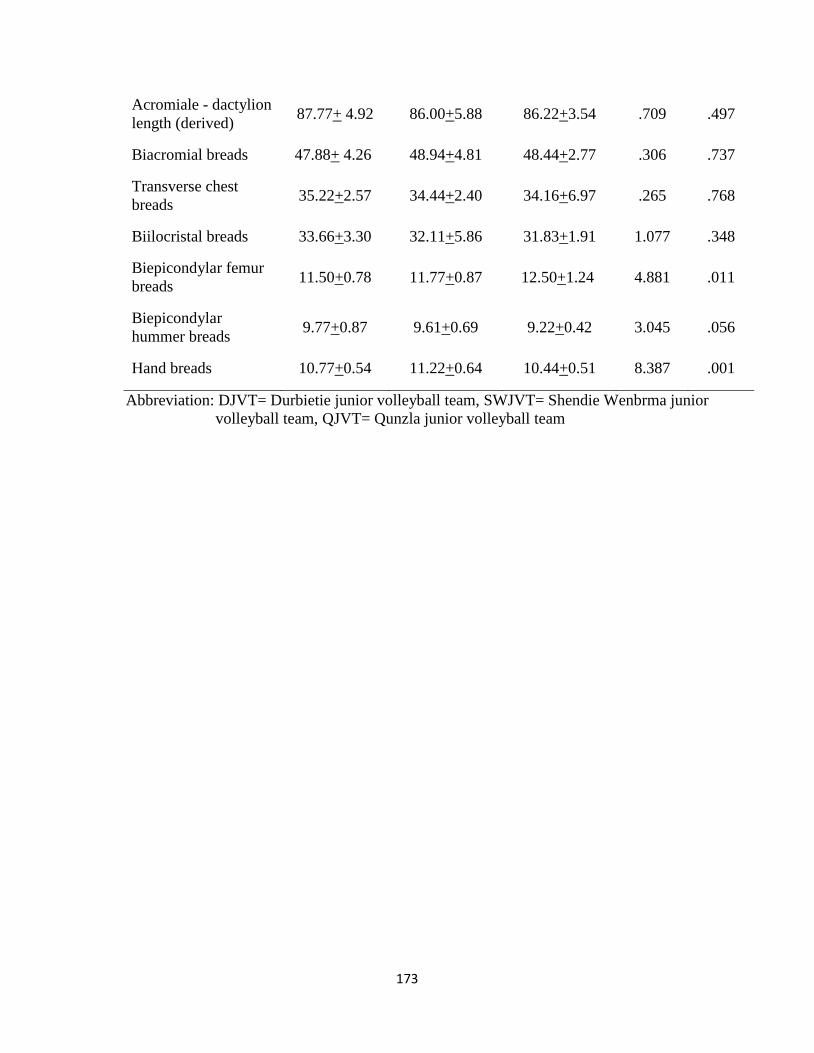
173
Acromiale - dactylion
length (derived) 87.77+ 4.92 86.00+5.88 86.22+3.54 .709 .497
Biacromial breads 47.88+ 4.26 48.94+4.81 48.44+2.77 .306 .737
Transverse chest
breads 35.22+2.57 34.44+2.40 34.16+6.97 .265 .768
Biilocristal breads 33.66+3.30 32.11+5.86 31.83+1.91 1.077 .348
Biepicondylar femur
breads 11.50+0.78 11.77+0.87 12.50+1.24 4.881 .011
Biepicondylar
hummer breads 9.77+0.87 9.61+0.69 9.22+0.42 3.045 .056
Hand breads 10.77+0.54 11.22+0.64 10.44+0.51 8.387 .001
Abbreviation: DJVT= Durbietie junior volleyball team, SWJVT= Shendie Wenbrma junior
volleyball team, QJVT= Qunzla junior volleyball team
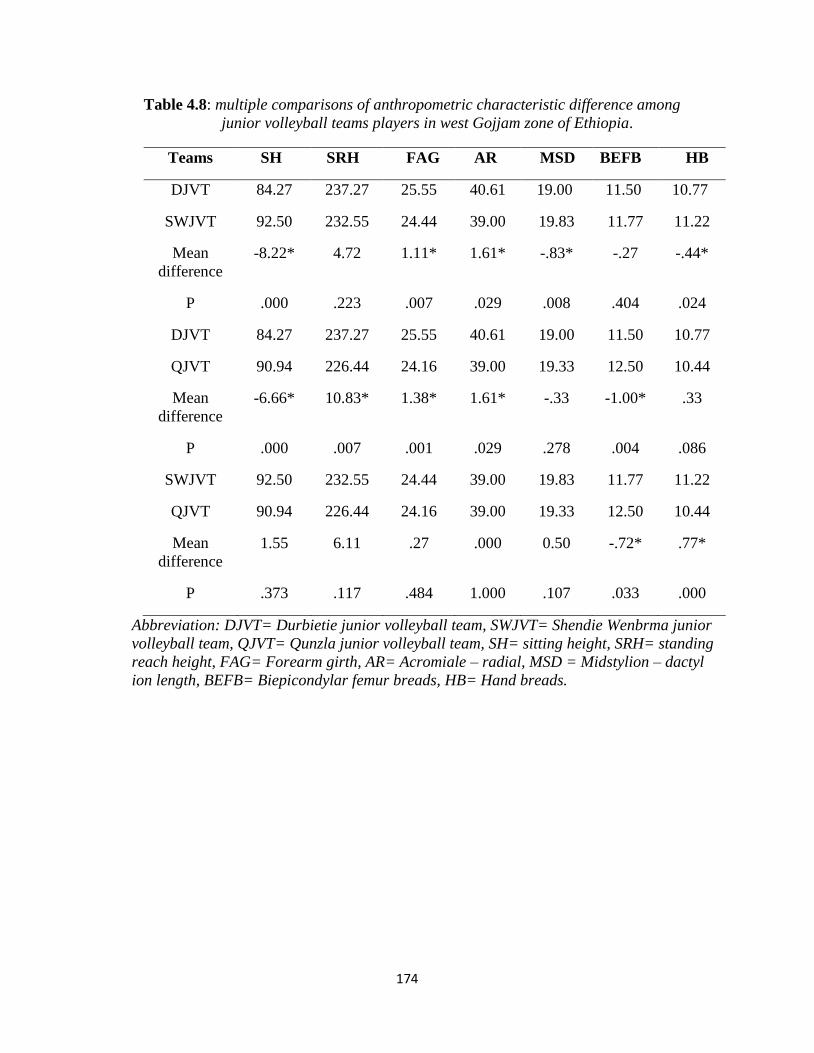
174
Table 4.8: multiple comparisons of anthropometric characteristic difference among
junior volleyball teams players in west Gojjam zone of Ethiopia.
Teams SH SRH FAG AR MSD BEFB HB
DJVT 84.27 237.27 25.55 40.61 19.00 11.50 10.77
SWJVT 92.50 232.55 24.44 39.00 19.83 11.77 11.22
Mean
difference
-8.22* 4.72 1.11* 1.61* -.83* -.27 -.44*
P .000 .223 .007 .029 .008 .404 .024
DJVT 84.27 237.27 25.55 40.61 19.00 11.50 10.77
QJVT 90.94 226.44 24.16 39.00 19.33 12.50 10.44
Mean
difference
-6.66* 10.83* 1.38* 1.61* -.33 -1.00* .33
P .000 .007 .001 .029 .278 .004 .086
SWJVT 92.50 232.55 24.44 39.00 19.83 11.77 11.22
QJVT 90.94 226.44 24.16 39.00 19.33 12.50 10.44
Mean
difference
1.55 6.11 .27 .000 0.50 -.72* .77*
P .373 .117 .484 1.000 .107 .033 .000
Abbreviation: DJVT= Durbietie junior volleyball team, SWJVT= Shendie Wenbrma junior
volleyball team, QJVT= Qunzla junior volleyball team, SH= sitting height, SRH= standing
reach height, FAG= Forearm girth, AR= Acromiale – radial, MSD = Midstylion – dactyl
ion length, BEFB= Biepicondylar femur breads, HB= Hand breads.
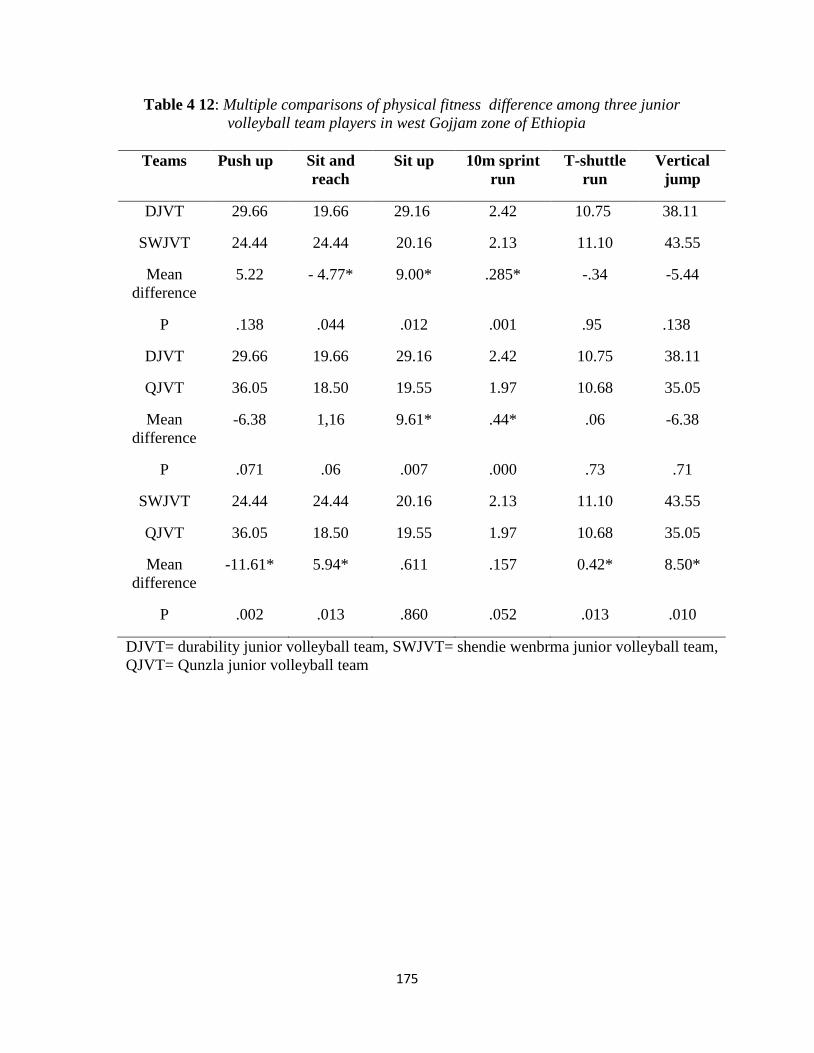
175
Table 4 12: Multiple comparisons of physical fitness difference among three junior
volleyball team players in west Gojjam zone of Ethiopia
Teams Push up Sit and
reach
Sit up 10m sprint
run
T-shuttle
run
Vertical
jump
DJVT 29.66 19.66 29.16 2.42 10.75 38.11
SWJVT 24.44 24.44 20.16 2.13 11.10 43.55
Mean
difference
5.22 - 4.77* 9.00* .285* -.34 -5.44
P .138 .044 .012 .001 .95 .138
DJVT 29.66 19.66 29.16 2.42 10.75 38.11
QJVT 36.05 18.50 19.55 1.97 10.68 35.05
Mean
difference
-6.38 1,16 9.61* .44* .06 -6.38
P .071 .06 .007 .000 .73 .71
SWJVT 24.44 24.44 20.16 2.13 11.10 43.55
QJVT 36.05 18.50 19.55 1.97 10.68 35.05
Mean
difference
-11.61* 5.94* .611 .157 0.42* 8.50*
P .002 .013 .860 .052 .013 .010
DJVT= durability junior volleyball team, SWJVT= shendie wenbrma junior volleyball team,
QJVT= Qunzla junior volleyball team
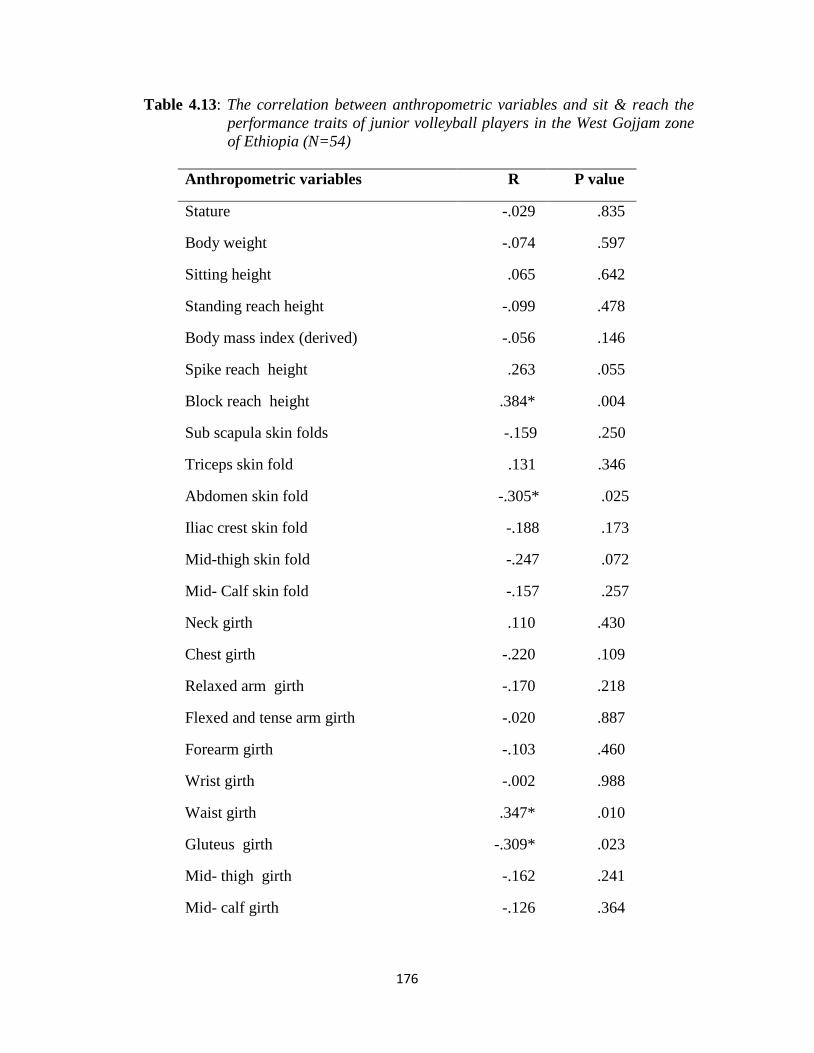
176
Table 4.13: The correlation between anthropometric variables and sit & reach the
performance traits of junior volleyball players in the West Gojjam zone
of Ethiopia (N=54)
Anthropometric variables R P value
Stature -.029 .835
Body weight -.074 .597
Sitting height .065 .642
Standing reach height -.099 .478
Body mass index (derived) -.056 .146
Spike reach height .263 .055
Block reach height .384* .004
Sub scapula skin folds -.159 .250
Triceps skin fold .131 .346
Abdomen skin fold -.305* .025
Iliac crest skin fold -.188 .173
Mid-thigh skin fold -.247 .072
Mid- Calf skin fold -.157 .257
Neck girth .110 .430
Chest girth -.220 .109
Relaxed arm girth -.170 .218
Flexed and tense arm girth -.020 .887
Forearm girth -.103 .460
Wrist girth -.002 .988
Waist girth .347* .010
Gluteus girth -.309* .023
Mid- thigh girth -.162 .241
Mid- calf girth -.126 .364
177
Ankle girth -.191 .166
Radial- styling radial -.096 .491
Acromiale - radial -.095 .495
Midstylion - dactylion .188 .173
Acromiale - dactylion length (derived) -.036 .796
Biacromial -.109 .433
Transverse chest -.099 .477
Biilocristal -.241 .079
Biepicondylar femur -.265 .053
Biepicondylar hummers -.138 .321
Hand .247 .071
*Correlation is significant at o.o5 traits (2 tailed),
**Correlation is highly significant at o.o5 traits (2 tailed),
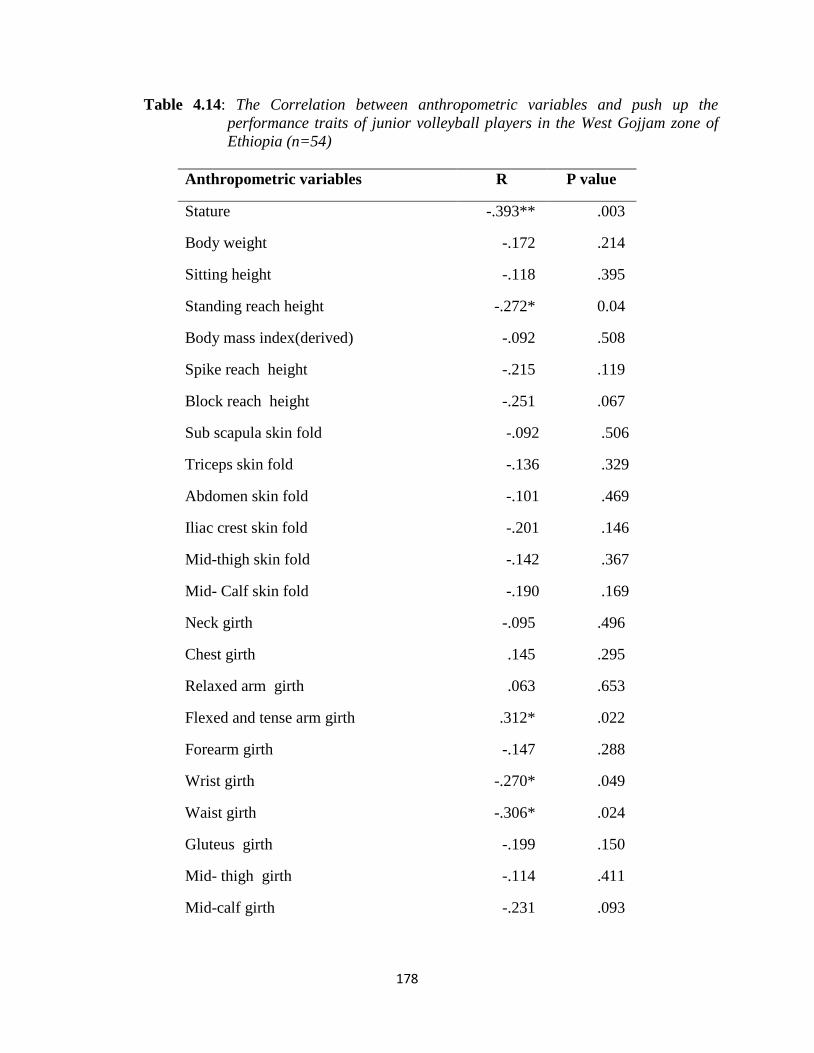
178
Table 4.14: The Correlation between anthropometric variables and push up the
performance traits of junior volleyball players in the West Gojjam zone of
Ethiopia (n=54)
Anthropometric variables R P value
Stature -.393** .003
Body weight -.172 .214
Sitting height -.118 .395
Standing reach height -.272* 0.04
Body mass index(derived) -.092 .508
Spike reach height -.215 .119
Block reach height -.251 .067
Sub scapula skin fold -.092 .506
Triceps skin fold -.136 .329
Abdomen skin fold -.101 .469
Iliac crest skin fold -.201 .146
Mid-thigh skin fold -.142 .367
Mid- Calf skin fold -.190 .169
Neck girth -.095 .496
Chest girth .145 .295
Relaxed arm girth .063 .653
Flexed and tense arm girth .312* .022
Forearm girth -.147 .288
Wrist girth -.270* .049
Waist girth -.306* .024
Gluteus girth -.199 .150
Mid- thigh girth -.114 .411
Mid-calf girth -.231 .093
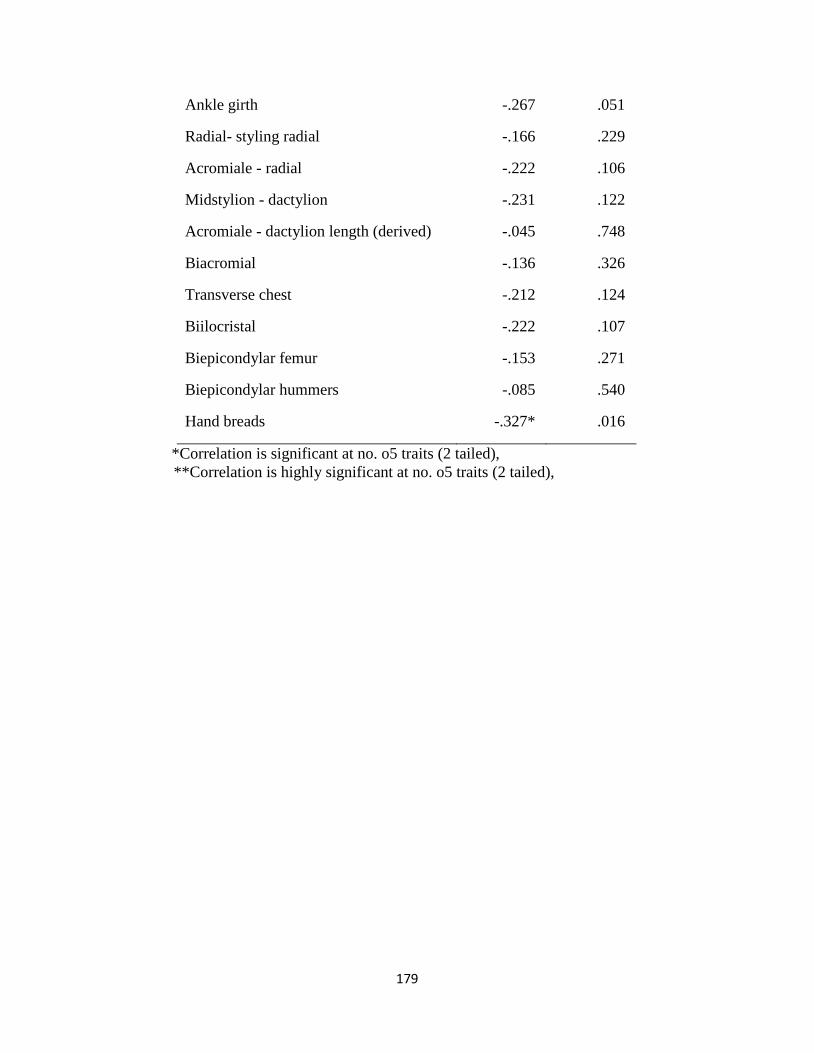
179
Ankle girth -.267 .051
Radial- styling radial -.166 .229
Acromiale - radial -.222 .106
Midstylion - dactylion -.231 .122
Acromiale - dactylion length (derived) -.045 .748
Biacromial -.136 .326
Transverse chest -.212 .124
Biilocristal -.222 .107
Biepicondylar femur -.153 .271
Biepicondylar hummers -.085 .540
Hand breads -.327* .016
*Correlation is significant at no. o5 traits (2 tailed),
**Correlation is highly significant at no. o5 traits (2 tailed),
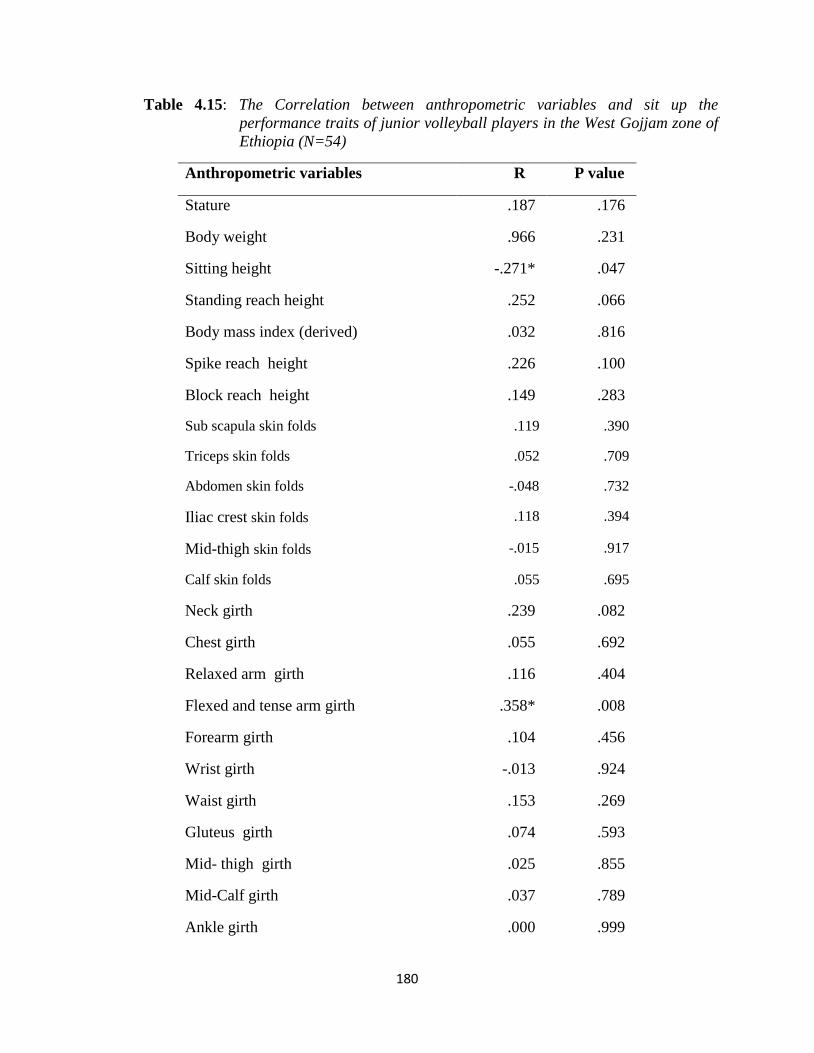
180
Table 4.15: The Correlation between anthropometric variables and sit up the
performance traits of junior volleyball players in the West Gojjam zone of
Ethiopia (N=54)
Anthropometric variables R P value
Stature .187 .176
Body weight .966 .231
Sitting height -.271* .047
Standing reach height .252 .066
Body mass index (derived) .032 .816
Spike reach height .226 .100
Block reach height .149 .283
Sub scapula skin folds .119 .390
Triceps skin folds .052 .709
Abdomen skin folds -.048 .732
Iliac crest skin folds .118 .394
Mid-thigh skin folds -.015 .917
Calf skin folds .055 .695
Neck girth .239 .082
Chest girth .055 .692
Relaxed arm girth .116 .404
Flexed and tense arm girth .358* .008
Forearm girth .104 .456
Wrist girth -.013 .924
Waist girth .153 .269
Gluteus girth .074 .593
Mid- thigh girth .025 .855
Mid-Calf girth .037 .789
Ankle girth .000 .999
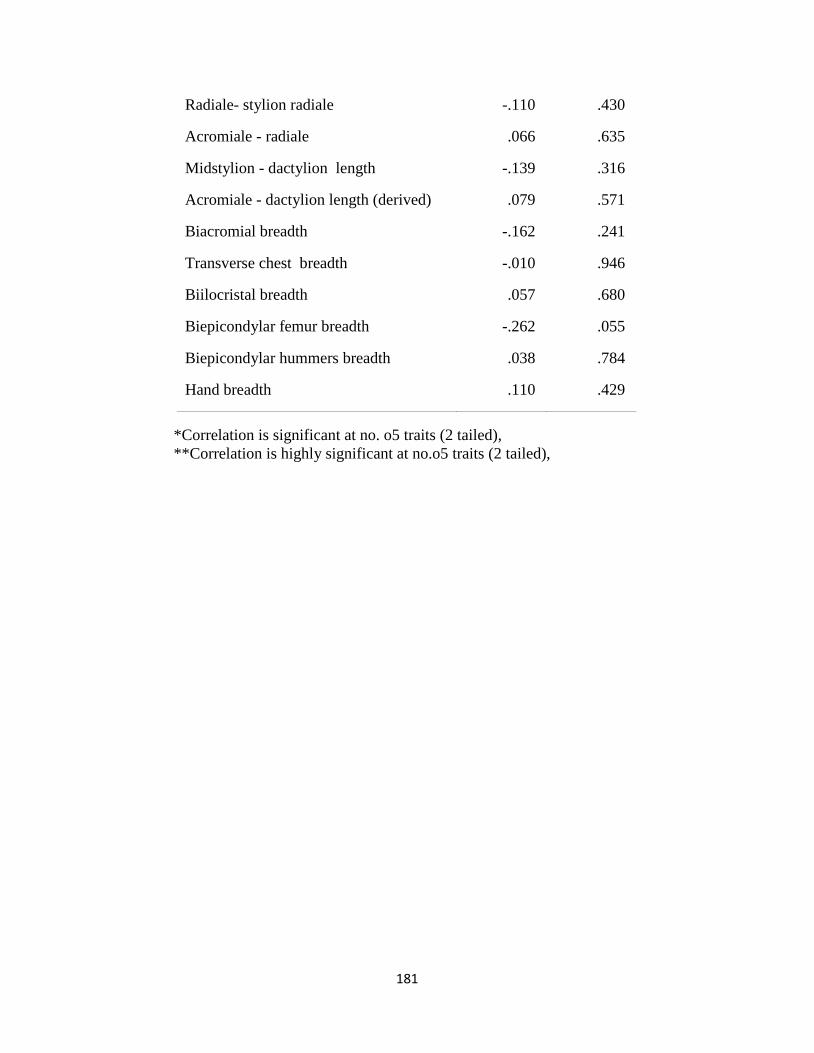
181
*Correlation is significant at no. o5 traits (2 tailed),
**Correlation is highly significant at no.o5 traits (2 tailed),
Radiale- stylion radiale -.110 .430
Acromiale - radiale .066 .635
Midstylion - dactylion length -.139 .316
Acromiale - dactylion length (derived) .079 .571
Biacromial breadth -.162 .241
Transverse chest breadth -.010 .946
Biilocristal breadth .057 .680
Biepicondylar femur breadth -.262 .055
Biepicondylar hummers breadth .038 .784
Hand breadth .110 .429
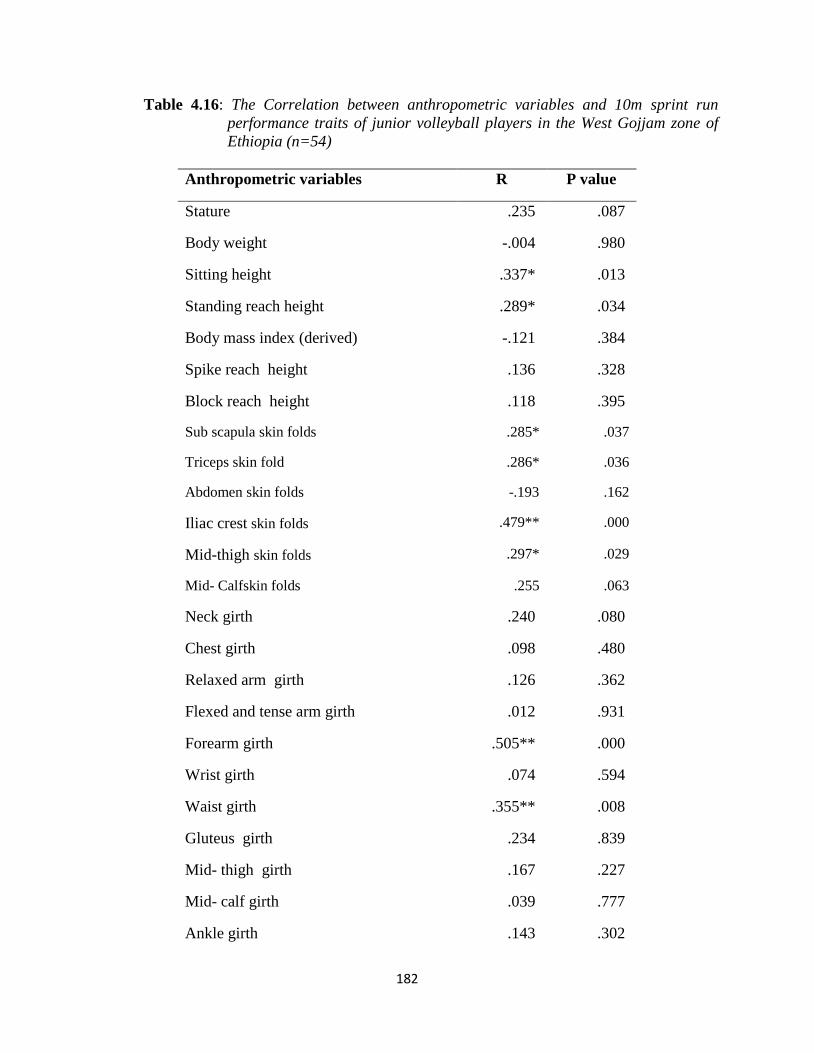
182
Table 4.16: The Correlation between anthropometric variables and 10m sprint run
performance traits of junior volleyball players in the West Gojjam zone of
Ethiopia (n=54)
Anthropometric variables R P value
Stature .235 .087
Body weight -.004 .980
Sitting height .337* .013
Standing reach height .289* .034
Body mass index (derived) -.121 .384
Spike reach height .136 .328
Block reach height .118 .395
Sub scapula skin folds .285* .037
Triceps skin fold .286* .036
Abdomen skin folds -.193 .162
Iliac crest skin folds .479** .000
Mid-thigh skin folds .297* .029
Mid- Calfskin folds .255 .063
Neck girth .240 .080
Chest girth .098 .480
Relaxed arm girth .126 .362
Flexed and tense arm girth .012 .931
Forearm girth .505** .000
Wrist girth .074 .594
Waist girth .355** .008
Gluteus girth .234 .839
Mid- thigh girth .167 .227
Mid- calf girth .039 .777
Ankle girth .143 .302
183
Radial- styling radial .007 .958
Acromiale - radial .242 .077
Midstylion - dactylion .059 .671
Acromiale - dactylion length (derived) .094 .500
Biacromial .003 .980
Transverse chest .079 .571
Biilocristal .223 .106
Biepicondylar femur -.088 .525
Biepicondylar hummers .352** .009
Hand .234 .839
*Correlation is significant at no. o5 traits (2 tailed),
**Correlation is highly significant at no. o5 traits (2 tailed),
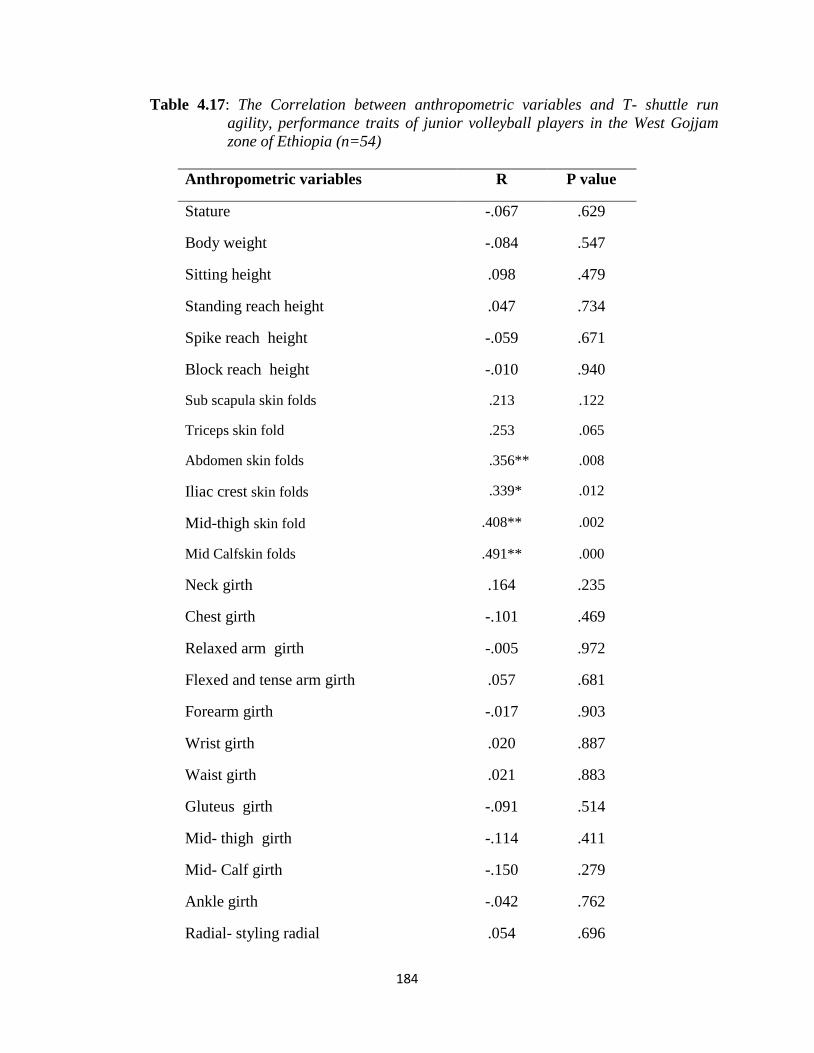
184
Table 4.17: The Correlation between anthropometric variables and T- shuttle run
agility, performance traits of junior volleyball players in the West Gojjam
zone of Ethiopia (n=54)
Anthropometric variables R P value
Stature -.067 .629
Body weight -.084 .547
Sitting height .098 .479
Standing reach height .047 .734
Spike reach height -.059 .671
Block reach height -.010 .940
Sub scapula skin folds .213 .122
Triceps skin fold .253 .065
Abdomen skin folds .356** .008
Iliac crest skin folds .339* .012
Mid-thigh skin fold .408** .002
Mid Calfskin folds .491** .000
Neck girth .164 .235
Chest girth -.101 .469
Relaxed arm girth -.005 .972
Flexed and tense arm girth .057 .681
Forearm girth -.017 .903
Wrist girth .020 .887
Waist girth .021 .883
Gluteus girth -.091 .514
Mid- thigh girth -.114 .411
Mid- Calf girth -.150 .279
Ankle girth -.042 .762
Radial- styling radial .054 .696
185
Acromiale - radial -.019 .889
Midstylion - dactylion -.085 .541
Acromiale - dactylion length (derived) .007 .960
Biacromial -.054 .700
Transverse chest -.037 .789
Biilocristal -.011 .908
Biepicondylar femur -.030 .831
Biepicondylar hummers .064 .644
Hand -.127 .360
*Correlation is significant at no. o5 traits (2 tailed),
**Correlation is highly significant at no.o5 traits (2 tailed),
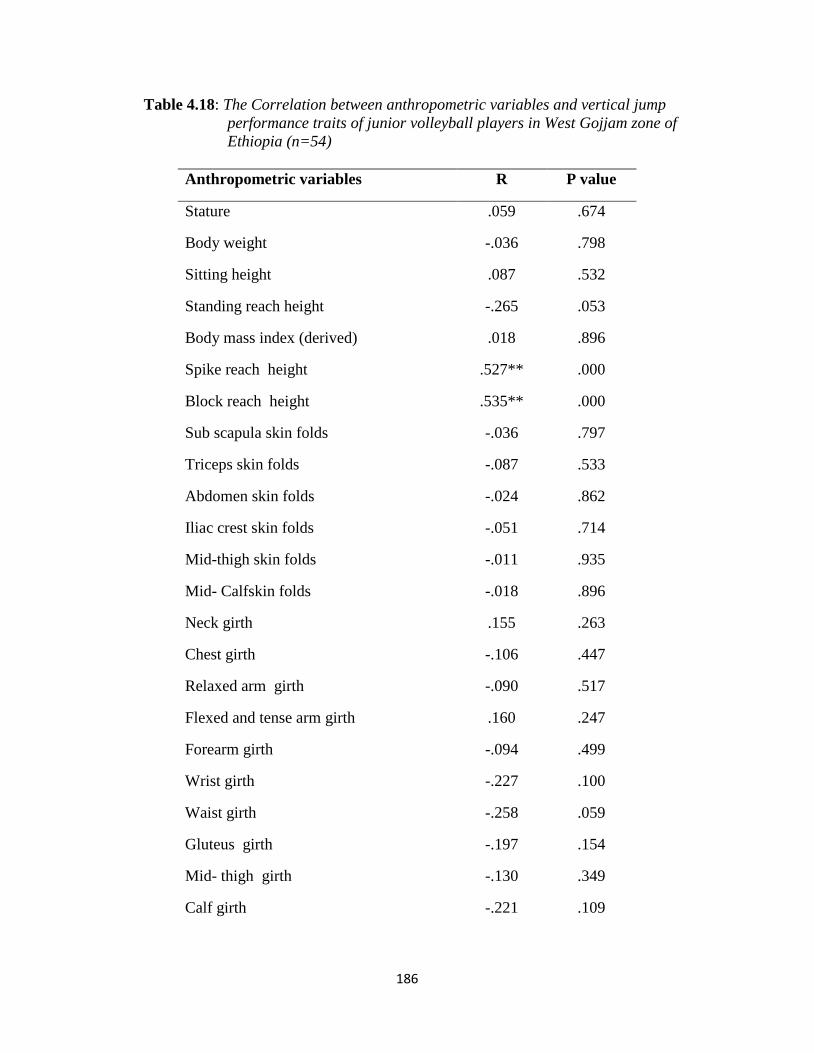
186
Table 4.18: The Correlation between anthropometric variables and vertical jump
performance traits of junior volleyball players in West Gojjam zone of
Ethiopia (n=54)
Anthropometric variables R P value
Stature .059 .674
Body weight -.036 .798
Sitting height .087 .532
Standing reach height -.265 .053
Body mass index (derived) .018 .896
Spike reach height .527** .000
Block reach height .535** .000
Sub scapula skin folds -.036 .797
Triceps skin folds -.087 .533
Abdomen skin folds -.024 .862
Iliac crest skin folds -.051 .714
Mid-thigh skin folds -.011 .935
Mid- Calfskin folds -.018 .896
Neck girth .155 .263
Chest girth -.106 .447
Relaxed arm girth -.090 .517
Flexed and tense arm girth .160 .247
Forearm girth -.094 .499
Wrist girth -.227 .100
Waist girth -.258 .059
Gluteus girth -.197 .154
Mid- thigh girth -.130 .349
Calf girth -.221 .109
187
Ankle girth -.131 .344
Radial- styling radial .079 .571
Acromiale - radial -.074 .595
Midstylion - dactylion .127 .359
Acromiale - dactylion length (derived) .126 .365
Biacromial -.040 .774
Transverse chest .023 .870
Biilocristal -.191 .166
Biepicondylar femur ,029 .832
Biepicondylar hummers -.032 .817
Hand .111 .425
**Correlation is highly significant at no. o5 traits (2 tailed)
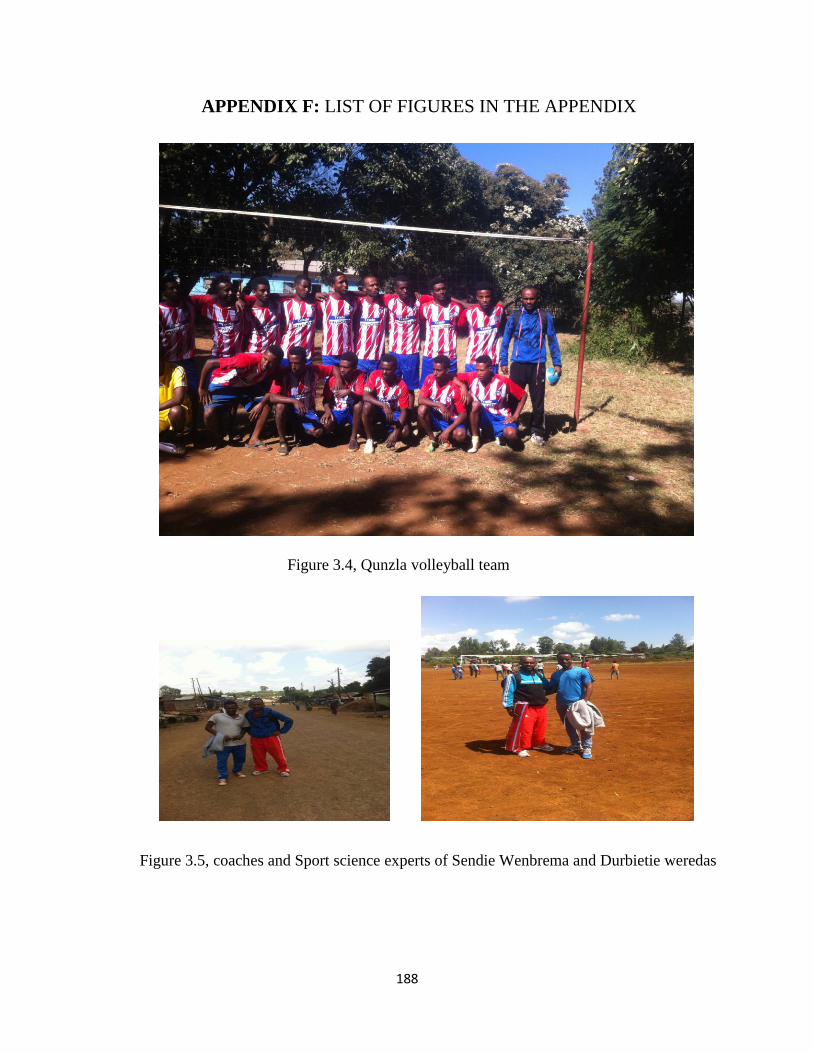
188
APPENDIX F: LIST OF FIGURES IN THE APPENDIX
Figure 3.4, Qunzla volleyball team
Figure 3.5, coaches and Sport science experts of Sendie Wenbrema and Durbietie weredas
Related Documents