VNU Journal of Economics and Business, Vol. 1, No. 4 (2021) 45-54 45 Original Article The Relation between Information Asymmetry and Firm Value: Empirical Evidence from Vietnamese Listed Firms Nguyen Hoang Thai, Do Ngoc Phuong, Nguyen Thi Hong VNU University of Economics and Business, 144 Xuan Thuy Street, Cau Giay District, Hanoi, Vietnam Received 16 July 2021 Revised 9 November 2021; Accepted 25 December 2021 Abstract: Managers normally have an advantage over the market in predicting firm-specific events. This creates information asymmetry between managers of the firm and the market. The purpose of this paper is to investigate the relationship between firm value and information asymmetry in Vietnam. Our data include 202 non-financial companies with 606 firm-year observations collected from the two main stock exchange markets in Vietnam including Hanoi Stock Exchange and Ho Chi Minh Stock Exchange, covering 3 years from 2017-2019. The finding of this study indicates that two variables measuring information asymmetry (ASYDISP, ASYDUM) negatively impact firm value. Besides, control variables such as return on assets, leverage, firm size, and intangible assets are found to have significant effects on firm value. Keywords: Information asymmetry, firm value, Vietnamese listed firms. 1. Introduction * To investigate the influent factors affecting firm value, several studies were conducted in terms of corporate governance characteristics [1], capital structure [2], liquidity [3] and dividend policy [4], but so far appropriate proxies to measure the relationship between firm value and information asymmetry have not been found yet. According to principal-agency problems, insiders (i.e.: managers, employees) ________ * Corresponding author E-mail address: [email protected] https://doi.org/10.25073/2588-1108/vnueab.4647 usually possess more information about a company's performance and strategy than outsiders (i.e. investors, stockholders). This indicates the information held by insiders and outsiders of a company is asymmetric. Based on the research of Beyers et al. [5] managers are constantly in a trade-off about what information will be disclosed by the company. As a result, conflicts between managers and shareholders have a significant impact on the company’s investment decisions and capital cost and VNU Journal of Economics and Business Journal homepage: https://js.vnu.edu.vn/EAB

Welcome message from author
This document is posted to help you gain knowledge. Please leave a comment to let me know what you think about it! Share it to your friends and learn new things together.
Transcript
VNU Journal of Economics and Business, Vol. 1, No. 4 (2021) 45-54
45
Original Article
The Relation between Information Asymmetry and Firm
Value: Empirical Evidence from Vietnamese Listed Firms
Nguyen Hoang Thai, Do Ngoc Phuong, Nguyen Thi Hong
VNU University of Economics and Business, 144 Xuan Thuy Street, Cau Giay District, Hanoi, Vietnam
Received 16 July 2021
Revised 9 November 2021; Accepted 25 December 2021
Abstract: Managers normally have an advantage over the market in predicting firm-specific events.
This creates information asymmetry between managers of the firm and the market. The purpose of
this paper is to investigate the relationship between firm value and information asymmetry in
Vietnam. Our data include 202 non-financial companies with 606 firm-year observations collected
from the two main stock exchange markets in Vietnam including Hanoi Stock Exchange and Ho Chi
Minh Stock Exchange, covering 3 years from 2017-2019. The finding of this study indicates that
two variables measuring information asymmetry (ASYDISP, ASYDUM) negatively impact firm
value. Besides, control variables such as return on assets, leverage, firm size, and intangible assets
are found to have significant effects on firm value.
Keywords: Information asymmetry, firm value, Vietnamese listed firms.
1. Introduction*
To investigate the influent factors affecting
firm value, several studies were conducted in
terms of corporate governance characteristics
[1], capital structure [2], liquidity [3] and
dividend policy [4], but so far appropriate
proxies to measure the relationship between firm
value and information asymmetry have not been
found yet. According to principal-agency
problems, insiders (i.e.: managers, employees)
________ * Corresponding author
E-mail address: [email protected]
https://doi.org/10.25073/2588-1108/vnueab.4647
usually possess more information about a
company's performance and strategy than
outsiders (i.e. investors, stockholders). This
indicates the information held by insiders and
outsiders of a company is asymmetric. Based on
the research of Beyers et al. [5] managers are
constantly in a trade-off about what information
will be disclosed by the company. As a result,
conflicts between managers and shareholders
have a significant impact on the company’s
investment decisions and capital cost and
VNU Journal of Economics and Business
Journal homepage: https://js.vnu.edu.vn/EAB
N. H. Thai et al. / VNU Journal of Economics and Business, Vol. 1, No. 4 (2021) 45-54 46
negatively affect firm value. Under those
circumstances, information asymmetry has
received much attention in modern literature,
and this paper aims to investigate the
relationship between information asymmetry
and firm value in the context of Vietnamese
listed firms.
The role of information asymmetry has
become one of the basic tenets of firm value.
Managers normally have an advantage over the
market in predicting firm specific events, which
creates information asymmetry between the firm
management and the market. Ross [6], Myers
and Majluf [7] introduced information
asymmetry models that predict firm value based
on the changes in capital structure. In particular,
assuming that all other things are equal, the
announcement of a new equity issue releasing
negative information about the firm will create a
drop in the market value of the firm. There is
some empirical evidence that supports theories
of information asymmetry; for example, the
study of Sadok et al. [8] indicated that stock price
decreases approximately 3 percent after the
announcement of a new equity issue. In addition,
several studies investigated the influence factors
affecting the drop in firm value and have found
that the value of the firm depends on the financing
decision as to whether to issue more equity capital
or to highly rely on debt financing [9].
In Vietnam, although there are several
solutions which have been proposed to enhance
information transparency, their effectiveness is
still relatively low [10]. The main reason is that
businesses have not been motivated to disclose
information. The study of Nguyen [11] was
conducted to investigate whether more
information disclosure helps listed companies in
Vietnam reduce the cost of equity capital and
increase stock value which may create an
incentive for firms to disclose information
transparently. In this vein, Nguyen and Le [12]
also examine the level of asymmetric
information in the market to propose solutions
that limit the level of asymmetry. In general,
most of studies in Vietnam focus on the
association between information asymmetry and
stock value.
Obviously, there are several studies abroad
that investigate the effects of asymmetric
information on firm value. However, few studies
have focused on this issue in the Vietnamese
context. This paper aims to test the relationship
between information asymmetry and firm value
in Vietnam. Our data include 202 non-financial
companies with 606 firm-year observations
covering 3 years from 2017-2019 collected from
Hanoi Stock Exchange and Ho Chi Minh Stock
Exchange. Least squares based on Pooled
Ordinary Least Square (Pooled OLS), Fixed-
Effect Model (FEM), Random-Effect Model
(REM), as well as robustness tests are employed
to analyze data. The finding of this study
indicates that information asymmetry adversely
influences firm value. Besides that, as for firm
value control variables, return on assets,
leverage, firm size, and tangible assets are found
to have significant effects on firm value.
Our study is part of a growing body of
literature emphasizing the role of information
asymmetry in corporate finance research. We
contribute to the finance literature in three main
ways. Firstly, this paper provides evidence of the
association between firm value and information
asymmetry which facilitates (investors’)
awareness, attention, risk-shifting behavior, and
monitoring lapses. Secondly, we prove that
leverage has an adverse effect on firm value and
that this effect is also moderated by asymmetric
information. Finally, the paper provides
evidence of the sensitivity of the firm value and
information asymmetry relationship to growth
opportunities.
The remainder of this paper is organized as
follows. In section 2, we review relevant
literature and develop hypotheses. Section 3
presents the method used in this research. The
conclusion is provided in section 4, followed by
results and discussion. The conclusion is given
in the last sections.
N. H. Thai et al. / VNU Journal of Economics and Business, Vol. 1, No. 4 (2021) 45-54 47
2. Literature review
Information asymmetry was initially
analyzed by Akerlof [13]. According to the
research of Akerlof, buyers possess different
information than sellers do, and high- and low-
quality goods and services can coexist in the
marketplace. Likewise, Leland and Pyle [14]
state that markets are characterized by different
levels of information, and some users exhibit a
higher level of information than others. Because
of information asymmetry, “prices do not
accurately convey all information necessary to
coordinate economic decisions” [15]. As a
result, an increase in the release of relevant
information should benefit average users without
access to private information [14]. More
specially, scholars discriminate between two
types of information asymmetry: moral hazard
and adverse selection.
Besides that, there are some other theories
relating to information asymmetry that have
been developed such as Signaling Theory, and
Peaking Order Theory (POT). According to the
signaling theory, managers often more exactly
understand the quality of their firms than others.
Investors are unable to assess the true value of
firms due to information asymmetry. In such
circumstances, high-value firms usually decide
to undervalue their new capital issuing to signal
their true value. The real value of the firms will
be revealed before the firm undertakes actions
that trigger a fresh valuation after the issuance
event. Likewise, POT suggests that the managers
of a company know more about the actual value
of their firms than outsiders. As such, the cost of
adverse selection arising from information
asymmetry leads to the priority of debt financing
rather than equity financing [7]. According to
POT theory, information asymmetry plays an
important role in many corporate finance
decisions. As information asymmetry occurs,
insiders possess more information about firm
future performance, and outside investors are
unable to accurately assess firm fundamental
quality. To compensate for the higher risk of
information asymmetry, investors usually
require a higher rate of return, therefore firms
that need external financing will face the higher
cost of equity which may adversely affect their
firm value.
Hutton et al. [16] indicated that managers
tend to conceal ‘bad news’ because of career
concerns, job promotion, and option exercise.
When negative news accumulates to a limit that
cannot be concealed, it will erupt in the external
market, and the company’s share price will be
hit. Similarly, previous studies have shown that
the main reason for the risk of a stock price crash
was that managers hide bad news from investors
and markets to realize their interests [17, 18].
Likewise, many scholars have provided
theoretical arguments and empirical evidence to
support POT. For example, the research of
Botosan et al. [19] evaluates the cost of equity
and finds it have a strong connection with firm
value. A study by Ryen, Vasconcellos, and Kish
[20] is considered as the further development of
information asymmetry and its relationship
related to investment decisions as well as firm
valuation.
Therefore, our research suggests that there is
a positive association between information
asymmetry and firm value.
H0: There is no relationship between firm
value and information asymmetry.
H1: There is a significant relationship
between firm value and information asymmetry.
3. Data and research methodology
3.1. Data selection
All data in this paper refer to firms traded on
the Hanoi Stock Exchange and Ho Chi Minh
Stock Exchange between 2017 and 2019. We
obtain specific data from each of the firm’s
annual report. For assurance of data validation,
we apply the following data requirements
informing our samples to exclude abnormal
cases. First, we exclude firms in the utility and
financial industry as their financing policies are
affected by government regulations. Second, we
exclude all firms listed after December 31, 2017,
and firms that are unable to collect necessary
N. H. Thai et al. / VNU Journal of Economics and Business, Vol. 1, No. 4 (2021) 45-54 48
data. Consequently, for the period 2017 to 2019,
our selection procedure results in a sample of
606 firm-year observations, which represent 202
listed companies.
3.2. Variables
3.2.1. Asymmetric information measurements
By referring to the work by Krishnaswami
and Subramaniam [21], Fosu et al. [22], and
Huynh et al. [23], this paper uses the dispersion
of analysts’ forecasts (ASYDISP) and analysts’
forecast error (ASYER) as the leading measures
of information asymmetry to examine its
relationship with firm value.
To compute the dispersion of analysts’
forecasts, we use 1-year consensus forecasts of
the earnings per share (ASYDISP). More
specially, ASYDISP is the standard deviation of
analysts’ forecast about earnings per share (EPS)
of the fiscal year. As our dependent variable (the
firm value) is related to the market value of the
firm, we scale by the median forecast rather than
the stock price to avoid an indigeneity problem.
By adding one and taking the natural logarithm,
our measure converges to a normal distribution.
Therefore, our main proxy for information
asymmetry, denoted as ASYDISP, is:
ASYDISP = ln(1 +𝑆𝑡𝑎𝑛𝑑𝑎𝑟𝑑𝐷𝑒𝑣𝑖𝑎𝑡𝑖𝑜𝑛𝑜𝑓𝐴𝑛𝑎𝑙𝑦𝑠𝑡𝑠′𝐹𝑜𝑟𝑒𝑐𝑎𝑠𝑡𝑠
|𝑀𝑒𝑑𝑖𝑎𝑛𝐹𝑜𝑟𝑒𝑐𝑎𝑠𝑡|)
The second measurement of information
asymmetry in this study is the error of analysts’
forecasts (ASYER). It is calculated by taking
into account the differences between the forecast
of analysts’ earnings per share and the actual
earnings per share for each fiscal year [21-23].
ASYERR = ln(1 +|𝐸𝑃𝑆𝑓𝑜𝑟𝑒𝑐𝑎𝑠𝑡 − 𝐸𝑃𝑆𝑎𝑐𝑡𝑢𝑎𝑙|
|𝑀𝑒𝑑𝑖𝑎𝑛𝐸𝑃𝑆|)
The last measurement of information
asymmetry uses a dummy variable. It is called
ASYDUM. If the dispersion of analysts is larger
than the median forecast, then the value equals 1
and 0 otherwise. According to Fosue et al. [23],
this measurement enables the comparison of
information asymmetry levels between one
company and its peers in the same industry.
3.2.2. Control variables
In this study, we limit our research to a
concise set of control variables that are
correlated with firm value: size, profitability,
leverage, and tangible assets.
Size is measured as the log of the firm’s total
assets. According to the study of Rajan and
Zingales [24], large firms disclose more
information than small firms and they have
lower information asymmetry. Hence, larger
firms tend to finance by issuing capital and
reduce the cost of debt and enhance firm value.
We use profitability (ROA), measured as the
ratio of earnings before interest and taxes (EBIT)
to total assets, to control the influence of
profitability on firm value. The increase in profits
could cease the predictability of future returns and
reduce the impact of information asymmetry on
firm value [23]. Hence, we add profits to our
regression model as a control variable.
Leverage is another key control variable of
our study. Leverage, in this case, is calculated by
taking the book value of debts divided by the
book value of assets. The adoption of book value
is to reduce the potential reverse causation from
firm value to leverage [22, 25].
Similar to Margaritis and Psillaki [26], the
tangibility ratio (TANAS) is measured as the ratio
of fixed assets to total assets. Firms with more
tangible assets should exhibit a higher value for
two reasons: Collaterals retain more of their value
to debtors in case of liquidation, and agency cost of
debt, such as risk shifting, can be reduced.
3.3. Research methodology
In this section, we discuss some main
methods of data analysis that can potentially be
applied to addressing our research questions and
N. H. Thai et al. / VNU Journal of Economics and Business, Vol. 1, No. 4 (2021) 45-54 49
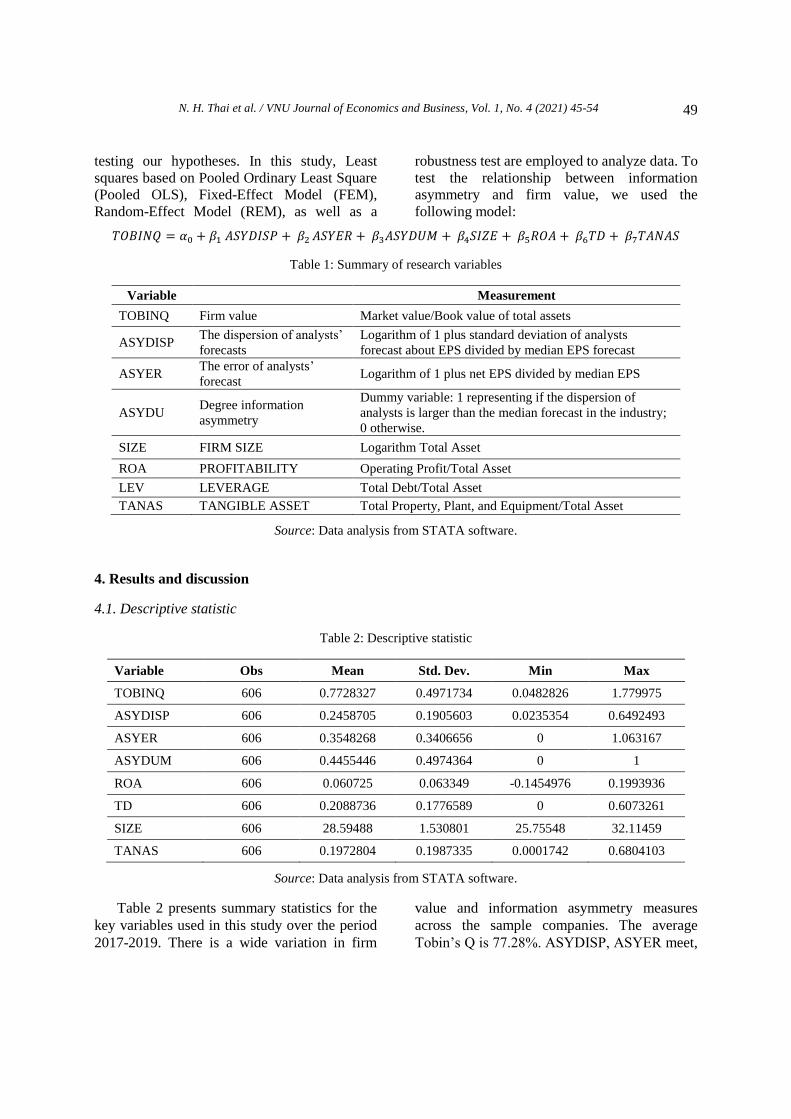
testing our hypotheses. In this study, Least
squares based on Pooled Ordinary Least Square
(Pooled OLS), Fixed-Effect Model (FEM),
Random-Effect Model (REM), as well as a
robustness test are employed to analyze data. To
test the relationship between information
asymmetry and firm value, we used the
following model:
𝑇𝑂𝐵𝐼𝑁𝑄 = 𝛼0 + 𝛽1𝐴𝑆𝑌𝐷𝐼𝑆𝑃 +𝛽2𝐴𝑆𝑌𝐸𝑅 +𝛽3𝐴𝑆𝑌𝐷𝑈𝑀 +𝛽4𝑆𝐼𝑍𝐸 +𝛽5𝑅𝑂𝐴 +𝛽6𝑇𝐷 +𝛽7𝑇𝐴𝑁𝐴𝑆
Table 1: Summary of research variables
Variable Measurement
TOBINQ Firm value Market value/Book value of total assets
ASYDISP The dispersion of analysts’
forecasts
Logarithm of 1 plus standard deviation of analysts
forecast about EPS divided by median EPS forecast
ASYER The error of analysts’
forecast Logarithm of 1 plus net EPS divided by median EPS
ASYDU Degree information
asymmetry
Dummy variable: 1 representing if the dispersion of
analysts is larger than the median forecast in the industry;
0 otherwise.
SIZE FIRM SIZE Logarithm Total Asset
ROA PROFITABILITY Operating Profit/Total Asset
LEV LEVERAGE Total Debt/Total Asset
TANAS TANGIBLE ASSET Total Property, Plant, and Equipment/Total Asset
Source: Data analysis from STATA software.
4. Results and discussion
4.1. Descriptive statistic
Table 2: Descriptive statistic
Variable Obs Mean Std. Dev. Min Max
TOBINQ 606 0.7728327 0.4971734 0.0482826 1.779975
ASYDISP 606 0.2458705 0.1905603 0.0235354 0.6492493
ASYER 606 0.3548268 0.3406656 0 1.063167
ASYDUM 606 0.4455446 0.4974364 0 1
ROA 606 0.060725 0.063349 -0.1454976 0.1993936
TD 606 0.2088736 0.1776589 0 0.6073261
SIZE 606 28.59488 1.530801 25.75548 32.11459
TANAS 606 0.1972804 0.1987335 0.0001742 0.6804103
Source: Data analysis from STATA software.
Table 2 presents summary statistics for the
key variables used in this study over the period
2017-2019. There is a wide variation in firm
value and information asymmetry measures
across the sample companies. The average
Tobin’s Q is 77.28%. ASYDISP, ASYER meet,

N. H. Thai et al. / VNU Journal of Economics and Business, Vol. 1, No. 4 (2021) 45-54 50
on average, 24.58% and 35.48%, respectively.
The average total assets (size) of the sample
firms are 28.59% while ROA is 6.07%. The
mean ratio of total debt is 0.2089, and the
standard deviation is 0.1777. For the intangible
assets held by listed firms, the mean value of the
intangible asset is 0.1973 with a standard
deviation of 0.1987.
4.2. Empirical results
4.2.1. Pearson correlation matrix
Table 3 shows the pair-wise Pearson
correlation matrix for the variables reported in
this study. According to Table 3, none of the
correlations between explanatory variables has
correlation coefficients above 0.602; this
indicates that there are no serious multi-
collinearity problems in this model.
Furthermore, the Variance Inflation Factors
(VIF) for our variables are also far below the
threshold value of 10 [27], suggesting that the
issue of multi-collinearity in models is not a
concern in this particular study.
Table 3: Pearson correlation matrix
TOBINQ ASYDISP ASYER ASYDUM ROA TD FIRMSIZE TANAS VIF 1/VIF
TOBINQ 1
ASYDISP -0.285*** 1 5.91 0.17
ASYER -0.240*** 0.593*** 1 3.31 0.30
ASYDUM 0.0144 0.485*** 0.234*** 1 2.52 0.40
ROA 0.602*** -0.411*** -
0.344*** -0.0158 1 2.64 0.38
TD 0.0566 0.0696 0.00929 0.0182 -
0.234*** 1 3.04 0.33
SIZE 0.203*** -0.0257 -0.112** -0.00476 -0.0158 0.419*** 1 8.66 0.12
TANAS 0.113** 0.0684 -0.0549 -0.0376 -0.0611 0.349*** 0.145*** 1 2.32 0.43
* p < 0.05, **p < 0.01, ***p < 0.001 4.06
Notes: TOBINQ: Tobin’s Q; ASYDISP: Asymmetry Dispersion; ASEYER: Asymmetry Error; ASYDUM:
Asymmetry Dummy; ROA: Return on Asset; TD: Debt Ratio; SIZE: Firm Size; TANAS: Tangible Asset.
Source: Data analysis from STATA software.
Table 4: The results of penal data analysis
Variable Variable definitions Tobin’s Q
Model 1 Model 2
β S.E β S.E
ASYDISP Asymmetry Dispersion -0.201* 0.105
ASYER Asymmetry Error 0.0188 0.0385
ASYDUM Asymmetry Dummy -0.0488* 0.0266
ROA Return on Asset 1.757*** 0.346 1.740*** 0.346
TD Total Debt 0.860*** 0.188 0.842*** 0.189
FIRMSIZE Firm Size -0.266*** 0.0496 -0.257*** 0.0506
TANAS Tangible Assets 0.179 0.221 0.174 0.223
Constant 8.063*** 1.408 7.817*** 1.441
N. H. Thai et al. / VNU Journal of Economics and Business, Vol. 1, No. 4 (2021) 45-54 51
Observations 606 606
Number of Code 202 202
R-squared 0.14 0.148
***p < 0.01, **p < 0.05, *p < 0.1
Source: Data analysis from STATA software.
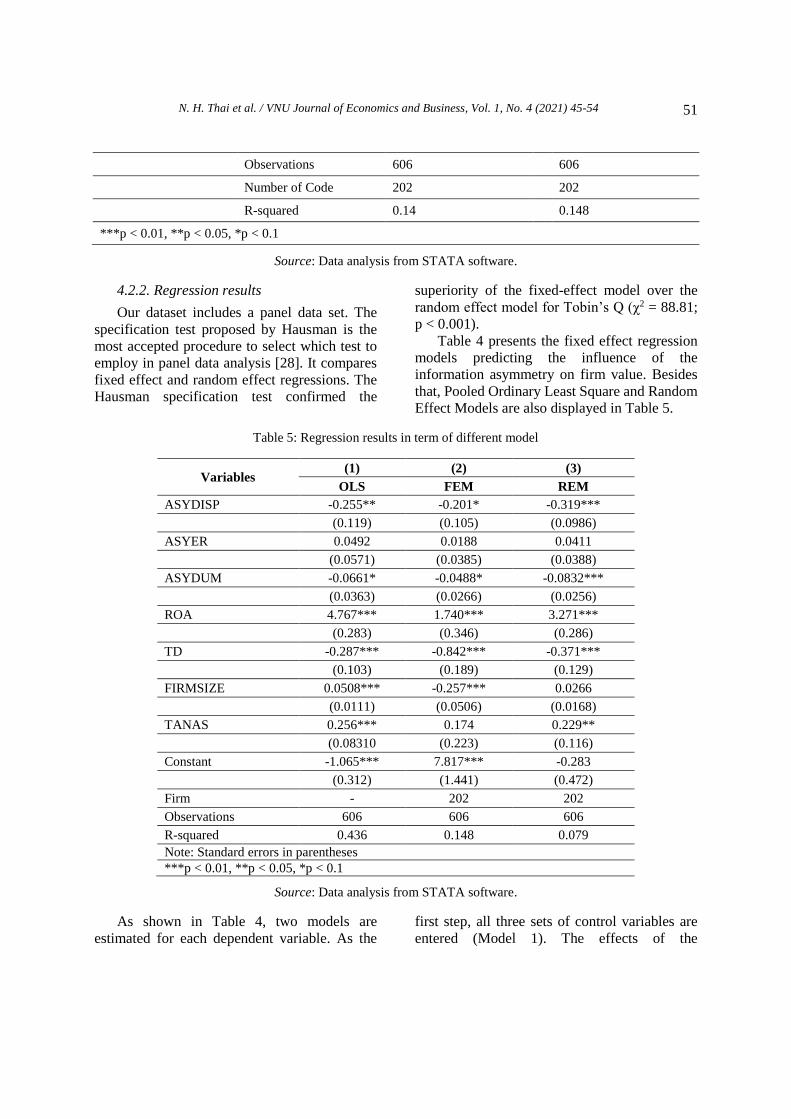
4.2.2. Regression results
Our dataset includes a panel data set. The
specification test proposed by Hausman is the
most accepted procedure to select which test to
employ in panel data analysis [28]. It compares
fixed effect and random effect regressions. The
Hausman specification test confirmed the
superiority of the fixed-effect model over the
random effect model for Tobin’s Q (χ2 = 88.81;
p < 0.001).
Table 4 presents the fixed effect regression
models predicting the influence of the
information asymmetry on firm value. Besides
that, Pooled Ordinary Least Square and Random
Effect Models are also displayed in Table 5.
Table 5: Regression results in term of different model
Variables (1) (2) (3)
OLS FEM REM
ASYDISP -0.255** -0.201* -0.319***
(0.119) (0.105) (0.0986)
ASYER 0.0492 0.0188 0.0411
(0.0571) (0.0385) (0.0388)
ASYDUM -0.0661* -0.0488* -0.0832***
(0.0363) (0.0266) (0.0256)
ROA 4.767*** 1.740*** 3.271***
(0.283) (0.346) (0.286)
TD -0.287*** -0.842*** -0.371***
(0.103) (0.189) (0.129)
FIRMSIZE 0.0508*** -0.257*** 0.0266
(0.0111) (0.0506) (0.0168)
TANAS 0.256*** 0.174 0.229**
(0.08310 (0.223) (0.116)
Constant -1.065*** 7.817*** -0.283
(0.312) (1.441) (0.472)
Firm - 202 202
Observations 606 606 606
R-squared 0.436 0.148 0.079
Note: Standard errors in parentheses
***p < 0.01, **p < 0.05, *p < 0.1
Source: Data analysis from STATA software.
As shown in Table 4, two models are
estimated for each dependent variable. As the
first step, all three sets of control variables are
entered (Model 1). The effects of the
N. H. Thai et al. / VNU Journal of Economics and Business, Vol. 1, No. 4 (2021) 45-54 52
hypothesized variables are then tested in Model
2 where all independent variables along with
control variables are tested, as shown in Table 5.
According to Table 5, two variables
measuring information asymmetry (including
ASYDISP, ASYDUM) negatively affect firm
value. This means that a high level of
information asymmetry adversely impacts firm
value (p < 0.001). These findings are consistent
with the previous studies by Fosu et al. [22] and
Huynh et al. [23].
As for firm control variables, ROA, TD,
SIZE, and TANAS are found to have significant
effects on firm value.
According to the result presented in Table 5,
ROA is found to have a positive and significant
effect on firm value (p < 0.001). In fact, ROA is
used to control for the influence of profitability
on firm value. The increase in profits could cease
the predictability of future returns and reduce the
impact of information asymmetry on firm value.
TD is noted to have a negative and
significant impact on firm value (p < 0.01).
According to the study of Sadok et al. [8], firm
performance is adversely affected by leverage.
In other words, firm value is improved when that
company finances its fund by debt because of
cash flow effects, whereby the higher leverage
firms enable more free cash for more
commitments and covenants.
SIZE is found to have a negative and
significant effect on firm value (p < 0.001). In
other words, smaller firms indicate better market
performance and enhance firm values. Previous
studies have indicated larger firms often face
communication problems; therefore, they are
unable to decide in a timely manner. Smaller
firms are also better equipped to circumnavigate
the law in settings where institutional coverage
is incomplete.
Tangible assets (TANAS) are found to have
a positive and significant effect on firm value (p
< 0.001). Obviously, firms with considerable
tangible assets tend to be able to compensate for
the loss of tangible assets. As a result, the value
of a firm will be improved if it holds a high level
of tangible assets.
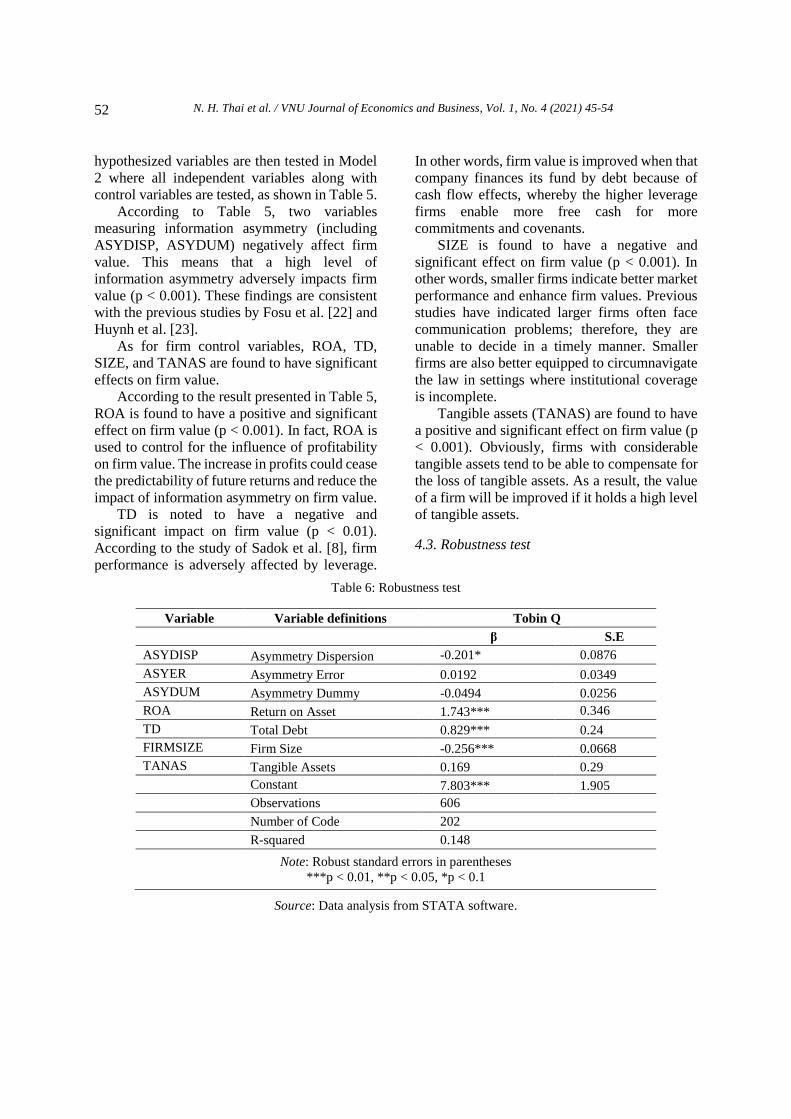
4.3. Robustness test
Table 6: Robustness test
Variable Variable definitions Tobin Q
β S.E
ASYDISP Asymmetry Dispersion -0.201* 0.0876
ASYER Asymmetry Error 0.0192 0.0349
ASYDUM Asymmetry Dummy -0.0494 0.0256
ROA Return on Asset 1.743*** 0.346
TD Total Debt 0.829*** 0.24
FIRMSIZE Firm Size -0.256*** 0.0668
TANAS Tangible Assets 0.169 0.29
Constant 7.803*** 1.905
Observations 606
Number of Code 202
R-squared 0.148
Note: Robust standard errors in parentheses
***p < 0.01, **p < 0.05, *p < 0.1
Source: Data analysis from STATA software.
N. H. Thai et al. / VNU Journal of Economics and Business, Vol. 1, No. 4 (2021) 45-54 53
Although the results presented are robust
across different model specifications, we carry
out some further tests of the robustness of our
results. First, all the continuous variables are
winsorized using a 1% level at both tails to
eliminate potential outliers and all models are re-
estimated. However, the results do not change
qualitatively. Furthermore, to control for any
endogeneity problem, following several studies
[29, 30], values of all independent variables are
replaced with their lagged values treating them
as a potential cause of endogeneity. However,
again, results remain largely unaltered. Since the
correlation between these variables and VIF are
within the acceptable range, we decided to report
them in one model, shown in Table 6.
5. Conclusion
The role of information asymmetry has
become one of the basic tenets of firm value.
Managers normally have an advantage over the
market in predicting firm-specific events. This
creates information asymmetry between
managers of the firm and the market. Previous
studies indicate that many reasons explain why
managers tend to conceal unfavorable news. For
example, they may be concerned about their
future career, compensation, and personal
interest (option exercise). Unfortunately,
managers only conceal the negative news up to a
limit; when the information is publicly available
the firm value will be affected. This study aims
to investigate the relationship between firm
value and information asymmetry in Vietnamese
listed firms.
Our data include 202 non-financial
companies with 606 firm-year observations
covering 3 years from 2017-2019, collecting
from two stock exchange markets in Vietnam
including Hanoi Stock Exchange and Ho Chi
Minh Stock Exchange. After considering several
criteria, our selection procedure results in a
sample of 606 firm-year observations, which
represent 202 listed companies. Besides that,
Pooled Ordinary Least Square (Pooled OLS),
Fixed-Effect Model (FEM), Random-Effect
Model (REM), as well as robustness tests are
employed to analyze data.
The findings of this study indicate that two
variables measuring information asymmetry
(including ASYDISP, ASYDUM) have a
negative effect on firm value. This result
indicates that a higher level of dispersion and a
higher level of error forecast suggest a higher
level of information asymmetry. Besides that, as
for specific control variables of firm value
including ROA, TD, SIZE and TANAS, are
found to have significant effects on firm value.
This study contributes to the literature by
providing more evidence to support the influent
factors affect firm value, especially in the
context of Vietnam. A considerable majority of
studies examine the relationship between
corporate governance and firm value. However,
our study focuses on another determinant of firm
value - we investigate the association between
information asymmetry and firm value. We are
aware, however, of some limitations in our
research paradigm, such as we only use data of
202 listed companies for the period from 2017
to 2019. Future research may focus on
expanding the sample to include firms not
covered by these databases.
References
[1] Brown, L.D., and Marcus L.C., “Corporate
Governance and Firm Valuation,” Journal of
Accounting and Public Policy 25 (4) (2006) 409-434.
[2] Vo Xuan Vinh, and Craig Ellis, “An Empirical
Investigation of Capital Structure and Firm Value
in Vietnam,” Finance Research Letters 22 (2017)
90-94.
[3] Noe, T.H., Vivian W.F., and Sheri T., “Stock
Market Liquidity and Firm Value,” Journal of
Financial Economics 94 (2009) 150-169.
[4] Udochukwu Godfrey Ogbonna, and Chukwu
Agwu Ejem, “Dynamic Modeling of Market Value
and Capital Structure in Nigerian
Firms,” International Journal of Economics and
Financial Issues 10 (1) (2019) 1-5.
[5] Beyer, A., D. A. Cohen, T. Z. Lys, and B. R.
Walther, “The Financial Reporting Environment:
Review of the Recent Literature,” Journal of
Accounting and Economics 50 (2-3) 296-343.
N. H. Thai et al. / VNU Journal of Economics and Business, Vol. 1, No. 4 (2021) 45-54 54
[6] Ross, S., “The Determination of Financial
Structure: The Incentive Signaling Approach,” Bell
Journal of Economics 8 (1977) 1-32.
[7] Myers, S., and N. Majluf, “Corporate Financing
and Investment Decisions When Firms Have
Information That Investors Do Not Have,” Journal
of Financial Economics 13 (1984)187–221.
[8] Sadok El Ghoul, et al,. “Does Information
Asymmetry Matter to Equity Pricing? Evidence
from Firms’ Geographic Location: Does
Information Asymmetry Matter to Equity
Pricing?,” Contemporary Accounting Research 30
(1) (2013) 140-181.
[9] Hughes, J. S., L. Jing, and J. Liu, “Information
Asymmetry, Diversification, and Cost of Capital,”
The Accounting Review 82 (3) (2007) 705-29.
[10] Nguyen, V., N., Tran, T., A. & Phan, G., T, “Level
of Asymmetric Information: Evidence from
Companies Listed on the Ho Chi Minh City Stock
Exchange,” Business and Business Administration
Journal 11(1) (2016).
[11] Nguyen V., D. & Nguyen T., H, “The Impact of
Asymmetric Information on the Cost of Capital of
Vietnamese Listed Companies,” Business and
Development Journal 226 (2016).
[12] Nguyen, T., H & Le, A., K, “The Econometric
Model Determines the Degree of Information
Asymmetry: The Situation of the Ho Chi Minh
Stock Market,” Economics Development Journal
213 (2008).
[13] Akerlof, G. A, “The Market for ‘Lemons’: Quality
Uncertainty and the Market Mechanism,”
Quarterly Journal of Economics, 84 (3) (1970)
488-500.
[14] Leland, H. E., & Pyle, D. H., “Information
Asymmetries, Financial Structure, and Financial
Intermediation,” The Journal of Finance, 32 (2)
(1977) 371-387.
[15] Eckhardt, Jonathan T, and Scott A Shane,
“Opportunities and Entrepreneurship.” Journal of
Management 29 (3) (2003) 333-349.
[16] Hutton, A. P., Marcus, A. J., & Tehranian, H.,
“Opaque Financial Reports, R2, and Crash Risk,”
Journal of Financial Economics, 94 (1) (2009) 67-86.
[17] Kothari, S. P., Shu, S., & Wysocki, P. D “Do
Managers Withhold Bad News?,” Journal of
Accounting Research, 47(1) (2009) 241-276.
[18] Kim, J. B., Li, Y., & Zhang, L., “FOs Versus
CEOs: Equity Incentives and Crashes,” Journal of
Financial Economics, 101 (3) (2011) 713-730. [19] Botosan, C. A., “Disclosure Level and the Cost of
Equity Capital,” The Accounting Review, 72 (3)
(1997) 323-349.
[20] Ryen, T. G., Vasconcellos, M. G., & Kish, J. R.,
“Capital Structure Decisions: What Have We
Learned?,” Business Horizons Journal, 40 (5)
(1997) 41-50.
[21] Krishnaswami, S., and V. Subramaniam,
“Information Asymmetry, Valuation, and the
Corporate Spin-off Decision,” Journal of
Financial Economics, 53 (1999) 73-112.
[22] Fosu, S., Danso, A., Ahmad, W., & Coffie, W.,
“Information Asymmetry, Leverage and Firm
Value: Do Crisis and Growth Matter?,”
International Review of Financial Analysis, 46
(2016) 140–150.
[23] Rajan, R., and L. Zingales, “What Do We Know
About Capital Structure: Some Evidence from
International Data,” Journal of Finance 50
(1995)1421-60.
[24] Opler, T., L. Pinkowitz, R. Stulz, and R.
Williamson, “The Determinants and Implications
of Corporate Cash Holdings,” Journal of Financial
Economics, 52 (1999) 3-46.
[25] Margaritis, Dimitris, and Maria Psillaki, “Capital
Structure, Equity Ownership and Firm
Performance,” Journal of Banking & Finance, 34
(3) (2010) 621-632.
[26] Freund, R. J., Wilson, W. J., & Sa, P., “Regression
Analysis - Statistical Modeling of a response
variable,” San Diego: Elsevier, 459 (2006).
[27] B. H. Baltagi, “A Hausman Test Based on the
Difference Between Fixed Effects Two-Stage
Least Squares and Error Components Two-Stage
Least Squares,” Econometric Theory, 21(2) (2005)
483-484.
[28] Croci, E., Gonenc, H. and Ozkan, N., “CEO
Compensation, Family Control, and Institutional
Investors in Continental Europe,” Journal of
Banking & Finance, 36 (2012) 3318-335.
[29] Ozkan, A., Ozkan, N., “Corporate Cash Holdings:
An Empirical Investigation of UK Companies,”
Journal of Banking and Finance, 28 (2004)
2103-2134.
Related Documents