AUTHOR QUERY FORM Journal: GENE Please e-mail or fax your responses and any corrections to: Specht, Carmela E-mail: [email protected] Fax: +1 619 699 6721 Article Number: 39470 Dear Author, Please check your proof carefully and mark all corrections at the appropriate place in the proof (e.g., by using on-screen annotation in the PDF file) or compile them in a separate list. Note: if you opt to annotate the file with software other than Adobe Reader then please also highlight the appropriate place in the PDF file. To ensure fast publication of your paper please return your corrections within 48 hours. For correction or revision of any artwork, please consult http://www.elsevier.com/artworkinstructions. Any queries or remarks that have arisen during the processing of your manuscript are listed below and highlighted by flags in the proof. Click on the ‘Q’ link to go to the location in the proof. Location in article Query / Remark: click on the Q link to go Please insert your reply or correction at the corresponding line in the proof Q1 Please confirm that given names and surnames have been identified correctly. Q2 Of the two captions provided for Fig. 1, we used the caption provided along with the text. Please check, and correct if necessary. Q3 Please check the presentation of the caption and legend of Table 1 and amend if necessary. Q4 Kindly check if we are correct in capturing the Highlights as presented in the original manuscript and amend if necessary. The highlights were presented in five separate lines. The second and third line seems to be a continuation of the first line and the fifth line a continuation of the fourth. Moreover, as per journal instruction, Highlights should consist of only 85 characters per bullet point, including spaces. For more information, please see Guide for Authors. Q5 The citation “Seligmann, 2010” has been changed to match the author name/date in the reference list. Please check here and in subsequent occurrences, and correct if necessary. Q6 The phrase "that found in" was changed to "like those found in" in this sentence. Please check and amend if necessary. Q7 The citation “Macey et al., 2000” has been changed to match the author name/date in the reference list. Please check here and in subsequent occurrences, and correct if necessary. Q8 The phrase "because enabling objective and repeatable decisions" was changed to "because they enable objective and repeatable decisions" in this sentence. Please check and amend if necessary. Q9 Please check the hierarchy and labelling of the section headings. Q10 The phrase "unless one considers that the probability' was changed to "unless one considers the probability" in this sentence. Please check and amend if necessary. Q11 , Q12 Citation “Seligmann, 2006” has not been found in the reference list. Please supply full details for this reference. Q13 Please provide a conflict of interest statement. If there is no conflict of interest, state that. Our reference: GENE 39470 P-authorquery-v11 Page 1 of 2

Welcome message from author
This document is posted to help you gain knowledge. Please leave a comment to let me know what you think about it! Share it to your friends and learn new things together.
Transcript
AUTHOR QUERY FORM
Journal: GENE Please e-mail or fax your responses and any corrections to:Specht, CarmelaE-mail: [email protected]: +1 619 699 6721
Article Number: 39470
Dear Author,
Please check your proof carefully and mark all corrections at the appropriate place in the proof (e.g., by using on-screen annotationin the PDF file) or compile them in a separate list. Note: if you opt to annotate the file with software other than Adobe Reader thenplease also highlight the appropriate place in the PDF file. To ensure fast publication of your paper please return your correctionswithin 48 hours.
For correction or revision of any artwork, please consult http://www.elsevier.com/artworkinstructions.
Any queries or remarks that have arisen during the processing of your manuscript are listed below and highlighted by flags in theproof. Click on the ‘Q’ link to go to the location in the proof.
Location in article Query / Remark: click on the Q link to goPlease insert your reply or correction at the corresponding line in the proof
Q1 Please confirm that given names and surnames have been identified correctly.
Q2 Of the two captions provided for Fig. 1, we used the caption provided along with the text. Please check,and correct if necessary.
Q3 Please check the presentation of the caption and legend of Table 1 and amend if necessary.
Q4 Kindly check if we are correct in capturing the Highlights as presented in the original manuscript andamend if necessary. The highlights were presented in five separate lines. The second and third lineseems to be a continuation of the first line and the fifth line a continuation of the fourth. Moreover, asper journal instruction, Highlights should consist of only 85 characters per bullet point, includingspaces. For more information, please see Guide for Authors.
Q5 The citation “Seligmann, 2010” has been changed to match the author name/date in the reference list.Please check here and in subsequent occurrences, and correct if necessary.
Q6 The phrase "that found in" was changed to "like those found in" in this sentence. Please check andamend if necessary.
Q7 The citation “Macey et al., 2000” has been changed to match the author name/date in the reference list.Please check here and in subsequent occurrences, and correct if necessary.
Q8 The phrase "because enabling objective and repeatable decisions" was changed to "because theyenable objective and repeatable decisions" in this sentence. Please check and amend if necessary.
Q9 Please check the hierarchy and labelling of the section headings.
Q10 The phrase "unless one considers that the probability' was changed to "unless one considers theprobability" in this sentence. Please check and amend if necessary.
Q11, Q12 Citation “Seligmann, 2006” has not been found in the reference list. Please supply full details for thisreference.
Q13 Please provide a conflict of interest statement. If there is no conflict of interest, state that.
Our reference: GENE 39470 P-authorquery-v11
Page 1 of 2

Q14 Uncited references: This section comprises references that occur in the reference list but not in the bodyof the text. Please position each reference in the text or, alternatively, delete it. Thank you.
Please check this box if you have nocorrections to make to the PDF file. □
Thank you for your assistance.
Our reference: GENE 39470 P-authorquery-v11
Page 2 of 2
UNCO
RRECTED P
RO
OF
1 Highlights
2 Gene xxx (2014) xxx–xxx
4
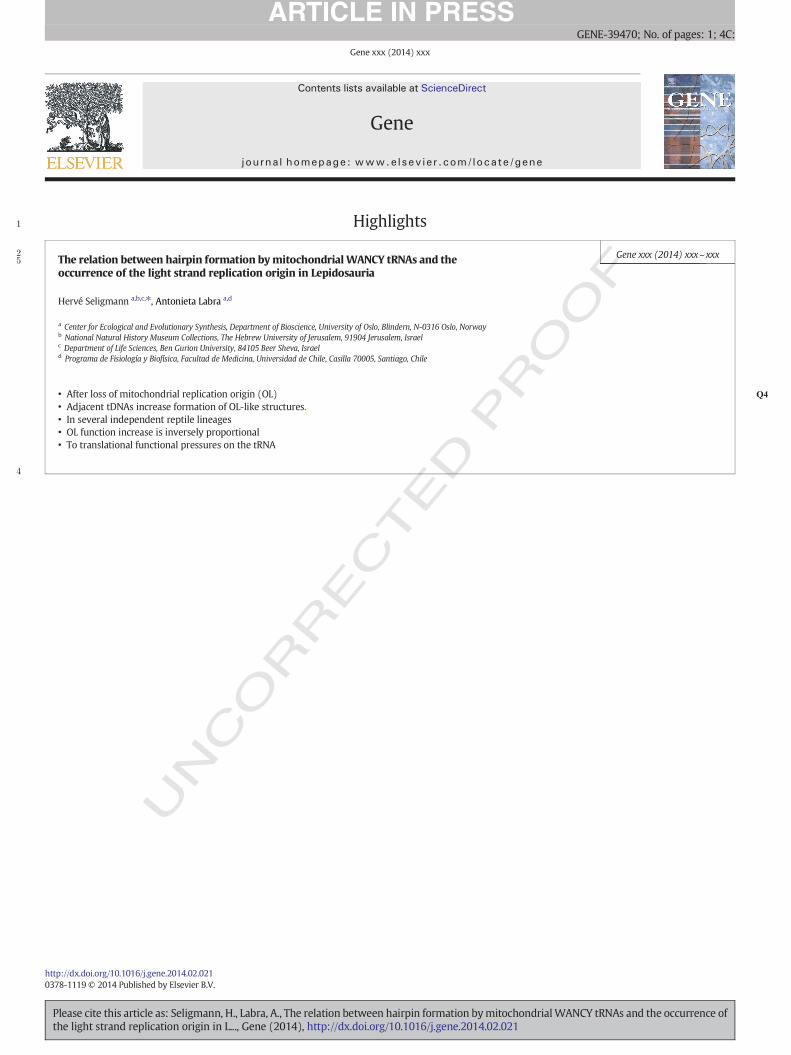
5 The relation between hairpin formation bymitochondrial WANCY tRNAs and theoccurrence of the light strand replication origin in Lepidosauria
Hervé Seligmann a,b,c,⁎, Antonieta Labra a,d
a Center for Ecological and Evolutionary Synthesis, Department of Bioscience, University of Oslo, Blindern, N-0316 Oslo, Norwayb National Natural History Museum Collections, The Hebrew University of Jerusalem, 91904 Jerusalem, Israelc Department of Life Sciences, Ben Gurion University, 84105 Beer Sheva, Israeld Programa de Fisiología y Biofísica, Facultad de Medicina, Universidad de Chile, Casilla 70005, Santiago, Chile
• Q4After loss of mitochondrial replication origin (OL)• Adjacent tDNAs increase formation of OL-like structures.• In several independent reptile lineages• OL function increase is inversely proportional• To translational functional pressures on the tRNA
Gene xxx (2014) xxx
GENE-39470; No. of pages: 1; 4C:
http://dx.doi.org/10.1016/j.gene.2014.02.0210378-1119 © 2014 Published by Elsevier B.V.
Contents lists available at ScienceDirect
Gene
j ourna l homepage: www.e lsev ie r .com/ locate /gene
Please cite this article as: Seligmann, H., Labra, A., The relation between hairpin formation bymitochondrialWANCY tRNAs and the occurrence ofthe light strand replication origin in L..., Gene (2014), http://dx.doi.org/10.1016/j.gene.2014.02.021
Original text:
Inserted Text
""
1
Q1
2
34567
891011121314
15
16
17
18
19
20
35
36
37
38
39
40
41
42
43
44
45
Gene xxx (2014) xxx–xxx
GENE-39470; No. of pages: 10; 4C:
Contents lists available at ScienceDirect
Gene
j ourna l homepage: www.e lsev ie r .com/ locate /gene
The relation between hairpin formation bymitochondrial WANCY tRNAsand the occurrence of the light strand replication origin in Lepidosauria
OFHervé Seligmann a,b,c,⁎, Antonieta Labra a,d
a Center for Ecological and Evolutionary Synthesis, Department of Bioscience, University of Oslo, Blindern, N-0316 Oslo, Norwayb National Natural History Museum Collections, The Hebrew University of Jerusalem, 91904 Jerusalem, Israelc Department of Life Sciences, Ben Gurion University, 84105 Beer Sheva, Israeld Programa de Fisiología y Biofísica, Facultad de Medicina, Universidad de Chile, Casilla 70005, Santiago, Chile
U
Abbreviations: OL, light strand replication origin; WAgenome region that templates for tRNAs with cognates W(asparagine), C (cysteine) and Y (tyrosine).⁎ Corresponding author at: Unité de Recherche su
Tropicales Émergentes, Faculté de Médecine, URMITEUniversité de la Méditerranée, Marseille, France.
E-mail addresses: [email protected] (H. Seli(A. Labra).
http://dx.doi.org/10.1016/j.gene.2014.02.0210378-1119 © 2014 Published by Elsevier B.V.
Please cite this article as: Seligmann, H., Labrthe light strand replication origin in L..., Gen
O
a b s t r a c t
a r t i c l e i n f o21
22
23
24
25
26
Article history:Received 30 May 2013Received in revised form 27 December 2013Accepted 17 February 2014Available online xxxx
Keywords:Gene function duplicationAlternative gene functionSecondary structure predictionSphenodonCovariance matrixGene interactions
27
28
29
CTED P
R
Mitochondrial light strand DNA replication is initiated at light strand replication origins (OLs), short stem-loophairpins formed by the heavy strand DNA. OL-like secondary structures are also formed by heavy strand DNAtemplating for the five tRNAs adjacent to OLs, the WANCY tRNA cluster. We tested whether natural OL absenceassociates with greater capacities for formation of OL-like structures byWANCY tRNA genes. Using lepidosauriantaxa (Sphenodon, lizards and amphisbaenids), we compared WANCY tRNA capacities to form OL-like structuresbetween 248 taxa possessing an OL with 131 taxa without OL (from different families). On average, WANCYtRNA genes form more OL-like structures in the absence of a regular OL than in its presence. Formation of OL-like structures by WANCY tRNAs follows hierarchical patterns that may reduce competition between thetRNA's translational function and its secondary OL function: the rarer the tRNA's cognate amino acid, the greaterthe capacity to form OL-like structures. High OL-forming capacities for neighboring tRNAs are avoided. BecauseOL absence usually occurs in taxa with reduced genomes, increased formation of OL-like structures by WANCYtRNAs might result from selection for greater metabolic efficiency. Further analyses suggest that OL loss is oneof the latest steps in genome reduction, and promotes the increase in formation of OL-like structures byWANCY tRNA genes in Lepidosauria.
© 2014 Published by Elsevier B.V.
303133
32
E
3446
47
48
49
50
51
52
53
54
55
56
57
58
NCO
RR1. Introduction
A major challenge of the postgenomic era is to make sense of thewealth of newly available molecular sequence information. Some DNAsequences have a presumably well-known, easily detected function.However, this is sometimesmisleading, because it deflects from consid-ering secondary functions, which may have biological importance. Forexample,manyDNA regions that supposedly cannot code for proteins be-cause they include stop codons seem to actually code for proteins, assum-ing induction of translational activity by suppressor or antiterminationtRNAs that have anticodons that match stop codons (Seligmann,2010a). The off frame regions of protein coding regions code for ‘cryptic’overlapping protein coding genes according to a stopless parallel
59
60
61
62
63
64
65
66Q5
67
NCY region, the mitochondrial(tryptophane), A (alanine), N
r les Maladies Infectieuses etCNRS-IRD 198 UMER 6236,
gmann), [email protected]
a, A., The relation between haie (2014), http://dx.doi.org/10
‘overlapping’ genetic code, as suggested by comparative analyses ofmito-chondria from primates (Faure et al., 2011; Seligmann, 2011a, 2012a),Drosophila (Seligmann, 2012b) and turtles (Seligmann, 2012c). This sys-tem of overlapping genes by overlapping genetic codes increases thenumber of putatively mitochondrion-encoded proteins, without length-ening the genome. In fact, several additional mechanisms increase mani-fold the coding density of genes, such as tetracodons (Seligmann, 2012d,2013a,b; Seligmann and Labra, 2013), 3′-to-5′ overlap coding (Seligmann,2013c,d) and permuting polymerization that produces transcripts withsystematically exchanged nucleotides (Seligmann, 2013e,f). All this is inlinewith the description of a ‘punctuation code’ formed by 20 specific co-dons (the circular code regulates frame choice, Arquès andMichel, 1997),and that some codons regulate gene expression (Stergachis et al., 2013).This indicates that not all functions of DNA are known, and that somecan still be detected. In fact, in the short mitochondrial vertebrate ge-nome, the classical known role of tRNA genes is to template for tRNAsthat function in translation, but DNA coding for tRNAs has other, lessknown functions (Giegé, 2008). Bioinformatic analyses of mitochondrialgenomes suggest that DNA templating for tRNAs (tDNA) can function asadditional mitochondrial light strand replication origin, OL (Seligmann,2008, 2010b; Seligmann and Krishnan, 2006; Seligmann et al., 2006a,b).Similarly, Rhodakis et al. (2007) found that sequences other than the
rpin formation bymitochondrialWANCY tRNAs and the occurrence of.1016/j.gene.2014.02.021
Original text:
Inserted Text
"givenname"
Original text:
Inserted Text
"givenname"
Original text:
Inserted Text
"surname"
Original text:
Inserted Text
"surname"
Original text:
Inserted Text
"’"
Original text:
Inserted Text
"’"
Original text:
Inserted Text
"’"
Original text:
Inserted Text
"’"
T
68
69
70
71
72
73
74
75
76
77
78
79
80
81
82
83
84
85
86
87
88
89
90
91
92
93
94
95
96
97
98
99
100
101
102
103
104
105
106
107
108
109
110
111
112
113
114
115
116
117
118
119
120
121
122
123
124
125
126
127
128
129
130
131
132
133
134
135
136
137
Q2
2 H. Seligmann, A. Labra / Gene xxx (2014) xxx–xxx
C
recognized OL have an OL-like function, such as a short region in the cod-ing sequence of ND3 in the mussel genusMytilus.
1.1. Light strand replication initiation and tDNAs
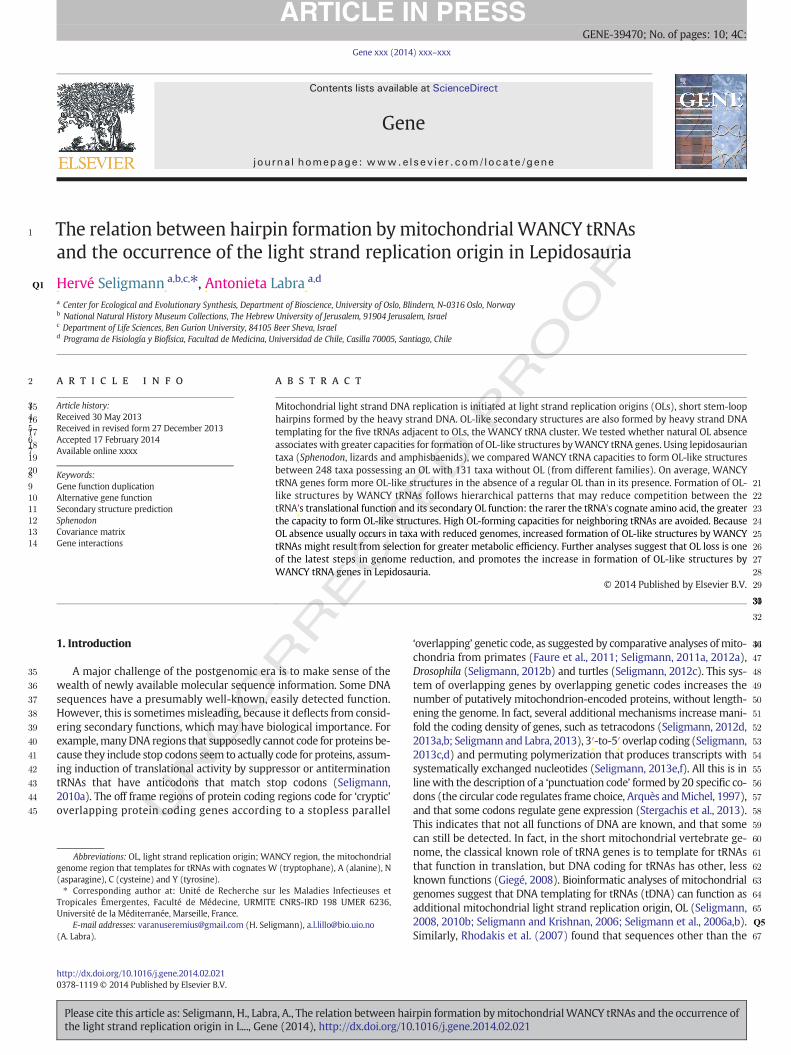
The OL is a short heavy strand DNA stem-loop hairpin. The mito-chondrial DNA polymerase gamma initiates mitochondrial light strandDNA replication in the OL vicinity (Wanrooij and Falkenberg, 2010).Two independent properties of mitochondrial tRNA genes correlatepositively with estimations of the frequency at which light strand repli-cation is initiated in the region of these specific tRNA genes: the tenden-cy of these tRNAs to formOL-like secondary structures (Seligmannet al.,2006a), and the similarity between the sequences forming tRNA antico-don loops and those forming the loop of the ‘real’ OL (Seligmann,2010a). The latter agreewith the results by Fuste et al. (2010) on the re-quirement of polyT stretches in the OL loop, because both the OL loopand the tDNA anticodon loops predicted to function as OLs have polyTstretches.
Other properties of the classical OL region important to initiate DNAreplication, include the presence of the presumed canonical motif 3′-GGCCG-5′ located near the OL (Hixson et al., 1986), as well as the pres-ence in the loop of the OL, of a poly dT stretch (Fuste et al., 2010).Evidence indicates that similarities between the linear sequences ofOL and anticodon loops are independent from the capacity of the com-plete tDNA to form OL-like secondary structures, and that similaritiesbetween tDNA and OL, according to different OL properties, predict OLfunction. Supporting this are results showing that the stability of hy-bridization between heavy strand tDNA and its expressed, complemen-tary tRNA, decreases initiation of light strand replication at that tDNA(Seligmann, 2008). These observations agree with the hypothesis thatthe original role of tRNAs at the origins of life was for replication initia-tion (Maizels andWeiner, 1994), and, conversely, that RNA correspond-ing to the OL is expressed and loadedwith amino acids (Yu et al., 2008).
The above described analyses used secondary structure predictions(Mfold, Zuker, 2003) that show formation of OL-like structures byheavy strand sequences of genes coding formitochondrial tRNAs, notablythefive tRNA genes adjacent to the OL (Seligmann, 2010a; Seligmann andKrishnan, 2006; Seligmann et al., 2006a,b). A total of six adjacent genes,
UNCO
RRE
Fig. 1. Secondary structures in thewestern fence lizard, Sceloporus occidentalis (NC_005960 inNfor tRNAs Asn and Cys. b—Classical tRNA Trp cloverleaf structure functioning in translation andsequence that corresponds for that tRNA to the expressed sequence.
Please cite this article as: Seligmann, H., Labra, A., The relation between haithe light strand replication origin in L..., Gene (2014), http://dx.doi.org/10
ED P
RO
OF
the OL and the five tRNAs that form the WANCY region (tRNA Trp -W-,tRNA Ala -A-, tRNA Asn -N-, tRNA Cys -C- and tRNA Tyr -Y-) potentiallyfunction as OL in that region (Seligmann, 2010a; Seligmann et al.,2006a,b). The regular OL is located between tRNA Asn and tRNA Cys (be-sides some rare exceptions, i.e. in salamanders,Mueller et al., 2004). Fig. 1presents a typical example of the regular OL and an OL-like structureformed by the heavy strand complement of the tDNA that templates fortRNA Trp in the western fence lizard, Sceloporus occidentalis. Note thatthe loop of theOL-like hairpin corresponds to sequences that form the an-ticodon loop in the tRNA cloverleaf structure. This is generally the case, asit has been shown in different taxa: for tRNA Tyr of the anguid arborealalligator lizard Abronia graminea (Fig. 2 in Seligmann and Krishnan,2006); for tRNA Asn of the dusky leaf monkey Trachypithecus obscurus(Fig. 1B in Seligmann et al., 2006a); for tRNA Thr of Homo sapiens(Figs. 1b and d in Seligmann et al., 2006b) and for tRNA Ser UCN of theTibetan macaque,Macaca thibetana (Seligmann, 2010a).
1.2. Effects of multiple replication origins
Possessing several regions that function as OL has adaptive conse-quences for mitochondrial genomes. Each time the DNA duplex isopened for DNA or RNA syntheses (i.e., DNA replication and RNA tran-scription), the single stranded DNA is subject to enhanced mutationrates because single stranded DNA is more likely to mutate than in theprotected duplex state. If replication starts at the regular OL, differentregions remain single stranded for different periods of time. Accordingto their position in relation to the OL, some regions remain a shorttime single stranded, and others a long time, and cumulatesmoremuta-tions during replication (i.e., Hassanin et al., 2005; Tanaka and Ozawa,1994). A similar, yet not identical phenomenon, occurs during tran-scription, which makes that some regions mutate due to replication,and others, due to transcription (Seligmann, 2012a, 2013f).
1.3. Working hypothesis and predictions
Analyses presented here use the WANCY system to address the fol-lowing issues: 1. Does OL absence associate with greater capacities bytRNAs adjacent to the OL to function as OL? 2. If so, is it possible to
CBI (GenBank)). a—Classical OL formed by the heavy strandDNA between the genes codingexpressed by the light strand DNA. c—OL-like structure formed by the heavy strand DNA
rpin formation bymitochondrialWANCY tRNAs and the occurrence of.1016/j.gene.2014.02.021
Original text:
Inserted Text
"’"
Original text:
Inserted Text
"’"
Original text:
Inserted Text
"–"
Original text:
Inserted Text
"– "
138
139
140
141
142
143
144
145
146
147
148
149
150
151
152
153
154
155
156
157
158
159
160
161
162
163Q6
164
165
166
167
168Q7
169
170
171
Q3
t1:1
t1:1
t1:1
t1:1
t1:1
t1:1
t1:1
t1:1
t1:1
t1:1
t1:1
t1:1
t1:1
t1:1
t1:1
t1:1
t1:1
t1:1
t1:1
t1:1
t1:1t1:1
t1:1
t1:1
t1:1
t1:1
t1:1
t1:1
t1:1
t1:1
t1:1
t1:1
t1:1
t1:1
t1:1
t1:1
t1:1
t1:1
t1:1
t1:1
t1:1
t1:1
t1:1
t1:1
t1:1
t1:1
t1:1
t1:1
t1:1
t1:1
t1:1
t1:1
t1:1
t1:1
t1:1
t1:1
3H. Seligmann, A. Labra / Gene xxx (2014) xxx–xxx
predict which tRNAs specialize as OLs? 3. Does OL loss drive increasedformation of OL-like structures by adjacent tRNAs, or is OL loss enabledby that pre-existing capacity by WANCY tDNAs to form these OL-likestructures?
Considering the vital OL function, we hypothesize that tDNAssurrounding the regular OL should formmore OL-like structures in tax-onomic groups lacking an OL than those possessing a regular OL. Sec-ond, in groups lacking a classical OL, the enhancement in OL-formingcapacities should be proportional to the extent of OL formation by thattDNA in the presence of a classical OL.We also expect that the hierarchybetween tDNAs for specializing for OL function should follow simpleprinciples of trade-off between tRNA/tDNA functions. We expect nega-tive associations between the primary function of the gene as tRNA inprotein translation and its secondary function as OL during DNAreplication.
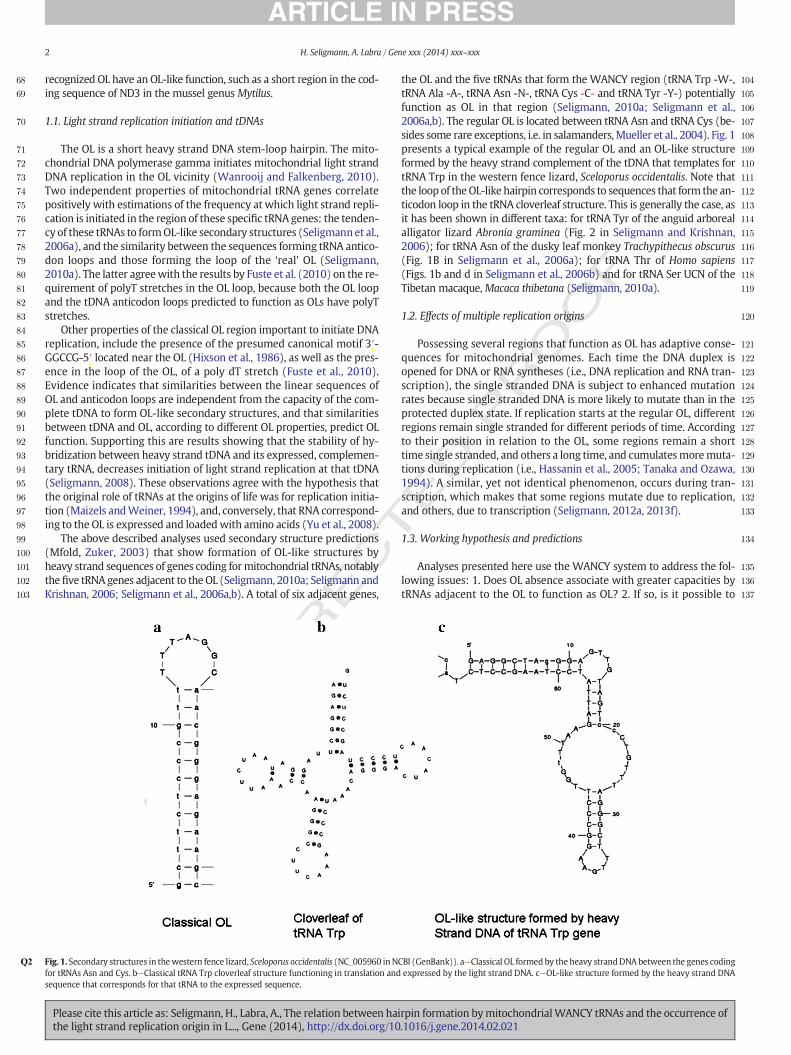
We compared OL-forming capacities of tDNAs adjacent to the OL inlepidosaurian groups with and without a classical OL (see Table 1).
UNCO
RRECT
Table 1Capacity of the WANCY region to form OL-like structures and the general use of different amin
Taxon N Mean percent of OL-like structures
OL Trp Ala Asn Cys
OL absentAgamidae 88 23.22 2.53 15.03 21.34Amphisbaenia 2 25.00 0.00 14.71 3.71Amphibaena xera 1 40.00 0.00 0.00 0.00
Gekkonidae: Cyrtodactylus 20 22.81 16.7 7.54 23.53Iguanidae 3 22.94 6.67 6.67 19.44Enyalioides laticeps 1 22.22 20.00 0.00 25.00Phrynosoma mcallii 1 9.10 0.00 20.00 33.33Uracentron flaviceps 1 37.5 0.00 0.00 0.00
Scincidae 12 16.72 7.59 11.51 11.40Chalcides ocellatus 1 18.18 0.00 6.25 0.00Eumeces anthracinus 1 15.39 0.00 11.11 33.33Eumeces inexpectatus 1 27.27 0.00 27.27 0.00Eumeces skiltonianus 1 15.69 0.00 27.27 27.27
Xantusiidae 5 57.29 0.00 5.00 31.71Sphenodontidae 1 12.50 7.69 0.00 75.00
OL presentAgamidae 58 3.63 21.13 9.64 7.32 29.96Amphisbaeniaa 8 9.18 15.42 0.00 18.89 17.94Amphisbaena schmidti 1 11.35 25.00 0.00 37.5 0.00
Anguidae 11 11.49 5.62 0.00 1.82 31.41Polychridae 20 11.55 26.54 1.74 8.80 2.88Chamaeleonidae 9 7.77 37.22 7.41 2.38 24.22Cordylidae 3 11.07 16.24 0.00 27.78 0.00Gekkonidae 20 10.11 17.6 3.33 20.75 15.15Helodermatidae 2 10.19 4.55 0.00 0.00 10.00Lacertidae 7 11.65 13.77 0.00 22.15 5.71Liolaemidae: Liolaemus 36 12.25 47.54 0.00 2.04 3.08Phrynosomatidae: Sceloporus 16 11.07 27.15 0.00 7.99 3.70Enyalioides laticeps 4 10.28 10.00 8.00 0.00 6.90Phrynosoma 8 11.72 23.36 0.00 3.54 22.21Uracentron flaviceps 1 11.99 37.5 0.00 0.00 0.00
Scincidae 29 6.8 19.19 3.23 14.44 13.41Chalcides ocellatus 1 6.43 16.17 0.00 6.25 0.00Eumeces anthracinus 1 6.68 15.39 0.00 11.11 33.33Eumeces inexpectatus 1 6.98 27.27 0.00 27.27 0.00Eumeces skiltonianus 1 6.68 11.11 0.00 27.27 0.00
Shinisauridae 1 11.04 18.18 12.50 0.00 0.00Teiidae 2 11.82 5.56 0.00 0.00 22.50Varanidae 19 12.49 12.43 25.51 4.62 40.15rOL-cognate usageMean, all taxa 22 10.14 21.30 4.76 9.07 18.47Mean taxa with OL 15 10.14 19.21 4,23 9.27 14.68Mean taxa without OL 7 25.78 5.89 8.64 26.59Δ taxa with and without OL −6.57 1.66 −0.63 −11.92
Mean percent of OL-like secondary structures formed by heavy strand sequences of tRNA genespecies used to calculate averages for a taxon, OL= mean−ΔGof the stem-loop hairpin formetRNAs, Dist = Pearson correlation coefficient between pairwise correlations between OL formathefive tRNAs are also indicatedwhen the complete sequence of at least one genome is availabltRNAs for taxa with and without recognized OL. Bold indicates statistical significance at P b 0
a Includes members from all 4 amphisbaenian families.
Please cite this article as: Seligmann, H., Labra, A., The relation between haithe light strand replication origin in L..., Gene (2014), http://dx.doi.org/10
F
Lepidosaurians are a monophylogenetic reptilian group which consistsof Rhynchocephalians (as outer branch, with the tuatara, Sphenodon,Sphenodontidae, its only extant species), and the squamates, which in-clude lizards, amphisbaenids and snakes. Analyses exclude the ‘ad-vanced’ snakes, since their replication is peculiar, as their mitochondrialgenomes possess two D-loops. For the sake of taxonomic uniformityin the analyses, we also excluded sequences from primitive snakes(Typhloidea: Leptotyphlopidae and Typhlopidae), which possess mito-chondrial genomes with a structure resembling like those found in liz-ards, but lack an OL in their WANCY region. Therefore, our analyseswere restricted to lizards, amphisbaenids and Sphenodon. In lizards, thelack of the classical OL occurs occasionally in Amphisbaenia (two species,Amphisbaena xera and Trogonophis wiegmanni) and in some lizard fami-lies, Agamidae (Macey et al., 2000a,b), Gekkonidae (only in the genusCyrtodactylus), Iguanidae (Enyaloides laticeps, Phrynosoma mcallii andUracentron flaviceps), Scincidae (11 species) and Xantusiidae (onespecies), which are compared to other lizard groups.
ED P
RO
O
o acids coded by the WANCY region, in different Lepidosauria taxa.
Sum Dist Genome-wide usage of cognate
Tyr Trp Ala Asn Cys Tyr
19.49 80.01 0.38 26.1 76.0 31.8 6.7 30.023.08 66.4946.15 86.1533.25 103.83 0.164.76 60.480.00 67.220.00 62.42
14.29 51.7917.45 64.67 −0.430.00 24.43
33.33 93.1623.08 77.6223.08 93.0118.89 112.89 −0.39 28.0 79.5 34.3 7.1 30.40.00 95.19 31.3 65.2 36.4 6.6 31.4
13.64 81.15 0.06 26.8 87.5 44.0 7.9 28.716.62 68.86 −0.05 26.5 84.6 32.3 7.7 33.111.11 73.611.30 40.15 −0.25 27.4 67.8 40.1 8.2 30.3
21.05 61.00 0.34 26.2 70.3 41.0 7.9 29.62.62 73.85 −0.12 26.9 62.4 43.0 8.0 31.04.76 48.78 28.0 71.4 36.4 8.9 27.2
12.24 69.07 0.46 27.6 74.9 36.5 8.8 29.40.00 14.55 26.9 64.1 38.0 8.1 33.2
10.64 52.27 0.35 27.2 70.1 35.7 7.4 29.928.43 81.09 0.4426.23 65.07 0.38 27.3 74.9 37.8 7.9 29.36.25 31.157.50 56.61 −0.16
14.29 51.7916.16 66.44 −0.29 28.3 85.0 34.8 8.2 29.80.00 22.92
33.33 93.1623.08 77.6250 88.380.00 30.68 27.5 74.9 37.5 8.0 30.20.00 28.069.53 92.24 −0.18 26.5 60.5 41.9 7.6 26.6
−0.07 −0.33 −0.47 −0.60 −0.4312.73 66.21 0.32 27.4 73.1 37.6 7.8 30.010.88 58.22 0.17 27.2 73.0 38.4 8.1 28.916.70 83.37 0.42 28.5 73.6 34.2 6.8 30.6−5.82 −25.15
s for different lepidosaurian taxa (lizards, amphisbaenids and Sphenodon). N = number ofd by the classical OL, Sum= sumof the percentages of theOL-like structures over all fivetion and the distance between genes. Genome-wide usages of the cognate amino acids ofe for that taxon. The last line indicates differences betweenmean OL-formation capacity by.05 according to one tailed t-tests for the last row, and for Dist.
rpin formation bymitochondrialWANCY tRNAs and the occurrence of.1016/j.gene.2014.02.021
Original text:
Inserted Text
"in "
Original text:
Inserted Text
"that "
Original text:
Inserted Text
"that "
Original text:
Inserted Text
"strictly "
T
172
173
174
175
176
177
178
179
180
181
182
183
184
185
186
187
188
189
190
191
192
193
194
195
196
197
198
199
200
201
202
203
204
205
206
207
208
209
210
211
212
213
214
215
216
217Q8
218
219
220
221
222
223
224
225
226
227
228
229
230
231
232
233
234
235
236
237
238
239
240
241
242
243
244
245
246
247
248
249
250
251
252
253
254
255
256
257
258
259
260
261
262
263
264
265
266
267
268
269
270
271
272
273
274
275
276
277
278
279Q9
280
281
282
283
284
285
286
287
288
289
290
291
292
293
294
295
4 H. Seligmann, A. Labra / Gene xxx (2014) xxx–xxx
UNCO
RREC
It is important to consider that variation probably exists betweenspecies in the motifs initiating polymerase gamma binding (in the OLloop) and polymerization. These motifs have been determined forHomo sapiens (Hixson et al., 1986), but they are probably not universal,and probably vary evenwithin Lepidosauria. Including them in the anal-yseswould bemore complete at the condition they are known for all thetaxonomic groups included in this study. This would imply separatestudies on each of thesemotifs for each taxon, which seems unpracticalat this stage. Restricting the study to the secondary structure aspect en-ables to testwhether the basic hypothesis of OL function by tRNAs is po-tentially viable according to that specific criterion. It should be seen as afirst step towardsmore complete analyses that include the other criteria(binding region in the OL loop and polymerization initiation motif).Therefore, here we focus on a single tDNA property, the capacity toform OL-like secondary structures.
2. Materials and methods
We searched Genbank (NCBI; accessed January 2009 and samplingcompleted July 2013) for lizard, amphisbaenids and Sphenodon se-quences of mitochondrial genes that normally flank the OL. ForAmphisbaenia and each lizard family (or genus) and Sphenodon, tRNAsequences for the five tRNA genes flanking the OL (tRNA Trp, Ala, Asn,Cys and Tyr) were extracted using tRNAScan-Se (http://lowelab.ucsc.edu/tRNAscan-SE/, Lowe and Eddy, 1997; Schattner et al., 2005), toavoid inconsistencies between species in Genbank annotations.
Capacities to form OL-like structures were estimated by examiningeach of the alternative secondary structures predicted by Mfold (usingthe default mode in terms of temperature and ionic concentrations),for the heavy strand tDNA sequence of a givenWANCY tRNAwith stabil-ities down to half that of its most stable secondary structure (Krishnanet al., 2004, 2008; Seligmann and Krishnan, 2006; Seligmann et al.,2006a,b). Thereafter, we calculated percentages of secondary structuresthat are OL-like for all secondary structures (see Seligmann andKrishnan, 2006; Seligmann et al., 2006a,b). In order to decide that astructure formedby a tDNA is OL-like or not,we strictly used the follow-ing criteria. The structure has to consist of a single linear, non-branchingstem. At one end of the stem are the sequence's 5′ and 3′ extremities,at the other end, a loop of undetermined size. Bulges or small loops (un-paired nucleotides) within the stem were tolerated, as long as these donot involve secondary (paired nucleotides) stems branching from themain stem. Hence, the stem-loop structure has to be linear. It is possiblethat these criteria were too restrictive and that other secondary struc-tures, such as branching ones, or suggesting bidirectionality (seeFig. 2C in Seligmann and Krishnan, 2006, and 1C in Seligmann et al.,2006b where a tDNA sequence seems to form two OLs, each one direct-ed in the opposite direction), also function as OLs. The criteria, however,were chosen because they enable objective and repeatable decisionsupon visual examination of secondary structures.
Genbank entries frequently lack annotations for the OL. The lack ofpolyT stretch in the OL can be a cause for this lack of annotation. Thecause probably varies between studies, but there is no doubt that in nu-merous cases theOL is not annotated but includes a polyT stretch (i.e., inHorsfield's tarsier, Tarsius bancanus (NC_002811)). However, in caseswhere the OL has been annotated, procedures determining its sequencediffer among studies. Therefore, we determined the sequence formingthe OL stem-loop hairpin using the following procedure: 1- Consideringthat for most vertebrates the OL is between tRNA Asn and tRNA Cys, weextracted the sequence between these two tRNAs, extendedby about 15nucleotides from the 3′ extremity of tRNA Asn and 15 nucleotides fromthe 5′ extremity of tRNA Cys. 2- The secondary structure formed by thissequence, as predicted by Mfold, was examined to determine the pre-cise sequence forming the stem-loop structure. 3- The heavy strand ofthe latter sequence was used to predict the stability (ΔG) of the OL ac-cording to Mfold predictions. Stages 1 and 2 were necessary becausethe sequence forming the OL is not always precisely limited by the
Please cite this article as: Seligmann, H., Labra, A., The relation between haithe light strand replication origin in L..., Gene (2014), http://dx.doi.org/10
tRNA genes flanking the OL, it could be shorter than the inter-tRNAspacer, or expand into the tRNAs, as previously described (e.g., Maceyet al., 1997). Usages of tRNAs are deduced from the complete genomeusages of their corresponding amino acid cognates in mitochondrially-encoded protein coding genes for species from that family for whichcomplete mitochondrial genome sequences are available.
Associations between variables were tested using Pearson correla-tions, inmost cases one tailed. Sign testswere applied using the binomi-al distribution.
ED P
RO
OF
3. Results and discussion
3.1. Enhanced formation of OL-like structures in OL absence: tRNA Cys andtRNA Trp
Among the 379 species examined, Mfold did not predict any OL-likestructure for 44% of all tDNA sequences across all five tRNA species. Intwo unrelated taxa, Heloderma suspectum and Anolis lionotus, none ofthe five tDNAs forms OL-like structures. Overall, the distribution ofOL-forming capacities seems random, with some indications of phyleticconservatism.
Table 1 presents the taxon-wide average percentage of OL-likestructures for the heavy strand DNA of the five WANCY tRNAs, themean−ΔG of OLs in these taxa, aswell as data for single species or gen-era when sequences with and without OL exist for that specific species/genus (the comparisons within genus are discussed separately in asection below). The formation of OL-like structures by tDNAs is, as ex-pected, on average larger in taxa lacking an OL than in the other taxaat four levels of taxonomic divergences, comparisons between families(Table 1, four last rows), within families, within genera, andwithin spe-cies (Table 1).
In general, tRNA Trp has among the five tRNAs the greatest capacityto formOL-like structures (Table 1). Data indicate that tRNA Cys has thehighest difference between mean capacities to form OL-like structuresin the presence versus the absence of OL. However, tRNA Trp has thegreatest OL-forming capacity in four among seven groups lacking OL(57%) and six among 15 groups with OL (40%), and either the highestor second highest in six among seven groups lacking OL (86%) and 13among 15 taxa with OL (87%). On the other hand, tRNA Ala forms rarelyOL-like structures in the wide majority of taxa, with the exception ofVaranus, where it evolved the capacity to form OL-like structures(discussed later). In addition, the difference in mean OL-formation ca-pacity by tDNAs between taxa with and without OL is largest for OLformation summed over all five tRNAs. In Sphenodon, which lacks OL(Seutin et al., 1994), the situation was similar to other taxa (lizardsand Amphisbaenia) lacking OL (Table 1).
3.1.1. OL-like structures with and without OL: comparisons withinAgamidae
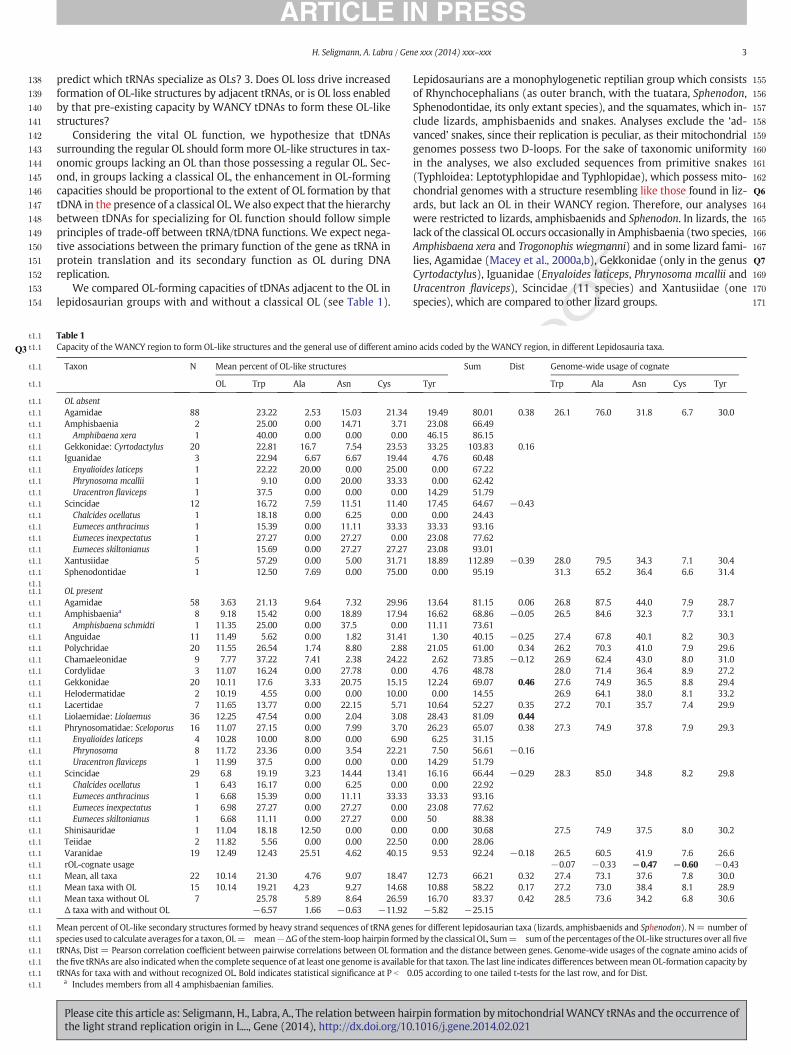
Agamidae is an extremely interesting lizard family, because itincludes variation in OL presence/absence (Table 1), which enablesmore meaningful evolutionary tests to understand the implication ofOL absence on tDNAs. The distribution of the presence/absence of OLin major agamid groups is shown in Fig. 2. As shown by Table 1, OL for-mation by tDNAs was, on average, weaker in taxa with an OL as com-pared to taxa lacking it, for all tDNAs. The effect was significant acrossall agamid groups using a sign test for tRNA Tyr (six among seven com-parisons, P = 0.03, one tailed sign test). These results are an indepen-dent confirmation of the trends found across different lepidosaurianfamilies; a negative association between OL presence and an enhancedcapacity for formation of OL-like structures by WANCY tDNAs. Notethat the differences between means of species with and without OL inFig. 2 correspond towhat is usually called phylogenetically independentcontrasts (Felsenstein, 1985).
rpin formation bymitochondrialWANCY tRNAs and the occurrence of.1016/j.gene.2014.02.021
Original text:
Inserted Text
"strictly "
Original text:
Inserted Text
","
Original text:
Inserted Text
"strictly "
Original text:
Inserted Text
"’"
Original text:
Inserted Text
"’"
Original text:
Inserted Text
"’"
Original text:
Inserted Text
"enabling "
Original text:
Inserted Text
"’"
Original text:
Inserted Text
"’"
Original text:
Inserted Text
"’"
Original text:
Inserted Text
"’"
Original text:
Inserted Text
" -"
Original text:
Inserted Text
"latter"
Original text:
Inserted Text
"latter"
Original text:
Inserted Text
"latter"
ECTED P
RO
OF
296
297
298
299
300
301
302
303
304
305
306
307
308
309
310
311
312
313
314
315
316
317
318
319
320
321
322
323
324
Δ
ΔΔΔΔΔ
Δ
ΔΔΔ
Δ
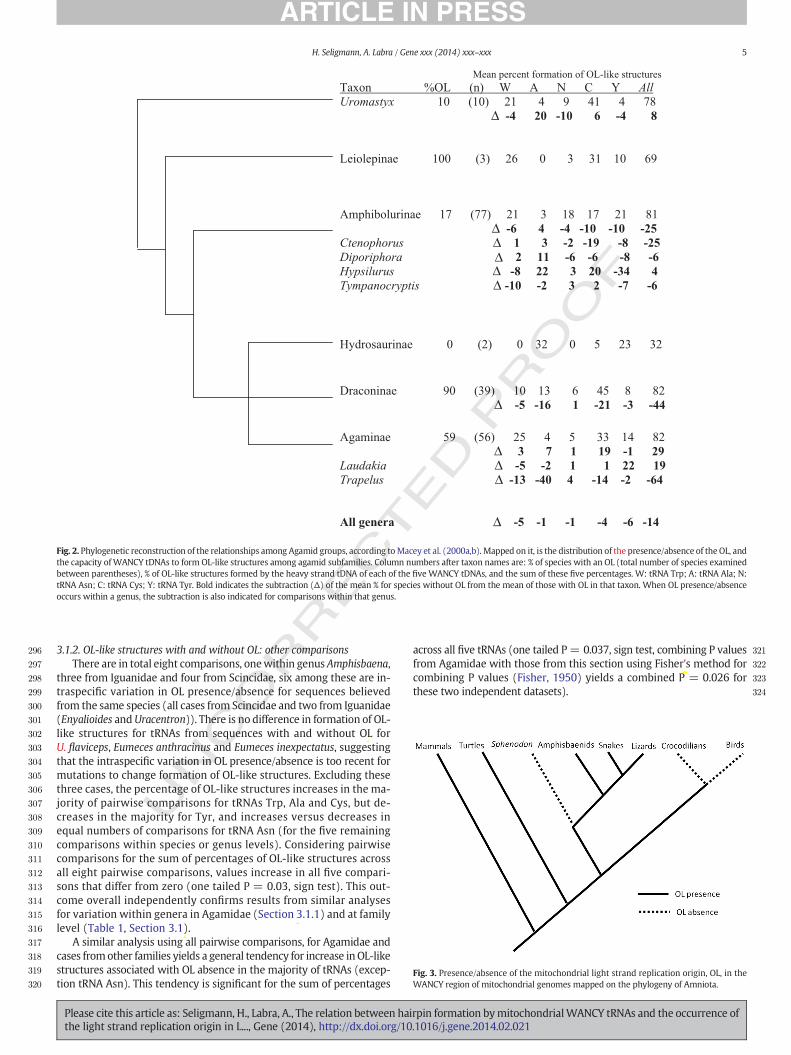
Fig. 2. Phylogenetic reconstruction of the relationships among Agamid groups, according toMacey et al. (2000a,b). Mapped on it, is the distribution of the presence/absence of the OL, andthe capacity ofWANCY tDNAs to form OL-like structures among agamid subfamilies. Column numbers after taxon names are: % of species with an OL (total number of species examinedbetween parentheses), % of OL-like structures formed by the heavy strand tDNA of each of the five WANCY tDNAs, and the sum of these five percentages. W: tRNA Trp; A: tRNA Ala; N:tRNA Asn; C: tRNA Cys; Y: tRNA Tyr. Bold indicates the subtraction (Δ) of the mean % for species without OL from the mean of those with OL in that taxon. When OL presence/absenceoccurs within a genus, the subtraction is also indicated for comparisons within that genus.
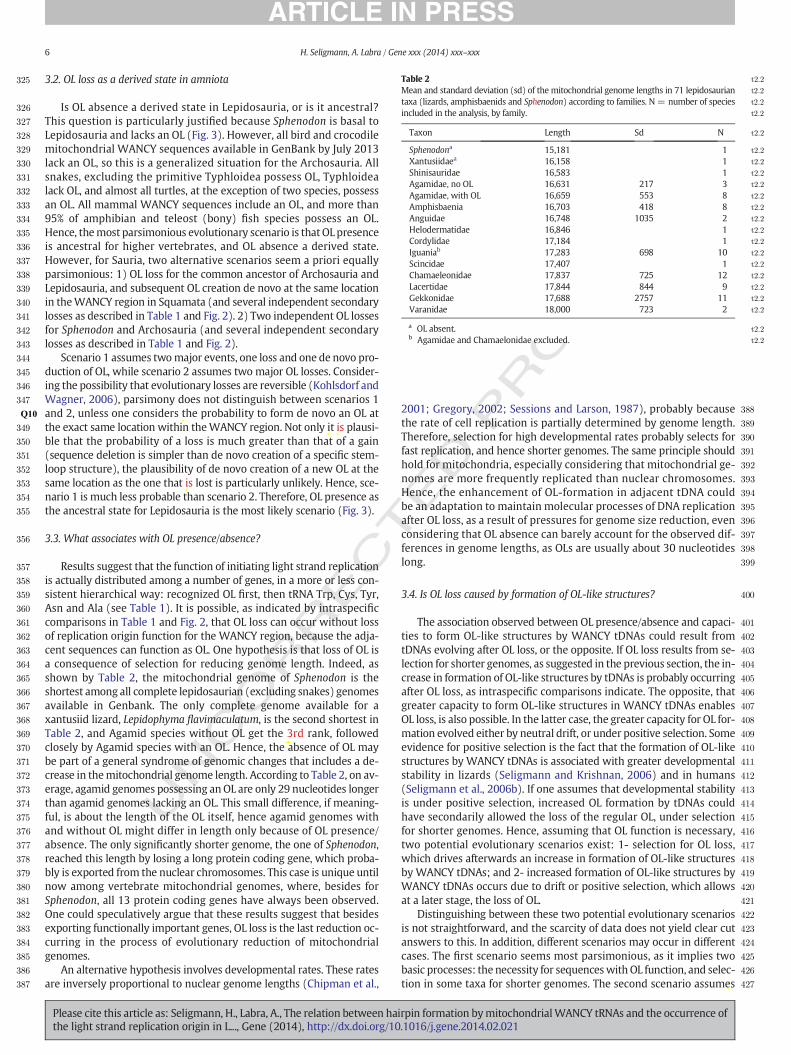
Fig. 3. Presence/absence of the mitochondrial light strand replication origin, OL, in theWANCY region of mitochondrial genomes mapped on the phylogeny of Amniota.
5H. Seligmann, A. Labra / Gene xxx (2014) xxx–xxx
UNCO
RR
3.1.2. OL-like structures with and without OL: other comparisonsThere are in total eight comparisons, onewithin genus Amphisbaena,
three from Iguanidae and four from Scincidae, six among these are in-traspecific variation in OL presence/absence for sequences believedfrom the same species (all cases from Scincidae and two from Iguanidae(Enyalioides andUracentron)). There is no difference in formation of OL-like structures for tRNAs from sequences with and without OL forU. flaviceps, Eumeces anthracinus and Eumeces inexpectatus, suggestingthat the intraspecific variation in OL presence/absence is too recent formutations to change formation of OL-like structures. Excluding thesethree cases, the percentage of OL-like structures increases in the ma-jority of pairwise comparisons for tRNAs Trp, Ala and Cys, but de-creases in the majority for Tyr, and increases versus decreases inequal numbers of comparisons for tRNA Asn (for the five remainingcomparisons within species or genus levels). Considering pairwisecomparisons for the sum of percentages of OL-like structures acrossall eight pairwise comparisons, values increase in all five compari-sons that differ from zero (one tailed P = 0.03, sign test). This out-come overall independently confirms results from similar analysesfor variation within genera in Agamidae (Section 3.1.1) and at familylevel (Table 1, Section 3.1).
A similar analysis using all pairwise comparisons, for Agamidae andcases fromother families yields a general tendency for increase inOL-likestructures associated with OL absence in the majority of tRNAs (excep-tion tRNA Asn). This tendency is significant for the sum of percentages
Please cite this article as: Seligmann, H., Labra, A., The relation between haithe light strand replication origin in L..., Gene (2014), http://dx.doi.org/10
across all five tRNAs (one tailed P= 0.037, sign test, combining P valuesfrom Agamidae with those from this section using Fisher's method forcombining P values (Fisher, 1950) yields a combined P = 0.026 forthese two independent datasets).
rpin formation bymitochondrialWANCY tRNAs and the occurrence of.1016/j.gene.2014.02.021
Original text:
Inserted Text
"Uracentron "
Original text:
Inserted Text
"3.2.1 "
Original text:
Inserted Text
"."
Original text:
Inserted Text
""
Original text:
Inserted Text
"’"
T
OO
F
325
326
327
328
329
330
331
332
333
334
335
336
337
338
339
340
341
342
343
344
345
346
347
348Q10
349
350
351
352
353
354
355
356
357
358
359
360
361
362
363
364
365
366
367
368
369
370
371
372
373
374
375
376
377
378
379
380
381
382
383
384
385
386
387
388
389
390
391
392
393
394
395
396
397
398
399
400
401
402
403
404
405
406
407
408
409
410
411
412
413
414
415
416
417
418
419
420
421
422
423
424
425
426
427
t2:2Table 2t2:2Mean and standard deviation (sd) of the mitochondrial genome lengths in 71 lepidosauriant2:2taxa (lizards, amphisbaenids and Sphenodon) according to families. N = number of speciest2:2included in the analysis, by family.
Taxon Length Sd N t2:2
Sphenodona 15,181 1 t2:2
Xantusiidaea 16,158 1 t2:2
Shinisauridae 16,583 1 t2:2
Agamidae, no OL 16,631 217 3 t2:2
Agamidae, with OL 16,659 553 8 t2:2
Amphisbaenia 16,703 418 8 t2:2
Anguidae 16,748 1035 2 t2:2
Helodermatidae 16,846 1 t2:2
Cordylidae 17,184 1 t2:2
Iguaniab 17,283 698 10 t2:2
Scincidae 17,407 1 t2:2
Chamaeleonidae 17,837 725 12 t2:2
Lacertidae 17,844 844 9 t2:2
Gekkonidae 17,688 2757 11 t2:2
Varanidae 18,000 723 2 t2:2
t2:2a OL absent.t2:2b Agamidae and Chamaelonidae excluded.
6 H. Seligmann, A. Labra / Gene xxx (2014) xxx–xxx
UNCO
RREC
3.2. OL loss as a derived state in amniota
Is OL absence a derived state in Lepidosauria, or is it ancestral?This question is particularly justified because Sphenodon is basal toLepidosauria and lacks an OL (Fig. 3). However, all bird and crocodilemitochondrial WANCY sequences available in GenBank by July 2013lack an OL, so this is a generalized situation for the Archosauria. Allsnakes, excluding the primitive Typhloidea possess OL, Typhloidealack OL, and almost all turtles, at the exception of two species, possessan OL. All mammal WANCY sequences include an OL, and more than95% of amphibian and teleost (bony) fish species possess an OL.Hence, themost parsimonious evolutionary scenario is that OL presenceis ancestral for higher vertebrates, and OL absence a derived state.However, for Sauria, two alternative scenarios seem a priori equallyparsimonious: 1) OL loss for the common ancestor of Archosauria andLepidosauria, and subsequent OL creation de novo at the same locationin theWANCY region in Squamata (and several independent secondarylosses as described in Table 1 and Fig. 2). 2) Two independent OL lossesfor Sphenodon and Archosauria (and several independent secondarylosses as described in Table 1 and Fig. 2).
Scenario 1 assumes twomajor events, one loss and one de novo pro-duction of OL, while scenario 2 assumes two major OL losses. Consider-ing the possibility that evolutionary losses are reversible (Kohlsdorf andWagner, 2006), parsimony does not distinguish between scenarios 1and 2, unless one considers the probability to form de novo an OL atthe exact same location within theWANCY region. Not only it is plausi-ble that the probability of a loss is much greater than that of a gain(sequence deletion is simpler than de novo creation of a specific stem-loop structure), the plausibility of de novo creation of a new OL at thesame location as the one that is lost is particularly unlikely. Hence, sce-nario 1 is much less probable than scenario 2. Therefore, OL presence asthe ancestral state for Lepidosauria is the most likely scenario (Fig. 3).
3.3. What associates with OL presence/absence?
Results suggest that the function of initiating light strand replicationis actually distributed among a number of genes, in a more or less con-sistent hierarchical way: recognized OL first, then tRNA Trp, Cys, Tyr,Asn and Ala (see Table 1). It is possible, as indicated by intraspecificcomparisons in Table 1 and Fig. 2, that OL loss can occur without lossof replication origin function for the WANCY region, because the adja-cent sequences can function as OL. One hypothesis is that loss of OL isa consequence of selection for reducing genome length. Indeed, asshown by Table 2, the mitochondrial genome of Sphenodon is theshortest among all complete lepidosaurian (excluding snakes) genomesavailable in Genbank. The only complete genome available for axantusiid lizard, Lepidophyma flavimaculatum, is the second shortest inTable 2, and Agamid species without OL get the 3rd rank, followedclosely by Agamid species with an OL. Hence, the absence of OL maybe part of a general syndrome of genomic changes that includes a de-crease in themitochondrial genome length. According to Table 2, on av-erage, agamid genomes possessing anOL are only 29 nucleotides longerthan agamid genomes lacking an OL. This small difference, if meaning-ful, is about the length of the OL itself, hence agamid genomes withand without OL might differ in length only because of OL presence/absence. The only significantly shorter genome, the one of Sphenodon,reached this length by losing a long protein coding gene, which proba-bly is exported from the nuclear chromosomes. This case is unique untilnow among vertebrate mitochondrial genomes, where, besides forSphenodon, all 13 protein coding genes have always been observed.One could speculatively argue that these results suggest that besidesexporting functionally important genes, OL loss is the last reduction oc-curring in the process of evolutionary reduction of mitochondrialgenomes.
An alternative hypothesis involves developmental rates. These ratesare inversely proportional to nuclear genome lengths (Chipman et al.,
Please cite this article as: Seligmann, H., Labra, A., The relation between haithe light strand replication origin in L..., Gene (2014), http://dx.doi.org/10
ED P
R
2001; Gregory, 2002; Sessions and Larson, 1987), probably becausethe rate of cell replication is partially determined by genome length.Therefore, selection for high developmental rates probably selects forfast replication, and hence shorter genomes. The same principle shouldhold for mitochondria, especially considering that mitochondrial ge-nomes are more frequently replicated than nuclear chromosomes.Hence, the enhancement of OL-formation in adjacent tDNA couldbe an adaptation to maintain molecular processes of DNA replicationafter OL loss, as a result of pressures for genome size reduction, evenconsidering that OL absence can barely account for the observed dif-ferences in genome lengths, as OLs are usually about 30 nucleotideslong.
3.4. Is OL loss caused by formation of OL-like structures?
The association observed between OL presence/absence and capaci-ties to form OL-like structures by WANCY tDNAs could result fromtDNAs evolving after OL loss, or the opposite. If OL loss results from se-lection for shorter genomes, as suggested in the previous section, the in-crease in formation of OL-like structures by tDNAs is probably occurringafter OL loss, as intraspecific comparisons indicate. The opposite, thatgreater capacity to form OL-like structures in WANCY tDNAs enablesOL loss, is also possible. In the latter case, the greater capacity for OL for-mation evolved either by neutral drift, or under positive selection. Someevidence for positive selection is the fact that the formation of OL-likestructures by WANCY tDNAs is associated with greater developmentalstability in lizards (Seligmann and Krishnan, 2006) and in humans(Seligmann et al., 2006b). If one assumes that developmental stabilityis under positive selection, increased OL formation by tDNAs couldhave secondarily allowed the loss of the regular OL, under selectionfor shorter genomes. Hence, assuming that OL function is necessary,two potential evolutionary scenarios exist: 1- selection for OL loss,which drives afterwards an increase in formation of OL-like structuresby WANCY tDNAs; and 2- increased formation of OL-like structures byWANCY tDNAs occurs due to drift or positive selection, which allowsat a later stage, the loss of OL.
Distinguishing between these two potential evolutionary scenariosis not straightforward, and the scarcity of data does not yield clear cutanswers to this. In addition, different scenarios may occur in differentcases. The first scenario seems most parsimonious, as it implies twobasic processes: the necessity for sequenceswith OL function, and selec-tion in some taxa for shorter genomes. The second scenario assumes
rpin formation bymitochondrialWANCY tRNAs and the occurrence of.1016/j.gene.2014.02.021
Original text:
Inserted Text
"that "
Original text:
Inserted Text
"is "
Original text:
Inserted Text
"as "
Original text:
Inserted Text
"as "
Original text:
Inserted Text
"3d "
Original text:
Inserted Text
""
TED P
RO
OF
428
429
430
431
432
433Q11
434
435
436
437
438
439Q12
440
441
442
443
444
445
446
447
448
449
450
451
452
453
454
455
456
457
458
459
460
461
462
463
464
465
466
467
468
469
470
471
472
473
474
475
476
477
478
479
480
481
482
483
484
485
486
487
488
489
490
491
492
493
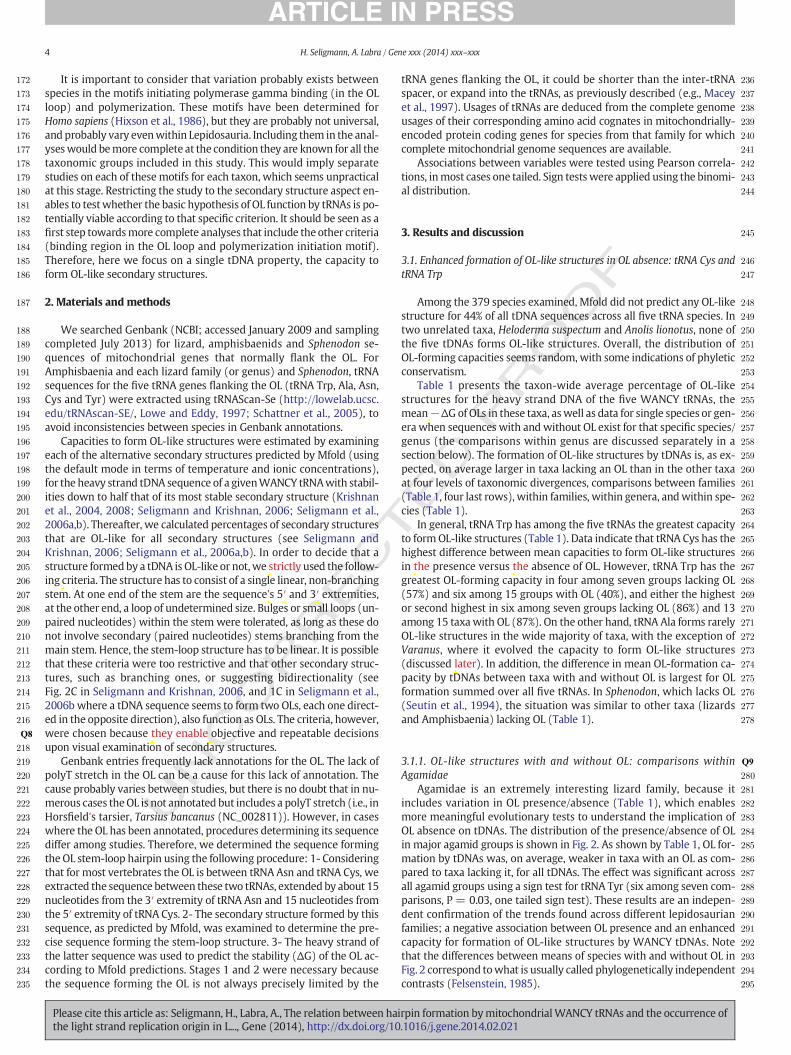
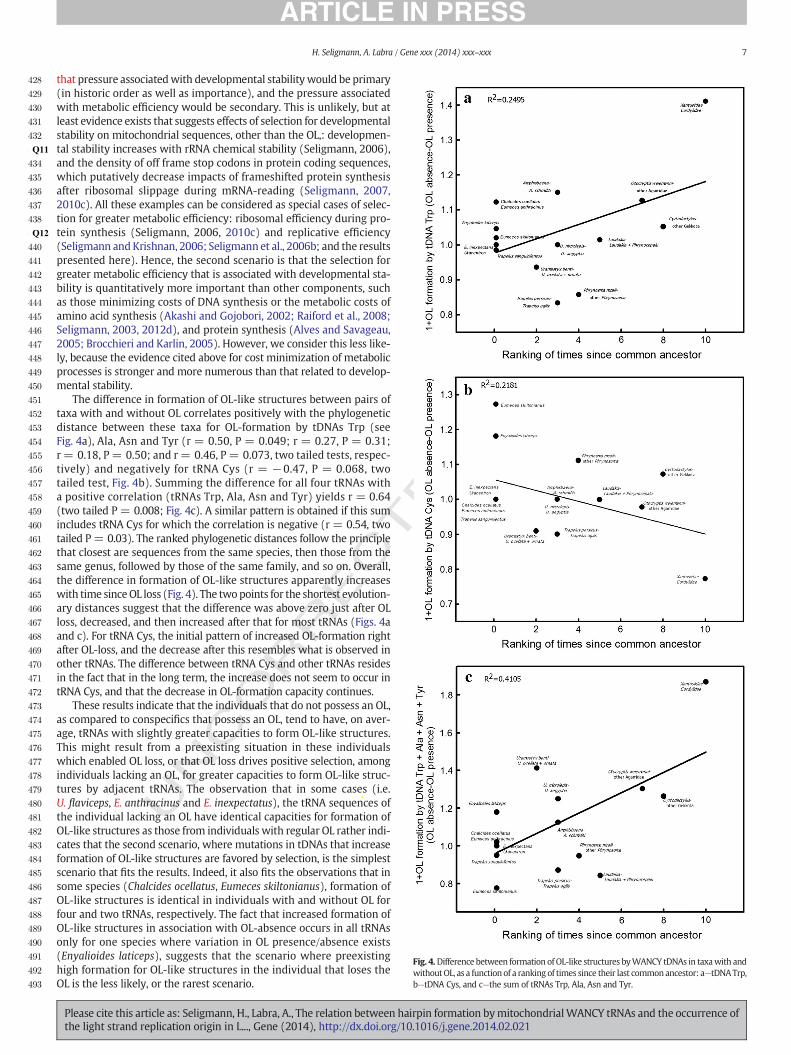
Fig. 4.Difference between formation ofOL-like structures byWANCY tDNAs in taxawith andwithoutOL, as a functionof a ranking of times since their last commonancestor: a—tDNATrp,b—tDNA Cys, and c—the sum of tRNAs Trp, Ala, Asn and Tyr.
7H. Seligmann, A. Labra / Gene xxx (2014) xxx–xxx
UNCO
RREC
that pressure associatedwith developmental stabilitywould be primary(in historic order as well as importance), and the pressure associatedwith metabolic efficiency would be secondary. This is unlikely, but atleast evidence exists that suggests effects of selection for developmentalstability on mitochondrial sequences, other than the OL,: developmen-tal stability increases with rRNA chemical stability (Seligmann, 2006),and the density of off frame stop codons in protein coding sequences,which putatively decrease impacts of frameshifted protein synthesisafter ribosomal slippage during mRNA-reading (Seligmann, 2007,2010c). All these examples can be considered as special cases of selec-tion for greater metabolic efficiency: ribosomal efficiency during pro-tein synthesis (Seligmann, 2006, 2010c) and replicative efficiency(Seligmann andKrishnan, 2006; Seligmann et al., 2006b; and the resultspresented here). Hence, the second scenario is that the selection forgreater metabolic efficiency that is associated with developmental sta-bility is quantitatively more important than other components, suchas those minimizing costs of DNA synthesis or the metabolic costs ofamino acid synthesis (Akashi and Gojobori, 2002; Raiford et al., 2008;Seligmann, 2003, 2012d), and protein synthesis (Alves and Savageau,2005; Brocchieri and Karlin, 2005). However, we consider this less like-ly, because the evidence cited above for cost minimization of metabolicprocesses is stronger and more numerous than that related to develop-mental stability.
The difference in formation of OL-like structures between pairs oftaxa with and without OL correlates positively with the phylogeneticdistance between these taxa for OL-formation by tDNAs Trp (seeFig. 4a), Ala, Asn and Tyr (r = 0.50, P = 0.049; r = 0.27, P = 0.31;r = 0.18, P= 0.50; and r= 0.46, P = 0.073, two tailed tests, respec-tively) and negatively for tRNA Cys (r = −0.47, P = 0.068, twotailed test, Fig. 4b). Summing the difference for all four tRNAs witha positive correlation (tRNAs Trp, Ala, Asn and Tyr) yields r = 0.64(two tailed P = 0.008; Fig. 4c). A similar pattern is obtained if this sumincludes tRNA Cys for which the correlation is negative (r = 0.54, twotailed P= 0.03). The ranked phylogenetic distances follow the principlethat closest are sequences from the same species, then those from thesame genus, followed by those of the same family, and so on. Overall,the difference in formation of OL-like structures apparently increaseswith time sinceOL loss (Fig. 4). The twopoints for the shortest evolution-ary distances suggest that the difference was above zero just after OLloss, decreased, and then increased after that for most tRNAs (Figs. 4aand c). For tRNA Cys, the initial pattern of increased OL-formation rightafter OL-loss, and the decrease after this resembles what is observed inother tRNAs. The difference between tRNA Cys and other tRNAs residesin the fact that in the long term, the increase does not seem to occur intRNA Cys, and that the decrease in OL-formation capacity continues.
These results indicate that the individuals that do not possess an OL,as compared to conspecifics that possess an OL, tend to have, on aver-age, tRNAs with slightly greater capacities to form OL-like structures.This might result from a preexisting situation in these individualswhich enabled OL loss, or that OL loss drives positive selection, amongindividuals lacking an OL, for greater capacities to form OL-like struc-tures by adjacent tRNAs. The observation that in some cases (i.e.U. flaviceps, E. anthracinus and E. inexpectatus), the tRNA sequences ofthe individual lacking an OL have identical capacities for formation ofOL-like structures as those from individuals with regular OL rather indi-cates that the second scenario, where mutations in tDNAs that increaseformation of OL-like structures are favored by selection, is the simplestscenario that fits the results. Indeed, it also fits the observations that insome species (Chalcides ocellatus, Eumeces skiltonianus), formation ofOL-like structures is identical in individuals with and without OL forfour and two tRNAs, respectively. The fact that increased formation ofOL-like structures in association with OL-absence occurs in all tRNAsonly for one species where variation in OL presence/absence exists(Enyalioides laticeps), suggests that the scenario where preexistinghigh formation for OL-like structures in the individual that loses theOL is the less likely, or the rarest scenario.
Please cite this article as: Seligmann, H., Labra, A., The relation between hairpin formation bymitochondrialWANCY tRNAs and the occurrence ofthe light strand replication origin in L..., Gene (2014), http://dx.doi.org/10.1016/j.gene.2014.02.021
Original text:
Inserted Text
"Uracentron "
Original text:
Inserted Text
"Eumeces "
Original text:
Inserted Text
"Eumeces "
Original text:
Inserted Text
""
Original text:
Inserted Text
"Eumeces "
Original text:
Inserted Text
"s"
T
494
495
496
497
498
499
500
501
502
503
504
505
506
507
508
509
510
511
512
513
514
515
516
517
518
519
520
521
522
523
524
525
526
527
528
529
530
531
532
533
534
535
536
537
538
539
540
541
542
543
544
545
546
547
548
549
550
551
552
553
554
555
556
557
558
559
560
561
562
563
564
565
566
567
568
569
570
571
572
573
574
575
576
577
578
579
580
581
582
583
584
585
586
587
588
589
590
591
592
593
594
595
596
597
598
599
600
601
602
603
604
605
606
607
608
609
610
611
612
613
614
615
8 H. Seligmann, A. Labra / Gene xxx (2014) xxx–xxx
UNCO
RREC
3.5. Evolutionary variation in formation of OL-like structures by tDNAs
In Helodermatidae, OL function is more or less fulfilled only by theregular OL, while in most other groups in Table 1 several tRNAs havethe capacity to form OL-like structures. In most tRNAs, variation existsin the extents of OL-forming capacities, independently of phylogeneticaffiliations, suggesting multiple gains and losses of OL function foreach tDNA. This principle is valid alsowithin families, resembling resultspreviously reported for primates (Seligmann et al., 2006a). In Liolaemus,for example, tDNA of tRNA Trp does not form OL-like structures inL. lutzae. However, 20% of the structures formed by that tDNA are OL-like in L. dorbignyi and L. ruibali, up to 83% in L. chiliensis and L. tenuisand 92% for L. ornatus. For 27 among 36 Liolaemus species included inthis study, tRNA Ala forms no OL-like structures, but it forms 60% and50% OL-like structures in L. chaltin and L. fabiani, respectively. InLiolaemus, the minimal OL-forming tendency is null also for tRNA Cysand tRNA Asn, and 14% for tRNA Tyr. The maximum is 63% for tRNACys, 83% for tRNA Tyr and 90% for tRNAAsn. Results suggest that the ca-pacity to formOL-like structures is highly unstable from an evolutionarypoint of view because it varies widely, even among closely relatedspecies.
3.6. Tradeoffs for OL function
The tendency of a tRNA to function as OL may be predicted by threetRNA properties: 1- The relative importance of their primary function astRNAs in protein synthesis, expecting tRNAs with rare cognates to formmore OL-like structures. 2- If coding for the tRNA and the OL function issplit between different DNA strands of the same tRNA gene. In this way,fewer constraints should be associated with each function than whenthe same DNA strand fulfills both functions. 3- Formation of severalOL-like structures within a short range on the heavy strand DNAmight create steric and other interactions that could perturb properOL function by any of the potential alternative OL-like structures.
3.6.1. Property 1: Amino acid usageThis predicts negative correlations between the mitochondrial
genome-wide usage of the cognate amino acid of a tRNA and formationof OL-like structures by its tDNA. For example, the only group wheretRNA Ala has a relatively high capacity for formation of OL-like struc-tures, Varanidae, has the lowest genome-wide usage for that aminoacid among the Lepidosauria included here. This negative correlationwas confirmed independently at two levels. First, comparisons of ho-mologous tRNA genes in different families show that the family meancapacity to form OL-like structures is negatively correlated with familymean cognate amino acid usage in three among five tRNAs (tRNA Asn,r = −0.47, P = 0.033, tRNA Cys, r = −0.60, P = 0.007 and tRNA Tyr,r = −0.43, P = 0.049, one tailed tests). Although correlations werenot significant in the two remaining tRNAs, they were also negative(tRNA Trp, r = −0.07, P = 0.40; tRNA Ala, r = −0.33, P = 0.11, onetailed tests). Second, comparing non-homologous tRNA species withinthe same taxon, tRNAs Trp and Cys, which have the highest capacitiesto form OL-like structures, have the rarest cognate amino acids, whiletRNA Ala only rarely forms OL-like structures, and has the most com-mon cognate amino acid among all WANCY tRNAs (Table 1).
3.6.2. Property 2: Coding strand and OL formationHere, the prediction is that for tRNA genes whose light strand tem-
plates for the expressed tRNA, their heavy strand DNA is more free toevolve the secondary function as OL than in tRNA genes where thestrand expressed as tRNA is the heavy strand tRNA, which hence hasto fulfill both tRNA and OL functions. The only light strand-expressedtRNA in the WANCY region is tRNA Trp, which indeed, according toour results (see Table 1 and Fig. 2) has the highest capacity to formOL-like structures. The fact that in the absence of the regular OL, the in-crease in OL formation capacity is lower than for tRNA Cys might be
Please cite this article as: Seligmann, H., Labra, A., The relation between haithe light strand replication origin in L..., Gene (2014), http://dx.doi.org/10
ED P
RO
OF
because tRNA Trp has already a high capacity in the presence of an OL,and also because genome-wide Trp usage is greater than for Cys.
3.6.3. Property 3: Steric interactionsThis principle, as the abovementioned property 2, is related to struc-
tural constraints on a single DNA strand. This predicts that the capacityto formOL-like structures for two genes should be inversely proportion-al to proximity between them. The Pearson correlation coefficientmatrix between formation of OL-like structures by tRNAs, and withthe -ΔG of the OL where it is present, is proportional to the distance be-tween genes (column ‘Dist’ in Table 1). Though for half the families, thecorrelation in Dist is positive, the only significant cases are for positivecorrelations (Liolaemus and Sceloporus), which coincide with the largestsample sizes. For taxawith small samples, Dist does not differ statistical-ly from zero, which is predictable because of enhanced effects of sam-pling error due to small sample sizes. These results indicate that themost positive correlations are usually between tRNA Trp and tRNATyr, which are at opposite extremities of the WANCY region, and themost negative correlations are between adjacent gene pairs.
3.7. Robustness of estimates of OL formation capacities
Data indicate that our estimates of the structure of correlationmatri-ces between OL formation capacities are repeatable, as we get similarresults for different families for which we analyzed a reasonable num-ber of taxa (e.g., Liolaemidae, Phrynosomatidae, Polychridae). This re-peatability suggests that the method used to estimate capacities of OLformation is robust, despite sampling biases due to relatively small sam-ples (i.e., b200 species in a genus, see Steppan, 1997), and the lack ofphylogenetic correction when calculating correlations. In addition, thepercentage of OL-like structures among all secondary structures includ-ed, does not take into account the different stabilities of the variousstructures: if, for example, we obtained a single OL-like structureamong 10 alternative secondary structures, ourmethod does not distin-guish between cases where this OL-like structure is themost versus theleast stable one. Further calculations integrating over theΔGs of the sec-ondary structures are possible.
The issue of inaccuracies in secondary structure prediction as addingnoise and hence not being responsible for the (repeatable) positive re-sults described here, has been already discussed (Krishnan et al.,2008). The major point is that inaccuracies in predictions are very un-likely to produce similar results in independent cases. In addition, a pre-vious study that compared the rough percentages such as those usedhere, and calculations integrating over ΔGs, showed similar results forboth calculationmethods, but that the rough estimates tend to fit slight-ly better predictions than the presumably more precise calculations(Seligmann and Krishnan, 2006). This might be because the precise cal-culations rely more heavily on parameters required for predicting ΔGsand the Boltzmann distribution of secondary structures. However,these parameters are usually not available: temperature, ionic concen-trations, and interactions of the OL-forming sequences with unknownmolecules that might enhance or prevent OL formation, or alter thestabilities of the OL-like structures. Even for a relatively well-known pa-rameter, temperature, this can be problematic, as ranges and distribu-tions of body temperatures have to be equally well-known for all thetaxa considered, which is even more complicated when restrictionsneed to be included (e.g. season of activity, sex, reproductive condition).Even in ‘homeotherms’ body temperature varies between body parts(i.e. the body trunk vs. appendages). In this context, we suggest thatin the absence of adequate precise information, the rough methodused is most adequate for qualitative answers.
4. General conclusions
Formation of OL-like structures by tRNA genes is greater inlepidosaurian mitochondria lacking OL, interpreted as most frequently
rpin formation bymitochondrialWANCY tRNAs and the occurrence of.1016/j.gene.2014.02.021
Original text:
Inserted Text
"s"
Original text:
Inserted Text
"s"
Original text:
Inserted Text
"s"
Original text:
Inserted Text
" "
Original text:
Inserted Text
" "
T
616
617
618
619
620
621
622
623
624
625
626
627
628
629
630
631Q13
632Q14
633
634
635
636
637
638
639
640
641
642
643644645646647648649650651652653654655656657658659660661662663664665666667668669670671672673674675676677678679680681682683684
685686687688689690691692693694695696697698699700701702703704705706707708709710711712713714715716717718719720721722723724725726727728729730731732733734735736737738739740741742743744745746747748749750751752753754755756757758759760761762763764765766767768769770
9H. Seligmann, A. Labra / Gene xxx (2014) xxx–xxx
UNCO
RREC
resulting from OL loss. Though patterns in data are not conclusive, theysuggest that this greater capacity usually develops after OL loss, ratherthan precludes it. Hence OL-loss would drive selection for greater ca-pacities to form OL-like hairpins by tDNAs in the vicinity of the regularOL, and adjacent tDNAs compensate for OL absence. The increase information of OL-like structures by tDNAs includes complex patterns ofinteraction between tDNAgenes,which involve an avoidance of compe-tition between different tRNA genes and between different functions ofa tRNA gene. This suggests that the evolution of secondary functions,and of the multi-gene complex that functions as OL is not random, butfollow simple functional principles. In most multi-gene complexes, thevarious genes are not interchangeable, but code for different parts ofthe functional complex. In this particular case, the situation is simplifiedbecause any gene can function as an OL, which gives a special opportu-nity to study the evolution of gene interactions and their evolution inmulti-gene complexes.
5. Uncited references
Reyes et al., 1998Seligmann, 2011bSeligmann, 2012eSeligmann, 2012f
Acknowledgments
We thank Thomas F. Hansen and all member of his lab at the Univer-sity of Oslo for discussing results, and to one anonymous reviewer forcomments. This project was partially funded by FONDECYT 1120181to AL.
References
Akashi, H., Gojobori, T., 2002. Metabolic efficiency and amino acid composition in theproteomes of Escherichia coli and Bacillus subtilis. Proceedings of the National Acade-my of Sciences of the United States of America 99, 3695–3700.
Alves, R., Savageau, M.A., 2005. Evidence of selection for low cognate amino acid bias inamino acid biosynthetic enzymes. Molecular Microbiology 56, 1017–1034.
Arquès, D.G., Michel, C.J., 1997. A code in the protein coding genes. Biosystems 44,107–134.
Brocchieri, L., Karlin, S., 2005. Protein length in eukaryotic and prokaryotic proteomes.Nucleic Acids Research 33, 3390–3400.
Chipman, A.D., Khaner, O., Haas, A., Tchernov, E., 2001. The evolution of genome size:what can be learned from anuran development? The Journal of Experimental Zoology291, 365–374.
Faure, E., Dealaye, L., Tribolo, S., Levasseur, A., Seligmann, H., Barthélémy, R.M., 2011.Probable presence of an ubiquitous cryptic mitochondrial gene on the antisensestrand of the cytochrome oxidase I gene. Biology Direct 6, 56.
Felsenstein, J., 1985. Phylogeneties and the comparative method. The American Naturalist125, 1–15.
Fisher, R.A., 1950. Statistical Methods for Research Workers, 11th ed. Oliver and Boyd,Edinburgh and London 99.
Fuste, J.M., et al., 2010. Mitochondrial RNA polymerase is needed for activation of the or-igin of light-strand DNA replication. Molecular Cell 37, 67–78.
Giegé, R., 2008. Toward a more complete view of tRNA biology. Nature Structural & Mo-lecular Biology 15, 1007–1014.
Gregory, T.R., 2002. Genome size and developmental parameters in the homeothermicvertebrates. Genome 45, 833–838.
Hassanin, A., Léger, N., Deutsch, J., 2005. Evidence for multiple reversals of asymmetricmutational constraints during the evolution of the mitochondrial genome of metazo-an, and consequences for phylogenetic inferences. Systematic Biology 54, 277–298.
Hixson, J.E., Wong, T.W., Clayton, D.A., 1986. Both the conserved stem-loop and divergent5′-flanking sequences are required for initiation at the humanmitochondrial origin oflight-strand DNA-replication. The Journal of Biological Chemistry 261, 2384–2390.
Kohlsdorf, T., Wagner, G.P., 2006. Evidence for reversibility of digit loss: a phylogeneticstudy of limb evolution in Bachia (Gymnophthalmidae: Squamata). Evolution 60,1896–1912.
Krishnan, N.M., Seligmann, H., Raina, S.Z., Pollock, D.D., 2004. Detecting gradients of asym-metry in site-specific substitutions in mitochondrial genomes. DNA and Cell Biology23, 707–714.
Krishnan, N.M., Seligmann, H., Rao, B.J., 2008. Relationship between mRNA secondarystructure and sequence variability in chloroplast genes: possible life history implica-tions. BMC Genomics 9, 48.
Lowe, T.M., Eddy, S.R., 1997. tRNAscan-SE: a program for improved detection of transferRNA genes in genomic sequence. Nucleic Acids Research 25, 955–964.
Please cite this article as: Seligmann, H., Labra, A., The relation between haithe light strand replication origin in L..., Gene (2014), http://dx.doi.org/10
ED P
RO
OF
Macey, J.R., Larson, A., Ananjeva, N.B., Fang, Z., Papenfuss, T.J., 1997. Two novel gene or-ders and the role of light-strand replication in rearrangement of the vertebrate mito-chondrial genome. Molecular Biology and Evolution 14, 91–104.
Macey, J.R., Schulte, J.A., Larson, A., 2000a. Evaluating transtethys migration: an exampleusing acrodont lizard phylogenetics. Systematic Biology 49, 233–256.
Macey, J.R., Schulte, J.A., Larson, A., 2000b. Evolution and phylogenetic information con-tent of mitochondrial genomic structural features illustrated with acrodont lizards.Systematic Biology 49, 257–277.
Maizels, N., Weiner, A.M., 1994. Phylogeny from function: evidence from the molec-ular fossil record that tRNA originated in replication, not translation. Proceedingsof the National Academy of Sciences of the United States of America 91,6729–6734.
Mueller, R.L., Macey, J.R., Jaekel, M., Wake, D.B., Boore, J.L., 2004. Morphological ho-moplasy, life history evolution, an historical biogeography of plethodontidsalamander inferred from complete mitochondrial genomes. Proceedings ofthe National Academy of Sciences of the United States of America 101,13820–13825.
Raiford, D.W., Heizer, E.M., Miller, R.V., Akashi, H., Raymer, M.L., Krane, D.E., 2008. Do Aminoacid biosynthetic costs constrain protein evolution in Saccharomyces cerevisiae? Journalof Molecular Evolution 67, 621–630.
Reyes, A., Gissi, C., Pesole, G., 1998. Asymmetrical directional mutation pressure inthe mitochondrial genome of mammals. Molecular Biology and Evolution 15,957–966.
Rhodakis, G.C., Cao, L.Q., Mizi, A., Kenchington, E.L.R., Zouros, E., 2007. Nucleotide contentgradients in maternally and paternally inherited mitochondrial genomes of the mus-sel Mytilus. Journal of Molecular Evolution 65, 124–136.
Schattner, P., Brooks, A.N., Loewe, T.M., 2005. The tRNAscan-SE, snoscan and snoGPS webservers for the detection of tRNAs and snoRNAs. Nucleic Acids Research 33,W686–W689.
Seligmann, H., 2003. Cost minimization of amino acid usage. Journal of Molecular Evolu-tion 56, 151–161.
Seligmann, H., 2007. Cost minimization of ribosomal frameshifts. Journal of TheoreticalBiology 249, 162–167.
Seligmann, H., 2008. Hybridization between mitochondrial heavy strand tDNA andexpressed light strand tRNA modulates the function of heavy strand tDNA as lightstrand replication origin. Journal of Molecular Biology 379, 188–199.
Seligmann, H., 2010a. Mitochondrial tRNAs as light strand replication origins: similaritybetween anticodon loops and the loop of the light strand replication origin predictsinitiation of DNA replication. Biosystems 99, 85–93.
Seligmann, H., 2010b. Avoidance of antisense, antiterminator tRNA anticodons in verte-brate mitochondria. Biosystems 101, 42–50.
Seligmann, H., 2010c. The ambush hypothesis at the whole-organism level: off-frame,‘hidden’ stops in vertebrate mitochondrial genes increase developmental stability.Computational Biology and Chemistry 34, 80–85.
Seligmann, H., 2011a. Two genetic codes, one genome: frameshifted primate mitochon-drial genes code for additional proteins in presence of antisense antiterminationtRNAs. Biosystems 105, 271–285.
Seligmann, H., 2011b. Mutation patterns due to convergingmitochondrial replication andtranscription increase lifespan, and cause growth rate longevity-tradeoffs. In:Seligmann, H. (Ed.), DNA Replication: Current Advances. InTech. http://dx.doi.org/10.5772/24319.
Seligmann, H., 2012a. Coding constraints modulate chemically spontaneous mutationalreplication gradients in mitochondrial genomes. Current Genomics 13, 34–57.
Seligmann, H., 2012b. An overlapping genetic code for frameshifted overlapping genes inDrosophila mitochondria: antisense antitermination tRNAs UAR insert serine. Journalof Theoretical Biology 298, 51–76.
Seligmann, H., 2012c. Overlapping genetic codes for overlapping frameshifted genes inTestudines, and Lepidochelys olivacea as special case. Computational Biology andChemistry 41, 18–34.
Seligmann, H., 2012d. Putative mitochondrial polypeptides coded by expanded quadru-plet codons, decoded by antisense tRNAs with unusual anticodons. Biosystems 110,84–106.
Seligmann, H., 2012e. Overlapping genes coded in the 3′-to-5′-direction in mitochondrialgenes and 3′-to-5′ polymerization of non-complementary RNA by an ‘invertase’.Journal of Theoretical Biology 315, 38–52.
Seligmann, H., 2012f. Positive and negative cognate amino acid bias affects compositionsof aminoacyl-tRNA synthetases and reflects functional constraints on protein struc-ture. BIO 2, 11–26.
Seligmann, H., 2013a. Putative anticodons in mitochondrial tRNA sidearm loops: pocket-knife tRNAs? Journal of Theoretical Biology 340, 155–163.
Seligmann, H., 2013b. Pocketknife tRNA hypothesis: anticodons inmammal mitochondri-al tRNA side-arm loops translate proteins? Biosystems 113, 165–176.
Seligmann, H., 2013c. Triplex DNA:RNA, 3′-to-5′ inverted RNA and protein coding in mi-tochondrial genomes. Journal of Computational Biology 20, 660–671.
Seligmann, H., 2013d. Systematic asymmetric nucleotide exchanges produce human mi-tochondrial RNAs cryptically encoding for overlapping protein coding genes. Journalof Theoretical Biology 324, 1–20.
Seligmann, H., 2013e. Polymerization of non-complementary RNA: systematic symmetricnucleotide exchanges mainly involving uracil produce mitochondrial RNA transcriptscoding for cryptic overlapping genes. Biosystems 111, 156–174.
Seligmann, H., 2013f. Replicational mutation gradients, dipolemoments, nearest neighboreffects and DNA polymerase gamma fidelity in human mitochondrial genomes. In:Stuart, D. (Ed.), The Mechanisms of DNA Replication. InTech. http://dx.doi.org/10.5772/51245.
Seligmann, H., Krishnan, N.M., 2006. Mitochondrial replication origin stability and pro-pensity of adjacent tRNA genes to form putative replication origins increase
rpin formation bymitochondrialWANCY tRNAs and the occurrence of.1016/j.gene.2014.02.021
Original text:
Inserted Text
"are "
Original text:
Inserted Text
"'"
Original text:
Inserted Text
"’"
Original text:
Inserted Text
"’"
Original text:
Inserted Text
"’"
Original text:
Inserted Text
"’"
Original text:
Inserted Text
"’"
Original text:
Inserted Text
"’"
771772773774775776777778779780781782783784
785786787788789790791792793794795796797798
799
10 H. Seligmann, A. Labra / Gene xxx (2014) xxx–xxx
developmental stability in lizards. Journal of Experimental Zoology Part B: Molecularand Developmental Evolution 306, 433–449.
Seligmann, H., Labra, A., 2013. Tetracoding increases with body temperature inLepidosauria. Biosystems 114, 155–163.
Seligmann, H., Krishnan, N.M., Rao, B.J., 2006a. Possible multiple origins of replication inprimate mitochondria: alternative role of tRNA sequences. Journal of Theoretical Bi-ology 241, 321–332.
Seligmann, H., Krishnan, N.M., Rao, B.J., 2006b. Mitochondrial tRNA sequences as unusualreplication origins: pathogenic implications for Homo sapiens. Journal of TheoreticalBiology 243, 375–385.
Sessions, S.K., Larson, A., 1987. Developmental correlates of genome size in plethodontidsalamanders and their implications for genome evolution. Evolution 41, 1239–1251.
Seutin, G., Lang, B.F., Mindell, D.P., Morais, R., 1994. Evolution of theWANCY region in am-niote mitochondrial DNA. Molecular Biology and Evolution 11, 329–340.
UNCO
RRECT
Please cite this article as: Seligmann, H., Labra, A., The relation between haithe light strand replication origin in L..., Gene (2014), http://dx.doi.org/10
Steppan, S.J., 1997. Phylogenetic analysis of phenotypic covariance structure. 1. Contrast-ing results from matrix correlation and common principal component analyses. Evo-lution 51, 571–586.
Stergachis, A.B., et al., 2013. Exonic transcription factor binding directs codon choice andaffects protein evolution. Science 342, 1367–1372.
Tanaka, M., Ozawa, T., 1994. Strand asymmetry in human mitochondrial DNA mutations.Genomics 22, 327–335.
Wanrooij, S., Falkenberg, M., 2010. The human mitochondrial replication fork in healthand disease. Biochimica et Biophysica Acta 1797, 1378–1388.
Yu, C.H., Liao, J.Y., Zhou, H., Qu, L.H., 2008. The rat mitochondrial Ori L encodes a novelsmall RNA resembling an ancestral tRNA. Biochemical and Biophysical Research Com-munications 372, 634–638.
Zuker, M., 2003. Mfold web server for nucleic acid folding and hybridization prediction.Nucleic Acids Research 31, 3406–3415.
ED P
RO
OF
rpin formation bymitochondrialWANCY tRNAs and the occurrence of.1016/j.gene.2014.02.021
Related Documents