arXiv:astro-ph/0508254v1 11 Aug 2005 The Reddening of Red Supergiants: When Smoke Gets in Your Eyes Philip Massey 1,2 , Bertrand Plez 3 , Emily M. Levesque 4 , K. A. G. Olsen 5 , Geoffrey C. Clayton 6 , Eric Josselin 3 ABSTRACT Deriving the physical properties of red supergiants (RSGs) depends upon accurate corrections for reddening by dust. We use our recent modeling of the optical spectra of RSGs to address this topic. First, we find that previous broad- band studies have underestimated the correction for extinction in the visible, and hence the luminosities (if derived from V ); the shift in the effective wavelengths of the standard B and V bandpasses necessitates using an effective value of the ratio R ′ V =4.2 to correct broad-band photometry of RSGs if R V =3.1 for early- type stars viewed through the same dust, where we have assumed the standard reddening law of Cardelli, Clayton, & Mathis (1989). Use of the Fitzpatrick (1999) reddening law would lead to R ′ V =3.8, as well as slightly lower values of extinction derived from spectrophotometry, but results in slightly poorer fits. Second, we find that a significant fraction of RSGs in Galactic OB associations and clusters show up to several magnitudes of excess visual extinction compared to OB stars in the same regions; we argue that this is likely due to circumstellar dust around the RSGs. We also show that the RSG dust production rate (as indicated by the 12-μm excess) is well-correlated with bolometric luminosity, contrary to what has been found by earlier studies. The stars with the highest amount of extra visual extinction also show significant near-UV (NUV) excesses 1 Lowell Observatory, 1400 W. Mars Hill Rd., Flagstaff, AZ 86001. 2 Visiting Observer, Kitt Peak National Observatory, National Optical Astronomy Observatory, which is operated by the Association of Universities for Research in Astronomy, Inc., under cooperative agreement with the National Science Foundation. 3 GRAAL, CNRS, Universit´ e de Montpellier II, 34095 Montpellier Cedex 05, France. 4 Massachusetts Institute of Technology, 77 Massachusetts Avenue, Cambridge, MA 02139. 5 Cerro Tololo Inter-American Observatory, National Optical Astronomy Observatory, Casilla 603, La Serena, Chile. 6 Department of Physics and Astronomy, Louisiana State University, Baton Rouge, LA 70803.

Welcome message from author
This document is posted to help you gain knowledge. Please leave a comment to let me know what you think about it! Share it to your friends and learn new things together.
Transcript
arX
iv:a
stro
-ph/
0508
254v
1 1
1 A
ug 2
005
The Reddening of Red Supergiants:
When Smoke Gets in Your Eyes
Philip Massey1,2, Bertrand Plez3, Emily M. Levesque4, K. A. G. Olsen5, Geoffrey C.
Clayton6, Eric Josselin3
ABSTRACT
Deriving the physical properties of red supergiants (RSGs) depends upon
accurate corrections for reddening by dust. We use our recent modeling of the
optical spectra of RSGs to address this topic. First, we find that previous broad-
band studies have underestimated the correction for extinction in the visible, and
hence the luminosities (if derived from V ); the shift in the effective wavelengths
of the standard B and V bandpasses necessitates using an effective value of the
ratio R′
V = 4.2 to correct broad-band photometry of RSGs if RV = 3.1 for early-
type stars viewed through the same dust, where we have assumed the standard
reddening law of Cardelli, Clayton, & Mathis (1989). Use of the Fitzpatrick
(1999) reddening law would lead to R′
V = 3.8, as well as slightly lower values
of extinction derived from spectrophotometry, but results in slightly poorer fits.
Second, we find that a significant fraction of RSGs in Galactic OB associations
and clusters show up to several magnitudes of excess visual extinction compared
to OB stars in the same regions; we argue that this is likely due to circumstellar
dust around the RSGs. We also show that the RSG dust production rate (as
indicated by the 12-µm excess) is well-correlated with bolometric luminosity,
contrary to what has been found by earlier studies. The stars with the highest
amount of extra visual extinction also show significant near-UV (NUV) excesses
1Lowell Observatory, 1400 W. Mars Hill Rd., Flagstaff, AZ 86001.
2Visiting Observer, Kitt Peak National Observatory, National Optical Astronomy Observatory, which is
operated by the Association of Universities for Research in Astronomy, Inc., under cooperative agreement
with the National Science Foundation.
3GRAAL, CNRS, Universite de Montpellier II, 34095 Montpellier Cedex 05, France.
4Massachusetts Institute of Technology, 77 Massachusetts Avenue, Cambridge, MA 02139.
5Cerro Tololo Inter-American Observatory, National Optical Astronomy Observatory, Casilla 603, La
Serena, Chile.
6Department of Physics and Astronomy, Louisiana State University, Baton Rouge, LA 70803.
– 2 –
compared to the stellar models reddened by the standard reddening law. This
NUV excess is likely due to scattering of the star’s light by the dust and/or a
larger average grain size than that typical of grains found in the diffuse interstellar
medium. Similar excesses have been attributed to circumstellar dust around R
Coronae Borealis stars. Finally, we estimate that the RSGs contribute dust grains
at the rate of 3 × 10⁻⁸M⊙ yr−1 kpc−2 in the solar neighborhood, comparable
to what we estimate for late-type WCs, 1 × 10⁻⁷M⊙ yr−1 kpc−2. In the solar
neighborhood this represents only a few percent of the dust production (which is
dominated by low-mass AGBs), but we note that in low-metallicity starbursts,
dust production by RSGs would likely dominate over other sources.
Subject headings: stars: atmospheres—stars: fundamental parameters—stars:
late-type—supergiants—dust, extinction
1. Introduction
Red supergiants (RSGs) are the evolved, He-burning descendents of moderately mas-
sive (≤ 40M⊙) O and B stars. We have recently used the new generation of MARCS stellar
atmosphere models (Gustafsson et al. 1975, 2003; Plez et al. 1992) to fit optical spectropho-
tometry of 74 Milky Way RSGs, from which we derived a new effective temperature scale for
RSGs of Galactic metallicity (Levesque et al. 2005, hereafter Paper I). A subsample of 62 of
these stars belong to OB associations with known distances, which allowed us to determine
other physical properties, such as bolometric luminosity and stellar radii, for comparison
with those predicted by stellar evolutionary models. We found excellent agreement, thus
removing a major discrepancy between “observation” and theory for massive star evolution
(see Massey 2003).
However, that study underscored the difficulty in correcting for reddening due to dust for
these objects; our work hinted at several previously neglected problems, which we consider
more fully here. First (Sec. 2), we find that previous efforts involving broad-band filter
photometry have led to systematically underestimating the visual extinctions, and thus to
underestimating the stellar luminosities. Although we successfully avoided that problem in
Paper I by using spectrophotometry to derive reddenings, our work revealed that many of
these stars suffer extinction beyond that of their neighboring O and B stars. We show here
(Sec. 3) that this is likely caused by circumstellar dust from these “smoky” stars. Although
future studies will attempt to derive the reddening law for this dust, it is already clear that
the circumstellar dust results in a near-UV excess compared to the stellar models reddened
with the “standard” reddening law (Sec. 4). Finally, we use the results of Paper I and the
– 3 –
current study to estimate the fraction of dust deposited in the diffuse interstellar medium
compared to that of other sources in the Galaxy (Sec. 5).
2. The Effective RV for Broad-band Photometry of RSGs
A knowledge of the ratio of total to selective extinction RV ≡ AV /E(B−V ) is needed in
order to derive physical parameters of reddened stars. Using early-type stars with moderate
reddenings in the Milky Way, Sneden et al. (1978) and others found RV to be typically 3.1,
although it is now well understood that this value is not universal in nature, but represents
the average sightline through the diffuse interstellar medium (Valencic et al. 2004). Values
of RV ∼ 5 and even higher have been found for stars in dense molecular clouds; see, for
example, Cardelli & Wallerstein (1989) and Cardelli et al. (1989, hereafter CCM89). These
physical variations of RV are due to differences in the line-of-sight environment, such as the
grain size distribution.
However, aside from such real differences in the dust properties, one must employ a larger
effective value of RV (which we will denote as R′
V ) when correcting broad-band photometry
of objects whose spectral energy distributions differ from that of lightly- to moderately-
reddened O stars. This is simply due to the shift of the effective wavelength of the filters
compared to that obtained with early-type stars. A very red star shifts the effective wave-
lengths of the B and V filters to longer wavelengths, where extinction is less, making both
AB and AV smaller for a given amount of dust. The net effect of lowering AB and AV is
to increase R′
V , as the decrease in the denominator of the ratio outweighs the decrease of
the numerator. McCall (2004) has recently emphasized the importance of considering the
spectral energy distribution (SED) of the source when correcting for extinction in galaxy
photometry, as their SEDs do not, after all, resemble that of the OB stars for which the
extinction laws were derived.
We avoided this problem in Paper I by using spectrophotometry of the stars to measure
the color excess with regard the MARCS models, employing the CCM89 reddening law.
Since neither the B nor V filters were actually used in our color excesses, conversion to AV
was straight-forward, although it did assume that the reddenings had a “typical” RV = 3.1
value. For broad-band photometry of RSGs, a value of R′
V = 3.6 has usually been adopted
(Lee 1970, Humphreys 1978), and is consistent with the scaling of R′
V with color proposed
by Schmidt-Kaler (1982). However, our work in Paper I has forced us to conclude that this
value is not very accurate, as it produced AV values that were systematically smaller than
extinction values derived from our spectrophotometry. We have derived an improved value
for the effective R′
V of RSGs by convolving the MARCS models with the standard B and
– 4 –
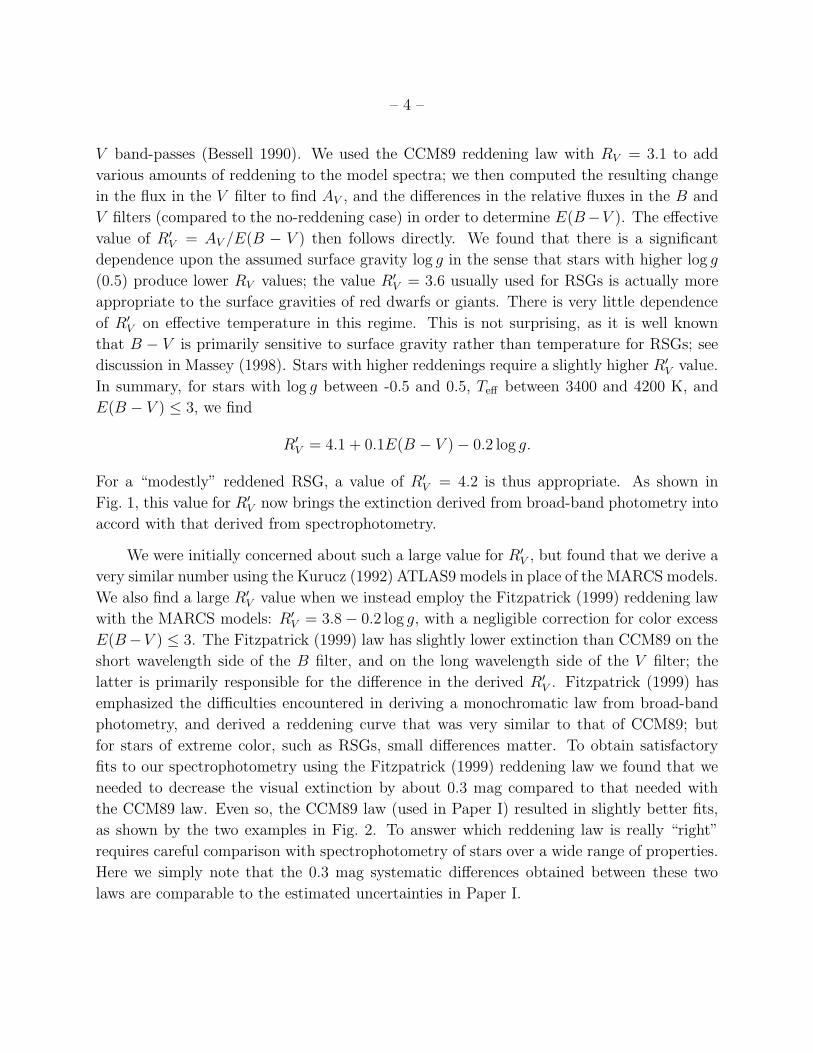
V band-passes (Bessell 1990). We used the CCM89 reddening law with RV = 3.1 to add
various amounts of reddening to the model spectra; we then computed the resulting change
in the flux in the V filter to find AV , and the differences in the relative fluxes in the B and
V filters (compared to the no-reddening case) in order to determine E(B−V ). The effective
value of R′
V = AV /E(B − V ) then follows directly. We found that there is a significant
dependence upon the assumed surface gravity log g in the sense that stars with higher log g
(0.5) produce lower RV values; the value R′
V = 3.6 usually used for RSGs is actually more
appropriate to the surface gravities of red dwarfs or giants. There is very little dependence
of R′
V on effective temperature in this regime. This is not surprising, as it is well known
that B − V is primarily sensitive to surface gravity rather than temperature for RSGs; see
discussion in Massey (1998). Stars with higher reddenings require a slightly higher R′
V value.
In summary, for stars with log g between -0.5 and 0.5, Teff between 3400 and 4200 K, and
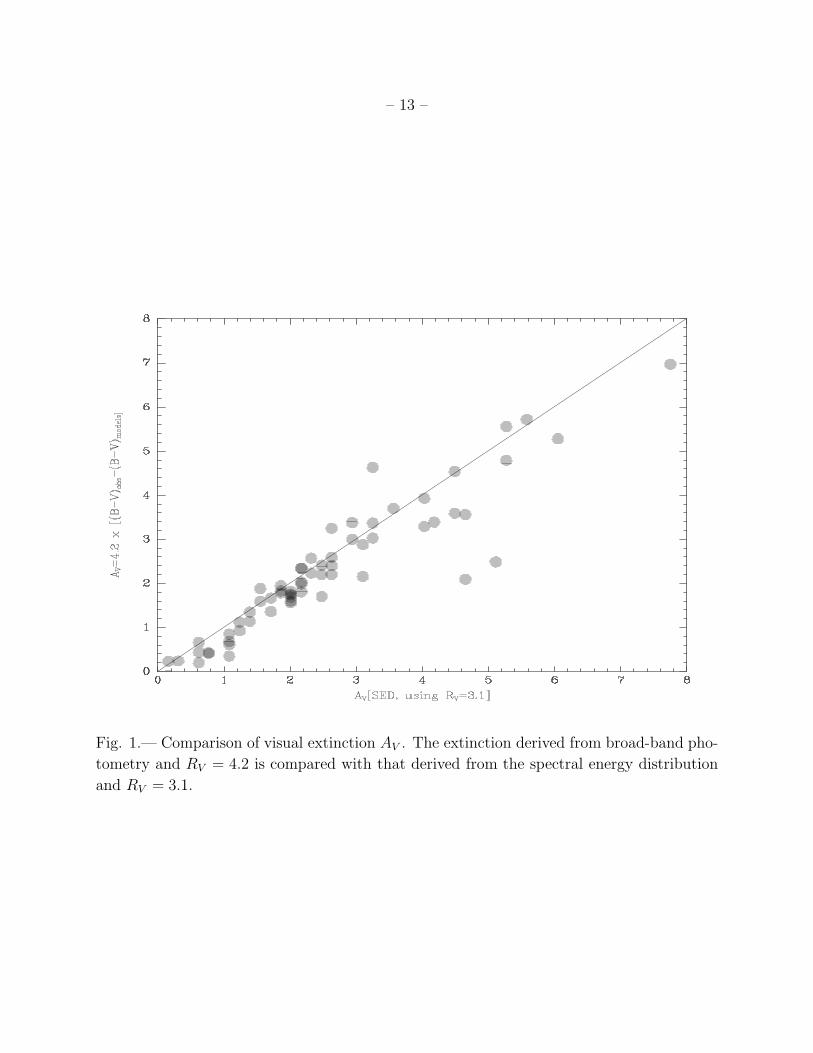
E(B − V ) ≤ 3, we find
R′
V = 4.1 + 0.1E(B − V ) − 0.2 log g.
For a “modestly” reddened RSG, a value of R′
V = 4.2 is thus appropriate. As shown in
Fig. 1, this value for R′
V now brings the extinction derived from broad-band photometry into
accord with that derived from spectrophotometry.
We were initially concerned about such a large value for R′
V , but found that we derive a
very similar number using the Kurucz (1992) ATLAS9 models in place of the MARCS models.
We also find a large R′
V value when we instead employ the Fitzpatrick (1999) reddening law
with the MARCS models: R′
V = 3.8 − 0.2 log g, with a negligible correction for color excess
E(B−V ) ≤ 3. The Fitzpatrick (1999) law has slightly lower extinction than CCM89 on the
short wavelength side of the B filter, and on the long wavelength side of the V filter; the
latter is primarily responsible for the difference in the derived R′
V . Fitzpatrick (1999) has
emphasized the difficulties encountered in deriving a monochromatic law from broad-band
photometry, and derived a reddening curve that was very similar to that of CCM89; but
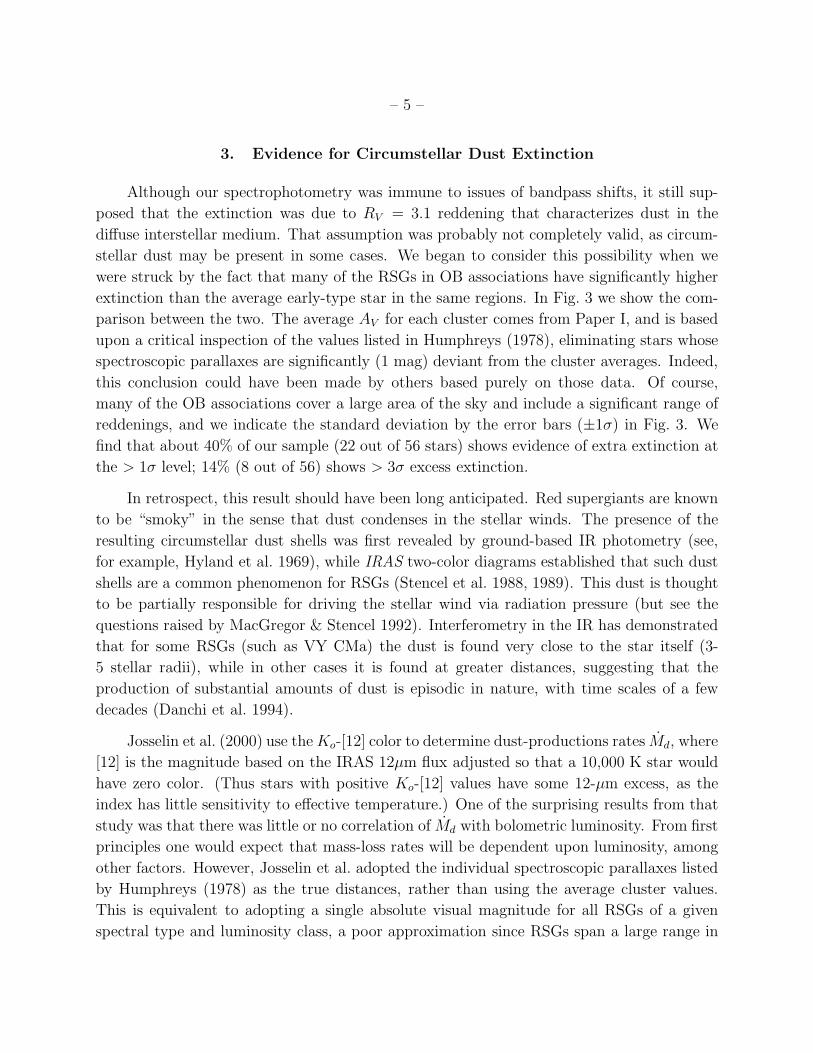
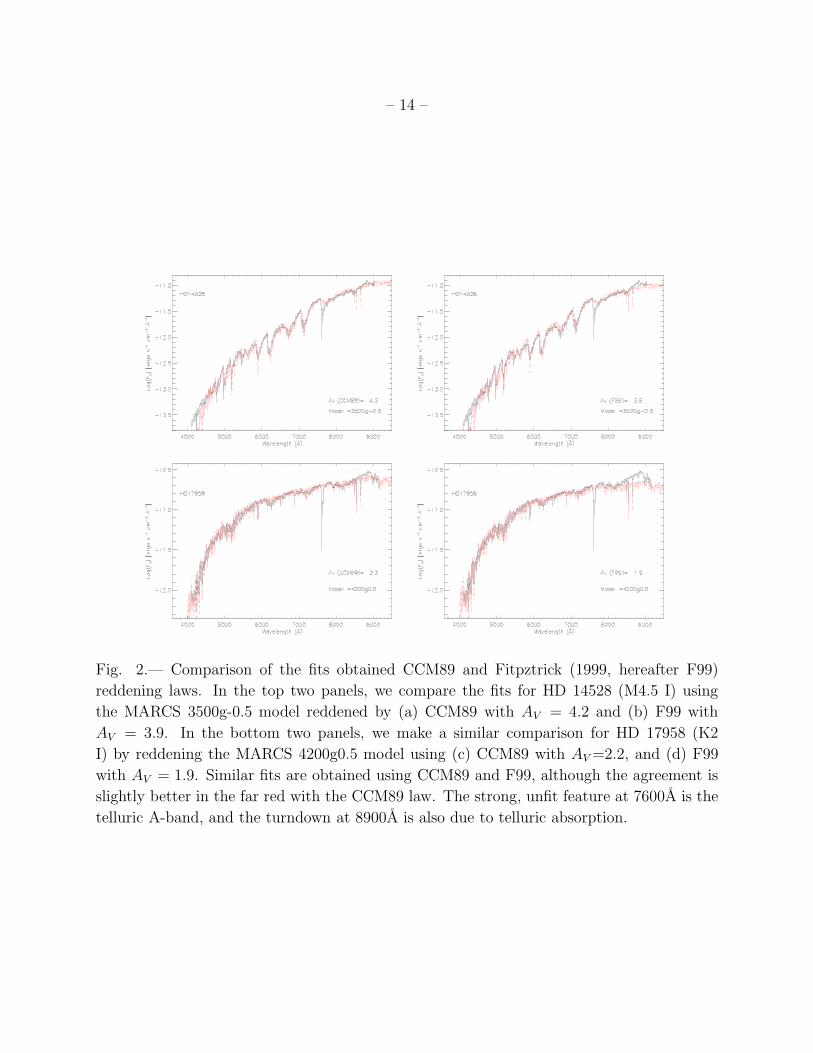
for stars of extreme color, such as RSGs, small differences matter. To obtain satisfactory
fits to our spectrophotometry using the Fitzpatrick (1999) reddening law we found that we
needed to decrease the visual extinction by about 0.3 mag compared to that needed with
the CCM89 law. Even so, the CCM89 law (used in Paper I) resulted in slightly better fits,
as shown by the two examples in Fig. 2. To answer which reddening law is really “right”
requires careful comparison with spectrophotometry of stars over a wide range of properties.
Here we simply note that the 0.3 mag systematic differences obtained between these two
laws are comparable to the estimated uncertainties in Paper I.
– 5 –
3. Evidence for Circumstellar Dust Extinction
Although our spectrophotometry was immune to issues of bandpass shifts, it still sup-
posed that the extinction was due to RV = 3.1 reddening that characterizes dust in the
diffuse interstellar medium. That assumption was probably not completely valid, as circum-
stellar dust may be present in some cases. We began to consider this possibility when we
were struck by the fact that many of the RSGs in OB associations have significantly higher
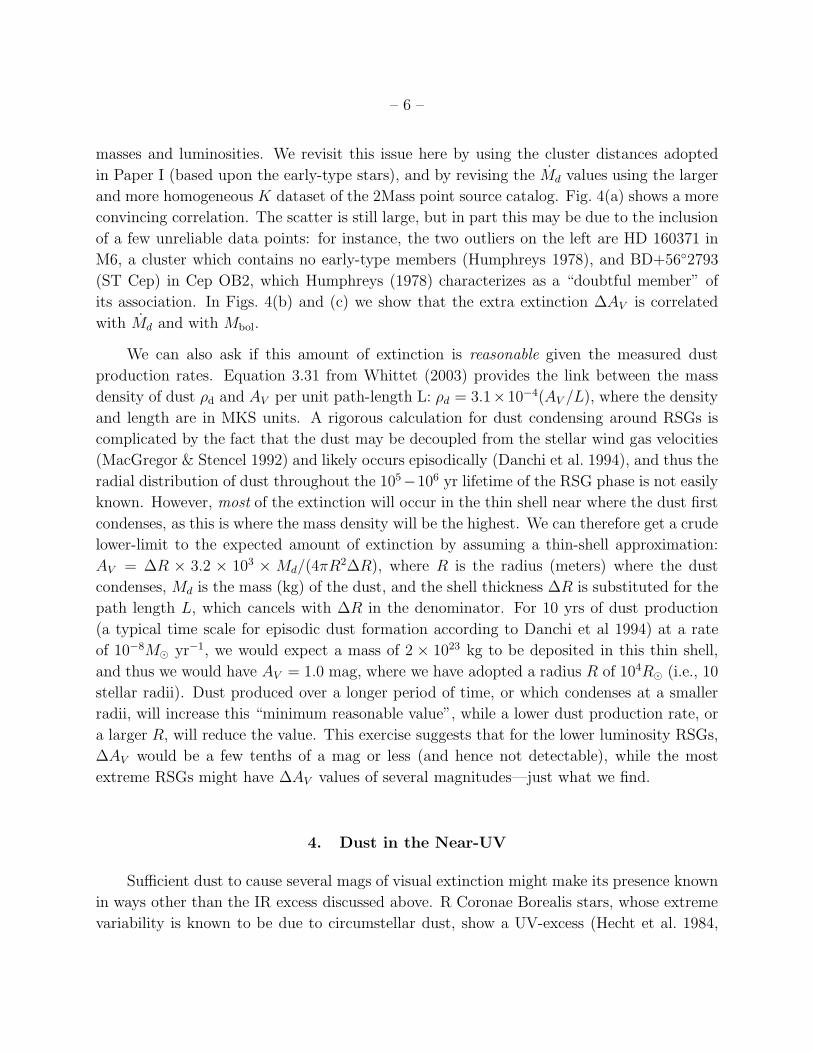
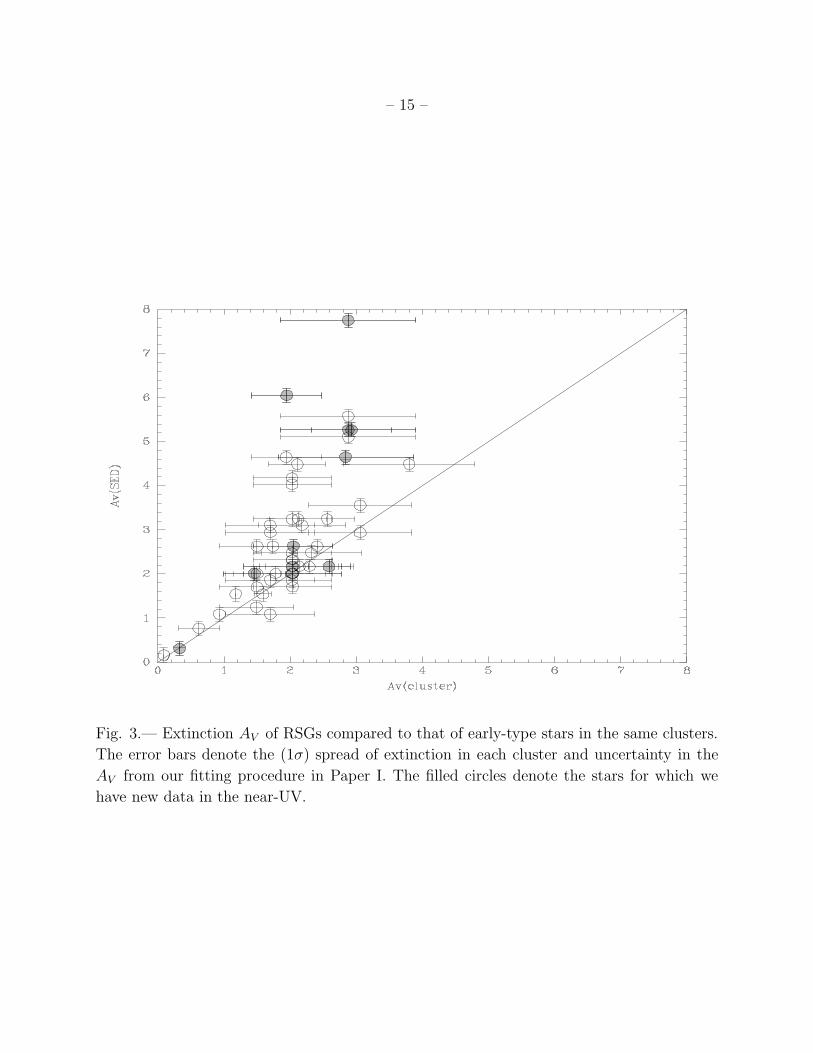
extinction than the average early-type star in the same regions. In Fig. 3 we show the com-
parison between the two. The average AV for each cluster comes from Paper I, and is based
upon a critical inspection of the values listed in Humphreys (1978), eliminating stars whose
spectroscopic parallaxes are significantly (1 mag) deviant from the cluster averages. Indeed,
this conclusion could have been made by others based purely on those data. Of course,
many of the OB associations cover a large area of the sky and include a significant range of
reddenings, and we indicate the standard deviation by the error bars (±1σ) in Fig. 3. We
find that about 40% of our sample (22 out of 56 stars) shows evidence of extra extinction at
the > 1σ level; 14% (8 out of 56) shows > 3σ excess extinction.
In retrospect, this result should have been long anticipated. Red supergiants are known
to be “smoky” in the sense that dust condenses in the stellar winds. The presence of the
resulting circumstellar dust shells was first revealed by ground-based IR photometry (see,
for example, Hyland et al. 1969), while IRAS two-color diagrams established that such dust
shells are a common phenomenon for RSGs (Stencel et al. 1988, 1989). This dust is thought
to be partially responsible for driving the stellar wind via radiation pressure (but see the
questions raised by MacGregor & Stencel 1992). Interferometry in the IR has demonstrated
that for some RSGs (such as VY CMa) the dust is found very close to the star itself (3-
5 stellar radii), while in other cases it is found at greater distances, suggesting that the
production of substantial amounts of dust is episodic in nature, with time scales of a few
decades (Danchi et al. 1994).
Josselin et al. (2000) use the Ko-[12] color to determine dust-productions rates Md, where
[12] is the magnitude based on the IRAS 12µm flux adjusted so that a 10,000 K star would
have zero color. (Thus stars with positive Ko-[12] values have some 12-µm excess, as the
index has little sensitivity to effective temperature.) One of the surprising results from that
study was that there was little or no correlation of Md with bolometric luminosity. From first
principles one would expect that mass-loss rates will be dependent upon luminosity, among
other factors. However, Josselin et al. adopted the individual spectroscopic parallaxes listed
by Humphreys (1978) as the true distances, rather than using the average cluster values.
This is equivalent to adopting a single absolute visual magnitude for all RSGs of a given
spectral type and luminosity class, a poor approximation since RSGs span a large range in
– 6 –
masses and luminosities. We revisit this issue here by using the cluster distances adopted
in Paper I (based upon the early-type stars), and by revising the Md values using the larger
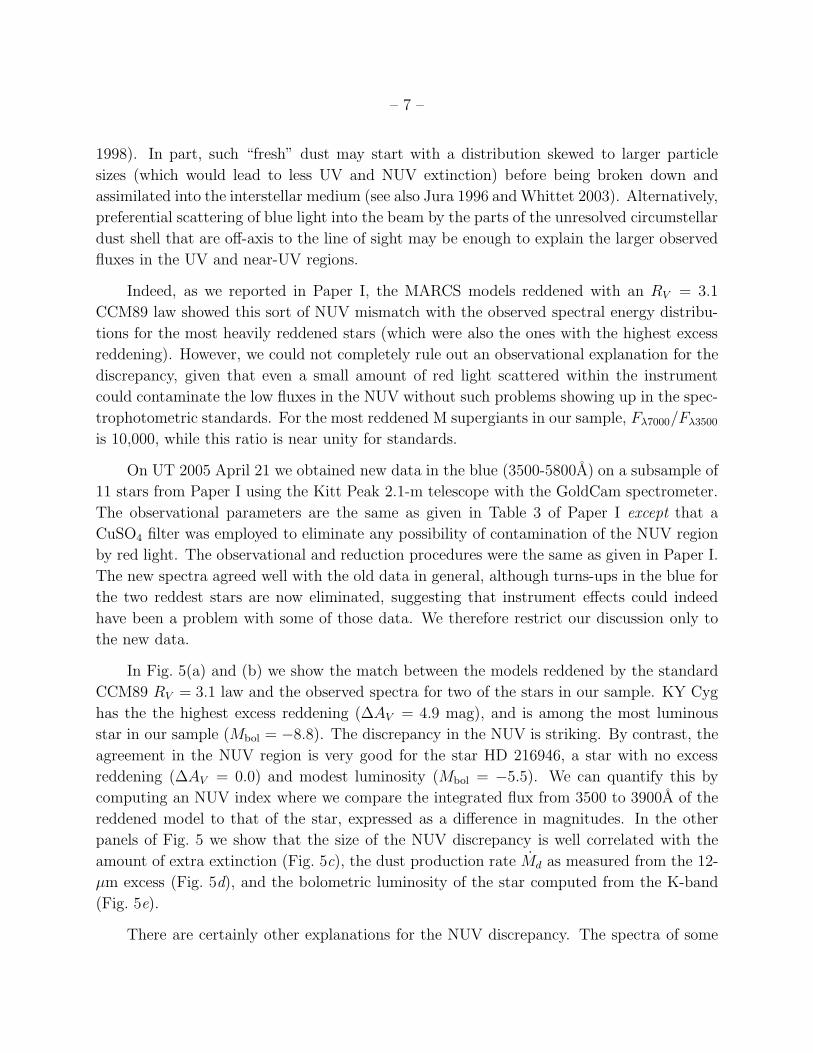
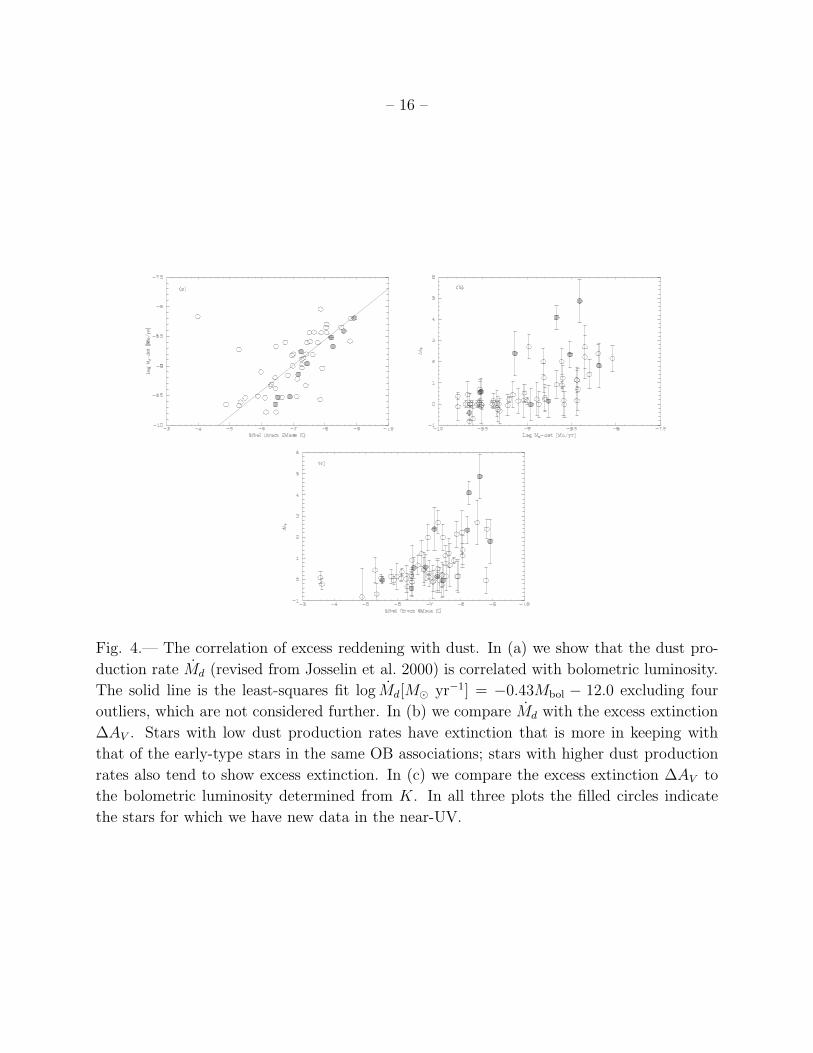
and more homogeneous K dataset of the 2Mass point source catalog. Fig. 4(a) shows a more
convincing correlation. The scatter is still large, but in part this may be due to the inclusion
of a few unreliable data points: for instance, the two outliers on the left are HD 160371 in
M6, a cluster which contains no early-type members (Humphreys 1978), and BD+56◦2793
(ST Cep) in Cep OB2, which Humphreys (1978) characterizes as a “doubtful member” of
its association. In Figs. 4(b) and (c) we show that the extra extinction ∆AV is correlated
with Md and with Mbol.
We can also ask if this amount of extinction is reasonable given the measured dust
production rates. Equation 3.31 from Whittet (2003) provides the link between the mass
density of dust ρd and AV per unit path-length L: ρd = 3.1×10⁻⁴(AV /L), where the density
and length are in MKS units. A rigorous calculation for dust condensing around RSGs is
complicated by the fact that the dust may be decoupled from the stellar wind gas velocities
(MacGregor & Stencel 1992) and likely occurs episodically (Danchi et al. 1994), and thus the
radial distribution of dust throughout the 105−106 yr lifetime of the RSG phase is not easily
known. However, most of the extinction will occur in the thin shell near where the dust first
condenses, as this is where the mass density will be the highest. We can therefore get a crude
lower-limit to the expected amount of extinction by assuming a thin-shell approximation:
AV = ∆R × 3.2 × 10³ × Md/(4πR2∆R), where R is the radius (meters) where the dust
condenses, Md is the mass (kg) of the dust, and the shell thickness ∆R is substituted for the
path length L, which cancels with ∆R in the denominator. For 10 yrs of dust production
(a typical time scale for episodic dust formation according to Danchi et al 1994) at a rate
of 10−8M⊙ yr−1, we would expect a mass of 2 × 10²³ kg to be deposited in this thin shell,
and thus we would have AV = 1.0 mag, where we have adopted a radius R of 104R⊙ (i.e., 10
stellar radii). Dust produced over a longer period of time, or which condenses at a smaller
radii, will increase this “minimum reasonable value”, while a lower dust production rate, or
a larger R, will reduce the value. This exercise suggests that for the lower luminosity RSGs,
∆AV would be a few tenths of a mag or less (and hence not detectable), while the most
extreme RSGs might have ∆AV values of several magnitudes—just what we find.
4. Dust in the Near-UV
Sufficient dust to cause several mags of visual extinction might make its presence known
in ways other than the IR excess discussed above. R Coronae Borealis stars, whose extreme
variability is known to be due to circumstellar dust, show a UV-excess (Hecht et al. 1984,
– 7 –
1998). In part, such “fresh” dust may start with a distribution skewed to larger particle
sizes (which would lead to less UV and NUV extinction) before being broken down and
assimilated into the interstellar medium (see also Jura 1996 and Whittet 2003). Alternatively,
preferential scattering of blue light into the beam by the parts of the unresolved circumstellar
dust shell that are off-axis to the line of sight may be enough to explain the larger observed
fluxes in the UV and near-UV regions.
Indeed, as we reported in Paper I, the MARCS models reddened with an RV = 3.1
CCM89 law showed this sort of NUV mismatch with the observed spectral energy distribu-
tions for the most heavily reddened stars (which were also the ones with the highest excess
reddening). However, we could not completely rule out an observational explanation for the
discrepancy, given that even a small amount of red light scattered within the instrument
could contaminate the low fluxes in the NUV without such problems showing up in the spec-
trophotometric standards. For the most reddened M supergiants in our sample, Fλ7000/Fλ3500
is 10,000, while this ratio is near unity for standards.
On UT 2005 April 21 we obtained new data in the blue (3500-5800A) on a subsample of
11 stars from Paper I using the Kitt Peak 2.1-m telescope with the GoldCam spectrometer.
The observational parameters are the same as given in Table 3 of Paper I except that a
CuSO4 filter was employed to eliminate any possibility of contamination of the NUV region
by red light. The observational and reduction procedures were the same as given in Paper I.
The new spectra agreed well with the old data in general, although turns-ups in the blue for
the two reddest stars are now eliminated, suggesting that instrument effects could indeed
have been a problem with some of those data. We therefore restrict our discussion only to
the new data.
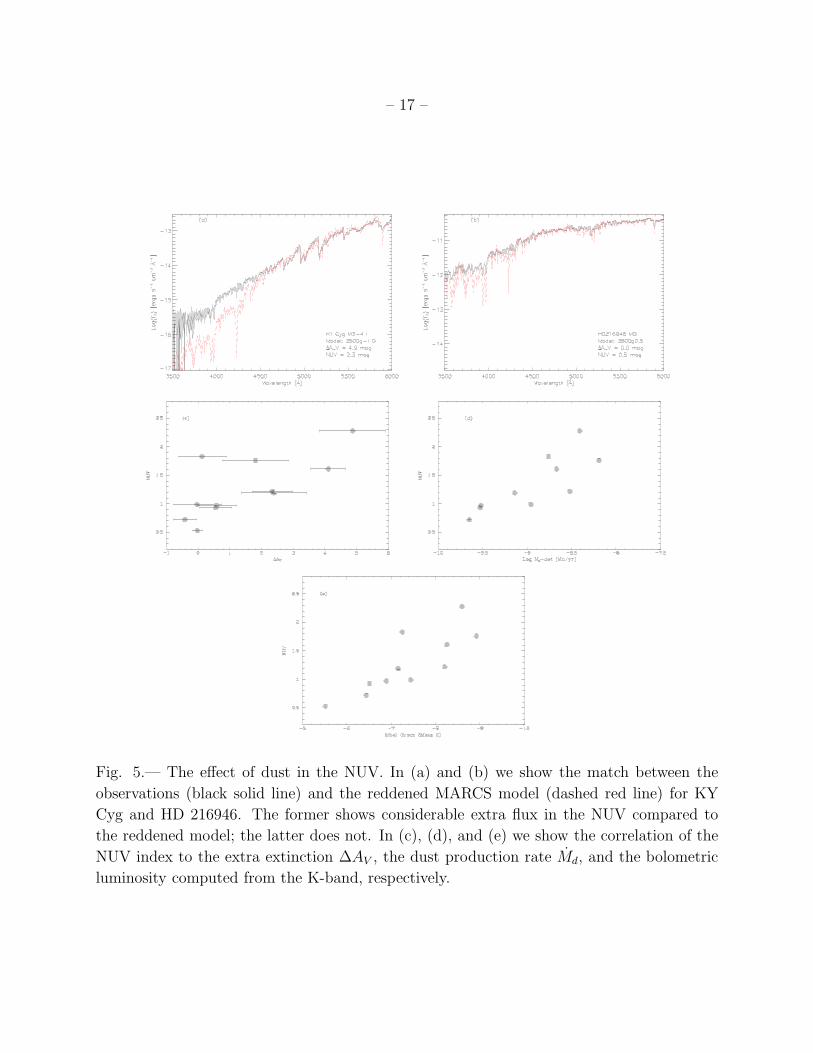
In Fig. 5(a) and (b) we show the match between the models reddened by the standard
CCM89 RV = 3.1 law and the observed spectra for two of the stars in our sample. KY Cyg
has the the highest excess reddening (∆AV = 4.9 mag), and is among the most luminous
star in our sample (Mbol = −8.8). The discrepancy in the NUV is striking. By contrast, the
agreement in the NUV region is very good for the star HD 216946, a star with no excess
reddening (∆AV = 0.0) and modest luminosity (Mbol = −5.5). We can quantify this by
computing an NUV index where we compare the integrated flux from 3500 to 3900A of the
reddened model to that of the star, expressed as a difference in magnitudes. In the other
panels of Fig. 5 we show that the size of the NUV discrepancy is well correlated with the
amount of extra extinction (Fig. 5c), the dust production rate Md as measured from the 12-
µm excess (Fig. 5d), and the bolometric luminosity of the star computed from the K-band
(Fig. 5e).
There are certainly other explanations for the NUV discrepancy. The spectra of some
– 8 –
stars could be contaminated by the presence of a hot companion. However, we would expect
such stars to show a composite spectrum. Indeed, in Paper I we had eliminated several stars
from our sample because Balmer lines were clearly present. Another intriguing possibility is
that hot spots might be present on the surface of these stars, as suggested by interferometric
observations and UV HST imaging; see Freytag (2003) and references therein. Stars with
vigorous convection patterns could have spectra dominated by regions at different temper-
atures depending upon the wavelength. Alternatively, chromospheric emission may play a
role (Carpenter et al. 1994, Harper et al. 2001). These possibilities could, and should, be
investigated by higher spectral resolution studies. Nevertheless, the correlations shown in
Fig. 5 provide strong evidence that circumstellar dust is the culprit.
Although it is tempting to derive the reddening law of this circumstellar material, it is
difficult to accurately extract the circumstellar component from the total extinction, given
the high (and uncertain) amount of foreground reddening. We are in the process of obtaining
the necessary data for a large sample of RSGs in the Magellanic Clouds. There the problem
is actually tractable, given the small and relatively uniform extinction of the Clouds (van
den Bergh 2000).
5. Contribution to the Dust Content of the Milky Way
In reviews of the origin of cosmic dust, the role of RSGs is often ignored, with the
primary sources given as SNe and low-mass AGB stars. However, for dusty galaxies at large
look-back times, AGBs cannot play a role given the time scales for low-mass stellar evolution.
When high-mass stars are discussed, it is usually only the WC-type Wolf-Rayet stars that
are considered (see, for example, Dwek 1998). However, only the late-type WCs are known
to produce dust, and even those types may require a binary companion (see Crowther 2003).
In the Milky Way, late-type WCs are concentrated towards the Galactic center, and are
known to be absent in low-metallicity galaxies (see Massey 2003 and references therein). So,
in extreme environments (such as metal-poor starbursts, or for most galaxies at early times),
RSGs could play a dominant role.
Here we briefly consider how large that role is locally. We expect the production rate
(in units of mass per unit time per unit area of the galactic disk) to be
RRSG =
∫25
10
ρRSG(m) Md(m) dm,
where ρRSG(m) is the surface density of RSGs as a function of mass and Md(m) is the dust
production rate. We can estimate these quantities as follows. First, from Fig. 4(a), we
– 9 –
find that log Md = −0.43×Mbol − 12.0 for Mbol < −5, which roughly corresponds to masses
> 10M⊙. In Paper I we used the evolutionary tracks of Meynet & Maeder (2003) to estimate
that the masses of RSGs scale with luminosity as log(M/M⊙) = 0.50 − 0.099Mbol, so we
expect
log Md = 4.3 log(M/M⊙) − 14.2
for RSGs with masses 10 < (M/M⊙) < 25. The surface density ρRSG(m) is harder to
estimate. We expect ρRSG(m) ∝ m−2.35∆τRSG(m), where we have assumed a Salpeter initial
mass function, and ∆τRSG is the lifetime of the RSG phase as a function of mass. From
the evolutionary models of Meynet & Maeder (2003), we find that the RSG phase lasts
2 Myr (10M⊙) to 0.4 Myr (25M⊙), and we use the models to approximate log ∆τRSG =
8.1 − 1.8 log(M/M⊙). Jura & Kleinmann (1990) find 21 high-luminosity (Mbol < −7.8,
corresponding roughly to 19M⊙) RSGs within 2.5 kpc of the sun, or a surface density of
1 kpc−2. If that is complete (and we list a comparable number, 18, meeting these criteria
in our admittedly incomplete sample from Paper I), then we can use that to determine the
scaling factor C:∫
25
19ρRSG(m) dm = 1.3× 10⁸C
∫25
19m−2.35 m−1.8 dm = 1, or C = 4.5× 10⁻⁴.
Thus ρRSG(m) = 5.8 × 10⁴m−4.15. Substituting in the above, we expect
RRSG = 3.7 × 10⁻¹⁰
∫25
10
m0.15 dm,
or 8.5 10−9M⊙ yr−1 kpc−2.
We emphasize that this value is uncertain due primarily to our poor understanding of the
exact completeness limits. We can instead derive the surface density of RSGs using what we
do know about the surface densities of other types of massive stars in the solar neighborhood,
appealing to the evolutionary models to then connect the two. Although the number of O-
type stars within a few kpc of the sun is poorly known (see Massey 2003), the number of WC-
type Wolf-Rayet stars is thought to be complete, given their strong emission-line signature
(Massey & Johnson 1998). According to the evolutionary models of Meynet & Maeder
(2003), WCs come from stars with masses greater than 40M⊙; the lifetime of the WC stage is
independent of mass, with ∆τWC = 0.2 Myr (see their Fig. 10). The surface density of WCs in
the solar neighborhood is 2.1 kpc−1, a number which we believe is based on a complete sample
(Massey 2003 and references therein). So,∫
120
40ρWC(m) dm = 2×10⁵C
∫120
40m−2.35 dm = 2.1,
and we derive C = 2.7×10⁻³, about a factor of 6 times greater. Thus RRSG = 5.1×10⁻⁸M⊙
yr−1 kpc−2. Given the uncertainties (both in our knowledge of the local RSG content, and
in the models) we consider this agreement very good, and adopt a value RRSG = 3×10⁻⁸M⊙
yr−1 kpc−2. For comparison Whittet (2003) estimates a return rate for RSGs that is about
3 time greater, well within the uncertainties of our approximation. This is about 1% of the
rate of return of AGBs.

– 10 –
How does this compare to the production rate for WC-type WRs? As stated above,
only the late-type WCs (WCLs) are known to produce dust, and even those may require a
binary companion. From Conti & Vacca (1990) we find a surface density of WCLs of 0.5
kpc−1. The (total) mass-loss rates of WCs are about independent of mass, and are about
10−4.8M⊙ yr−1 (Nugis & Lammers 2000). Of this, perhaps 2% is dust (Dwek 1998). So we
expect RWCL = 1.5×10⁻⁷M⊙ yr−1 kpc−2. If close binarity is a requirement for dust ejection,
then this value should be decreased by roughly a factor of 2. We adopt a compromise of
RWCL = 1×10⁻⁷M⊙ yr−1 kpc−2, or about a factor of 3 higher than RRSG. In low-metallicity
systems (or the outwards of the solar circle in the Milky Way) there are no late-type WCs,
and RSGs will dominate the dust production by massive stars. In star-bursts, where stars
are recently formed, most dust production should be by RSGs, as low-mass stars will not
have had sufficient time to evolve to AGBs.
We are grateful to Richard Green, the Director of Kitt Peak National Observatory, for
providing discretionary time on the 2.1-m telescope to resolve the NUV problem, and to
Di Harmer for support of these efforts. Conversations and suggestions by our colleagues,
particularly Georges Meynet and Andre Maeder, are acknowledged. An anonymous referee
was responsible for valuable suggestions, including calling our attention to the fact that
circumstellar dust should behave differently in its scattering properties than dust far from
the star.
REFERENCES
Bessell, M. S. 1990, PASP, 102, 1181
Cardelli, J. A., Clayton, G. C., & Mathis, J. S. 1989, ApJ, 345, 245
Cardelli, J. A., & Wallerstein, G. 1989 AJ, 97, 1099
Carpenter, K. G., Robinson, R. D., Wahlgren, G. M., Linsky, J. L., & Brown, A. 1994, ApJ,
428, 329
Conti, P. S., & Vacca, W. D. 1990, AJ, 100, 431
Crowther, P. A. 2003 Ap&SS 285, 677
Danchi, W. C., Bester, M., Degiacomi, C. G., Greenhill, L. J., & Townes, C. H. 1994, AJ,
107, 1469
Dwek, E. 1998, ApJ, 501, 643
– 11 –
Freytag, B. 2003, in The Future of Cool-Star Astrophysics: 12th Cambridge Workshop on
Cool Stars, Stellar Systems, and the Sun, ed. A. Brown, G. M. Harper, & T. R. Ayres
(Boulder: Univ of Colorado), 1024
Gustafsson, B., Bell, R. A., Eriksson, K., Nordlund, A. 1975, A&A, 42, 407
Gustafsson, B., Edvardsson, B., Eriksson, K., Mizuno-Wiedner, M., Jørgensen, U. G., &
Plez, B. 2003, in Stellar Atmosphere Modeling, eds. I. Hubeny, D. Mihalas, & K.
Werner (San Francisco: ASP), 331
Harper, G. M., Brown, A., & Lim, J. 2001, ApJ, 551, 1073
Hecht, J. H., Clayton, G. D., Crilling, J. S., & Jeffery, C. S. 1998, ApJ, 501, 813
Hecht, J. H., Holm, A. V., Donn, B., & Wu, C.-C. 1984, ApJ, 280, 228
Humphreys, R. M. 1978, ApJS, 38, 309
Hyland, A. R., Becklin, E. E., Neugebauer, G., & Wallerstein, G. 1969, ApJ, 158, 619
Josselin, E., Blommaert, J. A. D. L., Groenewegen, M. A. T., Omont, A., & Li, F. L. 2000,
A&A, 357, 225
Jura, M. 1996, ApJ, 472, 806
Jura, M, & Kleinmann, S. G. 1990, ApJS, 73, 769
Kurucz, R. L. 1992, in The Stellar Populations of Galaxies, ed. B. Barbara & A. Renzini
(Dodrecht: Kluwer), 225
Lee, T. A. 1970, ApJ, 162, 217
Levesque, E., Massey, P., Olsen, K. A. G., Plez, B., Josselin, E., Maeder, A., & Meynet, G.
2005, ApJ, in press (Paper I)
MacGregor, K. B., & Stencel, R. E. 1992, ApJ, 397, 644
Massey, P. 1998, ApJ, 501, 153
Massey, P. 2003, ARA&A, 41, 15
Massey, P., & Johnson, O. 1998, ApJ, 505, 793
McCall, M. L. 2004, AJ, 128, 2144
Meynet, G., & Maeder, A. 2003, A&A, 404, 975
Nugis, T., & Lamers, H. J. G. L. M. 2000, A&A, 360, 227
Plez, B., Brett, J. M., & Nordlund, A. 1992, A&A, 256, 551
Schmidt-Kaler, Th. 1982, in Landolt-Bornstein New Series, Group VI, Vol. 2b, ed. K.
Shaifers & H.-H. Voigt (Berlin: Springer), 12
– 12 –
Sneden, C., Gehrz, R. D., Hackwell, J. A., York, D. G., Snow, T. P. 1978, ApJ, 223, 168
Stencel, R. E., Pesce, J. E., & Bauer, W. H. 1988, AJ, 95, 141
Stencel, R. E., Pesce, J. E., & Bauer, W. H. 1989, AJ, 97, 1120
Valencic, L. A., Clayton, G. C., & Gordon, K. D. 2004, ApJ 616, 912
van den Bergh, S. 2000, The Galaxies of the Local Group (Cambridge, Cambridge University
Press)
Whittet, D. C. B. 2003, Dust in the Galatic Environment (Bristol: IOP)
This preprint was prepared with the AAS LATEX macros v5.2.
– 13 –
Fig. 1.— Comparison of visual extinction AV . The extinction derived from broad-band pho-
tometry and RV = 4.2 is compared with that derived from the spectral energy distribution
and RV = 3.1.
– 14 –
Fig. 2.— Comparison of the fits obtained CCM89 and Fitpztrick (1999, hereafter F99)
reddening laws. In the top two panels, we compare the fits for HD 14528 (M4.5 I) using
the MARCS 3500g-0.5 model reddened by (a) CCM89 with AV = 4.2 and (b) F99 with
AV = 3.9. In the bottom two panels, we make a similar comparison for HD 17958 (K2
I) by reddening the MARCS 4200g0.5 model using (c) CCM89 with AV =2.2, and (d) F99
with AV = 1.9. Similar fits are obtained using CCM89 and F99, although the agreement is
slightly better in the far red with the CCM89 law. The strong, unfit feature at 7600A is the
telluric A-band, and the turndown at 8900A is also due to telluric absorption.
– 15 –
Fig. 3.— Extinction AV of RSGs compared to that of early-type stars in the same clusters.
The error bars denote the (1σ) spread of extinction in each cluster and uncertainty in the
AV from our fitting procedure in Paper I. The filled circles denote the stars for which we
have new data in the near-UV.
– 16 –
Fig. 4.— The correlation of excess reddening with dust. In (a) we show that the dust pro-
duction rate Md (revised from Josselin et al. 2000) is correlated with bolometric luminosity.
The solid line is the least-squares fit log Md[M⊙ yr−1] = −0.43Mbol − 12.0 excluding four
outliers, which are not considered further. In (b) we compare Md with the excess extinction
∆AV . Stars with low dust production rates have extinction that is more in keeping with
that of the early-type stars in the same OB associations; stars with higher dust production
rates also tend to show excess extinction. In (c) we compare the excess extinction ∆AV to
the bolometric luminosity determined from K. In all three plots the filled circles indicate
the stars for which we have new data in the near-UV.
– 17 –
Fig. 5.— The effect of dust in the NUV. In (a) and (b) we show the match between the
observations (black solid line) and the reddened MARCS model (dashed red line) for KY
Cyg and HD 216946. The former shows considerable extra flux in the NUV compared to
the reddened model; the latter does not. In (c), (d), and (e) we show the correlation of the
NUV index to the extra extinction ∆AV , the dust production rate Md, and the bolometric
luminosity computed from the K-band, respectively.
Related Documents