The recent deposition of persistent organic pollutants and mercury to the Dasuopu glacier, Mt. Xixiabangma, central Himalayas Xiao-ping Wang ⁎ , Tan-dong Yao, Peng-ling Wang, Wei-Yang, Li-de Tian Institute of Tibetan Plateau Research, Chinese Academy of Sciences, PO Box 2871, Beijing 100085, China ARTICLE INFO ABSTRACT Article history: Received 15 August 2007 Received in revised form 4 January 2008 Accepted 8 January 2008 High mountains may serve as condensers for persistent organic pollutants (POPs) and the ice/snow core can provide long-term records of atmospheric deposition of pollutants. In this study, organochlorine pesticides (OCPs) and polycyclic aromatic hydrocarbons (PAHs) in firn core from Dasuopu Glacier were analyzed and the seasonal variation and deposition flux of these pollutants were investigated. PCB 28 was always detected in samples from different firn core layers and concentrations of PCB 28 were in the range of 0.09–0.3 ng/l. Hexachlorobenzene (HCB) and total DDTs (p-p'-DDD and p-p'-DDT) were not always detected and were only present in some samples. No p-p'-DDE and hexachlorocyclohexane (HCH) were detected above the level of determination limits. Concentrations of HCB ranged from 0.04 to 0.07 ng/l, and total DDTs were in the range of 0.15–0.3 ng/l. Total glacier PAHs was below 26 ng/l. The levels of OCPs and PAHs in Dasuopu glacier were roughly similar to values from the European mountain areas but lower than those from Lys glacier (Italy) and glacier from Rocky Mountain. Hg concentration (2–35 ng/l) in firn core samples was higher than that of remote region of Arctic. PCB 28 didn't show obvious variation in different seasons, however for major PAH compounds higher values were observed in summer than in winter. With regard to Hg, it displayed winter maximum. Deposition flux of OCPs, PAHs and mercury showed similar results with maximum flux occurring in the 2000s. After 2000/ 2001, deposition flux decreased and reflected the possible decrease of emissions of these atmospheric pollutants in the adjacent region. © 2008 Elsevier B.V. All rights reserved. Keywords: Persistent organic pollutants Mercury Firn core Himalayas 1. Introduction In the past decades, the “grasshopper effect” model has successfully illustrated that persistent organic pollutants (POPs) can migrate to polar region through repeated-evapora- tion, atmospheric transport, and deposition (Wania and Mackay, 1996, 1995). Except for high-latitude region, there is evidence that pesticides and other volatile compounds are accumulating in remote high-elevation ecosystems through- out the world. The presence of persistent organic pollutants in remote ecosystems is of concern because these pollutants are carcinogenic or estrogenic and, therefore, pose potential threats to sensitive aquatic and terrestrial ecosystems. High mountains may act as possible condensation sites for POPs (Daly and Wania, 2005). In particular, mountain glaciers may be used as “natural archives” for studying historical trends of pollution. Mountain glacier ice cores have been widely used for studying historical trend of POPs (Dalla Valle et al., 2007; Finizio et al., 2006; Halsall, 2004; Gustafsson et al., 2005). Blais et al. (2001) showed that glaciers are important contributors of POPs to freshwater systems and melting glacier supplies 50–97% of the organochlorine inputs to the SCIENCE OF THE TOTAL ENVIRONMENT 394 (2008) 134 – 143 ⁎ Corresponding author. Tel.: +86 10 62849397; fax: +86 10 62849886. E-mail address: [email protected] (X. Wang). 0048-9697/$ – see front matter © 2008 Elsevier B.V. All rights reserved. doi:10.1016/j.scitotenv.2008.01.016 available at www.sciencedirect.com www.elsevier.com/locate/scitotenv

Welcome message from author
This document is posted to help you gain knowledge. Please leave a comment to let me know what you think about it! Share it to your friends and learn new things together.
Transcript
S C I E N C E O F T H E T O T A L E N V I R O N M E N T 3 9 4 ( 2 0 0 8 ) 1 3 4 – 1 4 3
ava i l ab l e a t www.sc i enced i r ec t . com
www.e l sev i e r. com/ loca te / sc i to tenv
The recent deposition of persistent organic pollutants andmercury to the Dasuopu glacier, Mt. Xixiabangma,central Himalayas
Xiao-ping Wang⁎, Tan-dong Yao, Peng-ling Wang, Wei-Yang, Li-de TianInstitute of Tibetan Plateau Research, Chinese Academy of Sciences, PO Box 2871, Beijing 100085, China
A R T I C L E I N F O
⁎ Corresponding author. Tel.: +86 10 62849397E-mail address: [email protected] (X. W
0048-9697/$ – see front matter © 2008 Elsevidoi:10.1016/j.scitotenv.2008.01.016
A B S T R A C T
Article history:Received 15 August 2007Received in revised form4 January 2008Accepted 8 January 2008
High mountains may serve as condensers for persistent organic pollutants (POPs) and theice/snow core can provide long-term records of atmospheric deposition of pollutants. In thisstudy, organochlorine pesticides (OCPs) and polycyclic aromatic hydrocarbons (PAHs) in firncore from Dasuopu Glacier were analyzed and the seasonal variation and deposition flux ofthese pollutants were investigated. PCB 28 was always detected in samples from differentfirn core layers and concentrations of PCB 28 were in the range of 0.09–0.3 ng/l.Hexachlorobenzene (HCB) and total DDTs (p-p'-DDD and p-p'-DDT) were not alwaysdetected and were only present in some samples. No p-p'-DDE and hexachlorocyclohexane(HCH) were detected above the level of determination limits. Concentrations of HCB rangedfrom 0.04 to 0.07 ng/l, and total DDTs were in the range of 0.15–0.3 ng/l. Total glacier PAHswas below 26 ng/l. The levels of OCPs and PAHs in Dasuopu glacier were roughly similar tovalues from the European mountain areas but lower than those from Lys glacier (Italy) andglacier from Rocky Mountain. Hg concentration (2–35 ng/l) in firn core samples was higherthan that of remote region of Arctic. PCB 28 didn't show obvious variation in differentseasons, however for major PAH compounds higher values were observed in summer thanin winter. With regard to Hg, it displayed winter maximum. Deposition flux of OCPs, PAHsand mercury showed similar results with maximum flux occurring in the 2000s. After 2000/2001, deposition flux decreased and reflected the possible decrease of emissions of theseatmospheric pollutants in the adjacent region.
© 2008 Elsevier B.V. All rights reserved.
Keywords:Persistent organic pollutantsMercuryFirn coreHimalayas
1. Introduction
In the past decades, the “grasshopper effect” model hassuccessfully illustrated that persistent organic pollutants(POPs) can migrate to polar region through repeated-evapora-tion, atmospheric transport, and deposition (Wania andMackay, 1996, 1995). Except for high-latitude region, there isevidence that pesticides and other volatile compounds areaccumulating in remote high-elevation ecosystems through-out the world. The presence of persistent organic pollutants inremote ecosystems is of concern because these pollutants are
; fax: +86 10 62849886.ang).
er B.V. All rights reserved
carcinogenic or estrogenic and, therefore, pose potentialthreats to sensitive aquatic and terrestrial ecosystems.
High mountains may act as possible condensation sites forPOPs (Daly and Wania, 2005). In particular, mountain glaciersmay be used as “natural archives” for studying historicaltrends of pollution. Mountain glacier ice cores have beenwidely used for studying historical trend of POPs (Dalla Valleet al., 2007; Finizio et al., 2006; Halsall, 2004; Gustafsson et al.,2005). Blais et al. (2001) showed that glaciers are importantcontributors of POPs to freshwater systems and meltingglacier supplies 50–97% of the organochlorine inputs to the
.
135S C I E N C E O F T H E T O T A L E N V I R O N M E N T 3 9 4 ( 2 0 0 8 ) 1 3 4 – 1 4 3
water system downstream. Gregor et al. (1996) had investi-gated the deposition flux of PCBs in the Agassiz Ice Cap for the30 years of record. Mean PCB deposition to this ice cap rangesfrom 930 ng/m2/year in the winter of 1967–1968 to a minimumof 91 ng/m2/year in 1980–1981. Since 1980–1981, deposition hasagain increased to a local maximum of 848 ng/m2/year (in1989–1990). Peters et al. (1995) studied the correlationsbetween concentration of polycyclic aromatic hydrocarbons(PAHs) and other chemical compositions in ice core. Accordingto Peters' results, concentrations of PAHs are significantlycorrelated with the concentrations of soot in the ice.
The atmospheric deposition of POPs in high-latitude regionhas received more attention than that in mid-latitude, wherepesticides have been heavily used. In addition, combustion,mining and chemical production led to emission of largeamount ofmercury, PAHs and other pollutants inmid-latituderegion. Thus it is important to investigate the atmosphericwet-deposition of pollutants in mid-latitude high mountains.
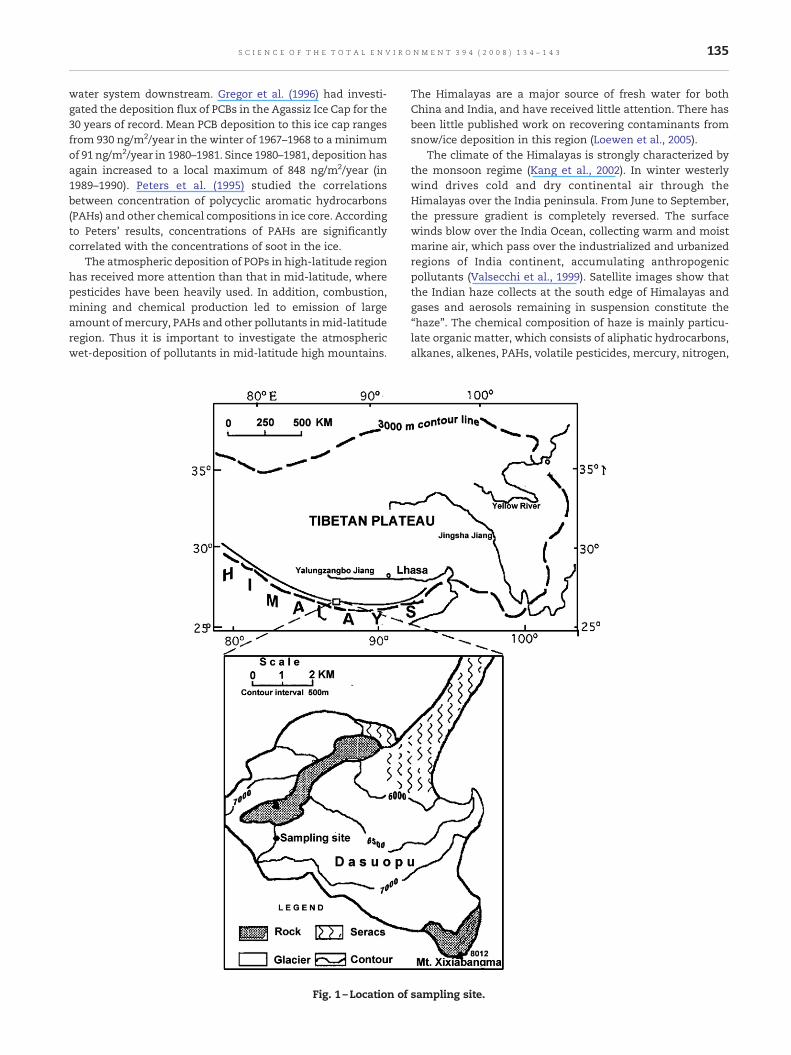
Fig. 1 –Location of
The Himalayas are a major source of fresh water for bothChina and India, and have received little attention. There hasbeen little published work on recovering contaminants fromsnow/ice deposition in this region (Loewen et al., 2005).
The climate of the Himalayas is strongly characterized bythe monsoon regime (Kang et al., 2002). In winter westerlywind drives cold and dry continental air through theHimalayas over the India peninsula. From June to September,the pressure gradient is completely reversed. The surfacewinds blow over the India Ocean, collecting warm and moistmarine air, which pass over the industrialized and urbanizedregions of India continent, accumulating anthropogenicpollutants (Valsecchi et al., 1999). Satellite images show thatthe Indian haze collects at the south edge of Himalayas andgases and aerosols remaining in suspension constitute the“haze”. The chemical composition of haze is mainly particu-late organic matter, which consists of aliphatic hydrocarbons,alkanes, alkenes, PAHs, volatile pesticides, mercury, nitrogen,
sampling site.
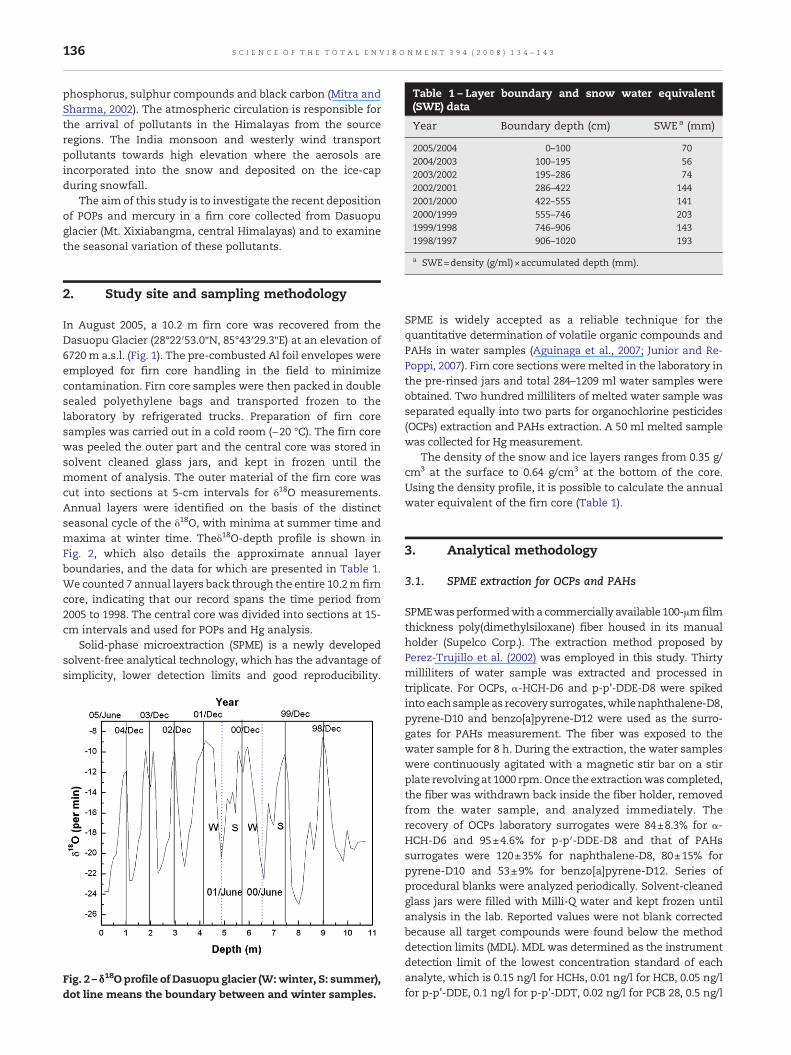
Table 1 – Layer boundary and snow water equivalent(SWE) data
Year Boundary depth (cm) SWEa (mm)
2005/2004 0–100 702004/2003 100–195 562003/2002 195–286 742002/2001 286–422 1442001/2000 422–555 1412000/1999 555–746 2031999/1998 746–906 1431998/1997 906–1020 193
136 S C I E N C E O F T H E T O T A L E N V I R O N M E N T 3 9 4 ( 2 0 0 8 ) 1 3 4 – 1 4 3
phosphorus, sulphur compounds and black carbon (Mitra andSharma, 2002). The atmospheric circulation is responsible forthe arrival of pollutants in the Himalayas from the sourceregions. The India monsoon and westerly wind transportpollutants towards high elevation where the aerosols areincorporated into the snow and deposited on the ice-capduring snowfall.
The aim of this study is to investigate the recent depositionof POPs and mercury in a firn core collected from Dasuopuglacier (Mt. Xixiabangma, central Himalayas) and to examinethe seasonal variation of these pollutants.
a SWE=density (g/ml)×accumulated depth (mm).
2. Study site and sampling methodology
In August 2005, a 10.2 m firn core was recovered from theDasuopu Glacier (28°22′53.0qN, 85°43′29.3qE) at an elevation of6720m a.s.l. (Fig. 1). The pre-combusted Al foil envelopes wereemployed for firn core handling in the field to minimizecontamination. Firn core samples were then packed in doublesealed polyethylene bags and transported frozen to thelaboratory by refrigerated trucks. Preparation of firn coresamples was carried out in a cold room (−20 °C). The firn corewas peeled the outer part and the central core was stored insolvent cleaned glass jars, and kept in frozen until themoment of analysis. The outer material of the firn core wascut into sections at 5-cm intervals for δ18O measurements.Annual layers were identified on the basis of the distinctseasonal cycle of the δ18O, with minima at summer time andmaxima at winter time. Theδ18O-depth profile is shown inFig. 2, which also details the approximate annual layerboundaries, and the data for which are presented in Table 1.We counted 7 annual layers back through the entire 10.2m firncore, indicating that our record spans the time period from2005 to 1998. The central core was divided into sections at 15-cm intervals and used for POPs and Hg analysis.
Solid-phase microextraction (SPME) is a newly developedsolvent-free analytical technology, which has the advantage ofsimplicity, lower detection limits and good reproducibility.
Fig. 2 –δ18O profile of Dasuopu glacier (W:winter, S: summer),dot line means the boundary between and winter samples.
SPME is widely accepted as a reliable technique for thequantitative determination of volatile organic compounds andPAHs in water samples (Aguinaga et al., 2007; Junior and Re-Poppi, 2007). Firn core sections weremelted in the laboratory inthe pre-rinsed jars and total 284–1209 ml water samples wereobtained. Two hundred milliliters of melted water sample wasseparated equally into two parts for organochlorine pesticides(OCPs) extraction and PAHs extraction. A 50 ml melted samplewas collected for Hg measurement.
The density of the snow and ice layers ranges from 0.35 g/cm3 at the surface to 0.64 g/cm3 at the bottom of the core.Using the density profile, it is possible to calculate the annualwater equivalent of the firn core (Table 1).
3. Analytical methodology
3.1. SPME extraction for OCPs and PAHs
SPMEwasperformedwith a commercially available 100-μmfilmthickness poly(dimethylsiloxane) fiber housed in its manualholder (Supelco Corp.). The extraction method proposed byPerez-Trujillo et al. (2002) was employed in this study. Thirtymilliliters of water sample was extracted and processed intriplicate. For OCPs, α-HCH-D6 and p-p'-DDE-D8 were spikedinto eachsample as recovery surrogates,whilenaphthalene-D8,pyrene-D10 and benzo[a]pyrene-D12 were used as the surro-gates for PAHs measurement. The fiber was exposed to thewater sample for 8 h. During the extraction, the water sampleswere continuously agitated with a magnetic stir bar on a stirplate revolving at 1000 rpm.Once the extractionwas completed,the fiber was withdrawn back inside the fiber holder, removedfrom the water sample, and analyzed immediately. Therecovery of OCPs laboratory surrogates were 84±8.3% for α-HCH-D6 and 95±4.6% for p-p′-DDE-D8 and that of PAHssurrogates were 120±35% for naphthalene-D8, 80±15% forpyrene-D10 and 53±9% for benzo[a]pyrene-D12. Series ofprocedural blanks were analyzed periodically. Solvent-cleanedglass jars were filled with Milli-Q water and kept frozen untilanalysis in the lab. Reported values were not blank correctedbecause all target compounds were found below the methoddetection limits (MDL). MDL was determined as the instrumentdetection limit of the lowest concentration standard of eachanalyte, which is 0.15 ng/l for HCHs, 0.01 ng/l for HCB, 0.05 ng/lfor p-p'-DDE, 0.1 ng/l for p-p'-DDT, 0.02 ng/l for PCB 28, 0.5 ng/l
137S C I E N C E O F T H E T O T A L E N V I R O N M E N T 3 9 4 ( 2 0 0 8 ) 1 3 4 – 1 4 3
for acenaphthylene, 0.125 ng/l for phenanthrene, 0.18 ng/l foranthracene, 0.75 ng/l for fluoranthene, and 0.15 ng/l for pyrene.
3.2. Gas chromatography analysis for persistent organicpollutants
OCPs and PAHs in all samples and field blanks wereanalyzed using a gas chromatograph (GC) with an ion-trapmass spectrometer (MS) (Finnigan Trace GC/PolarisQ). A30 m×250 μm i.d. HP-5MS capillary column was used forseparation. High-purity helium was used as a carrier gas at aconstant flow rate of 1.0 ml min−1. Each sample was analyzedunder splitless injection mode. The MS was operated with a70-eV electron impact (EI) mode.When the MS is using an ion-trap as the mass separator, the MS-MS mode can be used toachieve high sensitivity. The temperature of the injector was250 °C and the temperature of transfer line was 280 °C. Theoven-temperature for OCP detectionwas 100 °C held for 2min,ramped up at 25 °C per minute to 170 °C and then at 8 °C perminute to 225 °C, at 0.7 °C per minute to 235 °C, at 25 °C perminute to 260 °C, and held for 2 min. The oven-temperatureprogram for PAHs was set as: the column was held at 50 °C for2 min, increased to 180 °C at a rate of 20 °C/min and againramped at 4 °C/min to 250 °C, increased the temperature to280 °C at a rate of 2 °C/min, held for 2 min, and finally rampedto 300 °C at a rate of 10 °C/min, and then held for 5 min.
3.3. Mercury measurement
Themeltedwater sample (50ml) was placed in Hg-clean teflonjar. Four milliliters of bromine monochloride (BrCl) was addedto oxidize all species of Hg to Hg (II). Analysis for total Hg wasperformed with dual amalgamation cold vapor atomic fluor-escence spectrometry (Method1631, U.S.EPA, 1999) with a MDLof 0.05 ng/L. Quality control (QC) check samples were analyzedat the beginning of the run, at least every 10th sample, and atthe end of the run to establish daily statistical control. QCchecks were prepared with deionized water and a knownamount of Hg standard. The QC standards measure anypossible instrument drift and provide an external check on the
Table 2 – Comparison between concentration of persistent organsnow and fresh water samples from other areas
Site PCB (ng/l) HC
MountainsMt. Xixabangma (The Himalayas) 0.09–0.34 BCanadian Rocky Mountains(glacier water) 1.1–1.4 0European mountain areas (JÖri, lake water) 2.2 0European mountain areas (GossenkÖlle, lake water) 0.73 1European mountain areas (Starolesnianske, lake water) 0.20 0Lys glacier (Colle del Lys, glacier water) 0.17–0.71 0Glacier in Rocky Mountain (glacier water) 0
ArcticArctic (Canada, snow) 0.02–1.8 0Arctic (Ob-Yenisey watershed, snow) 0.5 1Arctic (Russia, snow) 5.3 5
AntarcticaDoumer Island (ice) 0.03–0.3Bothnian Bay (Baltic sea, ice/snow) 0.5–1.4 0
accuracy of the calibration standards. Four jar blanks (processblanks) were run during the period of analysis. Results fromthe jar blanks were used to determine the contribution of Hgfrom the oxidant BrCl and any Hg sources from the jars. Theblanks ranged in concentration from 0.30 to 0.86 ng/L(mean=0.66, stdev=0.25, n=4). After subtraction of the meanblank value, the lowest total Hg concentration from 49samples was 1.21 ng/L, which is still significantly above thehighest blank value. On each work day, at least one samplewas spiked and the percent recoveries ranged from 90 to 111(mean=99, stdev=6, n=15).
4. Results and discussion
4.1. Organochlorine compounds (OCPs) concentrations inDasuopu firn core
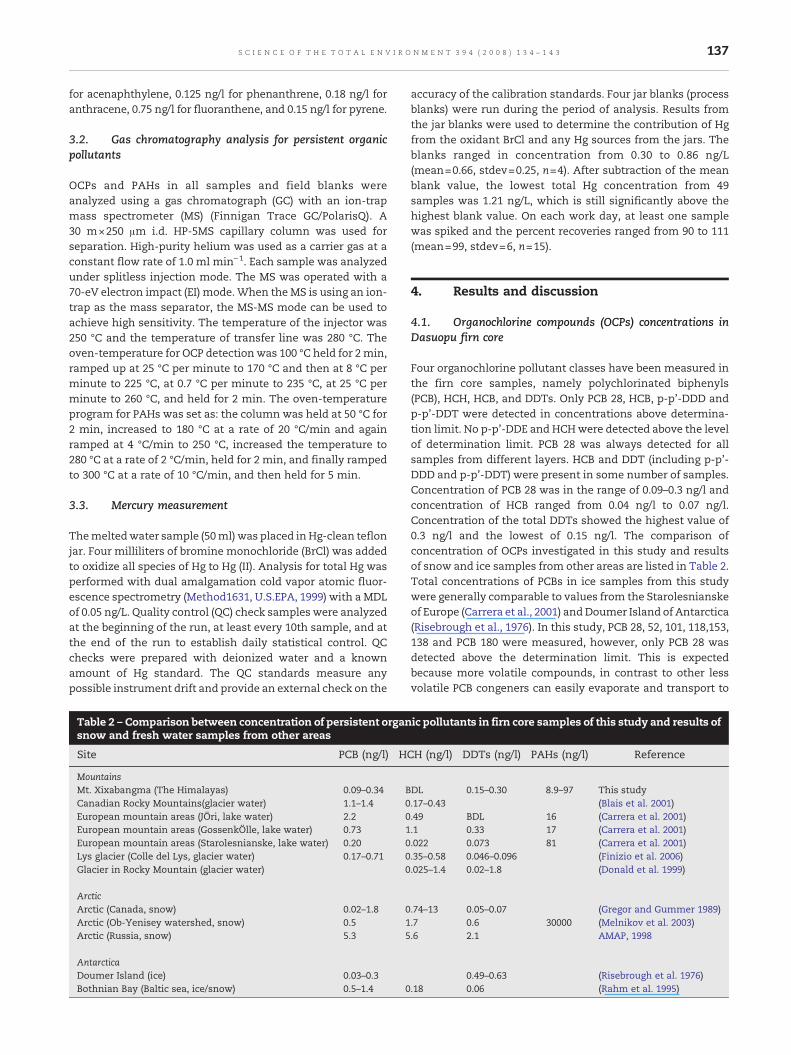
Four organochlorine pollutant classes have been measured inthe firn core samples, namely polychlorinated biphenyls(PCB), HCH, HCB, and DDTs. Only PCB 28, HCB, p-p'-DDD andp-p'-DDT were detected in concentrations above determina-tion limit. No p-p'-DDE and HCHwere detected above the levelof determination limit. PCB 28 was always detected for allsamples from different layers. HCB and DDT (including p-p'-DDD and p-p'-DDT) were present in some number of samples.Concentration of PCB 28 was in the range of 0.09–0.3 ng/l andconcentration of HCB ranged from 0.04 ng/l to 0.07 ng/l.Concentration of the total DDTs showed the highest value of0.3 ng/l and the lowest of 0.15 ng/l. The comparison ofconcentration of OCPs investigated in this study and resultsof snow and ice samples from other areas are listed in Table 2.Total concentrations of PCBs in ice samples from this studywere generally comparable to values from the Starolesnianskeof Europe (Carrera et al., 2001) andDoumer Island of Antarctica(Risebrough et al., 1976). In this study, PCB 28, 52, 101, 118,153,138 and PCB 180 were measured, however, only PCB 28 wasdetected above the determination limit. This is expectedbecause more volatile compounds, in contrast to other lessvolatile PCB congeners can easily evaporate and transport to
ic pollutants in firn core samples of this study and results of
H (ng/l) DDTs (ng/l) PAHs (ng/l) Reference
DL 0.15–0.30 8.9–97 This study.17–0.43 (Blais et al. 2001).49 BDL 16 (Carrera et al. 2001).1 0.33 17 (Carrera et al. 2001).022 0.073 81 (Carrera et al. 2001).35–0.58 0.046–0.096 (Finizio et al. 2006).025–1.4 0.02–1.8 (Donald et al. 1999)
.74–13 0.05–0.07 (Gregor and Gummer 1989)
.7 0.6 30000 (Melnikov et al. 2003)
.6 2.1 AMAP, 1998
0.49–0.63 (Risebrough et al. 1976).18 0.06 (Rahm et al. 1995)
138 S C I E N C E O F T H E T O T A L E N V I R O N M E N T 3 9 4 ( 2 0 0 8 ) 1 3 4 – 1 4 3
such high mountain. Similar PCB distributions have beenreported in snow from other remote sites (Fuoco et al., 1996;Swackhamer et al., 1988). Low chlorinated PCBs are present inthe atmosphere mainly in the gas phase. Yeo et al. (2003), inparticular, reported that the average contribution of PCBhomologs were 44.5% for tri-CBs, 23.6% for tetra-CBs, 21.6%for penta-CBs, 3.6% for hexa-CBs, 5.5% for hepta-CBs and 1.6%for deca-CBs in the rural air of Ansung, Kyonggi-do in SouthKorea. Brunciak et al. (2001) showed that tri-CBs and tetra-CBsconstitute 70–90% of the total PCB mass in air sampled at theHudson River Harbour Estuary in New Jersey. The higherconcentration fraction of lowmolecular weight PCB congenersshows that this is probably mostly influenced by long-rangetransport, which involves mainly less chlorinated congeners(Oehme et al., 1996; Wania and Mackay, 1996). Tri-CB (PCB 28)inclines to undergo long-range atmospheric transport, thus, inthis study, the dominant concentration of PCB 28 in firn corefrom Dasuopu Glacier may be reasonable.
Neither α-HCH nor γ-HCHwas detected in firn core samples.However, the Indian subcontinent is themost important sourceregion for airborne HCH and DDTs to the high Himalayas(Loewen et al., 2005). Remarkably high level of HCH wasobserved in water, soil and fish samples from India (Rameshet al., 1992), indicating significant contamination occurred inIndia. According to our previous results, high level of HCH wasobserved in spruce needles from the border between China andNepal (Wang et al., 2006). All these results raise the speculationthat high concentrations of HCH may be observed in snow/firncore samples from the Himalaya region. In spite of thissupposition, in our study HCH concentration is below thedetection limits. In addition, Li et al (2006) sampled air nearMt. Qomolangma in Tibet and their results showed that HCHconcentration is found to be ten to sixty times lower than that inthe Canadian Arctic atmosphere. Mt. Xixiabangma (28.022N,85.72E) andMt. Qomolangma (28.031N, 86.961E) are both locatedat the central Himalayas and adjacent toNepal and India,whichmeans they are closer to themajorHCHsource region.However,low concentration of HCH was observed in either firn coresamples (this study) or air samples (Li et al., 2006) from theseareas. High volatility of HCH may lead it to undergo globalcirculation rather than deposition in local glaciers. Thatmay bethe reason why HCH concentrations observed in Dasuopuglacier and Mt. Qomolangma region are lower than generalconsideration. Further investigation is apparently needed byassessing atmospheric concentration of POPs in the wholeregions of the Himalayas through the year coupled with backtrajectory analysis of the air mass.
DDTmetabolites (p-p'-DDD) andp-p'-DDTwere occasionallydetected in firn core samples. DDE has no insecticidal uses andin the environment it mainly comes from the degradation ofDDT. In this study, no p-p′-DDE was detected in any of thesamples. This result suggests a currently used source of DDTmay exist nearMt. Xixiabangma. Our previous results indicate apossible new source of DDT, existing in the Himalaya region(Wang et al., 2006). The value of DDT concentration observed inthis study is relatively lower as compared with other mountainregions (Table 2). Low level of DDTs was found in firn coresamples in spite of the mountain region in the vicinity of DDTsource. This may be caused by the lower volatility of DDTs,which leads to its short-distance migration in environment.
4.2. Polycyclic aromatic hydrocarbons (PAHs) concentrationsin Dasuopu firn core
Only five PAH compounds (Acenaphthylene (Ace), Anthracene(Ant), Phenanthrene (Phe), Fluoranthene (Fla) and Pyrene(Pyr))were detected above the determination limits. No PAHs withfive or more aromatic rings was observed to be present abovethe detection limits, although it has been shown that theparticle fraction of “Asian Brown Cloud” can carry a significantamount of PAHs to mountain region (Loewen et al., 2005). Theexclusion of 5-ring PAHs in firn core samplesmay be attributedto the behavior of particulate phase PAHs, which results inpreferential fall-out before reaching high altitude (Carrera et al.,2001). In our previous investigation, we have observed thenegative correlation between concentration of PAHs and eleva-tion. Concentration of heavy PAHs decreased with increasingelevation along amountain slope (Wang et al., 2006). The heavyPAHs, owing to the relatively lowvolatility and close associationwith particles, once deposited from the air, they may store orcycle in the soil–water–plant system, rather than being trans-ported (hopping) to a higher altitude (Liu et al., 2005). Totalglacier PAHs of our research was below 26 ng/l. This level is thesameas that of Europeanmountains (Table2).AceandPhewerethemost abundantmeasured compounds and their concentra-tions also account for most of the variability of total PAHconcentration. Enhanced deposition of low molecular weightcompounds at high altitude sites was also observed by otherauthors (Dickhut and Gustafson, 1995). From the brown snowevents occurred in the Canadian Arctic, catchment area of LakeSiskiwit and some European sites, researches obtained suchPAHs distribution pattern: Phe is the dominated PAHs and Flaand Pyr are the secondmajor compounds (Welch et al., 1991;McVeety andHites, 1988). Therefore, it can be deduced that vapourcompounds of PAHs could be significantly scavenged by snowand gas scavenging may give major contribution to PAHdeposition. Due to the low temperature, PAH with 3–4 ringscan condense on the atmospheric particles and be transportedto high elevation sites, subsequently depositing in snow. Thepotentially large surface area of snow flakes is efficient inadsorbing gaseous PAHs.Moreover, light PAHs tend to associatewith the air–ice interface (Wania et al., 1999), which may beanother reason that the snow scavenging process of light PAHsmay be more important at high altitude.
Contrary to typical individual PAH composition in sedimentin other polluted areas, a higher proportion of low molecularweight PAHs (2–4 ring) dominated in the samples of Dasuopuglacier, which may reflect the presence of significant combus-tion products from low-temperature pyrogenic processes suchas coal and firewood combustion (Mai et al., 2003). Energyconsumption in India and other adjacent areas may influencethe distribution pattern of PAHs in firn core samples. Forexample, firewoodwasmorecommonlyused forheatingathighaltitude than at lower elevations in India (Bhatt and Sachan,2004). With annual production of 310 million tonnes andimports of almost 25 million tonnes, coal provides one-third ofenergy supply in India (http://www.iea.org/textbase/nppdf/free/2000/coalinindia2002.pdf). Incomplete combustion of coal andwood aroundmountain regions can emit lowmolecular weightPAHs (2–4 ring), leading to the higher percentage of thesepollutants in environment.
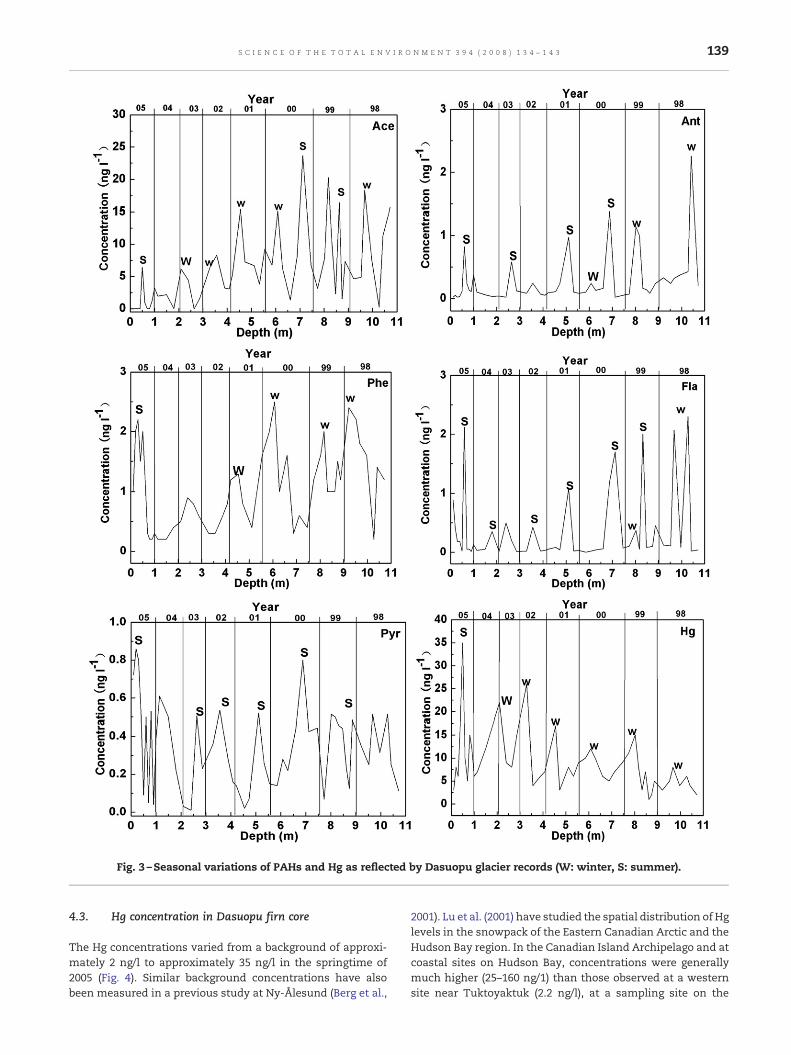
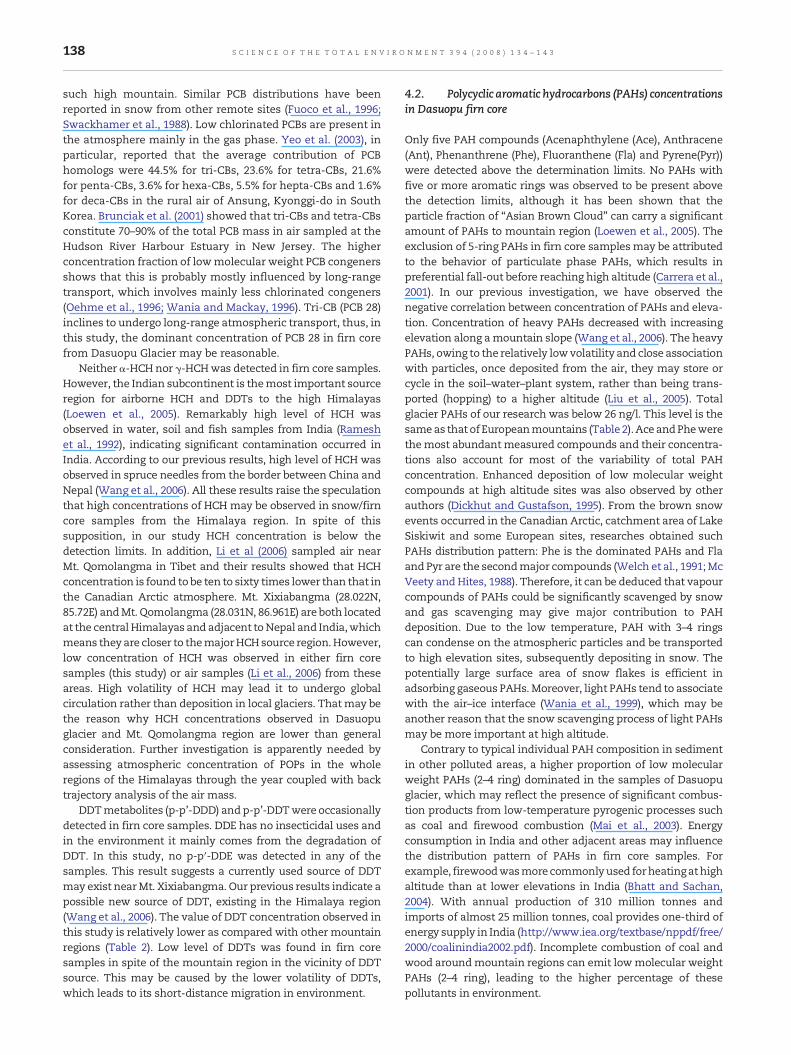
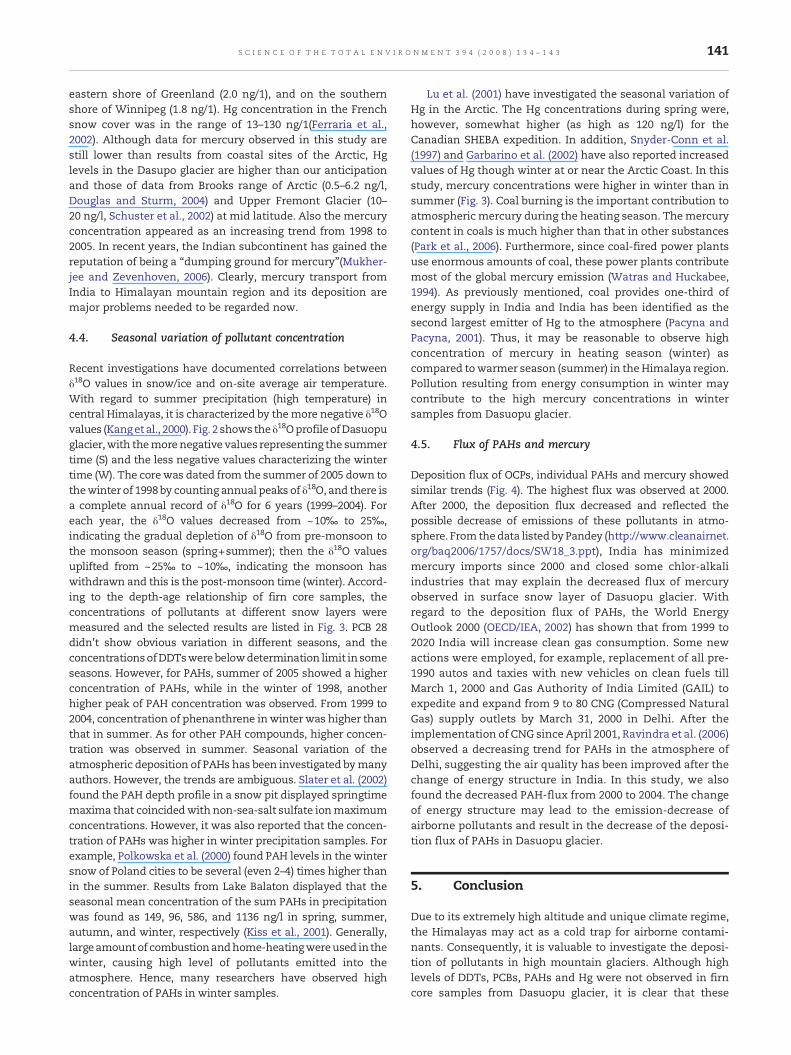
Fig. 3 –Seasonal variations of PAHs and Hg as reflected by Dasuopu glacier records (W: winter, S: summer).
139S C I E N C E O F T H E T O T A L E N V I R O N M E N T 3 9 4 ( 2 0 0 8 ) 1 3 4 – 1 4 3
4.3. Hg concentration in Dasuopu firn core
The Hg concentrations varied from a background of approxi-mately 2 ng/l to approximately 35 ng/l in the springtime of2005 (Fig. 4). Similar background concentrations have alsobeen measured in a previous study at Ny-Ålesund (Berg et al.,
2001). Lu et al. (2001) have studied the spatial distribution of Hglevels in the snowpack of the Eastern Canadian Arctic and theHudson Bay region. In the Canadian Island Archipelago and atcoastal sites on Hudson Bay, concentrations were generallymuch higher (25–160 ng/1) than those observed at a westernsite near Tuktoyaktuk (2.2 ng/l), at a sampling site on the
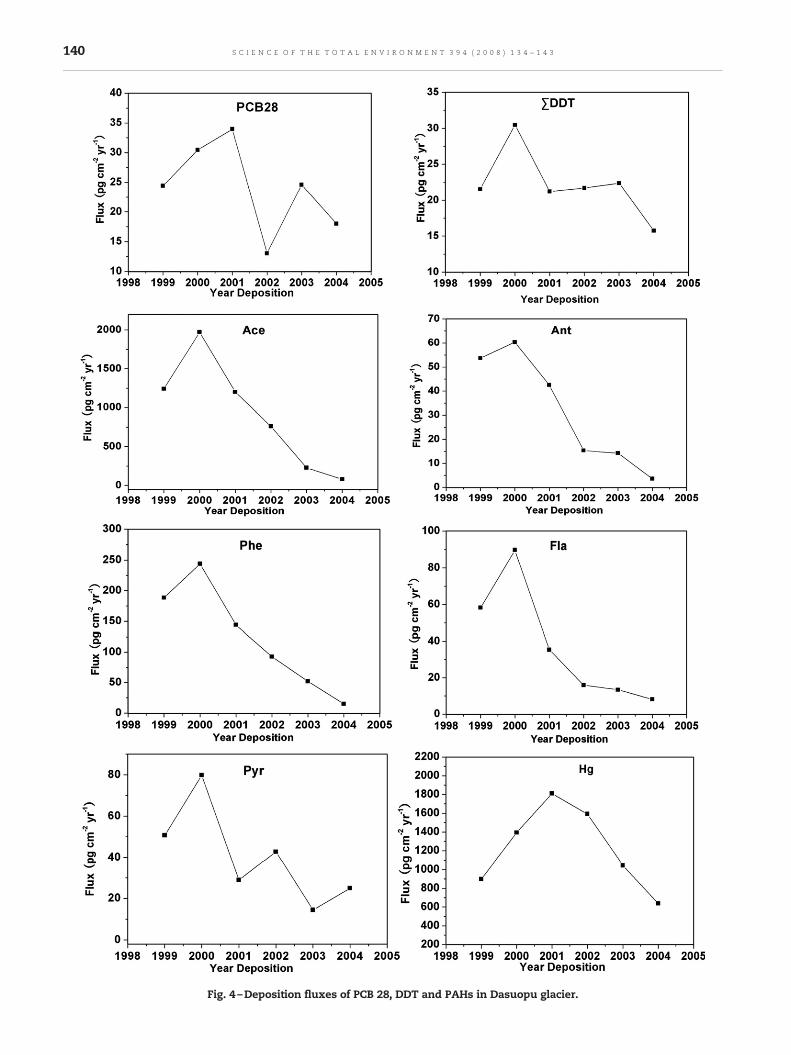
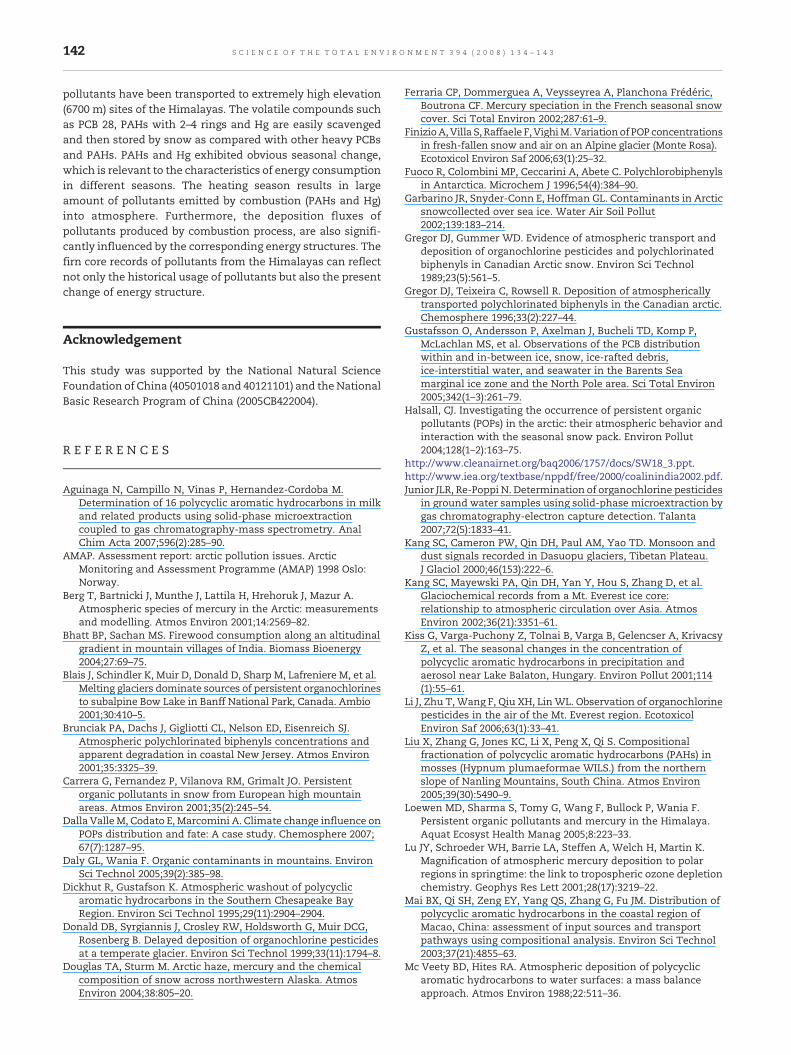
Fig. 4 –Deposition fluxes of PCB 28, DDT and PAHs in Dasuopu glacier.
140 S C I E N C E O F T H E T O T A L E N V I R O N M E N T 3 9 4 ( 2 0 0 8 ) 1 3 4 – 1 4 3
141S C I E N C E O F T H E T O T A L E N V I R O N M E N T 3 9 4 ( 2 0 0 8 ) 1 3 4 – 1 4 3
eastern shore of Greenland (2.0 ng/1), and on the southernshore of Winnipeg (1.8 ng/1). Hg concentration in the Frenchsnow cover was in the range of 13–130 ng/1(Ferraria et al.,2002). Although data for mercury observed in this study arestill lower than results from coastal sites of the Arctic, Hglevels in the Dasupo glacier are higher than our anticipationand those of data from Brooks range of Arctic (0.5–6.2 ng/l,Douglas and Sturm, 2004) and Upper Fremont Glacier (10–20 ng/l, Schuster et al., 2002) at mid latitude. Also the mercuryconcentration appeared as an increasing trend from 1998 to2005. In recent years, the Indian subcontinent has gained thereputation of being a “dumping ground for mercury”(Mukher-jee and Zevenhoven, 2006). Clearly, mercury transport fromIndia to Himalayan mountain region and its deposition aremajor problems needed to be regarded now.
4.4. Seasonal variation of pollutant concentration
Recent investigations have documented correlations betweenδ18O values in snow/ice and on-site average air temperature.With regard to summer precipitation (high temperature) incentral Himalayas, it is characterized by themore negative δ18Ovalues (Kangetal., 2000). Fig. 2 shows theδ18OprofileofDasuopuglacier,with themorenegative values representing the summertime (S) and the less negative values characterizing the wintertime (W). The corewas dated from the summer of 2005 down tothewinter of 1998 by counting annual peaks of δ18O, and there isa complete annual record of δ18O for 6 years (1999–2004). Foreach year, the δ18O values decreased from ~10‰ to 25‰,indicating the gradual depletion of δ18O from pre-monsoon tothe monsoon season (spring+summer); then the δ18O valuesuplifted from ~25‰ to ~10‰, indicating the monsoon haswithdrawn and this is the post-monsoon time (winter). Accord-ing to the depth-age relationship of firn core samples, theconcentrations of pollutants at different snow layers weremeasured and the selected results are listed in Fig. 3. PCB 28didn't show obvious variation in different seasons, and theconcentrationsofDDTswerebelowdetermination limit insomeseasons. However, for PAHs, summer of 2005 showed a higherconcentration of PAHs, while in the winter of 1998, anotherhigher peak of PAH concentration was observed. From 1999 to2004, concentration of phenanthrene inwinter was higher thanthat in summer. As for other PAH compounds, higher concen-tration was observed in summer. Seasonal variation of theatmospheric deposition of PAHs has been investigated bymanyauthors. However, the trends are ambiguous. Slater et al. (2002)found the PAH depth profile in a snow pit displayed springtimemaxima that coincidedwith non-sea-salt sulfate ionmaximumconcentrations. However, it was also reported that the concen-tration of PAHs was higher in winter precipitation samples. Forexample, Polkowska et al. (2000) found PAH levels in the wintersnow of Poland cities to be several (even 2–4) times higher thanin the summer. Results from Lake Balaton displayed that theseasonal mean concentration of the sum PAHs in precipitationwas found as 149, 96, 586, and 1136 ng/l in spring, summer,autumn, and winter, respectively (Kiss et al., 2001). Generally,largeamountof combustionandhome-heatingwereused in thewinter, causing high level of pollutants emitted into theatmosphere. Hence, many researchers have observed highconcentration of PAHs in winter samples.
Lu et al. (2001) have investigated the seasonal variation ofHg in the Arctic. The Hg concentrations during spring were,however, somewhat higher (as high as 120 ng/l) for theCanadian SHEBA expedition. In addition, Snyder-Conn et al.(1997) and Garbarino et al. (2002) have also reported increasedvalues of Hg though winter at or near the Arctic Coast. In thisstudy, mercury concentrations were higher in winter than insummer (Fig. 3). Coal burning is the important contribution toatmospheric mercury during the heating season. Themercurycontent in coals is much higher than that in other substances(Park et al., 2006). Furthermore, since coal-fired power plantsuse enormous amounts of coal, these power plants contributemost of the global mercury emission (Watras and Huckabee,1994). As previously mentioned, coal provides one-third ofenergy supply in India and India has been identified as thesecond largest emitter of Hg to the atmosphere (Pacyna andPacyna, 2001). Thus, it may be reasonable to observe highconcentration of mercury in heating season (winter) ascompared towarmer season (summer) in the Himalaya region.Pollution resulting from energy consumption in winter maycontribute to the high mercury concentrations in wintersamples from Dasuopu glacier.
4.5. Flux of PAHs and mercury
Deposition flux of OCPs, individual PAHs and mercury showedsimilar trends (Fig. 4). The highest flux was observed at 2000.After 2000, the deposition flux decreased and reflected thepossible decrease of emissions of these pollutants in atmo-sphere. Fromthedata listed by Pandey (http://www.cleanairnet.org/baq2006/1757/docs/SW18_3.ppt), India has minimizedmercury imports since 2000 and closed some chlor-alkaliindustries that may explain the decreased flux of mercuryobserved in surface snow layer of Dasuopu glacier. Withregard to the deposition flux of PAHs, the World EnergyOutlook 2000 (OECD/IEA, 2002) has shown that from 1999 to2020 India will increase clean gas consumption. Some newactions were employed, for example, replacement of all pre-1990 autos and taxies with new vehicles on clean fuels tillMarch 1, 2000 and Gas Authority of India Limited (GAIL) toexpedite and expand from 9 to 80 CNG (Compressed NaturalGas) supply outlets by March 31, 2000 in Delhi. After theimplementation of CNG since April 2001, Ravindra et al. (2006)observed a decreasing trend for PAHs in the atmosphere ofDelhi, suggesting the air quality has been improved after thechange of energy structure in India. In this study, we alsofound the decreased PAH-flux from 2000 to 2004. The changeof energy structure may lead to the emission-decrease ofairborne pollutants and result in the decrease of the deposi-tion flux of PAHs in Dasuopu glacier.
5. Conclusion
Due to its extremely high altitude and unique climate regime,the Himalayas may act as a cold trap for airborne contami-nants. Consequently, it is valuable to investigate the deposi-tion of pollutants in high mountain glaciers. Although highlevels of DDTs, PCBs, PAHs and Hg were not observed in firncore samples from Dasuopu glacier, it is clear that these
142 S C I E N C E O F T H E T O T A L E N V I R O N M E N T 3 9 4 ( 2 0 0 8 ) 1 3 4 – 1 4 3
pollutants have been transported to extremely high elevation(6700 m) sites of the Himalayas. The volatile compounds suchas PCB 28, PAHs with 2–4 rings and Hg are easily scavengedand then stored by snow as compared with other heavy PCBsand PAHs. PAHs and Hg exhibited obvious seasonal change,which is relevant to the characteristics of energy consumptionin different seasons. The heating season results in largeamount of pollutants emitted by combustion (PAHs and Hg)into atmosphere. Furthermore, the deposition fluxes ofpollutants produced by combustion process, are also signifi-cantly influenced by the corresponding energy structures. Thefirn core records of pollutants from the Himalayas can reflectnot only the historical usage of pollutants but also the presentchange of energy structure.
Acknowledgement
This study was supported by the National Natural ScienceFoundation of China (40501018 and 40121101) and theNationalBasic Research Program of China (2005CB422004).
R E F E R E N C E S
Aguinaga N, Campillo N, Vinas P, Hernandez-Cordoba M.Determination of 16 polycyclic aromatic hydrocarbons in milkand related products using solid-phase microextractioncoupled to gas chromatography-mass spectrometry. AnalChim Acta 2007;596(2):285–90.
AMAP. Assessment report: arctic pollution issues. ArcticMonitoring and Assessment Programme (AMAP) 1998 Oslo:Norway.
Berg T, Bartnicki J, Munthe J, Lattila H, Hrehoruk J, Mazur A.Atmospheric species of mercury in the Arctic: measurementsand modelling. Atmos Environ 2001;14:2569–82.
Bhatt BP, Sachan MS. Firewood consumption along an altitudinalgradient in mountain villages of India. Biomass Bioenergy2004;27:69–75.
Blais J, Schindler K, Muir D, Donald D, Sharp M, Lafreniere M, et al.Melting glaciers dominate sources of persistent organochlorinesto subalpine Bow Lake in Banff National Park, Canada. Ambio2001;30:410–5.
Brunciak PA, Dachs J, Gigliotti CL, Nelson ED, Eisenreich SJ.Atmospheric polychlorinated biphenyls concentrations andapparent degradation in coastal New Jersey. Atmos Environ2001;35:3325–39.
Carrera G, Fernandez P, Vilanova RM, Grimalt JO. Persistentorganic pollutants in snow from European high mountainareas. Atmos Environ 2001;35(2):245–54.
Dalla ValleM, Codato E, Marcomini A. Climate change influence onPOPs distribution and fate: A case study. Chemosphere 2007;67(7):1287–95.
Daly GL, Wania F. Organic contaminants in mountains. EnvironSci Technol 2005;39(2):385–98.
Dickhut R, Gustafson K. Atmospheric washout of polycyclicaromatic hydrocarbons in the Southern Chesapeake BayRegion. Environ Sci Technol 1995;29(11):2904–2904.
Donald DB, Syrgiannis J, Crosley RW, Holdsworth G, Muir DCG,Rosenberg B. Delayed deposition of organochlorine pesticidesat a temperate glacier. Environ Sci Technol 1999;33(11):1794–8.
Douglas TA, Sturm M. Arctic haze, mercury and the chemicalcomposition of snow across northwestern Alaska. AtmosEnviron 2004;38:805–20.
Ferraria CP, Dommerguea A, Veysseyrea A, Planchona Frédéric,Boutrona CF. Mercury speciation in the French seasonal snowcover. Sci Total Environ 2002;287:61–9.
FinizioA,Villa S, Raffaele F,VighiM.Variationof POP concentrationsin fresh-fallen snow and air on an Alpine glacier (Monte Rosa).Ecotoxicol Environ Saf 2006;63(1):25–32.
Fuoco R, Colombini MP, Ceccarini A, Abete C. Polychlorobiphenylsin Antarctica. Microchem J 1996;54(4):384–90.
Garbarino JR, Snyder-Conn E, Hoffman GL. Contaminants in Arcticsnowcollected over sea ice. Water Air Soil Pollut2002;139:183–214.
Gregor DJ, Gummer WD. Evidence of atmospheric transport anddeposition of organochlorine pesticides and polychlorinatedbiphenyls in Canadian Arctic snow. Environ Sci Technol1989;23(5):561–5.
Gregor DJ, Teixeira C, Rowsell R. Deposition of atmosphericallytransported polychlorinated biphenyls in the Canadian arctic.Chemosphere 1996;33(2):227–44.
Gustafsson O, Andersson P, Axelman J, Bucheli TD, Komp P,McLachlan MS, et al. Observations of the PCB distributionwithin and in-between ice, snow, ice-rafted debris,ice-interstitial water, and seawater in the Barents Seamarginal ice zone and the North Pole area. Sci Total Environ2005;342(1–3):261–79.
Halsall, CJ. Investigating the occurrence of persistent organicpollutants (POPs) in the arctic: their atmospheric behavior andinteraction with the seasonal snow pack. Environ Pollut2004;128(1–2):163–75.
http://www.cleanairnet.org/baq2006/1757/docs/SW18_3.ppt.http://www.iea.org/textbase/nppdf/free/2000/coalinindia2002.pdf.Junior JLR, Re-Poppi N. Determination of organochlorine pesticides
in ground water samples using solid-phase microextraction bygas chromatography-electron capture detection. Talanta2007;72(5):1833–41.
Kang SC, Cameron PW, Qin DH, Paul AM, Yao TD. Monsoon anddust signals recorded in Dasuopu glaciers, Tibetan Plateau.J Glaciol 2000;46(153):222–6.
Kang SC, Mayewski PA, Qin DH, Yan Y, Hou S, Zhang D, et al.Glaciochemical records from a Mt. Everest ice core:relationship to atmospheric circulation over Asia. AtmosEnviron 2002;36(21):3351–61.
Kiss G, Varga-Puchony Z, Tolnai B, Varga B, Gelencser A, KrivacsyZ, et al. The seasonal changes in the concentration ofpolycyclic aromatic hydrocarbons in precipitation andaerosol near Lake Balaton, Hungary. Environ Pollut 2001;114(1):55–61.
Li J, Zhu T, Wang F, Qiu XH, LinWL. Observation of organochlorinepesticides in the air of the Mt. Everest region. EcotoxicolEnviron Saf 2006;63(1):33–41.
Liu X, Zhang G, Jones KC, Li X, Peng X, Qi S. Compositionalfractionation of polycyclic aromatic hydrocarbons (PAHs) inmosses (Hypnum plumaeformae WILS.) from the northernslope of Nanling Mountains, South China. Atmos Environ2005;39(30):5490–9.
Loewen MD, Sharma S, Tomy G, Wang F, Bullock P, Wania F.Persistent organic pollutants and mercury in the Himalaya.Aquat Ecosyst Health Manag 2005;8:223–33.
Lu JY, Schroeder WH, Barrie LA, Steffen A, Welch H, Martin K.Magnification of atmospheric mercury deposition to polarregions in springtime: the link to tropospheric ozone depletionchemistry. Geophys Res Lett 2001;28(17):3219–22.
Mai BX, Qi SH, Zeng EY, Yang QS, Zhang G, Fu JM. Distribution ofpolycyclic aromatic hydrocarbons in the coastal region ofMacao, China: assessment of input sources and transportpathways using compositional analysis. Environ Sci Technol2003;37(21):4855–63.
Mc Veety BD, Hites RA. Atmospheric deposition of polycyclicaromatic hydrocarbons to water surfaces: a mass balanceapproach. Atmos Environ 1988;22:511–36.
143S C I E N C E O F T H E T O T A L E N V I R O N M E N T 3 9 4 ( 2 0 0 8 ) 1 3 4 – 1 4 3
Melnikov S, Carroll J, Gorshkov A, Vlasov S, Dahle S. Snow and iceconcentrationsof selectedpersistentpollutants in theOb-YeniseyRiver watershed. Sci Total Environ 2003;306(1–3):27–37.
Method1631, U.S.EPA. Revision B Mercury in water by oxidation,purge and trap, and cold vapor atomic fluorescencespectrometry. U.S. environmental protection agency, officeof water, office of science and technology, engineering andanalysis division (4303):Washington, DC; 1999. Jan.
Mitra AP, Sharma C. Indian aerosols: present status. Chemosphere2002;49(9):1175–90.
Mukherjee AB, Zevenhoven R. Mercury in coal ash and its fate inthe Indian subcontinent: a synoptic review. Sci Total Environ2006;368:384–92.
OECD/IEA. Coal in the energy supply of India. Paris, France7 OECD/IEA; 2002.
Oehme M, Haugen JE, Schlabac M. Seasonal changes and relationsbetween levels of organochlorines in Arctic ambient air: firstresults of an all-year-round monitoring program atNy-Ålesund, Svalbard, Norway. Environ Sci Technol1996;30:2294–304.
Pacyna JM, Pacyna E. An assessment of global and regionalemissions of trace metals to the atmosphere fromanthropogenic sources worldwide. Environ Rev 2001;9:268–98.
Park JY, Won JH, Lee TG. Mercury analysis of various types of coalusing acid extraction and pyrolysis methods. Energy Fuels2006;20(6):2413–6.
Perez-Trujillo JP, Frias S, Conde JE, Rodriguez-Delgado MA.Comparison of different coatings in solid-phasemicroextractionfor the determination of organochlorine pesticides in groundwater. J Chromatogr 2002;963(1–2):95–105.
Peters AJ, Gregor DJ, Teixeira CF, Jones NP, Spencer C. The recentdepositional trend of polycyclic aromatic hydrocarbons andelemental carbon to the Agassiz Ice Cap, Ellesmere Island,Canada. Sci Total Environ 1995;160–161:167–79.
PolkowskaZ,KotA,WiergowskiM,Wolska L,WolowskaK,NamiesHnik J. Organic pollutants in precipitation: determination ofpesticides and polycyclic aromatic hydrocarbons in GdanH sk,Poland. Atmos Environ 2000;34:1233–45.
Rahm L, Håkansson B, Larsson P, Fogelqvist E, Bremle G,Valderrama J. Nutrient and persistent pollutant deposition onthe Bothnian Bay ice and snow fields. Water Air Soil Pollut1995;84(1):187–201.
Ramesh A, Tanabe S, Kannan K, Subramanian AN, Kumaran PL,Tatsukawa R. Characteristic trend of persistent organochlorinecontamination in wildlife from a tropical agriculturalwatershed, South-India. Arch Environ Contam Toxicol 1992;23(1):26–36.
Ravindra K, Wauters E, Tyagi SK, Mor S, Geieken R. Assessment ofair quality after the implementation of compressed natural gas(CNG) as fuel in public transport in Delhi, India. Environ MonitAssess 2006;115:405–17.
Risebrough RW, Walker WI, Schmidt TT, Delappe BW, ConnorsCW. Transfer of chlorinated biphenyls to Antarctica. Nature1976;264:738–9.
Slater JF, Currie LA, Dibb JE, Benner Jr BA. Distinguishing therelative contribution of fossil fuel and biomass combustionaerosols deposited at Summit, Greenland through isotopic andmolecular characterization of insoluble carbon. Atmos Environ2002;36:4463–77.
Snyder-Conn E, Garbarino JR, Hoffman GL, Oelkers A. Soluble traceelements and total mercury in Arctic Alaskan snow. Arctic1997;50:201–15.
Schuster PF, Krabbenhoft DP, Naftz DL, Cecil D, Olson ML, DewildJF, et al. Atmospheric mercury deposition during the last270 years: a glacial ice core record of natural and anthropogenicsources. Environ Sci Technol 2002;36:2303–10.
SwackhamerDL,McVeety BD, Hites RA. Deposition and evaporationof polychlorobiphenyl congeners to and from Siskiwit Lake, IsleRoyale, Lake Superior. Environ Sci Technol 1988;22(6):664–72.
Valsecchi S, Smiraglia C, Tartari G, Polesello S. Chemicalcomposition of Monsoon deposition in the Everest region.Sci Total Environ 1999;226(2–3):187–99.
Wang XP, Yao TD, Cong ZY, Yan XL, Kang SC, Zhang Y. Gradientdistribution of persistent organic contaminants along northernslope of central-Himalayas, China. Sci Total Environ 2006;372(1):193–202.
Wania F, Mackay D. A global distribution model for persistentorganic chemicals. Sci Total Environ 1995;160/161:211–32.
Wania F, Mackay D. Tracking the distribution of persistent organicpollutants. Environ Sci Technol 1996;30:390A–6A.
Wania F, Mackay D, Hoff JT. The importance of snow scavenging ofpolychlorinated biphenyl and polycyclic aromatic hydrocarbonvapors. Environ Sci Technol 1999;33(1):195–7.
Watras CJ, Huckabee W. Mercury pollution integration andsynthesis. Boca Raton, FL: Lewis Publishers; 1994.
Welch HE, Muri DCG, Billeck BN, Lockhart WL, Burnskill GJ, KlingHJ, Olson MP Lemoine RM. Brown snow: a long-range transportevent in the Canadian Arctic. Environ Sci Technol1991;25:280–6.
Yeo HG, Choi M, Chun MY, Sunwoo Y. Concentration distributionof polychlorinated biphenyls and organochlorine pesticidesand their relationship with temperature in rural air of Korea.Atmos Environ 2003;37:3831–9.
Related Documents