THE RECEIVER OPERATING CHARACTERISTIC FANTINO SEMINAR APRIL 10, 2013 UCSD STEPHEN LINK 4/10/2013 LINK AT THE FANTINO SEMINAR 1

THE RECEIVER OPERATING CHARACTERISTIC FANTINO SEMINAR APRIL 10, 2013 UCSD STEPHEN LINK 4/10/2013LINK AT THE FANTINO SEMINAR1.
Dec 17, 2015
Welcome message from author
This document is posted to help you gain knowledge. Please leave a comment to let me know what you think about it! Share it to your friends and learn new things together.
Transcript
LINK AT THE FANTINO SEMINAR 1
THE RECEIVER OPERATINGCHARACTERISTIC
FANTINO SEMINARAPRIL 10, 2013
UCSD
STEPHEN LINK
4/10/2013

LINK AT THE FANTINO SEMINAR 24/10/2013

LINK AT THE FANTINO SEMINAR 34/10/2013
LINK AT THE FANTINO SEMINAR 4
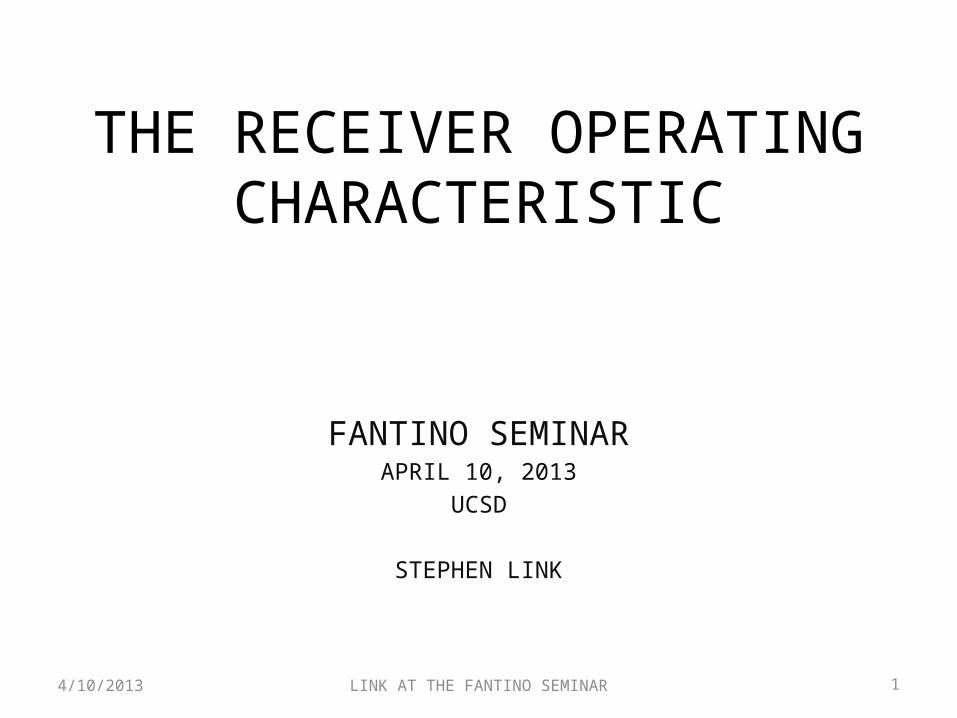
Fechner’s experiments on human sensory discrimination were based on a theory of how two
sensory stimuli are compared.
WA = Standard weight of say 300g
Versus
WB = Comparison weight of 320g
How does the subject decide that
WB is greater in weight than the Standard, WA?
4/10/2013

LINK AT THE FANTINO SEMINAR 5
THE THEORY
4/10/2013

LINK AT THE FANTINO SEMINAR 64/10/2013

LINK AT THE FANTINO SEMINAR 7
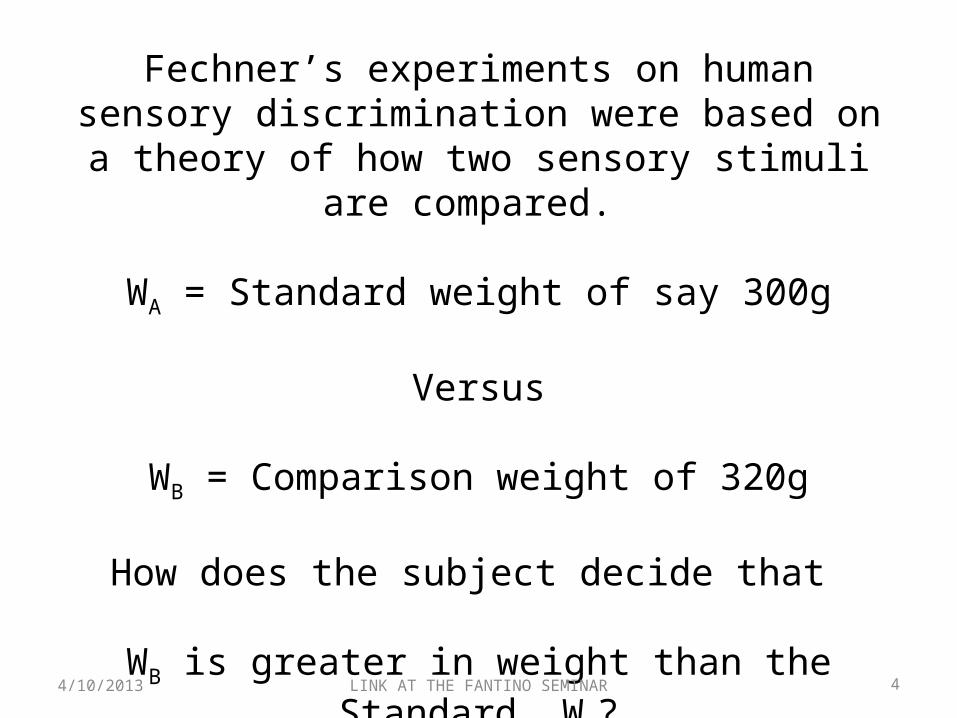
Because these are Gaussian (Normal) distributions Fechner could use response probabilities to determine the unknown value of t.
4/10/2013

LINK AT THE FANTINO SEMINAR 8
Then knowing that 2t equaled the distance between the two means divided by the standard deviation he determined the unknown variability within the nervous system by computing Mean Heaviness(WB) – Mean Heaviness(WA)
2t = ----------------------------------------- s= 𝑠𝑡𝑎𝑛𝑑𝑎𝑟𝑑 𝑑𝑖𝑣𝑖𝑎𝑡𝑖𝑜𝑛
Mean H(WB)– Mean H(WA)s = -----------------------------------
2t
4/10/2013

LINK AT THE FANTINO SEMINAR 9
Fechner did not know the Heaviness created by a weightbut he did know the physical weight. He substituted the
known physical weight to obtain a measure of the variability of heaviness in the human nervous system
IN UNITS OF THE PHYSICAL STIMULUS.
320g – 300g s = ----------------------------------------
2t
Suppose there were 75% correct responsesand 25% errors
then t =0.675 and
10gs = -------------------------------------
0.675
= 14.8g
PSYCHOLOGY became a science.4/10/2013

LINK AT THE FANTINO SEMINAR 104/10/2013
As a measure of the sensitivity of the subject Fechner used 1/s.When the variability was great, s was large and 1/s was smallIndicating little sensitivity. But when the variability was smallThe value of 1/s was large indicating high sensitivity
0 0.5 1 1.5 2 2.5 3 3.5 4 4.50
2
4
6
8
10
12
Sensitivity
sensivity
Standard deviation
Sens
itivi
ty

LINK AT THE FANTINO SEMINAR 114/10/2013
BUT THERE WAS ANOTHER WAY TO USE THE IDEAS.
LINK AT THE FANTINO SEMINAR 124/10/2013
75% Correct responses
75% Correct responses

LINK AT THE FANTINO SEMINAR 134/10/2013
0.00 0.50 1.00 1.50 2.00 2.50 3.000.500
0.750
1.000
PROBABILITY CORRECT
P(Correct)
75% Correct Threshold
Standard deviation
P(Co
rrec
t)
For a fixed pair of stimuli the difference between the meansis fixed. But if the standard deviation changes the number of correct responses will change as shown in this figure.

LINK AT THE FANTINO SEMINAR 144/10/2013
0.00 0.50 1.00 1.50 2.00 2.50 3.000.500
0.750
1.000
P(Correct)
75% Correct Threshold
sd|Threshold
Standard deviation
P(Co
rrec
t)
In order to standardize measures of sensitivity scientistsbegan experiments to determine the comparison stimulusthat would generate 75% correct responses which corresponds to a fixed standard deviation and therefore a fixed sensitivity. In this way the 75% threshold was created to measure sensitivity.

LINK AT THE FANTINO SEMINAR 154/10/2013
290 300 310 320 330 340 350 3600.50
0.75
1.00
P(Correct|Comparison stimulus)
COMPARISON STIMULI
P(Co
rrec
t)
The comparison stimulus generating 75% correct responses became a useful criterion, called the 75% threshold, for comparing sensitivities both within and between subjects.

LINK AT THE FANTINO SEMINAR 164/10/2013
THE 75% THRESHOLD BECAME A UNIVERSAL CRITERION
FOR JUDGMENT

LINK AT THE FANTINO SEMINAR 174/10/2013
The End is Near
It looks like the participation in the Greek debt swap has passed the magic 75% threshold. Both Reuters and Dow Jones are reporting that number in the last hour quoting sources in the Greek government. A meeting of the Greek cabinet has just ended with Finance Minister Evangelos Venizelos saying that the debt swap is going well.
A 75% participation rate would push the swap above the 75% threshold that the Greek government says is its minimum for proceeding with the offer. A 75% participation rate is also above the 66% level that would let the Greek government invoke collective action clauses on 90% or so of the government’s outstanding debt and force holders of those bonds to participate in the swap.
The government has said that it will post the results for the swap offer, which ends tonight, on the website of the Greek Treasury at 6 a.m. Greenwich time tomorrow.
EVEN TODAY ONE FINDS EXAMPLES OF THE USE OF THE 75% THRESHOLD

LINK AT THE FANTINO SEMINAR 184/10/2013
GIVEN THE USEFULNESS OF THIS MEASURE OF SENSITIVITY WHAT IS
WRONG WITH USING THE 75% THRESHOLD AS A MEASURE OF
SENSITIVITY?

LINK AT THE FANTINO SEMINAR 19
World War II brought about a renewed interest in the abilities of soldiers to discriminate between stimuli. In particular, distinguishingbetween the noise of the surrounding ocean, as heard over earphonesand the sound of the ocean with a nearby submarine lurking within it.Sensitivity became critical to survival.
The idea of how to distinguish between the ocean noise and the noisewith the submarine somehow adding to the noise became important asthe German U2 wolfpacks destroyed vast numbers of ships transportingcargo to Europe from the United States and Canada.
The theory of how Sonar Operators could distinguish “Signal” fromNoise was the following:
4/10/2013

LINK AT THE FANTINO SEMINAR 20
HITS
CORRECTREJECTIONS
4/10/2013

LINK AT THE FANTINO SEMINAR 21
Sonar (originally an acronym for SOund Navigation And Ranging) is a technique that uses sound propagation (usually underwater, as in submarine navigation) to navigate, communicate with or detect objects on or under the surface of the water, such as other vessels.
The problem for the SONAR operator is apparent in our figure of the two distributions of loudness. If the value of t is too high the probability of not detecting a submarine when it is present is very high and the submarine blasts you out of the water.
4/10/2013

LINK AT THE FANTINO SEMINAR 22
If the value of t is too low even a passing school of fish may make you believe that a sub is present. You sound the alarm and wastea lot of depth charges only killing fish. You might deplete your store of depth charges to a dangerous level.
You must somehow optimize your value of t, your criterion, in making judgments. Now the value of the criterion is not fixed between the two means but may vary according to informationavailable to the SONAR operator.
4/10/2013

LINK AT THE FANTINO SEMINAR 23
CORRECTREJECTIONS
HITS
4/10/2013

LINK AT THE FANTINO SEMINAR 24
HITS
CORRECTREJECTIONS
4/10/2013
In Signal Detection Theory sensitivity is measured by
Mean[ Noise + Signal ] - Mean [ Noise ]d’ = ------------------------------------------------------------------------
standard deviation
= 2t in Fechner’s terms

LINK AT THE FANTINO SEMINAR 254/10/2013

LINK AT THE FANTINO SEMINAR 26
Tanner, Swets and Green (1956)Single subject discriminating between Noise and Noise +Signal
4/10/2013

LINK AT THE FANTINO SEMINAR 274/10/2013

LINK AT THE FANTINO SEMINAR 284/10/2013

LINK AT THE FANTINO SEMINAR 294/10/2013

LINK AT THE FANTINO SEMINAR 304/10/2013

LINK AT THE FANTINO SEMINAR 31
Visual Brightness
P(Y|n) P(Y|n)
Data from Tanner Swets and Birdsall 1955
Signal Detection Theory Luce’s Low Threshold Theory
4/10/2013

LINK AT THE FANTINO SEMINAR 32
Acoustic
P(Y|s) P(Y|s)
P(Y|n) P(Y|n)
SIGNAL DETECTION THEORY LUCE’S LOW THRESHOLD THEORY
4/10/2013

LINK AT THE FANTINO SEMINAR 334/10/2013

LINK AT THE FANTINO SEMINAR 344/10/2013

LINK AT THE FANTINO SEMINAR 35
R. C. Atkinson Theory: Variable Sensitivity ROCs
4/10/2013

LINK AT THE FANTINO SEMINAR4/10/2013 36

LINK AT THE FANTINO SEMINAR 37
!!! YIKES !!!
WHERE DO ALL THESE DIFFERENT ROC’S COME FROM?
THE STIMULI USED IN THE EXPERIMENTS ARE SIMILAR IF NOT IDENTICAL BUT SOMEHOW THE SUBJECTS GENERATE
ALL THESE DIFFERENT PERFORMANCES.
4/10/2013

LINK AT THE FANTINO SEMINAR 384/10/2013
Differences between the sensory values of two stimuliare added together over time until a response thresholdis exceeded. Then a response occurs

LINK AT THE FANTINO SEMINAR 39
LINK (1975), LINK & HEATH (1975), LINK (….)
4/10/2013

LINK AT THE FANTINO SEMINAR 40
ALL THE VARIOUS ROC’S CAN OCCUR BY
ROC FOR SIGNAL DETECTION THEORY
A. MOVING THE STARTING AMOUNT FROM A BIAS TOWARD RESPONDING HEAVIER TOWARD A BIAS FOR RESPONDING LIGHTER. THIS AMOUNTS TO REQUIRING DIFFERENT AMOUNTS OF INFORMATION TO DECIDE HAEVIER OR LIGHTER.
B. INCREASING THE TOTAL AMOUNT OF INFORMATION REQUIRED TO MAKE A RESPONSE. THE RESPONSE BARRIERS MOVE FURTHER APART. THIS RESULTS IN WHAT APPEARS TO BE AN INCREASE IN SENSITIVITY – BUT IS NOT. IT IS AN INCREASE IN THE AMOUNT OF INFORMATION REQUIRED TO MAKE EITHER RESPONSE.
4/10/2013

LINK AT THE FANTINO SEMINAR 414/10/2013
LUCE’S LOW THRESHOLD THEORY
HOLDING THE STARTING VALUE FIXED AND ONE RESPONSE BARRIER FIXED BUT VARYING THE OTHER RESPONSE BARRIER. THIS IS THE SAME AS REQUIRING MORE INFORMATION FOR ONE RESPONSE THAN THE OTHER.
THIS GENERATES TWO STRAIGHT LINE ROCS DEPENDING ON WHICH BARRIER IS HELD FIXED. LIKE IN THE LUCE THEORY.

LINK AT THE FANTINO SEMINAR 424/10/2013
ATKINSON’S VARIABLE SENSITIVITY THEORY
SWITCHING BETWEEN THE TWO STRATEGIES IN THE LUCE MODEL WITH DIFFERENT PROBABILITIES GENERATES THE UNIT SLOPE ATKINSON THEORY.

LINK AT THE FANTINO SEMINAR 43
FORTUNATELY THE CHANGES IN PERFORMANCE DUE TO CHANGES IN SENSITIVITY VERSUS
CHANGES IN THE AMOUNT OF INFORMATION REQUIRED FOR A RESPONSECAN BE DIFFERENTIATED WHEN RESPONSE TIMES ARE
COLLECTED WITH THE RESPONSE CHOICES.
That is why knowing the correct and error response timesis critical to interpreting a subject’s performance especially when examining the ROC.
That’s all there is to that.
THANK YOU
4/10/2013
Related Documents