October 2014 THE REAL COST OF SALT USE FOR WINTER MAINTENANCE IN THE TWIN CITIES METROPOLITAN AREA

Welcome message from author
This document is posted to help you gain knowledge. Please leave a comment to let me know what you think about it! Share it to your friends and learn new things together.
Transcript

October 2014
THE REAL COST OF SALT USE FOR WINTER MAINTENANCE IN THE TWIN CITIES
METROPOLITAN AREA
cpenny
Typewritten Text
cpenny
Typewritten Text
wq-iw11-06bb

Fortin Consulting, Inc. Economic Analysis of Salt Use • October 2014 Minnesota Pollution Control Agency
Authors and contributors: Carolyn Dindorf, Fortin Consulting, Inc. Connie Fortin, Fortin Consulting, Inc. Contributing Authors: Brooke Asleson, Minnesota Pollution Control Agency John Erdmann, Minnesota Pollution Control Agency

Fortin Consulting, Inc. Economic Analysis of Salt Use • October 2014 Minnesota Pollution Control Agency
Contents Contents ........................................................................................................................................................ 1
LIST OF TABLES .............................................................................................................................................. 1
LIST OF FIGURES ............................................................................................................................................ 1
Acronyms ....................................................................................................................................................... i
Executive Summary ....................................................................................................................................... ii
1. Project Overview ................................................................................................................................... 1
Purpose ............................................................................................................................................................ 1
2. Material Use and Potential Reductions ................................................................................................ 2
3. The Real Cost of Deicing Salt Use .......................................................................................................... 4
Overall Estimates of Damage Costs Due to Deicing Salt Use ........................................................................... 6
Total Costs ........................................................................................................................................................ 7
4. Estimates of Cost Savings Based on Potential Deicing Salt Use Reductions ......................................... 9
5. Salt Reduction Case Studies ................................................................................................................ 11
6. Mitigating Impacts to Surface and Groundwater ............................................................................... 16
Hypothetical Impacts ..................................................................................................................................... 16
Cost to Remove Chloride from Water ............................................................................................................ 16
7. Conclusions ......................................................................................................................................... 17
8. Literature Cited ................................................................................................................................... 18
LIST OF TABLES TABLE 1. TCMA DEICING SALT USE AND COSTS ....................................................................................................................... 3 TABLE 2. COST OF DAMAGE PER TON OF SALT USED ................................................................................................................. 7 TABLE 3. TCMA COSTS FOR SALT, LABOR AND EQUIPMENT, AND DAMAGE FROM SALT USE ............................................................ 8 TABLE 4. POTENTIAL ANNUAL COST SAVINGS FROM REDUCED DEICING SALT USE IN THE TCMA ....................................................... 9
LIST OF FIGURES FIGURE 1. MNDOT HISTORICAL SALT USE .............................................................................................................................. 2 FIGURE 2. TCMA POTENTIAL COST SAVINGS FROM REDUCED DEICING SALT USE ......................................................................... 10
Fortin Consulting, Inc. Economic Analysis of Salt Use • September 2014 Minnesota Pollution Control Agency
i
Acronyms AASHTO American Association of State Highway and
Transportation Officials APWA American Public Works Association BMP Best Management Practice CTAP Circuit Training and Assistance Program EPA Environmental Protection Agency LTAP Local Technical Assistance Program mg/L milligrams per liter MPCA Minnesota Pollution Control Agency MnDOT Minnesota Department of Transportation MS4 Municipal Separate Storm Sewer Systems NMCWD Nine Mile Creek Watershed District RWIS Road Weather Information System TMDL Total Maximum Daily Load TCMA Twin Cities Metropolitan Area
Fortin Consulting, Inc. Economic Analysis of Salt Use • September 2014 Minnesota Pollution Control Agency
ii
Executive Summary Minnesota’s seven county, Twin Cities Metro Area (TCMA) uses about 349,000 tons of road salt each year (Sander et al. 2007, based on salt purchasing records). The chloride in salt is a toxic pollutant that accumulates over time in our waters. Thirty-eight stream reaches, lakes and wetlands are impaired for aquatic life due to high concentrations of chloride in the TCMA according to the Minnesota Pollution Control Agency’s (MPCA’s) 2014 Proposed 303(d) List of Impaired Waters (MPCA 2014a).
To examine the cost savings and other benefits of reducing salt use, scenarios were created to show hypothetical reductions of salt use from 10 to 70% at 10% increments. Seventy percent was selected as the upper bound since it is the approximate reduction needed for the Shingle Creek Total Maximum Daily Load (TMDL) Study, the first chloride TMDL in the State of Minnesota (Wenck Associates 2006). It is not known at present whether other requirements, safety foremost among them, can be met with a salt use reduction as high as 70%.
Using a 10% to 70% reduction in salt use, savings range from 34,900 tons to 244,000 tons. This would result in financial savings of $2.5 million to $17.8 million annually from lower purchases of salt, and $5.6 to $36 million annually in savings in labor and equipment.
Estimates of damage to infrastructure, automobiles, vegetation, human health and the environment due to road salt were found in the literature from several sources. They ranged from $803 to $3,341 per ton of road salt used. The money saved from reducing damage to infrastructure, vehicles, plants, water supplies and human health is much higher than that from the material and labor savings. At a 10% salt use reduction, annual savings in the TCMA for reduced material and applications costs plus reduced damages would amount to an estimated $36 to $124 million each year. At a 70% salt use reduction, savings would range from $251 to $870 million each year.
Removal of salt from water, on a large scale, can be done through reverse osmosis or distillation. These processes are used to purify drinking water. The cost to repair our freshwater ecosystems is mostly unknown. There are approximately 3,200 lakes and wetlands and over 680 stream reaches in the TCMA (Peichel 2013). Removing salt from our lakes, streams, wetlands, and groundwater in the TCMA would be logistically difficult and not financially feasible. Because of this, we must find ways to reduce or prevent salt from entering the TCMA freshwater systems.

Fortin Consulting, Inc. Economic Analysis of Salt Use • September 2014 Minnesota Pollution Control Agency
1
1. Project Overview
Purpose The purpose of this report is to examine the direct and indirect costs of road salt and the resulting cost savings of smart salt use. “Smart salting” means applying just enough chloride-based deicers at the right time, and in the right way, to minimize salt use without reducing the existing level of safety and service on the roads, parking lots and sidewalks. The economic analysis does not include a salt-free model because at this time our transportation and other winter maintenance organizations are not equipped, or easily able to switch to 100% non-chloride deicers, heated surfaces, gravel roads, studded snow tires or other non-chloride maintenance practices because of high costs.
This report is the result of a literature review that was completed as part of the TCMA Chloride Management Plan project for the MPCA.
This report provides estimates of the cost of damage to infrastructure, automobiles and the environment from using deicing salts. It also includes projection of salt cost savings, and hypothetical water pollution reductions from “smart salting”. It also looks at the ultimate cost to remove salt from our freshwater systems should this be required.
Fortin Consulting, Inc. Economic Analysis of Salt Use • September 2014 Minnesota Pollution Control Agency
2
2. Material Use and Potential Reductions
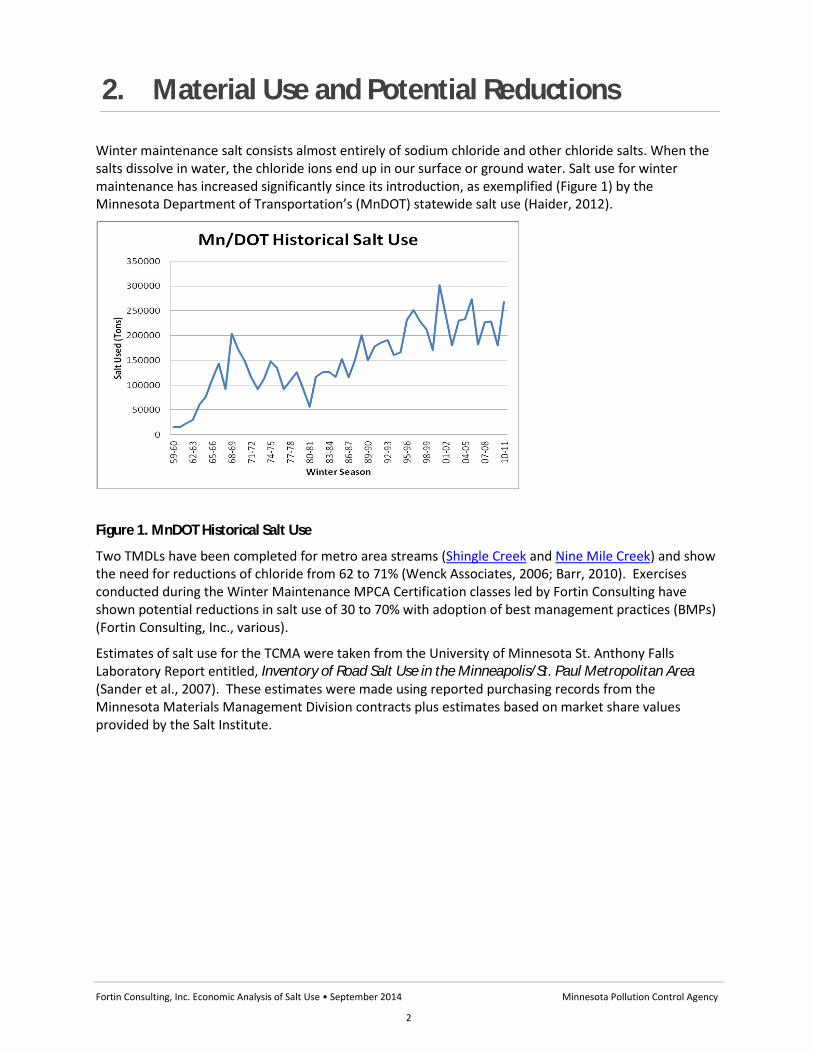
Winter maintenance salt consists almost entirely of sodium chloride and other chloride salts. When the salts dissolve in water, the chloride ions end up in our surface or ground water. Salt use for winter maintenance has increased significantly since its introduction, as exemplified (Figure 1) by the Minnesota Department of Transportation’s (MnDOT) statewide salt use (Haider, 2012).
Figure 1. MnDOT Historical Salt Use
Two TMDLs have been completed for metro area streams (Shingle Creek and Nine Mile Creek) and show the need for reductions of chloride from 62 to 71% (Wenck Associates, 2006; Barr, 2010). Exercises conducted during the Winter Maintenance MPCA Certification classes led by Fortin Consulting have shown potential reductions in salt use of 30 to 70% with adoption of best management practices (BMPs) (Fortin Consulting, Inc., various).
Estimates of salt use for the TCMA were taken from the University of Minnesota St. Anthony Falls Laboratory Report entitled, Inventory of Road Salt Use in the Minneapolis/St. Paul Metropolitan Area (Sander et al., 2007). These estimates were made using reported purchasing records from the Minnesota Materials Management Division contracts plus estimates based on market share values provided by the Salt Institute.

Fortin Consulting, Inc. Economic Analysis of Salt Use • September 2014 Minnesota Pollution Control Agency
3
Table 1. TCMA Deicing Salt Use and Costs
Deicing Salt Use*
(tons/yr)
Percent of
Total Use
Salt cost
per ton†
Salt use cost per year (millions)
TCMA Sector Salt Equip & Labor‡ Total
MnDOT 80,797 23% $67 $5 $12 $18
Counties 70,284 20% $67 $5 $11 $15
Cities 114,314 33% $67 $8 $17 $25
Private Commercial 66,349 19% $73 $5 $10 $15
Private Packaged 17,460 5% $160 $3 $3 $5
Total / Weighted Average 349,204 100% $73 $25 $52 $78
*(Sander et al. 2007; Stefan et al. 2008) † MnDOT (ca. 2011c); U.S. Salt (6/20/2012) ‡ Based on estimated equipment plus labor cost of $150/ton (Stefan et al. 2008)
To examine the cost savings of reducing salt use, calculations for reductions of salt use from 10 to 70% at 10% increments were completed. Seventy percent was selected as the upper bound since it is the approximate reduction needed for the Shingle Creek Chloride TMDL Study. Using potential reductions of 10 to 70% and a baseline of 349,000 tons used in the TCMA each year, the following annual salt and salt cost savings were calculated. With a 10% reduction, approximately 35,000 fewer tons of salt would be used. At a 70% reduction, 244,000 fewer tons of salt would be used.

Fortin Consulting, Inc. Economic Analysis of Salt Use • September 2014 Minnesota Pollution Control Agency
4
3. The Real Cost of Deicing Salt Use Salt use for winter maintenance is beneficial for public safety, but comes at a cost. According to the Road Safety Foundation, effective snow fighting on our roads cuts injury accidents by 88.3% and decreases crash costs by 10%. Additionally,
· During the first four hours after salt is applied, the direct road users’ benefits are $6.50 for every $1.00 spent on direct maintenance costs for the operation.
· The economic impact of snow-related closures far exceeds the cost of timely snow removal.
· Among all economic classes, snow related shutdowns harm hourly workers the most, accounting for almost two-thirds of direct economic losses.
· A one-day major snowstorm can cost a state $300-$700 million in both direct and indirect costs.
(Roadway Safety Foundation, undated)
Salt use for winter maintenance results in cost savings in some areas as indicated above, but not all costs are considered. The real cost of using road salt for winter maintenance comprises much more than the cost of the material. The cost of using deicers for winter maintenance includes the materials (deicer), equipment and labor to spread, and costs for maintenance and replacement of damaged infrastructure such as bridges and roadways, vehicle corrosion related costs, plant damage and the unknown costs due to impacts on our wildlife, soils, plants, and surface and groundwater resources.
Material Purchases Current road salt costs for MnDOT in the TCMA are $60 to $70/ton delivered (Schaefer, 2012). For the 2010-2011 winter season, salt cost averaged $67.04/ton for the state contract (MnDOT ca., 2011). Many cities and counties purchase salt under the state contract through cooperative purchasing. Some are able to get cheaper prices on their own. Private companies pay slightly higher prices for salt than the State, an average of $72.75/ton for bulk rock salt and $4 per 50 pound for bagged salt ($160/ton) (U.S. Salt, 2012). A weighted average cost per ton for salt (NaCl) in the TCMA is $73/ton (public and private, including packaged). The total spent annually in the TCMA on material is approximately $25 million for public and private uses (Table 1).
Labor and Equipment Stefan et al. (2008) estimated the cost of spreading the salt (labor and equipment) at $150/ton. A Transportation Research Board (TRB) study (1991) stated that state spending on deicing chemicals and abrasives for snow and ice control makes up 20 to 30% of the total costs. The remaining costs are labor (40%) and equipment (30%). Using a weighted average of $73/ton spent on road salt in the TCMA as 30% of total costs, total costs would be $243/ton. At 40%, labor costs would be $97/ton and at 30%, equipment costs would be $73/ton, giving a labor plus equipment subtotal of $170/ton. This is similar to the $150/ton reported by Stefan.
Using the more conservative value of $150/ton for labor and equipment (Stefan et al. 2008) and TCMA salt use of 349,000 tons/year (Table 3; Sander et al., 2007), annual TCMA costs for labor and equipment are estimated at $52 million. Potential labor and equipment savings estimates are presented in Table 4.
Infrastructure Costs associated with infrastructure are based on damage to infrastructure and maintenance and replacement costs associated with this damage. A study by economist Vitaliano (1992) included an estimate of expenditures of an additional $332/ton of salt per season for bridge maintenance. One ton of road salt results in $1,460 in corrosion damage to bridges, and indirect costs may be much higher (Sohanghpurwala 2008). The total annual cost of damages to bridge decks due to road salt was
Fortin Consulting, Inc. Economic Analysis of Salt Use • September 2014 Minnesota Pollution Control Agency
5
estimated at greater than $500 million nationwide (Murray and Ernst, 1976). Costs would be substantially higher now. In addition to damage to bridges, road salt also damages concrete pavement, requiring higher maintenance costs. Vitaliano (1992) estimates an overall increase in roadway maintenance costs of over $600/ton. This figure is believed to include the extra cost due to damage to bridges. Road salt is also damaging to parking garages and underground utilities (Michigan DOT, 1993).
Plants Vitaliano estimated that the aesthetic damage to trees in the Adirondacks due to road salt was $75/ton (1992). New York State Department of Transportation estimated a cost of $10,000/mile to replant and reestablish natural vegetation along a two mile stretch of highway in the Adirondacks (Adirondack Council, 2009).
Vehicle Corrosion Vitaliano (1992) estimated that vehicle depreciation due to corrosion from road salt results in a cost of $113/ton of salt. Automobile manufacturers have improved corrosion resistance in cars since the 1992 study; however, measures to protect vehicles against corrosion cost auto manufacturers an estimated $4 billion each year, which is passed on to consumers (Adirondack Council, 2009).
Groundwater Road salt application may result in higher chloride concentrations in groundwater. A recent MPCA study showed that 30% of wells tested in the TCMA exceeded the state’s standard for chloride (Kroening and Ferry, 2013). For drinking water, the larger concern is the sodium level, especially for individuals on a doctor recommended restricted sodium diet (USEPA , 2003; USEPA, 2014). Salt can also affect drinking water taste. The EPA set a recommended maximum contaminant level of 250 mg/L for chloride in drinking water, which is based on taste (USEPA, 2014).
The cost to clean up or replace a drinking water supply is substantial. According to a 1991 report, $10 million is spent nationally each year on mitigating impacts to groundwater from salt (Transportation Research Board, 1991). The United States uses approximately 20 million tons of deicing salt per year (Anning and Flynn, 2014). This equates to a cost of about $0.50/ton for mitigating groundwater impacts. A 1976 estimate (Murray and Ernst) was much higher, with a figure of $150 million per year for damages due to contamination of water supplies by deicing salt. This estimate includes more direct and indirect costs such as treating water, replacing wells, supplying bottled water, adding practices to prevent additional contamination, human health concerns, and property value damage. Using an estimate of 9 million tons of salt used in 1976, this equates to $16.67/ton for damages to water supplies.
Surface Water Chloride concentrations in lakes and streams in the TCMA as well as in many cold climate states have been increasing (Novotny et al., 2007; Novotny at al., 2008). Thirty-eight stream reaches, lakes and wetlands are impaired for aquatic life due to high concentrations of chloride in the TCMA according to MPCA’s 2014 Proposed303 (d) List of Impaired Waters (MPCA, 2014a). Impacts on lakes include interruption of the vertical mixing (turnover) process, and toxicity to aquatic life. It is difficult to put a financial value on these impacts; however, the Adirondack Watershed Institute (Kelting and Laxson, 2010) did a simulation of road salt impacts on surface waters and forests and showed a $2,320 per lane mile per year reduction in environmental value. With over 26,000 lane miles of roadways with impervious surfaces maintained by governmental entities in the TCMA (Sander et al., 2007), a rough estimate of economic impacts on surface waters and forests of $60 million per year can be made. Using the full amount of 349,000 tons of salt applied annually in the TCMA, this converts to a cost of $172/ton of salt. If the amount used by private companies is excluded (private packaged and bulk), the value increases to $227/ton of salt. These are not actual out-of-pocket costs, but indicate the cost of the loss of environmental value.

Fortin Consulting, Inc. Economic Analysis of Salt Use • September 2014 Minnesota Pollution Control Agency
6
Unknown Costs There are many additional costs related to impacts from road salt use which have not been estimated.
· Human Health: There are potential human health impacts from consuming drinking water higher in sodium due to contamination from deicing salt. Sodium can affect the taste of water at concentrations as low as 30 mg/L (USEPA, 2003).
· Aquatic life and water resources: No value has been assigned to impacts on aquatic life due to chloride toxicity or impacts on lake ecosystems whose natural turnover is disrupted due to formation of a chemocline caused by salt. Prevention of turnover can result in anoxia in the bottom of lakes and potential death of aquatic biota (Michigan DOT 1993). Increased salinity can result in loss of native plant species and invasion by invasive salt tolerant species such as Giant Reed Grass (Phragmites australis), Narrow leaf cattail (Typha angustifolia) and Eurasian watermilfoil (Myriophyllum spicatum) (Kelting and Laxson, 2010). Salt can be toxic to fish at fairly high concentrations, although these concentrations have been observed in streams (Evans and Frick, 2001).
“Road salts and their additives result in the following sublethal effects in zooplankton: weakening, immobilization, failure to develop, inhibition of egg development and suppression of feeding” (Evans and Frick, 2001). At higher concentrations, salt can be toxic to zooplankton, freshwater mussels and fish (Canadian Council of Ministers of the Environment, 2011).
Salt is toxic to some benthic invertebrates and also exhibits sublethal effects such as increased drift (Evans and Frick, 2001). Urban ponds impacted by road salt are likely to experience a shift in community composition to those species that are more salt tolerant (Van Meter and Swan, 2014).
Sodium ferrocyanide is added to salt as an anti-caking agent. In water, it dissolves and forms the ferrocyanide anion. When it is in solution and exposed to light it photodecomposes to free cyanide which can react to form hydrogen cyanide (HCN), a highly toxic compound (Environment Canada, 2001).
· Wildlife: Deer, moose and other large mammals are attracted to the salt on roadsides and roadside ponds to fulfill their sodium needs, resulting in increased traffic incidents (Environment Canada 2001; Norwegian Public Roads Administration, 2010). Exposure of Amphibians to road salt can result in abnormalities, reduced growth, behavior changes, lower survival rates, and changes in community structure (Environment Canada, 2001; Denoël et al., 2010; Karraker, 2008; Collins and Russel, 2009). Salt can also be toxic to birds or affect bird behavior at sublethal doses (Amundsen et al, 2008; Kelting and Laxson, 2010; Environment Canada, 2001; Norwegian Public Roads Administration, 2010).
· Soil: Soil along roadsides can be impacted by road salt in a number of ways, including change in soil structure, effects on the nutrient balance, accelerated colloidal transport, mobilization of heavy metals, and reduced hydraulic conductivity and permeability (Amundsen, 2008; Michigan DOT, 1993). These changes can lead to reduced plant growth. Soil structure changes also may result in increased erosion and sediment transport to surface waters (Kelting and Laxson, 2010).
Overall Estimates of Damage Costs Due to Deicing Salt Use Vitaliano estimated additional costs of $803/ton of salt for repair and maintenance of roads and bridges, vehicle corrosion cost, and loss of aesthetic value due to roadside tree damage (1992). Stefan took these estimates and adjusted them for inflation to 2008 dollars and came up with a value of $1,200/ton of salt (2008). Estimates of damage to water supplies and health, vegetation, highway structures, vehicles, and

Fortin Consulting, Inc. Economic Analysis of Salt Use • September 2014 Minnesota Pollution Control Agency
7
utilities due to road salt were completed based on an extensive literature search and several surveys (Murray and Brenner, 1977; Murray and Ernst, 1976). The researchers concluded that the national cost of salt-related damage approaches $3 billion which was about 15 times the cost of the salt and its application. The researchers found that the highest direct costs were from vehicle damage, but the most serious damage was to water supplies and potential impact on health. Using the figure of damage at 15 times the cost of salt and its application, for the TCMA, this results in damage estimates of $3,341/ton (Stefan et al., 2008), based on weighted average cost of $73/ton for salt and $150/ton for application).
Table 2 is a compilation of estimates of the cost of damage to the environment, vehicles and infrastructure caused by road salt. The last column includes the overall estimates discussed above. The overall damage estimates vary in what type of damage is included.
Table 2. Cost of Damage per Ton of Salt Used
Vehicle Extra Road Tree Infrastructure Ecosystem Overall
Reference Corrosion Maintenance Damage Damage Damage Damages Cost
Stefan et al. 2008 $615 $1,200 TRB 1991 Sohanghpurwala 2008 $1,460 Murray and Ernst 1976 Murray and Brenner 1977
$3,341
Adirondack Council 2009 $30 $600 $110 Vitaliano 1992 $113 $75 $803
Kelting and Laxson 2010* $172 - $227
Low Estimate $30 $600 $75 $172 $803 High Estimate $113 $615 $110 $1,460 $227 $3,341
*Ferric chloride (FCI) basis for calculations
Total Costs The TCMA spends approximately $25 million annually on salt, and $52 million for labor and equipment to apply the salt (Schaefer, 2012; MnDOT ca., 2011; U.S. Salt, 2012; Stefan et al., 2008). Considering material purchases, labor and equipment to spread the salt, and damage estimates, total annual expenditures and damage costs amount to approximately $350 million to $1.2 billion (Table 3).

Fortin Consulting, Inc. Economic Analysis of Salt Use • September 2014 Minnesota Pollution Control Agency
8
Table 3. TCMA Costs for Salt, Labor and Equipment, and Damage from Salt Use
Low Overall Damages Basis High Overall Damages Basis
Rate Cost (millions)* Rate Cost (millions) *
Cost Component per Ton of Salt per Year per Ton of Salt per Year
Material (salt) $73 $25 $73 $25
Labor and Equipment $150 $52 $150 $52
Overall Damages $803 $280 $3,341 $1,166
Combined Cost $1,026 $358 $3,564 $1,243
*Calculated using TCMA annual salt use of 349,000 tons/season
Fortin Consulting, Inc. Economic Analysis of Salt Use • September 2014 Minnesota Pollution Control Agency
9
4. Estimates of Cost Savings Based on Potential Deicing Salt Use Reductions
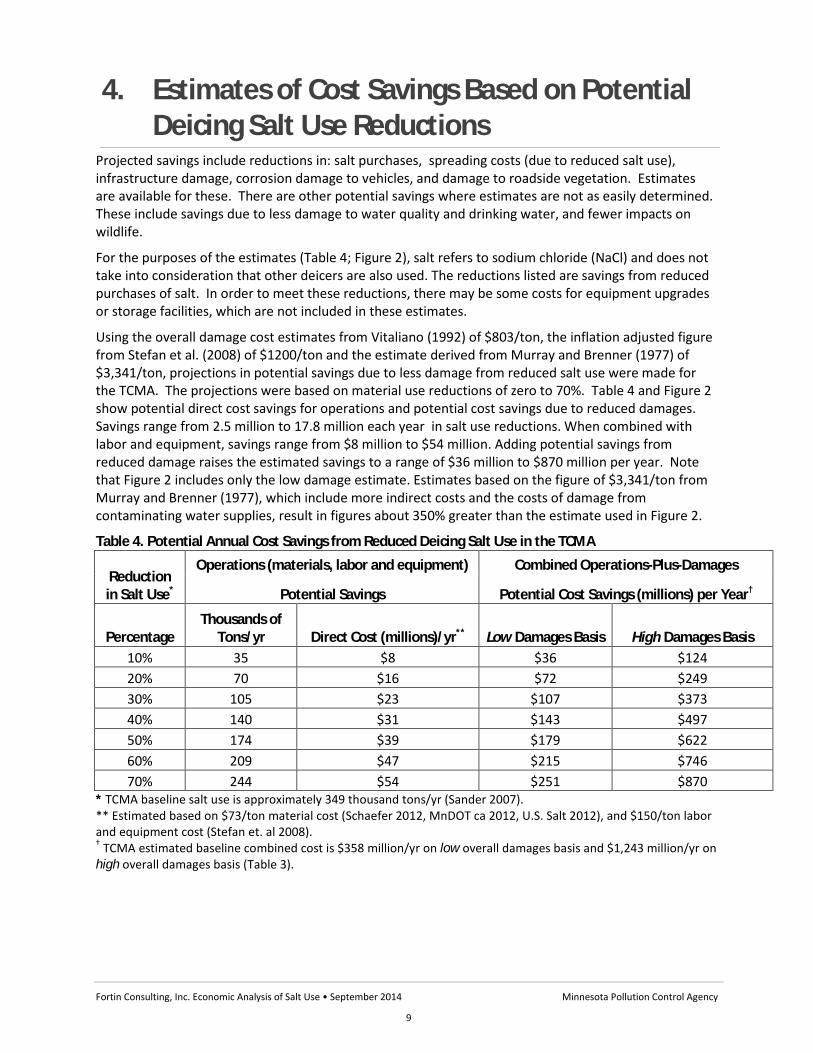
Projected savings include reductions in: salt purchases, spreading costs (due to reduced salt use), infrastructure damage, corrosion damage to vehicles, and damage to roadside vegetation. Estimates are available for these. There are other potential savings where estimates are not as easily determined. These include savings due to less damage to water quality and drinking water, and fewer impacts on wildlife.
For the purposes of the estimates (Table 4; Figure 2), salt refers to sodium chloride (NaCl) and does not take into consideration that other deicers are also used. The reductions listed are savings from reduced purchases of salt. In order to meet these reductions, there may be some costs for equipment upgrades or storage facilities, which are not included in these estimates.
Using the overall damage cost estimates from Vitaliano (1992) of $803/ton, the inflation adjusted figure from Stefan et al. (2008) of $1200/ton and the estimate derived from Murray and Brenner (1977) of $3,341/ton, projections in potential savings due to less damage from reduced salt use were made for the TCMA. The projections were based on material use reductions of zero to 70%. Table 4 and Figure 2 show potential direct cost savings for operations and potential cost savings due to reduced damages. Savings range from 2.5 million to 17.8 million each year in salt use reductions. When combined with labor and equipment, savings range from $8 million to $54 million. Adding potential savings from reduced damage raises the estimated savings to a range of $36 million to $870 million per year. Note that Figure 2 includes only the low damage estimate. Estimates based on the figure of $3,341/ton from Murray and Brenner (1977), which include more indirect costs and the costs of damage from contaminating water supplies, result in figures about 350% greater than the estimate used in Figure 2.
Table 4. Potential Annual Cost Savings from Reduced Deicing Salt Use in the TCMA
Reduction in Salt Use*
Operations (materials, labor and equipment) Combined Operations-Plus-Damages
Potential Savings Potential Cost Savings (millions) per Year†
Percentage Thousands of
Tons/yr Direct Cost (millions)/yr** Low Damages Basis High Damages Basis 10% 35 $8 $36 $124 20% 70 $16 $72 $249 30% 105 $23 $107 $373 40% 140 $31 $143 $497 50% 174 $39 $179 $622 60% 209 $47 $215 $746 70% 244 $54 $251 $870
* TCMA baseline salt use is approximately 349 thousand tons/yr (Sander 2007). ** Estimated based on $73/ton material cost (Schaefer 2012, MnDOT ca 2012, U.S. Salt 2012), and $150/ton labor and equipment cost (Stefan et. al 2008). † TCMA estimated baseline combined cost is $358 million/yr on low overall damages basis and $1,243 million/yr on high overall damages basis (Table 3).

Fortin Consulting, Inc. Economic Analysis of Salt Use • September 2014 Minnesota Pollution Control Agency
10
Figure 2. TCMA Potential Cost Savings from Reduced Deicing Salt Use
$0
$50
$100
$150
$200
$250
-10% 0% 10% 20% 30% 40% 50% 60% 70%
Pote
ntia
l Ann
ual C
ost S
avin
gs (m
illio
ns)
Percentage Reduction in Deicing Salt Use
Salt, Labor, & Equipment Overall Damages, Low Estimate Total Savings

Fortin Consulting, Inc. Economic Analysis of Salt Use • September 2014 Minnesota Pollution Control Agency
11
5. Salt Reduction Case Studies Reductions in use of road salt are possible through smart salt use and adoption of winter maintenance BMPs. Presented below are four examples of salt reductions achieved with the associated cost savings.
University of Minnesota, Twin Cities The information provided below is based on information presented at the awards ceremony at the 2007 Road Salt Symposium (Freshwater Society, 2007) and updated by Doug Lauer, a Landcare Supervisor with the University. The University of Minnesota Twin Cities Campus made changes to their winter maintenance program starting the winter of 2006. They began making their own salt brine and anti-icing (applying liquids before the storm), and adopted several other salt reduction BMPs. The resulting reductions for each winter maintenance material are listed below.
Material #1 - Rock Salt 1997 to 2005 9 year avg: 775 tons of salt 2006 to 2008 avg: 462 tons of salt Net avg. Reduction: 313 tons % Reduction: 41%
2009 to 2014 avg: 485 tons Net Reduction (from ’97 to ’05): 290 tons % Reduction (from ’97 to ’05): 37% Material #2 - Ice Melt (Magnesium Chloride - MgCl2) 1997 to 2005 avg: 131 tons 2006 to 2008 avg: 64 tons Net avg Reduction: 67 tons % Reduction: 51%
2009 to 2014 avg: 72 tons (switched to Calcium chloride – CaCl2) Net avg Reduction (from ’97 to ’05 Mg Cl2): 59 tons % Reduction (from ’97 to ’05): 45% Material #3 - Sand 1997 to 2005 avg: 1,965 tons 2006 to 2008 avg: 18 tons Net Reduction: 1,947 tons % Reduction: 99%
2009 to 2014 avg: 21 tons Net Reduction (from ’97 to ’05): 1,944 tons % Reduction (from ’97 to ’05): 99% In addition to salt reductions, they purchased some new equipment for about $10,000 and still saved $55,000 the first year the BMPs were implemented. The University is still using the same program indicated above as far as using brine to treat before the storm. They are aggressive with their mechanical removal using blades and brooms. A switch was made from using magnesium chloride to calcium chloride because it mixes better with sodium and does not clog their equipment when switching products. The product they use also contains beet juice which makes it less corrosive.

Fortin Consulting, Inc. Economic Analysis of Salt Use • September 2014 Minnesota Pollution Control Agency
12
City of Waconia
The information provided below is based on information presented at the awards ceremony at the 2013 Road Salt Symposium (Freshwater Society, 2013). The City of Waconia Public Services Department completes winter maintenance activities on the following:
• 56 Street Center Lane Miles • Portions of 14 miles of concrete sidewalk • 13 miles of bituminous trails
Each year prior to the winter season, City staff attends a winter preparations meeting. The meeting consists of review of their Winter Maintenance Policy, route assignments, material use discussions and service level expectations. After this meeting, all spreaders are calibrated for liquid and solid material applications. Calibration charts are prepared and placed within each vehicle for user review. In 2010, staff updated their 1999 “Snow and Ice Policy” to a “Winter Maintenance Policy.” The document title change was necessary to express a difference in proactive, opposed to reactive activities. At this time the City switched from sand/salt mixture of 1:1 to straight salt and liquid anti-icing practices. Additional items reflected within the policy included;
• Service level expectations for streets, sidewalks, trails, parking lots and downtown snow removal
• Addition of ordinances reflective of policy guidelines • Right-of-Way uses, including mailbox placements • Description of operation commencement and use of air and pavement temperatures, and anti-
icing practices • Tips on resident snow storage, or maintaining a “Snow Pocket” for driveway cleaning
Through efforts of calibration and equipment changes, staff has been able to reduce materials rates of salt per-pound by 70%. With the addition of pre-wet practices, and material savings based upon weather and pavement conditions have amounted to $1.80 cost savings per-lane-mile and a yearly savings of $8,600.
As part of the winter maintenance practices for sidewalks and trails, staff took the initiative to switch from hand applied and truck applied chloride products to liquid applications only. Staff conducts anti-icing and deicing (applying ice melting products after the storm) activities as needed on sidewalks and trails where substantial savings have also occurred. Staff obtained a “Local Operational Research Assistance Program” grant for $5,000. The research found a savings of 70% for activities related to recreational critical areas through the use of liquids for trails and sidewalks.
City of Prior Lake
The information provided below is based on information provided by the City of Prior Lake for the 2010 American Public Works Association (APWA) Excellence in Snow and Ice Control awards ceremony. The City of Prior Lake maintains approximately 100 center lane miles of street with ten maintenance personnel and one supervisor.
Starting in 2003 Prior Lake implemented a winter maintenance program which includes:
• Staff education and development • Anti-icing before events to reduce removal time • Pre-wetting (no more dry salt) delivers salt more efficiently at lower concentrations • Upgraded controllers and sanders that allow precise applications (flexibility)

Fortin Consulting, Inc. Economic Analysis of Salt Use • September 2014 Minnesota Pollution Control Agency
13
• Pre-mixed chemical storage that allows on-site storage of three ready to use mixes and bulk storage of critical ingredients
• Liquid mixing and transfer equipment
Education Education was important for establishing staff buy-in and support, which was critical for the program to be successful. The City started with supervisor training and researched other programs. Various training programs were attended or used including: Local Technical Assistance Program (LTAP), Circuit Training and Assistance Program (CTAP), Manual of Practice for an Effective Anti-icing Program, APWA Anti-icing/Road Weather and Information System (RWIS) computer based training, American Association of State Highway and Transportation Officials (AASHTO) Clear Roads computer based training series, and attending an APWA Snow Conference.
From 2003 to 2011, the City invested about $250k in the program including a $50k building addition. They recognized that the right equipment is key to providing the flexibility to apply the right chemicals, in the appropriate amounts by the most efficient method.
Chemicals and Storage Depending on conditions, Prior Lake keeps pre-mixed chemicals ready for use and bulk materials on hand. This allows the City to pre-mix and modify operations quickly depending on weather conditions. Using the best available weather data for preparation, and monitoring actual ground temperatures during operations is critical.
• Bulk materials include brine, beet juice, magnesium or calcium chloride and molasses • Pre-mixes include liquids for anti-icing and pre-wetting above and below 15 degrees F
Application Equipment Upgrading of application equipment can be phased in. Prior Lake took seven years to fully upgrade their fleet. With 5100/6100 Controllers and new sanders they can apply pre-wet material at rates down to 85 lbs per lane mile. Liquid application units can also apply at sub 100 lbs per lane mile rates.
• Controllers • Salt Sanders • Evaluate plow configuration to further optimize • On-board liquids
Liquid anti-icing operations increased removal efficiency. The City found that applications are effective for 7-14 days depending on mixture used and conditions. Equipment was also used on a liquid only route with deicing application rates of less than 100 lbs per lane mile.
Efficient truck design and equipment including Elliptical Box, 200 gallons of Liquid Storage, Falls Salt Special Material Applicator, Force America 6100 Controller and bed tarp allows for more efficiency with application rates of pre-wet salt as low as 85 lbs per lane mile.
Results Reduction of average application rates from 500 lbs per lane mile of salt in 2005 lane to 200-250 lbs per lane mile pre-wet salt in 2010.
• All liquid route with application rates equivalent to 100 lbs per lane mile or less. • Confirmed chloride level reduction in controlled watershed of 20 to 40 mg/L with all liquid
program • Reduced staff time for snow removal and maintenance

Fortin Consulting, Inc. Economic Analysis of Salt Use • September 2014 Minnesota Pollution Control Agency
14
• Overall road salt use reduced 42% since 2005 even with an additional 7% increase in mileage maintained.
• Minimum estimated savings per snow removal event of $2,000 (salt, labor, equipment) . • Maintained safety and increased level of service.
Future Plans
• No chemical application routes, blade cutting edge technology advances • Pre-wet application rates sub 100 lbs per lane mile • Expanded liquid only routes • High Priority Chloride Reduction Zones
City of Richfield The information provided below is based on information presented at the awards ceremony at the 2013 Road Salt Symposium (Freshwater Society, 2013).
In 2009, the Nine Mile Creek Watershed District (NMCWD) began a Total Maximum Daily Load (TMDL) Analysis and Report process for the chloride impairment identified for the creek. By 2010 they had prepared a draft TMDL report that called for a 62% reduction of salt application by their Municipal Separate Storm Sewer Systems (MS4) Cities, including Richfield. Along with other agencies, Richfield’s reaction was that this requirement was not only unreasonable, but impossible. They believed that public safety would be compromised and that it was too far reaching of a goal to take seriously. However, eventually the City came to accept that they had to make efforts toward reducing salt usage.
At about the same time the City Engineer was made aware that NMCWD was working with Fortin Consulting and LTAP to offer free MPCA Winter Maintenance Certification Training. Initially the Operations superintendent attended the training to gauge if it was worthwhile, and found that the training was excellent. Immediately he registered the entire snow plow operations staff for the next available training.
In addition, all of the snow plow operators that plow parking lots have attended the MPCA Winter Parking Lot and Sidewalk Maintenance Training.
The main thing that the staff took from the training is that they were doing everything wrong. Richfield’s winter maintenance organization prides itself in how well they take care of snow plowing and ice removal and in this instance they found they were wrong. After the training, there was urgency among all of the operators to change practices, now!
The main changes to the City of Richfield’s salt application process were:
• Calibrating all Sanders every year • Applying salt to the crown of the road only • Determining application rates by road temperatures/weather conditions • Using alternative materials for low road temperatures • Adjusting policies for minor arterial roads
With these small changes, the City of Richfield operators reduced the amount of salt applied to roads by over 50%. They believe as the years pass they will see that number trend upward closer to the TMDL goal of 62%.
Joe’s Lawn & Snow

Fortin Consulting, Inc. Economic Analysis of Salt Use • September 2014 Minnesota Pollution Control Agency
15
Joe’s Lawn and Snow is a small lawn and winter maintenance company located in the TCMA. The following information was provided by Joe Mather, owner.
Joe’s Lawn and Snow plows and treats both sidewalks and parking lots. Prior to attending the MPCA Winter Maintenance Certification class, they relied on application rates listed on the deicers and their best judgment to determine how much material to apply. Joe and four employees attended the certification class in the winter of 2013-14 . They learned a lot in the class and implemented many practices in their first year.
Practices implemented included:
· Purchased new spreader · Calibrated equipment · Made a “bowl” to catch any excess salt at spinner and reuse this · Made adjustments to spreader to get more even spread and prevent salt piles · Reduced application rates · Tested application rates and results and kept refining · Purchased hand-held and truck mounted temperature sensors · Use temperature to help determine rates and materials · Identify drainage patterns and appropriate snow storage areas prior to winter · Use sediment traps to contain solids in runoff and they clean out manholes · Experimented with anti-icing using liquids and will continue to experiment
With the changes made, they were able to reduce their salt usage by about 50% without reducing their level of service.

Fortin Consulting, Inc. Economic Analysis of Salt Use • September 2014 Minnesota Pollution Control Agency
16
6. Mitigating Impacts to Surface and Groundwater
Hypothetical Impacts At a rate of 349,000 tons of road salt used per year, the TCMA could hypothetically contaminate 223 billion gallons of surface or ground water each year to the 230 mg/L (MPCA chronic standard) level for chloride if it all ended up in the water. Records of salt use for MnDOT (Statewide) were available from the winter of 1966-67 to 2010-11 winter seasons (MnDOT ca., 2011). The total salt use for that period was 8 million tons. This amount of salt could contaminate 5 trillion gallons of water to the 230 mg/L concentration. Lake Minnetonka is 14,043 acres and has a volume of 130 billion gallons (400,000 acre-feet) (MPR, 2011). Putting this into perspective, the statewide salt use for MnDOT from 1966 to 2011 could contaminate all of the water in about 39 Lake Minnetonka’s (a 14,000-acre lake in the TCMA). And, MnDOT only uses about 23% of the total used for winter maintenance in Minnesota (Sander et al., 2007). Each year, the TCMA contaminates the equivalent volume of water of 1.7 Lake Minnetonka’s. Reductions in salt use are the most technically and economically feasible way to keep our waters below the impaired levels for chloride. Using the 10 to 70% reduction scenario, 20 to 150 billion gallons of water would be protected each year respectively.
Cost to Remove Chloride from Water If we do not prevent salt from entering our waters, it will continue to accumulate and contaminate our surface and groundwater, potentially resulting in toxicity to aquatic life and contamination to our drinking water, potentially creating undesirable taste conditions and possibly creating health concerns for individuals on a doctor recommended salt restricted diet. Since salt dissolves in water, it is very difficult and costly to remove. The most often used method of desalination is through reverse osmosis, also known as membrane desalinization, or distillation. Although technically possible, it would be economically and logistically impractical. Mitigation of groundwater or surface water used for drinking might be somewhat easier than removal of salt from surface waters since this water could be pumped to a site where a treatment system (small or large scale) could be installed. For lakes contaminated with salt, remediation would require the construction of a treatment facility that could filter the surface water through a reverse osmosis treatment system or distillation; however, this is not ecologically practical as the processes would kill microorganisms including algae and would also remove a wide range of necessary nutrients. Desalination treatment methods are costly and have been used in the production of drinking water, not for treatment of recreational waters (Bilton ca., 2010; Blue Spring Corporation, 2012; Muraleedaaran et al., 2009; New York Times, 2012; The International Desalination & Water Reuse Quarterly industry website, 2012; UNEP, 1997; Wade et al., 1982; Yun et al., 2006). Additionally, the wastewater produced in the reserve osmosis treatment process would be high in chlorides, presenting a disposal problem.

Fortin Consulting, Inc. Economic Analysis of Salt Use • September 2014 Minnesota Pollution Control Agency
17
7. Conclusions The TCMA uses enough salt each winter to potentially contaminate 223 billion gallons of water. Deicing salt is contaminating our lakes, streams, and wetlands. Deicing salt is the most common method of maintaining safe roads and other surfaces and shows positive financial implications associated with keeping traffic moving. However, use of deicing salt is costly, especially when considering costs beyond materials and labor, such as infrastructure and environmental damage. Annual costs for material, and equipment and labor in the TCMA amount to about $75 million per year, but the costs for damage to infrastructure, automobiles, human health and the environment is much higher, on the order of $280 million to $1 billion per year. Removal of salt (chlorides) from water is infeasible financially and logistically. Therefore, the logical approach is prevention, or source control. Reductions in salt use for winter maintenance are needed to prevent chloride contamination and other impacts to our waters. In addition to protecting surface and groundwater, reductions would result in significant savings in direct costs. A 10% reduction would amount in an estimated $8 million in direct savings each year, and an estimated $36 to $124 million per year in savings due to reduced infrastructure and environmental damage. There are a number of smart salting practices that can be implemented to reduce salt use (MPCA, 2014b). The case studies presented show that adoption of BMPs or smart salt use can lead to reductions in salt use as well as cost savings and help prevent further contamination of water resources.

Fortin Consulting, Inc. Economic Analysis of Salt Use • September 2014 Minnesota Pollution Control Agency
18
8. Literature Cited
Adirondack Council. 2009. Low Sodium Diet: Curbing New York's Appetite for Damaging Road Salt, Elizabethtown, NY. http://www.adirondackcouncil.org/uploads/special_reports_archive/1341942436_Low_Sodium_Diet.pdf.
Albrecht, Steve. 2011. City of Prior Lake Snow and Ice Control Program. Presentation at 2010 APWA
Profession Awards, Excellence in Snow and Ice Control Award. As reprised at the Minnesota Pollution Control Agency Water and Watersheds Meeting, February 3, 2011.
Amundsen, C.E., S. Håland, H. French, R. Roseth and N. Kitterød. 2008. Environmental Damages Caused
by Road Salt- A Literature Review. Norwegian Public Roads Administration. Report No. 2587. Anning, D.W. and M. E. Flynn. 2014. Dissolved-Solids Sources, Loads, Yields, and Concentrations in
Streams of the Conterminous United States. U. S. Geological Survey Scientific Investigations Report 2014-5012, 101 p., http://dx.doi.org/10.3133/sir20145012.
Barr. 2010. Nine Mile Creek Watershed Chloride Total Maximum Daily Load Report. wq-iw11-08e. Bilton, A.M., R. Weisman, A.F.M. Arif, S. M. Zubair, and S. Dubowsky. c.a. 2010 (accessed June 2012). On
the feasibility of Community-scale Photovoltaic-powered Reverse Osmosis Desalination Systems for Remote Locations http://robots.mit.edu/publications/291-300/295%20Osmosis%20Amy%20Journal/295%20Osmosis%20Amy%20Journal.pdf.
Blue Spring Corporation web site. 6/15/12 (accessed). http://www.bluspr.com/desalination_faq.html. Canadian Council of Ministers of the Environment. 2011. Canadian Water Quality Guidelines: Chloride
Ion. Scientific Criteria Document. Canadian Council of Ministers of the Environment, Winnipeg. Collins, S. J. and R. W. Russell. 2009. Toxicity of road salt to Nova Scotia amphibians, Environ. Pollut.,
157:320-324. Environment Canada 2001. Canadian Environmental protection act 1999. Priority substances list
assessment report – road salt. Environment Canada, Canada. http://www.hc-sc.gc.ca/ewh-semt/pubs/contaminants/psl2-lsp2/road_salt_sels_voirie/index-eng.php.
Evans, M. and C. Frick. 2001. The effects of road salts in stream, lake and wetland ecosystems. National
Water Research Institute, Saskatoon, Saskatchewan. NWRI publication 02-308. Fortin Consulting Inc. various. Information collected from participants of MPCA winter maintenance
certification classes. Freshwater Society, 2006. Information prepared for Environmental Leadership Award presentation to
the City of Prior Lake. Freshwater Society, 2007. Information prepared for Environmental Leadership Award presentation to
the University of Minnesota- Facilities Management.

Fortin Consulting, Inc. Economic Analysis of Salt Use • September 2014 Minnesota Pollution Control Agency
19
Freshwater Society, 2013. Information prepared for Environmental Leadership Award presentation to
the City of Waconia. Haider, Steve, 2012. Minnesota Department of Transportation (MnDOT). Personal communication and
data provided on 6/21/12.
Karraker, N. E., J. P. Gibbs, and J. R. Vonesh. 2008. Impacts of road de-icing salt on the demography of
vernal pool-breeding amphibians. Ecol. Appl., 18:724-734. Kelting, D.L. and C.L. Laxson. 2010. Review of Effects and Costs of Road De-icing with Recommendations
for Winter Road Management in the Adirondack Park. Adirondack Watershed Institute Report # AWI2010-01.
Kroening, S. and Ferry, M. 2013. The Condition of Minnesota’s Groundwater, 2007 – 2011. Minnesota
Pollution Control Agency. Document number: wq-am1-06.
Lauer, Doug. 7/28/14. University of Minnesota Facilities Management, Landcare. Personal Communication.
Mather, J. 8/1/14 Joe’s Lawn & Snow. Personal Communication. Michigan Department of Transportation (MDOT). 1993. The use of selected de-icing materials on
Michigan roads: Environmental and economic impacts. http://www.michigan.gov/mdot/0,1607,7-151-9622_11045-57246--,00.html. Accessed 5/4/14.
Minnesota Department of Transportation (MnDOT). ca 2011. MnDOT 2010-2011 Annual Winter
Maintenance Report- At A Glance. http://www.dot.state.mn.us/maintenance/pdf/research/winterataglance.pdf. Accessed 6/21/12.
Minnesota Pollution Control Agency (MPCA). 2014a. Draft 303(d) List of Impaired Waters.
http://www.pca.state.mn.us/index.php/water/water-types-and-programs/minnesotas-impaired-waters-and-tmdls/impaired-waters-list.html. MPCA Web site. Accessed 6/13/2014.
Minnesota Pollution Control Agency (MPCA). 2014b. MPCA Road Salt Education Project. http://www.pca.state.mn.us/index.php/about-mpca/mpca-events-and- training/road- salt-
education-program.html. MPCA Web site. Accessed 6/18/14. Minnesota Public Radio. 5/16/2011. A Tale of Two Lakes. Paul Huttner, Chief Meteorologist.
http://blogs.mprnews.org/updraft/2011/05/a_tale_of_two_lakes/. Accessed 6/21/12. Muraleedaaran, S. et al. 2009. Is Reverse Osmosis Effective for Produced Water Purification? Viability
and Economic Analysis. Paper prepared for the 2009 Society of Petroleum Engineers Western Regional Meeting held in San Jose, CA, USA, 24-26 March.
Murray, D. M. and U.F. Ernst. 1976. An Economic Analysis of the Environmental Impact of Highway
Deicing. EPA-600/2-76-105. USEPA Office of Research and Development, Municipal Environmental Research Laboratory. Cincinnati, OH.
Fortin Consulting, Inc. Economic Analysis of Salt Use • September 2014 Minnesota Pollution Control Agency
20
Murray, D M and Brenner, R. 1977. Economic Analysis of the Environmental Impact of Highway Deicing Salts. Transportation Research Record Issue 647. Transportation Research Board Report No. HS-024 782. http://pubsindex.trb.org/view/1977/C/80646.
New York Times. 2012. Turning Saltwater From Earth and Sea Into Water Fit to Drink. From Texas Tribune article by Kate Galbraith Published: June 9, 2012. Accessed on 6/15/12.
Norwegian Public Roads Administration. 2010. Salt SMART Environmental Damages Caused by Road
Salt- A Literature Review. Project Number 601945. Novotny, E., D. Murphy, and H. Stefan. 2007. Road Salt Effects on the Water Quality of Lakes in the Twin
Cities Metropolitan Area. Project Report No. 505. University of Minnesota, St. Anthony Falls Laboratory. Prepared for the Local Road Research Board and Minnesota Department of Transportation.
Novotny, E., D. Murphy, and H. Stefan. 2008. Increase in Urban Lake Salinity by Road Deicing Salt.
Science of the Total Environment 406 (2008) 131-144. http://www.geology.wmich.edu/koretsky/environmentalgeochemistry/novotny2008.pdf.
Peichel, B. 12/23/2013. Minnesota Pollution Control Agency. Personal Communication. Plath, Tim. 7/31/14. City of Eagan. Personal Communication. Roadway Safety Foundation. 6/27/14 (accessed). Brochure: Clear Winter Roads Protect Lives and
Commerce. http://www.roadwaysafety.org/wp-content/uploads/snowremovalbrochure-final.pdf.
Sander, A., E. Novotny, E. Mohseni, and H. Stefan. 2007. Inventory of Road Salt Use in the
Minneapolis/St. Paul Metropolitan Area. Project Report No. 503. University of Minnesota, St. Anthony Falls Laboratory. Prepared for the Minnesota Department of Transportation and the Local Road Research Board.
Schaefer, K. 6/19/12, Minnesota Department of Transportation. Personal communication. Sohanghpurwala, A. A. 2008. Cost of Winter Maintenance on Infrastructure. Presentation at the 7th
Annual Road Salt Symposium. Freshwater Society, Fortin Consulting and University of MN Center for Transportation Studies, Feb. 5, 2008, Brooklyn Center, MN.
Stefan, H., E. Novotny, A. Sander and O Mohseni. 2008. Study of Environmental Effects of De-icing Salt
on Water Quality in the Twin Cities Metro Area, Minnesota. MnDOT LRRB Report 2008-42. Struve, T. 2011. Information on practices adopted by the City of Eagan presented as part of an MPCA
Winter Road Maintenance certification training class.

Fortin Consulting, Inc. Economic Analysis of Salt Use • September 2014 Minnesota Pollution Control Agency
21
The International Desalination & Water Reuse Quarterly industry website. 2012. Low-cost desalination development gets EPA funding. Research News posted on May 24, 2012. http://www.desalination.biz/news/news_story.asp?id=6537&channel=0&title=Low-cost+desalination+development+gets+EPA+funding. Accessed 6/15/12.
Transportation Research Board (TRB). 1991. Highway Deicing, Comparing Salt and Calcium Magnesium
Acetate. Report 235, http://onlinepubs.trb.org/onlinepubs/sr/sr235/00i-012.pdf. Transportation Research Board (TRB). ca 1990. Road Salt Use in the United States.
http://onlinepubs.trb.org/onlinepubs/sr/sr235/017-030.pdf. United Nations Environment Programme (UNEP). 1997. Source Book of Alternative Technologies for
Freshwater Augmentation in Latin America and the Caribbean. Chapter 2.2. http://www.oas.org/DSD/publications/Unit/oea59e/ch21.htm.
U.S. Environmental Protection Agency (USEPA). 2003. Drinking Water Advisory: Consumer Acceptability
Advice and Health Effects Analysis on Sodium. EPA 822-R-03-00. USEPA Office of Water, Health and Ecological Criteria Division, Washington, DC.
U.S. Environmental Protection Agency (USEPA). 6/13/14 (accessed). What Can Cause Tapwater to Taste
Like Salt. EPA web site: http://safewater.supportportal.com/ics/support/KBAnswer.asp?questionID=21518&hitOffset=64+36+22+11&docID=1070.
U.S. Environmental Protection Agency. 6/13/14 (accessed). Sodium in Drinking Water. EPA website:
http://water.epa.gov/scitech/drinkingwater/dws/ccl/sodium.cfm. U.S. Salt (Burnsville, MN). 6/20/2012. 2011/2012 winter season average price. Personal communication. Van Meter R. J., and C.M. Swan. 2014. Road Salts as Environmental Constraints in Urban Pond Food
Webs. PLoS ONE 9(2): e90168. doi:10.1371/journal.pone.0090168. Vitaliano, Donald F. 1992. “An Economic Assessment of the Social Costs of Highway Salting and the
Efficiency of Substituting a New Deicing Material.” Journal of Policy Analysis and Management 11-3 (1992) 397-418.
Wade, N.M. and M.R. Hornsby. 1982. Distillation and Reverse Osmosis Energy Consumption and Costs.
Desalination Vol. 40, Issue 3., 245-257. http://www.sciencedirect.com/science/article/pii/S0011916400886932.
Wenck Associates, Inc. 2006. Shingle Creek Chloride TMDL Report. wq-iw8-02g. Yun, T.L., C. Gabelich, M. Cox, A. Mofidi, and R. Lesan. 2006. Reducing Costs for Large-scale Desalting
Plants Using Large-diameter, Reverse Osmosis Membranes. Metropolitan Water District of Southern California. Desalination 189 (2006) 141-154.
Related Documents