Electronic copy available at: http://ssrn.com/abstract=1184618 BANCA D’ITALIA E U R O S I S T E M A THE REAL ASSETS OF ITALIAN HOUSEHOLDS Luigi Cannari, Ivan Faiella, Grazia Marchese and Andrea Neri Extracted from the book: Household wealth in Italy, Banca d’Italia, 2008

Welcome message from author
This document is posted to help you gain knowledge. Please leave a comment to let me know what you think about it! Share it to your friends and learn new things together.
Transcript
Electronic copy available at: http://ssrn.com/abstract=1184618
BANCA D’ITALIA E U R O S I S T E M A
THE REAL ASSETS OF ITALIAN HOUSEHOLDS Luigi Cannari, Ivan Faiella, Grazia Marchese and Andrea Neri
Extracted from the book: Household wealth in Italy, Banca d’Italia, 2008

Electronic copy available at: http://ssrn.com/abstract=1184618
THE REAL ASSETS OF ITALIAN HOUSEHOLDS
Luigi Cannari*, Ivan Faiella*, Grazia Marchese* and Andrea Neri*
1. Introduction
No official macroeconomic data are available in Italy on the value of real assets held by Italian households (or by the other institutional sectors). Unofficial estimates of several components of households’ real wealth have been produced in the past by Tresoldi and Visco (1975), Pagliano and Rossi (1992), and more recently by Brandolini et al. (2004). The latter focuses exclusively on consumer households and therefore does not consider several wealth components linked to the entrepreneurial activities of producer households (sole proprietorships, informal partnerships and companies with up to five employees).1
In a country like Italy, where small firms are prevalent, these components can account for a significant proportion of total wealth. According to the most recent Survey on household wealth and income (SHIW) conducted by the Bank of Italy, in 2004 business wealth accounted for almost 10 per cent of households’ real assets (and as much as one third of total real assets for entrepreneurs and the self-employed).
This paper differs from previous macroeconomic estimates of real wealth by introducing an assessment of wealth components that refer to the producer household sector. These estimates are then compared with those reported in the SHIW. Though the literature offers studies on the quality of the SHIW data,2 this paper provides the first analysis of the quality of sample data relative to the wealth components of producer families.
Turning to the comparison of micro and macro estimates, it should be remembered that the definitions adopted in the survey are not easily reconciled with those of the national accounts. Several sub-aggregates of wealth will accordingly be redefined to make the definitions comparable with the macroeconomic estimates. The results of the Survey of Household Income and Wealth presented here may therefore differ from those published by the Bank of Italy.
The paper is organized as follows. Section 2 presents the results of the macroeconomic estimates of the components of real wealth. Section 3 compares these with the appropriately reclassified SHIW data. Section 4 presents our main conclusions.
2. Households’ real assets
As noted in the introduction, there are no official estimates of households’ real assets in Italy. This section illustrates the method used to reconstruct these wealth components, which will then be compared with the SHIW data.
The estimates are based on the definitions used in the national accounts, in other words the ESA95 standard.
* Bank of Italy. Our thanks to Romina Gambacorta and Alessandra Agostinelli for their helpful comments. 1 See Dabbicco (2003). 2 See Brandolini and Cannari (1994), Brandolini (1999), Cannari and D’Alessio (1990; 1992; 1993).

Luigi Cannari, Ivan Faiella, Grazia Marchese and Andrea Neri
122
The definition of “households” – The ESA95 sector classification system rests on the concept of institutional unit.3 The institutional units are grouped into homogeneous sets, called institutional sectors. The Households’ Sector comprises individuals or groups of individuals in their capacity as consumers or possible producers. Accordingly, this sector includes informal partnerships, de facto companies and sole proprietorships, whose primary function is to produce non-financial goods and services for the market, with up to five employees (sub-sector: Producer Households). The upper limit of five employees to distinguish producer households from quasi-corporations is not imposed by ESA95; Istat chose to adopt it as a working criteria, clearly a decision that was in line with the general principles of ESA95 (Dabbicco, 2003).4 Finally, this sector includes non-profit institutions serving households. This is primarily because: first, households are ultimately the beneficiaries of the goods and services offered to them at particularly advantageous conditions by the non-profit institutions; and second, because of this their social/non-profit function and economic behaviour can be easily assimilated with that of the households themselves.
The components of real assets – Based on the indications of ESA95, the values of assets held and outstanding liabilities must be calculated at current market prices. Table A1 presents the breakdown of the instruments. Economic assets are divided into two major aggregates: non-financial assets (AN), corresponding to real assets; and financial assets. Real assets in turn are subdivided into non-financial produced assets (AN.1) and non-financial non-produced assets (AN.2). Non-financial produced assets comprise: fixed assets (AN.11), inventories (AN.12) and valuables (AN.13). Non financial non-produced assets comprise: tangible non-produced assets (AN.21), for example lands and subsoil assets, and intangible non-produced assets (AN.22), such as patents and business goodwill.5
It follows that the real assets of households, which we propose to estimate (whenever the Households Sector is defined as above), comprises the following items: dwellings, valuables, plant, machinery and equipment, inventories and goodwill, and lands.
2.1 Dwellings
Estimates of the residential property holdings of households in any given year comprise three elements: a) the price of dwellings per square meter representing the households’ stock of dwellings; b) the number of dwellings held; c) and, the average floor area of the dwellings in square meters. The estimate of residential dwellings wealth for a given year will therefore be obtained by multiplying these three elements.
3 ESA95 considers the following institutional units: a) public and private corporations; b) co-operatives or partnerships
recognized as independent legal entities; c) households, deemed to be institutional units even if they do not keep a complete set of accounts; d) notional resident units, even if they keep only partial accounts and may not always enjoy autonomy of decision; e) public producers which by virtue of special legislation are recognized as independent legal entities; f) non-profit institutions recognized as independent legal entities; g) agencies of general government; h) quasi-corporations, that is, entities not having independent legal status that keep a complete set of accounts and by convention are deemed to have autonomy of decision inasmuch as their economic and financial behaviour is distinguished from that of the owners.
4 The classification criteria used for the institutional sectors interact with the accounting scheme for assets and liabilities. As Bonci et al. (2007) demonstrate, the composition of household wealth depends on the operative criteria used for the statistical breakdown between producer households and quasi-corporations: raising the threshold (currently 5 employees) beyond which sole proprietorships, informal partnerships and de facto partnerships are classified as quasi-corporations would increase the share of households’ real assets; lowering it would increase the share of financial assets.
5 Financial assets are subdivided into: monetary gold and SDRs (AF.1); currency and deposits (AF.2); securities other than shares (AF.3); loans (AF.4); shares and other equities (AF.5); insurance technical reserves (AF.6); other accounts payable and receivable (AF.7).

The real assets of Italian households
123
a) The price estimate is based on the methodology proposed by Cannari and Faiella (in this volume). The benchmark index is established by means of a composite estimator that uses data from the Italian Property Observatory (OMI) of the Ministry of Finances and the twice-yearly survey of real estate agents published by Italian media group Il Sole 24 Ore, the “Consulente Immobiliare”, extrapolated to the whole universe of Italian municipalities.
b) The number of dwellings is based on the Census data on the stock of houses owned by natural persons in 1991. This stock is updated for subsequent years based on data on new buildings (again owned by natural persons).6 CRESME data, that includes an estimate of illicitly built dwellings, are used up to 2004, and subsequent years employ data provided by the Property Market Observatory.7 The estimate excludes the value of buildings owned abroad by Italian households and buildings owned in Italy by non-resident households.
c) The average floor area of occupied dwellings is taken from the Census data for 1991 and 2001 and is estimated based on the data trends for subsequent years.
Housing wealth is corrected so as to include the sales of Government-owned housing to the household sector.
Following this methodology the dwelling stock of Italian households in 2005 is estimated at €3,887 billion, equal to almost 80 per cent of total real assets (Table A3).
2.2 Valuables
Valuables are non-financial goods that do not deteriorate over time under normal conditions and that are acquired and held primarily as stores of value. They consist of precious metals and stones, non-monetary gold, antiques, and art and other objects belonging to households (Siesto, 1996). Their value is obtained by applying an estimator given by the ratio between the valuables and the stock of durable goods owned by households based on SHIW data.8 This ratio is then applied to the estimated stock of durable goods based on the method developed by Pagliano and Rossi (1992).9
The stock of valuables estimated in this way amounted to €134 billion in 2005 (Table A3).
2.3 Non-residential buildings
This category comprises the market value of the stock of property owned by households and set aside for working purposes, including offices, shops/workshops and warehouses. The total value of the stock held by producer households was obtained by multiplying the estimates of the following components: (1) average price per square meter, (2) average floor area, and (3) the total number of buildings. The prices, computed as the average value of minimum and maximum prices per square meter reported at
6 The stock of dwellings estimated in this way is in line with the number of dwellings reported in the 2001 Census. 7 Rapporto sulle nuove costruzioni nel 2005. Available online (www.agenziaterritorio.it/servizi/
osservatorioimmobiliare/rapporto_construzioni). 8 The ratio is calculated after having Winsorized the numerator and denominator, using as threshold values the 1st and
99th percentile of their distribution. 9 The stock of durable goods is computed by applying the perpetual inventory method to reconstructed series for the
expenditure at constant prices on four different categories of durables, assuming exponential depreciation and retirement of the goods after a fixed number of years (20 years for furniture and furnishings, and 10 years for household equipment, transport, and TV, HI-FI and computer equipment). As standard in national accounts, the current values of the stock are expressed at substitution prices by multiplying the series at constant prices by the deflator of the corresponding expenditure.

Luigi Cannari, Ivan Faiella, Grazia Marchese and Andrea Neri
124
municipal level for each category of building, and the units are based on data from the Property Market Observatory,10 while area estimates were based on data from the 2004 Survey of Household Income and Wealth. The data available permit a time series to be constructed from 2002 onwards only; for previous years, the value of non-residential buildings is obtained by calculating their proportion of the overall value of dwellings and lands. Equal to about 7 per cent, this proportion remains unchanged in the period 2002-2005 and is in line with the SHIW estimates.
In 2005, the value of non-residential buildings based on the estimates used amounted to €312 billion, equal to one third of the total stock of real assets of producer families (Table A3).
2.4 Machinery and equipment
Fixed capital goods, excluding non-residential buildings, comprise machinery and equipment, transport equipment, computer software and other intangible assets owned by producer households. The reconstruction takes data on investments in this sector as the starting point.11 First, an initial value of the net capital stock of producer households at current prices is estimated for 1990, the base year. Producer household investments are then added to this value and depreciation subtracted, calculated by Istat at current prices for producer households and deflated using the National Accounts implicit deflators of fixed investment and of depreciation.12 In this way an estimate is obtained of the stock of net capital at constant prices for the producer household sector in each of the years considered. The net capital stock series at substitution prices is then reconstructed using the relevant deflators calculated by Istat for the whole economy.
The following method is adopted to calculate the initial value of net fixed capital assets (in machinery and equipment) in the base year (1990): first, the ratio between producer households’ investments and the overall amount of investment other than in building is computed; the mean of this ratio, calculated for the 1980s, gives an indication of producer households’ share of total investment in the economy (excluding investment in building). This weighting is then applied to the stock of net fixed assets calculated by Istat for the economic system as a whole (excluding building).
This method relies on an arbitrary assumption but we have two reasons to believe that the estimate obtained in this way for the base year (1990) is sufficiently reliable: first of all, throughout the 1980s the share of producer household investment in total investment (excluding buildings) varied only modestly (fluctuating at around 16 per cent), so that the investment behaviour of producer households was not very dissimilar to that of the entire economic system; secondly, we think it’s plausible that the exclusion of buildings aligns producer household investment portfolios more closely with those of the other productive sectors. In any event, from 1990 onwards the capital stock of producer households is reconstructed by adding investment (and subtracting depreciation) as calculated by Istat for that specific sector to the initial value of the capital stock; for this
10 The number of non-residential buildings owned by producer households is estimated applying the transaction’s share
made by natural persons to the different categories of buildings. 11 The estimates are based on the July 2007 National Accounts. 12 In 2006 Istat presented a methodological review of the series of fixed investments by ownership branch, capital stock
and depreciation. The new data are the result of the general review of the national accounts undertaken in accordance with EU rules, (see Bollettino Economico, No. 46, March 2006: “Revisione delle metodologie di calcolo dei conti nazionali nell’Unione europea”; and, “La revisione delle serie degli investimenti fissi per branca proprietaria, dello stock di capitale e degli ammortamenti”). One consequence of this review was the introduction of chained price indexes to substitute fixed base indexes (taking 1995 as the base year). Given that the new indexes do not allow the quantities to be added at constant prices (additive properties), we have used indexes that retain this property.

The real assets of Italian households
125
reason the quality of the estimates tends to improve as the end of the reference period is approached.
The results, listed in Table A3, show that in 2005 the value of machinery and equipment came to €229 billion, equal to 5 per cent of all real assets.
2.5 Inventories and goodwill
The value of the stock of inventories relative to the entire economic system is obtained using a benchmark provided by Istat with reference to 1989, and adding, for each year, the variation in inventories at constant prices contained in the national accounts.13 The data at constant prices were later converted to current prices using the GDP deflator.
The share of inventories attributable to the producer households was calculated based on the ratio of output at base prices of producer households to that of all non-financial enterprises (non-financial companies plus producer households), assuming that the size of the inventories is commensurate with the volume of production. In the 1990s this ratio averaged 21 per cent.
The goodwill estimate is based on data from the Cerved for smaller-sized companies, i.e. those with turnover below a certain threshold. The turnover threshold was chosen rather than number of employees because the latter is often not present in the Cerved data, while the turnover (given that this is accounting data) is always reported. For each year, the threshold was predetermined based on the average turnover per employee that emerges from the Istat surveys of profit-and-loss accounts of small-sized enterprises (up to 9 employees). For example, in 2002, this average was approximately €94,000, so we felt that enterprises with a turnover of less than €470,000 could constitute a reasonable proxy of those with up to 5 employees. Using this Cerved survey subset the average ratio of goodwill to fixed assets was estimated for the period 1995-2002.14 This proportion, equal to 9 per cent, was then applied to the stock of capital goods reconstructed according to the national accounts data.
The method used has two main limitations: first, the Cerved data refer to private and public companies and public corporations only, so extending the goodwill and tangible fixed asset ratio to producer households is certainly arbitrary. Second, balance-sheet tangible assets are carried at cost less depreciation, so the application of this ratio to the value of capital stock in the national accounts is likely to produce an overestimation of goodwill. Indicating the order of magnitude by share of goodwill in gross tangible fixed assets (in other words before depreciation), revalued to take account of price changes, one gets an estimate of 5.5 per cent (1999). 15 Applying this percentage to the data on the fixed capital goods stock in the national accounts should lead to an underestimate of the value of goodwill, because the revalued gross fixed assets do not take account of capital depreciation.
13 As recalled earlier, chained price indexes do not allow quantities to be added at constant prices (additive properties).
Accordingly, the variation series of the inventories at constant prices which, prior to the 2006 review, was calculated as a residual, is now no longer available. The GDP deflator was used to deflate the series at current prices.
14 The estimate was made in two stages. First, the Company Accounts Data Service was used to calculate the share of goodwill in total intangible assets by class of intangible asset investment; then the estimates were applied to the Cerved data to estimate the total value of goodwill.
15 This assessment is possible only for the reconstructed data of the Company Accounts Data Service for a sample of medium-sized and large industrial accounting units. For this sample, the ratio of intangible to tangible fixed assets valued at cost net of depreciation is 13 per cent, basically equivalent to that measured using the Cerved data.
Luigi Cannari, Ivan Faiella, Grazia Marchese and Andrea Neri
126
By this method, inventories in 2005 were estimated at €89 billion and goodwill at €48 billion (Table A3).
2.6 Lands
The total value of lands is calculated as the sum of the value of agricultural lands and lands set aside for other purposes. The value of lands used for agriculture is based on the overall amount of agricultural lands per region drawn from the annual survey of the property market compiled by the National Institute of Agricultural Economics (INEA).16 To evaluate non-agricultural lands, their value as a percentage of the value of agricultural lands in the SHIW estimates was applied to the foregoing estimate (in the period 1991-2004, this percentage averaged around 11 per cent). The value thus obtained was used to estimate the share of producer households only,17 applying the percentage of farm area that they use according to the latest agricultural Census. This share, equal to 80.4 per cent, was assumed to be valid also for non-agricultural land area and to be substantially stable over time.
In 2005, the value of the lands amounted to €237 billion, equal to approximately 5 per cent of all real assets (Table A3).
3. Micro and macro estimates: the principal conceptual differences
Before proceeding to compare micro and macro estimates it must be remembered that the national accounts and the Survey of Household Income and Wealth (SHIW) respond to different aims, principles and criteria. In the national accounts, for example, the need to distinguish between the consumption and production functions leads to a subdivision between “consumer” and “producer” households; from this requirement there follows an operational criteria based upon the legal form and the number of producer employees of households’ businesses. In a microeconomic study this distinction can be made for survey items (for example sources of income), but it is not suitable for classifying households as such (the same household can perform both the consumer and producer functions); what is more, some items that serve to reconcile the consumer household sector with that of producer households (e.g. the share of mixed income transferred from producer households to consumer households) or that of quasi-corporations (income deriving from the members of quasi-corporations) are based upon operational (and in some respects conventional) criteria that are hard to use in a research study.
The survey, moreover, tries to distinguish assets in respect of which the household plays an active managing or controlling role from assets that merely make up an investment portfolio, whereas the financial accounts distinguish only between types of financial instrument. In other words, for the purposes of the survey it does not matter whether a household business in which the head and spouse work is a de facto company or a private limited company, what matters is the value of the asset (and the income that flows from it). But for the financial accounts these are two different forms of wealth.
It should also be noted that, while ESA95 includes not-for-profit organizations in the definition of the household sector, in a sample survey it would not make sense to give
16 The survey results are available online at: www.inea.it/progetti/mercato_f.cfm. 17 The general census on agriculture provides data on the farm area used according to the owner’s legal form. The
producer household sector was reconstructed taking into account sole proprietorships, agricultural associations and joint leases and some informal partnerships.
The real assets of Italian households
127
them the same questionnaire as that designed for the households.
As to methodology, the comparison between survey data and macroeconomic data requires us to examine two issues: (i) the definition of the field of observation, and (ii) the definition of each asset.
3.1 The field of observation
The SHIW has been conducted by the Bank of Italy since 1962, with the objective of acquiring a deeper insight into the economic behaviour of households. The reference population for the study consists of households listed in the civic register of residents, excluding persons who reside in institutionalized settings (such as hospitals, rest homes, prisons or military buildings). The sample, equal in the last study to about eight thousand households, is chosen using a two-stage18 sample design, where the first-stage units (municipalities) are stratified to take account of population distribution and by city size in terms of population.
There is no great difficulty in reclassifying the survey data by distinguishing between households and quasi-corporations based on the number of employees and the legal form, as happens in the national accounts. This information is in fact gathered for households that carry on a productive activity and for persons who manage companies. The principal differences between the survey and the macroeconomic estimates, as far as the definition of the households sector is concerned, are therefore two: the inclusion, in the household sector of macroeconomic accounts of non-profit institutions serving households, which are excluded from the SHIW; and the survey’s exclusion of the population resident in institutions, which are included, at least in principle, in the macroeconomic estimates.
The first problem can be overcome by separating out the non-profit institutions.19 The problem of the population resident in institutions is insoluble but the impact of its exclusion from the total population is modest (of the order of 0.7 per cent according to census data), so the comparison can be made on a relatively homogeneous basis.
3.2 The components of real wealth
In the survey the real wealth of the household is given by the sum of property − i.e. dwellings, non-residential buildings and land − valuables and “wealth in businesses”. The components are generally valued at realizable prices, estimated subjectively by the interviewee.20
In the SHIW, “wealth in businesses”, of which there is no direct equivalent in ESA95, is given by the sum of three components:
1) the value of the businesses of professionals, sole proprietors and self-employed workers, discovered by the question “How much do you believe your business would be worth if you were to sell it, ceasing to be involved in the business,
18 Starting with the 1989 study a part of the sample (around 50 per cent in the last few surveys) has consisted of
households that had already participated in surveys (panel households), making it possible to study the evolution of such phenomena such as mobility of households between income or different employment statuses.
19 This strategy was adopted for the financial accounts by Bonci, Marchese and Neri (2005). 20 For financial assets the questionnaire does not specify the criteria of valuation: while for shares, investment funds and
other listed assets respondents presumably reported market prices for the year end in question, some instruments (government securities for example) are more likely to be given at face value (see Bonci, Marchese and Neri., 2005).

Luigi Cannari, Ivan Faiella, Grazia Marchese and Andrea Neri
128
counting the equipment used in the activity, inventory and goodwill but not the value of the buildings used?”;21
2) the value of the businesses of the household, drawn from a question similar to the one above;
3) the value of equity in partnerships and companies, where the household member has a managing or controlling role. In this case the value taken is the answer to the question “What is the market value of your share of the partnership/company?”.
There is an important difference between the first two components and the third: in the former the value of the business is calculated with direct reference to the tangible assets (capital assets and inventory) and intangible assets (goodwill) of which it is constituted; in the latter the value is indirect, in that, one refers to a financial asset that itself represents the value of the business (an equity holding).
In principle this distinction is consistent with the representation of economic assets typical of the system of national accounts, which is founded upon the concept of institutional units and their grouping into “sectors of activity”. According to these principles, a business that is not identifiable as an institutional unit separate from its possessor22 − in our case a person classified in the household sector – cannot be considered as an equity asset of the proprietor. But the company’s tangible and intangible assets will appear as assets of the proprietor. This is the case of components 1 and 2 of the “wealth in businesses” according to the survey’s taxonomy. In the proprietor’s balance sheet these components are added to his other assets, irrespective of his role as “producer”; similarly no distinction is made between the liabilities he has incurred to operate the business and others that he may have contracted, for example in his role as consumer.
A business that can be identified as an institutional unit separate from the household that owns it will instead be classified in the national accounts under “corporations and quasi-corporations”. Since the two institutional units belong to different sectors, transactions between them will be recorded in the sectoral accounts and the interests in the capital of the business will be shown among the balance-sheet liabilities of the “corporations and quasi-corporations” sector and among the balance-sheet assets of the household sector, under the financial instrument heading “shares and other equity”, as for component 3 of the survey’s definition of “wealth in businesses”.23
Although the underlying conceptual framework is the same, the survey definitions and those of the national accounts do not coincide perfectly. For the second, not only are partnerships and companies to be classified under “corporations and quasi-corporations” (and not under households) but so are sole proprietorships and informal and de facto partnerships with more than 5 employees, which are conventionally assumed to have autonomy of decision and which the survey instead considers to be indistinguishable from the households that own them.
If the aim is to compare the survey data with the macro estimates, the SHIW data on “wealth in businesses” must be reclassified taking account of the legal form and size
21 Data on the value of the property used in the business is gathered in another part of the questionnaire. 22 That is, it has no power of decision apart from its owner and no separate accounts for it can be reconstructed. 23 Another peculiarity of the definition of “wealth in businesses” used in the survey compared with the national accounts
is that component 3 includes only equity interests in firms in which the household performs a controlling or managing role. Other equity interests are considered components of the financial portfolio and thus part of households’ financial wealth, a clear analogy with the distinction between “direct” and “portfolio” investment in balance-of-payments statistics. No such distinction is to be found however in the theoretical basis of the European System of Accounts, where all assets of this kind, regardless of the purpose for which they are held, are included among financial assets under the heading Shares and other equity.
The real assets of Italian households
129
of the businesses owned by households. The reclassification to be carried out for this paper is detailed in Table A2; very briefly, only the value of sole proprietorships and informal and de facto partnerships will be included among households’ real assets, while the value of the remaining businesses apart from companies should be included among financial assets, under the instrument heading “shares and other equity”.
3.3 The comparison between the two sources
As indicated in the preceding sections, to compare the macroeconomic estimates and those of the SHIW, the latter’s data on “wealth in businesses” must be reclassified by adopting definitions that are more consistent with those of ESA95. Carried out on the data for 2004, this reclassification gives the results shown in Table A4. Of the “wealth in businesses” in 2004, equal on average to €20,363, real assets were allocated 63 per cent and financial assets the remainder.24
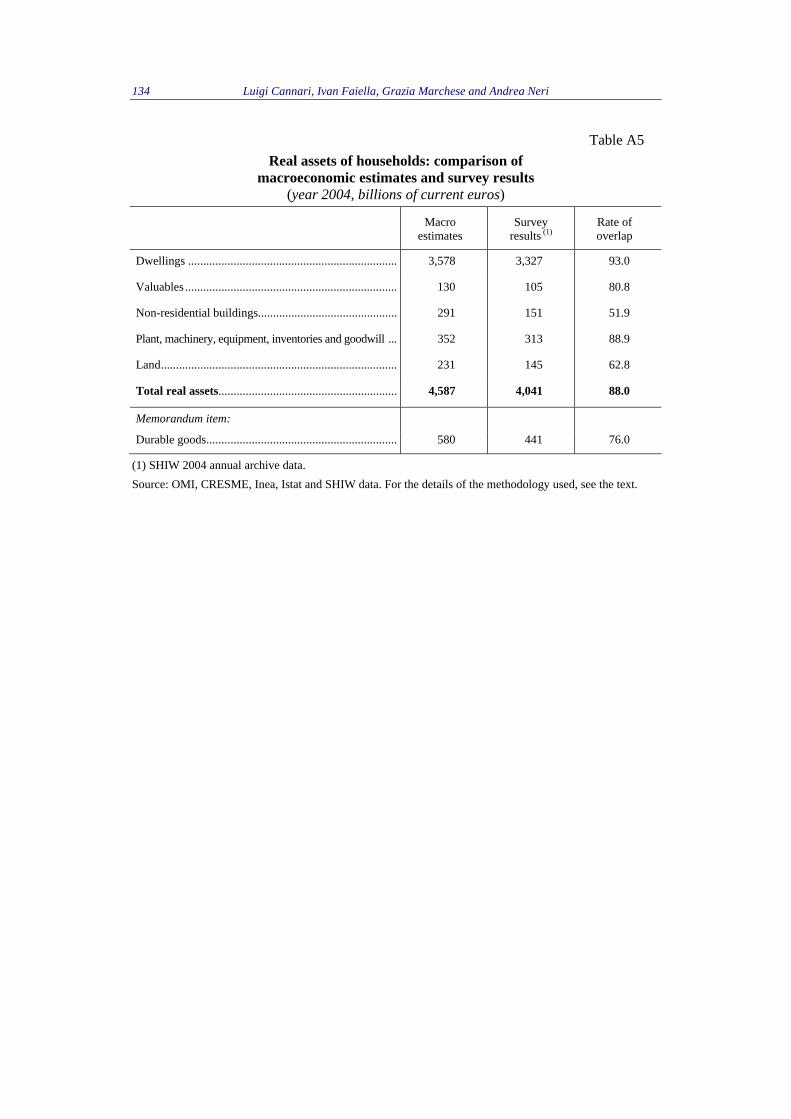
Table A5 shows the comparison between the values obtained from the 2004 survey and the estimate based on macroeconomic sources. For the real assets taken together the ratio between the two estimates is 88 per cent. The survey thus appears able to capture a large part of this component of household wealth. For dwellings the rate of overlap is about 93 per cent. The discrepancy between the two sources can be attributed to the survey’s underestimation of the number of other than owner-occupied dwellings, which is offset, however, by an overestimate of the surface areas (Cannari and Faiella, in this volume).
Lower rates of overlap are found for land and non-residential buildings (63 and 52 per cent respectively) (Table A5). As far as the latter are concerned, it should be noted that in the sections of the survey devoted to “wealth in businesses” interviewees are requested to exclude the value of the buildings used in their business activities. Such buildings are included in another section of the survey, but it is possible that when interviewees come to this section they focus their attention on residential buildings and overlook those used in their business activities.25 Indications regarding the importance of this phenomenon can be obtained by comparing the survey estimates of non-residential buildings with the figures published by the Ministry of Finances on the stock of non-residential buildings divided by type (offices, shops and workshops, and warehouses). Exclusively for transactions carried out during the year, it also provides a breakdown by the legal form of the seller and the buyer. Assuming that the proportion of individuals who carried out transactions in 2000 can be taken as a proxy for the proportion of individuals owning the stock of buildings, the OMI data can be used to obtain an estimate of the number of non-residential buildings owned by individuals, equal to 3.5 million in 2004, compared with the estimate of 1.7 million obtained on the basis of the data of the SHIW for the same year. Thus, for non-residential buildings, as for unoccupied residential buildings, the difference between the sources is due more to an underestimation of the stock than to a difference in its valuation.
The other components of “wealth in businesses” (machinery, inventories and goodwill) have rates of overlap around 90 per cent. As far as these forms of wealth are concerned, more accurate evaluations of the quality of the individual sub-components can
24 The average value of this item is €7,663, corresponding to about €170 billion for the entire population. The value with
which to supplement the estimates of the financial accounts is comparable with the estimates obtained by Rodano and Signorini (in this volume).
25 Starting from the survey referring to 2004, a question was introduced into the section of the questionnaire on the household’s business activities concerning the use of buildings owned by the household in such activities. In the event of a positive answer, in the section of the questionnaire on real estate wealth the household is asked to give an estimate of the value of such buildings.
Luigi Cannari, Ivan Faiella, Grazia Marchese and Andrea Neri
130
be made by using the data of the survey referring to 2004, in which interviewees were asked to provide information on some individual items of “wealth in businesses” (in particular, the value of plant and machinery, inventories and goodwill). In the survey on 2004 plant and machinery accounted for about 34 per cent of the total survey value of “wealth in businesses” (excluding buildings), inventories accounted for 22 per cent and goodwill for the remaining 44 per cent.
4. Conclusions
Official estimates of households’ real assets are not available in Italy. Earlier research that reconstructed this component of wealth overlooked the components related to the activities of producer households.
This paper presents a method for obtaining a valuation of the components of the real assets related to households business activities. Moreover, for the first time valuables were estimated by means of a relationship with the stock of durable goods.
Using this new methodology, the value of households’ real assets was found to be €4,936 billion in 2005. The bulk of these assets consisted of dwellings (€3,887 billion) while nearly 20 per cent consisted of assets belonging to producer households. A substantial proportion of these assets were found to consist of buildings used in households’ business activities (land and non-residential buildings and other components of fixed capital). Valuables accounted instead for less than 3 per cent of the total value of households’ real assets.
The macro estimates of real wealth were then compared with the SHIW data available for 2004 after reconciling the definitions adopted in the survey and redefining some aggregates that go to make up wealth, so as to render them comparable with the macroeconomic estimates. In particular, only the value of sole proprietorships and informal and de facto partnerships with up to 5 employees was included among households’ real assets, while the value of the remaining businesses apart from companies was included among financial assets. After the reclassification the SHIW estimate of “wealth in businesses”, equal to €20,363 per household in 2004, was divided as follows: 69 per cent to real assets and the remainder to financial assets.
The comparison with the macroeconomic estimates shows that the survey can estimate them with a fair degree of accuracy. For 2004 the sample estimates were equal to about 88 per cent of the macro estimates. The “rate of overlap” was particularly high for dwellings (93 per cent), the stock of capital, inventories and goodwill (89 per cent) and valuables (81 per cent). By contrast, the SHIW estimates were less able to capture the property component linked to the activities of producer households. In fact land and non-residential buildings had rates of overlap of 63 and 52 per cent respectively.

The real assets of Italian households
131
APPENDIX
STATISTICAL TABLES
Table A1 Nomenclature of assets in ESA95
AN. NON FINANCIAL ASSETS
AN.1 Produced assets AN.11 Fixed capital AN.111 Produced tangible goods
AN.1111 Dwellings AN.1112 Non-residential buildings and other works AN.1113 Plant and machinery AN.1114 Crops and livestock AN.112 Produced intangible goods AN.12 Inventories AN.13 Valuables AN.2. Non-produced assets AN.21 Non-produced tangible goods AN.211 Land AN.212 Deposits AN.213 Non-cultivated biological resources AN.214 Water resources AN.22 Non-produced intangible goods AN.221 Patents AN.222 Leasing contracts and other transferable contracts AN.223 Goodwill of commercial activities AN.229 Other non-produced intangible goods
AF. FINANCIAL ASSETS
AF.1 Monetary gold and special drawing rights (SDRs) AF.2 Notes, coins and deposits AF.3 Securities other than shares AF.4 Loans AF.5 Shares and other equity AF.51 Shares and other equity, shares/units of investment funds AF.52 Shares/units of investment funds AF.6 Technical provisions of insurance companies AF.7 Other asset and liability accounts AF.71 Trade credits and advances AF.79 Other

Luigi Cannari, Ivan Faiella, Grazia Marchese and Andrea Neri
132
Table A2 Reclassification of “wealth in businesses”
Survey items subject to reclassification Survey definition Definition consist with
macroeconomic estimates
Non-residential buildings Included in ”wealth in buildings”
Reallocated to the item Capital stock, inventories and goodwill
Value of the business for professionals, sole proprietors, self-employed and quasi-employees (Annex B2 of the questionnaire)
Included in ”wealth in businesses”
For businesses with up to 5 employees the component is reallocated to the item Capital stock, inventories and goodwill
For businesses with more than 5 employees the component is reallocated to the item Shareholdings in corporations and quasi-corporations
Value of the business for household businesses (Annex B3 of the questionnaire)
Included in ”wealth in businesses”
For businesses with up to 5 employees the component is reallocated to the item Capital stock, inventories and goodwill
For businesses with more than 5 employees the component is reallocated to the item Shareholdings in corporations and quasi-corporations
Shareholdings in companies (Annex B4 of the questionnaire)
Included in ”wealth in businesses”
For (all) the companies the component is reallocated to the item Shares and other equity
For the remaining businesses with up to 5 employees the component is reallocated to the item Capital stock, inventories and goodwill
For the remaining businesses with more than 5 employees the component is reallocated to the item Shareholdings in corporations and quasi-corporations

The real assets of Italian households
133
Table A3
Households’ real assets (billions of current euros)
1995 1996 1997 1998 1999 2000 2001 2002 2003 2004 2005
Dwellings .......................... 2,113 2,232 2,375 2,407 2,436 2,580 2,753 3,033 3,328 3,578 3,887
Valuables........................... 79 82 85 88 95 104 111 118 124 130 134
Non-residential buildings .. 177 186 197 200 203 215 229 255 277 291 312
Plant, machinery, equipment............................... 115 122 132 143 155 170 184 198 209 219 229
Inventories......................... 63 67 69 72 74 77 78 81 84 87 89
Goodwill............................ 26 28 29 31 32 34 37 41 44 46 48
Land .................................. 179 182 188 194 198 206 215 223 231 236 237
Total real assets 2,751 2,898 3,076 3,135 3,195 3,386 3,606 3,950 4,297 4,587 4,936
Memorandum item: Durable goods ................... 405 428 446 469 486 506 527 546 565 580 598
Source: OMI, CRESME, Inea, Istat and SHIW data. For the details of the methodology used, see the text.
Table A4 SHIW estimates and reconciliation with the ESA95 definitions
(year 2004, averages per household in euros)
SHIW definitions
Real assets 187,410 Definitions aligned with ESA95
Buildings 162,336
Businesses 20,363
Valuables 4,711
Dwellings 148,972
148,972
Land 6,493
6,493
Non-residential buildings
6,737
6,737 (1)
Plant, machinery, equipment,
inventories and goodwill 14,035
14,035 (2)
Real assets
180,948
Valuables 4,711
4,711
(1) Non-residential buildings. (2) Value of the businesses excluding buildings. Source: SHIW 2004 annual archive data.
Luigi Cannari, Ivan Faiella, Grazia Marchese and Andrea Neri
134
Table A5 Real assets of households: comparison of
macroeconomic estimates and survey results (year 2004, billions of current euros)
Macro estimates
Survey results (1)
Rate of overlap
Dwellings ..................................................................... 3,578 3,327 93.0
Valuables ...................................................................... 130 105 80.8
Non-residential buildings.............................................. 291 151 51.9
Plant, machinery, equipment, inventories and goodwill ... 352 313 88.9
Land.............................................................................. 231 145 62.8
Total real assets........................................................... 4,587 4,041 88.0
Memorandum item:
Durable goods............................................................... 580 441 76.0
(1) SHIW 2004 annual archive data. Source: OMI, CRESME, Inea, Istat and SHIW data. For the details of the methodology used, see the text.

The real assets of Italian households
135
REFERENCES
Banca d’Italia (2003), “The Italian Financial Accounts”, Tematiche istituzionali, July. Also available at www.bancaditalia.it/statistiche/metodoc/cofin03.
Bonci, R., Marchese, G. and A. Neri (2005) “La ricchezza finanziaria nei conti finanziari e nell’indagine sui bilanci delle famiglie italiane”, Banca d’Italia, Temi di discussione, No. 565, November.
Bonci, R., Cannari, L., Karagregoriou, A., Marchese, G. and A. Neri (2007), “Defining Household Wealth in Business”, IFC Bulletin, No. 25, March.
Brandolini, A. (1999), “The Distribution of Personal Income in Post-War Italy: Source Description, Data Quality, and the Time Pattern of Income Inequality”, Banca d’Italia, Temi di discussione, No. 350, April.
Brandolini, A. and L. Cannari (1994) Methodological Appendix: The Bank of Italy’s Survey of Household Income and Wealth”, in A. Ando, L. Guiso and I. Visco (eds), Savings and the Accumulation of Wealth, Cambridge, Cambridge University Press, pp. 369-386.
Brandolini, A., Cannari, L., D’Alessio, G. and I. Faiella (2004) “Household Wealth Distribution in Italy in the 1990s”, Banca d’Italia, Temi di discussione, No. 530, December.
Cannari, L. and G. D’Alessio (1990), “Housing Assets in the Bank of Italy’s Survey of Household Income and Wealth”, in C. Dagum and M. Zenga (eds.), Income and Wealth Distribution, Inequality and Poverty Berlin, Springer-Verlag, pp. 326-334.
Cannari, L. and G. D’Alessio (1992), “Mancate interviste e distorsione degli stimatori”, Banca d’Italia, Temi di discussione, No. 172, June.
Cannari, L. and G. D’Alessio (1993), “Non-Reporting and Under-Reporting Behaviour in the Bank of Italy’s Survey of Household Income and Wealth”, Bulletin of the International Statistical Institute – Proceedings of the 49th ISI Session, tome LV, No. 3, August-September, pp. 395-412.
Dabbicco, G. (2003), La classificazione delle unità istituzionali in settori: in particolare delle società e quasi società e delle famiglie, available at www.istat.it/istat/eventi/sec95.
Eurostat (1996), European System of Accounts – ESA 1995, Luxembourg.
Pagliano, P. and N. Rossi (1992), “The Italian Saving Rate: 1951 to 1990 Estimates”, in G. Marotta, P. Pagliano and N. Rossi, “Income and Saving in Italy: a Reconstruction”, Banca d’Italia, Temi di discussione, No. 169, June.
Siesto, V. (1996), La contabilità nazionale italiana, Bologna, Il Mulino.
Tresoldi, C. and I. Visco (1975) “Un tentativo di stima della ricchezza delle famiglie (1963-1973)”, Rivista di Diritto Finanziario e Scienza delle Finanze, No. 4, pp. 516-524.
Related Documents