Ann. occup. Hyg., Vol. 44, No. 8, pp. 565–601, 2000 Crown Copyright 2000 Published by Elsevier Science Ltd on behalf of British Occupational Hygiene Society All rights reserved. Printed in Great Britain. 0003-4878/00/$20.00 PII: S0003-4878(00)00045-4 The Quantitative Risks of Mesothelioma and Lung Cancer in Relation to Asbestos Exposure JOHN T. HODGSON* and ANDREW DARNTON Epidemiology and Medical Statistics Unit, Health and Safety Executive, Magdalen House, Stanley Precinct, Bootle L20 3QZ, UK Mortality reports on asbestos exposed cohorts which gave information on exposure levels from which (as a minimum) a cohort average cumulative exposure could be estimated were reviewed. At exposure levels seen in occupational cohorts it is concluded that the exposure specific risk of mesothelioma from the three principal commercial asbestos types is broadly in the ratio 1:100:500 for chrysotile, amosite and crocidolite respectively. For lung cancer the conclusions are less clear cut. Cohorts exposed only to crocidolite or amosite record similar exposure specific risk levels (around 5% excess lung cancer per f/ml.yr); but chryso- tile exposed cohorts show a less consistent picture, with a clear discrepancy between the mortality experience of a cohort of chrysotile textile workers in Carolina and the Quebec miners cohort. Taking account of the excess risk recorded by cohorts with mixed fibre exposures (generally,1%), the Carolina experience looks uptypically high. It is suggested that a best estimate lung cancer risk for chrysotile alone would be 0.1%, with a highest reasonable estimate of 0.5%. The risk differential between chrysotile and the two amphibole fibres for lung cancer is thus between 1:10 and 1:50. Examination of the inter-study dose response relationship for the amphibole fibres suggests a non-linear relationship for all three cancer endpoints (pleural and peritoneal mesotheli- omas, and lung cancer). The peritoneal mesothelioma risk is proportional to the square of cumulative exposure, lung cancer risk lies between a linear and square relationship and pleural mesothelioma seems to rise less than linearly with cumulative dose. Although these non-linear relationships provide a best fit to the data, statistical and other uncertainties mean that a linear relationship remains arguable for pleural and lung tumours (but not for perito- neal tumours). Based on these considerations, and a discussion of the associated uncertainties, a series of quantified risk summary statements for different levels of cumulative exposure are presented. Crown Copyright 2000 Published by Elsevier Science Ltd on behalf of British Occupational Hygiene Society. All rights reserved Keywords: asbestos; amphibole hypothesis; exposure-response; lung cancer; mesothelioma; quantified risk assess- ment INTRODUCTION There has been much debate on the relative hazard- ousness of the three main asbestos types: crocidolite, amosite and chrysotile (commonly known as blue, brown and white asbestos respectively), but no sys- tematic attempt to quantify the differences. Existing published quantitative risk assessments have mostly not distinguished between the fibre types, and none Received 17 September 1999; in final form 5 June 2000. *Author to whom correspondence should be addressed. Tel.: + 44-151-9514566; fax: + 44-151-95114703; e-mail: john [email protected] 565 has produced quantified estimates of the risk from amphiboles (a collective mineralogical term covering crocidolite and amosite). A review commissioned by the HSE in the 1980s from Professors Richard Doll and Julian Peto (1985) gave estimates for chrysotile alone; more recently a review by the Health Effects Institute (1991) produced estimates for an unspecified mixture of fibre types. An INSERM review (1996) also ignored differences in fibre type, and drew heav- ily on the HEI review. The studies included in this review were selected by reviewing the material referenced in the Doll and Peto, HEI and INSERM reports and identifying all cohort mortality reports for which quantified data on

Welcome message from author
This document is posted to help you gain knowledge. Please leave a comment to let me know what you think about it! Share it to your friends and learn new things together.
Transcript
Ann. occup. Hyg., Vol. 44, No. 8, pp. 565–601, 2000Crown Copyright 2000
Published by Elsevier Science Ltd on behalf of British Occupational Hygiene SocietyAll rights reserved. Printed in Great Britain.
0003-4878/00/$20.00PII: S0003-4878(00)00045-4
The Quantitative Risks of Mesothelioma and LungCancer in Relation to Asbestos ExposureJOHN T. HODGSON* and ANDREW DARNTONEpidemiology and Medical Statistics Unit, Health and Safety Executive, Magdalen House, StanleyPrecinct, Bootle L20 3QZ, UK
Mortality reports on asbestos exposed cohorts which gave information on exposure levelsfrom which (as a minimum) a cohort average cumulative exposure could be estimated werereviewed. At exposure levels seen in occupational cohorts it is concluded that the exposurespecific risk of mesothelioma from the three principal commercial asbestos types is broadlyin the ratio 1:100:500 for chrysotile, amosite and crocidolite respectively. For lung cancerthe conclusions are less clear cut. Cohorts exposed only to crocidolite or amosite recordsimilar exposure specific risk levels (around 5% excess lung cancer per f/ml.yr); but chryso-tile exposed cohorts show a less consistent picture, with a clear discrepancy between themortality experience of a cohort of chrysotile textile workers in Carolina and the Quebecminers cohort. Taking account of the excess risk recorded by cohorts with mixed fibreexposures (generally,1%), the Carolina experience looks uptypically high. It is suggestedthat a best estimate lung cancer risk for chrysotile alone would be 0.1%, with a highestreasonable estimate of 0.5%. The risk differential between chrysotile and the two amphibolefibres for lung cancer is thus between 1:10 and 1:50.
Examination of the inter-study dose response relationship for the amphibole fibres suggestsa non-linear relationship for all three cancer endpoints (pleural and peritoneal mesotheli-omas, and lung cancer). The peritoneal mesothelioma risk is proportional to the square ofcumulative exposure, lung cancer risk lies between a linear and square relationship andpleural mesothelioma seems to rise less than linearly with cumulative dose. Although thesenon-linear relationships provide a best fit to the data, statistical and other uncertainties meanthat a linear relationship remains arguable for pleural and lung tumours (but not for perito-neal tumours).
Based on these considerations, and a discussion of the associated uncertainties, a series ofquantified risk summary statements for different levels of cumulative exposure are presented.Crown Copyright 2000 Published by Elsevier Science Ltd on behalf of British OccupationalHygiene Society. All rights reserved
Keywords: asbestos; amphibole hypothesis; exposure-response; lung cancer; mesothelioma; quantified risk assess-ment
INTRODUCTION
There has been much debate on the relative hazard-ousness of the three main asbestos types: crocidolite,amosite and chrysotile (commonly known as blue,brown and white asbestos respectively), but no sys-tematic attempt to quantify the differences. Existingpublished quantitative risk assessments have mostlynot distinguished between the fibre types, and none
Received 17 September 1999; in final form 5 June 2000.*Author to whom correspondence should be addressed. Tel.:+44-151-9514566; fax:+44-151-95114703; e-mail: [email protected]
565
has produced quantified estimates of the risk fromamphiboles (a collective mineralogical term coveringcrocidolite and amosite). A review commissioned bythe HSE in the 1980s from Professors Richard Dolland Julian Peto (1985) gave estimates for chrysotilealone; more recently a review by the Health EffectsInstitute (1991) produced estimates for an unspecifiedmixture of fibre types. An INSERM review (1996)also ignored differences in fibre type, and drew heav-ily on the HEI review.
The studies included in this review were selectedby reviewing the material referenced in the Doll andPeto, HEI and INSERM reports and identifying allcohort mortality reports for which quantified data on

566 J. T. Hodgson and A. Darnton
exposure was available either as an average for thecohort as a whole, or for individual subgroups. Seven-teen such cohorts were identified (Albinet al., 1990a;de Klerk et al., 1994; Dementet al., 1994; Enterlineet al., 1987; Finkelstein, 1984; Hugheset al., 1987;Liddell et al., 1997; McDonaldet al., 1983b, 1984;Neuberger and Kundi, 1990; Newhouse and Sullivan,1989; Petoet al., 1985; Piolattoet al., 1990; Seidmanet al., 1986; Seidman and Selikoff, 1990; Sluis-Cremeret al., 1992; Talcottet al., 1989). Three ofthe selected cohorts have been split into sub-cohortswhich have been separately treated in this review: theSouth African crocidolite and amosite mining cohortshave been treated separately; the New Orleans asbes-tos cement cohort has been split into the two separateplants covered, since the mix of fibres used in the twoplants was different; and the Carolina textile cohorthas been split by sex, since the results for men andwomen were rather different. The cohorts have beenreferred to by their geographical location except forcohorts 3 (Enterlineet al., 1987) and 17 (Newhouseand Sullivan, 1989) which are identified by a com-pany name, and cohort 15 (Albinet al., 1990a) wherethe name of the principal author on the cohort hasbeen used.
Information extractedInformation was extracted from the identified
reports on the following:
O The number of deaths in the cohort from all causesand from lung cancer, and the correspondingSMRs;
O Dose specific lung cancer SMRs (or rates),where available;
O The number of mesothelioma deaths in the cohort(for pleural and peritoneal mesotheliomaseparately);
O The rates of mesothelioma by categories of timesince first exposure;
O The process/type of work being carried out;O Cohort recruitment period and duration of follow
up;O Average age at first exposure, when available;O The type(s) of asbestos fibre used in the process;O The average fibre levels for the entire cohort and
the average employment duration for workers inthe cohort, or simply the average cumulativeexposure for the entire cohort;
O Information about the smoking habits of the work-ers in the cohort where available;
O The sex of the workers.
Some general issues on the summary of outcomeand exposure measures are discussed below. A moredetailed discussion on some of these points is givenin Appendix A, and the extracted data is shown infull in Tables 12 and 13.
Excess lung cancer measureExcess overall lung cancer mortality has been
expressed as a percentage excess of expected lungcancer mortality per unit of cumulative exposure.
RL = 100(OL2EL)/(EL.X)
WhereOL and EL are the numbers of observed andexpected lung cancers, respectively andX is cohortmean exposure. This estimate of the lung cancer riskis described as the ‘cohort average’ estimate. 95%confidence limits for the cohort average estimateRL
have been calculated assuming a Poisson distributionfor OL.
Mesothelioma measureMesothelioma mortality was expressed as a per
cent of expected mortality from all causes (adjustedto an age of first exposure of 30) per unit of cumulat-ive exposure.
RM = 100OM/(EAdjX)
Where OM is the number of mesothelioma deaths,EAdj the total expected deaths from all causes adjustedto an age of first exposure of 30, andX the meancumulative exposure. (See Appendix A for a dis-cussion of this measure, and the calculation ofEAdj).When the expected all causes mortality was not avail-able, the denominator was taken to be the totalobserved deaths less the total of asbestos-relateddeaths (mesothelioma, asbestosis and any excess lungcancer deaths). A 95% confidence interval forRM wascalculated assuming a Poisson distribution forOM.
Treatment of ‘best evidence’ cause of death dataIn some studies causes of death have been assigned
in two ways, one based purely on data given on thedeath certificates (DC), the other using other data (e.g.autopsy reports) to establish a ‘best evidence’ (BE)cause of death. For lung cancer this review has gener-ally used the DC data, since this preserves compar-ability with the reference rates, and with the majorityof other studies. For mesothelioma however, the BEdata has been used, since reference rates are inappro-priate, and most studies use some sort of best evi-dence judgement to identify mesotheliomas.
It might be thought that where reference rates arederived from DC data (as in the SMR analyses inthis report) the observed deaths on a DC basis shouldalways be used. The argument is not as clear cut asit seems. The coding of death certificates is subjectto a range of errors, and the net error in the count ofdeaths coded to lung cancer on national death certifi-cates will be determined by the balance of these errorsacross the whole population. One of these errors isthe tendency of pleural mesothelioma deaths to becoded to lung cancer. In the population as a whole,

567Quantitative risks of mesothelioma and lung cancer
this error is very small, but in an asbestos exposedcohort it may have a substantial effect. Leaving themiscoded mesotheliomas in the lung cancer count willoverstate the true lung cancer SMR. Excluding themwill in theory understate it, but only to the smallextent that this error affects the population as a whole.The best available approximation to a true estimateof the risk is therefore to exclude the miscoded meso-theliomas, and this has been done for this review.
Derivation of cohort mean exposure estimatesMean exposure for cohorts was calculated in differ-
ent ways, depending on the available information.When data was given for separate exposure groups,the cohort mean was calculated by weighting the indi-vidual group means by the expected deaths from lungcancer in the group. On the assumption that excessrisk is proportional to cumulative exposure, thisweighting preserves the same proportionality whenthe results from subgroups with different exposuresare aggregated, it is therefore the optimal statisticalmeasure of aggregate exposure.
Where mean exposure values for individual dosecategories were not given, the midpoints were used.The top exposure category was usually given as anopen interval (e.g. exposures>100 f/ml.yr): in thesecases a value was chosen based on a view of the high-est likely exposure and the distribution of individualsacross all exposure categories. It was assumed thatwhere the highest category contains a relatively smallproportion of the population, the category mean willbe a smaller multiple of the lower band than other-wise.
For cohorts where results for exposure specific sub-groups were not given, the cohort mean was eithergiven directly (cohorts 4, 13 and 15); derived frominformation given on the distribution of individualdoses (cohorts 1 and 7), or on the exposure of internalcontrols (cohort 17), or by multiplying a meanexposure level by mean exposure duration (cohorts 8and 14).
Exposure estimates given in particle counts wereconverted to counts of ‘regulated fibres’ (fibres withan aspect ratio greater than 3:1, and length>=5microns), using conversion factors calculated by thereport authors where possible. The most commonlyused conversion was 1 mppcf (million particles percubic foot)=3 f/ml (fibres per millilitre), and this wasthe value adopted for the Johns Manville cohort,where a conversion was not given. For the Massachu-setts cohort, where the fibre involved was crocidolite(rather than chrysotile as in the other cohorts withparticle counts), an independent expert hygienist wasasked for an assessment (see Appendix B).
The exposure estimates for Wittenoom have beenquestioned by Rogers (1990) who has suggested—having re-examined some of the original samplesusing modern light and electron microscopy—that thelevels may have been underestimated by up to a factor
of 10. Details of this reassessed data were to be pub-lished, but these have not so far appeared in print.It is therefore difficult to know whether to make anadjustment to the published estimates, and if so byhow much. Similar comments may of course apply toother cohorts and introducing a correction might thendistort rather than correct the overall picture. de Klerkand colleagues, developing estimates of environmen-tal risk at Wittenoom (1992) use a factor of 4 withoutdetailed discussion. The effect of using this adjustedexposure level is examined as a variant of the mainanalyses.
Exposure-specific risk estimatesIt is generally assumed that the most reliable guide
to dose-specific risk is provided by exposure analysesusing estimates of individual exposure. This is clearlythe case when these individual exposure values canbe accurately determined. However this assumptionis very much not the case in the studies in this review.Not only are there the inevitable problems of extrapo-lating earlier exposures on the basis of more recentmeasurements; there are also problems of convertingthe most usual historic measurements (in terms ofparticle counts) to the more relevant measure of fibrecounts. Direct fibre counting only became generallyused in the 1970s.
In these circumstances it is at least arguable thatglobal assessments of average exposure, set againstoverall mortality outcomes, should be preferred.Exposure–response regressions with inaccurate indi-vidual exposure assignments will produce a slopeestimate biased downwards. Use of an overall assess-ment will also minimise the error introduced by con-version from particle counts to fibres, since theseaverage conversion factors will represent a moreaccurate conversion for the totality of exposure thanfor a particular individual.
However, the arguments are not all one way. Over-all mortality outcomes can only be assessed againstsome outside reference—usually the regional ornational population—and this may not represent atrue baseline level for the exposed population in ques-tion. Assessment of an internal exposure responsegives some check on this issue. A complete absenceof exposure response must cast some doubt on anyoverall excess being counted as a measure of risk (theAlbin and Connecticut cohorts are examples of this).
Cohort-level risk measures were chosen for thisreview both because these allow a wider range of datato be assessed than if attention is restricted to internalexposure response analyses and since (as arguedabove) cohort-level exposure estimates are likely tobe more accurate than individual exposures.
SmokingThe evidence on the joint effect of smoking and
asbestos exposure on lung cancer has been reviewed
568 J. T. Hodgson and A. Darnton
recently (Vainio and Bofetta, 1994) who concludethat the overall evidence indicates an interaction inthe multiplicative region. This implies that the rela-tive risk of lung cancer due to asbestos exposure willbe the same for smokers and non-smokers alike. ThusSMRs for lung cancer based on a reference popu-lation with the same smoking habits as the cohortmembers should only reflect the effect on mortalitydue to asbestos exposure. An earlier review by Berryet al. (1985) estimated that the effect of asbestosexposure was about 1.8 times greater in non-smokersthan in smokers (though with confidence limits whichdid not exclude a simple multiplicative interaction).If this is the case the observed effect of asbestos onlung cancer rates will be greater in populations withlower smoking prevalence. However, given the rela-tive lung cancer risks typical of smoking (about 15-fold) and asbestos exposure (about 2-fold) togetherwith the generally high prevalence of smoking in theobserved populations, the scope for bias—if there isindeed a differential effect of the scale suggested—is limited. In either case, a problem arises when thesmoking habits of the cohort members differ fromthose of the reference population, which is the casefor some of the cohorts reviewed. For this reason, anyinformation about smoking given in the studies wassummarised. The amount of information given wasvery variable, and could be categorised as follows:
1. No information given, (Ferodo, US Insulators, Pat-erson, South Africa, Johns Manville, Albin).
2. The percentage of the cohort that smoked, usuallybased on a cross sectional survey conducted in aparticular year, (Connecticut, Balangero, Quebec,Pennsylvania, Rochdale, Wittenoom).
3. Comparison of the prevalence of smoking in thecohort and the reference population, (New Orle-ans, Massachusetts, Carolina).
4. Estimation of the effect of any differences inprevalence—for example calculation of smokeradjusted lung cancer SMRs, (Vocklabruck)
5. Data on prevalence of smoking within exposurecategories—but with no external comparison(Ontario).
Most studies fell within the first two of the abovecategories. In these cases only subjective judgementscould be made by the authors about the smoking hab-its of the cohort members. Also, cross sectional stud-ies were often based on a small proportion of thecohort and may not be very representative. For moststudies which addressed the issue the authors con-cluded that there was no major difference in smokingprevalence or that the slight differences in prevalencewere not likely to change the expected number oflung cancer deaths in a substantial way. Of the studieswhere comparative smoking data were given, theVocklabruck cohort showed the largest difference incohort smoking habits and those of the general popu-
lation, and this was the only study where an explicitadjustment for smoking was made. Unadjusted datawas used for all other studies.
Fibre type and industry processFor the purpose of summarising the information
given in the studies, each cohort was given a fibretype classification of 1, 2 or 3 letters according to thetype of fibre used, with the letters y, a and o rep-resenting chrysotile, amosite and crocidoliteexposures respectively. For example:
‘yao’ means all three commercial asbestos typeswere used in the cohort
‘yo’ means chrysotile and crocidolite were used‘a’ means only amosite was used
The order of the letters indicates the relative impor-tance of the fibres used. Very small quantities of fibrewere ignored in some cohorts (Carolina, New Orleansplant 1, Connecticut), the reasoning for this in eachcase is set out in Appendix A (Table 14). In a similarway, for display in tabular and graphical data sum-maries, industry process was coded as follows.
M MinesC CementT TextilesI Insulation ProductsF Friction ProductsL Lagging and work with insulationO Other
Meta-analytic issuesThe aim of a meta-analysis is to identify where evi-
dence from different studies is discrepant; ideally, toexplain the reasons for the discrepancies; and wheredata from different studies are coherent to combinethem into a common summary which will be moreprecise and soundly based than the estimate from anysingle study. For this review the coherence of esti-mates ofRL and RM from different studies has beenassessed in a Poisson regression framework, fitting acommon value of the parameter of interest across agroup of studies and testing the residual deviancebetween the observed and predicted numbers ofevents (mesothelioma or lung cancer deaths) in thestudies in the group. Confidence limits around thegroup estimates were calculated by profile likelihoodmethods. Confidence limits are not shown for themeans of groups which show very significant hetero-geneity, since such limits have no ready interpret-ation. Indeed, in this situation it is not clear that themean itself has any natural meaning. Faced withclearly discrepant data, purely statistical criteria can-not be used to decide on a ‘correct’ summary orcompromise estimate.
The statistical analyses in this report only takeaccount of the statistical variability of the mortality
569Quantitative risks of mesothelioma and lung cancer
outcomes. The statistical variability in expected mor-tality levels and cohort average exposures areignored. This means that calculated confidence inter-vals will be narrower and statistical distinctionssharper than they would be if these variabilities wereknown and allowed for. This needs to be borne inmind in the interpretation of these analyses.
RESULTS
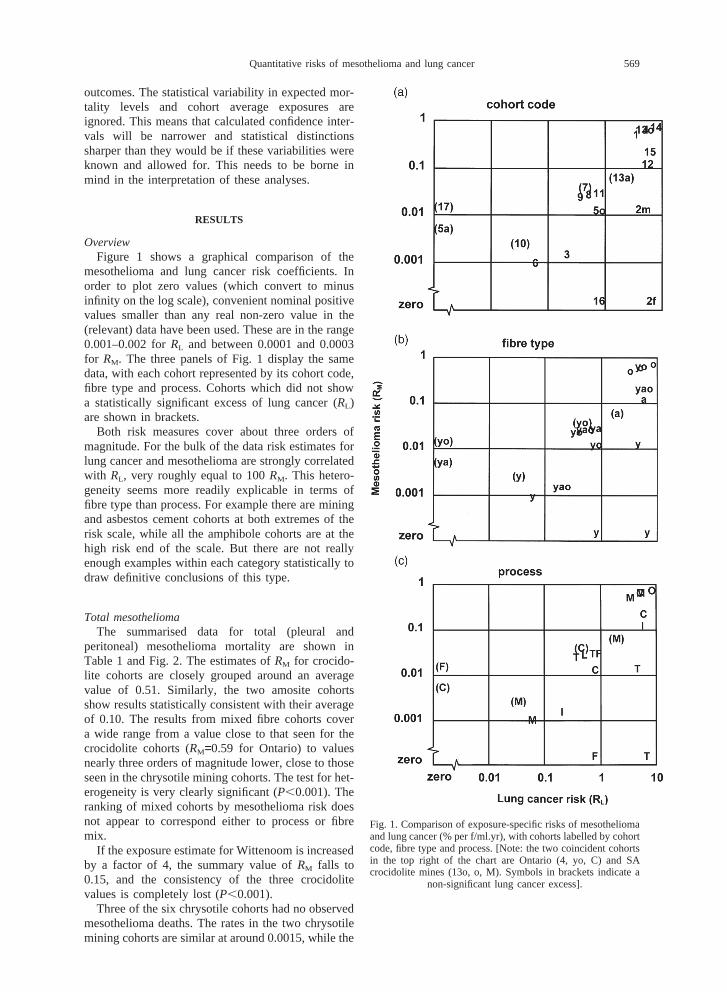
OverviewFigure 1 shows a graphical comparison of the
mesothelioma and lung cancer risk coefficients. Inorder to plot zero values (which convert to minusinfinity on the log scale), convenient nominal positivevalues smaller than any real non-zero value in the(relevant) data have been used. These are in the range0.001–0.002 forRL and between 0.0001 and 0.0003for RM. The three panels of Fig. 1 display the samedata, with each cohort represented by its cohort code,fibre type and process. Cohorts which did not showa statistically significant excess of lung cancer (RL)are shown in brackets.
Both risk measures cover about three orders ofmagnitude. For the bulk of the data risk estimates forlung cancer and mesothelioma are strongly correlatedwith RL, very roughly equal to 100RM. This hetero-geneity seems more readily explicable in terms offibre type than process. For example there are miningand asbestos cement cohorts at both extremes of therisk scale, while all the amphibole cohorts are at thehigh risk end of the scale. But there are not reallyenough examples within each category statistically todraw definitive conclusions of this type.
Total mesotheliomaThe summarised data for total (pleural and
peritoneal) mesothelioma mortality are shown inTable 1 and Fig. 2. The estimates ofRM for crocido-lite cohorts are closely grouped around an averagevalue of 0.51. Similarly, the two amosite cohortsshow results statistically consistent with their averageof 0.10. The results from mixed fibre cohorts covera wide range from a value close to that seen for thecrocidolite cohorts (RM=0.59 for Ontario) to valuesnearly three orders of magnitude lower, close to thoseseen in the chrysotile mining cohorts. The test for het-erogeneity is very clearly significant (P,0.001). Theranking of mixed cohorts by mesothelioma risk doesnot appear to correspond either to process or fibremix.
If the exposure estimate for Wittenoom is increasedby a factor of 4, the summary value ofRM falls to0.15, and the consistency of the three crocidolitevalues is completely lost (P,0.001).
Three of the six chrysotile cohorts had no observedmesothelioma deaths. The rates in the two chrysotilemining cohorts are similar at around 0.0015, while the
Fig. 1. Comparison of exposure-specific risks of mesotheliomaand lung cancer (% per f/ml.yr), with cohorts labelled by cohortcode, fibre type and process. [Note: the two coincident cohortsin the top right of the chart are Ontario (4, yo, C) and SAcrocidolite mines (13o, o, M). Symbols in brackets indicate a
non-significant lung cancer excess].

570 J. T. Hodgson and A. Darnton
Tab
le1.
Sum
mar
yof
mes
othe
liom
am
orta
lity
data
and
expo
sure
-spe
cific
risk
estim
ates
Coh
ort
Coh
ort
nam
eP
roce
ssF
ibre
Mes
othe
liom
ade
aths
Tot
alA
djus
tmen
tA
vera
geM
esot
helio
ma
risk
expr
esse
das
P-v
alue
for
num
ber
expe
cted
fact
orfo
rcu
mul
ativ
epe
rcen
tage
tota
lex
pect
edm
orta
lity
per
hete
roge
neity
mor
talit
yag
efir
stex
posu
ref/m
l.yr
(R
M)
expo
sed
(f/m
l.yr)
Tot
alN
umbe
rU
nadj
uste
dA
djus
ted
for
95%
CI
num
ber
perit
onea
lag
eat
first
expo
sure
14M
assa
chus
etts
Oo
53
8.3
0.74
120
0.50
0.68
(0.2
2,1.
6)1
Witt
enoo
mM
o72
1060
1.8
1.08
230.
520.
48(0
.38,
0.60
)13
oS
Acr
ocid
olite
min
esM
o20
222
3.2
a0.
9316
.40.
550.
59(0
.36,
0.91
)T
otal
–C
roci
dolit
e97
150.
51(0
.41,
0.61
)0.
6co
hort
s12
Pat
erso
nI
a17
935
5.9
0.63
650.
073
0.12
(0.0
68,0
.19)
13a
SA
amos
item
ines
Ma
41
305.
7a
0.93
23.6
0.05
60.
060
(0.0
16,0
.015
)T
otal
–am
osite
coho
rts
2110
0.10
(0.0
62,0
.15)
0.2
4O
ntar
ioC
yo17
862
.20.
7760
0.46
0.59
(0.3
4,0.
9)15
Alb
inC
yao
130
493.
31
130.
20.
2(0
.11,
0.35
)7
Voc
klab
ruck
Cyo
51
530.
21.
0525
0.03
80.
036
(0.0
12,0
.084
)8
US
/Can
ada
insu
lato
rsL
yao
453
282
3170
.61.
0950
00.
029
0.02
6(0
.024
,0.0
29)
11P
enns
ylva
nia
TF
ya14
482
1.1
1.08
600.
029
0.02
7(0
.014
,0.0
44)
9R
ochd
ale
Tyo
100
602.
51
740.
022
0.02
2(0
.011
,0.0
41)
17F
erod
oF
yo13
026
46.3
135
0.01
40.
014
(0.0
075,
0.02
4)5o
New
Orle
ans
(pla
nt2,
yo)
Cyo
30
217
b1.
2693
0.01
50.
012
(0.0
024,
0.03
4)5a
New
Orle
ans
(pla
nt1)
Cya
10
294.
50.
8579
0.00
40.
005
(0.0
001,
0.02
8)3
John
sM
anvi
llere
tiree
sI
yao
82
762.
51
750
0.00
10.
001
(0.0
005,
0.00
28)
0.02
1P
,0.
001
2mC
arol
ina
(men
)T
y1
141
0.1
1.34
280.
017
0.01
3(0
.001
6,0.
047)
10B
alan
gero
My
20
225.
41.
230
00.
003
0.00
25(0
.000
3,0.
009)
6Q
uebe
cM
y33
059
12.7
160
00.
001
0.00
09(0
.000
6,0.
0013
)2f
Car
olin
a(w
omen
)T
y0
-29
9.2
1.34
260
0(0
,0.0
35)
5yN
ewO
rlean
s(p
lant
2,y)
Cy
0-
397.
1b
1.26
220
0(0
,0.0
33)
16C
onne
ctic
utF
y0
-55
0.7
0.93
460
0(0
,0.0
16)
Poo
led
chry
sotil
ees
timat
esT
otal
370
0.00
10(0
.000
7,0.
0014
)0.
11–
excl
udin
gC
arol
ina
350
0.00
10(0
.000
7,0.
0013
)0.
69m
en–
excl
udin
gm
ines
700
0.00
33(0
.000
6,0.
010)
0.14
a Red
uced
bya
fact
orof
0.67
toex
clud
eex
pect
edde
aths
less
than
10yr
from
first
expo
sure
(see
App
endi
xC
).bE
xpec
ted
all
caus
em
orta
lity
inpl
ant
2pa
rtiti
oned
inpr
opor
tion
tosh
are
ofex
pect
edlu
ngca
ncer
.

571Quantitative risks of mesothelioma and lung cancer
Fig. 2. Exposure-specific mesothelioma mortality (RM) by cohort and fibre type groupings, showing 95% confidence intervals.Group means labelled in capitals. Confidence intervals not shown for groups with very significant heterogeneity.
two cases seen in among men in the Carolina cohortproduce an estimate, with wide confidence limits, of0.013—about an order of magnitude higher than forthe mines cohorts. The very wide confidence limitsfor the three cohorts where no cases were observedare statistically consistent with either end of thisrange. Indeed there is no significant heterogeneitybetween RM estimates in the chrysotile group,although the total shows some tendency to heterogen-eity (P=0.11). If the mines cohorts are excluded, thecentral combined estimate ofRM increases to 0.0033,but with wide confidence limits (0.0006–0.01) andwith a similar level of heterogeneity (P=0.14). Withthe Carolina men excluded, the remaining data arecoherent (P for heterogeneity=0.69), and the meanestimate ofRM is 0.001 (95% CI 0.0007 to 0.0013)No summary estimate ofRM has been calculated forthe mixed fibre cohorts, since these are so clearly stat-istically heterogeneous. This heterogeneity is plausi-bly explicable by variations in the mix of fibresencountered. The estimates from the pure fibrecohorts suggest a difference in potency approachingtwo orders of magnitude between chrysotile andamosite, and a further five-fold difference betweenamosite and crocidolite. If these gross differences areeven approximately correct, quite small variations inthe fibre mix in the cohorts exposed to several fibretypes could have important effects on the mesotheli-oma risk in the cohort. This would have the conse-quence that the generally measured fibre levels would
be an unreliable estimate of the true risk status. Thiswill be particularly true where the history of usage ofdifferent fibre types has varied over time.
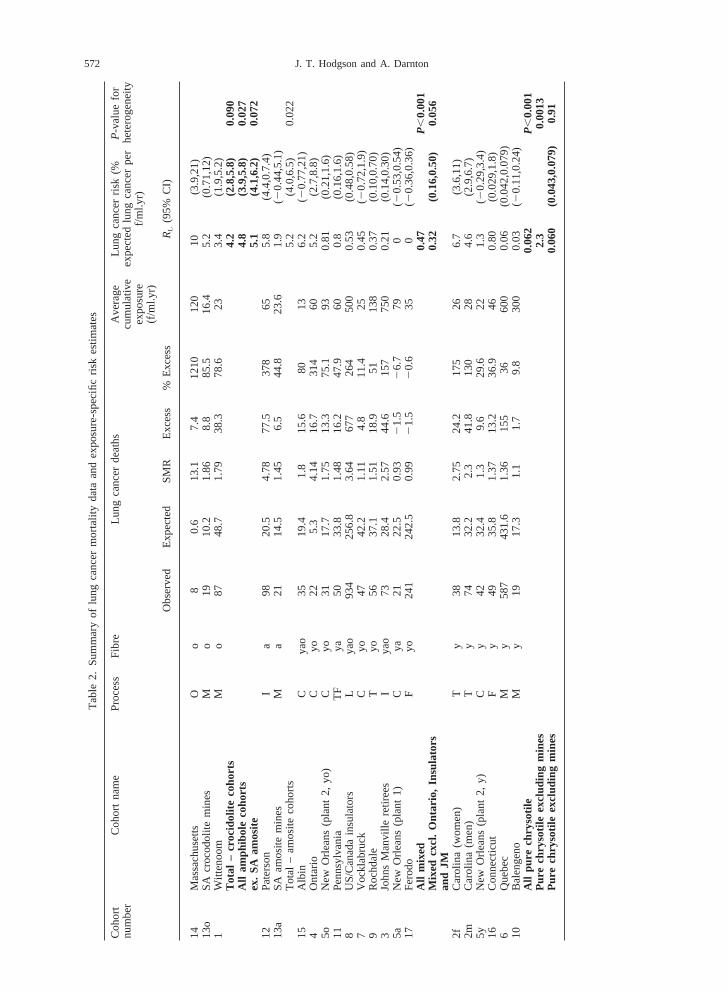
Lung cancerThe summary data for lung cancer is shown in
Table 2 and Fig. 3. The pure fibre groupings are lesscoherent forRL than forRM, although the general pic-ture is similar, with higher values for the amphibolecohorts, lower values for most of the chrysotilecohorts and intermediate values for the mixedexposure groups. The Carolina cohort is the one clearexception to this pattern. The mean estimate for thethree crocidolite cohorts is 4.2% per f/ml.yr (95% CI2.8–5.8). The two amosite cohorts give somewhat dif-ferent results, and despite the wide confidence limitson the South African data they are not statisticallyconsistent (P=0.022). Their joint mean is 5.2% perf/ml.yr (95% CI 4.0–6.5). The five amphibole cohortstaken together are also not a statistically consistentgroup (P=0.027), with a joint mean of 4.8% perf/ml.yr (95% CI 3.9–5.8). The heterogeneity is mainlydue to the SA amosite cohort, and if this is set asidethe remaining four amphibole cohorts are just statisti-cally consistent (P=0.072) with a joint mean of 5.1%per f/ml.yr (95% CI 4.1–6.2). If the exposure estimatefor Wittenoom is increased by a factor of 4, the sum-mary value ofRL falls to 2 for the combined amphi-bole cohorts and to 1.1 for the three crocidolite
572 J. T. Hodgson and A. Darnton
Tab
le2.
Sum
mar
yof
lung
canc
erm
orta
lity
data
and
expo
sure
-spe
cific
risk
estim
ates
Coh
ort
Coh
ort
nam
eP
roce
ssF
ibre
Lung
canc
erde
aths
Ave
rage
Lung
canc
erris
k(%P-v
alue
for
num
ber
cum
ulat
ive
expe
cted
lung
canc
erpe
rhe
tero
gene
ityex
posu
ref/m
l.yr)
(f/m
l.yr)
Obs
erve
dE
xpec
ted
SM
RE
xces
s%
Exc
ess
RL
(95%
CI)
14M
assa
chus
etts
Oo
80.
613
.17.
412
1012
010
(3.9
,21)
13o
SA
croc
odol
item
ines
Mo
1910
.21.
868.
885
.516
.45.
2(0
.71,
12)
1W
itten
oom
Mo
8748
.71.
7938
.378
.623
3.4
(1.9
,5.2
)T
otal
–cr
ocid
olite
coho
rts
4.2
(2.8
,5.8
)0.
090
All
amph
ibol
eco
hort
s4.
8(3
.9,5
.8)
0.02
7ex
.S
Aam
osite
5.1
(4.1
,6.2
)0.
072
12P
ater
son
Ia
9820
.54.
7877
.537
865
5.8
(4.4
,0.7
.4)
13a
SA
amos
item
ines
Ma
2114
.51.
456.
544
.823
.61.
9(
20.
44,5
.1)
Tot
al–
amos
iteco
hort
s5.
2(4
.0,6
.5)
0.02
215
Alb
inC
yao
3519
.41.
815
.680
136.
2(
20.
77,2
1)4
Ont
ario
Cyo
225.
34.
1416
.731
460
5.2
(2.7
,8.8
)5o
New
Orle
ans
(pla
nt2,
yo)
Cyo
3117
.71.
7513
.375
.193
0.81
(0.2
1,1.
6)11
Pen
nsyl
vani
aT
Fya
5033
.81.
4816
.247
.960
0.8
(0.1
6,1.
6)8
US
/Can
ada
insu
lato
rsL
yao
934
256.
83.
6467
726
450
00.
53(0
.48,
0.58
)7
Voc
klab
ruck
Cyo
4742
.21.
114.
811
.425
0.45
(2
0.72
,1.9
)9
Roc
hdal
eT
yo56
37.1
1.51
18.9
5113
80.
37(0
.10,
0.70
)3
John
sM
anvi
llere
tiree
sI
yao
7328
.42.
5744
.615
775
00.
21(0
.14,
0.30
)5a
New
Orle
ans
(pla
nt1)
Cya
2122
.50.
932
1.5
26.
779
0(2
0.53
,0.5
4)17
Fer
odo
Fyo
241
242.
50.
992
1.5
20.
635
0(2
0.36
,0.3
6)A
llm
ixed
0.47
P,
0.00
1M
ixed
cxcl
.O
ntar
io,
Insu
lato
rs0.
32(0
.16,
0.50
)0.
056
and
JM2f
Car
olin
a(w
omen
)T
y38
13.8
2.75
24.2
175
266.
7(3
.6,1
1)2m
Car
olin
a(m
en)
Ty
7432
.22.
341
.813
028
4.6
(2.9
,6.7
)5y
New
Orle
ans
(pla
nt2,
y)C
y42
32.4
1.3
9.6
29.6
221.
3(
20.
29,3
.4)
16C
onne
ctic
utF
y49
35.8
1.37
13.2
36.9
460.
80(0
.029
,1.8
)6
Que
bec
My
587
431.
61.
3615
536
600
0.06
(0.0
42,0
.079
)10
Bal
enge
noM
y19
17.3
1.1
1.7
9.8
300
0.03
(2
0.11
,0.2
4)A
llpu
rech
ryso
tile
0.06
2P
,0.
001
Pur
ech
ryso
tile
excl
udin
gm
ines
2.3
0.00
13P
ure
chry
sotil
eex
clud
ing
min
es0.
060
(0.0
43,0
.079
)0.
91

573Quantitative risks of mesothelioma and lung cancer
Fig. 3. Exposure-specific excess lung cancer mortality (RL) by cohort and fibre type groupings, showing 95% confidence intervals.Group means labelled in capitals. Confidence intervals not shown for groups with very significant heterogeneity.
cohorts, but both groupings now show very signifi-cant heterogeneity (P,0.001).
Among the mixed cohorts, two stand out with parti-cularly high values (Ontario and Albin). Both areasbestos cement cohorts, and both also had high lev-els of mesothelioma mortality. The values forRL forthese two cohorts are both more than six times thelevel of the next highest observation.
The heterogeneity among the mixed fibre cohortsis driven principally by three of them: Ontario,US/Canada Insulators and the Johns Manvilleretirees. Other reviewers (Doll and Peto, 1985;Hughes and Weill, 1986), have remarked on theunusually high risk estimate implied by the Ontariocohort and have suggested that the exposure estimatesfor this group may have been underestimated.Another potential contribution to the high risk of lungcancer in this cohort is exposure to silica: 8 out of26 workers with post mortem examinations showedsigns of silicosis (Finkelstein and Vingilis, 1984).There are clearly considerable uncertainties in theestimation of average exposures for the US/CanadaInsulators cohort, since this is averaged over a verylarge cohort with no doubt very variable exposureexperiences and over a long time period. The size ofthis group means that the value adopted for it willdetermine statistically the average risk in this group.The study of retirees from the Johns Manville asbes-tos products company is unusual in basing its esti-mates exclusively on follow-up of retired individuals
from the age of 65. There is no obvious theoreticalreason why this should produce a seriously biasedestimate of risk, though asbestos related mortality atages below 65 will be missed. This cohort has beenfollowed up almost to extinction, and if the impactof asbestos exposure on mortality eventually declinesafter the cessation of exposure, then cohorts with nearcomplete lifetime follow up will tend to show ratherlower excess mortalities than those where survivorsform a substantial proportion of the cohort. Inaddition, the Johns Manville cohort was one wherethe authors had not suggested a conversion factorfrom particles to fibres, and this review has used themost commonly used value of 3 f/ml=1 mppcf. If thisconversion implies higher exposure than in fact tookplace (the recent review by Lashet al. (1997), useda value of 1.4 borrowed from the New Orleanscohort), then the risk coefficient implied here wouldbe too low. If these three cohorts are excluded fromthe group the remaining eight are just statisticallyconsistent (P=0.056), and their joint mean is 0.32(95% CI 0.16–0.50).
The six chrysotile cohorts fall into two groups: thetwo Carolina cohorts give values around 6% perf/ml.yr; the other four, including the two minescohorts and dominated by the large Quebec cohort,are consistent with a jointRL estimate of 0.06% perf/ml.yr (95% CI 0.043–0.079). The Connecticut andNew Orleans (chrysotile only) cohorts give centralestimates ofRL substantially above this value, (0.80

574 J. T. Hodgson and A. Darnton
and 1.3 respectively) but both confidence intervals arevery wide. Even if the mines cohorts are excludedthere is still very clear statistical inconsistencybetween the Carolina results and those from Con-necticut and New Orleans (P=0.0013). The Carolinaresults are also out of line with the two other (mixedfibre) textile cohorts—Rochdale and Pennsylvania—whose 95% confidence intervals forRL have no over-lap with those for Carolina.
RISK ASSESSMENT AT MODERATE AND HIGHERCUMULATIVE EXPOSURES
MesotheliomaThe quantified risk for mesothelioma at the kinds
of cumulative exposure levels recorded in thereviewed cohorts—say, from 10 f/ml.yr upwards—presents a reasonably coherent picture, with values ofRM, in round figures, of 0.5, 0.1 and 0.001 (at most0.003) for crocidolite, amosite and chrysotile respect-ively (see Fig. 2).
Lung cancerIt is more difficult to come to a clear view of the
quantified risks of lung cancer, because of the incon-sistency of the results especially for the chrysotilecohorts (see Fig. 3). The amphibole estimates arereasonably consistent. In round figures the estimatesfall in the range 2–10% per f/ml.yr. The mean for thecrocidolite group is rather lower (4.2) than that forthe amosite group (5.2), though their confidence lim-its overlap substantially. The mean risk for all amphi-bole cohorts is 4.8% per f/ml.yr (95%CI 3.9–5.8), butwith some evidence of heterogeneity (P=0.027). If theSA amosite cohort data are set aside, the remainingdata are reasonably consistent (P=0.072), and themean estimate becomes 5.1 (95%CI 4.1–6.2). Inround figures, a value of 5% per f/ml.yr would rep-resent a reasonable risk estimate for both amphibolefibre types.
The pure chrysotile cohorts produce estimates ofRL spanning two orders of magnitude, from a valueof 6.7 for the Carolina women to 0.03 for Balengeromine. How should this very wide range ofRL esti-mates be interpreted? As far as evidence from ‘pure’exposure goes there are only two strongly informativecohorts: Quebec and Carolina. The differencesbetween these two has been studied and discussedextensively but, finally, inconclusively. The hypoth-esis that mineral oil used to suppress dust in the Caro-lina plant may have contributed to the lung cancerexcess has been addressed by an internal case-controlanalysis of this factor reported by Dementet al.(1994) and Dement (1991)). The most recent report(Dementet al., 1994), shows that the odds ratios fordifferent cumulative asbestos exposure categories areessentially unchanged by the addition of a variablerepresenting subjects’ typical level of exposure to
mineral oil (slight, moderate, high). The coefficientsfor these categories in the joint model were notreported, but were as follows, expressed as oddsratios relative to ‘slight’ exposure:
Mineral oil Odds ratio 95%exposure Confidence
intervalModerate 1.12 0.57–2.21High 1.47 0.8–2.75(Dement, personal communication)
Although these ORs are not statistically significant(and do not form a statistically significant trend),there is some suggestion that mineral oil may have arole in enhancing the asbestos effect, particularlysince all the effect of exposureduration is absorbedin the asbestos measure (workers were assigned tooil exposure categories according to the assessed oilexposure level at which they had spent the longestproportion of their employment in the plant). Earlyresults from this case control study showed a crosstabulation of cases and controls by asbestos exposureand mineral oil category (Dement, 1991), without for-mal modelling. Crude odds ratios on this data suggestthat the asbestos response is progressively steeperwith increasing mineral oil category. If mineral oildoes have an enhancing effect, the anomalousincrease in estimated exposure specific lung cancerrisk for men in the Rochdale cohort first exposed after1950 could be explained, since dust suppression usingmineral oil was introduced from that date (Petoet al.,1985). The regression slope estimate ofRL for themen first exposed after 1950 is 1.3 (95%CI 0.37–2.6),three times the value for men first exposed between1930 and 1950.
The plausible suggestion that the longer fibre usedin textile processes are responsible seems to be con-tradicted by the comparative analyses of lung fibreburdens in Quebec and Carolina cohorts reported bySebastien et al. (1989). They found that the pro-portionate distribution of fibres by length was verysimilar in Quebec and Carolina lungs. Nevertheless,the notion that the longer fibres used in textile pro-cesses do represent a higher risk, is consistent withexperimental evidence that longer fibres are more car-cinogenic (Meldrum, 1996; Stantonet al., 1981;Miller et al., 1999). Greenet al. (1997) have shownthat the mean length and aspect ratio of chrysotilefibres in the lungs of Carolina workers are greaterthan in a local population control series; and than inthe lungs of workers from the Albin cohort (Albinetal., 1990a,b).
Both studies on the lung content of Carolina work-ers have found amphibole (crocidolite or amosite)fibres in an appreciable proportion of them, though atmuch lower levels than for chrysotile and its associa-ted tremolite. Se´bastienet al. (1989 report that amphi-bole fibres at concentrations >0.1 f/µg (fibres >5microns long) were only found in the lungs of work-

575Quantitative risks of mesothelioma and lung cancer
ers hired before 1940, which conflicts with the periodof known use of crocidolite yarn (in very small quan-tities—see Appendix A) in the plant after 1950. Thisraises the possibility that some amphibole formed partof the exposure mix in this cohort in an early period.Greenet al. (1997) show that the levels of amphiboleare higher in Carolina workers than in local controls(2-fold difference in geometric mean,P=0.031) butmuch less strikingly than for chrysotile (5-fold,P,0.0001) or tremolite (14-fold,P,0.0001). Theyalso report that amphibole at levels >1.0 f/µg (all fibrelengths) were found in only one of the ten lung cancercases for whom this datum was available. This lastobservation limits the extent to which amphiboleexposure—perhaps unrecognised—might play a rolein this cohort. Whatever mechanism is in play doesnot appear to apply—to the same extent, at least—to the other two textile cohorts reviewed. As alreadypointed out, the Pennsylvania and Rochdale cohorts(with mixed fibre exposures) both give substantiallylower estimates ofRL.
If it is accepted that some such feature of the pro-cessing in the Carolina cohort has genuinely produceda much higher risk than seen in other chrysotilecohorts the question can be asked how typical thesefeatures are of the bulk of applications? Looked at inthe wider context of cohorts with mixed fibreexposure, theRL value for Carolina looks untypicallyhigh. Setting aside the possibility that amphibolepresents a higher risk of lung cancer, the observationsof RL from mixed fibre cohorts can be taken asinformative of theRL level for chrysotile. This sug-gests that in typical applications (including other tex-tile processes)RL for chrysotile is generally lowerthan the value derived from the Carolina cohort. ThemedianRL for the 16 cohorts with some chrysotileexposure is 0.5, compared to 4.5 for Carolina menand 6.7 for Carolina women. All but two of the mixedfibre cohorts give anRL estimate less than 1, and ofthe two exceptions one (Albin) has a confidence limitincluding zero, and the other (Ontario) shows featuressuggestive of significant exposure to crocidolite (seebelow, Fig. 4 and related text).
To the extent that amphibole fibres make a dispro-portionate contribution to the lung cancer risk in themixed exposure cohorts—and the evidence presentedhere suggests that they do—the typical risk of lungcancer from chrysotile exposure would be even lower.In most circumstances a value of 0.5% per f/ml.yrshould probably be regarded as an upper limit to thelung cancer risk from pure (commercial) chrysotile.The meanRL estimate for mixed fibre cohorts exclud-ing the three with particular interpretational difficult-ies is 0.32% per f/ml.yr with an upper 95% confi-dence limit of 0.50.
It should be noted that a value of 0.5% per f/ml.yris not as far out of line with the Carolina observationsas it might seem. The ‘cohort average’ risk estimatefrom this cohort (6.7 for women, 4.7 for men) prob-
Fig. 4. Comparison of excess mortality from pleural and perito-neal mesothelioma, showing fibre type.
ably overestimates the risk, which from internalanalysis is 1 for women and 3 for men (Dementetal., 1994, p. 439). The exposure response regressionson this cohort give an intercept close to zero excessrisk at zero dose, and there is thus no reason to sus-pect serious error in the reference rates (with conse-quential doubts about interpreting the slope). There isalso the possibility of inaccuracies in the conversionof particle counts to fibre counts. One early report onthis cohort (McDonaldet al., 1983a) suggested thatthe average conversion factor should be about 6 f/mlto 1 mppcf. If this were true, the risk per f/ml.yrwould be halved.
A ‘best estimate’ of the lung cancer risk would belower than 0.5% per f/ml.yr. Noting that the meanrisk of the mixed fibre cohorts (excluding the threementioned above) is 0.32% per f/ml.yr, and that theamphibole risk is over 10 times higher, it is possiblethat virtually all the observed risk could be explainedby rather less than 10% of amphibole in the mixedexposures. However there is no direct evidence onwhich an estimate of the risk of ‘pure’ chrysotilecould be based. Apart from the Balangero cohort, allthe chrysotile evidence considered here effectivelyrelates to Canadian chrysotile, since this was thedominant source of fibre for the other chrysotilecohorts. The risk of ‘commercial’ chrysotile as esti-mated from the mining cohorts is 0.06% per f/ml.yr.Given that the processing of chrysotile may producesome additional risk, the best estimate should be sethigher than the mines level, say at 0.1% per f/ml.yr.The overall risk, of a mixture of 96% chrysotile witha risk of 0.1, and 4% amphibole with a risk of 5.1would be 0.3% per f/ml.yr.
EXTRAPOLATION TO LOW EXPOSURES
All these cohort observations reflect the effect ofexposure to high levels of asbestos. The main interest

576 J. T. Hodgson and A. Darnton
in quantitative risk assessment in current conditionsis to apply this evidence to the estimation of the risksassociated with exposure levels 100–1000 timeslower. The standard assumption is that, other thingsbeing equal, the risk will be proportional to dose; butthis is more a cautious default assumption than any-thing more soundly based. To quote from the HEIreview: “The assumption of dose-linearity for low-dose assessment purposes is thus a widely acceptedand scientifically reasonable compromise rather thanan established scientific principle of carcinogenesis”.
However, if the true relationship between exposureand response was not linear, the impact on low doseextrapolations could be dramatic. There is some indi-cation in the present data suggesting a non-linearexposure response, particularly for peritoneal meso-thelioma, and the next sections examine this question.
Relationship of pleural and peritoneal mesotheliomaFigure 4 plots the percentage excess mortality from
peritoneal mesothelioma against that from pleuralmesothelioma. Cohorts with no mesothelioma casesof either kind are excluded. Cohorts with no perito-neal mesotheliomas are plotted on the peritoneal scaleon or close to the 0.01 ordinate. The positioning ofthe cohort points strongly suggests a pattern of twoalignments, one defined by the pure crocidolitecohorts, the other by the two pure amosite cohorts.Four mixed exposure cohorts lie very close to theamosite line: the US/Canada Insulators, New Orleansplant 1, the Johns Manville retirees and the Albincohorts. All but the last of these clearly had amositeas the main amphibole fibre. The point representingthe Ontario cohort lies very close to the crocidoliteline, suggesting perhaps that the anomalous resultsfrom this cohort may be explained by underestimatedexposure to crocidolite.
The position of the (male) Carolina cohort seemssomewhat anomalous. The single peritoneal meso-thelioma in this group is the only one in a cohortwithout material amphibole exposure, and the equal-ity between pleural and peritoneal numbers (one ofeach) is only otherwise seen in cohorts with muchhigher levels of mesothelioma (and substantial amphi-bole exposure). The possibility of unrecognisedamphibole exposure again suggests itself, but toomuch should not be read into this single peritonealcase. It is clear that the three fibre types produce dif-ferent mesothelioma responses overall. The questionof differential responses by mesothelioma site canreally only be addressed for the amphibole fibres.
This relationship does not depend on quantifiedexposure data, and if it is real it should be reproducedin other cohorts with predominant amphiboleexposure. The most informative cohorts will be thosewith crocidolite or amosite exposure, but not both.A Medline search identified eight such cohorts. Therelevant data are summarised in Table 3, and a plotof the percent excess mortalities from these cohorts
(and the pure fibre quantified cohorts) is shown inFig. 5.
There is still an apparent separation between cro-cidolite and amosite cohorts, though the segregationis now less clear cut (as might be expected given thesmall numbers often involved). There is, of courseconsiderable statistical uncertainty in both of thesevariables, and a simple regression (in which uncer-tainty about ‘x’ values is ignored) would be mislead-ing. Table 4 summarises the results of regressions inwhich the fit is optimised in both variables simul-taneously (fit being measured by deviance, assumingPoisson variation for the numbers of mesotheliomasat each site).
Fitting a single line through all the data producesa line with a slope (on the log–log scale) of 1.2, butthe overall fit is unsatisfactory (P,0.001). Allowingthe two fibres to have separate fits makes a very sig-nificant improvement to the fit (P,0.001), and bothfits have steeper slopes (2.3 for crocidolite and 3.1for amosite — not shown in table). These slopes arenot very precisely determined, and constraining themto be equal does not materially degrade the fit(P=0.75). The central estimate for this common slopeis 2.4.
This model provides a very close statistical fit toall but two of the cohorts. The two exceptions are thegas mask cohorts in Canada (McDonald and McDon-ald, 1978) and in Leyland (Achesonet al., 1982),which contribute 6.1 and 4.5 respectively to the totaldeviance. Possible reasons for these cohorts to beuntypical can be identified. The Leyland cohort wasnot ascertained from employment records, but fromoccupational details recorded on the wartime popu-lation register compiled in September 1939. If thenumbers directly involved with gas mask assemblyhave been over estimated the percentage excess mor-talities will be proportionately under estimated. If, forexample, only 2/3rds of the identified women werein fact exposed, the expected mortality denominatorwould fall to around 120, and the residual falls from6.1 to 4.3—still an outlier, but materially less extreme(P=0.038 instead of 0.014). The overall excess mor-tality from mesothelioma recorded in the Leylandcohort is much lower than in the Nottingham cohortengaged on the same process: 2.7% at Leyland and16.5% at Nottingham, again suggesting the possibilityof underestimation (eg by dilution of the exposedpopulation), perhaps substantial.
The assessment of mesothelioma in the Canadiangas mask cohort was particularly exhaustive, involv-ing review of pathological data for all cancer cases.Three of the six peritoneal cases were only identifiedafter this review. If the number of peritoneal meso-theliomas is reduced by three, the residual for thiscohort falls from 4.5 (P=0.034) to 2.0 (P=0.16).
However these are post-hoc rationalisations, and itis not clear whether it is better to remove thesecohorts from the model or not. Despite the large

577Quantitative risks of mesothelioma and lung cancer
Table 3. Additional data on pleural and peritoneal mesothelioma from cohorts with predominant exposure to crocidoliteor amosite (but not both), and without reported quantified cumulative exposures
Cohort Process Fibre Sex Expected all Pleural Peritonealcause
moralityNo. Reference No. % Excess No. % Excessmortality mortality
18 Joneset al. (1996) o f 400a 53 13 14 3.519 Achesonet al. (1982) Gas masks o f 185 3 1.6 2 1.1
(Leyland group)20 McDonald and oy mf 41a 3 7.3 6 14.6
McDonald (1978)21 Hilt et al. (1981) O o m 5b 1 20 1 2022 Levin et al. (1998) I a m 133.6 4 3 2 1.523 Parolariet al. (1987) I a mf 115.1 2 1.7 1 0.8724 Finkelstein (1989) I a m 1.89 2 10625 Achesonet al. (1984) I ay m 298.8 4 1.3 1 0.33
aEstimated as observed deaths less asbestos related deaths.bEstimated assuming 25% mortality from age 31 to 68.
Fig. 5. Joint distribution of excess mortality from pleural andperitoneal mesothelioma, showing fibre type. [Note: Label size(area) roughly proportion to total mesothelioma numbers in
each cohort].
residuals for these two cohorts, the overall residualdeviance for the inclusive data (model 2) indicates asatisfactory fit (P=0.22). If the two outliers areremoved, the separate fibre model fits the data almostexactly, and the slopes for the two fibres are verysimilar (model 3) and higher (around 3.2) than the2.4 for the fit including them. In either case the singleline model is rejected in favour of separate fits to thetwo fibre types, with similar slopes. The peritonealrate is proportional to at least the square—perhaps asmuch as the cube—of the pleural rate.
The form of the relationship is unusual and some-what surprising, since both outcomes reflect the effectof the same carcinogenic insult to the same type of
tissue. If true, it is presumably related to the dynamicscontrolling the distribution of asbestos fibres aroundthe body. Note that this relationship does not dependon the cumulative exposure, and is therefore not sub-ject to the uncertainties attached to exposure esti-mation. Whatever its physical/biological explanation,these observations imply that at least one of these out-comes has a non-linear relationship with exposure.
Pleural mesothelioma and cumulative exposureTo examine this question more closely, Fig. 6
shows a plot of excess mortality from pleural meso-thelioma against cumulative exposure with cohortsrepresented by their fibre type code. Figure 7 showsa similar plot for peritoneal mesothelioma. The pointsfor the pure amphibole cohorts show a clear patternof alignment, with the slopes for pleural mesotheli-oma less than 1 and those for peritoneal mesotheli-oma greater than 1.
Table 5 summarises the results of Poissonregression fits to the relationship between percentageexcess mortality from pleural cancer and cumulativeexposure, and the observed data points and selectedregression lines are shown in Fig. 6. The relationshipis modelled as linear on a log scale for each variable,and therefore has the formPpl = AplXr where Ppl isthe percent excess mortality from pleural cancer,Xis cumulative exposure andApl and r are regressionparameters. The corresponding predicted number ofpleural cancers for a given cohort isAplXrEAdj/100(whereEAdj is expected all cause deaths adjusted toan age at exposure of 30). The parameters were esti-mated by minimising the residual deviance betweenthe observed and predicted numbers of pleural cancerfor each (pure fibre) cohort.
It is clear that a wide range of slopes (r) are statisti-cally consistent with the data. With independent fitsto each fibre type the slopes are 0.62, 1.2 and 0.72for crocidolite, amosite and chrysotile respectively.

578 J. T. Hodgson and A. Darnton
Table 4. Joint Poisson regression (structure model) of relationship between pleural and peritoneal mesotheliomas(%peritoneal=A.%pleuralb)
Model A b Residual deviance Degrees of Pfreedom
1. All data 0.21 1.2 31.6 11 ,0.0012. By fibre, common slopeo 0.0089 2.4 12.0 6 0.06a 0.26 2.4 1.1 5 0.95Overall 13.1 10 0.223. Fit excluding Leyland and Canadian gasmask dataBy fibreo 0.00074 3.3 0.1 3 0.98a 0.17 3.1 1.0 4 0.91Overall 1.1 7 0.99
Fig. 6. Excess mortality from pleural mesothelioma againstcumulative exposure, showing fibre type. Regression lines fit-ted to pure fibre cohort. Bold lines indicate fits with slope con-strained to be common across fibre types, narrow lines are
unconstrained fits.
(The fit for amosite is of course completely determ-ined since there are only two observations.) The totalresidual deviance is 3.93. Moving to a model in whichthe three slopes are constrained to be equal, theresidual deviance increases marginally to 4.53, anincrease of 0.6 with a corresponding increase of 2degrees of freedom (df), clearly not a statistically sig-nificant change in overall fit (P=0.74), nor for anyindividual fibre type. The best fitting common slope is0.75. Using deviance differences to construct a 95%confidence limits for the common slope gives esti-mated upper and lower limits of 0.27 and 1.3.
Peritoneal mesothelioma and cumulative exposureFigure 7 and Table 6 show similar regression
analyses for peritoneal cancer. Again the crocidoliteand amosite points align themselves on two parallellines. The small numbers of observed events meansthat the statistical uncertainties are quite wide. There
Fig. 7. Excess mortality from peritoneal mesothelioma againstcumulative exposure, showing fibre type. Regression lines fit-ted to pure fibre cohorts. Bold lines indicate fits with slopeconstrained to be common across fibre types, narrow lines are
unconstrained fits (the slopes are identical for crocidolite).
is very little difference between the slopes (t) for thetwo fibres, and the best common slope is 2.1, witha deviance based 95% confidence interval from 1.2to 2.9.
The single peritoneal mesothelioma among theCarolina men, together with zero cases in the otherchrysotile cohorts generates a negative value oft. Ifa common slope is imposed over all three fibres thebest estimate is 1.6, but with significant heterogeneity(P=0.0025—data not shown). Only the amphibolecohorts have enough data to draw valid conclusionson peritoneal mesotheliomas.
The comparison of pleural and peritoneal slopesindependent of exposure levels suggested a ratio ofslopes between 2.4 and 3.2. If the ratio of the esti-
579Quantitative risks of mesothelioma and lung cancer
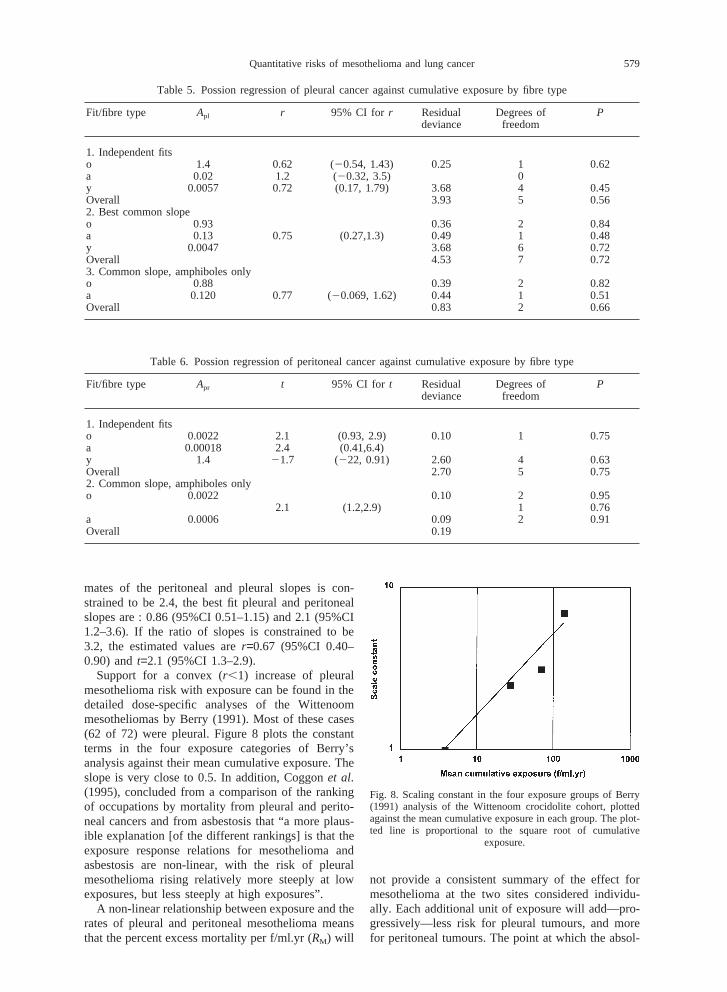
Table 5. Possion regression of pleural cancer against cumulative exposure by fibre type
Fit/fibre type Apl r 95% CI for r Residual Degrees of Pdeviance freedom
1. Independent fitso 1.4 0.62 (20.54, 1.43) 0.25 1 0.62a 0.02 1.2 (20.32, 3.5) 0y 0.0057 0.72 (0.17, 1.79) 3.68 4 0.45Overall 3.93 5 0.562. Best common slopeo 0.93 0.36 2 0.84a 0.13 0.75 (0.27,1.3) 0.49 1 0.48y 0.0047 3.68 6 0.72Overall 4.53 7 0.723. Common slope, amphiboles onlyo 0.88 0.39 2 0.82a 0.120 0.77 (20.069, 1.62) 0.44 1 0.51Overall 0.83 2 0.66
Table 6. Possion regression of peritoneal cancer against cumulative exposure by fibre type
Fit/fibre type Apr t 95% CI for t Residual Degrees of Pdeviance freedom
1. Independent fitso 0.0022 2.1 (0.93, 2.9) 0.10 1 0.75a 0.00018 2.4 (0.41,6.4)y 1.4 21.7 (222, 0.91) 2.60 4 0.63Overall 2.70 5 0.752. Common slope, amphiboles onlyo 0.0022 0.10 2 0.95
2.1 (1.2,2.9) 1 0.76a 0.0006 0.09 2 0.91Overall 0.19
mates of the peritoneal and pleural slopes is con-strained to be 2.4, the best fit pleural and peritonealslopes are : 0.86 (95%CI 0.51–1.15) and 2.1 (95%CI1.2–3.6). If the ratio of slopes is constrained to be3.2, the estimated values arer=0.67 (95%CI 0.40–0.90) andt=2.1 (95%CI 1.3–2.9).
Support for a convex (r,1) increase of pleuralmesothelioma risk with exposure can be found in thedetailed dose-specific analyses of the Wittenoommesotheliomas by Berry (1991). Most of these cases(62 of 72) were pleural. Figure 8 plots the constantterms in the four exposure categories of Berry’sanalysis against their mean cumulative exposure. Theslope is very close to 0.5. In addition, Coggonet al.(1995), concluded from a comparison of the rankingof occupations by mortality from pleural and perito-neal cancers and from asbestosis that “a more plaus-ible explanation [of the different rankings] is that theexposure response relations for mesothelioma andasbestosis are non-linear, with the risk of pleuralmesothelioma rising relatively more steeply at lowexposures, but less steeply at high exposures”.
A non-linear relationship between exposure and therates of pleural and peritoneal mesothelioma meansthat the percent excess mortality per f/ml.yr (RM) will
Fig. 8. Scaling constant in the four exposure groups of Berry(1991) analysis of the Wittenoom crocidolite cohort, plottedagainst the mean cumulative exposure in each group. The plot-ted line is proportional to the square root of cumulative
exposure.
not provide a consistent summary of the effect formesothelioma at the two sites considered individu-ally. Each additional unit of exposure will add—pro-gressively—less risk for pleural tumours, and morefor peritoneal tumours. The point at which the absol-

580 J. T. Hodgson and A. Darnton
Fig. 9. Percent excess lung cancer by cumulative exposure, showing fibre type, with regression lines fitted to pure fibre cohorts(A: combined amphibole data, (1) slope free, (2) slope fixed=1; Y: chrysotile data, (1) all data, slope free (2) excl. Carolina,
slope free, (3) excl. Carolina, slope fixed=1).
ute risks for tumours at the two sites are predicted tobe equal is around 90f/ml.yr for crocidolite, around55f/ml.yr for amosite. Below these values pleuraltumours are more common, and at higher levels per-itoneal tumours dominate. It happens that across thescale of cumulative exposure values in the reviewedcohorts (from about 10 to nearly 1000 f/ml.yr), therelationship between exposure and total mesotheli-oma risk is not far from linear, so the summary indexRM does provide a reasonable index of the overallmesothelioma risk over this range.
Lung cancerIf pleural and peritoneal mesothelioma have a non-
linear relationship with asbestos exposure, the ques-tion arises as to whether the relationship for lung can-cer is linear. Figure 9 shows a plot of percent excesslung cancer against cumulative exposure and Table7 summarises regression results for lung cancer by
Table 7. Poisson regression of lung cancer against cumulative exposure by fibre type
Fit/fibre type AL r 95% CI for r Residual Degrees Pdeviance of
freedom
Combined amphibole0.49 1.6 (1.1, 2.1) 2.35 3 0.50
%excluding Massachusetts and SA amosite:1.1 1.4 (0.89, 2.0) 0.83 1 0.36
Chrysotile%excluding Carolina 195 20.27 (20.44, 20.07) 19.8 4 ,0.00127.5 0.030 (20.26, 1.1) 0.91 2 0.63
cumulative exposure. There is no significant differ-ence between the regressions for crocidolite andamosite points, so these are treated together. Using allthe data, independent fits for amphibole fibres givesa concave relationship (r=1.6), and for chrysotile anegative slope (r=20.25). These are clearly inconsist-ent with each other, and both depart very significantlyfrom linearity (P,0.001).
The negative slope for chrysotile depends entirelyon the Carolina data, and if this is removed the slopeis just positive (r=0.039) with a CI that just includes1. Clearly the data for chrysotile-only cohorts do notprovide a coherent basis for direct estimation of theexposure–response slope, and some appeal to the evi-dence provided by cohorts with mixed exposure isnecessary (as in the discussion of Table 2 and Fig. 3).
The concave slope for amphibole cohorts is largelydependant on the two extreme points, the Massachu-setts and SA amosite cohorts. The lung cancer excessin the SA amosite cohort is quite small and statisti-

581Quantitative risks of mesothelioma and lung cancer
cally unstable, and the exposure estimate for the Mas-sachusetts cohort is based on fairly slender evidence.If these two cohorts are removed the best fit slopebecomes 1.4, with a confidence interval thatincludes 1.
The Massachusetts cohort with its very high levelsof excess mortality, and as cohort with the highestestimated mean exposure to crocidolite, has animportant—though not determining—impact on theestimates. It is unfortunate that the exposure estimatesare somewhat speculative (see Appendix B). At thesame time it should be noted that in relation to a priorexpectation of a linear dose response the effects ofthis observation on the pleural and lung cancer esti-mates are opposite: the pleural slope is flattened andthe lung slope is steepened. This does not of courseprove that the exposure estimate is correct, but if itis materially in error then either the pleural or thelung slope is even further from linear than suggestedby the present analyses.
DEVELOPMENT OF NON-LINEAR RISK ESTIMATES
MesotheliomaThe data in Tables 5 and 6 and Figs. 6 and 7 sug-
gest the following model with separate componentsfor pleural and peritoneal tumours:
PM = AplXr + AprXt
wherePM is the percent excess mortality,r and t arethe pleural and peritoneal slopes of the exposureresponse on a log–log scale,Apl andApr are constantsof proportionality for the pleural and peritonealelements of the risk respectively, andX is cumulativeexposure in f/ml.yr.
If the information about the ratio ofr and t fromthe non-quantified cohorts is ignored, the best fitvalues using all the data arer=0.75 andt=2.1. With-out the chrysotile data, the estimate ofr is essentiallythe same (0.77). Analysis of the ratiot/r including thenon-quantified cohorts (Table 4) indicates values forthis ratio around 2.4 with all the data, around 3.2excluding the two outlying cohorts. If a simultaneousfit is made to the full data with the ratio of pleuraland peritoneal slopes fixed at 2.4, the resulting esti-mates (using only the amphibole data) arer=0.86 andt=2.1. If the ratio of slopes is constrained to be 3.2,the estimated values arer=0.67 andt=2.1.
There is little to choose between values ofr from0.67 to 0.86. We will use a slope of 0.75 as our bestestimate forr. The estimates fort are less variable,and in any case have no bearing on risk estimates atlow levels. We will taket=2.1 as the best estimate.
How wide a margin of uncertainty should beallowed on these slopes? On purely statistical criteria,values of r between 0.4 and 1.2 could be chosen.However a slope as low as 0.4 seems unlikely onphysical grounds. Berry’s analysis of Wittenoom data
using individual doses implies a slope of about 0.5,but the uncertainties of individual dose assignmentare likely to have biased this estimate downwards.The argument above suggests that the lower end ofrange should be set at 0.67 or lower. We will take0.6 to represent the lower end of the plausible sloperange.
There are quite stronga priori reasons for using aslope of 1. It is the value that all previous risk esti-mations have used, and represents a natural assump-tion (effect is proportional to cause) in the absenceof evidence to the contrary. A linear relationship isalso (in most models) consistent with the data. Wetherefore taker=1 as the upper end of the slope range.Different slopes imply different best fit values forApl
and Apr. These estimates and their 95% confidenceintervals for the three fibre types are shown inTable 8.
Effects of exposure duration and age at first exposureThis formulation does not take duration of
exposure or age at first exposure into account. TheHEI (and similar) risk models (see Appendix A)imply that for equivalent cumulative exposures, shortexposure times produce larger risks than longexposure times, (in other words 10 f/ml for 1 yr isworse than 1 f/ml for 10 yr); and that exposure atyounger ages will produce higher excess mortalityrates. All the amphibole cohorts considered here hadshort exposures (averaging about 2 yr). The suggestedrisk model for amphiboles is therefore appropriate forshort exposures, but will overstate the risk fromextended exposure periods. The chrysotile coef-ficients are effectively determined by the Quebeccohort, where the average exposure durations werequite long (averaging about 10 yr). A given cumulat-ive exposure accrued over 2 yr (starting at age 30)produces about 40% more deaths as the sameexposure accrued over 10 yr. For general risk assess-ment purposes, where short exposures are more likelyto be at issue, the chrysotile coefficient should beincreased by a factor of 1.4. Reductions in theexposure accrual time below 2 yr have very littleimpact on the risk.
The risk estimates summarised above apply toexposure starting at age 30. Table 9 shows adjustmentfactors derived from the HEI model to convert riskestimates for an age at exposure of 30 to otherexposure ages.
Predicted effects at very long follow upIt can reasonably be questioned whether a given
asbestos exposure will continue to generate a constantexcess mesothelioma mortality beyond 40 or 50 yrfollow up. The evidence from cohorts with long fol-low up is that the incidence eventually falls. In thePaterson cohort a significant fall is seen for followup beyond 35 yr. In the US/Canada insulators there

582 J. T. Hodgson and A. Darnton
Table 8. Estimated coefficientsa with 95% confidence intervals for constants in the risk prediction equation forPM atthree levels of the slope coefficientr
Slope/Fibre Apl 95% CI Apr 95% CI
Best estimate slope (r=0.75, t=2.1)Crocidolite 0.94a (0.71,1.2) 0.0022 (0.0011,0.0039)Amosite 0.13b (0.060,0.25) 0.0006 (0.00025,0.0012)
Chrysotile 0.0047a (0.0030,0.0069)High slope (r=1, t=2.5)
Crocidolite 0.43 (0.33b,0.54) 0.00053 (0.00029,0.00087)Amosite 0.052 (0.022b,0.099) 0.00012 (0.000049,0.00024)
Chrysotile 0.000970 (0.00064b,0.0014)Low slope (r=0.6, t=1.7)
Crocidolite 1.5 (1.1,1.9c) 0.0083 (0.0043,0.014)Amosite 0.24 (0.11,0.44c) 0.003 (0.0013,0.0058)
Chrysotile 0.012 (0.0078,0.018c)
aCoefficients used for risk extrapolation at low doses shown in bold:abest estimate,blowest arguable,chighest arguable (see Table 11). Numbers of peritoneal mesotheliomas at low doses arenegligible. For short exposure, chrysotile coefficients should be multiplied by 1.4.
Table 9. Adjustment factors to convert estimates of meso-thelioma mortality due to asbestos exposure starting at age
30 to other exposure start ages
Age 20 25 35 40Factor 2.1 1.5 0.6 0.4
Table 10. Estimated coefficients with 95% confidenceintervals for constants in the risk prediction equation for
PL for chosen levels of the slope coefficientr
Fibre/model AL 95% CI
AmphiboleLinear (r-1) 4.8 –a
Best (r=1.3) 1.6 (1.2, 1.9)Steepest 0.49 (0.37,0.62)(r=1.6)
Chrysotileb
Best (r=1.3) 0.028 –b
Cautious model-max of:Linear (r=1) 0.5 –b
Steepest 0.039 –b
(r=1.6)
aA linear model is not strictly statistically consistent withthe observed data. The line withAL=4.8 is the single best fit.bNon-statistical uncertainties dominate choice of chrysotilemodels, 95% confidence intervals cannot be properly calcu-lated. See text for discussion.
is a fall beyond 50 yr. Qualitatively it seems clearthat the risk does not increase indefinitely, but thereis insufficient evidence on very long follow up to fixthe risk profile in this period. A rough and ready wayof limiting the predicted risk at very long follow upperiods is to truncate the predictions at some age. TheDoll and Peto and HEI reports both truncated theirpredictions at age 80, and we will follow this conven-tion. It is likely that this would still overstate the riskfrom exposure at ages below 20, and truncation ofthe predicted effect at 60 yr follow up might thenbe appropriate.
Lung cancerThe data in Table 7 and Fig. 9 suggest that the
relation between lung cancer and cumulativeexposure may be concave—i.e. that the excess lungcancer risk is proportional to a power greater than 1of cumulative exposure. Statistically the range ofpowers consistent with all the amphibole data is from1.1 to 2.1. Without the two extreme cohorts the rangebecomes 0.89–2.0 with a central estimate of 1.4. Noprevious analysis of the epidemiological data has sug-gested a concave relationship, though experimentaldata for a wide range of carcinogens (Hoel and Port-ier, 1995) suggest they may be quite common. Acrossthe range of exposures in a single study, and giventhe uncertainties in individual exposure estimation, amoderate degree of non-linearity will be difficult todetect.
The reasonably arguable values forr fall in theinterval 1 to 2: a degree on conservatism and somedoubts about the two extreme cohorts lead us to preferthe lower end of this interval. We will taker=1 (alinear relationship) andr=1.6 to represent the flattestand steepest slopes for risk assessment, and the midpoint of this range (r=1.3) as our best estimateassumption.
The estimates and 95% confidence limits for theconstant term AL in a model for lung cancerPL = ALXr with r=1 (linear) 1.3, and 1.6 based onamphibole data are shown in Table 10. As alreadydiscussed, the inconsistencies in the pure chrysotiledata rule out a direct estimate of the exposure–response slope based on this data. The dominantuncertainties for chrysotile are the reasons for theobserved differences in exposure-specific lung cancerrisk, rather than the statistical uncertainties in estimat-ing this risk level. This uncertainty is already reflectedin the five-fold difference between our ‘best’ and‘cautious’ estimates ofRL (0.1 and 0.5 respectively).In the absence of a better approach we will assume

583Quantitative risks of mesothelioma and lung cancer
the same range of possible slopes for the chrysotilelung cancer relationship as for the amphiboles, anddetermine the scaling constant by fixing the predictedexcess mortality at the median exposure for chrysotilecohorts (70 f/ml.yr) to 0.1% for the best estimate and0.5% for the cautious estimate. The resulting valuesare shown in Table 10.
The pattern of excess lung cancer—broadly con-stant relative excess from 10 to 40 (perhaps more)years from exposure (see Appendix A) implies thatfor exposure starts between 20 and 40 yr of age thereis very little difference in the predicted risk. Theremay be some decline for very long follow up, but therate of decline is unknown. As for mesothelioma weaddress this possibility approximately by truncatingthe predicted excess at age 80.
IS THERE A THRESHOLD?
Another question with important implications forrisk at low levels of exposure is whether there is athreshold for cancer initiation by asbestos. The HSE’srecentReview of fibre toxicology(Meldrum, 1996),presents arguments mainly on a toxicological basisfor believing that there may be a threshold for asbes-tos induced lung cancer. The argument is essentiallybased on a view of the carcinogenic process inducedby asbestos as being an extension of the chronicinflammatory processes producing fibrosis. It iswidely agreed that heavy doses of chrysotile arerequired to produce lung fibrosis. And some evidencehas been derived from the New Orleans cohort sug-gesting a threshold dose of about 30 f/ml.yr for radio-logical fibrosis (Weill, 1994). Analysis of necropsymaterial from the Carolina cohort also shows a dis-tinct step increase in fibrosis score for cumulativeexposures around 20–30 f/ml.yr (Greenet al., 1997).This does not apply to amphibole exposure: radiologi-cal fibrosis which progressed after the cessation ofexposure has been documented (Sluis-Cremer, 1991),in South African amphibole miners under medicalsurveillance and with cumulative doses less than 5f/ml.yr. This suggests that if a threshold applies to thelung cancer effect of amphibole asbestos, it is verylow. The adoption of a slightly concave exposureresponse slope entails a moderately threshold-likebehaviour.
Several lines of argument also suggest that anythreshold for mesothelioma is at a very low level.Some cohorts (Neuberger and Kundi, 1990; New-house and Sullivan, 1989; McDonald and McDonald,1978; Thomaset al., 1982; Rossiter and Coles, 1980),have produced mesotheliomas in conditions where noexcess lung cancer was seen. Occupational PMRs forBritish men suggest that the range of jobs for whichmesothelioma rates are above background levels isvery wide (Hutchingset al., 1995; Hodgsonet al.,1997). Also the proportion of mesothelioma cases inpopulation studies for whom no likely source of
asbestos exposure can be identified is often quitehigh. All these observations suggest that relativelybrief exposures may carry a low, but non-zero, riskof causing mesothelioma.
Some authors (Ilgren and Browne, 1991; Liddell,1993) have argued for a mesothelioma threshold, orthreshold-like behaviour of the dose–response. Sucharguments are fraught with statistical and logical dif-ficulties. The attempt (Ilgren and Browne, 1991) todeduce a ‘threshold’ by identifying the lowest esti-mated dose received by any observed case is a logicalnonsense. Furthermore, the existence of zero cases ina dose category (human or animal) should not beautomatically interpeted as zero risk. Direct statisticalconfirmation of a threshold from human data is vir-tually impossible. One would need accurate assess-ment of very low doses across a large population withlong term follow up. Case-control studies with lungcontent measures of exposure (McDonaldet al.,1989; Rodelspergeret al., 1999; Rogerset al., 1991)do not suggest any threshold, or downward inflexionof the dose response at the lower end of theirexposure scales. Some of the animal data cited byIlgren and Browne are suggestive of a threshold—particularly that from intra-pleural and intra-perito-neal injection—but it is not clear how this wouldtranslate into a estimated human effect threshold forexposure by inhalation. Taking this evidence togetherwe do not believe there is a good case for assumingany threshold for mesothelioma risk.
QUANTIFIED RISK ASSESSMENT
Under current conditions, the main interest in thehealth risks of asbestos relates to exposure circum-stances well outside the range for which we havedirect observations. The statements we can makeabout risk therefore incorporate two kinds of uncer-tainty. First there is the usual statistical uncertaintyof inferring underlying risk from observations inparticular groups. This kind of uncertainty dependsessentially on the number of events (in this case can-cer deaths) observed. The uncertainty can therefore—given some assumptions—be quantified: the moreobserved events, the less the statistical uncertainty.Statistical uncertainty is expressed as a confidenceinterval (a range of values with—conventionally—a95% probability of covering the true value).
The second kind of uncertainty relates to the ques-tion whether the relationship between exposure andoutcome seen in the observed range continues to holdoutside that range. This kind of uncertainty cannot bequantified statistically. Qualitatively one can reason-ably argue that the agreement will be better forexposures close to the observed range, but withincreasing distance from the observed range our con-fidence that we know what to expect decreases. Forexample, previous assessments of cancer risk fromasbestos have all assumed that the effect is linear.

584 J. T. Hodgson and A. Darnton
This review has presented evidence suggesting thatthis may not be the case. Uncertainty about the slopesof exposure–response lines has an increasing impactwith increasing distance from the observed range.Also the strength of qualitative arguments such asthose advanced in the HSE review (Meldrum, 1996),in favour of a threshold for the lung cancer effectincrease as exposure falls.
All the above implies that simply to present a tableof risk estimates—or even risk ranges—for differentcumulative exposures cannot capture the changingbalance of the different kinds of uncertainty. Table11 gives a verbal assessment of risk at a range ofrepresentative cumulative exposures. No estimateshave been given for lifetime risks lower than 1 in100 000, and this level is referred to as ‘insignificant’.A lifetime risk of 1 in 100 000 corresponds to anannual risk well below 1 in a million, which HSE hassuggested (Health and Safety Executive, 1999) as a“guideline for the boundary between the broadlyacceptable and tolerable regions [of fatal risk to anindividual].” It is also well below the level at whichit is suggested that mesothelioma would occur in theabsence of asbestos exposure: a clear majority of thevery few mesotheliomas that would occur at this levelwould not be caused by asbestos.
Mesothelioma risks in the observed cohorts havebeen expressed as a percentage (PM) of total expectedmortality in order to standardise observations fromdifferent follow up configurations. To make predic-tions of risk this measure must be converted back intoabsolute terms, and this is done using the averagemale life table discussed in Appendix A. Forexposures starting at age 30 the excess mortality esti-mate PM is applied to the total expected mortalityfrom age 40 to age 79 (allowing a 10 yr minimumlatency, and truncating risk at age 80). The life tablepredicts that about 70% of survivors to age 30 willdie between the ages of 40 and 80. Absolute risk esti-mates can therefore be derived from thePM value fora given exposure by multiplying by a factor of 0.7.Lung cancer risks have been expressed as a percent-age excess of expected lung cancer mortality. Themajor determinant of this underlying lung cancer riskis smoking—especially cigarette smoking—and thenumber of asbestos-related lung cancers will be affec-ted by the prevalence of smoking in the exposedpopulation. Currently (in 1997) about 9.5% of maledeaths between the ages of 40 and 79 are due to lungcancer. For women the figure is 7%, reflecting differ-ences in past smoking. Total survival to age 80 islower in men than in women, and combining data forsurvival and proportionate mortality from lung cancerit can be predicted that for 1000 30-yr-old men 54will die of lung cancer between the ages of 40 and79. For women the number is 28. Thus for a popu-lation with the past smoking habits of British menaged 60+ (the ages at which most lung cancers occur),the lung cancer risk from asbestos exposure is given
by 0.054PL. For women with typical past smokinghabits the figure would be 0.028PL.
Table 11 makes statements about the lifetime risksof exposures accumulated over short (up to 5 yr) per-iods from age 30. The factors given in Table 10 canbe used to apply the mesothelioma estimates to otherages at exposure. The lung cancer estimates are basedon 1997 male lung cancer rates. They are not sensi-tive to age at exposure.
For the lung cancer risk due to chrysotile two prin-cipal figures are given: a best estimate and a cautiousestimate. A risk estimate derived from the Carolinacohort is also given, with the qualification that thismight be arguable in ‘exceptional circumstances’.These exceptional circumstances cannot be definedwith any certainty since the features of exposure atthis plant responsible for the very high lung cancerrisks there are not known. Exposure to textile grade(i.e. long fibre) chrysotile is presumably necessary,but does not seem to be sufficient, since other textileplants have recorded much lower exposure-specificrisk (even with additional exposure to amphibolefibre). The spraying of the raw fibre with mineral oil(as a dust suppression measure) has been suggestedas a possible explanation. This hypothesis seems tobe supported by a case-control study of lung cancersat Carolina (though the relevant results have not beenfully reported), and by observations from anotherasbestos textile plant (Rochdale), where men firstemployed after oil spraying was introduced had threetimes the exposure-specific risk of those firstemployed in earlier periods (though still lower thanthe Carolina risk).
The main uncertainties in this picture relate to theeffects of chrysotile, particularly at low doses. Theapplication of these estimates in the assessment of aparticular risk situation will depend on the purposesof that particular assessment, and the extent to whicha precautionary approach is appropriate.
DISCUSSION
There have been a number of papers (Cullen, 1998;Stayneret al., 1996; Nicholson and Landrigan, 1996;Smith and Wright, 1996), in the literature recentlywhich directly or indirectly consider whether thereare differences in potency between the fibre types ascauses of mesothelioma and lung cancer. The claimthat there are important differences is often describedas ‘the amphibole hypothesis’. In its strongest formthis has been said to claim that pure chrysotile (i.e.without any associated tremolite fibre) would presentlittle or no carcinogenic risk. At the other extreme, ithas been argued (Smith and Wright, 1996), that thereis virtually no difference between the risks presentedby the different fibre types. Most commentators (e.g.Doll and Peto, 1985; Hughes and Weill, 1986; HealthEffects Institute, 1991) have considered that theamphibole fibre types are more dangerous, parti-
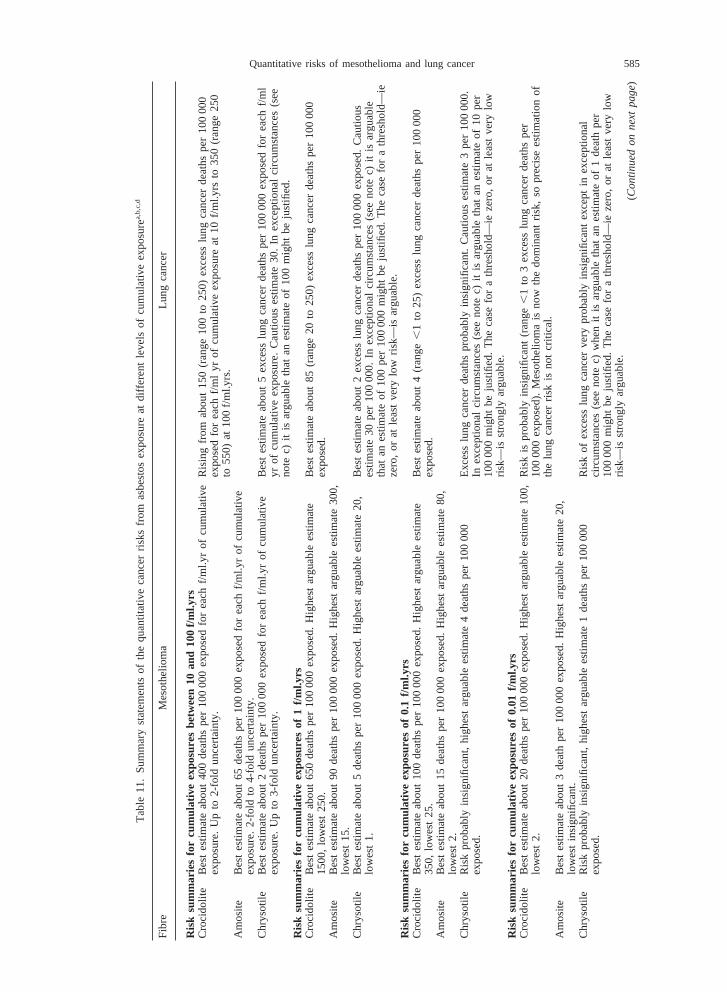
585Quantitative risks of mesothelioma and lung cancer
Tab
le11
.S
umm
ary
stat
emen
tsof
the
quan
titat
ive
canc
erris
ksfr
omas
best
osex
posu
reat
diffe
rent
leve
lsof
cum
ulat
ive
expo
sure
a,b
,c,d
Fib
reM
esot
helio
ma
Lung
canc
er
Ris
ksu
mm
arie
sfo
rcu
mul
ativ
eex
posu
res
betw
een
10an
d10
0f/m
l.yrs
Cro
cido
lite
Bes
tes
timat
eab
out
400
deat
hspe
r10
000
0ex
pose
dfo
rea
chf/m
l.yr
ofcu
mul
ativ
eR
isin
gfr
omab
out
150
(ran
ge10
0to
250)
exce
sslu
ngca
nce
rde
aths
per
100
000
expo
sure
.U
pto
2-fo
ldun
cert
aint
y.ex
pose
dfo
rea
chf/m
lyr
ofcu
mul
ativ
eex
posu
reat
10f/m
l.yrs
to35
0(r
ange
250
to55
0)at
100
f/ml.y
rs.
Am
osite
Bes
tes
timat
eab
out
65de
aths
per
100
000
expo
sed
for
each
f/ml.y
rof
cum
ulat
ive
expo
sure
.2-
fold
to4-
fold
unce
rtai
nty.
Chr
ysot
ileB
est
estim
ate
abou
t2
deat
hspe
r10
000
0ex
pose
dfo
rea
chf/m
l.yr
ofcu
mul
ativ
eB
est
estim
ate
abou
t5
exce
sslu
ngca
ncer
deat
hspe
r10
000
0ex
pose
dfo
rea
chf/m
lex
posu
re.
Up
to3-
fold
unce
rtai
nty.
yrof
cum
ulat
ive
expo
sure
.C
autio
uses
timat
e30
.In
exce
ptio
nal
circ
umst
ance
s(s
eeno
tec)
itis
argu
able
that
anes
timat
eof
100
mig
htbe
just
ified
.R
isk
sum
mar
ies
for
cum
ulat
ive
expo
sure
sof
1f/m
l.yrs
Cro
cido
lite
Bes
tes
timat
eab
out
650
deat
hspe
r10
000
0ex
pose
d.H
ighe
star
guab
lees
timat
eB
est
estim
ate
abou
t85
(ran
ge20
to25
0)ex
cess
lung
canc
erd
eath
spe
r10
000
015
00,
low
est
250.
expo
sed.
Am
osite
Bes
tes
timat
eab
out
90de
aths
per
100
000
expo
sed.
Hig
hest
argu
able
estim
ate
300,
low
est
15.
Chr
ysot
ileB
est
estim
ate
abou
t5
deat
hspe
r10
000
0ex
pose
d.H
ighe
star
guab
lees
timat
e20
,B
est
estim
ate
abou
t2
exce
sslu
ngca
ncer
deat
hspe
r10
000
0e
xpos
ed.
Cau
tious
low
est
1.es
timat
e30
per
100
000.
Inex
cept
iona
lci
rcum
stan
ces
(see
note
c)it
isar
guab
leth
atan
estim
ate
of10
0pe
r10
000
0m
ight
beju
stifi
ed.
The
case
for
ath
resh
old—
ieze
ro,
orat
leas
tve
rylo
wris
k—is
argu
able
.R
isk
sum
mar
ies
for
cum
ulat
ive
expo
sure
sof
0.1
f/ml.y
rsC
roci
dolit
eB
est
estim
ate
abou
t10
0de
aths
per
100
000
expo
sed.
Hig
hest
argu
able
estim
ate
Bes
tes
timat
eab
out
4(r
ange
,1
to25
)ex
cess
lung
canc
erde
aths
per
100
000
350,
low
est
25.
expo
sed.
Am
osite
Bes
tes
timat
eab
out
15de
aths
per
100
000
expo
sed.
Hig
hest
argu
able
estim
ate
80,
low
est
2.C
hrys
otile
Ris
kpr
obab
lyin
sign
ifica
nt,
high
est
argu
able
estim
ate
4de
aths
per
100
000
Exc
ess
lung
canc
erde
aths
prob
ably
insi
gnifi
cant
.C
autio
uses
timat
e3
per
100
000.
expo
sed.
Inex
cept
iona
lci
rcum
stan
ces
(see
note
c)it
isar
guab
leth
atan
estim
ate
of10
per
100
000
mig
htbe
just
ified
.T
heca
sefo
ra
thre
shol
d—ie
zero
,or
atle
ast
very
low
risk—
isst
rong
lyar
guab
le.
Ris
ksu
mm
arie
sfo
rcu
mul
ativ
eex
posu
res
of0.
01f/m
l.yrs
Cro
cido
lite
Bes
tes
timat
eab
out
20de
aths
per
100
000
expo
sed.
Hig
hest
argu
able
estim
ate
100,
Ris
kis
prob
ably
insi
gnifi
cant
(ran
ge,
1to
3ex
cess
lung
canc
erde
aths
per
low
est
2.10
000
0ex
pose
d).
Mes
othe
liom
ais
now
the
dom
inan
tris
k,so
prec
ise
estim
atio
nof
the
lung
canc
erris
kis
not
criti
cal.
Am
osite
Bes
tes
timat
eab
out
3de
ath
per
100
000
expo
sed.
Hig
hest
argu
able
estim
ate
20,
low
est
insi
gnifi
cant
.C
hrys
otile
Ris
kpr
obab
lyin
sign
ifica
nt,
high
est
argu
able
estim
ate
1de
aths
per
100
000
Ris
kof
exce
sslu
ngca
ncer
very
prob
ably
insi
gnifi
cant
exce
pti
nex
cept
iona
lex
pose
d.ci
rcum
stan
ces
(see
note
c)w
hen
itis
argu
able
that
anes
timat
eof
1de
ath
per
100
000
mig
htbe
just
ified
.T
heca
sefo
ra
thre
shol
d—ie
zero
,or
atle
ast
very
low
risk—
isst
rong
lyar
guab
le.
(Co
ntin
ue
do
nn
ext
pa
ge)
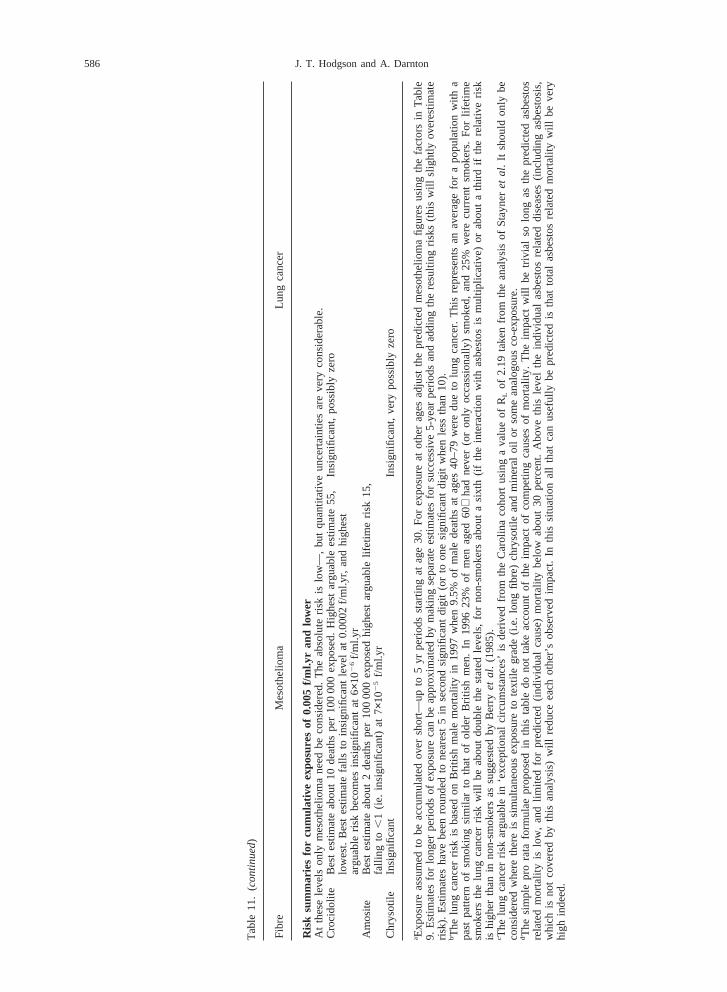
586 J. T. Hodgson and A. Darnton
Tab
le11
.(co
ntin
ue
d)
Fib
reM
esot
helio
ma
Lung
canc
er
Ris
ksu
mm
arie
sfo
rcu
mul
ativ
eex
posu
res
of0.
005
f/ml.y
ran
dlo
wer
At
thes
ele
vels
only
mes
othe
liom
ane
edbe
cons
ider
ed.
The
abso
lute
risk
islo
w—
,bu
tqu
antit
ativ
eun
cert
aint
ies
are
very
cons
ider
able
.C
roci
dolit
eB
est
estim
ate
abou
t10
deat
hspe
r10
000
0ex
pose
d.H
ighe
star
guab
lees
timat
e55
,In
sign
ifica
nt,
poss
ibly
zero
low
est.
Bes
tes
timat
efa
llsto
insi
gnifi
cant
leve
lat
0.00
02f/m
l.yr,
and
high
est
argu
able
risk
beco
mes
insi
gnifi
cant
at6
×102
6f/m
l.yr
Am
osite
Bes
tes
timat
eab
out
2de
aths
per
100
000
expo
sed
high
est
argu
able
lifet
ime
risk
15,
falli
ngto
,1
(ie.
insi
gnifi
cant
)at
7×10²
5f/m
l.yr
Chr
ysot
ileIn
sign
ifica
ntIn
sign
ifica
nt,
very
poss
ibly
zero
a Exp
osur
eas
sum
edto
beac
cum
ulat
edov
ersh
ort—
upto
5yr
perio
dsst
artin
gat
age
30.
For
expo
sure
atot
her
ages
adju
stth
epr
edic
ted
mes
othe
liom
afig
ure
sus
ing
the
fact
ors
inT
able
9.E
stim
ates
for
long
erpe
riods
ofex
posu
reca
nbe
appr
oxim
ated
bym
akin
gse
para
tees
timat
esfo
rsu
cces
sive
5-ye
arpe
riods
and
addi
ngth
ere
sulti
ngr
isks
(thi
sw
illsl
ight
lyov
eres
timat
eris
k).
Est
imat
esha
vebe
enro
unde
dto
near
est
5in
seco
ndsi
gnifi
cant
digi
t(o
rto
one
sign
ifica
ntdi
git
whe
nle
ssth
an10
).bT
helu
ngca
ncer
risk
isba
sed
onB
ritis
hm
ale
mor
talit
yin
1997
whe
n9.
5%of
mal
ede
aths
atag
es40
–79
wer
edu
eto
lung
canc
er.
Thi
sre
pres
ents
anav
erag
ef
ora
popu
latio
nw
itha
past
patte
rnof
smok
ing
sim
ilar
toth
atof
olde
rB
ritis
hm
en.
In19
9623
%of
men
aged
60+
had
neve
r(o
ron
lyoc
cass
iona
lly)
smok
ed,
and
25%
wer
ecu
rren
tsm
oker
s.F
orlif
etim
esm
oker
sth
elu
ngca
ncer
risk
will
beab
out
doub
leth
est
ated
leve
ls,
for
non-
smok
ers
abou
ta
sixt
h(if
the
inte
ract
ion
with
asbe
stos
ism
ultip
licat
ive
)or
abou
ta
third
ifth
ere
lativ
eris
kis
high
erth
anin
non-
smok
ers
assu
gges
ted
byB
erry
et
al.
(198
5).
c The
lung
canc
erris
kar
guab
lein
‘exc
eptio
nal
circ
umst
ance
s’is
deriv
edfr
omth
eC
arol
ina
coho
rtus
ing
ava
lue
ofR
Lof
2.19
take
nfr
omth
ean
alys
isof
Sta
yneret
al.
Itsh
ould
only
beco
nsid
ered
whe
reth
ere
issi
mul
tane
ous
expo
sure
tote
xtile
grad
e(i.
e.lo
ngfib
re)
chry
sotil
ean
dm
iner
aloi
lor
som
ean
alog
ous
co-e
xpos
ure.
dT
hesi
mpl
epr
ora
tafo
rmul
aepr
opos
edin
this
tabl
edo
not
take
acco
unt
ofth
eim
pact
ofco
mpe
ting
caus
esof
mor
talit
y.T
heim
pact
will
betr
ivia
lso
long
asth
epr
edic
ted
asbe
stos
rela
ted
mor
talit
yis
low
,an
dlim
ited
for
pred
icte
d(in
divi
dual
caus
e)m
orta
lity
belo
wab
out
30pe
rcen
t.A
bove
this
leve
lth
ein
divi
dual
asbe
stos
rela
ted
dise
ases
(incl
udin
gas
best
osis
,w
hich
isno
tco
vere
dby
this
anal
ysis
)w
illre
duce
each
othe
r’sob
serv
edim
pact
.In
this
situ
atio
nal
lth
atca
nus
eful
lybe
pred
icte
dis
that
tota
las
best
osre
late
dm
orta
lity
will
beve
ryhi
ghin
deed
.

587Quantitative risks of mesothelioma and lung cancer
cularly for mesothelioma, but some (Cullen, 1998;Stayneret al., 1996) have regarded the extent of thesedifferences as unimportant, particularly since chryso-tile has been overwhelmingly the most commonlyused fibre.
The interpretation of the whole body of evidencedepends importantly on the interpretation of resultsfrom cohorts with predominantly chrysotile exposuretogether with a minority contribution—usually a fewper cent—from amphiboles. As long as the differencein potency is not extreme these cohorts can be reason-ably interpreted as indicating the risk of chrysotileexposure. But if the differences in potency are verysubstantial this is no longer the case. Furthermore,in this situation an additional source of error in theestimation of exposure will be introduced, since themeasured exposure (mainly of chrysotile) will oftenbe a poor proxy for the relevant exposure.
The data in this review suggest that order of magni-tude differences in potency may indeed apply formesothelioma, and probably also for lung cancer. Themain reason this review differs from earlier similarreviews is in its use of the information from theamphibole mining cohorts in South Africa and Aus-tralia. The publication of mortality results from theSouth African mines seems to have gone almostunnoticed. The Australian cohort has been the subjectof a series of publications with varying analyticalapproaches and varying results. One of these analysesgave a lung cancer risk from the cohort of around 1%per fibre/ml.yr, and this is the value that has beenmost usually quoted, but this is probably an underesti-mate due to incomplete follow up at older ages. Thisreview is also the only one to have exploited the(admittedly uncertain) quantitative exposure infor-mation in the Massachusetts cohort.
Implications of the non-linear exposure response formesothelioma
A non-linear relationship between the rates of pleu-ral and peritoneal mesothelioma is more readilyexplicable if the cancer risk is proportional to somefunction of the concentration of fibres in the targettissue, rather than the simple number burden.
If concentration rather than number burden is therelevant parameter, then the possibility of a thresholdtype relationship becomes much more plausible, sinceif the effect depends on fibres acting together, theremust presumably be some point at which individualfibres are simply too far apart to exert any joint effect.Of course, if the mechanisms of distribution of fibreswithin the lung and pleura are such that fibres tendto be delivered preferentially to particular areas—andthere is evidence that this is the case in the pleura(Boutin et al., 1996)—the effective threshold levelmay be very low. In any case such a threshold isunlikely to be a sharp cut-off. Random variations inthe distribution of fibres in particular lungs, and dif-
ferences in individual susceptibility will mean that theexposure response curve simply starts to descendmore steeply from some point on the cumulativeexposure scale.
Also, fibre concentration is the more plausibleexposure metric for the production of fibrosis, so thisinterpretation is consistent with the link suggested bythe HSE fibre review (and by other authors) betweenthe two processes. It should be noted that the sugges-tion is not that tumours arise directly from fibrosis,but that both are products of an underlying inflamma-tory process.
If fibre concentration in tissue is the key risk meas-ure, the extreme sensitivity in animal experiments tointra-peritoneal and intra-tracheal instillation of mass-ive fibre doses is also readily explicable.
Combined with the knowledge of the much greatersolubility of chrysotile in the lung, this may alsoexplain why asbestos related diseases have only beenclearly seen with heavy chrysotile exposures. Ifexposures are heavy and sustained a sufficient con-centration of fibre in the lung may be maintained totrigger both fibrosis and malignancy. The extreme rar-ity of peritoneal mesothelioma in cohorts exposed tochrysotile alone may also be explained. If the routeby which asbestos reaches the peritoneum is from thepleural cavity, it may well be that chrysotile fibres donot survive long enough in body tissues to make thejourney in sufficient numbers.
Chrysotile and asbestos related malignancySmith and Wright (1996), showed a ranking of 25
cohort studies by proportional mortality from pleuralmesothelioma and argued that since chrysotile wasthe primary exposure for two of the top 10 cohortsand present as part of the mix in six of them, and thatthe picture for crocidolite in terms of its presence inthe mix was similar, while amosite was less evidentthan either of the other two fibre types, that chrysotilemust therefore be similarly potent as a cause of pleu-ral mesothelioma. What this argument ignores is anyquantification of exposure. Without quantification itis very difficult to draw any conclusion about relativerisk from a simple ranking by mesothelioma rate. Inrelation to the 25 cohorts identified in this review anequally pertinent observation might be that all ofthem involved exposure to one or other of the amphi-bole fibres. Smith and Wright also present argumentsbased on the relative levels of mortality from pleuralmesothelioma and from excess lung cancer to suggestthat there is only moderate difference between thepotency of chrysotile and the amphibole fibres forcausing mesothelioma—they suggest a factor of threeor four. However this argument is based on theassumption that all fibre types are equally potent forlung cancer. If this review is correct in suggestingthat this is not the case, these arguments are not valid.
Nicholson and Landrigan (1996), present similar

588 J. T. Hodgson and A. Darnton
arguments based on the assumed equivalence of thefibre types to cause lung cancer. They also show ananalysis of the mesothelioma mortality of a small sub-set of the US insulators study which shows that thepattern of deaths over time implies that members ofthis cohort were exposed to a pleural carcinogenbefore 1935. Since, reportedly, amosite was first usedfrom around 1935, and prior to this date only chryso-tile was used, some of these deaths must have beendue to chrysotile. The authors do not mention thepossible role of crocidolite, but if we accept that noamphibole fibre was used before 1935 by US insu-lation workers, these observations do show that someof the cases in this cohort must have been caused byexposure to chrysotile prior to 1935. These exposureswill often have been heavy. In fact the contemporaryUS trade journal ‘Asbestos’ (published monthly fromJuly 1919) makes it clear that both amosite and cro-cidolite were used in the US through the 1920s,though probably in limited quantities, since the USindustry seems to have been resistant to their use ontechnical grounds, and chrysotile was the fibre ofchoice for most applications.
Stayneret al.’s review of the issues (1996), setsout similar arguments, and also points to the evidencethat all three commercial fibre types have produceda similar level of lung tumours in animal inhalationexperiments. This is the most problematic evidenceto reconcile with the human evidence that amphibolefibres are substantially more potent lung carcinogens.However, the time periods needed to induce cancerin humans (yr) and in rats (months) are very different,and it is at least plausible that all fibres are equallypotent in rats because none of them are materiallycleared from the rat lung over the months needed toinitiate a rat lung tumour. By contrast, in humanschrysotile (cleared in months) might have less effectthan the amphibole fibres (cleared in years). Adetailed elaboration of this argument has recentlybeen published by Berry (1999). It may also be rel-evant that the animal experiments were made withexposure concentrations massively in excess of thoserepresented in the human data. The differences in thehuman data summarised in this review seem reason-ably clear (certainly in respect of mesothelioma), andare based on a range of independent data. In the end,if a choice has to be made between animal and humanevidence as a basis for assessing human risk, adequatehuman data must be given priority.
Many of the arguments presented against the‘amphibole hypothesis’ in connection with mesotheli-oma are variants on the basic theme that it is simplyunbelievable that such a small component of theexposure could be responsible for the observed risk.If it is true that the mesothelioma risk is proportionalto a less than unit power of exposure, then these argu-ments are correct in their basic perception that a dis-proportionate effect of the amphibole component was
required to explain the data. Low levels of amphiboledo have a disproportionate effect.
REFERENCES
Acheson, E. D., Gardner, M. J., Pippard, E. C. and Grime, L.P. (1982) Mortality of two groups of women who manufac-tured gas masks from chrysotile and crocidolite asbestos: a40-year follow-up.British Journal of Industrial Medicine39,344–348.
Acheson, E. D., Gardiner, M. J., Winter, P. D. and Bennett, C.(1984) Cancer in a factory using amosite asbestos.Inter-national Journal of Epidemiology13, 3–10.
Albin, M., Jacobson, K., Attawell, R., Johannson, L. and Wel-linder, H. (1990a) Mortality and cancer morbidity in cohortsof asbestos cement workers and referents.British Journal ofIndustrial Medicine47, 602–610.
Albin, M., Johansson, L., Pooley, F. D., Jakobsson, K., Attaw-ell, R. and Mitha, R. (1990b) Mineral fibres, fibrosis andasbestos products in the lungs from deceased asbestoscement workers.British Journal of Industrial Medicine47,747–774.
Armstrong, B. K., de Klerk, N. H., Musk, A. W. and Hobbs,M. S. T. (1989) Cancer mortality in relation to measures ofoccupational exposure to crocidolite at Wittenoom Gorge inWestern Australia.British Journal of Industrial Medicine46,529–536.
Berry G. (1991) Prediction of mesothelioma, lung cancer, andasbestosis in former Wittenoom asbestos workers. BritishJournal of Industrial Medicine.48, 793–802.
Berry, G. (1995) Environmental mesothelioma incidence, timesince exposure to asbestos and level of exposure.Environmetrics6, 221–228.
Berry, G. (1999) Models for mesothelioma incidence followingexposure to fibres in terms of timing and duration ofexposure and the biopersistence of the fibres.InhalationToxicology11, 101–120.
Berry, G. and Newhouse, M. L. (1983) Mortality of workersmanufacturing friction materials using asbestos.BritishJournal of Industrial Medicine40, 1–7.
Berry, G., Newhouse, M. L. and Antonis, P. (1985) Combinedeffect of asbestos and smoking on mortality from lung cancerand mesothelioma in factory workers.British Journal ofIndustrial Medicine42, 12–18.
Boutin, C., Dumortier, F., Rey, F., Viallat, R. and DeVuyst, P.(1996) Black spots concentrate oncogenic asbestos fibres inthe parietal pleura-thorascopic and mineralogical study.American Journal of Respiratory and Critical Care Medicine153, 444–449.
Coggon, D., Inskip, H., Winter, P. and Pannett, B. (1995) Dif-ferences in occupational mortality from pleural cancer, per-itoneal cancer and asbestosis.Occupational and Environ-mental Medicine52, 775–777.
Cullen, M. R. (1998) Chrysotile asbestos: enough is enough.Lancet351, 1377–1378.
de Klerk, N. H., Musk, W. A., Armstrong, B. K. and Hobbs,M. S. T. (1991) Smoking, exposure to crocidolite, and theincidence of lung cancer and asbestosis.British Journal ofIndustrial Medicine48, 412–417.
de Klerk, N. H., Musk, A. W. and Armstrong, B. K. (1992) Theepidemiology of asbestos and mesothelioma. InMalignantMesothelioma, eds D. W. Henderson, K. B. Shilkin, S. L.Langlois and D. Whitaker, pp. 223–250. Hemisphere Pub-lishing Corp, New York.
de Klerk, N. H., Musk, A. W., Armstrong, B. K. and Hobbs,M. S. T. (1994) Diseases in miners and millers of crocidolitefrom Wittenoom, Western Australia: a further follow-up toDecember 1986.Annals of Occupational Hygiene38(supp1), 647–655.
Dement, J. M. (1991) Carcinogenicity of chrysotile asbestos:
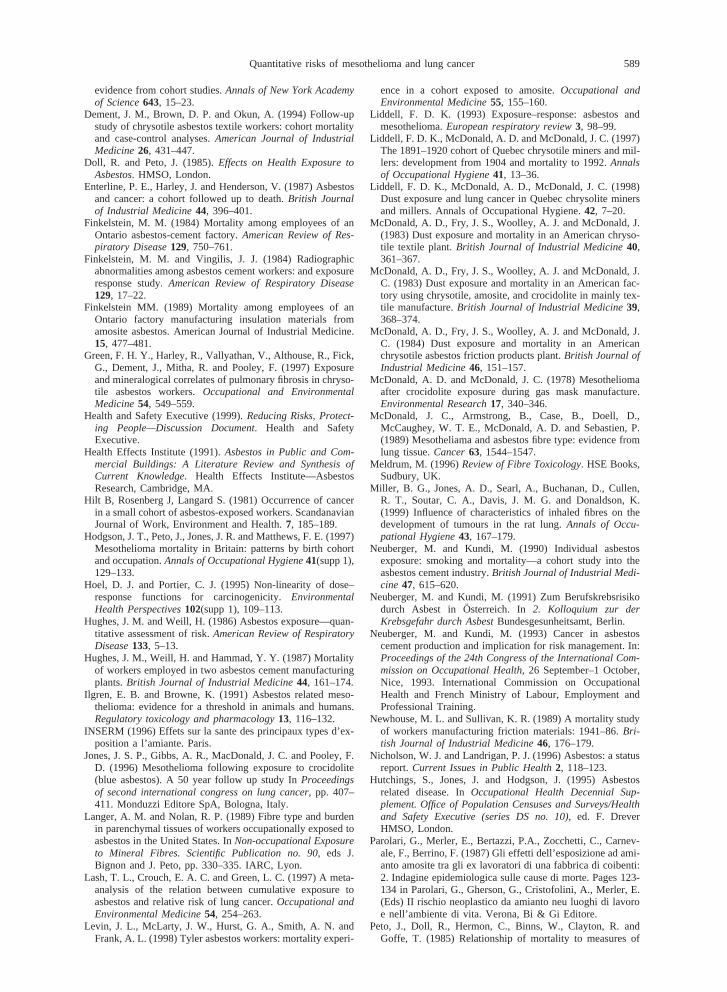
589Quantitative risks of mesothelioma and lung cancer
evidence from cohort studies.Annals of New York Academyof Science643, 15–23.
Dement, J. M., Brown, D. P. and Okun, A. (1994) Follow-upstudy of chrysotile asbestos textile workers: cohort mortalityand case-control analyses.American Journal of IndustrialMedicine26, 431–447.
Doll, R. and Peto, J. (1985).Effects on Health Exposure toAsbestos. HMSO, London.
Enterline, P. E., Harley, J. and Henderson, V. (1987) Asbestosand cancer: a cohort followed up to death.British Journalof Industrial Medicine44, 396–401.
Finkelstein, M. M. (1984) Mortality among employees of anOntario asbestos-cement factory.American Review of Res-piratory Disease129, 750–761.
Finkelstein, M. M. and Vingilis, J. J. (1984) Radiographicabnormalities among asbestos cement workers: and exposureresponse study.American Review of Respiratory Disease129, 17–22.
Finkelstein MM. (1989) Mortality among employees of anOntario factory manufacturing insulation materials fromamosite asbestos. American Journal of Industrial Medicine.15, 477–481.
Green, F. H. Y., Harley, R., Vallyathan, V., Althouse, R., Fick,G., Dement, J., Mitha, R. and Pooley, F. (1997) Exposureand mineralogical correlates of pulmonary fibrosis in chryso-tile asbestos workers.Occupational and EnvironmentalMedicine54, 549–559.
Health and Safety Executive (1999).Reducing Risks, Protect-ing People—Discussion Document. Health and SafetyExecutive.
Health Effects Institute (1991).Asbestos in Public and Com-mercial Buildings: A Literature Review and Synthesis ofCurrent Knowledge. Health Effects Institute—AsbestosResearch, Cambridge, MA.
Hilt B, Rosenberg J, Langard S. (1981) Occurrence of cancerin a small cohort of asbestos-exposed workers. ScandanavianJournal of Work, Environment and Health.7, 185–189.
Hodgson, J. T., Peto, J., Jones, J. R. and Matthews, F. E. (1997)Mesothelioma mortality in Britain: patterns by birth cohortand occupation.Annals of Occupational Hygiene41(supp 1),129–133.
Hoel, D. J. and Portier, C. J. (1995) Non-linearity of dose–response functions for carcinogenicity.EnvironmentalHealth Perspectives102(supp 1), 109–113.
Hughes, J. M. and Weill, H. (1986) Asbestos exposure—quan-titative assessment of risk.American Review of RespiratoryDisease133, 5–13.
Hughes, J. M., Weill, H. and Hammad, Y. Y. (1987) Mortalityof workers employed in two asbestos cement manufacturingplants.British Journal of Industrial Medicine44, 161–174.
Ilgren, E. B. and Browne, K. (1991) Asbestos related meso-thelioma: evidence for a threshold in animals and humans.Regulatory toxicology and pharmacology13, 116–132.
INSERM (1996) Effets sur la sante des principaux types d’ex-position a l’amiante. Paris.
Jones, J. S. P., Gibbs, A. R., MacDonald, J. C. and Pooley, F.D. (1996) Mesothelioma following exposure to crocidolite(blue asbestos). A 50 year follow up study InProceedingsof second international congress on lung cancer, pp. 407–411. Monduzzi Editore SpA, Bologna, Italy.
Langer, A. M. and Nolan, R. P. (1989) Fibre type and burdenin parenchymal tissues of workers occupationally exposed toasbestos in the United States. InNon-occupational Exposureto Mineral Fibres. Scientific Publication no. 90, eds J.Bignon and J. Peto, pp. 330–335. IARC, Lyon.
Lash, T. L., Crouch, E. A. C. and Green, L. C. (1997) A meta-analysis of the relation between cumulative exposure toasbestos and relative risk of lung cancer.Occupational andEnvironmental Medicine54, 254–263.
Levin, J. L., McLarty, J. W., Hurst, G. A., Smith, A. N. andFrank, A. L. (1998) Tyler asbestos workers: mortality experi-
ence in a cohort exposed to amosite.Occupational andEnvironmental Medicine55, 155–160.
Liddell, F. D. K. (1993) Exposure–response: asbestos andmesothelioma.European respiratory review3, 98–99.
Liddell, F. D. K., McDonald, A. D. and McDonald, J. C. (1997)The 1891–1920 cohort of Quebec chrysotile miners and mil-lers: development from 1904 and mortality to 1992.Annalsof Occupational Hygiene41, 13–36.
Liddell, F. D. K., McDonald, A. D., McDonald, J. C. (1998)Dust exposure and lung cancer in Quebec chrysolite minersand millers. Annals of Occupational Hygiene.42, 7–20.
McDonald, A. D., Fry, J. S., Woolley, A. J. and McDonald, J.(1983) Dust exposure and mortality in an American chryso-tile textile plant.British Journal of Industrial Medicine40,361–367.
McDonald, A. D., Fry, J. S., Woolley, A. J. and McDonald, J.C. (1983) Dust exposure and mortality in an American fac-tory using chrysotile, amosite, and crocidolite in mainly tex-tile manufacture.British Journal of Industrial Medicine39,368–374.
McDonald, A. D., Fry, J. S., Woolley, A. J. and McDonald, J.C. (1984) Dust exposure and mortality in an Americanchrysotile asbestos friction products plant.British Journal ofIndustrial Medicine46, 151–157.
McDonald, A. D. and McDonald, J. C. (1978) Mesotheliomaafter crocidolite exposure during gas mask manufacture.Environmental Research17, 340–346.
McDonald, J. C., Armstrong, B., Case, B., Doell, D.,McCaughey, W. T. E., McDonald, A. D. and Sebastien, P.(1989) Mesotheliama and asbestos fibre type: evidence fromlung tissue.Cancer63, 1544–1547.
Meldrum, M. (1996)Review of Fibre Toxicology. HSE Books,Sudbury, UK.
Miller, B. G., Jones, A. D., Searl, A., Buchanan, D., Cullen,R. T., Soutar, C. A., Davis, J. M. G. and Donaldson, K.(1999) Influence of characteristics of inhaled fibres on thedevelopment of tumours in the rat lung.Annals of Occu-pational Hygiene43, 167–179.
Neuberger, M. and Kundi, M. (1990) Individual asbestosexposure: smoking and mortality—a cohort study into theasbestos cement industry.British Journal of Industrial Medi-cine 47, 615–620.
Neuberger, M. and Kundi, M. (1991) Zum Berufskrebsrisikodurch Asbest in O¨ sterreich. In 2. Kolloquium zur derKrebsgefahr durch AsbestBundesgesunheitsamt, Berlin.
Neuberger, M. and Kundi, M. (1993) Cancer in asbestoscement production and implication for risk management. In:Proceedings of the 24th Congress of the International Com-mission on Occupational Health, 26 September–1 October,Nice, 1993. International Commission on OccupationalHealth and French Ministry of Labour, Employment andProfessional Training.
Newhouse, M. L. and Sullivan, K. R. (1989) A mortality studyof workers manufacturing friction materials: 1941–86.Bri-tish Journal of Industrial Medicine46, 176–179.
Nicholson, W. J. and Landrigan, P. J. (1996) Asbestos: a statusreport.Current Issues in Public Health2, 118–123.
Hutchings, S., Jones, J. and Hodgson, J. (1995) Asbestosrelated disease. InOccupational Health Decennial Sup-plement. Office of Population Censuses and Surveys/Healthand Safety Executive (series DS no. 10), ed. F. DreverHMSO, London.
Parolari, G., Merler, E., Bertazzi, P.A., Zocchetti, C., Carnev-ale, F., Berrino, F. (1987) Gli effetti dell’esposizione ad ami-anto amosite tra gli ex lavoratori di una fabbrica di coibenti:2. Indagine epidemiologica sulle cause di morte. Pages 123-134 in Parolari, G., Gherson, G., Cristofolini, A., Merler, E.(Eds) II rischio neoplastico da amianto neu luoghi di lavoroe nell’ambiente di vita. Verona, Bi & Gi Editore.
Peto, J., Doll, R., Hermon, C., Binns, W., Clayton, R. andGoffe, T. (1985) Relationship of mortality to measures of
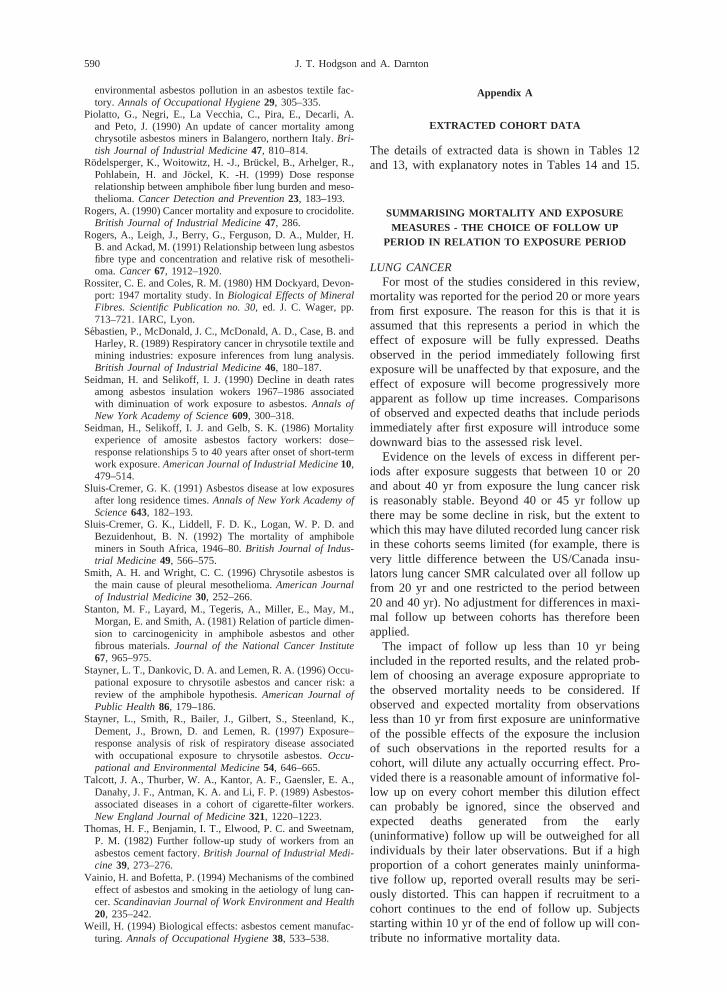
590 J. T. Hodgson and A. Darnton
environmental asbestos pollution in an asbestos textile fac-tory. Annals of Occupational Hygiene29, 305–335.
Piolatto, G., Negri, E., La Vecchia, C., Pira, E., Decarli, A.and Peto, J. (1990) An update of cancer mortality amongchrysotile asbestos miners in Balangero, northern Italy.Bri-tish Journal of Industrial Medicine47, 810–814.
Rodelsperger, K., Woitowitz, H. -J., Bru¨ckel, B., Arhelger, R.,Pohlabein, H. and Jo¨ckel, K. -H. (1999) Dose responserelationship between amphibole fiber lung burden and meso-thelioma.Cancer Detection and Prevention23, 183–193.
Rogers, A. (1990) Cancer mortality and exposure to crocidolite.British Journal of Industrial Medicine47, 286.
Rogers, A., Leigh, J., Berry, G., Ferguson, D. A., Mulder, H.B. and Ackad, M. (1991) Relationship between lung asbestosfibre type and concentration and relative risk of mesotheli-oma.Cancer67, 1912–1920.
Rossiter, C. E. and Coles, R. M. (1980) HM Dockyard, Devon-port: 1947 mortality study. InBiological Effects of MineralFibres. Scientific Publication no. 30, ed. J. C. Wager, pp.713–721. IARC, Lyon.
Sebastien, P., McDonald, J. C., McDonald, A. D., Case, B. andHarley, R. (1989) Respiratory cancer in chrysotile textile andmining industries: exposure inferences from lung analysis.British Journal of Industrial Medicine46, 180–187.
Seidman, H. and Selikoff, I. J. (1990) Decline in death ratesamong asbestos insulation wokers 1967–1986 associatedwith diminuation of work exposure to asbestos.Annals ofNew York Academy of Science609, 300–318.
Seidman, H., Selikoff, I. J. and Gelb, S. K. (1986) Mortalityexperience of amosite asbestos factory workers: dose–response relationships 5 to 40 years after onset of short-termwork exposure.American Journal of IndustriaI Medicine10,479–514.
Sluis-Cremer, G. K. (1991) Asbestos disease at low exposuresafter long residence times.Annals of New York Academy ofScience643, 182–193.
Sluis-Cremer, G. K., Liddell, F. D. K., Logan, W. P. D. andBezuidenhout, B. N. (1992) The mortality of amphiboleminers in South Africa, 1946–80.British Journal of Indus-trial Medicine 49, 566–575.
Smith, A. H. and Wright, C. C. (1996) Chrysotile asbestos isthe main cause of pleural mesothelioma.American Journalof Industrial Medicine30, 252–266.
Stanton, M. F., Layard, M., Tegeris, A., Miller, E., May, M.,Morgan, E. and Smith, A. (1981) Relation of particle dimen-sion to carcinogenicity in amphibole asbestos and otherfibrous materials.Journal of the National Cancer Institute67, 965–975.
Stayner, L. T., Dankovic, D. A. and Lemen, R. A. (1996) Occu-pational exposure to chrysotile asbestos and cancer risk: areview of the amphibole hypothesis.American Journal ofPublic Health86, 179–186.
Stayner, L., Smith, R., Bailer, J., Gilbert, S., Steenland, K.,Dement, J., Brown, D. and Lemen, R. (1997) Exposure–response analysis of risk of respiratory disease associatedwith occupational exposure to chrysotile asbestos.Occu-pational and Environmental Medicine54, 646–665.
Talcott, J. A., Thurber, W. A., Kantor, A. F., Gaensler, E. A.,Danahy, J. F., Antman, K. A. and Li, F. P. (1989) Asbestos-associated diseases in a cohort of cigarette-filter workers.New England Journal of Medicine321, 1220–1223.
Thomas, H. F., Benjamin, I. T., Elwood, P. C. and Sweetnam,P. M. (1982) Further follow-up study of workers from anasbestos cement factory.British Journal of Industrial Medi-cine 39, 273–276.
Vainio, H. and Bofetta, P. (1994) Mechanisms of the combinedeffect of asbestos and smoking in the aetiology of lung can-cer.Scandinavian Journal of Work Environment and Health20, 235–242.
Weill, H. (1994) Biological effects: asbestos cement manufac-turing. Annals of Occupational Hygiene38, 533–538.
Appendix A
EXTRACTED COHORT DATA
The details of extracted data is shown in Tables 12and 13, with explanatory notes in Tables 14 and 15.
SUMMARISING MORTALITY AND EXPOSUREMEASURES - THE CHOICE OF FOLLOW UP
PERIOD IN RELATION TO EXPOSURE PERIOD
LUNG CANCERFor most of the studies considered in this review,
mortality was reported for the period 20 or more yearsfrom first exposure. The reason for this is that it isassumed that this represents a period in which theeffect of exposure will be fully expressed. Deathsobserved in the period immediately following firstexposure will be unaffected by that exposure, and theeffect of exposure will become progressively moreapparent as follow up time increases. Comparisonsof observed and expected deaths that include periodsimmediately after first exposure will introduce somedownward bias to the assessed risk level.
Evidence on the levels of excess in different per-iods after exposure suggests that between 10 or 20and about 40 yr from exposure the lung cancer riskis reasonably stable. Beyond 40 or 45 yr follow upthere may be some decline in risk, but the extent towhich this may have diluted recorded lung cancer riskin these cohorts seems limited (for example, there isvery little difference between the US/Canada insu-lators lung cancer SMR calculated over all follow upfrom 20 yr and one restricted to the period between20 and 40 yr). No adjustment for differences in maxi-mal follow up between cohorts has therefore beenapplied.
The impact of follow up less than 10 yr beingincluded in the reported results, and the related prob-lem of choosing an average exposure appropriate tothe observed mortality needs to be considered. Ifobserved and expected mortality from observationsless than 10 yr from first exposure are uninformativeof the possible effects of the exposure the inclusionof such observations in the reported results for acohort, will dilute any actually occurring effect. Pro-vided there is a reasonable amount of informative fol-low up on every cohort member this dilution effectcan probably be ignored, since the observed andexpected deaths generated from the early(uninformative) follow up will be outweighed for allindividuals by their later observations. But if a highproportion of a cohort generates mainly uninforma-tive follow up, reported overall results may be seri-ously distorted. This can happen if recruitment to acohort continues to the end of follow up. Subjectsstarting within 10 yr of the end of follow up will con-tribute no informative mortality data.

591Quantitative risks of mesothelioma and lung cancer
Tab
le12
.S
umm
ary
ofco
hort
data
(par
t1)
a
Coh
ort
iden
tifica
tion
Pro
cess
Fib
reS
exA
vera
geT
ypic
alP
redi
cted
mor
talit
yN
umbe
rD
eath
sby
all
caus
esM
esot
helio
ma
age
atfo
llow
for
typi
cal
follo
wup
ofye
ars
deat
hsfir
stup
bfr
omav
g.ag
efir
stla
tenc
yex
posu
reex
pose
dc
Cod
eN
ame
Ref
eren
ceP
ropo
rtio
nR
elat
ive
Obs
Exp
SM
RT
otal
%E
xces
sto
age
atnu
mbe
rm
orta
lity
first
expo
sure
of30
1W
itten
oom
deK
lerk
et
al.
(199
4)M
om
2935
0.24
1.08
1071
960
1.8*
1.19
72*
122m
Car
olin
aD
emen
teta
l.(1
994)
Ty*
m26
410.
321.
3415
607
410.
11.
482
0.49
(men
)2f
Car
olin
aT
y*f
2641
0.32
1.34
1536
229
9.2
1.21
00
(wom
en)
3Jo
hns
Ent
erlin
eet
al.
(198
7)I
yao
m37
651
1ag
e>65
944
762.
51.
248
1M
anvi
llere
tiree
s4
Ont
ario
Fin
kels
tein
(198
4)C
yom
3327
0.17
0.77
2010
862
.21.
7317
275a
New
Orle
ans
Hug
heset
al.
(198
7)C
ya*
m32
350.
30.
8520
259
294.
50.
881
0.34
(pla
nt1)
5oN
ewO
rlean
sC
yom
2738
0.27
1.26
2060
361
4.1
0.98
30.
49(p
lant
2)6
Que
bec
Lidd
elle
ta
l.(1
997)
My
m23
721
1ag
e>55
6587
5912
.7*
1.11
33*
0.56
7V
ockl
abru
ckN
eube
rger
and
Kun
diC
yom
f24
650.
951.
0520
540
530.
2*–
50.
94(1
990)
8U
S/C
anad
aS
eidm
anan
dS
elik
off
Lya
o*m
2462
0.9
1.09
2046
2631
70.6
1.46
453
14in
sula
tors
(199
0)9
Roc
hdal
eP
etoe
ta
l.(1
985)
Tyo
*m
3042
0.45
120
727
602.
5*1.
2110
1.7
10B
alan
gero
Pio
latto
et
al.
(199
0)M
ym
2747
0.51
1.2
2031
722
5.4
1.41
20.
8911
Pen
nsyl
vani
aM
cDon
aldet
al.
(198
3a,b
)T
Fya
*m
2940
0.35
1.08
2089
582
1.1
1.09
141.
712
Pat
erso
nS
eidm
anet
al.
(198
6)I
am
3740
0.6
0.63
559
335
5.9
1.67
174.
813
aS
Aam
osite
Slu
is-C
rem
eret
al.
(199
2)M
am
3140
0.4
0.93
064
845
6.3*
1.42
40.
88m
ines
13o
SA
Mo
m31
400.
40.
930
423
333.
1*1.
2720
6cr
ocid
olite
min
es14
Mas
sach
uset
tsT
alco
tteta
l.(1
989)
Oo
m34
370.
40.
740
288.
33.
375
6015
Alb
inA
lbin
et
al.
(199
0a,b
)C
yao*
m30
620.
981
2059
249
3*1.
213
2.6
16C
onne
ctic
utM
cDon
alde
ta
l.(1
984)
Fy*
m31
400.
410.
9320
557
550.
71.
010
017
Fer
odo
New
hous
ean
dS
ulliv
anF
yo*
mf
3045
0.56
110
2577
2646
.30.
9713
0.49
(198
9)
a Not
eson
star
red
entr
ies
inT
able
14.
bF
ollo
wup
dura
tion
whi
chdi
vide
sth
eob
serv
atio
nfie
ldbe
yond
the
min
imum
late
ncy
into
two
equa
lar
eas.
a See
text
.
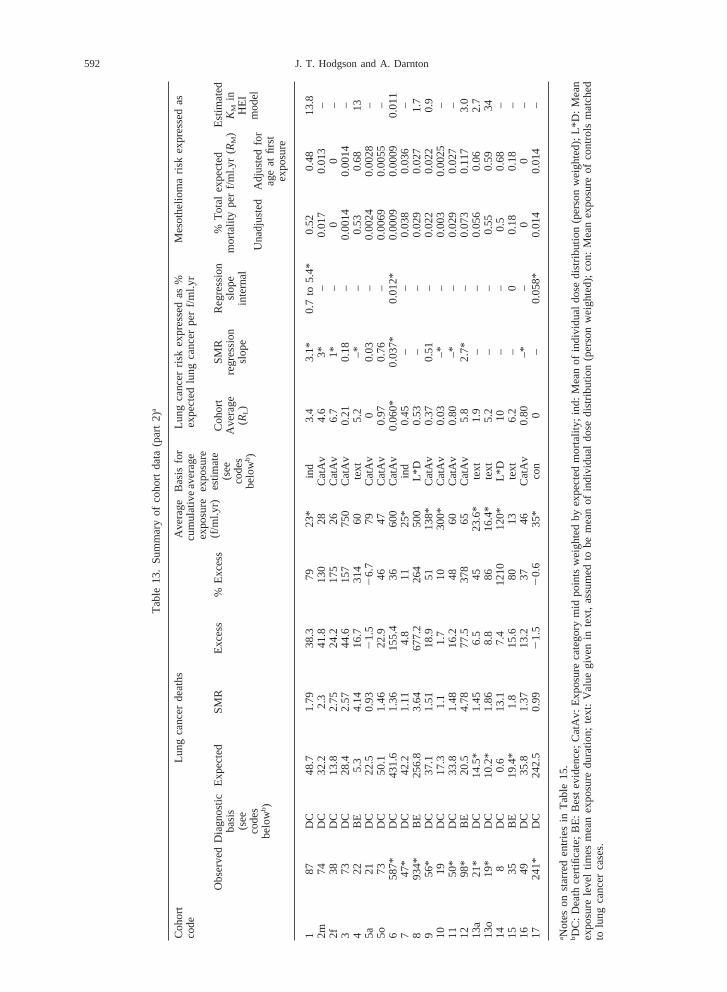
592 J. T. Hodgson and A. Darnton
Tab
le13
.S
umm
ary
ofco
hort
data
(par
t2)
a
Coh
ort
Lung
canc
erde
aths
Ave
rage
Bas
isfo
rLu
ngca
ncer
risk
expr
esse
das
%M
esot
helio
ma
risk
expr
esse
das
code
cum
ulat
ive
aver
age
expe
cted
lung
canc
erpe
rf/m
l.yr
expo
sure
expo
sure
(f/m
l.yr)
estim
ate
Obs
erve
dD
iagn
ostic
Exp
ecte
dS
MR
Exc
ess
%E
xces
sC
ohor
tS
MR
Reg
ress
ion
%T
otal
expe
cted
Est
imat
ed(s
eeba
sis
Ave
rage
regr
essi
onsl
ope
mor
talit
ype
rf/m
l.yr
(R
M)
KM
inco
des
(see
(RL)
slop
ein
tern
alH
EI
belo
wb)
code
sm
odel
Una
djus
ted
Adj
uste
dfo
rbe
lowb
)ag
eat
first
expo
sure
187
DC
48.7
1.79
38.3
7923
*in
d3.
43.
1*0.
7to
5.4*
0.52
0.48
13.8
2m74
DC
32.2
2.3
41.8
130
28C
atA
v4.
63*
–0.
017
0.01
3–
2f38
DC
13.8
2.75
24.2
175
26C
atA
v6.
71*
–0
0–
373
DC
28.4
2.57
44.6
157
750
Cat
Av
0.21
0.18
–0.
0014
0.00
14–
422
BE
5.3
4.14
16.7
314
60te
xt5.
2–*
–0.
530.
6813
5a21
DC
22.5
0.93
21.
52
6.7
79C
atA
v0
0.03
–0.
0024
0.00
28–
5o73
DC
50.1
1.46
22.9
4647
Cat
Av
0.97
0.76
–0.
0069
0.00
55–
658
7*D
C43
1.6
1.36
155.
436
600
Cat
Av
0.06
0*0.
037*
0.01
2*0.
0009
0.00
090.
011
747
*D
C42
.21.
114.
811
25*
ind
0.45
––
0.03
80.
036
–8
934*
BE
256.
83.
6467
7.2
264
500
L*D
0.53
––
0.02
90.
027
1.7
956
*D
C37
.11.
5118
.951
138*
Cat
Av
0.37
0.51
–0.
022
0.02
20.
910
19D
C17
.31.
11.
710
300*
Cat
Av
0.03
–*–
0.00
30.
0025
–11
50*
DC
33.8
1.48
16.2
4860
Cat
Av
0.80
–*–
0.02
90.
027
–12
98*
BE
20.5
4.78
77.5
378
65C
atA
v5.
82.
7*–
0.07
30.
117
3.0
13a
21*
DC
14.5
*1.
456.
545
23.6
*te
xt1.
9–
–0.
056
0.06
2.7
13o
19*
DC
10.2
*1.
868.
886
16.4
*te
xt5.
2–
–0.
550.
5934
148
DC
0.6
13.1
7.4
1210
120*
L*D
10–
–0.
50.
68–
1535
BE
19.4
*1.
815
.680
13te
xt6.
2–
00.
180.
18–
1649
DC
35.8
1.37
13.2
3746
Cat
Av
0.80
–*–
00
–17
241*
DC
242.
50.
992
1.5
20.
635
*co
n0
–0.
058*
0.01
40.
014
–
a Not
eson
star
red
entr
ies
inT
able
15.
bD
C:
Dea
thce
rtifi
cate
;B
E:
Bes
tev
iden
ce;
Cat
Av:
Exp
osur
eca
tego
rym
idpo
ints
wei
ghte
dby
expe
cted
mor
talit
y;in
d:M
ean
ofin
divi
dual
dose
dist
ribut
ion
(per
son
wei
ghte
d);
L*D
:M
ean
expo
sure
leve
ltim
esm
ean
expo
sure
dura
tion;
text
:V
alue
give
nin
text
,as
sum
edto
bem
ean
ofin
divi
dual
dose
dist
ribut
ion
(per
son
wei
ghte
d);
con:
Me
anex
posu
reof
cont
rols
mat
ched
tolu
ngca
ncer
case
s.

593Quantitative risks of mesothelioma and lung cancer
Tab
le14
.E
xpla
nato
ryno
tes
onco
hort
data
Coh
ort
iden
tifica
tion
Gen
eral
coho
rtno
tes
Fib
rety
peD
eath
sB
yA
llC
ause
sM
esot
helio
ma
mor
talit
y
Cod
eN
ame
Obs
Exp
1W
itten
oom
Dea
ths
toag
e65
(evi
denc
eof
inco
mpl
ete
deat
has
cert
ainm
ent
aol
der
ages
)2m
Car
olin
a(m
en)
Ver
ysm
all
amou
nts
ofcr
ocid
olite
yarn
wer
eus
ed,
but
raw
croc
idol
itefib
rew
asno
tpr
oces
sed.
The
quan
tity
ofcr
ocid
olite
used
was
abou
t0.
002%
ofth
eto
tal
2fC
arol
ina
(wom
en)
3Jo
hns
Man
ville
retir
ees
4O
ntar
ioP
rodu
ctio
nan
dm
aint
enan
cew
orke
rson
ly5a
New
Orle
ans
(pla
nt1)
Exc
l.m
enw
ith,3
mon
ths
Mai
nly
chry
sotil
e,am
osite
used
from
early
1940
s;cr
ocod
olite
used
occa
sion
ally
Tw
oad
ditio
nal
empl
oym
ent
from
1962
(too
rece
ntto
affe
ctob
serv
edm
orta
lity)
mes
othe
liom
asat
,20
yr5o
New
Orle
ans
(pla
nt2)
Exc
l.m
enw
ith,6
mon
ths
Mai
nly
chry
sotil
e,cr
ocid
olite
used
inpi
pepr
oduc
tion
proc
ess
late
ncy.
Afu
rthe
rfo
urem
ploy
men
toc
curr
edaf
ter
end
offo
rmal
follo
wup
6Q
uebe
cE
xclu
ding
Asb
esto
sfa
ctor
y,bu
tin
clud
ing
case
sat
Tab
le9
and
text
ages
,55
and
the
smal
ler
The
tford
min
es7
Voc
klab
ruck
Obs
erve
dle
ss5
mes
othe
liom
asan
d4.
8ex
cess
lung
canc
ers
8U
S/C
anad
ain
sula
tors
Nic
hols
onan
dLa
ndrig
an(1
996)
estim
ate
the
expo
sure
toha
vebe
en60
%ch
ryso
tile
and
40%
amos
ite,
base
don
publ
ishe
dpr
oduc
tco
mpo
sitio
ns.
Ana
lyse
sof
lung
burd
enin
lung
sfr
om16
US
insu
latio
nw
orke
rsgi
ven
byLa
nger
and
Nol
an(1
989)
foun
dam
osite
inal
l16
,ch
ryso
tile
inha
lfof
them
and
croc
idol
itein
thre
e.9
Roc
hdal
eP
redo
min
antly
chry
sotil
e,E
xpec
ted
all
caus
ede
aths
cann
otbe
rest
ricte
dto
men
with
>1
yrem
ploy
men
tbu
tfr
omm
id19
30s
aex
cess
mes
othe
liom
a-
and
mea
nex
posu
re-
ther
efor
eex
pres
sed
for
who
leco
nsite
nt5%
orso
was
coho
rtcr
ocid
olite
.10
Bal
ange
ro11
Pen
nsyl
vani
aA
bout
10%
ofth
efib
repr
oces
sed
was
amos
ite.
Ver
ysm
all
amou
nts
ofcr
ocid
olite
wer
eal
sous
ed,
but
little
was
hand
led
asra
wfib
re(C
on
tinu
ed
on
ne
xtp
ag
e)

594 J. T. Hodgson and A. Darnton
Tab
le14
.(co
ntin
ue
d)
Coh
ort
iden
tifica
tion
Gen
eral
coho
rtno
tes
Fib
rety
peD
eath
sB
yA
llC
ause
sM
esot
helio
ma
mor
talit
y
Cod
eN
ame
Obs
Exp
12P
ater
son
13a
SA
amos
item
ines
Rep
orte
dex
pect
ednu
mbe
rre
duce
dto
estim
ate
the
num
ber
rela
ting
to10+
yrfr
omfir
stex
posu
re(d
etai
lsin
App
endi
xC
)13
cS
Acr
ocid
olite
min
es14
Mas
sach
uset
ts15
Alb
inM
ainl
ych
ryso
tile
(>95
%),
Exp
ecte
dnu
mbe
res
timat
edfr
omob
serv
edan
dal
lca
use
RR
with
smal
ler
amou
nts
ofcr
ocid
olite
and
amos
ite.
Rec
ent
croc
idol
iteus
e,
1%,
neve
r>
3-4%
.U
pto
18%
ofam
osite
used
brie
flydu
ring
the
1950
s.It
isno
tcl
ear
whi
cham
phib
ole
shou
ldbe
seen
asth
em
ost
impo
rtan
t-
amos
itebe
caus
eof
the
rela
tivel
yhi
ghpe
rcen
tage
used
durin
ga
limite
dpe
riod
orcr
ocid
olite
beca
use
ofits
regu
lar
hist
oric
use
atlo
wle
vels
.16
Con
nect
icut
Dat
aon
men
expo
sed
,1
year
excl
uded
Chr
ysot
ilew
asth
eon
lyty
peof
asbe
stos
used
until
1957
whe
nso
me
anth
ophy
llite
was
adde
dfo
rso
me
prod
uct
lines
.A
bout
400
lbs
ofcr
ocid
olite
was
hand
led
expe
rimen
tally
ona
few
occa
sion
sin
the
labo
rato
ry,
but
only
betw
een
1964
and
1972
.G
iven
the
smal
lsc
ale
and
timin
gof
this
amph
ibol
eus
e,th
eco
hort
has
been
trea
ted
asch
ryso
tile
only
17F
erod
oA
part
from
two
perio
dsbe
fore
1944
,w
hen
croc
idol
iteas
best
osw
asus
edon
one
part
icul
arco
ntra
ct,
only
chry
sotle
asbe
stos
has
been
used
.
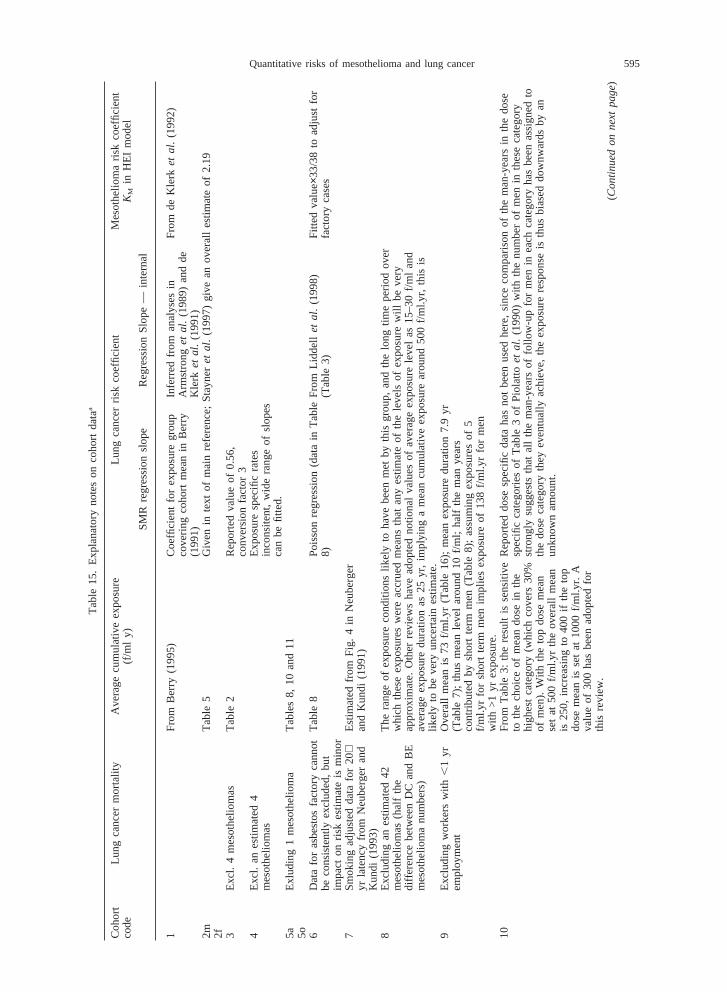
595Quantitative risks of mesothelioma and lung cancer
Tab
le15
.E
xpla
nato
ryno
tes
onco
hort
data
a
Coh
ort
Lung
canc
erm
orta
lity
Ave
rage
cum
ulat
ive
expo
sure
Lung
canc
erris
kco
effic
ient
Mes
othe
liom
aris
kco
effic
ient
code
(f/m
ly)
KM
inH
EI
mod
el
SM
Rre
gres
sion
slop
eR
egre
ssio
nS
lope
—in
tern
al
1F
rom
Ber
ry(1
995)
Coe
ffici
ent
for
expo
sure
grou
pIn
ferr
edfr
oman
alys
esin
Fro
mde
Kle
rke
ta
l.(1
992)
cove
ring
coho
rtm
ean
inB
erry
Arm
stro
nget
al.
(198
9)an
dde
(199
1)K
lerk
et
al.
(199
1)2m
Tab
le5
Giv
enin
text
ofm
ain
refe
renc
e;S
tayn
ereta
l.(1
997)
give
anov
eral
les
timat
eof
2.19
2f 3E
xcl.
4m
esot
helio
mas
Tab
le2
Rep
orte
dva
lue
of0.
56,
conv
ersi
onfa
ctor
34
Exc
l.an
estim
ated
4E
xpos
ure
spec
ific
rate
sm
esot
helio
mas
inco
nsite
nt,
wid
era
nge
ofsl
opes
can
befit
ted.
5aE
xlud
ing
1m
esot
helio
ma
Tab
les
8,10
and
115o 6
Dat
afo
ras
best
osfa
ctor
yca
nnot
Tab
le8
Poi
sson
regr
essi
on(d
ata
inT
able
Fro
mLi
ddel
le
ta
l.(1
998)
Fitt
edva
lue×3
3/38
toad
just
for
beco
nsis
tent
lyex
clud
ed,
but
8)(T
able
3)fa
ctor
yca
ses
impa
cton
risk
estim
ate
ism
inor
7S
mok
ing
adju
sted
data
for
20+E
stim
ated
from
Fig
.4
inN
eube
rger
yrla
tenc
yfr
omN
eube
rger
and
and
Kun
di(1
991)
Kun
di(1
993)
8E
xclu
ding
anes
timat
ed42
The
rang
eof
expo
sure
cond
ition
slik
ely
toha
vebe
enm
etby
this
grou
p,an
dth
elo
ngtim
epe
riod
over
mes
othe
liom
as(h
alf
the
whi
chth
ese
expo
sure
sw
ere
accr
ued
mea
nsth
atan
yes
timat
eof
the
leve
lsof
expo
sure
will
beve
rydi
ffere
nce
betw
een
DC
and
BE
appr
oxim
ate.
Oth
erre
view
sha
vead
opte
dno
tiona
lva
lues
ofav
erag
eex
posu
rele
vel
as15
–30
f/ml
and
mes
othe
liom
anu
mbe
rs)
aver
age
expo
sure
dura
tion
as25
yr,
impl
ying
am
ean
cum
ulat
ive
expo
sure
arou
nd50
0f/m
l.yr,
this
islik
ely
tobe
very
unce
rtai
nes
timat
e.9
Exc
ludi
ngw
orke
rsw
ith,
1yr
Ove
rall
mea
nis
73f/m
l.yr
(Tab
le16
);m
ean
expo
sure
dura
tion
7.9
yrem
ploy
men
t(T
able
7);
thus
mea
nle
vel
arou
nd10
f/ml;
half
the
man
year
sco
ntrib
uted
bysh
ort
term
men
(Tab
le8)
;as
sum
ing
expo
sure
sof
5f/m
l.yr
for
shor
tte
rmm
enim
plie
sex
posu
reof
138
f/ml.y
rfo
rm
enw
ith>
1yr
expo
sure
.10
Fro
mT
able
3:th
ere
sult
isse
nsiti
veR
epor
ted
dose
spec
ific
data
has
not
been
used
here
,si
nce
com
paris
onof
the
man
-yea
rsin
the
dose
toth
ech
oice
ofm
ean
dose
inth
esp
ecifi
cca
tego
ries
ofT
able
3of
Pio
latto
et
al.
(199
0)w
ithth
enu
mbe
rof
men
inth
ese
cate
gory
high
est
cate
gory
(whi
chco
vers
30%
stro
ngly
sugg
ests
that
all
the
man
-yea
rsof
follo
w-u
pfo
rm
enin
each
cate
gory
has
been
assi
gned
toof
men
).W
ithth
eto
pdo
sem
ean
the
dose
cate
gory
they
even
tual
lyac
hiev
e,th
eex
posu
rere
spon
seis
thus
bias
eddo
wnw
ards
byan
set
at50
0f/m
l.yr
the
over
all
mea
nun
know
nam
ount
.is
250,
incr
easi
ngto
400
ifth
eto
pdo
sem
ean
isse
tat
1000
f/ml.y
r.A
valu
eof
300
has
been
adop
ted
for
this
revi
ew.
(Co
ntin
ue
do
nn
ext
pa
ge)

596 J. T. Hodgson and A. Darnton
Tab
le15
.(co
ntin
ue
d)
Coh
ort
Lung
canc
erm
orta
lity
Ave
rage
cum
ulat
ive
expo
sure
(f/m
lLu
ngca
ncer
risk
coef
ficie
ntM
esot
helio
ma
risk
coef
ficie
ntco
dey)
KM
inH
EI
mod
el
SM
Rre
gres
sion
slop
eR
egre
ssio
nS
lope
—in
tern
al
11E
xclu
ding
thre
e(M
cDon
ald,
Tab
le5
The
dose
cate
gorie
sof
the
thre
em
esot
helio
mas
code
das
pers
onal
com
mun
icat
ion)
resp
irato
ryca
ncer
not
know
n,so
anad
just
edex
posu
re-r
espo
nse
mes
othe
liom
as.
Exp
ecte
dca
nnot
befit
ted.
mul
tiplie
dby
repo
rted
byS
MR
for
low
est
expo
sure
cate
gory
(0.6
69)
12E
xclu
ding
anes
timat
edfo
urT
able
XV
IP
oiss
onre
gres
sion
(Tab
leV
I)m
esot
helio
mas
13a
Obs
erve
dan
expe
cted
redu
ced
Rep
orte
dm
eans
adju
sted
tore
flect
wei
ghin
gof
expe
cted
mor
talit
y>
10yr
from
first
expo
sure
(see
13o
byth
ees
timat
edex
pect
edA
ppen
dix
C)
num
bers
with
in10
yrfr
omfir
stex
posu
re(S
eeA
ppen
dix
C).
Obs
erve
dnu
mbe
rsal
sore
duce
dby
the
estim
ated
num
ber
ofm
esot
helio
mas
code
dto
lung
canc
er(1
in13
a,5
in13
o)14
Bur
dett,
pers
onal
com
mun
icat
ion
(see
App
endi
xB
)15
Lung
canc
erta
ken
tobe
resp
irato
ryca
ncer
excl
udin
gpl
eura
lm
esot
hlio
mas
,R
Rin
terp
rete
das
SM
R16
Tab
le3
Mor
talit
yda
taw
ere
repo
rted
bycu
mul
ativ
eex
posu
re,
but
high
mor
talit
yin
shor
tte
rmw
orke
rsm
akes
inte
rpre
tatio
nof
this
data
diffi
cult.
The
high
est
resp
irato
ryca
ncer
mor
talit
yis
seen
inth
elo
wes
tex
posu
reca
tego
ry.
Thi
sre
mai
nsth
eca
seif
shor
tte
rmw
orke
rsar
eex
clud
ed:
low
-dos
em
enin
all
empl
oym
ent
dura
tion
cate
gorie
sha
dhi
ghle
vels
ofre
spira
tory
canc
erm
orta
lity
(Tab
le8)
.T
hem
ost
likel
yex
plan
atio
nse
ems
tobe
that
expo
sure
sha
vebe
enw
rong
lyas
sign
edat
the
indi
vidu
alle
vel.
The
avai
labl
ejo
bde
tails
gene
rally
only
allo
wed
wor
ker
hist
orie
sto
bede
scrib
edby
depa
rtm
ent,
rath
erth
anpr
oces
s.B
ecau
seof
this
the
expo
sure
–res
pons
eda
tais
not
used
here
.17
Tot
alob
serv
edlu
ngca
ncer=lun
gF
rom
Ber
ryan
dN
ewho
use
(198
3)F
rom
Ber
ryan
dN
ewho
use
(198
3)(c
ase
cont
rol,
anal
ysis
)an
dpl
eura
lca
ncer
sle
sspl
eura
l(m
ean
expo
sure
oflu
ngca
ncer
mes
othe
liom
asco
ntro
ls)
a Tab
les
orfig
ures
refe
rred
toar
eth
ose
foun
din
the
mai
nre
fere
nces
liste
din
Tab
le12
,un
less
othe
rwis
esp
ecifi
ed.

597Quantitative risks of mesothelioma and lung cancer
DEFINITION OF AVERAGE EXPOSURE
The inclusion of large numbers of cohort memberswho contribute no informative follow up may alsobias the average exposure. An appropriately weightedaverage exposure will give zero weight to individualexposures in this group. If only a simple mean isused, and if this late entrant group is large and has—as is likely—systematically lower exposures, theapparent cohort exposure will be too low in relationto the observed mortality, and the estimated risk perunit exposure will be exaggerated.
REVIEW OF COHORTS WITH POTENTIAL EFFECTDILUTION OR BIASSED EXPOSURE AVERAGES
The potential biases discussed in the precedingparagraphs will not apply where the reported mor-tality excludes observations before the tenth year offollow up (or a later year), and where the averageexposure has been weighted by expected lung cancermortality. This leaves the following cohorts as poten-tially affected: Wittenoom, Ontario, Vocklabruck,US/Canada insulators, Balangero, Paterson, SAmines, Massachusetts, Albin and Ferodo. Table 16summarises the relevant data.
The possibility of dilution due to uninformative fol-low up needs to be considered for the SA mines andfor the Massachusetts and Paterson cohorts. This cancertainly be ignored for Massachusetts and Patersoncohorts, because of their combination of limitedrecruitment period with long follow up. It cannot bedismissed for the SA mines, and an adjustment willbe developed below (Appendix C).
The possibility that a simple mean of individualexposures (the available figure) will be a poor proxyfor the desired average weighted by expected lungcancer mortality needs to be considered for all thecohorts listed in Table 16. For all but one there arereasons (summarised individually below) for believ-ing that the available figure is an acceptable proxy.
Table 16. Recruitment and follow up configurations for cohorts with potential effect dilution or biassed exposure averages
Recruitment follow up
Cohort Numbers of From To From To Maximum Follow upyears follow up on latest
latency (yr) entrants (yr)
Wittenoom 10 1943 1966 1943 1986 44 20Ontario 20 1948 1959 1948 1977 30 18Vocklabruck 20 1907 1979 1950 1990 84 11US/Canada insulators 20 1907 1966 1967 1986 80 20Balangero 20 1930 1986 1946 1987 58 1Paterson 5 1941 1945 1941 1982 42 37SA mines 0 1925 1980 1946 1980 56 0Massachusetts 0 1951 1953 1953 1988 38 35Albin 20 1907 1977 1927 1986 80 9Ferodo 10 1920 1977 1942 1979 60 2
O For Wittenoom, the measure of excess mortalityused has been truncated at subjects’ 65th birth-days. The effect of this is broadly to equalise thefollow up durations (and therefore the expectedmortality weights) of different first exposuregroups.
O The recruitment period of theOntario cohort isrelatively short, and no mention is made of majorvariations in exposure conditions.
O Only 18% of theVocklabruck cohort started theirexposure after 1969: described as ‘the decisiveyear in improving the dust situation’.
O The basis for the ‘mean’ exposure in theUS/Canadian insulatorscohort (drawn from pre-vious reviews) is very uncertain. It is not based onaveraging known or estimated individualexposures. It is plausible that conditions may nothave changed greatly over the relevant period (upto 1966).
O The narrow range of first exposure dates for theMassachusettscohort implies limited scope forchanges in average levels, and the long minimumfollow up also means that even if there were suchchanges, the weighting applied to early and lateentrants would be similar.
O Comparison of the most recent follow up report onthe Balangeromine cohort with a previous report(recruitment to 1965, follow up to 1975), suggeststhat only a relatively small proportion of the latestcohort were first exposed after 1965; though it isnot entirely clear how the two cohorts relate toeach other, and the minimum employment quali-fication time was more restrictive (1 yr) for thelater report than for the earlier (1 month), so thecomparison is not straightforward. There wasreportedly little change in exposure conditionsbetween 1946 and 1960. Some downward bias inthe derived exposure average is possible, but theextent of this is difficult to quantify. Even on anunadjusted basis, the derived risk per unitexposure for this cohort is one of the lowest seen.
598 J. T. Hodgson and A. Darnton
O For the Albin cohort, major exposure changesstarted to apply only from the late 1960s, the last10 yr of 70 yr of intake. The scope for bias istherefore limited.
O The average exposure used for theFerodo cohortis that of controls matched to lung cancer cases.It is therefore—indirectly—weighted in the appro-priate way.
The one exception is theSA mines cohort. Thereport on this cohort shows that a large proportion ofthe cohort (amosite and crocidolite workerscombined) were first exposed less than 10 yr from theend of follow up. Illustrative exposure data is alsoshown which implies that these workers wereexposed to levels 4–6 times lower than those whichapplied before about 1950. Some adjustment to thereported individual mean exposure is therefore indi-cated.
This adjustment, and the related adjustment toexclude observed and expected mortality arising fromuninformative follow up are described in detail inAppendix C. Briefly, we conclude that both theobserved excess lung cancer and the associated cumu-lative exposure should be adjusted upwards, theexposure by rather more than the mortality excess.The implied dose specific risk is reduced by abouta quarter.
SUMMARY MEASURES FOR MESOTHELIOMA
Mesothelioma incidence rate rises very steeplywith time since exposure, and this complicates thechoice of a summary measure that will be properlycomparable across cohorts. Comparisons betweencohorts with different follow up times (or differentmixes of follow up times) should be adjusted to allowfor the impact of those differences on the observedmesothelioma mortality. One solution is to fit a stat-istical model. The following formulation was used inthe HEI report, and is fairly typical:
r = KM·L·[{ t210}32{ t2102D} 3]
where L is exposure level expressed in f/ml,D isexposure duration in yr and the contents of the curlybrackets {} are set to zero if,0.
However not all cohorts have the data needed tofit the HEI (or similar) models. A pragmatic way ofmaking an equivalent adjustment is to expressobserved mesothelioma numbers as a percentage ofexpected mortality from all causes, since this too is ameasure which increases steeply with follow up time.
The expected mortality from all causes has onedrawback as a denominator for mesothelioma risk: itis dependent on age at first exposure. This would notbe a serious problem if the mean age at first exposurewas similar in different cohorts, but this is not the
case. For those cohorts for which the mean age at firstexposure is given or can be estimated, it ranges from23 for Quebec to 37 for Paterson, with a mean acrosscohorts of about 30. We have therefore standardisedthe expected all cause mortality figure given for eachcohort to an assumed mean age at first exposure of30. The amount of adjustment applied has been calcu-lated using the following formula:
EAdj = EAM30/Ma
Where EAdj is the adjusted expected all cause mor-tality to be used as denominator for the observedmesothelioma mortality;a is the mean age at firstexposure for the cohort in question;EA is the actualexpected all cause mortality from the person yearsin which the mesotheliomas arose;M30 and Ma areproportional expected all cause mortality estimatesfor the ‘typical’ follow up duration for the cohort (thefollow up duration that divides the observation fieldbeyond the minimum latency into two equal areas)from ages 30 anda respectively. The schedule of allcause death rates used to calculate M30 and Ma, wasrate=exp(29.61+.0936a)—where a is age in yr—which provides a close fit to male all cause mortalityin Australia, Austria, USA and Great Britain (usingdata taken from the mid 1970s). The fit is less goodfor South African and for Swedish death rates, but theadjustment depends on the ratio (M30/Ma) of expecteddeaths in different—and quite wide—age ranges, ameasure that is not sensitive to the precise underlyinglife table. So for convenience the same life tableapproximation was used for all cohorts. For the twocohorts where mean age at first exposure was notavailable (Rochdale and Albin), a mean age of 30was assumed.
A similar argument to that set out above in relationto the effect of uninformative follow up on recordedlung cancer mortality in the SA mines cohorts alsoapplies to the excess mortality from mesothelioma.All the recorded mesotheliomas in these cohortsoccurred more than 10 yr from first exposure. An esti-mate of the expected all cause mortality arising fromfollow up less than 10 yr from first exposure has beensubtracted from the reported total expected all causemortality, and this adjusted figure used as the denomi-nator for excess mesothelioma mortality in thesecohorts. Details of this calculation are given inAppendix C.
COMPARISON OF COHORT AVERAGE RISKMEASURES WITH ALTERNATIVES BASED ON
INTERNAL COMPARISONS
For reasons explained in the main report, thisreview has taken cohort level measures of exposureand outcome as the basic units of observation. In thenext two sections these cohort-level measures arecompared to the corresponding internal analyses forthose cohorts where both are available.

599Quantitative risks of mesothelioma and lung cancer
COMPARISON OF RISK MEASURES—MESOTHELIOMA
For cohorts where details of mesothelioma deathsand person years by time from first exposure weregiven, the HEI model fitted to these rates. The modelwas fitted using values for individual calendar yearsof time from first exposure aggregated to give thereported latency categories. Best fit was assessed bymaximum likelihood methods assuming a Poissondistribution, and the resulting estimates ofKM areshown in Table 12.
Figure 10 compares the two alternative measuresof mesothelioma risk: the HEI coefficientKM and thepercent excess mortality per f/ml.yr indexRM. Thereis good agreement between these measures. The mostdiscrepant point relates to the Quebec cohort (code6), though this is on either measure clearly the lowestvalue. It may be relevant that the HEI parameterKM
for the Quebec cohort was calculated using data basedon age at death as a proxy for time since exposure,since this will have introduced additional inaccuracy.The HEI formula may be preferred for the purposesof risk projection, but the alternative measure seemsto provide an equally valid summary of the relativelevels of mesothelioma risk in these cohorts.
COMPARISON OF RISK MEASURES—LUNGCANCER
Where exposure response regressions werereported by authors, the regression slope has beennoted: this provides the ‘regression slope’ estimate ofthe lung cancer risk. For cohorts where dose-specificSMR data had been reported, but no regression analy-sis was reported, a Poisson regression fit was calcu-lated.
The association between the cohort average esti-mate of RL with the regression slope estimate, for
Fig. 10. Comparison of alternative measures of mesotheliomamortality.
studies where both measures were available is shownin Fig. 11. There is a clear overall relationship,viewed across the whole risk scale. The discrepantpoints are those with substantial statistical uncer-tainty, either because they are based on small differ-ences between observed and expected cases (5a—New Orleans, plant 1; and 17—Ferodo) or becauseof uncertainties deriving from the small size of thereference population (15—Albin).
The most discrepant point relates to the Albincohort, which was analysed as an unmatched case-control study in relation to a control cohort of non-asbestos exposed industrial workers from the samearea. The overall RR for respiratory cancer excludingmesothelioma was 1.8 (though with a wide confi-dence interval: 0.9–3.7) and the mean cumulativeexposure was 13 f/ml.yr, giving a cohort average esti-mate ofRL of 6.2% per f/ml.yr (with an even widerconfidence interval:20.8–21). The value of theinternal regression slope in relation to exposure is notreported, though we are told that it was not statisti-cally significant (P=0.5). Inspection of the RRs forthe three exposure categories implies that the slopewould have been about 0.05. Whether this discrep-ancy reflects inaccuracy in the baseline, or in theexposure measurements (or a mix of these) is difficultto say. The high mesothelioma risk in this cohorttends to suggest that the cohort average measure isnearer the truth, but substantial uncertainty mustremain.
A further discrepant point relates to women in theCarolina cohort (2f), where the regression impliesRL=1, while the cohort average givesRL=6.7. Theauthors suggest that the low regression slope mayreflect uncertainties in women’s employment histories(which would tend to flatten the regression slope).
There is some tendency for the cohort average esti-mate to be larger than the corresponding regression
Fig. 11. Comparison of alternative measures of lung cancermortality.
600 J. T. Hodgson and A. Darnton
slope for those cohorts with clearly positive results.This might be predicted from the flattening ofregression slopes by inaccuracies in exposure esti-mates. But it can also reflect inadequacies in baselinerates. For example, the two-fold difference betweenthe cohort average and regression slope measures forthe Quebec cohort reflects the SMR of about 1.3 seenin all the low dose subgroups, and which the authorsinterpret as non-asbestos related. Nevertheless, thebroad agreement between the two measures acrossstudies suggests that valid conclusions can be drawnfrom the cohort average measure.
Appendix B
FIBRE–PARTICLE CONVERSION FORCROCIDOLITE CIGARETTE FILTER COHORT
NOTE BY DR G. BURDETT
The measurements in 1952 which gave an averageof 80 particles per ml, within the Massachusetts stan-dard of 175 particles per ml, almost certainly refer toimpinger measurements, which were frequently madefor insurance company purposes.
The normal units are millions of particles per cubicfoot (mppcf). As one cubic foot is equivalent to28 316.8 ml the value of 80 particles per ml is equiv-alent to 2.265 mppcf and 175 particles per ml is equi-valent to 5 mppcf.
Five mppcf was the threshold value in force fromthe 1930s to the 1960s (maybe even until 1972) whenit was replaced by a membrane filter limit of 10 f/ml,which has been falling ever since.
As the units suggest, the method only counted par-ticles using relatively low powered microscopy andwould overlook many of the respirable fibres and isa very indirect measurement of the fibre level. Itshould also be remembered that impingers have poorcapture efficiency below 1µm.
It is also noted that cotton and acetate fibres weremixed, carded and deposited on crepe paper under dryconditions. This would suggest that fibres made upmany of the particles but I have not referred to thepatent to work out quantities used to estimate thefibre percentage.
My best guesstimate is that 30% of the particleswere fibres but only about 10% of the fibres seenwould be crocidolite (it is more dusty, but has veryfew >1 µm fibres compared to the other dusts).
This would mean about 3% of the count was cro-cidolite fibres or about 2.5 f/ml>1µm wide. To con-vert to the current index we generally find one canassume only some 4% of the >5µm long crocidolitefibres were visible as compared with the currentindex. This is equivalent to a concentration of about60 crocidolite fibres per ml using a modern versionof the membrane filter method.
This is several times higher than the better factoriesat this time but not too far away from what was prob-
ably present assuming some exhaust control on thebag opening, carding and mixing areas. Unfortunatelyno mention of the control system is made.
Also it is probably an average value that has beengiven for both the wet and dry methods as both werein use. It is probable given that the sampling locationsare unknown that higher concentrations occurred inthe dry areas: around 100 f/ml as measured by thecurrent method.
Of course this is very approximate, but 100 f/mllooks to be a good maximum exposure with TWA of60 f/ml.
Appendix C
DEVELOPMENT OF ADJUSTMENTS TO THESOUTH AFRICAN MINES COHORT DATA
The starting point for the adjustment of thereported results from this cohort is the data given inTables 1 and 2 of the published paper, which giveillustrative data on exposure levels in different per-iods (Table 1) and a breakdown of the whole cohortby year of birth and date of first exposure (Table 2).
The average age at first exposure of the groups rep-resented by the cells of Table 2 can be estimatedusing the mid points of the year of birth and yearof first employment categories (1900 and 1935 wereassumed for the earliest birth and employment categ-ories respectively). Age specific all cause and lungcancer rates for white South African men in 1955,1965 and 1975 were then used to calculate the distri-bution of expected lung cancer deaths by time sincefirst exposure in each cell. The rates for 1955 werealso used for the cells relating to first employmentbetween 1941 and 1950, but the expected number wasreduced by a factor of 0.64 to allow for the fact thatcause specific follow up was only recorded from1949.
The total expected lung cancers calculated in thisway (39.3) agrees quite closely to the value reportedin the paper (36.6) and the proportion of expectedlung cancer deaths arising from follow up less than10 yr from first exposure is 0.23. The reportedobserved and expected lung cancers in the two purefibre subcohorts have therefore been reduced by 0.23times the expected numbers given.
The data reported in Table 1 was used to estimateapproximate relative exposure levels at ten year inter-vals from 1945. Taking 1945 as 1, the numbers usedwere 1, 0.6, 0.35, 0.25 for amosite; and 1, 0.5, 0.25,0.15 for crocidolite. Exposures in the 1930s wereassumed to be the same as in the 1940s. To derivean expected lung cancer weighting for this relativeexposure pattern, the expected lung cancers in eachbirth-start cell from the 10th anniversary of firstemployment to the end of follow up in 1980 was cal-culated in a similar way to that described for the first10 yr of follow up. The resulting distribution of

601Quantitative risks of mesothelioma and lung cancer
Table 17. Derivation of correction factor for reported mean exposure using assumed relative exposure and weightingfactors by year of first employment in asbestos mines
Data item Year of first employment Mean weighted by
Before 1940 1941–50 1951–60 1961–70 1971–80 Persons Expectedlung cancer
Relative exposureCrocidolite 1 1 0.5 0.25 0.15 0.35 0.6Amosite 1 1 0.6 0.35 0.25 0.44 0.68Weighting factors TotalsPersons 62 404 2355 2408 2088 7317Expected lung 1.68 6.75 17.59 4.36 0 30.38cancers >10 yr from1st exposure
expected lung cancers in the five date of start groupsis shown in Table 17.
Table 17 also shows the numbers of individuals ineach group, and the assumed relative levels ofexposure. Mean exposures are calculated using thetwo alternative weightings. The expected lung cancerweighted means are larger than the correspondingperson weighted means by a factor of 1.71 for cro-cidolite and 1.55 for amosite. The reported mean
exposures have been adjusted using these factors foruse in this review.
Similar calculations for all cause deaths imply thatthe proportion of expected all cause deaths falling inthe first 10 yr of follow up is 33%. The all causemortality denominator for the observed mesotheli-omas in the two subcohorts has therefore beenreduced by a factor of 0.67.
Related Documents