- 132 - www.ivypub.org/emj Economic Management Journal December 2018, Volume 7 Issue 2, PP. 132-144 The Quality of Service Community Health Center in Taiwan Chiao Chao 1 , Hsiao-Chi Ling 2 1 Fu Jen Catholic University, Institute of Psychology, Doctorate Student 2 Kainan University, Associate Professor Abstract The purpose of this study is to use the model of service quality concepts to evaluate the service qualities of "community health centers”in order to find out the service quality gaps and thus reinforce the competitive edge. This study took Datong District Health Centre in Taipei city as the research object and performed a questionnaire survey with internal and external customers. In terms of internal customers (service staff), 50 employees participated and a total number of 50 effective questionnaires were returned. In terms of external customers, convenience sampling was adopted to collect the questionnaires, 679 answered questionnaires were returned, effective copies being 667. The research tool was the questionnaire that was designed mainly on the basis of SERVQUAL (the scale of service quality determinants) and with reference to the practical data of service process during its implementation at subject service departments. The findings included the conclusions such as "there exists significant effect between service quality and customer satisfaction”, “the biggest difference among service qualities is service performance gap (GAP3), showing that there is still a room for improvement regarding the service provided at the health centre” and “different demographic variables have significant effects on customer satisfactions, e.g. higher age groups, lower education level and jobless people have lower satisfaction on the service received”. The research result can be provided to relevant organisations as a reference for improvement. Keywords: Service Quality, Community Health Centre, PZB Quality Theory 1 INTRODUCTION The current medical service operation in domestic hospitals is to provide service when patients seeking treatment. The health promotion to community residents at ordinary times cannot provide effective and prompt medical consultation and health management service. The government should take the following standards as the yearly health inspection comparison, i.e. to strengthen the function of community health centre, to provide health education service on prevention, health care as well as health consultation, to build up individual health administration archives so to establish sustainable mutual relationships. However, with the pro-active innovation in the service industry, the public will naturally increase their expectancy on service quality. Therefore, health centres must reflect about the requirements of service quality and take actions in advance in order to gain competitive edge. As a part of service industries, medical care sector takes customers satisfaction as the ultimate operation objective in an era of full three-dimensional customer orientation. In addition to the promotion of the medical technology and expertise, the public are paying more attention to the improvement of service quality. Therefore, the introduction of the quality management practices will help medical organisations to be promoted to a high level quality standard and thus enhance consumer’s confidence, which will absolutely have a positive impact on operational administration. According to the above motivations, this study aims to perform quality management analysis on health centres, taking the internal and external customers of Datong District Health Centre in Taipei City as the object to explore the

Welcome message from author
This document is posted to help you gain knowledge. Please leave a comment to let me know what you think about it! Share it to your friends and learn new things together.
Transcript
- 132 -
www.ivypub.org/emj
Economic Management Journal December 2018, Volume 7 Issue 2, PP. 132-144
The Quality of Service Community Health Center
in Taiwan Chiao Chao
1, Hsiao-Chi Ling
2
1 Fu Jen Catholic University, Institute of Psychology, Doctorate Student
2 Kainan University, Associate Professor
Abstract
The purpose of this study is to use the model of service quality concepts to evaluate the service qualities of "community health
centers”in order to find out the service quality gaps and thus reinforce the competitive edge. This study took Datong District Health
Centre in Taipei city as the research object and performed a questionnaire survey with internal and external customers. In terms of
internal customers (service staff), 50 employees participated and a total number of 50 effective questionnaires were returned. In terms
of external customers, convenience sampling was adopted to collect the questionnaires, 679 answered questionnaires were returned,
effective copies being 667. The research tool was the questionnaire that was designed mainly on the basis of SERVQUAL (the scale of
service quality determinants) and with reference to the practical data of service process during its implementation at subject service
departments. The findings included the conclusions such as "there exists significant effect between service quality and customer
satisfaction”, “the biggest difference among service qualities is service performance gap (GAP3), showing that there is still a room for
improvement regarding the service provided at the health centre” and “different demographic variables have significant effects on
customer satisfactions, e.g. higher age groups, lower education level and jobless people have lower satisfaction on the service
received”. The research result can be provided to relevant organisations as a reference for improvement.
Keywords: Service Quality, Community Health Centre, PZB Quality Theory
1 INTRODUCTION
The current medical service operation in domestic hospitals is to provide service when patients seeking treatment. The
health promotion to community residents at ordinary times cannot provide effective and prompt medical consultation
and health management service. The government should take the following standards as the yearly health inspection
comparison, i.e. to strengthen the function of community health centre, to provide health education service on prevention,
health care as well as health consultation, to build up individual health administration archives so to establish sustainable
mutual relationships. However, with the pro-active innovation in the service industry, the public will naturally increase
their expectancy on service quality. Therefore, health centres must reflect about the requirements of service quality and
take actions in advance in order to gain competitive edge.
As a part of service industries, medical care sector takes customers satisfaction as the ultimate operation objective in an
era of full three-dimensional customer orientation. In addition to the promotion of the medical technology and expertise,
the public are paying more attention to the improvement of service quality. Therefore, the introduction of the quality
management practices will help medical organisations to be promoted to a high level quality standard and thus enhance
consumer’s confidence, which will absolutely have a positive impact on operational administration.
According to the above motivations, this study aims to perform quality management analysis on health centres, taking
the internal and external customers of Datong District Health Centre in Taipei City as the object to explore the
- 133 -
www.ivypub.org/emj
merriment indicators of the service quality in health centres and to analyse the service quality evaluation process of
health centres. Relevant subjects are as follows:
To analyse the service quality items and priorities at health centres to learn about the characteristics of employees
and customers at health centres;
To explore if there are significant differences among expectations and perceptions that customers, internal and
external, have on the items of service quality provided by health centres;
To explore if there are significant differences among internal and external customers’ demographical variables and
expectations/perceptions on service quality provided by health centres.
2 LITERATURE REVIEW
2.1 Service Quality
Some scholars (Regan, 1963; Kotler, 1984; Buell, 1984; Juran, 1986; Murdick, 1990; Lovelock, 1991) have different
definitions of “service” but all of them have one thing in common regarding the nature. Lin Jianshan (1992) combines
the opinions of other scholars and points out that service has five characteristics which are intangibility, inseparability,
heterogeneity, perishability and ownership.
The word “quality” is commonly used in daily life, both in manufacturing and in service industry. Scholars have
different definitions for "quality” (Juran, 1986; Crosby, 1979; Garvin, 1983; Deming, 1981). Zhang (1996) points out
that Deming's definition is the most positive one, which indicates that quality is from the customers' point of view, which
means it should not only satisfy but also promote customer satisfactions. Garvin (1983) makes a complete explanation
according to the definition made by other scholars and organizations. He considers that quality can be defined in five
ways: (1) philosophy, (2) product-orientation, (3) user-orientation, (4) manufacture-orientation and (5) value orientation.
Zimmerman (1985) applies the quality control concept in manufacturing industry to service quality and considers that
good service should include (1) Fitness for Use, (2) The Ability to Replicate, (3) Timeliness (4) End User Satisfaction
and (5) Adherence to Pre-established Specification. On the basis of the explanation by the above scholars, this study
defines that the “quality” at health centers is “to satisfy patients’ demands”. Its characters include fitness for use,
compliance with specifications, acceptability on the affordable prices and patients’ satisfaction. Its implications can be
summarised as the following four points: (1) quality of product, (2) quality of process, (3) quality of the merriment and
(4) quality of management.
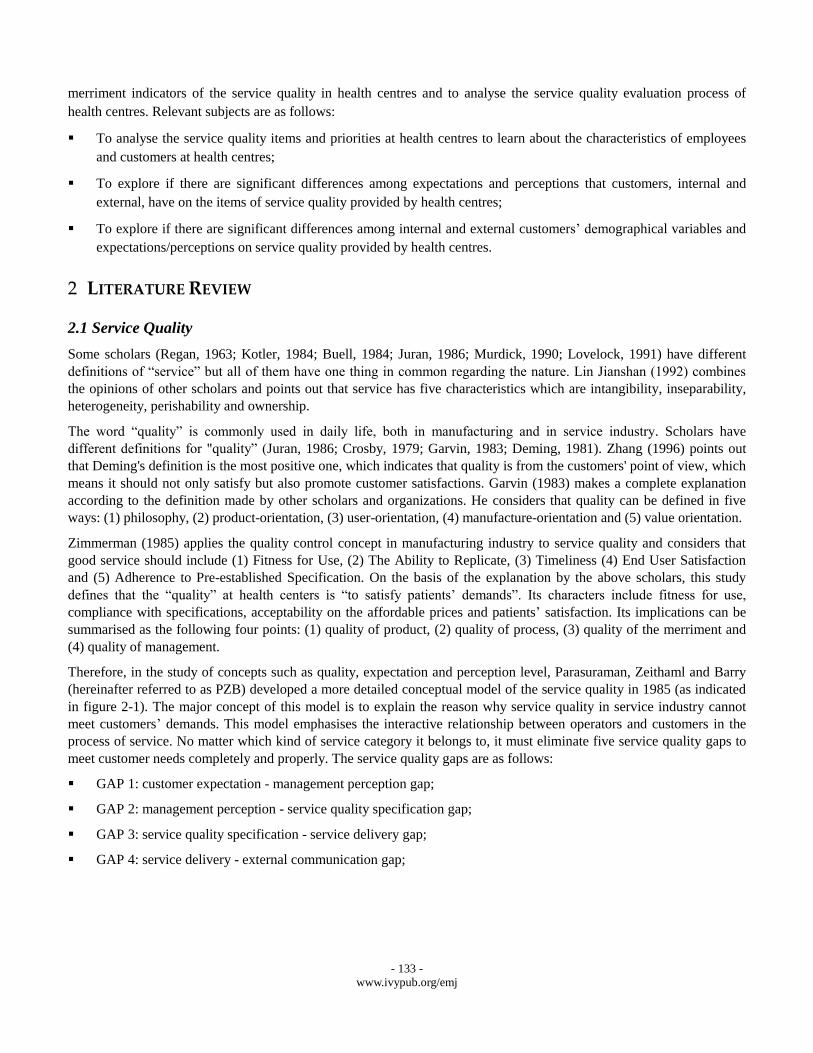
Therefore, in the study of concepts such as quality, expectation and perception level, Parasuraman, Zeithaml and Barry
(hereinafter referred to as PZB) developed a more detailed conceptual model of the service quality in 1985 (as indicated
in figure 2-1). The major concept of this model is to explain the reason why service quality in service industry cannot
meet customers’ demands. This model emphasises the interactive relationship between operators and customers in the
process of service. No matter which kind of service category it belongs to, it must eliminate five service quality gaps to
meet customer needs completely and properly. The service quality gaps are as follows:
GAP 1: customer expectation - management perception gap;
GAP 2: management perception - service quality specification gap;
GAP 3: service quality specification - service delivery gap;
GAP 4: service delivery - external communication gap;
- 134 -
www.ivypub.org/emj
GAP 5: expected service - perceived service gap.
There are five service gaps in this model and these five gaps are the reason why service operators' service standard
cannot meet customer expectations. The differences of these five gaps must be reduced if a operator wants customer
expectations to be satisfied. Among these five gaps, gap 1 to gap 4 are the major barriers for the service quality provided
while gap 5 is caused by the differences between the service expected by customers and the service perceived by
customers. Gap 5 is also the function from gap 1 to gap 4, i.e. Gap5=f (Gap1, Gap2, Gap3, Gap4), therefore Parasuraman,
Zeithaml and Berry (1985) consider that service expected (E, Expected) and service perceived (P, Perceived) determine
the size and the direction of the service quality (SQ) perceived by customers, i.e. SQ=P-E. According to such a definition,
we can list the following three types of the relationships between the level of expectation and the level of perception:
E>P, showing that customers think service quality is not good and they are unsatisfied;
E=P, showing that customers think of service quality is okay and therefore they are satisfied;
E>P, showing that customers think service quality is very good and therefore they are very satisfied.
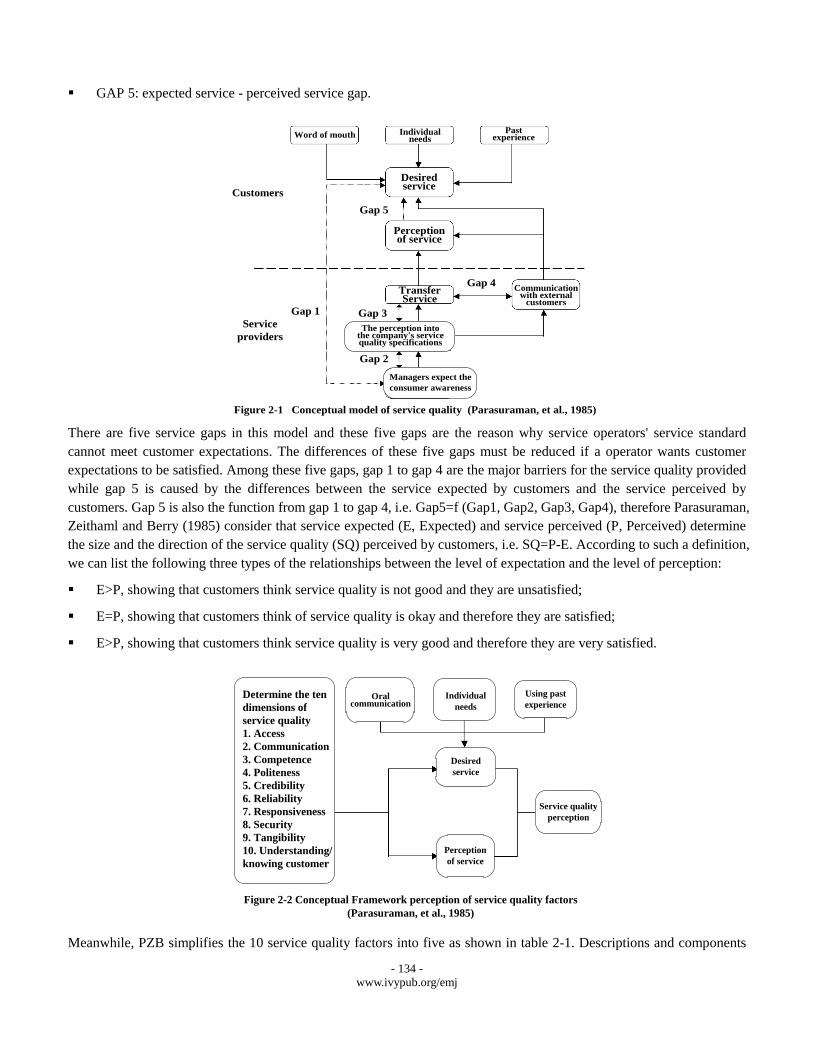
Meanwhile, PZB simplifies the 10 service quality factors into five as shown in table 2-1. Descriptions and components
Word of mouth
Customers
Individual needs
Past experience
Desired service
Perception of service
Gap 5
Service
providers
Gap 1
Transfer Service
Gap 3
Gap 2
Gap 4
The perception into the company's service quality specifications
Managers expect the
consumer awareness
Communication with external
customers
Figure 2-1 Conceptual model of service quality (Parasuraman, et al., 1985)
Determine the ten
dimensions of
service quality
1. Access
2. Communication
3. Competence
4. Politeness
5. Credibility
6. Reliability
7. Responsiveness
8. Security
9. Tangibility
10. Understanding/
knowing customer
Oral communication
Individual
needs
Using past
experience
Desired
service
Perception
of service
Service quality
perception
Figure 2-2 Conceptual Framework perception of service quality factors
(Parasuraman, et al., 1985)
- 135 -
www.ivypub.org/emj
of each gap are as follows:
GAP 1: customer expectation - management perception gap;
GAP 2: management perception - service quality specification gap;
GAP 3: service quality specification - service delivery gap;
GAP 4: service delivery - external communication gap;
GAP 5: expected service - perceived service gap.
TABLE 2-1 PZB SERVICE QUALITY FACTORS AND MEANINGS (PARASURAMAN, ET AL, 1988)
Ten original PZB factors in 1985 Five amended PZB factors in 1988 Meaning 1. Access
2. Communication 3. Competence 4. Politeness 5. Credibility 6. Reliability
7. Responsiveness 8. Security
9. Tangibility 10. Understanding/knowing
customer
1. Tangibility 2. Reliability
3. Responsiveness 4. Assurance 5. Empathy
1. Physical facilities, equipment and service staff's appearance.
2. Capacity to provide service to customers properly and reliably
3. Service staff's willingness to help and the promptness.
4. Capacity to make customers feel trustworthy and secure and the
possession of ettiqutte and skills required.
5. Service staff's ability to pay attention and show concern to particular
customers.
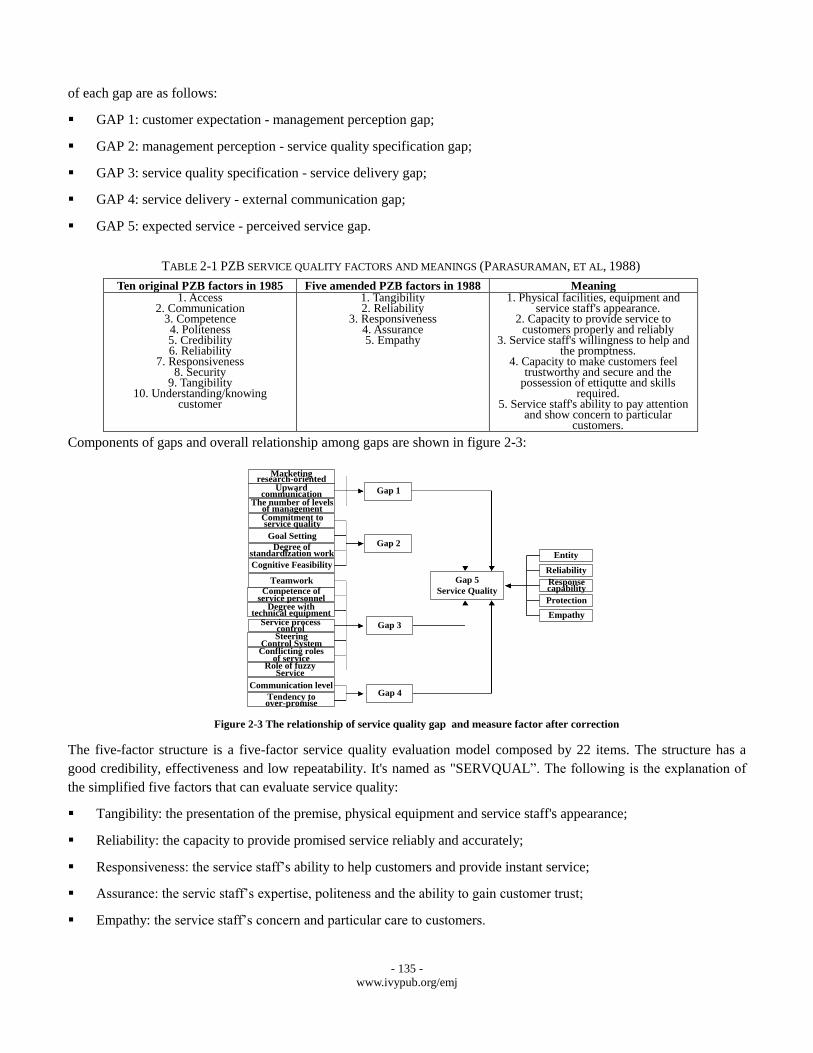
Components of gaps and overall relationship among gaps are shown in figure 2-3:
The five-factor structure is a five-factor service quality evaluation model composed by 22 items. The structure has a
good credibility, effectiveness and low repeatability. It's named as "SERVQUAL”. The following is the explanation of
the simplified five factors that can evaluate service quality:
Tangibility: the presentation of the premise, physical equipment and service staff's appearance;
Reliability: the capacity to provide promised service reliably and accurately;
Responsiveness: the service staff’s ability to help customers and provide instant service;
Assurance: the servic staff’s expertise, politeness and the ability to gain customer trust;
Empathy: the service staff’s concern and particular care to customers.
Marketing research-oriented
Upward communication
The number of levels of managementCommitment to service quality
Goal Setting
Degree of standardization work
Cognitive Feasibility
Gap 1
Gap 2
Gap 3
Gap 4
Teamwork
Competence of service personnel
Degree with technical equipment
Service process control
Conflicting roles of service
Role of fuzzy Service
Steering Control System
Communication level
Tendency to over-promise
Gap 5
Service Quality
Entity
Reliability
Response capability
Protection
Empathy
Figure 2-3 The relationship of service quality gap and measure factor after correction
- 136 -
www.ivypub.org/emj
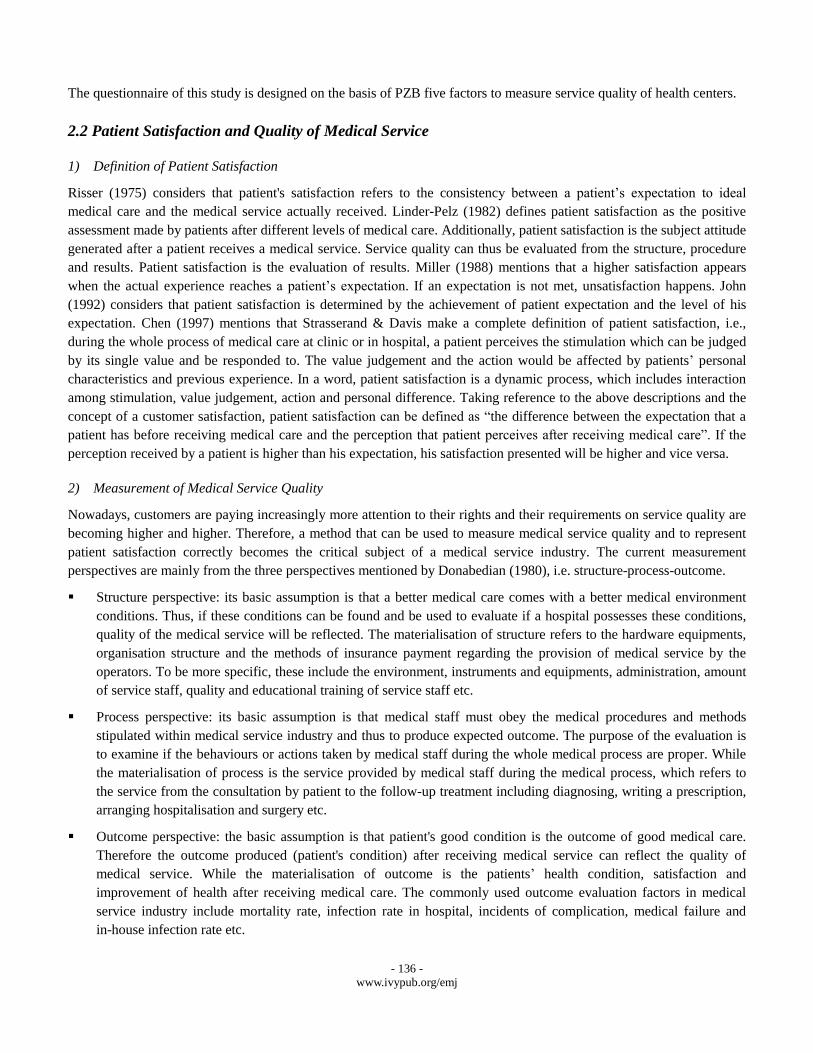
The questionnaire of this study is designed on the basis of PZB five factors to measure service quality of health centers.
2.2 Patient Satisfaction and Quality of Medical Service
1) Definition of Patient Satisfaction
Risser (1975) considers that patient's satisfaction refers to the consistency between a patient’s expectation to ideal
medical care and the medical service actually received. Linder-Pelz (1982) defines patient satisfaction as the positive
assessment made by patients after different levels of medical care. Additionally, patient satisfaction is the subject attitude
generated after a patient receives a medical service. Service quality can thus be evaluated from the structure, procedure
and results. Patient satisfaction is the evaluation of results. Miller (1988) mentions that a higher satisfaction appears
when the actual experience reaches a patient’s expectation. If an expectation is not met, unsatisfaction happens. John
(1992) considers that patient satisfaction is determined by the achievement of patient expectation and the level of his
expectation. Chen (1997) mentions that Strasserand & Davis make a complete definition of patient satisfaction, i.e.,
during the whole process of medical care at clinic or in hospital, a patient perceives the stimulation which can be judged
by its single value and be responded to. The value judgement and the action would be affected by patients’ personal
characteristics and previous experience. In a word, patient satisfaction is a dynamic process, which includes interaction
among stimulation, value judgement, action and personal difference. Taking reference to the above descriptions and the
concept of a customer satisfaction, patient satisfaction can be defined as “the difference between the expectation that a
patient has before receiving medical care and the perception that patient perceives after receiving medical care”. If the
perception received by a patient is higher than his expectation, his satisfaction presented will be higher and vice versa.
2) Measurement of Medical Service Quality
Nowadays, customers are paying increasingly more attention to their rights and their requirements on service quality are
becoming higher and higher. Therefore, a method that can be used to measure medical service quality and to represent
patient satisfaction correctly becomes the critical subject of a medical service industry. The current measurement
perspectives are mainly from the three perspectives mentioned by Donabedian (1980), i.e. structure-process-outcome.
Structure perspective: its basic assumption is that a better medical care comes with a better medical environment
conditions. Thus, if these conditions can be found and be used to evaluate if a hospital possesses these conditions,
quality of the medical service will be reflected. The materialisation of structure refers to the hardware equipments,
organisation structure and the methods of insurance payment regarding the provision of medical service by the
operators. To be more specific, these include the environment, instruments and equipments, administration, amount
of service staff, quality and educational training of service staff etc.
Process perspective: its basic assumption is that medical staff must obey the medical procedures and methods
stipulated within medical service industry and thus to produce expected outcome. The purpose of the evaluation is
to examine if the behaviours or actions taken by medical staff during the whole medical process are proper. While
the materialisation of process is the service provided by medical staff during the medical process, which refers to
the service from the consultation by patient to the follow-up treatment including diagnosing, writing a prescription,
arranging hospitalisation and surgery etc.
Outcome perspective: the basic assumption is that patient's good condition is the outcome of good medical care.
Therefore the outcome produced (patient's condition) after receiving medical service can reflect the quality of
medical service. While the materialisation of outcome is the patients’ health condition, satisfaction and
improvement of health after receiving medical care. The commonly used outcome evaluation factors in medical
service industry include mortality rate, infection rate in hospital, incidents of complication, medical failure and
in-house infection rate etc.
- 137 -
www.ivypub.org/emj
Robert and Kathleen (1987) considered that only when the structure, process and outcome in medical service are
included in the consideration of evaluation, the comprehensive service quality of a hospital can be concluded. None is
dispensable. Therefore many scholars, domestic and abroad, use “structure-process- outcome” evaluation model to
measure the service quality of a hospital.
3) Relationship between Patient Satisfaction and Medical Service Quality
Donabedian (1966) thinks that patient satisfaction can be used to evaluate the quality of medical care. Woodside, Frey
and Daly (1989) point out in their studies that patient perception on service quality has positive impact on patient
satisfaction while patient satisfaction will affect the decision that patients choose medical care. O’Connor (1991)
explorers the medical service quality in hospitals and patient satisfaction, the results show that there are positive
co-relation between medical service quality and patient satisfaction as well as between patient satisfaction and intention
to return. This means that the higher the patients’ evaluation on medical service quality is, the more satisfied he is and
the more willingly he’ll come back to the same hospital.
4) Relationship between Medical Service Quality and Service Quality
Patient satisfaction is the subject attitude generated after the patient receives medical service. It is decided by whether
the patient's expectation has been achieved and the patient’s perception level. In the era of the economic development
and knowledge improvement, a patient tends to have higher expectations of his own rights and service quality, thus, the
most appropriate response is to promote medical service quality. On that account, it will be helpful to evaluate the
satisfaction of medical staff and patients at health centres by the differences between perception and expectation. It will
also helpful to explore the service quality at health centers so as to make various medical services provided at health
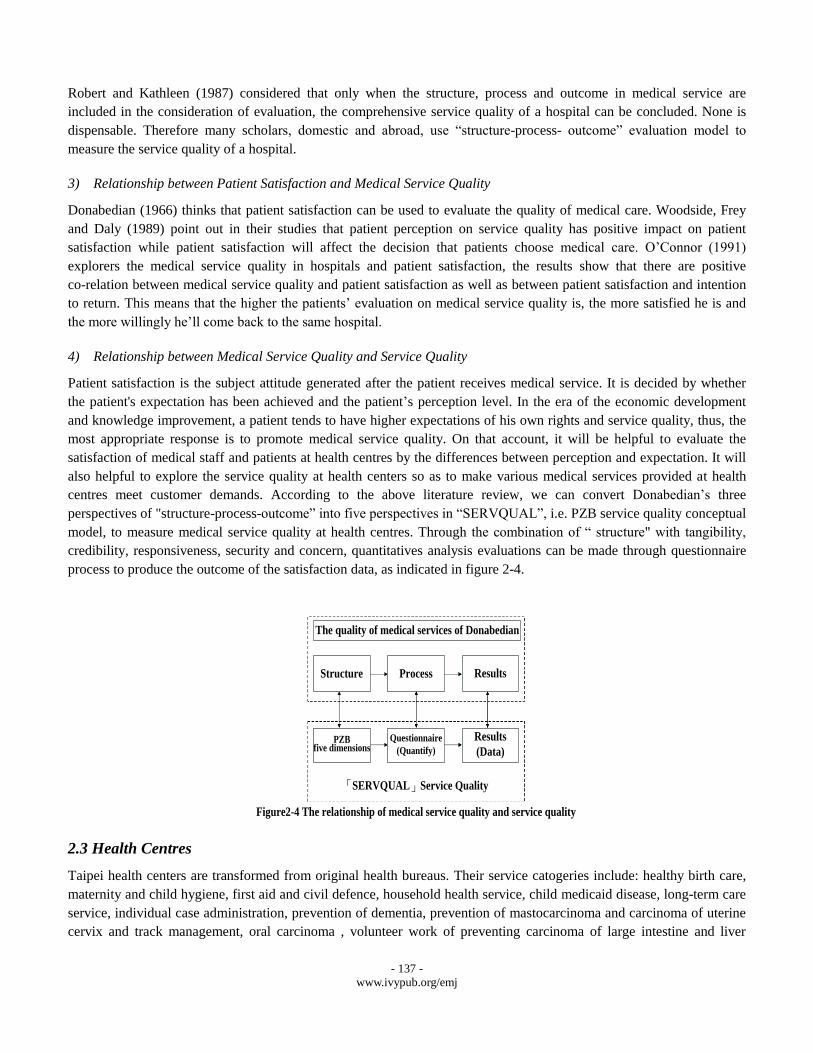
centres meet customer demands. According to the above literature review, we can convert Donabedian’s three
perspectives of "structure-process-outcome” into five perspectives in “SERVQUAL”, i.e. PZB service quality conceptual
model, to measure medical service quality at health centres. Through the combination of “ structure" with tangibility,
credibility, responsiveness, security and concern, quantitatives analysis evaluations can be made through questionnaire
process to produce the outcome of the satisfaction data, as indicated in figure 2-4.
2.3 Health Centres
Taipei health centers are transformed from original health bureaus. Their service catogeries include: healthy birth care,
maternity and child hygiene, first aid and civil defence, household health service, child medicaid disease, long-term care
service, individual case administration, prevention of dementia, prevention of mastocarcinoma and carcinoma of uterine
cervix and track management, oral carcinoma , volunteer work of preventing carcinoma of large intestine and liver
The quality of medical services of Donabedian
Structure Process Results
PZBfive dimensions
Questionnaire
(Quantify)
Results
(Data)
「SERVQUAL」Service Quality
Figure2-4 The relationship of medical service quality and service quality
- 138 -
www.ivypub.org/emj
cancer, student internship, mastocarcinoma and carcinoma of uterine cervix positive case trace management, citizen
health card, Changqing Energy Center, school hygiene and preschool children integrity screening, community health
creation, health physical performance promotion, career health promotion, safety community, healthy diet promotion and
publicity of preventing the harm of smoking, household security, health education and CPR first aid training program.
The object of this study is Datong District Health Center in Taipei City, which is an old district but developed earlier in
Taipei and merged with five other districts in the invasion period by Japan, like Penglai, into one of the 10 bigger
districts in Taiwan. Due to organizational reform with branches of health bureaus since 1st Jan, 2005, the health bureau
was renamed as Datong Health Center. The center has two teams, one dealing with case administration and the other
with health improvement. They are responsible for the health care, health education and health management of residents
within the community.
3 METHODOLOGY
3.1 Research Structure
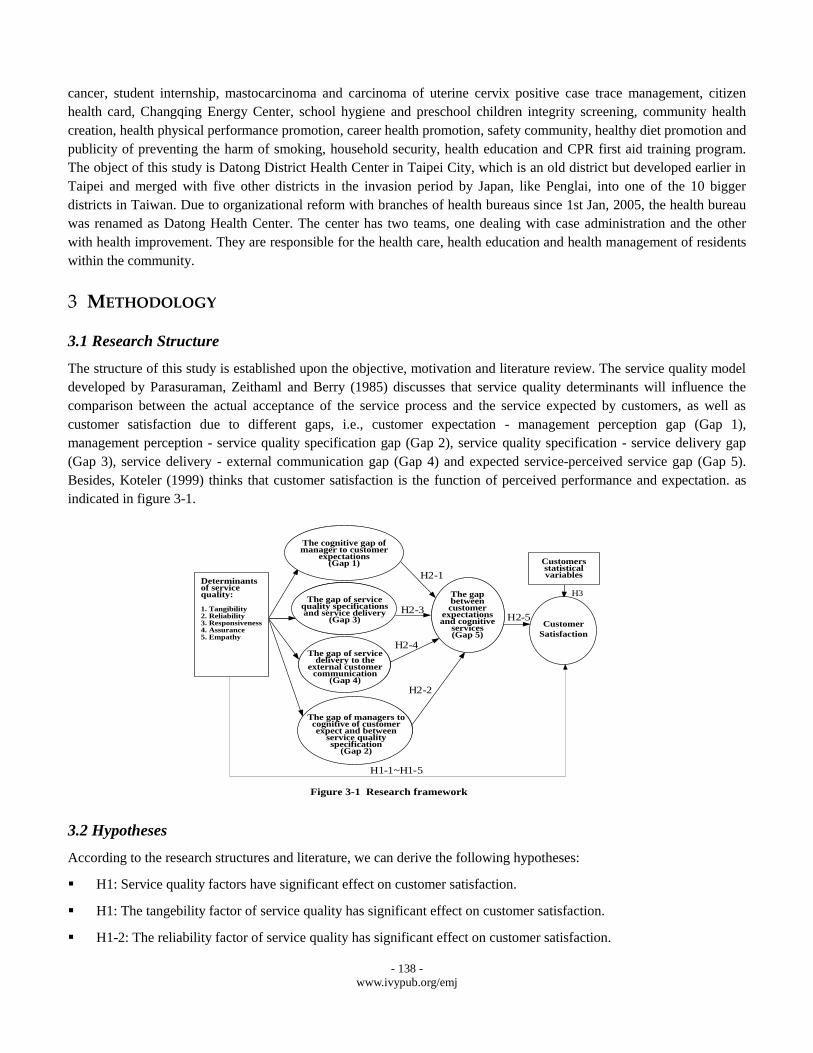
The structure of this study is established upon the objective, motivation and literature review. The service quality model
developed by Parasuraman, Zeithaml and Berry (1985) discusses that service quality determinants will influence the
comparison between the actual acceptance of the service process and the service expected by customers, as well as
customer satisfaction due to different gaps, i.e., customer expectation - management perception gap (Gap 1),
management perception - service quality specification gap (Gap 2), service quality specification - service delivery gap
(Gap 3), service delivery - external communication gap (Gap 4) and expected service-perceived service gap (Gap 5).
Besides, Koteler (1999) thinks that customer satisfaction is the function of perceived performance and expectation. as
indicated in figure 3-1.
3.2 Hypotheses
According to the research structures and literature, we can derive the following hypotheses:
H1: Service quality factors have significant effect on customer satisfaction.
H1: The tangebility factor of service quality has significant effect on customer satisfaction.
H1-2: The reliability factor of service quality has significant effect on customer satisfaction.
服務品質決
定因素:
1.有形性
2.可靠性
3.回應性
4.確實性
5.關懷性
客戶滿意度
圖3-1 研究架構
H1-1~H1-5
H2-1
H2-2
H2-3
H2-4
H2-5
顧客的期望與認知服務的差距(GAP5)
管理階層對客戶期望的認知缺口(GAP1)
服務品質的規格與服務傳遞的缺口(GAP3)
服務傳遞對客戶的外部溝通的缺口(GAP4)
管理者對客戶期望服務的認知與服務品質規格間的缺口(GAP2)
顧客人口統計變項
H3
Determinants of service quality:
1. Tangibility2. Reliability3. Responsiveness4. Assurance5. Empathy
The cognitive gap ofmanager to customer
expectations(Gap 1)
The gap of service quality specifications and service delivery
(Gap 3)
The gap of service delivery to the
external customer communication
(Gap 4)
The gap of managers to cognitive of customer expect and between
service quality specification
(Gap 2)
The gap between customer
expectations and cognitive
services(Gap 5)
Customer
Satisfaction
Customers statistical variables
Figure 3-1 Research framework

- 139 -
www.ivypub.org/emj
H1-3: The reactivity factor of service quality has significant effect on customer satisfaction.
H1-4: The security factor of service quality has significant effect on customer satisfaction.
H1-5: The empathy factor of service quality has significant effect on customer satisfaction.
H2: PZB quality model has significant effect on perspectives of perceived service.
H2-1: Due to Gap1, service quality factors have significant effects on perceived service.
H2-2: Due to Gap2, service quality factors have significant effects on perceived service.
H2-3: Due to Gap3, service quality factors have significant effects on perceived service.
H4-4: Due to Gap4, service quality factors have significant effects on transferd service.
H2-5: Gap5 has significant effect on customer satisfaction.
H3: Different demographic variables have significant effects on customer satisfaction.
H3-1: Customers at different ages have significant differences regarding the effect of service quality factor on
customer satisfaction.
H3-2: Customers at different educational leveles have significant differences regarding the effect of service quality
factor on customer satisfaction.
H3-3: Customers with different occupations have significant differences regarding the effect of service quality
factor on customer satisfaction.
H3-4: Customers with different genders have significant differences regarding the effect of service quality factor on
customer satisfaction.
H3-5: Customers with different health conditions have significant differences regarding the effect of service quality
factor on customer satisfaction.
3.3 Design of Research
This study will explore the five gaps of service quality through questionnaires and will build up the quality model and
satisfaction connotation suitable for health centers.
1) Design of Questionnaire
This study uses the SERVQUAL service quality determinant developed by Parasuraman, Zeithaml and Berry (1994) as
the major accordance and refers to the actual data of the service process at individual departments during its
implementation to design a questionnaire. All the 22 questions in five perspectives use five-score Likert scale. The
internal consistency coefficient value is among .87 and .93, while all VE values being above .5, all square roots of AVE
value of each prospective being bigger than correlation coefficient values, as shows that the questionnaire has a sound
and constructive validity.
2) Operational Definition of Research Variables
This study tries to transform the five-gap perspectives in PZB model into the operational definition of service quality at
health centres and to design every factor as a question. The operational definitions are as follows:
Management perception gap (Gap 1): the difference between the perception of the service on customer expectation
by the management at health centres and the service expected by customers;
- 140 -
www.ivypub.org/emj
Management criteria gap (Gap 2): the difference between the specification perceived by the management and the
service specification developed by them;
Service performance gap (gap 3): the difference between the service specifications provided by staff at health
centres and that expected by customers
Internal communication gap (Gap 4): the publicity and appraisals from the public on health centres exceed the
service that can be provided by the service staff, as causes customers to expect too much from health centres,
Service quality gap (Gap 5): the difference between the service quality and health centres after receiving service
and the service quality expected before receiving service. The accumulation of the first four gaps shows a different
which is GAP 5.
3.4 Design of Sampling
This study took Datong District Health Centre in Taipei City as the research object and carried out questionnaire surveys
to the internal customers and external customers. In terms of internal customers, i.e. the service staff, 50 employees
participated in the survey and 50 questionnaires were returned, with an effective return rate of 100%. In terms of external
customers, this study used convenience sampling to collect the questionnaire in the consideration of respecting
customers own wills and not disturbing the operation in health centre or making customers feel affected. Until October
31, 2011 the collection of questionnaires from the customers of the health centre was finished and answered
questionnaires returned were 679. After reviewing the returned questionnaires, there were 12 uncompleted ones (missing
answers), therefore the total effective questionnaires returned were 667, the effective return rate being 98%.
4 RESEARCH FINDINGS
4.1 Analysis of Sample Structure
Regarding the fundamental information of customers participated in the survey, 167 are males (24.6%) and 500 are
females (73.6%). 20 people (2.9%) are under the age of 20; 240 (35.3%) are between 20 and 40 years old, 252 (37.1%)
are between 40 and 60 years old; 160 (23.5%) are 60 and 80 years old; 4 (0.6%) are above 80 years old; 3 (0.4%) have
no answers. Regarding the education level, 89 (13.1%) are below primary school level, 72 (10.6%) are at high school
level, 193 (28.4%) at at occupational high school level, 284 (41.9%) are at college level; 35 (5.2%) are at institution
level, 6 (0.9%) have no answers. Regarding occupation, 235 (34.6%) are jobless; 114 (16.8%) work in service sectors;
10 (1.5%) work in industries; 80 (11.8%) work in business field; 1 (0.1%) work in agriculture and fishing; 101 (14.9%)
work in education field; 20 (2.9%) are students; 105 (15.6%) work in other fields or are freelancers; 12 (1.7%) have no
answers. The samples are evenly distributed in each category.
4.2 Analysis of Ranking of Service Quality Expectation and Perception
According to the valid questionnaires returned, a ranking analysis is made according to the expectation and perception
on service quality by internal and external customers of the health centre. An analysis whether there are gaps between
their expectations and perceptions in accordance with respondents’ background information is made. Then important
factors that form the expectation and perception of service quality evaluation factors are listed. An exploration of
prospective characteristics of forming factors on respondents is made finally. The purpose of the ranking analysis is to
learn about the priorities of expectations and perceptions in each question and to the take it as the accordance to improve
the current conditions.
1) Analysis of Service Quality Expectation Factors

- 141 -
www.ivypub.org/emj
It can be concluded after analyses that staff at health centres pays most attention to “reliability” of GAP5, and then
security and then tangibility, thus the order of emphases on expectation factors of GAP5 by staff at health centers is
reliability, security, responsiveness, empathy and tangibility. However, customers pay most attention to responsiveness
and then security and then tangibility, thus the order of emphases on expectation factors of customers is responsiveness,
security, reliability, empathy and the tangibility.
2) Analysis of Service Quality Perception Factors
It can be concluded after analyses that, among perception level factors of service quality gap (GAP5), service staff is
most satisfied with their reliability and then responsiveness while they are not very satisfied with tangibility. Thus the
order of customer satisfaction with expectation of service quality gap (GAP5) is responsiveness, reliability, security,
empathy and tangibility.
4.3 Relationship between Service Quality Factors and Customer Satisfaction
This study applies regression model to analyse and discuss the effect of service quality of customer satisfaction, using
the five perspectives of service quality factors (tangibility, reliability, responsiveness, security and empathy) as
independent variables and customer satisfaction as dependable variables to construct the regression model. The findings
show that the verified values of both overall variable R2 and F value has achieved significant effect, that is to say,
having an interpret ability and showing a significant relationship with customer satisfaction, i.e. H1-1 to H1-5 are all
supported.
4.4. Relationship between PZB Quality Model and Perceived Service
In order to verify H2, paired samples are used to verify and evaluate the differences between service qualities, i.e. to
evaluate the differences between service quality expectations and perceptions of service by the stuff and customers who
take part in the survey. The finding is that GAP1, GAP 3 and GAP5 values achieve significant differences, service
performance gap (GAP 3) having the biggest difference (averaged at 2.66). It can be concluded from the analysis that
there are differences in terms of the internal service staff’s expectations and perceptions on some of the evaluation
subjects and the differences are quite significant. The values of expectations and perceptions by customers are all
positive. Therefore it can be concluded that external customers are satisfied with the services that the health center
provides. Additionally, evaluations from internal customers show that perception level is lower than expectation level,
which means that the service quality provided by the health center still has a room for improvement. Therefore, H2-1,
H2-3 and H2-5 receive support.
4.5 Difference Verification Analysis of Demographic Variables
The purpose of this section is to verify H3 and the approach is to use T-test and analysis of variance (ANOVA) to study
the differences between expectations and perceptions of customers on service qualities by demographic variables, so as
to learn about the expectations and perceptions on service quality by customers with different demographic variables
such as gender, age, educational level and health conditions. The analysis of the relationship between satisfaction and
age arrives at the finding that people at 51-60 and 61-70 give lower scores on their satisfaction level, they show
unsatisfaction at almost every aspects of the service quality. In the analysis of the relationship between satisfaction and
educational level, the people have low educational level appears to have lower satisfaction level with the service quality.
In the analysis of the relationship between satisfaction and occupation, jobless (including housekeeping) people have the
lowest satisfaction level. Finally, in the analysis of the relationship between satisfaction and health condition, those who
have lower self-evaluation of their health conditions (one standard deviation lower than the average value) show lower
level of satisfaction. Therefore H2-1, H2-3 and H2-5 receive support.
- 142 -
www.ivypub.org/emj
5 CONCLUSIONS AND SUGGESTIONS
The current trend of industry development has changed from “production-oriented” to “marketing-oriented”, as leads to
the increasing competitive pressures on health centres. How to promote patient satisfaction and hold on with the concept
of valuing customers most and treating patients and their families friendly has become a critical theme. This study
arrives at the following conclusions:
5.1 Research Conclusions
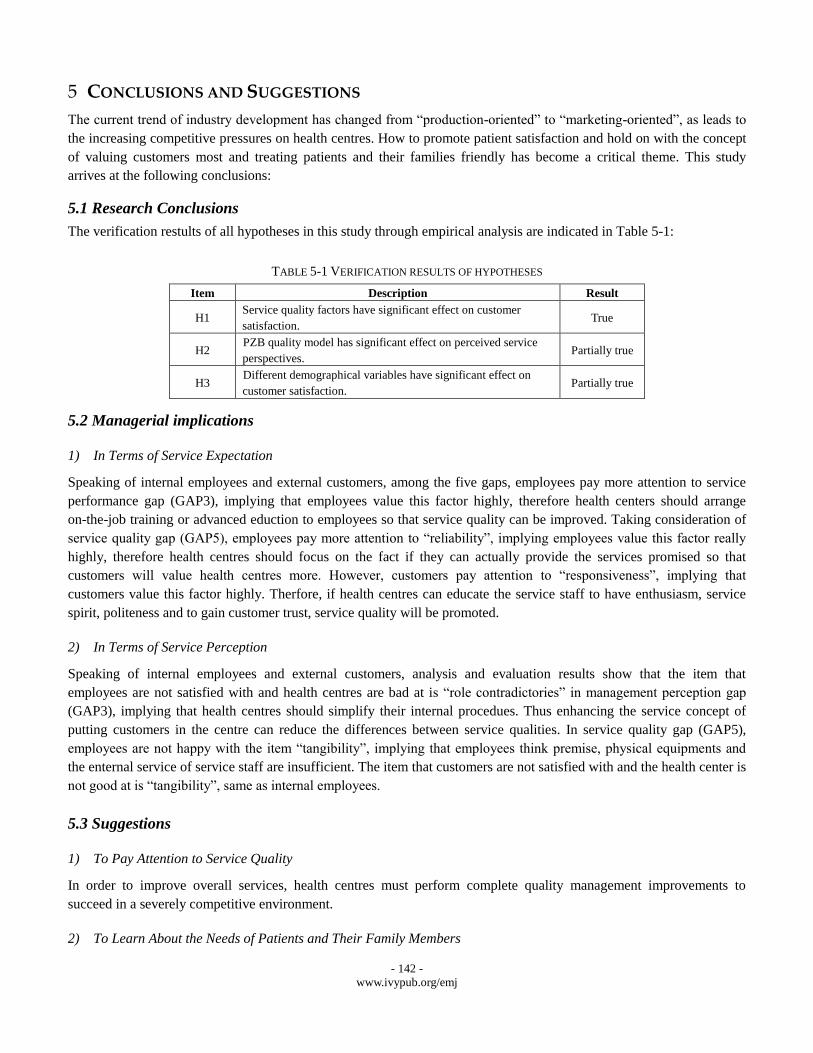
The verification restults of all hypotheses in this study through empirical analysis are indicated in Table 5-1:
TABLE 5-1 VERIFICATION RESULTS OF HYPOTHESES
Item Description Result
H1 Service quality factors have significant effect on customer
satisfaction. True
H2 PZB quality model has significant effect on perceived service
perspectives. Partially true
H3 Different demographical variables have significant effect on
customer satisfaction. Partially true
5.2 Managerial implications
1) In Terms of Service Expectation
Speaking of internal employees and external customers, among the five gaps, employees pay more attention to service
performance gap (GAP3), implying that employees value this factor highly, therefore health centers should arrange
on-the-job training or advanced eduction to employees so that service quality can be improved. Taking consideration of
service quality gap (GAP5), employees pay more attention to “reliability”, implying employees value this factor really
highly, therefore health centres should focus on the fact if they can actually provide the services promised so that
customers will value health centres more. However, customers pay attention to “responsiveness”, implying that
customers value this factor highly. Therfore, if health centres can educate the service staff to have enthusiasm, service
spirit, politeness and to gain customer trust, service quality will be promoted.
2) In Terms of Service Perception
Speaking of internal employees and external customers, analysis and evaluation results show that the item that
employees are not satisfied with and health centres are bad at is “role contradictories” in management perception gap
(GAP3), implying that health centres should simplify their internal procedues. Thus enhancing the service concept of
putting customers in the centre can reduce the differences between service qualities. In service quality gap (GAP5),
employees are not happy with the item “tangibility”, implying that employees think premise, physical equipments and
the enternal service of service staff are insufficient. The item that customers are not satisfied with and the health center is
not good at is “tangibility”, same as internal employees.
5.3 Suggestions
1) To Pay Attention to Service Quality
In order to improve overall services, health centres must perform complete quality management improvements to
succeed in a severely competitive environment.
2) To Learn About the Needs of Patients and Their Family Members
- 143 -
www.ivypub.org/emj
Since there are great differences between the perceptions of patients and health centres on service quality satisfaction, we
suggest that the executives of health centres should try to learn about the real needs of patients and their families and
provide different services according to different needs so as to improve the satisfaction of patients and their family
members on service quality. Meanwhile, the service staff should enhance their interaction with patients, gaining
information through written forms or regular disscusstions so as to realize complete quality management plans.
3) To Arrange Training Courses for Service Staff
Health centers should enhance service staff’s professional training and reminding their about the service attitude because
health centres have a high degree of customer contact and service staff’s competence, communication capacity and other
service attitudes will affect the satisfaction of patients and their family members. Therefore, the instruction of
customer-oriented spirit to service staff is necessary.
4) To Develop A Detailed Plan that Can Improve Service Quality
To promote service quality has become an important differentiated strategy for service providers to retain sustainable
competitive advantages. The promises and supports from the executives as well as well-planned long-term service
quality plans are the most important managerial implication of promoting over quality management.
We hope that the suggestions provided in this study can offer substantial help to health centres and the improvement of
service quality can meanwhile promote operational performance, help reinforce the function and contribution of medical
sector to the whole society and promote the sound development of medical care environment.
REFERENCES
[1] Crosy, P. B. (1979). Quality Is Free: The Art of Making Quality Certain. New York: McGraw-Hill.
[2] Deming, W. E., (1981). Improvement of Quality and Productivity Through Action by Management, National Productivity Review, 1 ,
12-22.
[3] Donabedian, A. (1980). Explorations in Quality Assessment and Monitoring. Health Administration Press, 1, 97-124.
[4] Donabedian, A. (1978). The Quality of Medical Care. Science, 200, 856-864.
[5] Garvin, D. A. (1983), Quality on the line, Harvard business review, 61, 65-75.
[6] John, Joby (1992), “The Impact of Past Experience”, Journal of Health Care Marketing, 12, 56-64.
[7] Juran, J. M. (1986), A universal approach to managing for quality, Quality Progress, 19, 19-24.
[8] Linder-Pelz, S. (1982), Toward a Theory of Patient Satisfaction, Social Science and Medicine, 16, 577-589.
[9] Lovelock, C. H. (1991). Services Marketing (2nd Ed), New Jersey: Perntice-Hall.
[10] Miiler, M. B. (1988), Nursing Care Behaviors That Predict Patient Satisfaction, Nursing Quality Assurance, 2, 11-17.
[11] Murdick, R.G., Render B. and Russell, R.S. (1990), Service Operations Management, Allyn and Bacon, Boston, MA.
[12] Kotler, P. (1984), Marketing Management Analysis, Planning, Implementation and Control, 6th ed., Englewood Cliffs, New Jersey:
Prentice-Hall.
[13] Kotler, P., (1999) Marketing Management: Analysis, Planning, Implementation and Control, 9th ed., Englewood Cliffs, New Jersey:
Prentice Hall.
[14] O'Connor, P. F. (1991). The Influence of Physician Task Behavior on Patient Evaluation of the Technical Quality of Medical
Care.Unpublished Dissertation, The George Washington University. Washington D.C.
[15] Parasuraman A., Zeithaml V., and Berry L. (1985), A Conceptual model of service quality and its Implication for Future Research,
Journal of Marketing, 49, 41-50.
[16] Parasuraman A., Zeithaml V., and Berry L. (1988), Servqual: A multiple-item scale for measuring consumer perception of service
quality, Journal of Retailing, 64, 12-40

- 144 -
www.ivypub.org/emj
[17] Parasuraman A., Zeithaml V., and Berry L. (1994), Alternative scales for measuring service quality: A comparative assessment based
on psychometric and diagnostic criteria, Journal of Retailing, 70, 201-230.
[18] Risser, N. (1975), Development of an Instrument to Measure Patient Satisfaction with Nurses and Nursing Care in Primary Care
Settings, Nursing Research, 24, 45-52.
[19] Victor, P. B. (1984). Marketing management: A strategic planning approach. New York, NY:McGraw-Hill Book Company.
[20] William J. R. (1963), The Service Revolution, Journal of Marketing, 27, 57-62.
Related Documents