The Quality of Financial Statements: Perspectives from the Recent Stock Market Bubble Stephen H. Penman Graduate School of Business 612 Uris Hall Columbia University (212) 854 9151 [email protected] January 2003 Now published in Accounting Horizons, Earnings Quality Supplement, 2003

Welcome message from author
This document is posted to help you gain knowledge. Please leave a comment to let me know what you think about it! Share it to your friends and learn new things together.
Transcript

The Quality of Financial Statements: Perspectives from the Recent Stock Market Bubble
Stephen H. Penman Graduate School of Business
612 Uris Hall Columbia University
(212) 854 9151 [email protected]
January 2003
Now published in Accounting Horizons, Earnings Quality Supplement, 2003

2
Stephen Penman’s research is supported by the Morgan Stanley Research Scholar Fund at Columbia University. The comments of Patricia Dechow and Baruch Lev are appreciated.
SYNOPSIS: During the recent stock market bubble, the traditional financial reporting model was assailed as a backward looking system, out of date in the Information Age. With the bursting of the bubble, the quality of financial reporting is again under scrutiny, but now for not adhering to traditional principles of sound earnings measurement, asset and liability recognition. This paper is a retrospective on the quality of financial reporting during the 1990s. Did reporting under U.S. GAAP perform well during the bubble, or is its quality suspect? My premise is that financial reporting should serve as an anchor during bubbles, to check speculative beliefs. With a focus on the shareholder as customer, the paper asks whether shareholders were well served or whether financial reporting helped to pyramid earnings and stock prices. The scorecard is mixed. A number of quality features of accounting are identified. Inevitable imperfections due to measurement difficulties are recognized, as a quality warning to analysts and investors. And a number of failures of GAAP and financial disclosures are identified which, if not recognized, can promote momentum investing and stock market bubbles.

1
The Quality of Financial Statements: Perspectives from the Recent Stock Market Bubble
Introduction
Concerns about the quality of accounting intensify as economies turn down, companies
flounder, and investors lose. With the bursting of the recent stock market bubble, the quality of
accounting is again under scrutiny. This essay questions the quality of financial reporting against
the backdrop of the stock market bubble.
Bubbles work like a pyramiding chain letter. Speculative beliefs feed rising stock prices
that beget even higher prices, spurred on by further speculation. Momentum investing displaces
fundamental investing. One role of accounting is to interrupt the chain letter, to challenge
speculative beliefs, and so anchor investors on fundamentals. Poor accounting feeds speculative
beliefs. Warren Buffet recognized the dot.com boom of the late 1990s as a chain letter, with
investment bankers the “eager postmen.”1 He might well have added their assistants, the
analysts, many of whom shamelessly disregarded fundamentals.2 But was accounting also to
blame?
GAAP accounting certainly came in for criticism during the bubble. Commentators
argued that the traditional financial reporting model, developed during the Industrial Age, is no
longer relevant in the Information Age. Is this bubble froth or something to be taken seriously?
In their statement responding to the Enron-Andersen debacle, the Big 5 accounting firms blamed
the “broken financial-reporting model.” 3 Is this an insight or a self-serving defense?
Consider the view, common among new-technology analysts during the bubble, that
“earnings no longer matter.” Untested metrics like clicks and page views became the substance
of “value reporting” for the Information Age. Price-earnings ratios over 50 were viewed as

2
acceptable, with the implicit criticism that earnings are deficient. These views are less
compelling in retrospect. We now understand that the losses reported by dot.coms were a good
predictor of outcomes. The statement that earnings don’t matter was bubble froth. The high P/E
ratios of the 1990s are now seen as more to do with the quality of prices rather than the quality of
earnings. Joe Berardino, chief executive of Enron’s auditor, Arthur Andersen, claimed (in a
“wake-up call”) that “Enron’s collapse, like the dot-com meltdown, is a reminder that our
financial reporting model is out of date.”4 Others might argue that accounting served us well
during the dot-com meltdown. But accounting was an issue in the Enron affair. What is a
balanced view?
My commentary provides a way of thinking about accounting quality, and then applies
that thinking to prepare a list of good and bad features of financial statements. I identify poor
features of GAAP, but also, in response to the criticisms during the bubble, point out quality
features of the traditional model. Some problematic features of GAAP are inevitable, given
inherent measurement difficulties, so are discussed, not with a view to reform, but to underscore
the limitations of accounting and as a quality warning to analysts who must appreciate these
imperfections and accommodate them. Some of the points I make are opinionated, for one must
be normative about quality. Opinions are to be reacted against, to be accepted or rejected with
better thinking. Most points follow from stated premises, however, so it is these premises that the
reader must challenge. Many of the points arise in my classes on financial statement analysis.
They appear on a list of complaints about accounting that I encourage students to prepare during
the semester as they run into frustrations in analyzing financial statements to value shares.
An initial premise is already implicit in the discussion: stock market bubbles – inefficient
capital markets – are damaging to economies. People form unreasonable expectations of likely

3
returns and so make misguided consumption and investment decisions. Entrepreneurs with poor
business models raise cash too easily in hot market IPO markets, deflecting it from firms that can
add value for society. Managers holding shares or options join the chain letter and make money
from stock price movements rather than running firms efficiently. Investors borrow to buy paper
rather than real productive assets. Debt burdens become intolerable. Banks that feed the
borrowing run into trouble. Risk is mispriced, so upsetting risk sharing in the economy. The
crash of 1929, the Japanese post-bubble experience of the 1990s, and the more recent U.S.
experience teach these lessons. Public accounting serves the public interest if it works against the
chain letter that conflicted entrepreneurs, corporate management, investment bankers,
consultants, and even directors and auditors are tempted to perpetuate.
In reviewing the quality of accounting practice and proposing remedies, one must be
careful in identifying the source of the problem. There are three reasons for poor accounting.
First is the subversion of sound accounting principles. Many of the recent practices assailed in
the press – excessive restructuring charges, front-end revenue recognition, capacity swapping,
cookie jar reserving, and off balance-sheet financing, for example -- are violations of sound
principles of revenue recognition, expense matching, and debt recognition, not the failure of
principle. The press has appropriately focused on the conflicts of interest -- on the part of
directors, auditors, regulators and politicians – that lead these actors to subvert practice. The
second reason is the form of the regulation of accounting. I refer to “bright line” prescriptions
that encourage form over substance, the compliance with regulations rather than capturing the
economics. The debate about “true and fair” overrides is to this issue. But, third, poor practice
also comes from poor thinking as well as the subversion of good thinking and the gaming of poor
regulation. It is the question of poor thinking that I deal with. Many suspect practices are
4
sanctioned by GAAP. The FASB refers to a Conceptual Framework. Many of the practices have
been associated with quality names, like IBM, Microsoft, General Electric, Xerox, and Cisco, not
just once-quality names like Lucent and Enron. The actors involved may be conflicted, but is
there also a failure in thinking about what good accounting should be?
Coming to Terms with Accounting Quality
The notion of accounting quality is vague, often discussed in wishy-washy terms.
Demanding that financial statements reflect “economic reality” is not very helpful, a self-evident
statement. “Relevance” and “true and fair” are criteria that do not get us very far. We must be
concrete. It seems that accounting quality is in the mind of the beholder. Pro forma earnings
numbers – measures other than GAAP earnings – proliferated during the bubble, each advanced
by particular constituents as a relevant quality number for their purpose.
The trouble is that accounting is by fiat, a matter of design; accounting can be whatever
we want it to be. We cannot address the issue of accounting quality unless we agree on what
accounting is supposed to do. In formal terms, a premise must be stated. Accounting is a
utilitarian endeavor, so the premise pertains to the presumed user. Financial reports then take on
meaning as products supplied to a customer. The performance criterion must be: What would a
quality accounting product look like – to the customer? Answering this question forces the
concreteness we seek.
Shareholders as Customers
I see shareholders as the primary customers to whom financial reports are made. In the
parlance of accounting theory texts, I embrace the proprietorship perspective: prepare financial
statement for the common shareholders. Accounting theory texts contrast the proprietorship

5
perspective with the entity perspective (where the accounting is performed for the firm, without
respect for specific stakeholders).5 The entity perspective and proprietorship perspective lead to
quite different accounting, and some of the problems of GAAP result from a confusion of the
interests of the shareholders with those of the firms (as I will later explain).
The proprietorship view is hardly controversial. It is articulated in the fiduciary duties of
directors. Auditors report to shareholders. The Securities and Exchange Commission acts under a
congressional mandate to guard the interests of investors. Indeed, what CEO, company director,
or auditor would go to press and argue that the financial statements are not primarily reports to
shareholders? The notion that “we work for the shareholders” defines a conflict of interest for
these people.
The proprietorship perspective is the simplest and most natural of concepts: the
shareholders are the owners. The proprietorship perspective is at the heart of the “contracting
perspective” of accounting. It recognizes that accounting is concerned with the division of
property rights – between shareholders and bondholders, between shareholders and management,
and between shareholders and auditors -- and with the efficient contracting over those property
rights that is so essential for the functioning of an economy. Enforcing property rights is a
particular concern when ownership is separated from control. The entity view is silent on
property rights, about the division of claims to the firm, and so leads to non-discriminating and
even ambiguous accounting.
It is surprisingly difficult to get students to think in these terms. They think of the firm,
an entity view. How does a particular transaction affect the firm, they ask, rather than how it
affects shareholders. Students are not alone in their fuzzy thinking. U.S. senators lobbied the
FASB against stock compensation accounting. Indeed, the Council of Institutional Investors,

6
which represents shareholders, argued against the (unsuccessful) 1997 Levin and McCain Senate
bill to require stock options to be booked as an expense. The Council offered the common
argument that options were not an expense because firms do not use cash to award them.6 This
fails to distinguish the firm from the owners of the firm. The argument also fails to appreciate the
principles of accrual accounting, designed not account for cash flows but for value flows.
Accrual accounting recognizes there is no loss in shareholder value when an asset is purchased
with cash, but there is a loss as its value depreciates (with no cash flow). Indeed accrual
accounting recognizes depreciation on assets that are acquired with no use of cash – in exchange
for stock, for example. Similarly, stock options do not use cash, but they do reduce shareholder
value.
The “traditional accounting model” embodies the shareholder perspective. The last entry
in the accounting cycle is the closing entry to shareholders’ equity: after recording transactions
and adjusting entries to determine earnings (for shareholders), equity is updated. Updating
shareholders’ equity is the very essence of the traditional model. In assailing this traditional
model during the bubble, commentators advocated a redefinition of the corporation, and spoke of
the “boundary-less corporation” and of the “disintegration” of the traditional corporation.
Assets, of course, can be organized in many ways to generate value (for shareholders), in
strategic alliances, in joint ventures, and in special purpose entities, but the ultimate question
must be in terms of how the arrangements affect shareholders. What goes into that final closing
entry? The traditional model anchors us to this perspective.
The Modified Shareholder Perspective
A principle of democratic capitalistic societies maintains that public welfare is served by
well-functioning, efficient capital markets. The United States has chosen to achieve this

7
objective through regulation, so this principle underlies the SEC’s mandate. Public accounting is
a means to that end.
For public accounting, the strict proprietorship perspective needs to be slightly restated.
Shareholders are in the market to sell shares (either their own or through share issues by the
firm), and also sell other claims on the firm, like bonds. Their interest may be to promote stock
prices (and bubbles) by inflating earnings, and so sell at higher prices. Accordingly, accounting
that promotes shareholders’ interests may damage the public interest. The public interest insists
on focusing on shareholders’ claims, but also on the fair valuation of those claims for trading in
capital markets. In short, public accounting improves the efficiency of capital markets. The
attributes “true and fair” and “faithfully representing” are quality prescriptions in the public
interest, for promoting “fair” market prices. Accordingly, accounting quality must be discussed
not only in terms of shareholders’ interests, but also in terms of the fair valuation of those
interests.7
With this perspective, I turn to the analysis of the quality of earnings and the quality of
financial reporting.
The Quality of Earnings
I take the view that shareholders “buy earnings,” so earnings quality is a particularly
important feature of the financial reporting product. This idea, I think, is also not controversial.
Stated simply, shareholders buy firms to make money, and earnings are an answer to the
question, “What did I make this year?” To value their shares, investors ask, “How much does
the firm expect to make (for the shareholder) in the future?” Analysts forecast earnings as an
indication of how much a stock is worth. The market focuses on earnings as a primary summary

8
measure; if a firm misses an earnings projection, the market reacts accordingly. Accounting-
based valuation models formally justify the focus on earnings.8
Investors do not buy current earnings, of course. So the quality of earnings is, first and
foremost, a question of the quality of forward earnings. What earnings measure should an analyst
forecast? If he forecasts GAAP earnings, will he misvalue the firm because GAAP earnings are
deficient? The answer is yes, as I explain below.
The perspective of buying future earnings also frames the question as to the quality of
current (reported) earnings. Current earnings are an input to forecasting future earnings. Current
earnings are of good quality if they are a good indication of future earnings.
The controversy over pro forma earnings is to the point. Pro forma numbers have been
advanced for both forecasting (as in First Call) and for reporting actual results (in press releases).
Many of these numbers have been criticized as low quality earnings numbers -- EBS,
Everything but the Bad Stuff, was Lynn Turner’s quip when he was Chief Accountant at the
SEC. But, conceivably, one might justifiably focus on a pro forma number if GAAP earnings
are of poor quality. What pro forma forward number should a quality analyst forecast to
compensate for the deficiencies of GAAP? What current earnings number should he defer to as
an indication of future earnings power?
Experience in the recent bubble suggests a criterion for answering this question: earnings
cannot be used in a pyramid scheme to promote speculative beliefs (and promote bubbles).
Momentum investing generates momentum in stock prices and looks to momentum in earnings
to feed the momentum in stock prices. The pyramiding scheme works in two ways. First,
earnings momentum can be created in the purely mechanical way in which revenues are
aggressively recognized or expenses ignored. But, second, the momentum can be levered up as

9
managements engage in activities to enhance the pyramiding number, to the ultimate detriment
to the (unwary) investor.
Pro forma earnings that ignore interest expense, for example, promote a scheme
involving increased borrowing in order to report even more earnings before interest. (Off-
balance sheet financing is one vehicle for this scheme.) This bubble can burst dramatically as the
pyramiding leads to default. An investor who buys earnings before interest (ebit) makes a
mistake, and an analyst or corporate press release (like those of Amazon.com) that advocates
such a number leads the investor into the pyramid scheme. The premiere pro forma number,
ebitda, ignores depreciation (and taxes) in addition. Investment bankers like this number for their
comparable analysis in IPOs, for they like to create IPO bubbles. Ebitda ignores a real cost.
Factories rust and become obsolescent. Overcapacity in telecom networks is a cost. Ebitda
promotes substitution of capital for labor, creating excess capacity, but creating more editda.
Ebitda also provides incentives to capitalize expenses. WorldCom, while promoting ebitda as the
“gauge of vigorous growth,” capitalized operating expenses in a $3.8 billion fraud exposed in
2002. By shifting the expenses to depreciation, these operating costs never affected the ebitda on
which we were asked to focus. Combine ebitda with revenues recognized from (excess) capacity
swaps (as in the recent case of Global Crossing), and one has a telecom bubble going. But the
bubble bursts. (GAAP earnings recognizes interest, depreciation and amortization, of course, so
challenges ebitda schemes).
A Loose Anchor: The Poor Quality of GAAP Earnings
GAAP violates the shareholder perspective ways that promotes pyramiding. Let the buyer
of earnings beware. And let the dedicated fundamental analyst make adjustment.

10
1. Violating the Shareholders’ Interest: The Accounting for the Statement of Shareholders’
Equity
The statement of shareholders equity is not usually seen as a primary statement. It is not
even required in the United States, although a reconciliation of beginning to ending equity must
be supplied in the notes. The analyst cannot ignore this statement, however, for it is the statement
that focuses on the shareholders’ interest. It is also a statement where that interest is neglected:
the accounting is poor quality. I tell students that, if you don’t clean up this poor accounting, you
will misread the profitability and value the equity incorrectly.
The shareholder invests to add value. He or she therefore wants a clear distinction
between changes in equity that are due to investment and disinvestment (share issues, share
repurchases and dividends) from changes in equity that are from earnings that add value. GAAP
confuses earnings with share transactions.
Comprehensive Income and Dirty Surplus Accounting. A shareholder perspective demands
comprehensive income reporting: earnings must include all sources of value added to the
shareholder. In a narrow sense, comprehensive income reporting demands clean-surplus
accounting, that is, booking all recognized income to the income statement rather than the equity
statement. In a wider sense, comprehensive income reporting demands that all gains and losses to
shareholders be recognized in income. Earnings that exclude depreciation (discussed above) are
not comprehensive (under both an entity perspective and a proprietorship perspective). Earnings
that exclude interest expense (also discussed above) are comprehensive income to the entity
(under an entity perspective) but not comprehensive income to shareholders (under a
proprietorship perspective). Comprehensive income reporting is the key to avoiding pyramid
schemes in earnings.

11
FASB Statement 130, Reporting Comprehensive Income, has of course made a
significant step to remedy the confusion introduced by dirty-surplus accounting, but most firms
choose the option to present “other comprehensive income” in the equity statement. A firm can
thus cherry pick realized gains on its investment portfolio into GAAP net income and recognize
unrealized losses off the income statement. Maintained for a few years, this practice creates a net
income and earnings-per-share pyramid. The competent analyst evaluates the performance of the
whole portfolio. (FASB 130 also leaves deferred compensation in the equity statement, rather
than treating it as an asset [like any other deferred charge], so its amortization looks like a share
issue.)
Dirty-surplus accounting is often justified on the basis that it separates out items of a
more transitory nature from net income. But dirty accounting is not a clean solution to dealing
with transitory items, for many more are left in the income statement. Still, the point is well
taken: comprehensive income reporting must be accompanied by classifications in the income
statement that distinguish earnings components valued differently by shareholders.9 I take up this
point when discussing financial reporting quality.
Hidden Expenses. The loss of shareholder focus is nowhere more evident than in the accounting
for share issues that involve operations. Accounting for stock compensation, prevalent during the
bubble, is most disturbing. One of the fundamental principles in finance says that buying and
selling shares in an efficient market does not add value (they are zero net present value
transactions). Correspondingly, issuing shares at less than fair market value – selling a share for
less than it is worth -- loses value for the current shareholders. Comprehensive income must
include the loss if it is to report faithfully value gained and lost for shareholders.

12
GAAP violates this precept. Stock options are, of course, a legitimate way to motivate
management, the shareholders’ employees, to produce revenues. But expenses must be matched
against revenues to report (comprehensively) the net gain to shareholders. The difference
between the market price and exercise price upon exercise of options is the expense to the
shareholder and compensation to the employee. The employee certainly sees it as such, but not
GAAP. The IRS sees it as such, giving a tax deduction to the issuer (for non-qualifying options),
but not GAAP. By not recognizing the expense, but recording the tax benefit, GAAP is perverse.
Firms report an increase in shareholders’ equity from the exercise of options, rather than a net
decrease, with the tax benefit recorded (inappropriately) as an issue of shares (in paid-in capital).
Further, the benefit is included in cash from operations ($2.5 billion for fiscal 2000 for Cisco,
$5.5 billion for Microsoft, $0.8 billion for Intel, etc.). So a tax benefit is recognized in cash flows
without the matching grossed-up expense. Firms boost reported cash flow from operations by
issuing options, so if an analyst who is doubtful about the integrity of accruals and defers to cash
from operations, she finds that number corrupted also.
Clearly, this GAAP accounting promotes pyramiding. A firm that substitutes stock
compensation for cash compensation increases reported earnings, an “egregious” way to inflate
earnings, as Jeffrey Skilling, former Enron CEO, testified to Congress.10 Given the accounting
for tax benefits, a firm can also pyramid cash flow from operations.
The FASB, of course, attempted to deal with the problem in Statement 123, Accounting
for Stock-Based Compensation, but was frustrated by politicians who served interests other than
shareholders. The International Accounting Standards Board (IASB) proposed a rule in July,
2002 requiring the expensing of stock option compensation. Both boards took the position that
an expense should be recognized at grant date (recommended but not required by the FASB). But

13
grant date accounting does not solve the problem, even if firms follow Boeing Company and
Winn-Dixie Stores in recording the expense to income (as many are now doing). Shareholders
lose at grant date only in expected terms, requiring recognition of a contingent liability. If
options lapse, no value is lost. (One can imagine firms reporting a pro forma number before
compensation expense with the argument that options may never be exercised.) Shareholders
lose more in (expected) value as options go into the money.
Under Statement 123, there is no settling up: if options lapse, the expense recorded at
grant date is not reversed, leaving a permanent difference between price and book value; if
options are exercised, no further cost to shareholders is recognized. Further, if the tax benefit
from exercise is included (appropriately) in comprehensive income, income is actually inflated in
the exercise year. The fudge, of course, is to treat the tax benefit as proceeds from the share
issue, but that treatment ventures on the absurd (and certainly confuses value added from
operations with share issues).
The appropriate accounting (for shareholders) recognizes a contingent liability at grant
date for the amount of the option value (and a corresponding deferred compensation asset), then
marks the liability to market as the option goes into the money, with a final settling up to
expense on exercise. (But see point 6 in this section below.) Amortization of deferred
compensation follows the principle of matching costs to revenue (over a vesting period, for
example). This accounting is, effectively, that for Stock Appreciation Rights that differ from
stock options in form, but differ little in economic substance. The wealth realized by
management from options in recent years, but not reported in the accounts, is appalling to the
new-technology shareholder who often was left with nothing. The failure was a cultural
14
phenomenon. Neither Congress, regulators, corporate boards, nor accountants kept in mind the
notion of faithfully reporting to shareholders.
Congress may be coming to its senses on stock compensation, but a similar criticism
applies to GAAP accounting for all contingent equity contracts – options, warrants, convertible
bonds, and convertible preferred stock. Consider the case of a convertible preferred share paying
no dividends but with generous conversion terms. From the common shareholders point of view,
preferred stock is debt. However, no expense is recorded in income available to common before
the conversion and no loss is recorded under GAAP on conversion. So it appears that the
borrowing came with no cost. Textbooks once talked of the “market value method” for
conversions, a method that records the loss to shareholders. GAAP practices the “book value
method.”
Put Options. A particular abuse arises when firms – like Microsoft, Intel, and Dell – write put
options on their own stock. Dell, in effect, runs two types of operations, one involving computer
sales, the other trading these options. For a few years, these options lapsed, so shareholders
gained. GAAP, however, reports the gains as an equity issue, not comprehensive income. But for
fiscal year ending February 2, 2002, options were exercised, and Dell repurchased 68 million
shares at an average price over $44 (a total of $3.0 billion) with the stock trading around $25 (a
total of $1.7 billion), for loss of about $1.3 billion, not recorded. Del recorded the full $3.0
billion as a stock repurchase; the appropriate entry records the repurchase at market value of $1.7
billion, with a loss recorded for the difference between market value and the amount paid for the
repurchase. That is, apply the “market value method.” Shareholders lose when the price of their
shares drop, but the firm levers the losses if it has written put options. However, the loss is not
reported under GAAP. Options of this type may serve as hedges (against exercise of employee

15
stock options for example), but the effect of the outcome of both positions should be part of
comprehensive income.
2. Debt versus Equity
The FASB has been grappling with the issue of defining debt and equity. Their problem
seems to arise because the Conceptual Framework defines a liability as arising from the entity’s
obligation to transfer assets to others in the future. Correspondingly, equity is defined as the
residual interest in the assets of the entity that remains after deducting liabilities. The definition
takes an entity view. Settling contingent equity claims with the issuance of common shares does
not require a use of the firm’s assets, so the entity view does not see a contingent equity as a
liability. Preferred stock is not debt under an entity view. The holders of outstanding common
shares – with their proprietary perspective -- see it differently. For valuing the common share, a
liability (to the common shareholders) arises from an obligation, created by the firm
(management), to transfer shareholder wealth to others.
Contingent Equity Securities. Settling contingent equity claims involves a loss to shareholders
because shares are issued for less than fair market value. Prior to settlement in common shares,
these claims are contingent liabilities, to be booked as such if they satisfy measurement criteria
(of the type in FASB Statement No. 5). The liability for convertible debt and convertible
preferred stock is understated by GAAP (and losses on conversion are not recognized). Secured
equity-linked loans (sometimes classified as nonrecourse!) are similar, as they call for a
contingent issue of stock, possibly at much reduced share prices from when the loan was
negotiated, resulting in a loss for shareholders.
Put options on the common stock also create a contingent liability for common
shareholders usually not recognized by GAAP. At the end of its 2002 fiscal year, Dell had put

16
obligations for 51 million shares at an average striking price of $45. With the stock trading at
$26, these options were under water by over $1 billion. Unless hedged, this represents a liability
for the common shareholder to purchase stock well below market price. If a firm sets up an off-
balance sheet partnership, issues stock to the partnership along with put options on the stock (as
with some Enron partnerships), and the partnership, in exchange, assumes some of the firm’s
debt, it appears that the firm has reduced its obligations. GAAP obscures the indebtedness of the
common shareholder, so promoting pyramiding of off-balance sheet debt. Appropriate
accounting places the debt – the put obligation -- back on the balance sheet as the put options go
into the money and the shareholders become liable.
Knowledge Liabilities. During the bubble, accounting was faulted for not recognizing
knowledge assets, particularly for new technology firms (more on this below). But it was often
overlooked that GAAP is remiss in not recognizing knowledge liabilities. Knowledge resides
with the human capital of individuals; it is not necessarily the asset of the firm, nor the
shareholders. Firms acquire knowledge by buying it, from engineers, scientists, and inventors,
and knowledge must be paid for. To what extent does Microsoft’s knowledge belong to the
shareholders or to the employees?
In recent years, firms acquired knowledge by offering stock options. From the
shareholders’ perspective, employee stock options create a liability to issue stock at less than
market value – to pay for the knowledge from which shareholders benefit -- and the amount of
this liability increases as options go into the money, to be settled upon exercise. GAAP does not
recognize this liability (and the corresponding knowledge cost). Microsoft surely has knowledge
assets, but its offsetting option overhang – its knowledge liability – has been enormous. What is
its net knowledge asset?

17
3. Prices in Financial Statements
If accounting is to challenge price bubbles, it must not be influenced by bubble prices.
Investors look to financial reports to assess whether stocks are fairly priced, so want measures
that are independent of prices. If the accounting reflects that pricing – particularly inefficient
pricing – the investor loses an anchor. How well does GAAP perform on this criterion?
Mark-to-Market Accounting for Equity Investments. Mark-to-market accounting defers to
market prices to measure assets in the balance sheet. For assets that involve borrowing and
lending, marking to market is reasonable, for most people see debt securities (traded in liquid
markets) as fairly priced. (Thinly traded instruments raise questions about “fair value,” of
course.) For equity securities, mark-to-market is appropriate for trading securities where the
trader is making money from betting on price movements. But for investment in the operations
of other companies, mark-to-market is dangerous. Witness the large investment gains reported by
firms such as Cisco and Intel during the bubble of 1997-99, compared with the losses reported
during 2000-01 as the bubble burst. Better to report shares of profits in those operations, using
the equity method or proportional consolidation. (Many of the firms for which large gains were
recognized during 1997-99 were reporting GAAP losses that anticipated subsequent outcomes.)
Cost basis for held-to-maturity securities avoids the problem, but then the statements give no
indication of the performance of investments.
Pension Assets Gains. GAAP pension expense is net of gains on pension assets. The gain is
calculated as the expected rate of return on the assets multiplied by the market value of pension
assets. If the market values of pension assets are bubble prices, earnings reflect the bubble. If a
firm’s pension fund holds the firm’s own shares (they are, by law, limited to 10 percent of the
fund), pension expense even includes gains in the firm’s own shares. An unperceptive analyst

18
who tries to price a firm on the basis of GAAP earnings gets a bubble price; the circularity feeds
the bubble. The pyramiding is exaggerated if firms also increase expected rates of return because
of recent realized return experience in their pension portfolios (as, indeed, they have). During
the late 1990s, pension gains were a significant part of earnings reported by firms like General
Electric and IBM, due partly to bubble prices and increases in expected rates of returns.11 These
gains proved to be unsustainable as the bubble burst.
4. Gains and Losses from Trading in the Firm’s Shares
Shareholders make money by buying and selling the firm’s shares in the stock market.
But the firm also buys (repurchases) and sells (issues) shares in the stock market on behalf of the
shareholders. As a shareholder, I can trade shares myself, or I can have my fiduciaries in the firm
do it on my behalf.
If markets are efficient, issuing and repurchasing shares does not add value. Just as a
shareholder trading in an efficient market does not expect to earn an abnormal return, so a share
transaction by the firm is a zero net present value transaction. Firms add value only from
business operations. However, inefficient markets provide the opportunity to issue shares at more
than fair value and repurchase them at less than fair value (and to make money from options on
the stock).12 Stock market bubbles provide a particular opportunity.13 With inside information
and anonymous trading this ability is enhanced, even if stock prices are efficient with respect to
public information.
GAAP treats all share transactions at market value as if they were at fair value (even
those issued at less than market value in exercise of employee stock options!), so comprehensive
income does not reflect gains or losses from these transactions. This is not to suggest that GAAP
should require such recognition – the measurement problems are considerabe – but it does mean

19
that we must recognize an imperfection in the accounting. Residual earnings and earnings growth
valuation models, as applied in practice and in academic research, forecast GAAP earnings.
These models misvalue the equity because they ignore potential gains and losses on these
transactions; the shareholder who buys future GAAP earnings (and an analyst who forecasts
GAAP earnings) misses an aspect of value that can be generated (or lost) for shareholders.14
Accounting regulation and disclosure mandates are designed to minimize the ability of
firms to make gains from share issues and repurchases, by promoting efficient markets in which
these trades are at fair value. Poor accounting and disclosure enhances that ability: use poor
accounting to promote earnings and price momentum, then issue shares. The sequence leads to
even more degraded earnings because the gains from share issues are not recognized.
5. Accounting for Value from Mergers and Acquisitions
A case in point is the issue of shares in mergers and acquisitions. Firms potentially add
value in acquisitions in three ways. First, so-called synergies come into play. In an efficient
market this is the only source of value. But, second, if the acquiree’s shares are underpriced in
the market, the acquiring shareholders add value; they find a bargain. Third, if the acquirer’s
shares are overpriced in a deal involving an exchange of shares, the acquiring shareholders add
value; they use their own overvalued shares as “currency” in the transaction. The exchange ratio
captures all three features.
GAAP earnings do not include the last two sources of value, reasonably so given the
measurement difficulties. The effect must be anticipated through future denominator effects on
earnings per share rather than numerator earnings. There are, however, second-order effects on
GAAP earnings. Firms make acquisitions during bubbles, as the spate of acquisitions in the late
1990s attests. If a firm pays a bubble price for another firm, it overpays, and application of FASB

20
Statement 142 (in good faith) subsequently recognizes the overpayment with an impairment
charge against earnings. However, if the acquiring firm makes the acquisition with its own
overvalued stock as currency, such that the exchange ratio is the same as if both shares were
efficiently priced, it did not overpay, yet the impairment charge is the same as if the firm had
overpaid. Indeed, acquiree shareholders might demand a higher price if they perceive the
currency they are to receive to be overvalued and wish to remain long-term shareholders, so the
impairment then represents a decline in value of the acquirer’s own stock. Impairment of
goodwill is appropriate from an asset measurement (balance sheet) point of view, for the
accounting has booked a bubble price into the balance sheet. But the loss on impairment is not
necessarily a loss of shareholder value. What are we to make of AOL Time Warner’s expected
$54 billion write off of goodwill last year? Is it not possible that, in the takeover of Time Warner
by AOL during the bubble, AOL shares (at over 100 times earnings at the time) were more
overvalued than those of Time Warner? Sorting out, from the accounting, whether that merger
was a successful one is not an easy task. It is hard to find an anchor. Nor is the appropriate
accounting remedy clear (at least to me).
6. Back to Employee Stock Options
The issuance of stock to employees in exercise of stock options is a loss to shareholders if
the issue is at fair value, and should be recognized as such, as argued above. Suppose, however,
that options are exercised at bubble prices? If the market price exceeds fair value, not all of the
difference market and exercise prices of shares issued amounts to a loss to shareholders.
Expensing the difference as compensation builds the bubble into the expense. The number of
shares sharing in future earnings is the same as if they had been exercised with market prices at
fair value. One might argue that the issued shares at bubble prices could have been used to raise

21
cash (to pay wages, for example), so an opportunity cost arises from the loss of a gain from a
share issue. But this assumes a limit of the supply of shares that can be issued, or some elasticity
of stock price with respect to the supply of shares.
The dilemma for measuring the cost of stock compensation is clear. Should the
accountant try to develop cash equivalent compensation measures (without reference to prices)
as a matter of accrual accounting? Recognizing contingent liabilities for the outstanding option
overhang based on bubble prices also brings bubble prices into the financial statements. Take
this point, together with the point above on impairment of goodwill purchased during bubbles,
and one concludes that accounting has inherent difficulty in dealing with value effects on
shareholders during bubbles. That’s a shame, because we want accounting to puncture bubbles.
7. GAAP Inflates Rates of Return and Earnings Growth
Investors buy earnings, and they pay more for earnings growth. They also look for high
rates of return on investment. But they should only pay for earnings growth and returns that add
value. Accounting, however, has two features that also induce earnings growth and rates of
return, with no value added: conservatism and leverage can grow earnings. What follows is not a
recommendation for changing GAAP, but a commentary on the features on GAAP that an
investor must be aware of in using the product. Caveat emptor.
Conservative Accounting. Conservative accounting – maintaining low asset values in the
balance sheet – is sometimes view as quality accounting. But consistent application of
conservative accounting creates higher book rates of return and earnings growth with no
economic justification.15 Pooling accounting for acquisitions (no longer allowed) is an example.
It creates more earnings on low book values, and, if perpetuated with more and more poolings,
creates an earnings pyramid that may not be related to value. But any accounting method that

22
keeps assets off the balance sheet, or carries assets at low amounts, can result in pseudo growth
(because there are fewer assets to expense later). The investor is protected from misreading this
growth by filtering forecasted rates of return and earnings growth through a residual income
valuation model or an Ohlson and Jeuttner-Nauroth earnings growth model, for these models
accommodate this feature of the accounting. But, without that discipline, the investor can
misread growth.
Conservative accounting has another feature that can have adverse effects on earnings
quality. The unrecorded assets are effectively hidden reserves that can be released to inflate
earnings temporarily by slowing investment. The effect is perverse: less investment creates more
earnings. LIFO valuation of inventory is conservative accounting, the LIFO reserve is an
unrecorded asset, and the reserve can be used to inflate earnings with LIFO dipping. The same
phenomena can arise in any application of conservative accounting with immediate expensing or
rapid depreciation.16
Leverage. Standard formulas show that increased borrowing relative to equity typically creates
higher return on equity and creates earnings growth.17 Yet, if borrowing is a zero net present
value activity, value is not created. Add stock repurchases (at fair market value), financed by
borrowing, and one levers up expected accounting returns and growth in earnings and earnings-
per-share considerably.
Investors must be careful in buying the higher expected earnings from leverage. They buy
higher earnings but take on higher risk. The extensive stock repurchases financed by borrowings
in the 1990s created earnings growth but also riskier balance sheets. Financial reporting can help
the investor isolate the effect of leverage by clearly separating financial activities from operating
activities in the financial statements, for it is growth in operating income (before the effect of

23
financing) on which the analyst needs to focus. For example, interest is a financing expense, so
the GAAP practices of capitalizing interest on construction into operating assets, aggregating
interest income with operating income, and including interest in cash from operations are not
helpful.
A Secure Anchor: The Good Features of GAAP Earnings
1. Prices not in Financial Statements
During the technology boom, commentators who justified high stock prices relative to
book values assailed accounting for not recognizing the intangible assets of the Information Age.
One saw calculations where analysts measured the value of intangibles as the difference between
the value of tangible assets (with some premium applied) and (bubble) market values for the
whole firm. With the exceptions noted above, GAAP does not make this mistake; GAAP does
not bring prices into financial statements. Quality accounting recognizes that market prices are
inherently speculative, for they are based on beliefs about the future. Losses reported for
dot.coms while stock prices soar must be respected.
2. Revenue Recognition and Matching
Shareholders buy future earnings and thus speculate as to what those earnings might be in
setting stock prices. But sound accounting understands that the shareholder is best served if you
don’t mix what you know with speculation about what you don’t know. This restatement of the
reliability criterion, embraced under the FASB’s Conceptual Framework, is also a maxim of
fundamental investing that separates information by reliability class.18
Sound accounting recognizes that a firm only adds value for shareholders if it, first, gets
customers and, second, receives more value from customers than is given up in servicing
customers. Shareholder value is added in the stock market, but the source of that added value is

24
value added from the firm’s trading with customers in product markets and suppliers in the input
markets. It is this source of value that the shareholder wants to understand: how much was
earned this period from trading with customers and suppliers? The investor uses this hard
information, uncontaminated by speculative information, to speculate on the firm’s ability to
generate earnings from customers in the future.
We are talking, of course, of revenue recognition and matching, the hallmark of the
traditional financial reporting model. Regrettably, the principle has been abused in practice.
Excessive write-downs, merger charges, cookie jar reserving, front-end revenue recognition, and
under- or over-estimating of allowances for credit losses, warranties, and deferred tax assets (to
name a few) – with the associated intertemporal shifting of earnings – are failures of
management, directors, and auditors in applying basic accounting, not a failure of principle. Our
auditing and corporate governance institutions need to enforce unbiased revenue recognition and
matching. Society fines and even incarcerates transgressors against the revenue recognition
principle, so strong is the imperative.
This view maintains that quality earnings are an imperfect indication of price. Earnings
report value added from trading with customers. Stock prices presumably recognize this value
added; however, prices also speculate on value to be added from future customers. Thus a quality
measure of earnings is not necessarily that which correlates perfectly with stock returns (as many
academic studies would have us believe), for correlation with returns is, in part, correlation with
changes in speculative beliefs.
These move to more and more “fair value” accounting -- currently under discussion
among standard setters – should proceed with care, particularly for non-financial institutions.
The danger is that we lose the information from revenue realization and matching and substitute
25
(possibly bubble) market prices or biased and imprecise fair value estimates. Historical cost
accounting provides information (about the profitability of trading with customers) to inform
about prices. Fair value accounting often gets the information from prices, so may destroy the
ability to inform about prices.
3. Accrual Accounting
Accounting does, of course, invite some speculation in the estimation of accruals that are
needed to match revenues with expenses. This is the tension in earnings measurement: quality
earnings require accruals, but accruals are estimates that can be poor quality. Auditors and
directors are a check (ideally), but some expenses – like amortization and depreciation – are
intrinsically hard to measure. For some costs, there may be no accounting solution. Expensing
R&D expenditures, for example, results in (gross) mismatching. But to capitalize and amortize
may just introduce arbitrary amortizations into the matching. The reliability criterion overrides.
Be it as it may, accounting quality is the less for the inability to measure.
Measurement problems call for responses. First, accountants must work on the
technology of measurement to improve the product. Introducing “technical feasibility” criteria to
the capitalization of R&D, like those for software development, and developing schedules for
R&D amortization rates from experience, like those for tangible assets, are areas worth
exploring. Second, consideration should be given to deferring to management and auditors, who
know more of the operations, to come up with objective measurements (of amortization rates, for
example). This requires a certain faith in the willingness of shareholders’ agents to provide a
“true and fair” view, but the FASB seems to have taken that leap in relying on impairment
testing of goodwill in FASB Statement No. 142. “Bright line” rules are a last-resort response to
the failure of auditing, for those rules (for amortization, for example) often do not reflect

26
economic reality. Third, financial disclosure should include information to help evaluate
accruals -- indicating, particularly, the effect on current earnings of changes in estimates for the
past accruals.19 Fourth, earnings should be supplemented with disclosures of other information
that helps shareholders forecast the future earnings they are buying. This is the substance of
“value reporting.” It, too, is necessarily speculative. Fifth, analysts and investors must recognize
the accounting imperfections, and understand where accounting ends and (speculative) analysis
begins. They must appreciate what we know and what we don’t know.
4. Knowledge Assets
The traditional financial reporting model was assailed during the bubble for not
recognizing the value of knowledge assets. No one knows what the value of a knowledge asset is
(or even precisely what it is!). One suspects that commentators were imputing these assets from
bubble prices. Recognizing the value of these assets in the balance sheets would be pure
speculation, and subsequent fuzzy amortization of a fuzzy number would destroy information in
matching. Do we really want to entertain the idea that Dell Corporation should recognize the
value of its supply chain, its direct-to-customer strategy, its culture and organization on its
balance sheet – and then amortize these assets to income? Or do we want to relegate such notion
to fantasy, ill-conceived ideas of a bubble mentality? Do we rather not want to stick to the
(Industrial Age) notions of revenue recognition and matching so that the value of such assets is
recognized when a firm gets a customer and the associated expenses are also recognized to get a
measure – accounting income—of value added from these assets?
Financial statements actually do report on knowledge assets, not in balance sheets, but
(eventually) in income statements. Knowledge assets have value because they lead to earnings
from customers. Earnings are reported, but only as customers are booked. Accounting confirms

27
whether investor’s speculation about the value of knowledge assets is justified, but does not
engage in the speculation. Baruch Lev has it correct: one infers the value of knowledge assets
(imperfectly) from earnings, not from prices.20
The Quality of Financial Reporting
Financial statements report details beyond earnings calculations – line items and footnote
information, in particular. However, the focus on buying future earnings also guides the broader
product features of financial reporting. Current earnings cannot be a sufficient statistic for
forecasting future earnings. Indeed quality earnings, if they are to be comprehensive (and so
include all effects of operations on the shareholder), inevitably contain transitory items.
Accordingly, financial reporting is judged on how well it aids the investor to determine how the
future earnings she is buying will be different from current earnings. In the parlance of analysts,
quality financial reporting identifies sustainable earnings.
GAAP is Forward Looking
The Big-5 letter after the Enron collapse echoed the complaint during the bubble that
accounting is “backward looking.” The words “historical cost” suggest so, but research, from
Ball and Watts (1970) and Beaver (1970) onwards, has consistently shown that current earnings,
on average, are an indicator of future earnings; by following the revenue recognition and
matching principle, accrual accounting allocates revenues and costs to periods to yield a measure
of current income that forecasts underlying profitability for the future. The losses of dot.com
firms were forward looking; those losses reported that, in the absence of further information
about improvements in profitability, the dot.com business model was very speculative. Further,
that information would have to be hard enough to predict accounting profits within a couple of
years.

28
Of course, current earnings are not a sufficient statistic for future earnings. But research
has consistently shown that wider financial statement analysis aids in forecasting. In effect, the
wider information in financial statements provides a commentary on the quality of earnings and
serves to correct a forecast of future earnings that relies on current earnings alone. See Ou and
Penman (1989), Lev and Thiagarajan (1993), Abarbanell and Bushee (1997), Lipe (1986), Sloan
(1996), Fairfield and Yohn (2001), Fairfield, Whisenant and Yohn (2001), Chan, Chan,
Jagadeesh and Lakonishok (2001), Thomas and Zhang (2002), and Penman and Zhang (2002a,
2002b) for examples.
Financial statement analysis aids forecasting because of a (quality) structural feature of
the financial reporting model. Focusing on operating income (that is, net income adjusted for the
after-tax effect of net borrowing in financing activities), it is always the case, if income is
comprehensive, that
Operating income = free cash flow + change in net operating assets.
This relationship is implemented through double entry accounting: one cannot affect earnings
without affecting something else in the financial statements; accounting for earnings leaves a
trail, and sound financial analysis follows that trail by investigating the investments and accruals
that determine the growth in net operating assets. If a firm reports unusual growth in net
operating assets or unusual changes in its components (by type of assets and by cash versus
accrual components) its earnings are likely to be of poor quality. Most of the research in the
above papers analyzes one aspect of changes in net operating assets. Figure 1, from Penman and
Zhang (2002b), shows that, synthesizing the financial statement analysis in many of the above
papers, one predicts differences in one-year ahead return on net operating assets (before

29
extraordinary and special items) of 4.1 percent on average (that’s large!) for firms initialized on
current return on net operating assets. GAAP statements are forward looking.
Indeed, research shows that such analysis predicts stock returns. That is (a risk
interpretation aside), investors do not appreciate the forward-looking information in the financial
statements. The traditional financial statement model is richer than it is given credit for. How
richer might it be if there were adequate disclosure to carry out an appropriate analysis?
GAAP Disclosure
Unfortunately, disclosure in U.S. financial statements frustrates the analyst. Here are
some consumer complaints and requests:
• The income statement is a disgrace. Often it is reduced to a few lines.
• There is little detail on S G & A expense. This item is typically 20 percent of
sales, but there is little breakdown on the multitude of sins that it covers. Firms
even credit gains from asset sales to S G & A. It would seem a simple matter to
report executive compensation, gains on pension fund assets (distinguished from
service costs), gains and losses from asset sales, and reversals of restructuring
charges (to name a few) as separate lines on the face on the income statement.
With before-tax operating profit margins typically less than 12 percent of sales, an
investor’s request to report any expense greater than 2 percent of sales -- along
with more sensitive lesser items such executive, director and auditor
compensation -- seems reasonable.
• An analysis of net revenue, a reconciliation of gross revenue to net revenue, and a
breakdown of booked and deferred revenue is needed.

30
• Highlight operating income, cleanly distinguished from financing income, so the
reader can see where growth is coming from. Correspondingly, operating and
financing assets and liabilities should not be aggregated, so the reader can
determine the return on operating assets.
• Transitory items need to be clearly displayed on the income statement, so the
reader can get an understanding of core operating earnings.
• The obscurity introduced by consolidations is troubling. The reader cannot get a
clear picture of how assets and liabilities are structured – through joint ventures,
alliances, special entities, R&D partnerships and other “networking”
relationships. Transparency can be improved with organizational diagrams,
disaggregated reporting, and proportionate presentations, for example.
• A presentation of how current earnings are affected by changes in estimates in
prior periods is needed. This table would include amounts bled back to earnings
from reversals of restructuring charges, dipping into cookie jar reserves, reducing
deferred tax asset allowances, and bad debt and loan loss experience relative to
prior estimates.21
• Also needed is a discussion of accruals for which there is particular uncertainty
and a ranking of accrual estimates by their perceived uncertainty, giving the
reader a better sense of what numbers are “hard” and “soft” and a better
appreciation of the likelihood that earnings will be sustainable.
• Include a “quality of earnings statement” by management, supplemented by a
statement of significant uncertainties by auditors, would place the obligations for
quality reporting where they belong.

31
Relative to the difficult problems of accounting measurement, these remedies are easy to
implement for a manager or auditor who has the shareholders’ interest at heart and a regulator
desiring to promote efficient capital markets.
Cash Flow Reporting
As accrual accounting contains tentative estimates (and can be manipulated), investors
often defer to cash flow for confirmation. High accruals-to-cash flow raises a red flag; indeed,
Sloan (1996) shows that accrual components of income are less persistent than cash flows.
Unfortunately, GAAP rules result in confused measures of cash from operations and free cash
flow from operations in the cash flow statement.
GAAP cash flow from operations includes interest, so it confuses cash flows from
operations with the cash flows from financing operations. Under a recent EITF ruling, GAAP
cash flow from operations includes tax benefits from exercise of employee stock options that are
not even in net income. As discussed above, there is no recognition of the matching implicit
cash compensation expense from the exercise that produced the tax benefit. Under GAAP, cash
from investment activities and thus free cash flow (cash from operations minus cash investment)
include investment in and liquidations of financial assets. Thus a firm that sells its T-bills
because cash from operations is declining is seen as increasing free cash flow from operations.
Trading in financial assets (and paying interest) are financing activities and should be classified
as such. For elaboration, see Nurnberg (1993), Ohlson (1999), and Penman (2001a, Chapter 10).
Conclusion: The Tale of a 1990s Firm
To conclude, consider the hypothetical case of a 1990s firm that summarizes many of the
points made above. That firm began the 1990s announcing a transformation from an old
economy manufacturing company to an information age company. Value was to be “generated”
32
from “knowledge” and “brand building.” The stock market greeted the large estimated
restructuring charges during the recession of 1990-1991 as positive steps for transforming the
company. The firm invested in brand building with an intensive two-year advertising campaign.
It boosted research expenditures, but through an off-balance sheet R&D shell to which the firm
sold expertise, so recording revenues. To acquire expertise, the firm attracted a team of
chemistry and engineering PhDs and marketing MBAs with successful careers on Madison
Avenue, with grants of stock options rather than cash, to “share in the upside potential of this
dynamic firm.” Management was also compensated with stock options. Investment bankers
advised financing with convertible bonds and an issue of preferred stock, with a low dividend
rate but generous terms for conversion to common stock, to “minimize the impact on earnings.”
The traditional well-funded defined benefit plan was retained and the valuation allowance on the
resulting deferred tax assets was increased at the time of the restructuring. As a matter of
accounting policy, the firm decided to take a conservative stance. Revenue recognition would be
delayed as much as possible (with deferred revenues recognized), and allowances against
revenue would tend towards the high end. The CEO, supported by the audit committee and
board, demanded one thing: “We will never engage in aggressive revenue recognition.”
In terms of delivering GAAP earnings, the strategy paid off well, and the market
rewarded the reported earnings growth handsomely, increasing the P/E ratio from 13 in 1993 to
28 in 1996 and 37 in 1999. Ebitda, the pro forma number that analysts preferred and the firm
emphasized in press releases, grew even faster. Privately, management admitted that the stock
price was benefiting from a bubble, but felt they were to be congratulated for “unlocking value.”
They would do all in their power to satisfy the market’s expectations. They stuck to their non-
aggressive revenue recognition stance. But, to further earnings growth, they made numerous

33
acquisitions, increasing earnings further. Some of these acquisitions were for less than 20 percent
ownership interest and were subsequently marked to market, some were poolings, and others
were purchases with a write down of the acquirees’ tangible assets prior to merger and sizable
merger charges. Many of the acquisitions were of firms with forward P/E ratios over 80 when the
firm’s own stock traded as less than thirty times forward earnings. Earnings growth was
supported by a reduction in advertising outlays after the initial campaign, bleeding back the
earlier restructuring charges, and recognizing some previously deferred revenue. Noting that
IBM increased its required return on pension plan assets to 10 percent from 7.0 percent in the
early 1980s (even though interest rates had fallen), the firm did likewise. It also invested excess
cash in the pension fund, to over-fund a plan where key employees were beneficiaries. Combined
with the large appreciation in the value of pension assets from rising stock prices (partly due to a
10 percent holding of the firm’s own shares), 24 percent of pre-tax earnings were gains on
pension assets, and pension expense was negative. With the rising stock market, the firm sold off
investments where gains had been highest, reporting these realized gains in “other income.”
Unrealized losses were cherry-picked into other comprehensive income in the equity statement.
Gains on asset sales were credited to SG&A expense. The firm began a regular program of stock
repurchases, financed by borrowing, increasing earnings-per-share growth. These repurchases
were at P/E ratios over 30.
The firm met analysts’ earnings expectations every quarter from 1995 to 1999. The
quarterly conference call was a joy to all as the firm proudly pointed to the drop in SG&A
expense and compensation expense as a percentage of sales. Analysts at the Wall Street firms
maintained strong buy ratings, pleasing their investment banking colleagues who fought hard for
the firm’s aquisition business. Talking heads on the financial networks raved. They pointed to

34
the firm’s “knowledge assets,” its “structural capital,” and its “entrepreneurial culture.”
Managers reinforced this chatter with talk of the “the weightless corporation” that de-emphasized
tangible assets, and of the “disintegrated corporation.” They were invited to speak at academic
conferences on intangibles where they were gratified to see academic papers that showed stock
returns correlated with clicks and page views. More stock options were granted as a reward for
these achievements. Graduating MBAs saw the firm as a place to be. Some commentators
pointed to the large option overhang, but the firm responded by pointing out that it was
repurchasing stock, albeit at very high prices, to maintain shares outstanding at the same level,
“to prevent dilution.” So confident were the managers that they wrote put options on the firm’s
stock to private investors for which the firm received handsome premiums. With encouragement
from its bankers, a special entity was set up to assume some of the firm’s growing debt from
financing stock repurchases. This entity was issued stock in the firm, in part consideration for a
note, with put options on the stock to protect the entity “in the unlikely event” of the firm’s
condition deteriorating.
The story does not have a happy ending. The decade ended and the stock market bubble
burst. Sales growth began to slow. The firm’s auditors insisted that residual values on sales-type
lease receivables, predicated on the assumption that the technology leased would endure, be
revised downward. In 2000 the firm maintained some growth in earnings on a decline in sales by
booking realized gains on some appreciated investments, by reducing deferred revenue, and
revising its deferred tax asset allowance. Managers also pointed to “robust” cash flow from
operations (though closer inspection would reveal that 45 percent of this cash flow was tax
benefits from the exercise of employee stock options). The market value of the firm’s equity
35
investment portfolio fell dramatically as the bubble burst, but, in accordance with GAAP, the
unrealized losses were booked, not to income, but to equity.
But, in 2001, the put options were called after a dramatic drop in the firm’s stock price.
To raise cash for the consequent stock repurchase, the firm was forced to sell off some losing
investments, bringing previously recorded unrealized losses into the income statement. The
considerable debt raised to finance share repurchases was downgraded, increasing borrowing
costs. Equity-linked loans were called. The obsolescence that had led to the write-down of lease
receivables, also caught up with inventory that was also written down. Following most other
firms, the expected return on pension plan assets was reduced because of lowered expectations of
stock returns, so reducing earnings.
With the drop in stock price and their options under water, employees who had the
knowledge that was key to the firm’s product development began to leave. In response, the firm
repriced some options, taking a charge to earnings which, along with increased cash
compensation to replace options, depressed earnings further. So desperate was the CEO to retain
key employees, he promised privately that, to avoid repricing charges under FASB Interpretation
No. 44, he would “talk the stock price down” with bad news over a six month period, so
establishing a low strike price for fresh option grants while honoring the GAAP “bright line.”
(U.S. Senators who had vigorously opposed the FASB’s attempt to account for stock options in
the early 1990s were said to be “disturbed” when this practice was mentioned in subsequent
congressional hearings.) In the second quarter of 2002, the firm took a large impairment charge
on goodwill acquired during the 1990s, followed by a large restructuring charge in the third
quarter as auditors realized prior depreciation charges had been too low; obsolescence was a
36
factor, but the firm had also invested in too much capacity through its acquisitions and its pursuit
of ebitda.
This is partly a tale of management folly. It is partly a tale of speculation disappointed. It
might also be a tale of conflicted individuals gaming the system. It is not a tale of fraud
(technically defined). One might have sympathy for human behavior that is carried away with
the prevailing speculative culture, although less forgiving of the gaming. However, this is also a
tale of financial statements not checking this behavior. This firm’s accounting was in accordance
with GAAP, as annual audit certificates stated. Some of the poor accounting was due to
prescriptions of GAAP, some to using GAAP to draw a picture of earnings growth. More
proactively, some of the behavior was induced by GAAP. The momentum in GAAP earnings
reinforced the stock price bubble.
The tale is also one of analysts who adopted speculative analysis rather than fundamental
analysis. Had they pursued the latter, they would have been frustrated by the GAAP quality but,
with an understanding of the deficiencies of the GAAP, they would have identified the quality
aspects of the traditional financial reporting model on which they could anchor.
Shareholders, whom the endeavor is meant to benefit, lost. They understood that
management and employees had done well from their options. Investment bankers had done
well. Analysts had become stars of the new age. Auditors had collected their fees, with
considerable consulting fees to boot. But, looking at their post-bubble stock price, shareholders
questioned what value their agents had generated for the legal owners. Indeed, they asked, what
did the firm really earn in the 1990s.
References
37
American Accounting Association Financial Accounting Standards Committee. 1997. Comprehensive income. Accounting Horizons 11 (June): 120-126. Abarbanell, J. and B. Bushee. 1997. Fundamental analysis, future earnings, and stock prices.
Journal of Accounting Research 35 (Spring): 1-24. Baker, M., and J. Wurgler. 2002. Market timing and capital structure. Journal of Finance 57 (February): 1-32. Ball, R., and R. Watts. 1972. Some time series properties of accounting income. Journal of
Finance 27 (June): 663-682.
Beaver, W. 1970. The time series behavior of earnings. Journal of Accounting Research 8 (Supplement): 62-99.
Bens, D., V. Nagar, D. Skinner, and F. Wong. 2002. Employee stock options, EPS dilution, and
stock repurchases. Unpublished paper, University of Chicago and University of Michigan.
Chan, K., L.Chan, N. Jagadeesh, and J. Lakonishok. 2001. Earnings quality and stock returns:
the evidence from accruals. Working paper, National Taiwan University and University of Illinois at Urbana-Champaign.
Fairfield, P., J. Whisenant, and T. Yohn. 2001. Accrued earnings and growth: implications for
earnings persistence and market mispricing. Unpublished paper, Georgetown University. Fairfield, P., and T. Yohn. 2001. Using asset turnover and profit margin to forecast changes in
profitability. Review of Accounting Studies 6 (December): 371-385. Greenwald, B., J. Kahn, P. Sonkin, and M. van Biema. 2001. Value Investing: from Graham to Buffet and Beyond. New York: John Wiley & Sons, Inc. Gu, F. and B. Lev. 2001. Intangible assets. Unpublished paper, New York University on www.baruch-lev.com. Hendriksen, E. 1970. Accounting Theory, revised ed. Homewood, Ill.: Irwin. Ikenberry, D., J. Lakonishok, and T. Vermaelen. 1995. Market underreaction to open market share repurchases. Journal of Financial Economics 39: 181-208. Jung, K., Y. Kim, and R. Stulz. 1996. Timing, investment opportunities, managerial discretion, and the security issue decision. Journal of Financial Economics 42: 159-185. Lev, B., and S. Thiagarajan. 1993. Fundamental information analysis. Journal of Accounting
Research 31 (Autumn): 190-215.
38
Lipe, R. 1986. The information contained in the components of earnings. Journal of Accounting Research 24 (Supplement): 37-64.
Lundholm, R. 1999. Reporting on the past: a new approach to improving accounting today. Accounting Horizons 13 (December): 315-322. Nurnberg, H. 1993. Inconsistencies and ambiguities in cash flow statements under FASB Statement No. 95. Accounting Horizons 7 (June): 60-75. Ohlson, J. 1999. Prescriptions for improved financial reporting. Unpublished paper, New York University. Ohlson, J. 2000. Residual income valuation: the problems. Unpublished paper, New York University. Ohlson, J., and Juettner-Nauroth. 2001. Expected EPS and EPS growth as determinants of value.
Unpublished paper, New York University and Johannes Gutenberg University. Ou J., and S. Penman. 1989. Financial statement analysis and the prediction of stock returns.
Journal of Accounting and Economics 11 (4): 295-329. Penman, S. 2001a. Financial Statement Analysis and Security Valuation. New York: McGraw- Hill Companies. Penman, S. 2001b. Fundamental analysis: lessons from the recent stock market bubble. Security Analysts Journal (Japan) 39 (December): 106-115. Penman, S., and X. Zhang. 2002a. Accounting conservatism, quality of earnings, and stock
returns. The Accounting Review 77 (2): 237-264. Penman, S., and X. Zhang. 2002b. Modeling sustainable earnings and P/E ratios with financial
statement analysis. Unpublished paper, Columbia University and University of California, Berkeley.
Sloan, R. 1996. Do stock prices fully reflect information in accruals and cash flows about future
earnings? The Accounting Review 71 (3): 289-315. Thomas, J., and H. Zhang. 2002. Inventory changes and future returns. Forthcoming, Review of
Accounting Studies. White G., A. Sondhi, and D. Fried. 1998. The Analysis and Use of Financial Statements, 2nd ed. New York: John Wiley & Sons, Inc. Zhang, X. 2000. Conservative accounting and equity valuation. Journal of Accounting and
Economics 29: 125-149.

39
Zhang, X. 2001. conservatism, growth, and the analysis of line items in earnings forecasting and equity valuation. Unpublished paper, University of California, Berkeley.
Figure 1
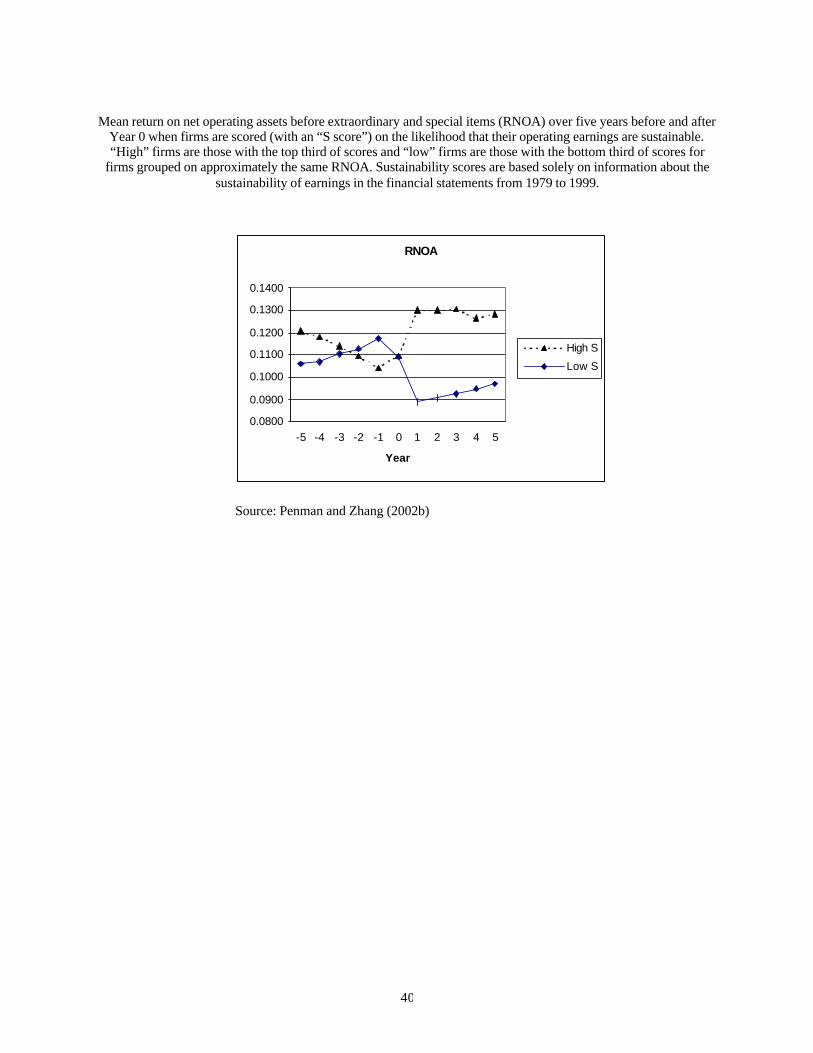
40
Mean return on net operating assets before extraordinary and special items (RNOA) over five years before and after
Year 0 when firms are scored (with an “S score”) on the likelihood that their operating earnings are sustainable. “High” firms are those with the top third of scores and “low” firms are those with the bottom third of scores for
firms grouped on approximately the same RNOA. Sustainability scores are based solely on information about the sustainability of earnings in the financial statements from 1979 to 1999.
Source: Penman and Zhang (2002b)
RNOA
0.0800
0.0900
0.1000
0.1100
0.1200
0.1300
0.1400
-5 -4 -3 -2 -1 0 1 2 3 4 5
Year
High S
Low S
41
Endnotes
1 See Buffet’s annual letter to shareholders in Berkshire Hathaway’s 2000 annual report. 2 I discuss the misguided analysis during the bubble in “Fundamental Analysis: Lessons from the Recent Stock Market Bubble,” a speech to the Japanese Society of Security Analysts. See Penman (2001b, in Japanese). An English version is available from the author. 3 See The New York Times, December 5, 2001, page C9. See also comment by Stephen Butler, Chairman of KPMG LLP in PR Newswire, January 31, 2002. 4 See The Wall Street Journal, op-ed page, A18, December 4, 2001. 5See, for example, Hendriksen (1970), Ohlson (1999). 6 From a report in The New York Times, February 10, 2002. The Council reversed itself on response to a revival of the Senate bill in February, 2002. 7 The prescription does not necessarily imply regulation. True and fair reporting could evolve without regulation as shareholders respond to buyers’ demands for assurance when selling claims. 8 The residual income model and the recent Ohlson and Jeuttner-Nauroth (2001) model produce valuations based on forecasting earnings that are equivalent to pricing expected dividends. 9 For more discussion on these points, see the AAA Financial Accounting Standards Committee (1997) paper on the FASB exposure draft for Statement 130. 10 Mr. Skilling said, “essentially what you do is you issue stock options to reduce compensation expense, and therefore increase your profitability,” as reported in The Wall Street Journal, March 26, 2002, p. 1. 11 IBM’s pension gain in 1998 was $4.9 billion, 53 percent of pre-tax earnings, and $5.4 billion for 1999, 46 percent of pre-tax earnings. General Electric’s numbers were $3.0 billion for 1998 and $3.4 billion for 1999, both 22 percent of pre-tax earnings. The two firms were using an expected rate of return on plan assets of 10 percent and 9.5 percent, respectively, up from 7.5 percent in the 1980s. 12 Evidence the firms buy low and sell high in share transactions is found in Ikenberry, Lakonishok, Vermaelen (1995), Jung, Kim, and Stultz (1998), and Baker and Wurgler (2002). 13 Curiously, many firms repurchased shares during the bubble at high prices (and ran up debt to do so). Repurchases were justified to keep shares outstanding roughly the same after issuing shares for exercises of stock options, to “prevent dilution” it was said. Of course it did nothing of the sort; rather shareholders lost on the exercise of options and then lost again as shares were

42
repurchased at high prices. Bens, Nagar, Skinner, and Wong (2002) find a link between employee stock options and share repurchases. 14 Ohlson (2000) makes this point. Penman (2001a, 511) shows how to adjust for anticipated share transactions in applying the residual income model. 15 Zhang (2000, 2001) models the effect. Penman (2001a, Chapter 17) gives a demonstration. 16 Penman and Zhang (2002) develop a metric to capture the effect of conservative accounting on the quality of earnings.
17 See White, Sondhi and Fried (1998, p. 184) and Penman (2001a, 339), for example, for the formula for the effect of leverage on return on equity; Penman (2001a, 540-541) demonstrates how leverage increases earnings growth rates.
18 See Greenwald, Kahn, Sonkin, and van Biema (2001), pp. 34-35 in a restatement of Graham and Dodd. 19 Lundholm (1999) argues for this type of reporting. 20 See Fortune, April 2001, pp.192-194 and Gu and Lev (2001). 21 With respect to restructurings, firms might unjustifiably charge operating expenses against the restructuring reserve. Ohlson (1999) recommends a cash (pay as you go) basis for recognizing these charges.
Related Documents


