The pursuit of excipient excellence One brand: DFE Pharma Two names: DMV-Fonterra Excipients and DOMO-pharma With MCC in our portfolio DFE Pharma now offers world’s main excipient categories, unlocking potential synergies for you to increase your efficiency. Contact us on www.dfepharma.com New in our portfolio: MCC

Welcome message from author
This document is posted to help you gain knowledge. Please leave a comment to let me know what you think about it! Share it to your friends and learn new things together.
Transcript

The pursuit of excipient excellence
One brand: DFE Pharma
Two names: DMV-Fonterra Excipients and DOMO-pharma
With MCC in our portfolio DFE Pharma now
offers world’s main excipient categories,
unlocking potential synergies for you to
increase your efficiency.
Contact us on www.dfepharma.com
New in our portfolio:
MCC

REGULATORY WATCHEU Raises API Standards
BIOSIMILARSThe Importance of Characterisation
TROUBLESHOOTINGBest Practices for RABS
Quality by DesignThe adoption of QbD in drug development
and manufacturing continues to evolve
SEPTEMBER 2013 Volume 25 Number 9
P - M E Ceurope
Advancing Development & Manufacturing
PharmTech.com

Your Power for Health
Visit us at CPhI
Hall 4.1, Booth 41H09
Germany (Main offi ce): Greiner Bio-One GmbH, [email protected] l Austria: Greiner Bio-One GmbH, offi [email protected]
Belgium: Greiner Bio-One BVBA/SPRL, [email protected] l Brazil: Greiner Bio-One Brasil, offi [email protected] l China: Greiner Bio-One Suns Co. Ltd., offi [email protected]
France: Greiner Bio-One SAS, [email protected] l Japan: Greiner Bio-One Co. Ltd., [email protected] l Netherlands: Greiner Bio-One B.V., [email protected]
UK: Greiner Bio-One Ltd., [email protected] l USA: Greiner Bio-One North America Inc., [email protected]
www.gbo.com/biosciencewww.gbo.com/bioscience
Tailor-Made Solutions with Expertise and Passion
Injection-moulding for diagnostics, pharmaceutical industry and medical sector
Plastic labware, plates and sample collection systems
Coating technology & surface treatments
Worldwide manufacturing & warehousing
Quality certifi cation according to
DIN EN ISO 9001 and DIN EN ISO 13485

Features
COVER STORY
26 Quality by Design for APIs
The adoption of quality by design in small-molecule
drug development and manufacturing continues to evolve.
BIOSIMILARS
32 The Importance of Characterisation
in Biosimilars Development
Industry experts discuss the challenges involved
in getting a biosimilar product from bench to launch.
TROUBLESHOOTING
42 Best Practices for Restricted Access Barrier Systems
RABS maximise product control but minimise
operator interaction.
FALSIFIED MEDICINES DIRECTIVE
66 Implications for APIs in the
European Falsified Medicines Directive
Representatives from the Active Pharmaceutical Ingredient
Committee and the European Fine Chemicals Group discuss
the implications of the FMD.
QUALITY BY DESIGN
72 Optimising Quality by Design in
Bulk Powders and Solid Dosage
Case studies on the manufacture of a bulk powder
and the development of a tablet show the application
of QbD principles.
API SYNTHESIS
78 Advancing API Synthesis
The author discusses commercial-scale amide formation
and an improved process route for a tetracycline derivative.
PharmTech.com
Columns and Regulars5 Editor’s Comment
CPhI Report Highlights Quality Concerns
6 Product Spotlight
8 Industry Insider
The Importance of Continued Investment in R&D
12 Outsourcing Review
Outsourcing Partnerships for CMC Development
16 European Regulatory Watch
EU Raises API Standards: A Curse in Disguise?
20 US Regulatory Watch
FDA Works to Secure Drug Supply Chain
23 Inside Standards
The Elements of Training
24 Emerging Market Report from Brazil
45 API Synthesis & Manufacturing
Advancing Chiral Chemistry in Pharmaceutical Synthesis
82 Statistical Solutions
The Basics of Measurement Uncertainty in Pharma Analysis
98 Ask the Expert
Multivariate Approaches for Powder Characterisation
98 Ad Index
Peer-Reviewed48 Effective and Efficient Weighing of
Potent Compounds
The authors describe the use of an automated powder
dispensing system in a ventilated balance enclosure
for handling and containment of potent compounds.
54 Overcoming Limitations of
Vapourised Hydrogen Peroxide
The author discusses the technical issues associated
with achieving lethal concentrations of H2O
2 delivered
in vapourous form on decontamination targets.
54 7232 26
PTE magazine is audited
by the BPA
Pharmaceutical Technology Europe is the authoritative
source of peer-reviewed research and expert analyses for
scientists, engineers, and managers engaged in process
development, manufacturing, formulation and drug
delivery, API synthesis, analytical technology and testing,
packaging, IT, outsourcing, and regulatory compliance
in the pharmaceutical and biotechnology industries.
Cover: lumpynoodles/Getty Images;Art direction: Dan Ward
September 2013Advancing Development & Manufacturing
Pharmaceutical Technology Europe SEPTEMBER 2013 3

PharmTech EuropeEditorAdeline Siew, [email protected]
PharmTech GroupEditorial DirectorRita [email protected]
Executive EditorPatricia Van [email protected]
Managing EditorSusan [email protected]
Manufacturing EditorJennifer [email protected]
Community ManagerMelanie [email protected]
Multimedia EditorReid Paul [email protected]
Contributing EditorCynthia A. Challener, PhD
Global CorrespondentsJane Wan (Asia, [email protected])Sean Milmo (Europe, [email protected])Hellen Berger (Latin and South America, [email protected])
Art DirectorDan Ward PublisherMichael [email protected]
Sales ManagerChris [email protected]
Sales ManagerDebbie Taylor-HigginsTel. +44 1244 629 [email protected]
Sales ExecutiveChristine JoinsonTel. +44 1244 629 [email protected]
Vice-President Sales/ Group PublisherRuss [email protected]
Published byAdvanstar Communications (U.K.) LtdBridgegate Pavillions,4A Chester Business Park,Wrexham Road,Chester CH4 9QH, United KingdomTel. +44 1244 629 300Fax +44 1244 678 008
Chief Executive OfficerJoe Loggia
Chief Executive Officer Fashion Group, Executive Vice-PresidentTom Florio
Executive Vice-President, Chief Administrative Officer & Chief Financial OfficerTom Ehardt
Executive Vice-PresidentGeorgiann DeCenzo
Executive Vice-PresidentChris DeMoulin
Executive Vice-PresidentRon Wall
Executive Vice-President, Business SystemsRebecca Evangelou
Sr Vice-PresidentTracy Harris
Vice-President, Media OperationsFrancis Heid
Vice-President, LegalMichael Bernstein
Vice-President, Electronic Information TechnologyJ Vaughn
Published by
Kevin Altria
Associate Director,
Pharmaceutical Development
GlaxoSmithKline R&D
Reinhard Baumfalk
Vice-President, R&D
Instrumentation & Control
Sartorius AG
Rafael Beerbohm
Head of Quality Systems
Boehringer Ingelheim GmbH
Gabriele Betz
Department of
Pharmaceutical Sciences
University of Basel, Switzerland
Phil Borman
Manager, GlaxoSmithKline
Rory Budihandojo
Director, Quality and EHS Audit
Boehringer-Ingelheim
Christopher Burgess
Managing Director
Burgess Analytical Consultancy
Ryan F. Donnelly
Reader in Pharmaceutics
Queens University Belfast
Tim Freeman
Managing Director
Freeman Technology
Filipe Gaspar
Director of Drug Product
Technology, Hovione
Sharon Grimster
Vice-President, Development
F Star
Anne Marie Healy
University of Dublin, Ireland
Deirdre Hurley
Senior Director, Plant
Helsinn Birex
Pharmaceuticals Ltd.
Makarand Jawadekar
Independent Consultant
Henrik Johanning
Senior Vice-President,
Compliance, QAtor A/S
Marina Levina
Senior Manager,
Product Development,
Colorcon
Roberto Margarita
Business Development Director
Corden Pharma
Luigi G. Martini
Chair of Pharmaceutical
Innovation
King’s College London
Thomas Menzel
Menzel Fluid Solutions AG
Jim Miller
President,PharmSource
Information Services
Colin Minchom
Vice-President, Particle Design
Hovione
Clifford S. Mintz
President and Founder
BioInsights
Ian Pearson
Executive General Manager—
Consulting, Derell Consultants
Tim Peterson
Transdermal Product
Development Leader, Drug
Delivery Systems Division, 3M
John Pritchard
Technical Director
Philips Respironics
Thomas Rades
Professor, Research Chair in
Formulation Desgin and Drug De-
livery, University of Copenhagen
Jean Paul Remon
Ghent University, Belgium
Rodolfo Romañach
Professor of Chemistry
University of Puerto Rico,
Puerto Rico
Beatriz San Martin
Senior Associate
Field Fisher Waterhouse LLP
Siegfried Schmitt
Principal Consultant
PAREXEL
Stane Srcic
Professor
University of Ljubljana, Slovenia
Griet Van Vaerenbergh
GEA Process Engineering
Benoît Verjans
Chief Commercial Officer
Aseptic Technologies
Andreas Weiler
Global Technical Sales Director
SAFC
Tony Wright
CEO
Exelsius
EDITORIAL ADVISORY BOARD
Above is a partial list of the Pharmaceutical Technology brand editorial advisory
members. The full board, which includes advisory members of Pharmaceutical
Technology North America, can be found online at www.PharmTech.com/EAB.
Pharmaceutical Technology publishes contributed technical articles that undergo
a rigorous, double-blind peer-review process involving members of our distin-
guished Editorial Advisory Board. Manuscripts for editorial consideration should
be sent directly to Susan Haigney, managing editor, [email protected]% PostConsumer
Waste
4 Pharmaceutical Technology Europe SEPTEMBER 2013 PharmTech.com
Editorial: All submissions will be handled with reasonable care, but the publisher assumes no responsibility for safety of
artwork, photographs, or manuscripts. Every precaution is taken to ensure accuracy, but the publisher cannot accept
responsibility for the accuracy of information supplied herein or for any opinion expressed.
Subscriptions:
Pharmaceutical Technology Europe is free to qualified subscribers in Europe.
To apply for a free subscription, or to change your name or address, go to PharmTech.com, click on Subscribe, & follow
the prompts.
To cancel your subscription or to order back issues, please email your request to [email protected], putting PTE
in the subject line.
Please quote your subscription number if you have it.
List Rental: Contact Sarah Darcy; Tel. +44 1244 629 326 Fax +44 1244 659 321
Reprints: Reprints of all articles in this issue and past issues are available (500 minimum).
Contact Brian Kolb at Wright’s Media, 2407 Timberloch Place, The Woodlands, TX 77380. Telephone: 877-652-5295
ext. 121. Email: [email protected].
Copyright 2013. Advanstar Communications (UK) Ltd. All rights reserved.
No part of this publication may be reproduced in any material form (including photocopying or storing it in any medium
by electronic means and whether or not transiently or incidentally to some other use of this publication) without
the written permission of the copyright owner except in accordance with the provisions of the Copyright, Designs &
Patents Act (UK) 1988 or under the terms of a licence issued by the Copyright Licensing Agency, 90 Tottenham Court
Road, London W1P 0LP, UK.
Applications for the copyright owner’s permission to reproduce any part of
this publication should be forwarded in writing to Permissions Dept, Bridge-
gate Pavillions, 4A Chester Business Park, Wrexham Road, Chester, CH4 9QH.
Warning: The doing of an unauthorized act in relation to a copyright work
may result in both a civil claim for damages and criminal prosecution.

EDITOR’S COMMENT
CPhI Report Highlights Quality Concerns CPhI Worldwide
and CPhI Pharma
Evolution recently
conducted a survey
on the current status
of the formulation and
ingredients market.
The results, which were
released in the first of a
series of monthly reports, with the headline
“Survey Suggests a Need for Greater Control
of Formulation & Ingredient Management,”
revealed overall trends and areas of concern
in the pharmaceutical industry.
Tablets and capsules still represent the
majority of the market with an increasing
focus on extended release and orally
disintegrating products. Bioavailability
remains the top challenge in formulation,
followed by stability, dissolution and release
profile. The most difficult unit operation to
control in final drug-product manufacturing
is particle size reduction as agreed by 60%
of survey respondents. Process analytical
technology and quality by design are playing
greater roles in formulation projects, with
nearly 35% of respondents already using
both and nearly 36% planning to use them
in the future.
For APIs and ingredients, India was the
top source as indicated by more than 45% of
respondents, while 25% answered China and
19% said Europe. Quality and supply were,
however, seen as top issues for the industry.
The importance of working with third-party
auditors to vet suppliers, as advocated by
EMA and FDA, was reflected in the survey
results, with more than 55% of respondents
describing supplier’s certification as
“extremely important” and 39% as
“somewhat important.” Yet, it is surprising
to see less than 25% of respondents actually
working with third-party auditors to verify
supplier compliance with GMP, suggesting
that the industry is still avoiding the problem
despite the need for greater vigilance.
The safety and quality of APIs have never
really been officially addressed in GMP
guidelines but regulators in the EU and US
are now stepping up efforts to fill this gap
through the Falsified Medicines Directive
and the FDA Safety and Innovation Act.
As API expert, Girish Malhotra, president
of Epcot International and CPhI expert
industry panel member, pointed out in the
survey report, quality must not be taken
for granted. Pharmaceutical companies
are urged to work with their suppliers and
emphasise to them the value of quality.
The game has changed, according to
Malhotra, and purchasing departments
must be made aware of it. Suppliers and
buyers must agree on what certifications
are required and there are no shortcuts
when it comes to ensuring quality.
Adeline Siew, PhD
Editor of Pharmaceutical Technology Europe
Editors’ Picks of Pharmaceutical Science & Technology Innovations
THE LATEST IN MANUFACTURING AND EQUIPMENT
6 Pharmaceutical Technology Europe SEPTEMBER 2013 PharmTech.com
PRODUCT SPOTLIGHT: MANUFACTURING AND EQUIPMENT
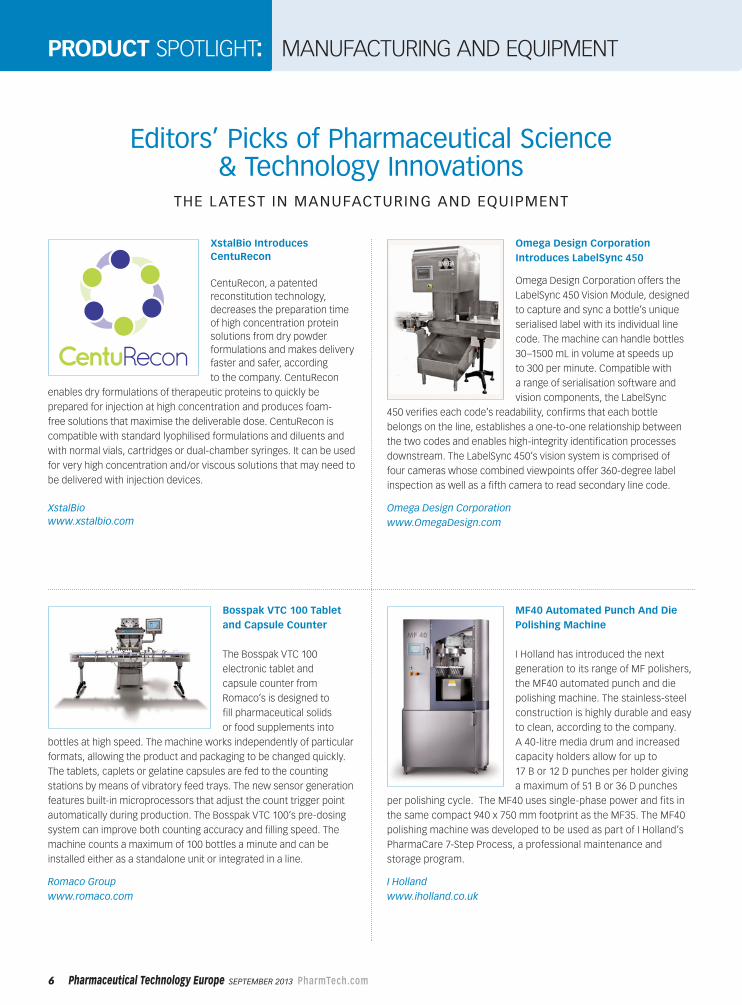
MF40 Automated Punch And Die
Polishing Machine
I Holland has introduced the next
generation to its range of MF polishers,
the MF40 automated punch and die
polishing machine. The stainless-steel
construction is highly durable and easy
to clean, according to the company.
A 40-litre media drum and increased
capacity holders allow for up to
17 B or 12 D punches per holder giving
a maximum of 51 B or 36 D punches
per polishing cycle. The MF40 uses single-phase power and fits in
the same compact 940 x 750 mm footprint as the MF35. The MF40
polishing machine was developed to be used as part of I Holland’s
PharmaCare 7-Step Process, a professional maintenance and
storage program.
I Holland
www.iholland.co.uk
XstalBio Introduces
CentuRecon
CentuRecon, a patented
reconstitution technology,
decreases the preparation time
of high concentration protein
solutions from dry powder
formulations and makes delivery
faster and safer, according
to the company. CentuRecon
enables dry formulations of therapeutic proteins to quickly be
prepared for injection at high concentration and produces foam-
free solutions that maximise the deliverable dose. CentuRecon is
compatible with standard lyophilised formulations and diluents and
with normal vials, cartridges or dual-chamber syringes. It can be used
for very high concentration and/or viscous solutions that may need to
be delivered with injection devices.
XstalBio
www.xstalbio.com
Bosspak VTC 100 Tablet
and Capsule Counter
The Bosspak VTC 100
electronic tablet and
capsule counter from
Romaco’s is designed to
fill pharmaceutical solids
or food supplements into
bottles at high speed. The machine works independently of particular
formats, allowing the product and packaging to be changed quickly.
The tablets, caplets or gelatine capsules are fed to the counting
stations by means of vibratory feed trays. The new sensor generation
features built-in microprocessors that adjust the count trigger point
automatically during production. The Bosspak VTC 100’s pre-dosing
system can improve both counting accuracy and filling speed. The
machine counts a maximum of 100 bottles a minute and can be
installed either as a standalone unit or integrated in a line.
Romaco Group
www.romaco.com
Omega Design Corporation
Introduces LabelSync 450
Omega Design Corporation offers the
LabelSync 450 Vision Module, designed
to capture and sync a bottle’s unique
serialised label with its individual line
code. The machine can handle bottles
30–1500 mL in volume at speeds up
to 300 per minute. Compatible with
a range of serialisation software and
vision components, the LabelSync
450 verifies each code’s readability, confirms that each bottle
belongs on the line, establishes a one-to-one relationship between
the two codes and enables high-integrity identification processes
downstream. The LabelSync 450’s vision system is comprised of
four cameras whose combined viewpoints offer 360-degree label
inspection as well as a fifth camera to read secondary line code.
Omega Design Corporation
www.OmegaDesign.com

www.sterile.com 1-888-4-STERILE
For more than 30 years, VAI has pioneered the design
and manufacture of hundreds of clean room solutions.
Quadruple Bagged using the ABCD Introduction System®
t Cleanest wipe in the industry
t Asepti-Fill® closed filling system
t Laundered in Class 1
t Saturated wipes are made with WFI
t Lot Specific Documention for all wipers
t Laser cut sealed edges
No other company offers this broad a range of wipers…
STERI-PEROX® WIPE
HYPO-CHLOR® Wipe
DECON-Clean® Wipe
ALCOH-Wipe® STEEL-BRIGHT® Wipe
DAS-Wipe®
Stainless Steel cleaning and lubricant wipe
Saturated Hydrogen Peroxide Wipe
Saturated Sodium Hypochlorite Wipe
Removes residue from disinfecting agents
Saturated with DECON-AHOL® WFI 70% USP Isopropyl Alcohol
Stainless Steel Cleaning wipe
70% USP IPA in Water for Injection saturated wipe
Dry cleaning wipe

INDUSTRY INSIDER
(Sp
otl
igh
t im
ag
e)
Sto
ckb
yte
/Ge
ttyIm
ag
es
Mark Howard is a
partner at Charles
Russell LLP.
The Importance of Continued Investment in R&DThere has been a notable shift in interest for life-science companies
over recent months from institutional investors investing through the public markets,
but any plans to release further capital will rely on first-rate R&D.
Good quality research and development (R&D)
is crucial to the long-term success of the
pharmaceutical industry and more generally, the
wider life-sciences sector, but acquiring adequate
funding is often viewed as a challenge, particularly
at the feasibility or concept stage of R&D. There are,
nonetheless, a number of funding sources available
for companies and recent trends on the public
markets may mean that an initial public offering (IPO)
could be an option over the longer term. Given that
traditional providers of debt finance remain cautious
in their lending approach to companies conducting
early-stage R&D, next generation businesses are
finding alternatives in government and national
development funds, such as the UK’s Biomedical
Catalyst programme and the Wales Life Sciences
Investment Fund (WLSIF).
Biomedical Catalyst programmeThe UK government’s Biomedical Catalyst programme,
a £180 million translational funding programme
operated by the Medical Research Council and the
Technology Strategy Board, is actively investing in
the life-sciences sector. The aim of the Biomedical
Catalyst is to provide funding and support for small
and medium-sized enterprises (SMEs), academics and
universities in the UK to accelerate R&D in innovative
healthcare projects. David Willetts, Minister for
Universities and Science, stated that this “investment
will help keep us at the very forefront of life sciences
by supporting some of our most innovative SMEs and
universities. It will help take excellent ideas through
to market, driving growth and helping patients benefit
from the very latest technologies and treatments” (1).
In November 2012, it was announced that in
its last round of funding, Biomedical Catalyst had
provided grants totalling £39 million to speed up the
development of healthcare technologies, of which
£29.6 million went to 22 projects led by SMEs (including
Cantab Biopharmaceuticals Ltd, Glide Pharmaceutical
Technologies Ltd and Kalvista Pharmaceuticals Ltd) and
a further £9.5 million to 10 projects led by academic
institutions (including the University of Oxford and
University College London). The fourth round of funding
was launched on 29 July 2013 and it is expected that
a further £30 million will be issued to researchers
through the scheme in 2013/14. The Chancellor,
George Osbourne, also announced that additional
government funds shall be used to top up the
programme, demonstrating the government’s
commitment to ensuring that the UK remains a world
leader in science and research (2).
Funding through such development funds not
only assists with the funding of R&D, but recognition
from these funds and the positive public relations it
generates may be a catalyst for additional investment.
An example of this benefit can be seen by the recent
successful funding round by Glide Pharma, which is
a pharmaceutical development and device company
focused on needle-free administration of solid dose
formulations. Glide Pharma announced on 26 February
2013 that it had completed a £14 million investment
round, with funds managed by Invesco Perpetual
investing the majority of such funds (3). In relation to
the fundraising, Mark Kirby, chairman of Glide Pharma
said that “this fundraising follows recognition of Glide’s
novel technology by the UK government-backed
Biomedical Catalyst scheme, which awarded the
company £2.3 million funding for the development of a
novel formulation of teriparatide (parathyroid hormone)
for the treatment of osteoporosis.”
Wales Life Sciences Investment FundIt was announced in May this year that the WLSIF
had made its first investment in Simbec Research,
a UK-based clinical research organisation providing
worldwide services to pharmaceutical and
biotechnology companies specialising in early clinical
development of new pharmaceuticals. The WLSIF
opened in the first quarter of 2013, with the purpose
of investing in life sciences and related medical,
pharmaceutical and healthcare companies based
8 Pharmaceutical Technology Europe SEPTEMBER 2013 PharmTech.com

t�(MPCBM�SFHVMBUPSZ�DPNQMJBODF
t��.BOVGBDUVSF�JO�BDDPSEBODF�XJUI�UIF�IJHIFTU�(.1�TUBOEBSET�PO�UIF�NBSLFU �UIF�*$)�(VJEF�2��GPS�"DUJWF�1IBSNBDFVUJDBM�*OHSFEJFOUT
t�)JHI�QVSJUZ�QSPEVDUT
t��"OBMZTFT�BDDPSEJOH�UP�NVMUJDPNQFOEJBM��QIBSNBDPQPFJBT�#1 �1I�&VS� �641�/'�BOE�+1
t�4FDVSJUZ�PG�4VQQMZ
t�)JHI�MFWFM�PG�TFSWJDF�BOE�TVQQPSU
$POUBDU�VT�GPS�NPSF�JOGPSNBUJPO�www.fefchemicals.com
B�/PWP�/PSEJTL�DPNQBOZ
cGMP MANUFACTURED
QUATERNARY AMMONIUM
COMPOUNDS FOR
PHARMACEUTICAL USE

Industry Insider
in Wales. It’s investment strategy is to
focus on a small number of companies
and provide them with both financial and
business support. The WLSIF will invest in
businesses at all stages of growth, including
those requiring seed capital funding to
fund R&D. Howard Jenkins, CEO of Simbec
Research said, “This new partnership with
the Wales Life Sciences Fund is a major step
towards creating an invigorated and more
dynamic company and we look forward to
a highly stimulating period of growth for
Wales and for all involved” (4).
In addition to investment activity,
the WLSIF aims to attract companies,
entrepreneurs and corporate venture
spin-outs to Wales and encourage its
investee companies to form international
partnerships. To date, more than 160
businesses have applied to the WLSIF,
showing a clear need for such funding and
business support.
Listing on the public marketsWhile there are a number of opportunities
available to pharmaceutical companies
looking for funding in the R&D and
commercialisation stage, another option for
such companies is to raise funds on public
markets. Although this approach has been a
challenge since the 2007/08 financial crisis,
particularly for the pharmaceutical sector,
there has been a notable shift in recent
months, with institutional investors showing
renewed interest in investing in life-sciences
companies through public markets, both in
the UK (e.g., Clinigen Group plc, Retroscreen
Virology plc and Venn Life Sciences Holdings
plc, all three recently floated on AIM) and
elsewhere (e.g., Stemline Therapeutics Inc.,
recently floated on NASDAQ). In addition
to providing access to funding, the public
markets offer life-sciences companies a
range of benefits, including enhanced status
and public profile, the ability to incentivise
employees through share-option schemes,
a transactional currency in the form of their
listed shares and a potentially profitable
exit option for investors. For example, on
admission, the existing shareholders of
Clinigen achieved a significant sell-down
with an aggregate consideration in excess
of £40 million.
While the market appears to be strong for
the pharmaceutical industry in general, for
companies involved in drug discovery, the
market remains challenging. However, certain
institutional investors are showing interest
in this sector as well, and the successful
float of Retroscreen Virology demonstrates
a willingness to invest in businesses carrying
out quality R&D. Such admissions show
that companies with a strong pathway to
profit are investable from an institutional
investor perspective. In particular, investors
are looking to invest in companies that
can demonstrate strong underlying
fundamentals, a strong management team
(preferably with a proven track record of
bringing life-sciences companies to market)
and established revenue streams or a clear
pathway to profit.
As a further boost to companies in the
life-sciences sector, on 27 March 2013, the
London Stock Exchange launched a new
high-growth segment of the main market,
which aims to address the needs of fast-
growing European technology companies
with a view to providing such companies
with a transitional route to the UK listing
authority official list. Initiatives such as the
Biomedical Catalyst are also proving to be
crucial resources in assisting companies
to fill the R&D funding gap early on in
their lifecycle, and with the Office for Life
Sciences firmly focussed on promoting
UK life-sciences companies, this position
looks set to continue.
References1. Arecor, “Arecor Awarded Biomedical Catalyst
Funding Towards £1.3 Million Project,” www.
arecor.com/news-events/arecor-awarded-
BMC/, accessed 19 Aug. 2013.
2. HM Treasury, “Spending Round 2013,” www.
gov.uk/government/uploads/system/uploads/
attachment_data/file/209036/spending-round-
2013-complete.pdf, accessed 19 Aug. 2013.
3. Glide Pharma, “Glide Pharma Completes £14.0
Million ($21.4 Million) Fundraising For Scale Up
of Drug and Device Manufacturing Processes
and Product Development,” Press Release,
26 Feb. 2013.
4. Wales Online, “Sir Chris Evans’ new life sci-
ences fund makes first investment,” Press
Release, 3 May 2013. PTE
While there are a number of opportunities available to pharmaceutical companies looking for funding in the R&D and commercialisation stage, another option for such companies is to raise funds on public markets.
10 Pharmaceutical Technology Europe SEPTEMBER 2013 PharmTech.com


OUTSOURCING REVIEW
(Sp
otl
igh
t im
ag
e)
Sto
ckb
yte
/Ge
ttyIm
ag
es
Jim Miller is president of
PharmSource Information
Services, Inc., and publisher
of Bio/Pharmaceutical
Outsourcing Report,
tel. 703.383.4903,
Twitter@JimPharmSource,
www.pharmsource.com
The first generation of strategic sourcing
relationships in clinical research is coming up for
renewal, and the CRO industry is watching carefully to
see how they renew. Strategic sourcing relationships,
which involve global bio/pharmaceutical companies
contracting large portions of their clinical research
programs to the largest CROs, have transformed
the clinical research industry. CROs that have won
strategic relationships, including Icon, Parexel,
Quintiles and Covance, now control substantial shares
of the clinical research market while smaller CROs
have been forced to fight over the “leftovers” from
mid-size and emerging bio/pharma companies.
All indications are that clients are happy with most
aspects of their strategic sourcing relationships. For
the most part, these arrangements are delivering
on their promise to the global bio/pharmaceutical
companies, especially lower costs, better trial
execution and reduced staffing. Given their
performance and the high costs that would be
involved in switching vendors, it is likely that most
(probably all) of these deals will renew.
That’s good news for the CROs that have been able
to secure these strategic relationships. Not only have
they received the project volumes negotiated in the
original deals, they have received work well beyond
the original scope, including projects in adjoining
activities that were not part of the initial arrangement.
As a result, their revenues have been growing at
the annual rate of 15–20%. Profits have not grown
as quickly due to the costs of expanding capacity
to handle the burgeoning volume, but margins are
expected to improve over time.
Suitable for CMC development?Given the success of the strategic relationships in
clinical research, CDMOs should be thinking hard
about when and if that model will be adapted to
chemistry, manufacturing and control (CMC) services.
If it can be ported into the CMC environment, the
model could drive a radical restructuring of the
industry by creating big opportunities for some
CDMOs but also shutting out others, which would
result in a flurry of acquisition activity. Whether
the model can be fully adapted to the CMC world,
however, is open to question.
Perhaps the biggest difference between clinical
research and CMC development is that CMC
development is all about creating knowledge,
innovation and intellectual property that ultimately
differentiates a product in the market. CMC creates
a lot of knowledge about the molecule, some of
which is captured in laboratory data but much of
which is generated and understood less formally,
just by working on the process or product. Further,
CMC development generates innovations such as
more efficient processes for manufacturing APIs or
improved formulations to aid drug delivery.
Bio/pharmaceutical companies recognise that
knowledge and innovation creation is part of CMC
development, and companies are understandably
reluctant to give it up entirely. They want to retain
the knowledge that is generated and want to own or
protect the intellectual property (IP) that is created.
By contrast, clinical research is only about
collecting and analysing data on the effectiveness
and safety of the product in the patient. It seldom
leads to product innovation directly (the famous
case of Viagra [sildenafil citrate], first discovered
as a cardiovascular drug and later developed as
a treatment for erectile dsyfuntion, is the rare
exception), and the information technologies that
clinical research leverages are not core competencies
for bio/pharmaceutical companies.
Another major characteristic of CMC development
that may mitigate against strategic partnerships is
the diversity of technologies and know-how that are
used to develop a drug. It would be uneconomical
and infeasible for a CMC-services provider to
acquire and maintain all of the technologies used
to manufacture or deliver a drug. Think of all the
possible types of reactions used to synthesise small-
molecule compounds and the way certain companies
have carved out special niches for themselves for
technologies such as high-energy reactions that are
only appropriate in particular circumstances. Similarly,
expertise and equipment for solubility-enhancing
technologies such as spray drying or micronising
Outsourcing Partnerships for CMC DevelopmentAre strategic partnerships in clinical research a model for CMC services?
OUTSOURCING REVIEW
12 Pharmaceutical Technology Europe SEPTEMBER 2013 PharmTech.com

MEGGLE HEAD OFFICE [email protected] +49 8071 73 476
22–24 October 2013Frankfurt am Main, GermanyBooth 31F54
– Innovative product range– Leading quality systems– Fully implemented GMP/GDP system– Global partner network– Customers in more than 100 countries
Lactose from MEGGLE – the experts in excipients.
As one of the pioneers in the development of excipients for direct tableting, MEGGLE has more than 50 years of experience and offers a broad-based and detailed portfolio of lactose products for any application worldwide. The benefits speak for themselves. And for MEGGLE:
The world of lactose.Global, individual, expert. From Meggle.

Outsourcing Review
is concentrated in a few specialty
CDMOs that can efficiently service
the limited number of candidates that
need that expertise.
The diverse range of technologies
would seem to guarantee that bio/
pharmaceutical companies will
always need a wide array of CMC
service providers to meet their
development requirements.
Strategic modelsThe nature of CMC development would
suggest that it may not be as suited
to the strategic partnership model as
clinical research. While there are some
CMC activities that have gone a long
way to adopting that model, namely
clinical packaging and analytical
testing, those activities have more
in common with clinical research.
Neither of those activities generates
IP and both require more operational
expertise than scientific expertise.
As the bio/pharmaceutical industry
continues to adapt to a changing
market and scientific environment,
however, some of the forces that
have driven strategic clinical research
relationships may come to bear on
CMC development as well. Consider
global reach. CMC expertise is
more widely available, especially for
small-molecule API development
and for basic formulations. As cost
pressure increases, companies seem
to be more open to exploring CMC
development in lower-cost locations.
Further, global bio/pharmaceutical
companies recognise the need to
develop products specifically for
those emerging markets.
At the same time, information
technology has made collaboration
and knowledge-sharing possible over
great distances, so the opportunity
to disperse those activities may be
increasing. CMC providers with truly
global operations that can access
and network lower-cost resources
in emerging markets might be able
to build favourable positions as
strategic providers.
The other big opportunity for
strategic partnerships may lie in
integrated service offerings. Time
and cost are of the essence in drug
development today, and companies
offering a combined service developing
an API and drug product may be able
to offer significant reductions in both.
One-stop offerings have the potential
to reduce the leakage of knowledge
as projects are handled off from
one provider to another, and they
can eliminate or reduce the periods
of inactivity between development
activities. Delivering the promise of
one-stop models, however, will require
a level of operational excellence that
few in the CMC industry have yet been
able to achieve. PTE
Information technology has made collaboration and knowledge-sharing possible over great distances, so the opportunity to disperse those activities may be increasing.
VITAMIN E TPGS
Applications
Contact t Pharmaceutical and Nutraceutical
t Cosmetic t�/VUSJUJPOBM�4VQQMFNFOUT�
ISOCHEM ofGFST�MBSHF�QSPEVDUJPO
DBQBDJUJFT�PO���D(.1�TJUFT�JO�'SBODF
64�%.'�BWBJMBCMF
Manufacturing
Global Product ManagerVincent GuillotTel: +33 (0)1 64 99 05 60
.PC��������������������
email: [email protected]
Sales DirectorXavier JeanjeanTel: + 33 (0)1 64 99 05 50
email: [email protected]
ISOCHEM
�� �SVF�-BWPJTJFS�
������VFSU�-F�1FUJU���'SBODF
Visit us at CPHI
22-24 October
Frankfurt, Booth 50D30
�5)&�,&:�40-65*0/�1307*%&3�
www.isochem.eu
ISOCHEM's Vitamin E TPGS available
14 Pharmaceutical Technology Europe SEPTEMBER 2013 PharmTech.com

Film forming and coating polymers
Fast dissolve and chewable tablets
'ilXents and Àllers for tablets�capsXles
Direct compression
Binders for wet granulation
Molecular encapsulation, taste-masking and dissolution enhancer
Syrups, semi-solids and softgels
Disintegrants and superdisintegrants
Dietary Àber, protein and mineral supplements
Pyrogen-free carbohydrates for injectable and dialysis solutions
Whateveryour requirement, you can relyon ROQUETTE. We deliver !
www.roquettepharma.com
VISIT US AT
CPHI
22 – 24 October 2013
Messe FRANKFURT
GERMANY
Hall 6
Stand 61A70

16 Pharmaceutical Technology Europe SEPTEMBER 2013 PharmTech.com
The number of substandard pharmaceutical ingredients
coming into the EU has increased in recent years; however,
when the European Commission (EC) first revealed details of
the implementation of new EU rules for GMP standards for
imported APIs, both the pharmaceutical industry and regulators
warned about the potential dangers of these restrictions in
causing medicines shortages. The new regulation, part of the
EU’s Falsified Medicines Directive (FMD), requires that imports of
APIs into the EU must be accompanied with written confirmation
by a national regulatory authority that the manufacturing plant
complies with GMP standards. This requirement has raised
concerns that the importation of a large proportion of APIs
would be severely hampered as a result. And yet, six weeks after
the new rules came into effect on 2 July 2013, there has been
no evidence of any major upheaval in the supplies of APIs in
the EU—approximately 70% of which are imported, with 60% of
these imports coming from India and China.
“Currently, we have not been notified of any critical disruption
of API supplies, or manufacture of medicinal products, linked
to the enforcement of the new EU rules on the importation
of active substances,” a spokesperson for the EC told
Pharmaceutical Technology Europe. The European Federation
of Pharmaceutical Industries and Associations (EFPIA), the main
trade body for research-based pharmaceutical companies,
also confirmed that it had not yet received any reports from
its members about any immediate difficulties with imported
API supplies after 2 July. An EFPIA official, however, informed
Pharmaceutical Technology Europe that “it is too early to assess
properly the impact of the new system.”
Exemption from written confirmation
To date, four countries (i.e., US, Japan, Australia and
Switzerland, which is a non-EU country), have been excluded
from the requirement for written confirmation on grounds
that their regulatory and monitoring standards on GMP
are equivalent to those of the EU. Several other countries,
including Brazil, Mexico, Singapore and Israel, have applied
to be exempted, or to have previous refusals of exemptions
reviewed, according to the EC. The regulation also enables
the authorities in the EU’s 28 member states to apply various
waivers when implementing the written confirmation
requirement. If, for example, an API plant has already been
inspected and given a GMP certification by EU inspectors,
written confirmation may be considered to be unnecessary.
Nonetheless, exactly how the new rules are being applied
in individual EU countries has been unclear because of delays
in including the FMD regulations in national statutes. By early
August, eight of the 28 member states were yet to transpose
the written confirmation obligation into their laws. In other
countries, the implementation date has been held back. For
example, in the UK, the requirement was not in full effect until
20 August.
In most countries, the checking of whether an imported API
is accompanied by a written confirmation is left to the individual
pharmaceutical manufacturers. Without the confirmation, a
medicine with the imported API cannot be marketed legally in
the EU. “(We) will monitor compliance with the rules in relation to
finished-product manufacturers as well as companies importing
active substances,” explained the Danish Health and Medicines
Authority in a statement on the new rules (1). “The Danish
customs authorities will not check whether the import rules have
been observed.” On the other hand, countries, such as Spain,
are verifying compliance through import controls at their borders
while Germany and the Netherlands are planning to do the same.
Alternative suppliers
Some manufacturers were quick to react to the possibility of
new restrictions on imported APIs at the time when the FMD
was being debated in the European Parliament and the European
Council representing EU governments. They signed deals with
alternative API suppliers with GMP certification, particularly those
based in the EU. “In a recent survey of our members, we found
that many of them had been asked by European pharmaceutical
companies to become second-source suppliers of their active
substances,” said Tony Scott, advisor to the European Fine
Chemicals Group (EFCG), representing EU producers of APIs.
National licensing authorities have been working closely
with their countries’ pharmaceutical manufacturers to pinpoint
API sources that may have difficulties complying with the new
EU restrictions. Risk assessments of potentially problematic
active ingredients have been carried out. These assessments
investigate reasons for the absence of written confirmations,
levels of existing stocks of the APIs with the medicine
manufacturers and the availability of alternative products and
treatments. “(We are) aware of 107 risk assessments being
carried out by member states although it is highly likely that many
more have been done,” says an official at the European Medicines
Agency (EMA). EMA has been monitoring the implementation of
the written confirmation requirement.
On the basis of the results of the risk assessments, national
authorities have been helping pharmaceutical companies to take
precautionary measures. “Some API sources for UK finished-
product manufacturers were (shown to be) potentially at risk,”
a spokesperson for the UK Medicines and Healthcare Products
Regulatory Agency (MHRA) told Pharmaceutical Technology
Europe. “However, further analysis by the manufacturers showed
that such risks could be mitigated, for example, by stocks being
held and the use of alternatives from approved API sources. The
situation is being kept under review by MHRA at a UK level and by
the weekly meetings at an EU level.”
EU Raises API Standards: A Curse in Disguise?The aim of the newly enacted European Falsified Medicines Directive is to
improve the quality of imported APIs, but does the pain now outweigh the gain?
Sean Milmo
is a freelance writer based in Essex, UK,

As a Director of
Quality ControlI adhere to a strict set of standards established to identify, measure, control and sustain the highest level of pharmaceutical product quality. The Thermo Scientific™TruScan™ RM, a leading-edge, handheld Raman spectrometer, has enabled us to modernize testing and increase quality coverage. The TruScan RM is part of our cultural shift toward continuous improvement which includes adding cost-effective, qualitycontrol measures upstream from final manufacturing processes.
Field Proven24of 25 leading pharma companies650+ GMP sites globally15+ regulatory enforcement agencies
$ Learn more at thermoscientific.com/quality
© 2
013
Ther
mo
Fish
er S
cien
tific
Inc.
All
right
s re
serv
ed. A
ll tr
adem
arks
are
the
prop
erty
of T
herm
o Fi
sher
Sci
entif
ic a
nd it
s su
bsid
iarie
s.
I am a TruScan RM user

18 Pharmaceutical Technology Europe SEPTEMBER 2013 PharmTech.com
Due to concerns about possible medicines shortages in the
short to medium term, EU regulators have been prioritising
inspections of some non-approved plants outside Europe
by EU GMP inspectors. “(We know) of 12 future planned
inspections of sites for which no written confirmation is
available although some of these inspections may ultimately
not be necessary as more non-EU authorities start issuing
written confirmations,” the EMA official told Pharmaceutical
Technology Europe. “In addition, EMA is aware of three EU
inspections that have been carried out although it is highly
likely that there have been more.”
India and China step up GMP standards
In the longer term, EU regulators are hoping that India and China,
which between them have more than 900 sites exporting APIs to
Europe, will establish comprehensive and reliable GMP inspection
systems that will eliminate the problem of certification of
exported active substances. In India, the Central Drugs Standard
Control Organisation (CDSCO), part of
the country’s Ministry of Health and
Family Welfare, has been issuing written
confirmations. Details of the confirmation
with names of the APIs are available on
the CDSCO website.
China only began issuing written
confirmations this spring through the
Chinese Food and Drug Administration
(CFDA), which supervises GMP
inspections but only in pharmaceutical
plants. It has no responsibility for
GMP standards in chemical plants
making and exporting APIs. “China
is a very big country so there are
difficulties with quality standards in
APIs production while there is also
a need for harmonisation of GMP
inspections,” commented Stefan
Kettelhold, lead auditor at Germany’s
blue inspection body GmbH, which
does a lot of auditing work in China.
“The Chinese government used to
concentrate on raising production
standards of companies supplying
the domestic market. With the new
legislation, it is also focusing on GMP
of API suppliers for the international
market. The Chinese authorities want to
see a general upgrading of standards in
pharmaceuticals.”
One likely result of tougher domestic
and international regulations on
production standards in India and China
will be a consolidation among API
manufacturers. There will be fewer of
them, but they will be able to ensure that
their active substances are of a more
consistently acceptable quality than at
present.
Reference
1. Danish Health and Medicines Authority, Re-
quirements for Import of Active Substances
(API) —Questions and Answers, laegemid-
delstyrelsen.dk/en/feeds/~/link.aspx?_id=6
5B341A60E1A427BA073611579683A43&_
z=z, accessed 10 Aug 2013. PTE
Our Operational Excellence – Your benefit!
Since winning the Facility of the Year Award in the
category of Operational Excellence in 2009, we strive
to be the first address for “Operational Excellence in
contract manufacturing of parenterals”. Every day we
are in motion for your solution.
Q Specialist for contract manufacturing
of sterile solutions
Q 60 years of experience
Q Facilities and services in accordance with cGMP
hameln pharmaceuticals gmbh
Langes Feld 13
31789 Hameln, Germany
www.hameln-pharma.com
Want to learn more?
Come and see us at
ICSE in Frankfurt from
22. – 24.10.2013
Hall 4.2, Booth G32

www.lonza.com
Reach Beyond
Pharma&Biotech
Costleadership
1 4
32
Rigorousproduct
management
Highsourcing
effectiveness
Lowcostmanufacturing
Efficient and combined
Nansha-VispR&D/PD
Contact us at [email protected], North America +1 201 316 9200 Europe +41 61 316 8111
DuraSource™ Life Cycle Extension Services
Enhance the life cycle of your product. Lonza’s Small Molecules offering now extends to
provide sustainable solutions for your mature, generic, and regionally important APIs.
DuraSource™ combines the benefits of Lonza’s global asset base and over 40 years experi-
ence in superior quality API manufacturing:
– Broadest technology expertise to develop 2nd generation processes
– FDA approved facilities in Nansha, China and Visp, Switzerland
– Backward integration and economies of scale
– Tailored production concepts and efficient manufacturing
– Global sourcing from our network of cost leaders
– Continuous improvements and cost reductions through operational excellence
and process R&D
The durable solution for your leading products. www.thedurasource.com
Holistic management for competitive
and sustainable API solutions

20 Pharmaceutical Technology Europe SEPTEMBER 2013 PharmTech.com
Key to implementing the United States FDA Safety and
Innovation Act (FDASIA) of 2012 is for the US Food and
Drug Administration to issue new regulations and guidance
that will help manufacturers understand how the agency aims
to strengthen oversight of today’s global drug industry. Title
VII of FDASIA provides added authority for FDA to inspect
drug-production facilities; to block import of adulterated
and substandard medical products; to require adherence to
manufacturing standards and to crack down on violators.
New provisions under Title VII of FDASIA
Agency leaders marked the first anniversary of FDASIA at a
public meeting on 12 July 2013. The meeting updated industry
on how the new policies will affect operations and ensure a
more level playing field between suppliers and manufacturers
at home and abroad. It also gave all parties an opportunity
to comment on agency proposals for strengthening FDA
authority over drug imports. FDA commissioner Margaret
Hamburg opened the meeting by noting the importance of
collaborative efforts with other regulators, with the industry
and with crucial stakeholders in better securing a “more
complex and more global supply chain.” Most notable was her
announcement of a new proposed rule and a draft guidance
document, the first of several such documents required to
flesh out the FDASIA policies.
John Taylor, counselor to the commissioner and now acting
deputy commissioner for global regulatory operations and
policy, similarly noted the vast increase in countries, importers
and foreign facilities that produce FDA-regulated therapies.
Title VII provides FDA with stronger tools to use against
firms that refuse inspections or seek to import noncompliant
products. And stiffer penalties for drug counterfeiting have
been authorised by the US Sentencing Commission to go into
effect in November 2013.
Additional data and information on facilities and operations
will support a more effective system for targeting inspections
and oversight of imports. These data are important for
implementing Title VII’s various programs and requirements,
explained Susan de Mars, senior advisor to the Office of
Global Regulatory Operations & Policy. All manufacturing
establishments now have to register with FDA and provide
unique facility identifiers (UFIs) that will populate an electronic
database able to track manufacturer operations, identify
importer compliance and generate information related to lost,
stolen or counterfeit products.
FDASIA’s provisions enhance partnerships and collaboration
with foreign regulators, making it easier for FDA to exchange
confidential information with peer regulators. The agency
gains flexibility to recognise or rely on inspections of other
regulators, which can help extend FDA’s limited resources,
de Mars noted. FDA has been engaged in several inspection
collaborations, and the legislation should lead to more formal
recognition and mutual reliance on foreign government
inspection findings.
Inspections intensified
A key FDASIA goal is to strengthen FDA’s authority to inspect
manufacturing facilities in the US and abroad. By eliminating
the traditional requirement that FDA inspect domestic drug
facilities every two years, the legislation supports a shift to
a risk-based inspection system that targets high-risk firms.
FDASIA also authorises FDA to examine facility records
electronically and in advance of a site visit, which can help
the agency determine whether or not to actually conduct the
inspection at that time.
If FDA determines during an inspection that certain drugs
may be adulterated or misbranded, it now can detain those
products, instead of waiting for a court order to do so, which
can give unscrupulous operators a chance to distribute the
violative products. FDA describes how it will implement this
new policy in a proposed regulation, which is similar to the
policy already in force for medical devices and food (1).
New draft guidance further clarifies how FDA plans
to conduct full and complete inspections of factories,
warehouses and other facilities involved in drug production (2).
The guidance spells out how firms that delay, deny access or
limit inspections may have their products deemed misbranded
and adulterated and not fit for sale in the US. The document
lists prohibited behaviours that could delay the scheduling
of inspections or an inspection in process, such as failure to
produce requested records in a timely manner. And it spells
out how manufacturers can run into trouble by preventing
an inspector from beginning or completing a site visit. FDA
specifies that its agents have the right to access and copy
records and to collect product samples as needed, including
samples of finished products, raw materials, in-process
materials, reserve samples and environmental samples.
One notable paragraph states that FDA inspectors have
authority to photograph facility conditions, an issue that has
been the subject of heated legal debate for years. Lawyers
already are questioning whether FDASIA actually does permit
agency officials to use cameras during an inspection, and
Doug Farquhar of Hyman, Phelps & McNamara speculates in
the FDA Law Blog whether a company that refuses to permit g
photography will end up as a test case in court (3). FDA would
like to receive comments on the guidance by 13 Sept., 2013.
FDA Works to Secure Drug Supply ChainNew policies aim to strengthen inspection and oversight processes.
Jill Wechsler is Pharmaceutical Technology
Europe’s Washington editor, tel. 1. 301.656.4634,
[email protected]. Read Jill’s blogs at
PharmTech.com/wechsler.

Looking for a Balanced CMO?From APIs to Drug Products, CordenPharma
Is Your Path to Balanced Outsourcing
Visit us this Fall at
Experts taking care.
Drug Product Contract Development
& Manufacturing
� Ŕ Highly Potent Formulations (Solid Forms)
Ŕ Cephalosporins & Penicillins (Oral & Sterile)
Ŕ Oncology Drug Products (Oral & Sterile)
Ŕ Parenterals
Ŕ Large Pre-Filled Syringes
Ŕ Two-Layer Tablets
Ŕ Primary & Secondary Packaging
- Labeling
- Pack Serialisation
- 2D Data Matrix Coding
Ŕ Pharma-Logistics
API Contract Development
& Manufacturing
Ŕ R&D Custom Synthesis & Scale-Up
- Small Molecules
- Peptides; Conjugates
- Synthetic Phospholipids
- Carbohydrates
Ŕ Highly Potent APIs (SafeBridge Category 4,
OEL ≤ 30 ng/m3)
Ŕ Large-scale API Contract Manufacturing
Ŕ Synthetic Peptide API Production
Ŕ Proprietary APIs & Building Blocks
- > 50 Generic APIs
- Synthetic Phospholipids
- AADs, Pseudoproline Dipeptides
EuroPeptides
November 13-14, 2013
Prague, Czech Republic
AAPS
Stand 1300
November 10-14, 2013
San Antonio, TX, USA
CPhI Worldwide
Stand 31B32
October 22-24, 2013
Frankfurt, Germany
www.cordenpharma.com
CordenPharma
Europe
Phone: +49 6202 99 2299
North America
Phone: +1 800 868 8208 or +1 303 938 6488
CordenPharma is your full-service CMO partner in the Contract Manufacturing & Development of Drug Products,
their Active Pharmaceutical Ingredients (APIs), and associated Packaging Services. With multiple cGMP facilities
across Europe and the US, CordenPharma is linking together a legacy of high-caliber scientists, technologies,
and capabilities to provide you with balanced outsourcing in all phases from R&D to Commercialization.

Overseeing imports
A main purpose of the July public meeting was to provide
manufacturers and other stakeholders with an opportunity to
comment on FDA proposals for setting standards for imports, for
registering commercial importers and for devising good importer
practices (GIPs). FDA expects GIPs to address registration
requirements for commercial importers, exemptions (possibly
for research products) to importer regulation and the importance
of importers meeting broader compliance standards, such
as GMPs or demonstrating a satisfactory inspection history.
One issue, noted FDA senior policy advisor Brian Pendleton, is
whether importers should be required to establish drug-safety
management programs as part of GIPs.
There was discussion about how useful a certificate of analysis
is in documenting product authenticity, or if these forms are
too easily falsified. The United States Pharmacopeia Convention
(USP) proposed that compendia standards serve as a key marker
for importer compliance. Excipient producers requested an
exemption from import restrictions, noting that foreign producers
ship large quantities of excipients to the US for a broad range
of uses, making it impossible to segregate out those products
specific to pharmaceutical production.
Another important topic is whether to permit compliant
importers to qualify for expedited clearance procedures. US
manufacturers would like to see risk-based standards for those
importers that meet high standards, noted Sarah Spurgeon,
assistant general counsel at the Pharmaceutical Research and
Manufacturers of America (PhRMA). Industry representatives
also proposed that GIP requirements might differ based on the
type of drug imported, company inspection history and evi-
dence of supply-chain controls.
The globalisation of drug production is a positive development,
in that manufacturers can make products anywhere and market
them worldwide via the Internet, noted John Taylor. But FDA “can’t
just do more inspections and more examinations of imports,”
he said. Instead, the agency needs to engage in inter-agency
activities within the US and collaborate more with international
regulatory and health organisations. FDA will be issuing a number
of regulations and guidance documents to implement its new
programs and is looking for manufacturers to help weigh all the
options.
References
1. Federal Register, Vol. 78, No. 135, pp. 42382-6 (15 July 2013).
2. FDA, Circumstances that Constitute Delaying, Denying, Limiting or
Refusing a Drug Inspection, draft guidance (12 July 2013), www.fda.
gov/RegulatoryInformation/Guidances/, accessed 2 Aug., 2013.
3. Farquhar, www.fdalawblog.net (18 July 2013). PTE
Don’t Gamble with your Registration
High value mineral salts
Visit us!
October 22-24, 2013
Hall 3.0 Booth 30G02
Available CEPs:
"��������������������!��ous
"����ro�����������
"����ro������������
"����ro�����������������
"����ro�����������������!�����
"������������� �����������!
"������������� �����������t
"���������������������!��ous
"�����������������������!�����
✔ ��������� ���������equest
✔ ����������������������������

Pharmaceutical Technology Europe SEPTEMBER 2013 23
Training represents one of the key elements that management
can use to assure a consistent, high quality, product. CodifyingTTthe elements of the training programme will help a company
maintain compliance to the regulations and address regulatory
concerns about employee qualifications that might arise during
inspections. Some companies are fortunate to have either a
training department or a training coordinator to define and
administer the programme. Companies that do not have either
should establish a training team with representatives from the
quality assurance, quality control and operations departments
at a minimum. There should be approximately four parts to any
training program: the introductory training requirements for new
employees, the annual training requirements for all employees
regardless of function, the continuing education training
expectations, and special training requirements that may be
required for continuous quality and process improvements. The
first three may be tracked with a training matrix.
Introductory training requirements
New employees should be initially trained on applicable GMPs,
good documentation practices (GDPs), and any additional global
requirements impacting their jobs. It is prudent for a company
to develop a quiz or test to demonstrate the new employee’s
comprehension of these basic requirements with an established
minimum passing percentage. The minimum percentage must
be achieved before the employee is considered to have the
basic knowledge needed to work in the company. Incorrect
answers should be discussed as part of the process. If the
required minimum is not achieved, the prospective employee
should be provided additional instruction on the material and a
different test should be employed to measure comprehension. If
the minimum required comprehension level is still not achieved,
the quality assurance department should inform the hiring
manager and indicate the new employee is not suitable for
employment. Once new employees have passed the minimum
understanding requirements on the quizzes, they should
then be trained on company policies and specific job-related
standard operating procedures (SOPs).
Annual training requirements
Companies should perform annual refresher training on a
variety of topics. At a minimum, it is recommended that
employees be retrained annually on cGMPs and cGDPs.
Additional yearly training topics could be tailored to the type
of operations being conducted at the facility. If the company
is manufacturing parenteral products, the annual training
programme might include modules on microbiological control in
aseptic manufacturing and conducting investigations/root cause
analysis. This yearly training should also measure employee
comprehension of the material. This comprehension might be
measured in a variety of ways including but not limited to written
quizzes, oral quizzes and hands-on demonstration. Whichever
way is chosen to assess the employee’s comprehension of the
material, it should be noted on individual training records.
Continuing education training requirements
Employees should be encouraged to enhance their job-
specific knowledge and skills by attending external training
conferences, seminars and activities. The training team should
be responsible for reviewing literature and recommending
which employees should attend specific courses to enhance
their skills and knowledge. The benefits of the external training
should be discussed with senior management. There are
several organizations that provide seminars, training classes
and symposia including the American Society for Quality, the
Parenteral Drug Association, the American Chemical Society,
and for-profit organisations.
Special training
Companies need to recognise there may be occasions when
special training is required for employees. The responsibility
for determining the need for special training will reside with
the training team but should be performed using qualified
trainers with recognised expertise in the specific discipline
being addressed. Using qualified trainers in this situation
assures the attendees will be trained by experts that will
understand questions that may arise during training. As with
all training, a record of the training should be put into the
employee’s personnel folder.
When a company invests in the future of its employees by
establishing a comprehensive training programme, they need
evidence that the monies were well spent. To assure continued
funding for training, management should establish metrics to
monitor performance as a practical measure of the ongoing
effectiveness of training activities. By continuing to invest in
training, companies invest in their employee’s futures and develop
a knowledgeable, skilled and experienced workplace as well as a
culture supporting continual improvement and growth. PTE
The Elements of TrainingEstablishing a well-defined training programme that ensures employees have the appropriate
combination of knowledge, skills and experience to perform their job functions is a crucial activity for any organisation.
Susan J. Schniepp
is vice-president of quality and
regulatory affairs at Allergy Laboratories
and is a member of the PharmTech
Editorial Advisory Board.
Join the discussion
Has your company invested in a well-defi ned training programme?
Post your comments on www.pharmtech.com/linkedin
or click the QR code with your smartphone to go directly
to the conversation.

24 Pharmaceutical Technology Europe SEPTEMBER 2013 PharmTech.com
JE
RE
MY
WO
OD
HO
US
E/G
ET
TY
IM
AG
ES
Report from:
BrazilHellen Berger
Pharma eyes biologics production in Brazil as the
government begins to recognise the
potential of these drugs.
In Brazil, there are indications that the pharmaceutical industry
has been living relatively comfortably despite global difficulties.
Due to improved wages and jobs created over the past few
years, thousands of Brazilians who never had access to drugs
have been investing in healthcare and purchasing medicines, not
only to treat illnesses but also as a means of prevention.
According to the Brazilian Association of National
Laboratories Distributors (Abradilan), figures from IMS Health
show that sales of pharmaceutical drugs in Brazil are expected
to rise 15–20% this year compared to (Brazilian Real) R$49.6
billion (approximately US$21.6 billion) in 2012. The Gross
National Product (GNP) for 2013 is expected to be 2.28% higher
this year, according to Brazil’s Central Bank.
In 2011, the so-called “C class,” which represents 53% of
the 200-million population in Brazil, contributed to 42% of the
domestic sales of pharmaceutical drugs in 2011, while the
wealthy “A and B classes” were responsible for 48% of total
sales, according to IMS Health. Companies operating in Brazil are
beginning to understand that it is important to target the middle
class as they outnumber the wealthier classes and are willing to
pay for all types of goods, including pharmaceuticals. As a result,
production of pharmaceutical drugs is on the rise despite the high
costs and taxes in Brazil. Investment plans, however, are ongoing
with opportunities seen ahead, especially for biological drugs.
Government plans include local production
Biological drugs are cellular- or tissue-based medical
products. They include, among others, vaccines, blood
components and living cells used to treat various diseases.
The production is mainly though gene-modification processes,
rather than synthetic. Producers have reported that biological
drugs have greater accuracy to treat illnesses according to the
Industry Syndicate of Pharmaceutical Products in the State of
São Paulo (Sindusfarma).
In an interview with Pharmaceutical Technology Europe, Nelson
Mussolini, executive president for Sindusfarma, said that “there
is no doubt that biological drugs have great potential in Brazil.
They will add to other drugs offered by the country’s public
health system to treat illnesses such as rheumatoid arthritis,
asthma and various types of cancer. This fact can be proven by
the actions developed by the Brazilian government to implement
local production of biological drugs, through its Health Ministry
and the Bank of Economic and Social Development (BNDES).”
According to Mussolini, Sindusfarma associates correspond
to more than 90% of Brazil’s pharmaceutical market
share, hosting companies that promote both national and
international research as well as commercialise biologics and
biosimilar products. “The health ministry would guarantee
purchasing these drugs under the public health system and
The government is willing to pay as much as 25%
more for locally produced biological drugs compared
to what it pays for imported products.

Pharmaceutical Technology Europe SEPTEMBER 2013 25
the BNDES would guarantee funding and financing for research
and production of biological products,” added Mussolini.
The topic of biologics production has definitely caught the
interest of policy makers, and the pharmaceutical industry
sees it as an opportunity given that the government in Brazil
is developing the biologics market. The Brazilian government
strongly supports research partnerships in this field and is
encouraging local production of biological drugs. According to
Sindusfarma, the government is willing to pay as much as 25%
more for locally produced biological drugs compared to what it
pays for imported products.
Mussolini noted that while Argentina is also taking steps to
localise production of biologics, Brazil will likely be the main
player in Latin America for these products because of its growing
pharmaceutical market. Although the biologics market is in its
infancy and, therefore, specific figures are difficult to obtain,
investments in this area have already been officially confirmed.
New production facility confirmed
Novartis told Pharmaceutical Technology Europe that the
company will be building a new facility to produce biological
drugs in Brazil. The Swiss pharmaceutical company will invest
R$1 billion (approximately US$ 435 million) in a unit located
in Jaboatão dos Guararapes, in the Northeastern state of
Pernambuco, to produce vaccines against Hepatitis B.
Novartis Brazil said this plant will be the company’s first
vaccine production site in Latin America. Construction is
expected to be completed by June 2014, while production has
been scheduled to start in 2016 according to the company.
According to Novartis, the company plans to export part of its
vaccines output from the new plant and gradually transform the
unit into a full-scale biologics producer. Novartis and Brazil’s federal
government have signed transfer-of-technology (TOT) deals to
produce drugs in government-owned facilities, hence, making the
country less dependent on imported products and technologies.
Novartis is not the only company to sign TOT deals with the
federal government. The country’s health ministry stated that
it is negotiating approximately 27 deals with public and private
laboratories to produce as many as 14 biological drugs nationally.
The ministry’s objective is to increase the number of locally
produced biological drugs for the treatment of breast cancer,
leukemia, rheumatoid arthritis and diabetes among others.
According to government figures, the country would save around
R$225 million (approximately US$ 97.8 million) a year with local
production, using transferred state-of-the-art technology. With
so many incentives, perhaps many other eyes will soon turn to
the biological products market in Brazil. PTE
— Hellen Berger is a business news correspondent
based in São Paulo, Brazil.
CleanFlex® CLEAN ROOM PACKAGING
www.bk-international.comCleanFlex® class 5 clean room packaging produced in accordance with DIN EN ISO 14644-1 at rest

lum
pyn
oo
dle
s/G
ett
y Im
ag
es;
Da
n W
ard
The science- and risk-based approach in quality by
design (QbD) entails greater product and process
understanding as a means to ensure product quality.
These concepts are embodied in ICH guidelines
Q8 (R2) Pharmaceutical Development, Q9 Quality
Risk Management, Q10 Pharmaceutical Quality
System, and most recently, Q11 Development and
Manufacture of Drug Substances (Chemical Entities
and Biotechnological/Biological Entities) (1–4), which
offer a lifecycle approach to continual improvement to
drug manufacturing.
Traditional versus enhanced approachesICH Q11 focuses specifically on the development and
manufacture of drug substances. It specifies that
a company can follow “traditional” or “enhanced”
approaches or a combination of both in developing
a drug substance (4). In the traditional approach, set
points and operating ranges for process parameters
are defined, and the drug-substance control strategy is
typically based on process reproducibility and testing
to meet established acceptance criteria (4). In an
enhanced approach, risk management and scientific
knowledge are used more extensively to identify and
understand process parameters and unit operations
that affect critical quality attributes (CQAs) (4). The
enhanced approach further includes the development
of appropriate control strategies applicable over the
lifecycle of the drug substance that may include the
establishment of design space(s) (4).
Manufacturing process development should include,
at a minimum, according to ICH Q11:
t� Identifying potential CQAs associated with the drug
substance so that those characteristics having an
impact on drug-product quality can be studied and
controlled
t� Defining an appropriate manufacturing process
t� Defining a control strategy to ensure process
performance and drug-substance quality (4).
An enhanced approach to manufacturing process
development would additionally include:
t� A systematic approach to evaluating, understanding
and refining the manufacturing process,
including identifying—through prior knowledge,
experimentation and risk assessment—the material
attributes (e.g., of raw materials, starting materials,
reagents, solvents, process aids, intermediates) and
process parameters that can have an effect on drug
substance CQAs
t� Determining the functional relationships that link
material attributes and process parameters to drug
substance CQAs (4).
The enhanced approach, in combination with
quality risk management, is used to establish an
appropriate control strategy. Those material attributes
and process parameters important to drug-substance
quality should be addressed by the control strategy.
The risk assessment can include an assessment of
manufacturing process capability, attribute detectability
and severity of impact as they relate to drug-substance
Quality by Design for APIsThe adoption of quality by design in small-molecule drug development and manufacturing
continues to evolve as the industry seeks ways to augment process understanding for APIs.
Patricia Van Arnum
is Executive Editor of
Pharmaceutical Technology
Europe.
26 Pharmaceutical Technology Europe SEPTEMBER 2013 PharmTech.com

SUPER REFINED OILS are naturally derived oils purified using Croda’s
proprietary chromatography process, which removes polar and oxidative
impurities. Super Refining improves the oxidative stability of the triglyceride
without altering the natural fatty acid composition. This reduces the potential
for adverse interactions between the excipient and the active ingredient,
enhancing the stability and performance of the active.
Super Refined™ Oils
Enhanced BioavailabilityThrough High Purity Lipid Vehicles
Q Dramatically reduces impurity profile
Q Improves oxidative stability
Q Enhances API stability
Q Universally accepted excipients
Available products include:
Super Refined™ Castor Oil
Super Refined™ Corn
Super Refined™ Cottonseed
Super Refined™ Olive
Super Refined™ Peanut
Super Refined™ Safflower
Super Refined™ Sesame
Super Refined™ Soybean
Europe, Middle East & Africa email:[email protected] www.croda.com/healthcare North America email:[email protected] www.croda.com/healthcareLatin America email:[email protected] www.croda.com/healthcareAsia Pacific email:[email protected] www.croda.com/healthcare

QbD for APIs
quality (4). For example, when assessing the link between
an impurity in a raw material or intermediate and drug-
substance CQAs, the ability of the drug-substance
manufacturing process to remove that impurity or its
derivatives should be considered in the assessment (4).
The risk related to impurities can usually be controlled by
specifications for raw material/intermediates and/or robust
purification capability in downstream steps. It is important to
understand the formation, fate (whether the impurity reacts
and changes its chemical structure), and purge (whether the
impurity is removed via crystallisation, extraction, etc.) as
well as their relationship to the resulting impurities that end
up in the drug substance as CQAs (4). The process should be
evaluated to establish appropriate controls for impurities as
they progress through multiple process operations (4).
Understanding regulatory expectationsIn March 2011, the European Medicines Agency and US Food
and Drug Administration launched a three-year pilot program
for a parallel assessment by both agencies of certain quality
and chemistry, manufacturing and control (CMC) sections of
new drug applications submitted to FDA and marketing
authorisation applications (MAAs) submitted to EMA that are
relevant to QbD, such as development, design space and
real-time release testing. The objective of the pilot, which is
scheduled to end 31 Mar. 2014, is to ensure consistent
implementation between the European Union and the
United States of ICH guidelines Q8, Q9, Q10 and Q 11 and to
facilitate sharing of regulatory decisions (5–7).
In August 2013, the agencies reported that the first
EMA–FDA parallel assessment of QbD elements of an initial
MAA was successfully finalised as
well as some consultative advice
procedures. In a question-and-answer
format, the EMA and FDA reported on
their expectations as they relate to
quality target product profiles (QTPPs), CQAs, classification
of criticality and application of QbD in analytical method
development (7).
With respect to the QTPP, the agencies specified that
they expect applicants to provide the QTPP, which describes
prospectively the quality characteristics of a drug product
that should be achieved to ensure the desired quality, safety
and efficacy of the drug product. With respect to CQAs,
the agencies expect applicants to provide a list of CQAs
for the drug substance, finished product and excipients
when relevant. This list should also include the acceptance
limits for each CQA and a rationale for designating these
properties as a CQA. Furthermore, there should be a
discussion of how the drug substance and excipient
CQAs relate to the finished product CQAs based on prior
knowledge, risk assessment or experimental data. The basis
of the control strategy is to ensure that the drug substance
and finished product CQAs are consistently within the
specified limits (7).
Another issue was whether the agencies would
accept a three-tier classification of criticality for process
parameters. The agencies responded that ICH Q8 (R2)
specifies that a critical process parameter is one whose
variability has an impact on a CQA and needs to be
monitored or controlled to ensure the process produces
the desired quality. EMA and FDA cited a regulatory
submission in which the applicant proposed an approach
to risk assessment and determination of criticality that
included a three-tier classification (“critical,” “key,” and
“noncritical”) for quality attributes and process parameters.
Using this classification, a “critical” factor was defined as
a factor that led to failure during experimentation. A factor
that had not led to failure within the range studied, but still
may have an impact on product quality, was considered as a
“key” factor. The agencies said that they do not support the
use of the term “key process parameters (KPP)” because it
is not ICH terminology and there is differing use of the term
“key” among applicants. Although FDA and EMA said they
are amenable to this terminology in the pharmaceutical
development section to communicate development
findings, they are not in describing the manufacturing
process, process control and control of critical steps and
intermediates, where the description of all parameters that
have an impact on a CQA should be classified as critical (7).
The agencies further specified that process manufacturing
descriptions be comprehensive and describe process steps
in a sequential manner, including batch size(s) and equipment
type. The critical steps and points at which process controls,
intermediate tests or final product controls are conducted
Those material attributes and process parameters that are found to be important to drug-substance quality should be addressed by the control strategy.
Rapid Microbial SolutionsCharles River pairs Endosafe® rapid endotoxin
testing systems with Accugenix® contract microbial
LGHQWLÀ�FDWLRQ�VHUYLFHV�WR�RIIHU�D�FRPSOHWH�4&�WHVWLQJ�
VROXWLRQ��:KHWKHU�IDFHG�ZLWK�FULWLFDO�WLPHOLQHV�RU�
stringent regulations, you can rely on Charles River to
HQVXUH�VDIH�PDQXIDFWXULQJ�DQG�WLPHO\�SURGXFW�UHOHDVH�
Learn more at www.criver.com/emd.
28 Pharmaceutical Technology Europe SEPTEMBER 2013 PharmTech.com

The new platform excipient for tablets, sachets and mores� �lRST�RATE�lLLER BINDER�PROPERTIES�DUE�TO�EXCELLENT�COMPRESSIBILITYs� �FAST�AND�SLOW�DISINTEGRATING�TABLETS��CHEWABLES��EFFERVESCENTS���SUCKABLES��&$$4Sx
s� �IDEAL�IN�SACHETS�FOR�DIRECT�ORAL�APPLICATION��OR�DRY�SUSPENSIONS
s� OUTSTANDING�mOW�AND�MIXING�PROPERTIESs� HIGH�DILUTION�POTENTIAL�AND�HIGH�CONTENT�UNIFORMITYs� VERY�LOW�HYGROSCOPICITY�AND�EXCELLENT�STABILITYs� '-/ FREE�AND�NON ANIMAL�ORIGIN
BENEO-Palatinit GmbH�q�0HONE������������� ����q�GALEN)1 BENEO�COM�q�WWW�GALEN)1�COM
The Smart Bulk Excipient
Come and visit us at
09. – 11. October 2012&ERIA�DE�-ADRID��3PAIN
3TAND���#��

should be identified (7). Steps in the process should have
the necessary detail in terms of appropriate process
parameters along with their target values or ranges. The
process parameters that are included in the manufacturing
process description should not be restricted to the critical
ones; all parameters that have been demonstrated during
development as needing to be controlled or monitored during
the process to ensure that the product is of the intended
quality need to be described (7).
The agencies also commented on QbD as it relates to
analytical methods using risk assessments and statistically
designed experiments to define analytical target profiles
(ATP) and method operational design ranges (MODR) for
analytical methods (7). “There is currently no international
consensus on the definition of ATP and MODR,” noted
the agencies. “Until this is achieved, any application that
includes such proposals will be evaluated on a case-by-
case basis” (7). The agencies noted, however, that an ATP
can be acceptable as a qualifier of the expected method
performance by analogy to the QTPP as defined in ICH
Q8 (R2), but the agencies would not consider analytical
methods that have different principles (e.g., high-
performance liquid chromatography and near-infrared [NIR]
spectroscopy) equivalent solely on the basis of conformance
with the ATP. “An applicant should not switch between
these two types of methods without appropriate regulatory
submission and approval,” they said. The agencies also
noted that similar principles and data requirements could
apply for MODRs. For example, data to support an MODR
could include: appropriately chosen experimental protocols
to support the proposed operating ranges/conditions and
demonstration of statistical confidence throughout the
MODR. Issues for further reflection include the assessment
of validation requirements as identified in ICH Q2 (R1)
throughout the MODR and confirmation of system suitability
across all areas of the MODR (7). The agencies further
indicated that future assessment of the pilot program will
include other lessons learned in areas such as design-space
verification, the level of detail in submissions for design
space and risk assessment, continuous process verification
and continuous manufacturing.
QbD at workA review of recent literature reveals some interesting
applications of QbD in drug-substance development and
manufacturing. For example, scientists at Bristol-Myers
Squibb reported on a process-modeling method using a
QbD approach in the development of the API ibipinabant, a
cannabinoid receptor 1 antagonist being developed to treat
obesity (8). In its development, the molecule had volume
requirements of 6 kg for toxicology studies and formulation
development, which later increased to 175 kg for late-
stage clinical trials. The researchers used mechanistic
kinetic modeling to understand and control undesired
degradation of enantiomeric purity during API crystallisation.
They implemented a work flow, along with kinetic and
thermodynamic process models, to support the underlying
QbD approach and reported on the use of risk assessment,
target quality specifications, operating conditions for
scale-up and plant control capabilities to develop a process
design space. Subsequent analysis of process throughput
and yield defined the target operating conditions and normal
operating ranges for a specific pilot-plant implementation.
Model predictions were verified from results obtained
in the laboratory and at the pilot-plant scale (8). Future
efforts were focused on increasing fundamental process
knowledge, improving model confidence and using a risk-
based approach to re-evaluate the design space and select
operating conditions for the future scale-up (8).
Scientists at Merck & Co. reported on their work in
applying QbD to set up an improved control strategy for the
final five steps in the production route of a legacy steroidal
contraceptive, which has been produced for more than 20
years within its facilities (9). A generic ultra-high-performance
liquid chromatography method was developed according
to QbD principles to create a range of proven acceptance
criteria for the assay and side-product determination for the
final five steps in the production route of the API (9).
Scientists at Eli Lilly reported on a systematic approach
consisting of a combination of first-principles modeling
and experimentation for the scale-up from bench to
pilot-plant scale to estimate the process performance
at different scales and study the sensitivity of a process
to operational parameters, such as heat-transfer driving
force, solvent recycle and removed fraction of volatiles
(10). This approach was used to predict process outcomes
at the laboratory and pilot-plant scale and to gain a better
understanding of the process. The model was also used
further to map the design space (10).
contin. on page 70
Handling equipment
– Lifting, weighing, blending,
pallet transfer
– Mobile or stationary
– Manual or fully automatic
– Loads up to 2500 kg handled
– Hygienic stainless steel
– GMP-compliant design
– ATEX conformity
Müller GmbH - 79618 Rheinfelden (Germany)Industrieweg 5 - Phone: +49(0)7623/969-0 - Fax: +49(0)7623/969-69A company of the Müller group [email protected] - www.mueller-gmbh.com
For p e r f e c tp r o d u c t i o n
methods
QbD for APIs
30 Pharmaceutical Technology Europe SEPTEMBER 2013 PharmTech.com

Good to know.
If you’d like to know more good reasons for a long-term partnership with us, go to www.evonik.com/exclusive-synthesis
With a reactor volume of 135 m3 for
manufacturing on a ton scale, 35 m3 for
small and development quantities and
an Occupational Exposure Level < 0.1 μg/m3
Evonik can ramp up for lab or bulk
quantities under best in class conditions.
And do it fast. That is why leading
pharma companies trust in our experts
and Highly Potent API custom manufacturing capabilities.
Visit us at CPhI
22 – 24 Oct 2013
Booth 31F32
Hall 3.1

IFo
tose
arc
h/g
ett
y im
ag
es
The global market for biosimilar drugs has been
forecasted to be worth $2.445 billion in 2013 (1).
The growth corresponds to a 20% increase from last
year’s figures and accounts for approximately 2% of
the overall biologics market (1). Although narrowly
focused on only a few therapy areas at present,
the biosimilars market is set to expand over the
next decade and beyond as a result of two major
factors: the impending patent expiries on blockbuster
biologics and the financial crisis that is driving payers
to push for wider adoption of biosimilars to manage
the escalating costs of healthcare.
Many companies are keen on getting a share in
the biosimilars market given its promising outlook;
however, bringing these complex molecules from
bench to launch can be a challenge, not just during
the development stage but also in terms of the
manufacturing process involved. Pharmaceutical
Technology Europe conducted a roundtable to gain
further insight on this topic. Participants included:
Sheen-Chung Chow, PhD, professor, Department of
Biostatistics and Bioinformatics at Duke University
School of Medicine; Christina Satterwhite, PhD,
director of laboratory sciences, Charles River
Laboratories; Fiona Greer, PhD, global director,
biopharma services development, Bruno Speder,
team leader of clinical trial regulatory affairs, Clinical
Research, and Rabia Hidi, PhD, director of biomarkers
& biopharmaceutical testing, Laboratory Services, all
three at Life Sciences Services at SGS.
The complex nature of biosimilarsPTE: Why are biosimilars not approved in the
same way as generics?
Chow (Duke University): The
regulatory approval pathway is well
established for generic drugs;
however, it cannot be applied to
biosimilars due to fundamental
differences between generic drugs
and biosimilars. For example,
generic drugs are small-molecule
drug products that contain
‘identical’ active ingredient(s) as the
branded drug. Biosimilars, on the
other hand, are made of living cells
or living organisms that are sensitive
to environmental factors such as light and temperature
during the manufacturing process. Biosimilars usually
have mixed and complicated structures that are difficult,
if not impossible, to characterise. As a result, biosimilars
are not generic drugs.
Industry experts discuss the requirements and challenges
involved in getting a biosimilar product from bench to launch.
Adeline Siew, PhD
Sheen-Chung Chow,
PhD, professor,
Department of
Biostatistics and
Bioinformatics,
Duke University
School of Medicine
The Importance ofCharacterisation inBiosimilars Development
32 Pharmaceutical Technology Europe SEPTEMBER 2013 PharmTech.com

ASAHI KASEI CHEMICALS CORPORATION
FUNCTIONAL ADDITIVES DIVISION
1-105 Kanda Jinbocho, Chiyoda-ku
Tokyo 101-8101 Japan
P:+81-3-3296-3361 F:+81-3-3296-3467
www.ceolus.com
Ceolus™ UF’s extraordinary compactibility
and flow allow formulation and tablet
efficiency to take flight...
Their unique morphology gives the Ceolus UF microcrystalline cellulosegrades an unparalleled combination of compactibility and flow. Formulatingwith Ceolus UF delivers smaller, harder, more efficient tablets than you ever thought possible.
Ceolus UF-711 – for direct compression of poorly compactible, high-dose actives using gravity feeding.
Ceolus UF-702 – for the greatest flow improvement and remarkable tablet hardness via direct compression
Microcrystalline Cellulose
USP/NF, EP, JP
Together we can make your formulation take flight...
CEOLUSTM

Biosimilars
Greer (SGS):
Biosimilar drugs
cannot be
regarded in the
same way as
generics. The
exact structure
of small-molecule
synthetic
drugs and their
impurities can
be well defined chemically, which
enables generic manufacturers to
avoid full, costly clinical studies
if they are able to establish that
their product is ‘bioequivalent’ in
pharmacokinetic studies to the
branded or listed drug. However,
unlike small-molecule drugs,
biologically derived products are
large, complex protein molecules,
usually comprising of a mixture
of closely related species that
undergo post-translational
modifications, which influence
the anticipated protein structure.
When produced in mammalian
expression systems, these proteins
can also be glycosylated (i.e.,
the carbohydrate is attached to
the protein backbone), thereby,
further increasing the amount of
heterogeneity in the glycoforms
produced.
In addition, the complexities
of cellular expression and
biomanufacturing make exact
replication of the originator’s
molecule nearly impossible; the
process will certainly be different.
Moreover, parameters such as the
three-dimensional structure, the
amount of acido-basic variants, or
post-translational modifications
(e.g., the glycosylation profile) can
be significantly altered by changes,
which may initially be considered
to be ‘minor’ in the manufacturing
process, but can greatly affect
the safety and efficacy profiles of
these products. Biosimilars are,
therefore, not simple generics.
The fundamental difference with
complex protein molecules is that
they cannot be absolutely identical
to the original. Instead, companies
developing these ‘copies’ must
demonstrate that they are similar
by performing a side-by-side
comparison with reference samples
of the originator.
Satterwhite
(Charles River):
Biosimilars are
not approved
in the same
way as generics
because they are
similar but not
identical to the
original biological
products due to
the manufacturing processes used to
generate these types of molecules.
A biosimilar is a biologically derived
product that can have subtle
structural differences with each
manufacturing process, which may
result in different properties.
The road to approvalPTE: Could you briefly describe
the legal and regulatory approval
pathways for biosimilars in Europe
and the United States?
Speder (SGS):
Both the European
and US regulatory
pathways depend
on being able
to demonstrate
‘biosimilarity’
involving rigorous
comparison
against batches of
originator product,
initially at the physicochemical level,
then in a step-wise manner in safety,
potency and clinical studies. Only an
originator product that was licensed on
the basis of a full registration dossier
can serve as a reference product
(i.e., centralised procedure in Europe
and new drug application in the US).
Both in Europe and the US, extensive
consultation with the European
Medicines Agency (EMA) and the US
Food and Drug Administration (FDA),
respectively, is required.
Greer (SGS): The European Union
established the first legal regulatory
guidelines for ‘similar biological
medicinal products’ (i.e., biosimilars)
(2–4). Subsequently, specific product
annexes were published (5). Several
of the original guidelines have been,
or are in the process of being,
revised. The first biosimilar molecule
approved in Europe in April 2006 was
Omnitrope, a version of somatropin.
All guidelines, plus current revision
concept papers and drafts, are
available on the EMA website (5).
Meanwhile, in the US, the Biologics
Price Competition and Innovation Act
(BPCIA) provides a new pathway for
biosimilars—the 351(k) route of the
Public Health Service (PHS) Act. This
pathway also requires comparison
of a biosimilar molecule to a single
reference product that has been
approved under the normal 351(a)
route with reference to prior findings
on safety, purity and potency. In
contrast, one aspect of the legislation
unique to the US is the provision for
two levels of product—’biosimilar’
and ‘interchangeable biosimilar.’ An
interchangeable biological product
is one that may be substituted
for the reference product without
the intervention of the healthcare
provider who prescribed the
reference product. Therefore, more
data are required for a product to be
labeled as interchangeable rather
than biosimilar.
In February 2012, FDA published
three draft guidance documents to
assist biosimilar developers: Scientific
Considerations in Demonstrating
Biosimilarity to a Reference Product
(6), Quality Considerations in
Demonstrating Biosimilarity to a
Reference Protein Product (7) and
Biosimilars: Questions and Answers
Regarding Implementation of the
Biologics Price Competition and
Innovation Act of 2009 (8). Earlier this
year, a fourth guidance, dealing with
scientific meetings, was issued (9).
Satterwhite (Charles River): The
EU has developed a science-based
regulatory guidance framework
from 2005 to the present to ensure
high-quality biosimilar drugs. The
biosimilars pathway in the US was
created under the Patient Protection
and Affordable Care Act in 2010;
however, US regulations are still
Fiona Greer, PhD,
global director,
biopharma services
development, SGS
Christina
Satterwhite, PhD,
director of laboratory
sciences, Charles River
Bruno Speder,
team leader of clinical
trial regulatory affairs,
Clinical Research, SGS
Biosimilars are made of living cells or living organisms that are sensitive to environmental factors such as light and temperature during the manufacturing process.—Chow
34 Pharmaceutical Technology Europe SEPTEMBER 2013 PharmTech.com

“Best Contract Manufacturing Organization” Vaccine Industry Excellence Awards (2010-2012) Third Year in a Row
For more information, visit
baxterbiopharmasolutions.com
Visit us at:
ICSE at Booth #10E25
Baxter and Galaxy are registered trademarks of Baxter International Inc. 920810-00 6/12
Meet with us at:
�����*$4&�o�#PPUI����(��

Biosimilars
pending. Three draft guidances
were released in February 2012
with a focus on the analytical
characterisation and totality of
evidence approach to the program.
A fourth draft guidance was
released in 2013 that emphasised
formal meetings between the
sponsor and regulators. Many
pharmaceutical and biotechnology
companies are moving forward
using the International Conference
on Harmonisation (ICH) and FDA
regulatory guidances currently
governing biologic submissions
and strategies that incorporate the
EU biosimilar regulatory guidance.
Although the draft guidance is
available, there remains some
confusion within the industry.
Bioequivalence testingPTE: Can you explain the
procedures for testing the
bioequivalence of biosimilars and
how it differs from bioequivalence
testing for generic drugs?
Chow (Duke University): The
current regulation for approval of
generic-drug products is based on
testing for average bioequivalence.
For assessment of biosimilars,
it is suggested that testing for
biosimilarity should focus on
variability rather than average
bioavailability alone. Besides, it has
been criticised that the one-size-
fits-all criterion is not appropriate for
assessment of biosimilars.
Satterwhite (Charles River):
One of the major differences in the
testing of biosimilars as opposed
to generics is that the drug-
development package must not only
test structure but also function. A
biosimilar program should commence
with a strong analytical package that
typically incorporates the testing
of protein quantity and purity,
amino-acid sequence, glycosylation,
physicochemical properties and
aggregation analysis. Lot release
and stability testing should also
be incorporated. In addition, these
properties need to be known for the
originator drug and multiple lots of
the originator drug should, therefore,
be evaluated. The type of functional
tests evaluated should be based
on the mechanism of action of the
drug. For example, an anti-CD20
monoclonal antibody may include
the following assessments: antibody-
dependent cell-mediated cytotoxicity
(ADCC) assay, complement
dependent cytotoxicity (CDC) assay,
flow-cytometry apoptosis assay,
flow-cytometry binding assay and Fc
receptor assays.
Speder (SGS): Testing the
bioequivalence of biosimilars differs
from that of standard generics, both
in the nonclinical testing as well as
in the design of the clinical studies.
The bioequivalence of generics
is compared in a randomised,
two-period, two-sequence, single-
dose, crossover-design study.
The treatment periods should be
separated by a wash-out period
sufficient to ensure that drug
concentrations are below the lower
limit of bioanalytical quantification
in all subjects at the beginning of the
second period. Normally, at least five
elimination half-lives are necessary
to achieve this. In most cases,
no nonclinical studies need to be
conducted on the generic product.
For biosimilars, most of which
have long half-lives, a crossover
study would be ineffective and
unethical due to the fact that the
wash-out period would be quite long.
The patient is not allowed to take the
drug during this wash-out period,
and hence, will have no treatment for
his/her condition. Therefore, parallel-
group studies are required, but these
studies do not provide an estimate
of within-subject variation. For
biosimilars, extensive head-to-head
nonclinical testing with the originator
product is required.
Characterisation studiesPTE: Why is structural and
functional characterisation
especially important for
biosimilars?
Satterwhite (Charles River):
The analytical packages that are
required for a robust program should
be conducted prior to any in-vivo
testing. The structural in-vitro tests,
along with the functional in-vitro
tests, provide necessary information
to assess the biosimilarity of the
molecules. Similarity is difficult to
establish as different manufacturing
processes can result in differences
in glycosylation sites as well as
aggregates. It is important that
The increasing demand for good-quality healthcare
comes with the challenge of controlling healthcare
expenditure. Biosimilars offer the potential of increasing
access to much-needed biologic medicines for patients
at a reduced cost, but as this new class of therapeutics
is introduced into healthcare systems worldwide, there
must be an uncompromising commitment to patient
safety, which starts with high regulatory approval
standards and ongoing manufacturer accountability. In
this article, Martin Van Trieste, senior vice-president of
quality at Amgen, explains how the development and supply of these complex
molecules is not only scientifically challenging but also capital intensive.
Developing a high-quality biologic medicine that is safe and effective requires
a commitment to manufacturing excellence and innovator companies often
need to invest up billions to bring a biologic product to market.
The full article is available at:
PharmTech.com/biosimilars_MartinVanTrieste
Biosimilars development and supply: how complex can the process be?
Martin Van Trieste,senior vice-president of quality at Amgen
One of the major differences in the testing of biosimilars as opposed to generics is that the drug-development package must not only test structure but also function.—Satterwhite
36 Pharmaceutical Technology Europe SEPTEMBER 2013 PharmTech.com


Biosimilars
analytical tests including structural
and functional characterisation
provide data in which subtle
differences are revealed and risk
assessment is conducted prior to
continuing to the next step in the
development program.
Greer (SGS): The development
pathway for a biosimilar is unlike
that of a novel biotherapeutic.
Undoubtedly, there is an increased
requirement for analytics. This
enhanced analytical effort, which
may be rewarded in the reduced
requirement for clinical trials,
entails initial physical, chemical
and biological characterisation of
the biosimilar in comparison to the
originator reference product. If found
to be ‘similar’ during this extensive
characterisation, subsequent
nonclinical and clinical data are
then required to demonstrate the
same safety and efficacy profiles as
the originator compound. However,
the premise is that the amount
of nonclinical and clinical data
required will be much less than for
a novel stand-alone application,
and generally, a Phase II trial is not
necessary. Extensive studies should,
therefore, be conducted to provide
comparative data for the biosimilar
side-by-side with the originator.
Strategies at this stage must
include assessment of primary
and higher-order structure as well
as batch-to-batch variation for
the biosimilar and the reference
product. In practice, analytical
characterisation will follow the
requirements of the ICH guideline
Q6B (10), including determination
of amino-acid sequence, post-
translational modifications, including
disulfide bridges and glycosylation,
and spectroscopic profiles.
One of the most important
analytical techniques for biomolecule
structural characterisation is mass
spectrometry (MS). Usually several
different types of instruments
are used in the detailed study of
a glycoprotein so that the overall
structure can be elucidated,
including electrospray–mass
spectrometry (ES–MS), online
ES–MS where the MS is coupled
to a high-performance liquid
chromatrography (HPLC), matrix-
assisted laser-desorption ionisation–
mass spectrometry (MALDI–MS), and
for derivatised carbohydrates, gas
chromatography–mass spectrometry
(GC–MS). Apart from the ability to
study nonprotein modifications such
as sulfation and phosphorylation,
the other major strength of an
MS approach is in the analysis
of mixtures, which has obvious
applications in the analysis of
heterogeneous glycoforms.
The objective of the comparative
study is to establish whether the
biosimilar has the same primary
protein sequence of amino acids as the
reference product. This can be done
by using classical protein sequencing
(automated Edman degradation),
peptide MS-mapping, MS/MS
sequencing and amino-acid analysis.
For products that are
glycosylated, characterisation of the
carbohydrate structure is essential
too. Glycosylation is arguably the
most important of the numerous
post-translational modifications,
but what is undeniable is that it
presents a unique challenge for
analytical methods. The population
of sugar units attached to individual
glycosylation sites on any protein
will depend on the host cell type
used, but it will be a mixture of
different glycoforms, on the same
polypeptide. Powerful MS-based
strategies can be used to analyse
both free (i.e., underivatised) and
derivatised samples to determine
sites of glycosylation of both
N- and O-linked structures, the
identity of terminal nonreducing
ends (potentially the most
antigenic structures) and the
types of oligosaccharide present.
Chromatographic anion-exchange
methods can also be used for glycan
profiling (i.e., the relative distribution
of carbohydrate structures).
In addition to MS, a host of other
analytical techniques should be used
to compare the structure of both the
biosimilar and originator at primary
and higher-order levels. Various
chromatographic, spectroscopic
and electrophoretic methods can
be used to interrogate and compare
on the basis of size, charge and
shape. Co- and post-translational
modifications, fragmentation,
aggregation, deamidation and
oxidation should all be studied and
compared. Techniques such as
near and far UV circular dichroism
provide information on the folding
and secondary and tertiary structure
of the protein and can be used in
Biologics are among the most expensive pharmacotherapies
as noted by IMS Health, and yet, there is a growing demand
for these specialty drugs as they continue to outperform in
the global market, delivering novel treatment alternatives
for a variety of diseases. The biologics market is fuelled by
launches of recombinant insulins, human growth hormones,
erythropoietins, granulocyte colony stimulating factors, and
the monoclonal antibodies, which are reported to have the
strongest R&D pipeline. Pharmaceutical Technology Europe
spoke to Mike Jenkins, general manager of Catalent Biologics
development and manufacturing facility in Madison, WI,
about the evolving landscape of the biologics market and the
development and manufacture of these innovative products.
The full interview is available at:
PharmTech.com/biosimilars_MikeJenkins
Gauging the outlook of the biologics market
Mike Jenkins, general manager of Catalent Biologics development and manufacturing facility in Madison, WI
Glycosylation is arguably the most important of the numerous post-translational modifications, but what is undeniable is that it presents a unique challenge for analytical methods.—Greer
38 Pharmaceutical Technology Europe SEPTEMBER 2013 PharmTech.com

&OR�FURTHER�INFORMATION��4EL��������������������s�&AX�������������������s�
WWW�TEREOS EXCIPIENTS�COM�s�WWW�STEVIA TEREOS PURECIRCLE�COM
Tereos,a bespoke service
for your excipients
TEREOS��PRODUCER�OF�SUCROSE BASED�EXCIPIENTS��OFFERS�A�WIDE�RANGE� OF�DIRECT�COMPRESSION��MILLED��SIEVED��AGGLOMERATED�OR�LIQUID�SUGARS�
THAT�lTS�THE�REQUIREMENTS�OF�EVERY�GALENIC�FORMULATIONS��TABLETS�� DRY�SYRUP��POWDER�SACHET��SYRUP�����
4HE�*OINT 6ENTURE�WITH�0URE#IRCLE��THE�WORLD�LEADER�IN�3TEVIA� EXTRACTS��4EREOS�0URE#IRCLE�3OLUTIONS�PROVIDES�A�WIDE�PORTFOLIO� OF�HIGH�PURITY�3TEVIA�EXTRACTS�AS�2EBAUDIOSIDE�!��
4HE�4EREOS�)NNOVATION�$EPARTMENT�IS�AT�YOUR�SERVICE�TO�SUGGEST� BESPOKE�SOLUTIONS�TO�MATCH�ALL�YOUR�NEEDS��
For further information: www.tereos-excipients.comwww.stevia-tereos-purecircle.com
CPhl:
Boot
h 61B
56 H
all 6.
1

Biosimilars
a comparative sense. Depending
on the molecule, nonroutine
techniques such as protein nuclear
magnetic resonance (NMR) and
x-ray crystallography may also
be used. In fact, a whole panel
of methods should be employed,
including orthogonal techniques to
analyse particular quality attributes.
The concept of ‘fingerprinting’ the
molecule has been raised in the
FDA guidelines.
It is clear from the new EU
guidelines that the primary protein
structure (i.e., the amino-acid
sequence) must be the same. The
guidelines, however, anticipate that
minor differences in post-translational
forms or product-related impurities
may exist and that these products
should be investigated with regard to
their potential impact on safety and
efficacy so that it is the total package
of data that will be taken into account
on a case-by-case basis. FDA has
adopted a similar approach, in that
the analytical characterisation should
show that it is ‘highly similar to the
reference product notwithstanding
minor differences in clinically inactive
components.’
Hidi (SGS): An
initial step of the
comparability
exercise is the
analysis of the
primary structure
of the molecule.
Change in the
primary structure
of a biotherapeutic
compound could
affect the down-
stream higher-order composition,
which could have impacts on the
clinical activity. Essentially the
tridimensional structures (tertiary
or quaternary) are very important
as they could greatly impact the
biological function. Finally, post-
transcriptional modifications (e.g.,
phosphorylation, glycosylation,
lipid attachment and/or intentional
modifications, such as PEGylation),
should be thoroughly characterised
as these can affect all forms
of higher-order structure and
can impact efficacy as well as
immunogenicity in the clinic.
Functional assays for testing
biological activity can play an
important role in filling the gaps in
data from higher-order structural
qualities. Bioassays should be
developed for high precision
and sensitivity to detect in-vitro
functional differences between
the biosimilar and the reference
compound. These assays should
express the relative potency in
which the activity of the biosimilar
is determined by comparison to the
reference compound according to
European Pharmacopoeia and US
Pharmacopeia recommendations.
Ideally, bioassays should allow an
assessment of all functional domains
of a biosimilar candidate during
comparison to the originator. An
example of multifunctionality is the
therapeutic monoclonal antibodies.
Conventional assays for testing the
functions of Fab and Fc domains of
therapeutic antibodies are widely
available. These include in-vitro
target binding (either on intact cells
or using soluble target), ADCC, CDC,
programmed cell death (PCD) and
surface plasmon resonance (SPR) Fc
receptor binding assays.
References1. Visiongain, “Biosimilars and Follow-On
Biologics: World Market 2013–2023,”
www.visiongain.com/Report/1039/
Biosimilars-And-Follow-On-Biologics-
World-Market-2013-2023, accessed
5 Aug. 2013.
2. EMA, Guideline on Similar Biological
Medicinal Products (London, Sept.
2005).
3. EMA, Similar Biological Medicinal
Products Containing Biotechnology-
Derived Proteins as Active Substance:
Quality Issues (London, Feb. 2006).
4. EMA, Guideline on Similar Biological
Medicinal Products Containing
Biotechnology-Derived Proteins as
Active Substance: Nonclinical and
Clinical Issues (London, Feb. 2006).
5. EMA website, “Multidisciplinary:
Biosimilars” www.ema.europa.eu/
ema/index.jsp?curl=pages/regulation/
general/general_content_000408.
jsp&mid=WC0b01ac058002958c,
accessed 5 Aug. 2013.
6. FDA, Guidance for Industry: Scientific
Considerations in Demonstrating
Biosimilarity to a Reference Product
(Rockville, MD, Feb. 2012).
7. FDA, Guidance for Industry: Quality
Considerations in Demonstrating
Biosimilarity to a Reference Protein
Product (Rockville, MD, Feb. 2012).
8. FDA, Guidance for Industry:
Biosimilars: Questions and Answers
Regarding Implementation of the
Biologics Price Competition and
Innovation Act of 2009 (Rockville, MD,
Feb. 2012).
9. FDA, Guidance for Industry: Formal
Meetings Between the FDA and
Biosimilar Biological Product Sponsors
or Applicants (Rockville, MD, Mar.
2013).
10. ICH Q6B Test Procedures
and Acceptance Criteria for
Biotechnological/Biological Products,
Step 4 version (Mar. 1999). PTE
The extended version of this article, which includes a discussion on the safety issues that must be considered when developing a biosimilar product, is available at PharmTech.com/biosimilars_characterisation.
Bioassays should be developed for high precision and sensitivity to detect in-vitro functional differences between the biosimilar and the reference compound.—Hidi
Rabia Hidi, PhD,
director of biomarkers
& biopharmaceutical
testing, Laboratory
Services, SGS
Ideally, bioassays should allow an assessment of all functional domains of a biosimilar candidate during comparison to the originator.—Hidi
Join the discussion
What is the best way to ensure high precision manufacturing of
quality biologic products?
Post your comments on www.pharmtech.com/linkedin or click
the QR code with your smartphone to go directly to the conversation.
40 Pharmaceutical Technology Europe SEPTEMBER 2013 PharmTech.com

CPHI Stand (ICSE area) - 42L13

Joerg Zimmermann
is director of process
development and
implementation at Vetter,
www.vetter-pharma.com.
(Sp
otl
igh
t im
ag
e)
Sto
ckb
yte
/Ge
ttyIm
ag
es
TROUBLESHOOTING
RABS maximise product control but minimise operator interaction.
Best Practices forRestricted AccessBarrier Systems
It seems intuitive that the manufacture of
pharmaceutical products must be free of all
contamination risk. After all, patients must rely on
the safety of the final product. Looking back, as early
as 1822, a French pharmacist demonstrated that
physicians could use solutions that contained chlorides
of lime or soda as disinfectants. He concluded
independently that the hands of health personnel
spread puerperal fever and that sterilisation measures
could be taken to prevent transmission of pathogens.
Today, almost 200 years later and with approximately
2200 commercial production lines in conventional
cleanrooms in operation worldwide (1), we still deal
with the introduction of the human element as we seek
the highest possible level of sterility and the prevention
of cross contamination in aseptic manufacturing. In
the highly competitive and global world of parenteral
manufacturing, along with ever-growing costs and
increasingly stricter regulatory demands, optimised
processes to reduce contamination sources are essential.
Since the early 1990s, two systems emerged that
have helped the manufacturer assure a higher level
of contamination-free product—the isolator and the
restricted access barrier system, commonly referred to
as RABS. The isolator was the first system developed
to help enable a high level of sterility. By definition, the
isolator allowed for full isolation of the machinery from
the environment. Such units help keep the processing
of the product separate from human intervention.
In the earlier phase of its development, technical
issues and discussions around validation of sterilisation
or decontamination of the isolator were a problem.
These issues have since been overcome and vast
improvements have helped make the isolator a
safe and proven process that is used in over 430
commercial lines (1). However, the limitation of the
isolator continues to be lengthy changeover time. Thus,
isolators are most effective in mono-lines that run
the same product continuously, especially products
requiring containment such as potent/cytotoxic drugs.
The second manufacturing system developed in the
mid-90s was the RABS (see Figure 1). Recently, the
demand for RABS lines has become more prominent.
A primary reason for this development is the enhanced
flexibility RABS offers beyond the isolator. RABS can
allow for faster start-up time, ease of changeover, and
reduced capital costs, particularly with retrofits and
renovations. As a result, today there are approximately
250 RABS units in operation worldwide.
What is a RABS?With the emergence of RABS among contract
development and manufacturing organisations,
agencies involved in overseeing those manufacturers,
such as FDA, demanded that a more precise definition
of RABS be put into place to ensure consistency among
its users. They believed that simply installing restricted
access barrier hardware in the manufacturing facility
does not create a RABS. In 2005, FDA commissioned
a study group to develop a definition and determine
what elements need to be included to ensure that a
RABS system is truly in place before a manufacturer
can make such a claim. The International Society
for Pharmaceutical Engineering (ISPE) study group
consisted of experts from major manufacturers
including Bosch Packaging Technologies, Pfizer, Merck,
GSK and Vetter, along with members of the US Food
and Drug Administration (FDA).
By the definition developed by this group (2),
any system claiming to be a RABS must include quality-
designed equipment, and operators must receive
comprehensive training in key practices such as proper
gowning practice. All RABS must include the following:
t� A barrier to prevent human intervention directly
into the critical zone
t� Airflow for an ISO 5, at least in the critical zone
t� Glove ports and transfer ports used for
interventions (see Figure 2)
t� High-level disinfection
t� Highly automated processes and well-defined
procedures for rare open-door interventions.
The system goes beyond encasing the production
lines from the environment only. RABS combines the
high aseptic safety of an isolator with the flexibility
of a conventional cleanroom. The inclusion of rare
open-door interventions in the definition often leads
to criticism. These interventions, however, are not
considered a best practice.
42 Pharmaceutical Technology Europe SEPTEMBER 2013 PharmTech.com

waters.com
A new category of separations science. Driven by the ultimate selectivity tool. Take the unrealized potential of SFC. Combine
it with Waters legendary UPLC® technology—and the ability to manipulate gas and liquid phases in one amazing instrument—
and you’ve got ACQUITY UPC.2TM
That’s UltraPerformance Convergence Chromatography.TM
And it’s compatible with the broadest
range of solvents and chemistries. This is game-changing selectivity with workflow enhancements that will take you further—
faster than you thought possible. See where your lab can go with it. Take the UPC2 Challenge at UPC2.waters.com.
©2013 Waters Corporation. Waters, UPLC, ACQUITY UPC,2 UPC,2 UltraPerformance Convergence Chromatography and
The Science of What’s Possible are trademarks of Waters Corporation.
Pharmaceutical & Life Sciences | Food | Environmental | Clinical | Chemical Materials

TroubleshootingTroubleshooting
Best practices for RABSRABS provides a level of separation between the operator
and product that affords product protection superior to
traditional systems. However, to operate a RABS cleanroom
successfully, several best practices must be followed.
No open-door intervention allowed. During
operation, the barriers may not be compromised; lifting
the separation can lead to contamination and increased
risk to the product. Therefore, when aseptic operations are
carried out in a RABS, it is the intent to fully eliminate the
need to open RABS doors. If the filling is interrupted with
an open-door intervention, a complete cleaning and line
clearance must be carried out, and the batch is eliminated.
During the line set-up stage, all machine parts and
formats must be installed with the barrier closed by using
a special glove-portal system. Thorough mock-up studies
when designing a machine are essential. Such studies allow
a well thought-through configuration of the machine and the
barrier around it that allows the operator to reach all areas
within the machine using the gloves. The mock-up studies
simulate all routine operations and potential interventions
on the machine. Operators of different departments (e.g.,
engineering and quality assurance) join forces to ensure the
mock-up studies are as effective as possible.
High-level disinfection. Disinfection after each
production batch must be completed. Once the filling
process and the monitoring of the microbiological
environment have been completed, the barriers are
opened for cleaning. This is followed by a high-level
disinfection with a sporicidal agent (e.g., peroxide
suspension), which generates oxygen radicals to avoid
build-up of resistance.
Integrity of gloves. Following production, all gloves
must be tested for integrity and sterilised. Using a
pressure-decay test, the gloves are removed and tested
for even the smallest damage that could compromise the
system. If the gloves are found to be airtight, they can be
cleaned, steam-sterilised and remounted back into the
glove ports for use in the next production batch.
Aseptic transfer systems for zone transition.
Materials and formats are only carried into the ISO 5 area
using aseptic transfer systems. Any parts used in the
production, including any raw materials such as syringes
and stoppers, are sterilised in steam or dry heat and double
packed. The outer packaging is sprayed with a sterilising
agent containing alcohol before being transferred to the ISO
5 area through a lock, and the outer packaging is removed.
All steps are performed using the glove portal system.
Packaging materials are also put into sterilised bags and
placed in special containers. The containers are sprayed
down prior to introduction so when they are opened inside
the barrier, the content is exposed to ISO 5 conditions only.
ConclusionA RABS process is secure, with both a cleanroom design
and aseptic safety comparable to an isolator, but with
a higher degree of flexibility. Automation of the system
reduces variability due to operators and makes the entire
process reproducible. At Vetter’s Ravensburg South
production facility, for example, approximately 4,000,000
media-fill units were filled over seven years in three
different cleanrooms with RABS units with no resulting
contaminated units.
The RABS system is a proven and effective approach to
favorably impact cleanliness in the finished product. RABS
is also one of the most effective and efficient responses
to current and future challenges in the manufacturing of
aseptic products.
References1. J. Lysfjord, “Current aseptic processing trends with the
use of isolators and RABS,” presentation at the European
Compliance Academy (Dusseldorf, Germany, 2012).
2. J. Lysfjord, Pharm. Eng. 25 (6) (2005). PTE
Figure 1: A commercial
restricted barrier access
system (RABS).
Figure 2: Glove ports are
used for a filling operation.
All
fig
ure
s a
re c
ou
rte
sy o
f th
e a
uth
or.
44 Pharmaceutical Technology Europe SEPTEMBER 2013 PharmTech.com

API SYNTHESIS & MANUFACTURINGM
ich
ae
l B
an
ks/
Ge
ttyIm
ag
es
Chiral chemistry plays an important role in
pharmaceutical development and manufacturing.
Strategies in asymmetric synthesis to produce
single enantiomers as well as methods for detecting
and quantifying chirality are important tools for
pharmaceutical chemists. Some recent developments
involve stereoretentive cross-coupling for producing
libraries of single enantiomers, an approach in
enantioselective alcohol silylation, strategies for
amplifying signals in circular dichroism spectroscopy
and a synthetic route to the natural product ingenol.
Stereoretentive cross-couplingMark R. Biscoe, assistant professor of chemistry at the
City College of New York (CCNY), and his team recently
reported on a new method for preparing libraries
of single-enantiomer molecules for therapeutic and
toxicity studies that is faster and potentially less costly
than methods now used in the pharmaceutical industry,
according to a 15 Aug. 2013 CCNY press release.
Specifically, the researchers developed a general
palladium-catalysed process for the stereoretentive
cross-coupling of secondary alkyl azastannatrane
nucleophiles with aryl chlorides, bromides, iodides and
triflates (1). The researchers reported that coupling
partners with a wide range of electronic characteristics
were well tolerated and that the reaction occurred
with minimal isomerisation of the secondary alkyltin
nucleophile (1). The researchers assert that the process
constituted the first general method to use secondary
alkyltin reagents in cross-coupling reactions (1).
Enantioselective alcohol silylation Researchers at Boston College (BC) reported on a new
computational approach for enantioselective alcohol
silylation (2) that reduced the reaction time to less
than one hour, down from a period of two to five days,
reduced catalyst loading and produced an overall more
efficient reaction, according to a July 2013 BC press
release. Based on a computational projection, the
researchers used cocatalysts to achieve the reaction
improvements in enantioselective silyl protection of
alcohols promoted by a combination of chiral and
achiral Lewis basic catalysts (2). The researchers used
a cocatalyst model involving two Lewis base molecules
adding the achiral molecule to an already present
chiral molecule. These cocatalysts operated in concert,
with the chiral molecule activating an alcohol, and the
additional achiral molecule, from commercially available
5-ethylthiotetrazole, activating silicon, according to the
BC release. Identifying the influence of ethylthiotetrazole
was a key component and provided the researchers
the ability to effectively control the interplay between
the cocatalysts. Together, the Lewis bases served as a
closely related Brønsted base to allow the catalyst to
work faster while retaining high enantioselectivity.
“The bottom line is the reaction goes a lot faster,”
said Marc Snapper, professor of chemistry at BC, in
the BC release. “The practical advance is adding the
tetrazole, which greatly accelerated the pace of the
reaction by doing a much better job activating the
silicon reaction partner.” The BC researchers suggest
that the new conceptualisation of the catalyst could
lead to the development of new processes that require
separate and independently operational Lewis basic
cocatalysts, which can overcome the overlapping
functions of cocatalysts and eliminate detrimental
effects on the production of new molecules with high
enantioselectivity (2).
Nanotechnology in discerning chiralityResearchers at the US Department of Energy’s
Brookhaven National Laboratory (BNL) and Ohio
University have developed a simpler way to discern
chirality by using gold and silver cubic nanoparticles to
amplify the difference in the enantiomers to circularly
polarised light, according to a 26 June 2013 BNL press
release. The researchers showed that nonchiral
nanoparticles, specifically gold/silver core/shell
nanocubes, can act as plasmonic reporters of chirality
for attached molecules by providing two orders of
magnitude circular dichroism enhancement in a near-
visible region (3).
“Our discovery and methods based on this research
could be extremely useful for the characterisation of
biomolecular interactions with drugs, probing protein
folding and in other applications where stereometric
properties are important,” said Oleg Gang, a
Developments involve stereoretentive cross-coupling, enantioselective alcohol silylation, strategies for
amplifying signals in circular dichroism spectroscopy and a synthetic route to the natural product ingenol.
Advancing Chiral Chemistry in Pharmaceutical Synthesis
Patricia Van Arnum
is Executive Editor of
Pharmaceutical Technology
Europe.
Pharmaceutical Technology Europe SEPTEMBER 2013 45

API Synthesis & Manufacturing
researcher at Brookhaven’s Centre
for Functional Nanomaterials in the
BNL release. “We could use this same
approach to monitor conformational
changes in biomolecules under
varying environmental conditions,
such as temperature—and also to
fabricate nano-objects that exhibit
a chiral response to light, which
could then be used as new kinds of
nanoscale sensors.”
The use of nanoparticles to amplify
the signal was done to overcome the
weak signal when applying circular
dichroism spectroscopy in the
ultraviolet range for chiral molecules.
The researchers were guided by
experimental work that showed that
coupling certain molecules with
metallic nanoparticles would increase
their response to light (4) as well
as theoretical work that suggested
that the plasmonic particles, which
induce a collective oscillation of
the material’s conductive electrons
to create stronger absorption of a
particular wavelength, could move
the signal into the visible spectrum,
where it would be easier to measure,
according to the BNL release.
The researchers experimented with
different shapes and compositions of
nanoparticles and found that cubes
with a gold centre surrounded by a
silver shell are not only able to show a
chiral optical signal in the near-visible
range, but also were effective signal
amplifiers. For their test biomolecule,
they used synthetic strands of DNA.
When DNA was attached to the silver-
coated nanocubes, the signal was
approximately 100 times stronger than
it was for free DNA in the solution,
according to the BNL release. The
observed amplification of the circular
dichroism signal is a consequence
of the interaction between the
plasmonic particles and the energy
absorbing-electrons within the DNA-
nanocube complex, according to the
BNL release. The researchers note
that the work can serve as a platform
for ultrasensitive sensing of chiral
molecules and their transformations
in synthetic, biomedical and
pharmaceutical applications.
In another development,
researchers at Harvard University, the
Centre for Free-Electron Laser Science
(CFEL) and the Max Planck Institute
in Germany reported on enantiomer-
specific detection of chiral molecules
by microwave spectroscopy (5, 6).
The approach sought to overcome
limitations in circular dichroism and
vibrational circular dichroism, which
are commonly used in analysing
chiral molecules, but which produce
weak signals and require high sample
densities (5, 6). The researchers
carried out nonlinear resonant phase-
sensitive microwave spectroscopy of
gas-phase samples in the presence of
an adiabatically switched nonresonant
orthogonal electric field. They used
this technique to map the enantiomer-
dependent sign of an electric dipole
Rabi frequency onto the phase of
emitted microwave radiation (5, 6)
and described how this approach
can be used for determining the
chirality of cold gas-phase molecules.
They implemented the approach
experimentally to distinguish
between the S and R enantiomers
of 1,2-propanediol and their racemic
mixture. “We can soon measure
mixtures of different compounds
and determine the enantiomer
ratios of each,” said Melanie Schnell,
co-author of the study in a CFEL
release. The researchers plan to
apply the technique in a broadband
spectrometer at CFEL that could
measure the enantiomer ratios in
mixtures of substances, and longer
term, the method opens a way for
separating enantiomers (6).
Synthesis of natural productsNatural products are well-established
sources for drug candidates but
developing synthetic routes to natural
products can often pose a problem.
Scientists at The Scripps Research
Institute (TSRI) recently reported on
their work in developing what they
characterise as the first efficient
chemical synthesis of ingenol, a plant-
derived compound with anticancer
potential, according to an 1 Aug. 2013
TSRI press release. The work enables
the synthesis of various ingenol
derivatives and also sets the stage for
the commercial production of ingenol
mebutate, the API in Picato, a drug
to treat actinic keratosis, a common
precursor to nonmelanoma skin
cancer. Picato was approved by the US
Food and Drug Administration and the
European Medicines Agency in 2012.
Ingenol mebutate, a macrocyclic
diterpene ester, is a purified ingenol
angelate extracted from the aerial
parts of Euphorbia peplus plant. The
molecule has eight chiral centres and
one “nonrestricted” double bond,
thus, there is a theoretical possibility
of up to 512 stereoisomers (7). The
ingenol mebutate is obtained from the
dried, milled aerial parts of the plant
by extraction followed by a series of
purification steps. The final step of the
process involves crystallisation (7). In
late 2011, the drug’s manufacturer,
the Danish pharmaceutical company
LEO Pharma, collaborated with
TSRI to develop an efficient way to
synthesise ingenol mebutate and
ingenol derivatives. The scientists
developed a stereocontrolled
synthesis of (+)-ingenol in 14 steps
from inexpensive (+)-3-carene and
used a two-phase design (8). The
researchers assert the results
validate that two-phase terpene total
synthesis is an alternative to isolation
or bioengineering for preparing
polyoxygenated terpenoids (8).
References1. M.R. Biscoe et al., Nat. Chem. 5 (7)
607–612 (2013).
2. N. Melville et al., Nat. Chem. online,
DOI10.1038/nchem.1708, 28 July 2013.
3. O. Gang et al., Nano Lett. 13 (7) 3145–
3151 (2013).
4. M.M. Maye, O Gang and M. Cotlet,
Chem. Commun. 46 (33) 6111–6113
(2010).
5. D. Patterson, M. Schnell and J.M. Doyle,
Nature 497 (7450) 475–477 (2013).
6. P. Van Arnum, Pharm. Technol. 37 (6)
46 (2013).
7. EMA, “Assessment Report: Picato”
(London, 20 Sept. 2012).
8. P.S. Baran et al., Science. online, DOI:
10.1126/science.1241606, 1 Aug.
2013. PTE
Researchers have developed a way to discern chirality by using gold and silver cubic nanoparticles to amplify the difference in enantiomers to circularly polarised light.
46 Pharmaceutical Technology Europe SEPTEMBER 2013 PharmTech.com

The lightweight tool withthe heavyweight performance!
� Ultra-lightweight, this fl at mop is especially suitable for walls,fl oors and ceilings
� Reduces operator fatigue and promotes best practice
� Features a single layer of hydrophilic foam for unmatchedabsorbency
� Knitted polyester laminated to clean PU foam provides a smooth and uniform application of disinfectant
To make your cleaning regime more effective and effi cient, fi nd out more about the VertiKlean MAX Wall and Floor Mop by visiting:
www.contecinc.comor by calling 0845 652 2582 or +33 (0)2 97 43 76 90
The VertiKlean MAX Wall and Floor Mop

48 Pharmaceutical Technology Europe SEPTEMBER 2013 PharmTech.com
PEER-REVIEWED
George Hartford is laboratory technician/inventory
coordinator for labeled compounds in analytical chemistry,
Patty Cheung is associate principle scientist in analytical
chemistry, Karen Whitaker is senior specialist, Rahway Safety
and the Environment, and Roy Helmy, PhD, is director of
analytical chemistry, all at Merck Research Laboratories, 126
East Lincoln Avenue, P.O. Box 2000, Rahway, NJ 07065-0900,
USA; Joanne Ratcliff*, PhD, is communication project manager,
Laboratory & Weighing Technologies at Mettler Toledo
AG, Im Langacher 44, P.O. Box LabTec, CH-8606 Greifensee,
Switzerland, [email protected].
*To whom all correspondance should be addressed.
Submitted: 16 Apr. 2013. Accepted: 26 June 2013.
Effective and Efficient
Weighing of Potent Compounds George Hartford, Patty Cheung, Karen Whitaker, Roy Helmy and Joanne Ratcliff
Working safely with potent compounds presents
challenges for the pharmaceutical industry because
exposure to minute quantities could potentially
cause health effects. Typically, an isolator would be
the preferred containment technology for working
with the most potent (occupational exposure band
five [OEB 5]) compounds but it has drawbacks in
terms of cost, space, efficiency and ergonomics.
The authors describe the advantages of using an
automated powder dispensing system in a ventilated
balance enclosure (VBE) for efficient handling and
effective containment of potent compounds. A
review of the data proves that air and surface
contamination is well within the acceptable limits,
demonstrating the applicability of the automated
powder dispensing unit in a VBE for weighing potent
compounds in the pharmaceutical industry.
In recent years, pharmaceutical companies have increasingly
begun to work with potent compounds (i.e., compounds
that are very active pharmacologically, with efficacy at sub-
milligram doses). These compounds allow patients to take
smaller doses and potentially experience fewer side effects.
While this property is advantageous for the patient, it
presents a greater risk to the health of analytical chemists
working with these compounds because exposure to very
small quantities has the potential to cause health effects. In
some cases, the quantity of potent compound that can lead
to health effects can be extremely small, being practically
invisible in air or on work surfaces, which makes containment
of these compounds in the workplace especially challenging.
The l ist of potent compounds of interest to the
pharmaceutical industry includes hormones, steroids and
many oncology drugs. These compounds have airborne
occupational exposure limits (OEL) ≤ 10 μg/m3 as an eight-
hour time-weighted average (1). For handling these
compounds in the laboratory, a classification system is used
to assign materials into a series of health hazard categories,
or occupational exposure bands (OEB), of increasing severity
based upon their inherent pharmacological and toxicological
properties. This classification system helps companies identify
risks associated with handling the compounds and provides
guidance on how to manage them (2). While no official
industry standard exists around the banding of compounds,
companies typically utilise OEB systems with four to six
categories (1). Each health hazard category corresponds to a
predefined strategy known to provide the necessary degree of
exposure control to protect employees and the environment.
To support research and development as well as
manufacturing of potent compounds, several contract
manufacturers have made significant investments to build
facilities to control exposure to potent compounds (3). Merck
& Co., like other companies, has been developing potent
compounds. Merck’s most potent compounds, known as OEB 5
compounds, typically require an isolator for dispensing milligram
to gram quantities to maintain airborne levels below 1 μg/m3 and
surface contamination below 10 μg/100 cm2 (see Table I).
User safety at the forefront
Working safely with these potent compounds presents
challenges. Employers are required to minimise the exposure
risk by following the “hierarchy of controls.” Since substitu-
tion is not an option when developing or manufacturing
CITATION: When referring to this article, please cite as Hartford
et al., “Effective and Efficient Weighing of Potent Compounds,”
Pharmaceutical Technology 37 (9) 2013.

It takes a unique blend of expertise
to deliver the right results
From clinical development to commercial production
At Vetter, we look at your product from every angle. And help you
find answers that make a difference in efficiency, productivity, safety,
quality, and growth. From initial process design through high-speed
fill and finish, learn how a partnership with Vetter will keep your
product moving smoothly towards success.
t More than 25 years of experience in aseptic filling
t Expertise with many compound classes, including biologics
t Highly trained experts in key technical areas
t Integrated life cycle management
t Innovative drug delivery options
t State-of-the-art cGMP manufacturing
t Excellent global regulatory support
Vetter
Development Service
Vetter
Commercial Manufacturing
Vetter
Packaging Solutions
For US inquiries please contact [email protected] t�For EU, Asia and other international inquiries, please contact [email protected]
Answers that work
www.vetter-pharma.com
Visit us at CPhI/ICSE 2013 in Frankfurt, Germany at Booth # 42 K29.

50 Pharmaceutical Technology Europe SEPTEMBER 2013 PharmTech.com
Weighing Potent Compounds
FIG
UR
E 1
IS
CO
UR
TE
SY
OF
TH
E A
UT
HO
RS
.
potent drugs, engineering controls are required to be used as
the primary control. The preferred containment technology is
often an isolator that maintains exposures below applicable
limits. Using an isolator for dispensing and weighing small
quantities of these compounds, however, presents space,
ergonomic, efficiency and cost challenges for an analytical
laboratory. Merck needed a simple solution to allow
analytical chemistry researchers to work in a laboratory
environment with OEB 5 compounds. The workflow needed
to be safe, simple, efficient and accurate enough to allow
precision weighing while maintaining cGMP compliance.
Automated powder weighing
Merck’s analytical laboratory originally invested in a semi-
automated powder dispensing unit (Mettler Toledo) to
address an increasing demand for routine weighing of non-
potent compounds. The system, however, subsequently
proved to be an effective solution for handling potent com-
pounds as well (see Figure 1).
It consisted of an enclosed semiautomated dispensing
unit attached to a regular analytical balance. The compound
is sealed in a vial with a dosing head attached to the top
of the container. The dosing head is inserted into the unit,
and the balance doors are closed before dispensing takes
place. Dispensing the compound from a sealed container
reduces the risk of airborne contamination. Each dosing
head contains a radio-frequency-identification (RFID) chip
to enable identification and tracking of the compound,
providing process security by eliminating the possibility of
selecting or dispensing the wrong substance. The dispensing
system is able to accurately weigh compounds from 1 mg to
5 g with a 2% variance and dispenses the required amount
of material into a container that is securely located on the
balance. Once the desired weight has been dispensed, the
researcher can remove the container and place another one
on the balance for the next weighing step. Alternatively, a
30-position autosampler can be added to automate the
change of target container, which enables up to 30 weighing
operations to take place without any user intervention. It
is also possible to link a solvent dispensing module, which
accurately adds the desired weight of solvent into the target
container based on the actual amount of solid dispensed
to achieve a desired concentration. This method is an even
more precise way to prepare analytical solutions. Compared
to conventional manual dispensing, the automated process
can be as much as 20 times faster.
Table I: Merck & Co.’s occupational exposure bands. HEPA is high-efficiency particulate air, LEV is local exhaust ventilation.
Occupational
exposure bands
(OEB)
OEB 1 OEB 2 OEB 3 OEB 4 OEB 5
Potency/toxicity Slightly toxic Moderately toxic ToxicPotent, toxic,
potentially genotoxic
Highly potent,
highly toxic
Occupational
exposure limits
(OEL) (μg/m3)
≥ 1000 ≥ 100 < 1000 ≥ 10 < 100 ≥ 1 < 10 < 1
Handling
requirements
Good laboratory/
manufacturing
practices (GLP/GMP).
LEV may be needed.
No special
containment.
GLP/GMP.
LEV may be needed.
No special
containment.
Virtually no open
handling. Closed
systems and/or
controlled by LEV,
hoods or HEPA-
filtered ventilated
enclosures designed
for personnel
protection.
No open handling.
Closed systems and/
or controlled by
LEV, hoods or HEPA
filtered ventilated
enclosures designed
for personnel
protection.
No open handling.
High containment
required.
STERILINE offers a wide range of high quality pharmaceutical equipment specifically designed to meet customer needs:
s��7ASHING�-ACHINESs��$EPYROGENATING�4UNNELSs��&ILLING�-ACHINESs��#APPING�-ACHINESs��&ILLING�,INE�)SOLATORSs��3TAND�!LONE�)SOLATORSs��$ECONTAMINATING�-ACHINES
34%2),).%�SRL� �#OMO� �)4!,9� �www.steriline.it
25-28 November 2013, -OSCOW
VVC, Pavillon 75
22-24 October 2013, &RANKFURT�
Hall 4.1, Booth 41J39

On the surface
all white mineral oils appear
to be the same.
With PURETOLTM white mineral oils, your money goes further because it’s buying much more than
just another ingredient. You’re buying supply (we’re the world’s largest producer of white mineral oils).
You’re buying choice (name your preferred packaging and delivery modes). You’re buying quality (every PURETOL product is produced by us from start to finish and meets the requirements of
USP/NF/DAB, the European Pharmacopoeia (EP) and German Pharmacopoeia (DAB 10)).
You’re buying support (world-class R&D and a dedicated team that knows its business – and yours).
Want to go deeper?
call: +44 (0) 121-781-7264 | e-mail: [email protected] | visit: lubricants.petro-canada.ca/puretol
Petro-Canada is a Suncor Energy business ™Trademark of Suncor Energy Inc. Used under licence.
Purity You Can Count On

52 Pharmaceutical Technology Europe SEPTEMBER 2013 PharmTech.com
Weighing Potent Compounds
A key benefit of automated dispensing is that it reduces
user exposure by eliminating the handling of the substance
with a spatula and minimising the risk of spillage. It also
reduces the manual actions required by the user, by
eliminating the need for repeated opening of the balance
door and transferring the compound from the main
container to the secondary container to achieve the desired
weight.
The automated dispensing system was situated within a
high-efficiency particulate air (HEPA)-filtered ventilated balance
enclosure (VBE) (Pharmaceutical Containment Technologies
[PCT]). The VBE has features key to effective containment such
as rounded airfoils around the entire face, a waste chute to
minimise researcher movement in and out of the face, safe-
change HEPA filtration and a flow alarm to ensure the face
velocity does not drop below 60 fpm (0.3 m/s). The laboratory
initially used this equipment to weigh less potent, OEB 3 and
OEB 4 compounds, a task that the device performed remarkably
well. A question was raised as to whether the capability of
the unit could be expanded to handle the safe and efficient
dispensing of OEB 5 compounds. After several discussions
between Merck Global Safety and the Environment and Mettler
Toledo, an experimental evaluation plan was created to assess
the ability of the system to reduce airborne and particulate
surface contamination during weighing of OEB 5 compounds.
As part of the evaluation, OEB 5 materials were provided to the
analytical laboratory in containers compatible with the dosing
heads as historical air and surface contamination data indicated
manual subdivision by analytical chemists in a VBE would not
maintain airborne and surface contamination levels below
applicable limits for some OEB 5 compounds.
Surrogate control performance evaluation
Verification sampling was performed to validate the equip-
ment containment. Personal protective equipment (PPE)
worn during the sampling included safety glasses, a dispos-
able laboratory coat, disposable sleeves and double nitrile
Table II: Containment verification data: Air sampling results. VBE is ventilated balance enclosure, < is less than the
laboratory limit of detection.
Iteration 1–6
sample numbers
Sample location Results in micrograms per cubic meter of
air (μg/m3)
02S, 07S, 12S, 17S, 22S, 27S Personal breathing zone samples < 0.0025 – < 0.0030
03S, 08S, 13S, 18S, 23S, 28S Left side of VBE face 200 mm from opening < 0.0025 – < 0.0030
04S, 09S, 14S, 19S, 24S, 29S Right side of VBE face 200 mm from opening < 0.0025 – < 0.0030
05S, 10S, 15S, 20S, 25S, 30S 1.8 m from VBE face at height 1.5 m < 0.0025 – < 0.0030
06S, 11S, 16S, 20S, 26S, 31S VBE exhaust 200 mm from outlet < 0.0025 – < 0.0031
Table III: Containment verification data: Surface sampling results. VBE is ventilated balance enclosure.
Iteration 1–6
sample numbers
Sample location Results in micrograms per 100 centimeters
square on the surface (μg/100 cm2)
05S, 09S, 13S, 17S, 21S, 25S Floor below VBE face opening (right) < 0.01
06S, 10S, 14S, 18S, 22S, 25S Floor below VBE face opening (left) < 0.01
07S, 11S, 15S, 19S, 23S
Horizontal airfoil (left)
< 0.01
26S 0.028
I08S, 12S, 16S, 20S, 24S, 27S Horizontal airfoil (right) < 0.01
Figure 1: Example of an automated powder dispensing unit.

Pharmaceutical Technology Europe SEPTEMBER 2013 53
Weighing Potent Compounds
gloves. Air and surface samples were collected during
the dispensing of 2 g of naproxen sodium and subsequent
cleaning and PPE removal. Naproxen sodium, a nonster-
oidal anti-inflammatory drug, was used because it is rec-
ognised by the International Society of Pharmaceutical
Engineers (ISPE) as a rigorous challenge agent and a suit-
able surrogate for assessing containment of potent com-
pounds (4). The sampling protocol included cleaning of the
VBE, containers, balance and the removal of outer gloves and
sleeves within the VBE given that proper technique during
these activities is crucial to containment and the prevention of
surface contamination. Six iterations of the dispensing task
were performed, and air and surface samples were collected
during each iteration to demonstrate that the controls and the
procedures used by the researchers did, in fact, protect them.
In total, six personal air samples and 24 area air samples
were collected. All samples collected were below the
laboratory limit of detection and well below OELs for the
OEB 5 compounds currently being handled in the laboratory
(see Table II). Additionally, all wipe samples were below the
surface contamination limits (see Table III).
Conclusion
A review of the air and surface contamination data showed
that exposures are low, generally nondetectable. It was con-
cluded that researchers can safely utilise the automated dis-
pensing system to dispense up to 2 g of OEB 5 compounds
with OELs > 3 ng/m3, provided that the VBE is properly sited
in the laboratory and use of the system is coupled with appro-
priate personal protective equipment, a written procedure,
hands-on training on proper handling of potent compounds in a
VBE, good handling practices and an annual preventative main-
tenance program for both the dispensing system and the VBE.
Automated powder dispensing of fers an ef f icient
combination of both strategies of containment and
improved sample handling techniques. Combining the
dosing head, a HEPA-f iltered VBE and good potent
compound handling techniques can eliminate the need to
use an isolator to precisely weigh OEB 5 compounds for
analytical testing. An added benefit is that any researcher
can undergo simple training and be qualified to operate the
automated system, which also removes user variability from
the process. Overall, the use of the automated dispensing
system in a VBE affords accurate and reproducible weighing
of potent compound while keeping researchers safe and
protecting the laboratory environment from contamination.
References
1. F. Hermann et al., Chemistry Today, “Focus on CROs/CMOs” supplement,
29 (4) s20–23 (2011).
2. R. Harris, “Formulating High Potency Drugs,” Contract Pharma, Oct 2012,
pp. 46–50.
3. P. Van Arnum, Pharm. Technol. 35 (12) 36–40 (2011).
4. ISPE, Good Practice Guide: Assessing the Particulate Containment
Performance of Pharmaceutical Equipment, 2nd Edition (Tampa, Florida,
May 2012) pp. 70. PTE
Webcast: Safe automated weighing of potent compounds in the pharmaceutical industry
Roy Helmy, PhD, director of analytical chemistry at
Merck Research Laboratories, and Joanne Ratcliff,
PhD, communication project manager at Mettler Toledo
AG, explain how the use of automated dosing, a high-
efficiency particulate air (HEPA)-filtered ventilated
balance enclosure (VBE), and good potent-compound
handling techniques have eliminated the need to
utilise an isolator to precisely weigh small quantities of
occupational exposure band five (OEB 5) compounds for
analytical testing. The webcast will provide insight on:
t� How researchers can work in a laboratory environment with OEB 5 compounds without the need for an isolator
t� How automated weighing of potent compounds can increase the safety of researchers while delivering accurate and reproducible weighing
t� How automated weighing of potent compounds can be 20 times faster than the manual equivalent.
The webcast will be broadcast 17 Sept. at 11:00 am EST and available for on-demand viewing thereafter. For additional information, go to www.pharmtech.com/potent.

54 Pharmaceutical Technology Europe SEPTEMBER 2013 PharmTech.com
PEER-REVIEWED
James P. Agalloco is president of Agalloco &
Associates, P.O. Box 899, Belle Mead, NJ 08502, tel.
908.874.7558, [email protected]. He is also a member
of Pharmaceutical Technology’s editorial advisory board.
James E. Akers, PhD is president of Akers Kennedy and
Associates.
Submitted: 1 Feb. 2013. Accepted: 1 Mar. 2013.
Overcoming Limitations
of Vapourised Hydrogen Peroxide
Hydrogen peroxide is highly potent and highly problematic.
James P. Agalloco and James E. Akers
The use of hydrogen peroxide (H2O
2) in the global
healthcare industry and other industries that require
high levels of contamination control has grown
steadily. This growth is attributable to the chemical’s
ability to kill spores and sterilise materials, which
has been demonstrated in a variety of practical
applications. Properly used, H2O
2 is an effective
sterilant capable of efficient and rapid elimination
of contaminating microbes. Some difficulties have
been associated with the implementation of H2O
2
processes in the healthcare field although these
issues appear to have been avoided in commercially
sterile food and beverage manufacture. Specifically,
persistent problems regarding the development
of H2O
2 processes and their subsequent validation
have been reported. The author discusses the
technical issues associated with achieving lethal
concentrations of H2O
2 delivered in vapourous
form on decontamination targets, explores the
core scientific principles behind H2O
2‘s use in
decontamination and sterilisation, and provides
experience-based solutions to frequently
encountered operational issues.
Hydrogen peroxide (H2O
2) is an extremely powerful oxi-
dant that is capable of effectively killing resistant spore-
forming bacteria over a wide range of concentrations. At
concentrations of 3% or less, it is suitable for use as a top-
ical antiseptic (1). H2O
2 has been accepted by both the US
Food and Drug Administration (FDA) and Environmental
Protection Agency (EPA) as a sterilising agent for many years
(2, 3). In the food industry, H2O
2 is widely used to sterilise
containers, closures and aseptic chambers (i.e., isolators)
used for manufacturing low-acid and dairy-based beverages
as well as other applications (4).
The potency of H2O
2 as a sterilant and its usefulness in
a broad range of antimicrobial applications are beyond
dispute. The problems associated with vapourised H2O
2
processes in the healthcare industry lie in fundamental
m isunder s t and ing s concern ing phys icochemic a l
characteristics of H2O
2 sterilisation. These errors profoundly
influence real-world H2O
2 applications.
Understanding vapours
To fully understand the physical factors that affect the dis-
tribution of H2O
2 in the vapour phase, one must consider the
factors that affect vapours in general and the factors that
allow them to exist in air, which is the medium in which H2O
2
in the vapour phase is distributed within a decontamination
target. Air contains varying but small amounts of water in
the vapour phase, which is described using the term rela-
tive humidity (RH). An important factor in the distribution of
a chemical is the dew point. The dew point is, in simplest
terms, a function of both concentration and temperature.
When the concentration of water exceeds the saturation
point at a particular temperature, condensation occurs.
The gaseous water converts to the liquid phase, and drop-
lets of liquid water may appear. On the other hand, if the
water concentration is below the saturation point, it will
remain in the gas phase. When the temperature of the air is
actively lowered (or simply drops as a function of thermo-
dynamics) below the dew point, some portion of the water
(H2O) present as a gas mixed with air condenses and forms
liquid droplets. We observe this as clouds, dew, fog or frost.
CITATION: When referring to this article, please cite it as J. P.
Agalloco and J. E. Akers, “Overcoming Limitations of Vapourised
Hydrogen Peroxide,” Pharmaceutical Technology 37 (9) (2013).

LEARN MORE – access webinars and case studies at
agilent.com/chem/togetheropenaccess.
Spend less time managing and more time analyzing. Agilent open access
solutions enable pharmaceutical scientists to accelerate discovery by
simplifying the management of multiple LC/MS and NMR instruments.
With MassHunter Walkup Software, analytical chemists can easily
configure and maintain multiple mass spec instruments right from their
desks. Users get answers quickly with solutions that extend to any
automated routine LC or LC/MS measurements. VnmrJ 4 Persona Manager
provides NMR facility managers with the best, most flexible platform for
managing multiple users and spectrometers.
WITH OPEN ACCESS SOLUTIONS
DO MORE TOGETHER
TOGETHER. IT’S HOW WE WORK. IT’S HOW WE SUCCEED.
© Agilent Technologies, Inc. 2013

56 Pharmaceutical Technology Europe SEPTEMBER 2013 PharmTech.com
Sterilisation and Decontamination
The typical H2O
2 process
The process that most H2O
2 generator and isolator manu-
facturers use for H2O
2 introduction is one in which a hot air
stream is used to introduce a heated H2O
2/H
2O gas into the
target environment, which may be an aseptic chamber or
isolator. Within the generator, the temperature of the air/
H2O
2/H
2O mixture is sufficiently high that all three mate-
rials are in a gaseous state. The hot air is conventionally at
temperatures in excess of 100 °C, which takes advantage
of the respective boiling points of the pure components
(i.e., H2O = 100 °C, H
2O
2 = 150.2 °C, and a 30–35% aqueous
solution of H2O
2 = approximately 108 °C). At these tem-
peratures, both H2O
2 and H
2O are present as gases and are
carried into the target vessel with the hot air. The H2O
2/
H2O is supplied as an aqueous solution of H
2O
2 in varying
percentages typically ranging from 31% to 50% H2O
2. At
typical room temperatures, each of these solutions is pre-
dominantly liquid, and the headspace air within the closed
containers has a small amount of gas phase H2O
2/H
2O that
is in equilibrium with the liquid.
If the concentration remains below the saturation point
upon introduction into the target environment, then both
the H2O
2 and H
2O will remain in the gas phase. When the hot
and relatively humid gas mixture from a H2O
2 generator is
introduced to the target chamber, it will encounter colder
air as well as ambient temperature surfaces of the chamber
and materials inside it. As the hot gas mixture cools to the
temperature of the chamber, it will fall below the dew-point
temperature of both H2O
2/H
2O, and some portion of these
materials will condense on the surfaces as liquids. In effect,
the H2O
2/H
2O are returning to their initial equilibrium state
of liquids in equilibrium with the adjacent gas, which they
possessed before being converted to a gas in the generator.
Condensation that forms on the surfaces will tend to
be nonuniform in concentration across the chamber for
several reasons:
t� The H2O
2 will condense first due to its lower equilibrium
vapour pressure (i.e., lower dew point) relative to H2O.
t� The temperature in the system may be non-uniform
across the chamber and is generally hottest near the inlet
where the hot gas mixture is introduced; for the purposes
of vapour-phase hydrogen peroxide (VPHP) technology,
± 2.5 °C can be considered effectively uniform.
t� The continued introduction of the hot gas mixture into
the chamber, in which VPHP generators rely on contin-
uous replenishment of mixture vapour, results in a slow
increase in temperature within the chamber. This effect
is more pronounced in smaller enclosures and those with
relatively low mass.
t� In larger enclosures, the amount of heat added by the hot
air stream laden with H2O
2/H
2O will have little impact on
temperatures remote from the injection port.
t� Where the localised temperature within the enclosure is
low enough and concentrations of H2O
2 and H
2O are high
enough, they will condense. Many present-day H2O
2 gener-
ator systems are designed such that the process relies on
the presence of condensation. In these cases, one should
recognise that the heated gas or vapour is used only as
a convenient delivery system for the H2O
2/H
2O to the
target environment. The sterilisation or decontamination
is accomplished by H2O
2 in the form of liquid condensate
on surfaces.
t� Depending upon the decontamination approach used,
H2O
2/H
2O introduction during the process dwell period can
be continuous, intermittent or absent entirely. In cases
where the hot air/vapour stream is present only during a
comparatively short initial introduction period, the effects
of the hot air stream on target chamber temperatures will
be less profound.
t� Chambers with a large number of objects to be decon-
taminated have added surfaces upon which condensate
may accumulate. As the load size increases, the amount
of H2O
2 added and/or the process dwell period may
need to be increased to ensure condensation on all
target surfaces.
The extent of condensation that occurs depends upon the
temperature (i.e., colder locations will have more condensa-
tion), the concentration or amount of H2O
2/H
2O introduced
(and removed if a circulating process is used), the size of
the enclosure (i.e., affects the surface/volume ratio) and the
SAMPLING AND GREAT
WAYS OF DOING IT
COMPLETELY WRONG
Don’t gamble with
your sample!
Use a KEOFITT® Aseptic
Sampling Bag when you
move your sample from the
production facility to the lab.
Please visit us at:
ILMAC Basel
Hall 1.2 - Stand A81
www.keofitt.dk

Complete solutions for pharmaceutical
production and packaging from a single source
Expertise from a single source
You can rely on Bosch when it
comes to the production and
packaging of pharmaceuticals. Our
portfolio ranges from single
machines to combined systems
and integrated solutions for
pharma, medtec, biotec and fine
chemicals. Our solutions enable
the processing of sterile, liquid and
powdered pharmaceuticals, as well
as the production of solid dosage
forms, primary and secondary
packaging, and inspection technol-
ogy. A full range of support
services completes our product
portfolio. In recent years, we have
continuously expanded and
strengthened our expertise. The
following brands belong to our
pharma portfolio: Eisai Machinery,
Hüttlin, Manesty, Moeller&Devicon,
Pharmatec, SBM Schoeller-
Bleckmann Medizintechnik,
Sigpack and Valicare. Extensive
experience, clearly defined pro-
cesses and close collaboration
between our different divisions
ensure that all required process
steps are covered.
Global competence,
local presence
Our many locations are spread
right across the globe. Whether
your project is in Europe or the US,
Latin America or Africa, our
international pool of experts is
available on-site to accompany you
throughout the process. At the
same time our dense sales and
service network ensures fast,
straightforward and expert advice
and support. One single contact
person can coordinate your
interests – from inquiry and initial
development through to implemen-
tation and aftermarket services.
Services
We are your all-in-one solution
provider. Consulting, conceptual
design and installation, as well as
tailor-made qualification, validation
Bosch Packaging Technology – Business Unit Pharma is
your expert point of contact for pharmaceutical processing
and packaging technology. We are internationally oriented
and draw on long-term and comprehensive expertise.
Working closely with you, we develop the best solution for
flexible and safe production processes.
www.boschpackaging.com
For more information
please contact us:
CPHIP-Mec Worldwide, Frankfurt, Germany
22.–24. Oktober 2013
Stand 41H30
We look forward to seeing you!
and aftermarket services, are
integral parts of our product range.
In addition, you gain access to a
comprehensive service portfolio
and network that supports you in
achieving the highest possible
availability and quality for your
production machines.

58 Pharmaceutical Technology Europe SEPTEMBER 2013 PharmTech.com
Sterilisation and Decontamination
quantity of material within the chamber (i.e., adds to the
surface area).
Phase states in the enclosure
It must be understood that the enclosure will contain a mix-
ture of air/H2O
2/H
2O internally, with some of the H
2O
2/H
2O in
a liquid state on surfaces and the remainder in the gas phase.
There is no simple means to establish how much H2O
2/H
2O is
in each phase or where in the chamber a particular phase is
present. Additionally one cannot know the percentage of H2O
2
or H2O at any single location, and certainly not at every loca-
tion within the enclosure. The Gibbs Phase rule makes it clear
that conditions can vary across the system (see Equation 1).
F = C - P + 2 = 3 - 2 + 2 = 3 (Eq. 1)
where F = number of degrees of freedom (i.e., concentration,
temperature, pressure), C = number of components in the
system and P = number of phases in the system.
Almost nothing is known with certainty with respect to
concentration and location. There is, however, one constant
in the process: H2O
2 is lethal to microorganisms in both the
gas and liquid phases. It is reasonable to assume that liquid-
phase kill will be somewhat faster than the gas-phase kill for
two important reasons as further outlined:
t� The concentration of H2O
2 in the liquid phase will always
be higher. A 35% H2O
2 mixture will have equilibrium con-
centrations of H2O
2 of ~2% in the gas phase and ~79% in
the liquid phase (5).
t��5IF� QSFTFODF� PG� BEFRVBUF�
moisture at the point of steri-
lisation is certain in liquids, as
H2O is the other component of
the liquid phase.
An older reference describes
more rapid kill occurring with H2O
2
in a gas-phase process compared
to a liquid-phase process (6). This
reference identifies a gas-phase
process at 25 °C, with no men-
tion of any liquid H2O
2 present.
At that temperature, however,
H2O
2 is a liquid, so there must
be some liquid H2O
2 in equilib-
rium with the gas. There is no
means to establish that the kill in
this “gas” process was actually
accomplished in that phase. It is
more likely that the cited kill was
accomplished in the liquid phase.
Misinterpreting what is actually
“vapour” as a “gas” has led to the
erroneous belief that gaseous-
phase kill is more rapid than
liquid-phase kill.
The expected microbial kill rates in the system might appear
as shown in Figure 1, which visualises H2O
2 sterilisation as a
process that occurs within a band, bounded by the extremes of
liquid and gas-phase kill. Figure 1 represents what is believed
to occur and does not reflect any specific H2O
2 process. The
absolute slopes of the death curves are unknown. Given that
the localised concentrations in both phases are variable due
to temperature differences and proximity to the inlet with
its heated air supply, it must be recognised that there will be
different kill rates in different locations in both the liquid and
gas phases. Figure 1 represents what might occur at a single
point within the chamber; similar appearing death curves with
differing slopes can be considered for other locations where
the local conditions are different. These variations are the
underlying cause of the variable performance experienced
when using vapour-phase H2O
2 as a lethal process.
D-values for H2O
2 decontamination
The death curves in Figure 1 seem to show that a D-value
(or an approximation of one) could be established against
a challenge microorganism for the combined processes.
That assumption is faulty because there is no way of
establishing what conditions (e.g., phase, concentration
or humidity) are present in the system at the point where
the microorganism is killed. D-value determination requires
knowledge of the specific lethal conditions to which a
microorganism is exposed. In a single-phase sterilisation
process, gas or liquid, information on concentration of the
agent, humidity (assumed at 100% for liquid processes),
Gas phasethroughout
Gas phase early,liquid phase late
Liquid phase early,gas phase late
Liquid phasethroughout
Time
Po
pu
lati
on
The exact killrates and theirdifferences areunknown
Figure 1: Estimated relative kill rates in liquid and gas phases; the exact kill
rates and their differences are unknown.
FIG
UR
E 1
IS
CO
UR
TE
SY
OF
TH
E A
UT
HO
RS
.

The Americas: +1.269.833.5844 Europe/Middle East/Africa: +32.2.714.6502 Asia Pacific: +65.6419.0248
[email protected] www.pfizercentresource.com
To get your bioprocessing project done right and on time, rely
on the collaborative team approach we’ve used to bring over
80 proteins and other large molecules to late phase clinical or
commercial-scale production. From project inception through
scale-up and ongoing optimization, you’ll have complete access
to our world-class analytical, regulatory, technical support and
production expertise – and the confidence that your project is
managed with seamless efficiency by a dedicated team of
experts, fully committed to your success. This allows us to offer
more flexible solutions to your manufacturing challenges, and
in accelerated timeframes.
No one brings more large-scale protein production experience to
your project. We are fully conversant in microbial, mammalian
cell, and other bioprocessing platforms. Our world-class
expertise in biological product characterization,
clinical and regulatory development, and process
development includes background in projects involving
the production of therapeutic proteins, peptides, vaccine
components, and enzymes. We also have a range of capabilities
to support sterile dosage form production and packaging to
meet selected customer needs.
Get an initial project assessment within a week
Take advantage of the Pfizer CentreSource rapid assessment
process to gauge your project’s feasibility. We’ll provide an
initial assessment within five business days.
The Collaborative Bioprocessing Partnership that Gets it Done Right and On Time

60 Pharmaceutical Technology Europe SEPTEMBER 2013 PharmTech.com
Sterilisation and Decontamination
and temperature is readily determined. In the context of
H2O
2, this is easiest for liquids, and published D-values for
Geobacillus stearothermophilus in various H2O
2/H
2O liquid
solutions are available (1). These liquid phase D-values dem-
onstrate extremely rapid kill (in seconds) at even modest
H2O
2 concentrations (7). At the estimated concentrations
where condensation first occurs in vapour H2O
2 processes,
the D-values should be lower as the concentration will be
substantially higher than that published in the literature.
Unfortunately, no comparable data are available on H2O
2,
where a strictly gas-phase process is present. Thus, any
labelled “D-values” for vapour H2O
2 biological indicators
must be considered nothing more than an approximation as
the killing conditions are unknown. The conditions of kill may
be consistent enough that they could be replicated in an
independent study in the same test system. What cannot be
established from these labelled “D-values“ is how that same
biological indicator will respond in a different environment
where the conditions are also unknown and most likely sub-
stantially different.
In the 20-plus years that this industry has been using
H2O
2 decontaminat ion, a BIER (biological indicator
evaluation resistometer) vessel for H2O
2 has not been
developed as a standard for compendial or routine use.
The same conundrum faced with respect to variable
and unknown biphasic conditions in a larger system has
prevented the development of a H2O
2 BIER. The absence
of a BIER vessel and, thus, a fully useable “D-value” for
H2O
2 biological indicators has caused some difficulties.
What can be established from the vendor “D-value” is the
relative resistance of one lot to another from the same
vendor. How any individual lot will perform under different
conditions is something the user must determine for each
application.
One suggested approach to get beyond this lack of a
definitive D-value for a biological indicator is to establish
a process or system “D-value” for a biological indicator
within a large enclosure and rely upon that as the basis for
destruction in the system rather than the vendor’s reported
value. This approach presumes that the conditions used to
establish the process/system “D-value” are representative
of the entire system. That assumption is decidedly not the
case, nor is it known whether the location(s) chosen for the
process “D-value” determination are best case or worst
case with respect to kill across the chamber. A number,
which is not a D-value in the strict sense, can be calculated,
but the utility of that number in any estimation kill rate
across the chamber is essentially nil.
Reports of vapour-phase “D-value” variat ions as
a consequence of dif ferent substrates must also be
recognised as uncertain (8, 9). Because there is no objective
biological indicator evaluation method available, published
“D-values” are not standardised and thus of very limited
use. Unless the concentration on the individual surfaces
tested can be known and demonstrated to be constant, any
hint that the substrate variations are meaningful must be
viewed with some skepticism. There is also some published
evidence that “D-values” may vary with spore concentration
applied to the carrier material, which means kill may not be
linear with concentration. That represents a serious flaw in
the use of any biological indicator.
Is safety a concern with H2O
2?
Given the rapid kill observed in the H2O
2 liquid phase, the
difficulties in attaining consistent kill with H2O
2 vapour proc-
esses can only be explained by a lack of adequate conden-
sation, for there is little doubt then when condensation
does occur, kill will be quite rapid (10). Many of the newer
There are three primary states of matter—
solid, liquid and gas. The term “vapour” is
defined in several ways. Scientifically, a
vapour is a gas at a temperature lower than
its critical point; a vapour is a gas phase
where the same substance can also exist as
a liquid. An example is atmospheric water
vapour. At temperatures above the dew
point, water in the atmosphere is a gas. As
the temperature is lowered through the
dew point, the gaseous water condenses
to form a fog or mist, or it can condense and form liquid water on a cold
surface. Another definition of vapour is visible moisture in the air, as in fog or
steam—a system in which a liquid is suspended in a gas.
Figure 1 shows water in various phases: the lake, the dense fog at the foot of
the mountain, the wisps of cloud and the blue sky above. The lake is certainly
liquid water; the blue sky is just as clearly a gas which contains water in
the gaseous state. The fog or cloud in the center is a mixture of a gas phase
(comprised of nitrogen, oxygen, water, carbon dioxide and trace amounts
of inert gases) and a suspended liquid phase (small droplets of water). The
density of the fog or cloud varies with its temperature. It is thickest (i.e.,
suspending the most liquid) near the base of the mountain where it is coldest.
It is clearly less dense, with less suspended water droplets near the top of the
image where the temperature is higher.
One of the major difficulties with hydrogen-peroxide (H2O
2) processes is the
use of a vapour for delivery of H2O
2 and water (H
2O) to the target chamber. It
must be understood that a vapour is a mixture of air and liquid that is present
within the chamber. In decontamination or sterilisation using H2O
2, the liquid
phase is comprised of both H2O
2 and H
2O, and the concentration of each in the
gas and suspended liquid state can vary across the system.
James P. Agalloco and James E. Akers
What is a Vapour?
Figure 1. Water phases.
FIG
UR
E I
S C
OU
RT
ES
Y O
F T
HE
AU
TH
OR
S.

Birgit BreitmoserTechnical draftswoman
(Machine Engineering)
“Imperfections? I like them in people. OPTIMA equipment I like to be perfect.”
A fi lling line from Optima, puts you on the safe side right from the begin-
ning. Because we build complete lines that feature all the advantages:
Perfect machine performance made to order, consistent documentation,
an ideal software solution including a central contact who is passionate
about looking after your smallest concerns. The one thing we refuse to
deliver is imperfection. Because we have understood that only perfection
translates into absolute customer satisfaction.
Visit us at P-mec India | December 03 - 05, 2013 | Hall 6 Booth # E28
OPTIMA pharma GmbH | Otto-Hahn-Straße 1 | 74523 Schwaebisch Hall | Germany
Telefon +49 791 9495-0 | [email protected] | www.optima-pharma.com
Member of

62 Pharmaceutical Technology Europe SEPTEMBER 2013 PharmTech.com
Sterilisation and Decontamination
generator designs, either freestanding or integrated into
enclosures, rely on condensation to decontaminate/sterilise
extremely rapidly.
Since the rapid kill provided by liquid H2O
2 is well
documented, why has industry been cautioned to avoid
condensation in vapour H2O
2 processes? The answer lies in
the early teachings of AMSCO (now Steris) when the first
H2O
2 generator was introduced in the late 1980s. Caution
was routinely raised regarding the potential hazards of
high concentrations of liquid H2O
2. (The H
2O
2 concentration
in the gas phase at ambient temperature will always be
substantially lower than its equilibrium concentration in the
liquid phase.) The relevant safety issues with the use of H2O
2
vapours are:
t� Explosive vapours. The caution here relates to concen-
trations of > 70% H2O
2 giving off explosive vapours at
temperatures greater than 70 °C (11). If this situation
were to occur anywhere in vapour processes, the
generators themselves would represent the greatest risk.
Temperatures inside enclosures rarely exceed 30 °C, and
thus the likelihood of this presenting a real-world problem
during a sterilisation process is unlikely.
t� Hazardous reactions. There are reports of H2O
2 reacting
with greases, alcohols, ketones, carboxylic acids (particu-
larly acetic acid), amines and phosphorus. Small amounts
of other materials that contain catalysts (e.g., silver, lead,
copper, chromium, mercury and iron oxide rust) can cause
rapid decomposition and an explosive pressure rupture of
the containing vessel if it is not properly vented (12). None
of these compounds and materials is typically present in
pharmaceutical enclosures.
t� Corrosivity. This is possible with some materials, but the
typical stainless steel, glass and other materials exposed
to H2O
2 are known to be compatible and are chosen
explicitly for that purpose. The chemical compatibility of
H2O
2/H
2O solutions is well documented.
t� Worker safety. The US Occupational Safety and Health
Administration has established an 8-hour, time-weighted
average for exposure to H2O
2 of 1 ppm, with an immediate
hazard in the presence of concentrations greater than
75 ppm (13, 14). This limit is managed in pharmaceutical
facilities through external alarms in the surrounding
areas and requirements for aeration before personnel or
material exposure.
While there is a need for caution with respect to the use
of vapour phase H2O
2, undue concern is unwarranted. In
more than 20 years of use in the global industry, there have
been no reported incidents of personal injury or equipment
damage associated with this process.
Claims that vapour-phase H2O
2 processes do not result
in condensation are speculative. The laws of physics
and temperature within enclosures are such that some
measure of condensation will always occur, and in many
recent equipment and process designs the creation of
condensation is intentional. Thus, within the context of real-
world experience, the safety issues associated with vapour
H2O
2 systems where condensation is present appear to be
adequately managed, assuming appropriate worker-safety
precautions are maintained.
Limitations of multipoint
process-control measurements
FDA’s Guideline on Sterile Drug Products Produced by
Aseptic Processing recommends: “The uniform distribu-
tion of a defined concentration of decontaminating agent
should also be evaluated as part of these studies” (15).
This suggestion is made without reference to a specific
methodology that could be employed. There is no tech-
nology that could address this expectation throughout a
two-phase environment. Nor would the resulting data on
concentration in the gas phase be useful in correlating to
microbial kill on surfaces. When appropriate amounts of
H2O
2 are used for decontamination or sterilisation, some
of the available instruments, such as those that rely on
near-infrared transmission, are unusable due to conden-
sation on the lenses. Because accurate measurement is
not possible, chemical indicators provide the only widely
available means to confirm that H2O
2 is, or was, present at
a specific location.
Problems in an unsteady-state process
The introduction of H2O
2 into a room-temperature enclo-
sure uses vapour-process heating to convert the liquid
solution into a gas for mixing and distribution in hot air. The
temperatures in vapourisers are in the range of 105–150
°C. This high temperature results in some localised heating
of the enclosure, primarily in locations close to the entry
point of the heated materials. The effects of this heat input
are multiple:
t� Temperatures during the process will change over its dura-
tion with the greatest impact found in locations nearest
the infeed locations. This heating is more pronounced in
smaller, flexible-wall and lightly loaded enclosures where
there is less overall mass.
t� The resulting changes in temperature will result in varying
amounts of condensation (and thus kill) across the
enclosure (and also varying over the duration of the
process dwell period at a single location).
t� The conditions close to the infeed are more likely to
remain in the gas phase throughout the process, which
can result in less condensation (if any) and potentially
slower kill rates in those locales. In one project, the
authors observed that a biological indicator location
directly beneath the supply port was repeatedly found to
be the only location where the biological indicator could
not be killed.
These phenomena are more problematic in those genera-
tors where H2O
2 is fed and removed throughout the process.
Systems that operate in a fill-and-soak mode may attain
equilibrium conditions within the targeted volume.

Pharmaceutical Technology Europe SEPTEMBER 2013 63
Sterilisation and Decontamination
The negative consequences of the unsteady-state nature of vapour-phase
H2O
2 processes are unavoidable in recirculating systems. The only means to
establish a consistent process is to use enough H2O
2 that even the warmest
locations attain some measure of condensation. This solution is more easily
accomplished in the non-circulating systems.
Penetration and adsorption by H2O
2
Years of experience with vapour-phase H2O
2 processes have shown how best to
address the adverse impact of its adsorption as further explained:
t� H2O
2 can penetrate high-density polyethylene fiber materials (Tyvek, Dupont),
which are primary packaging for many presterilised items. Tyvek-wrapped
materials of larger dimension may prove difficult to aerate because there is
no internal turbulence to aid in aeration.
t� Some polymeric materials will adsorb H2O
2 readily and desorb it very slowly.
A small (1 ft3), empty isolator manufactured from polycarbonate (Lexan,
SABIC Innovative Plastics) was found to require more than 24 h of aeration
(16). Careful attention to materials of construction is important to reduce any
unintended adsorption.
t� Typical sterile-product container materials (e.g., glass vial, elastomeric closure,
aluminum crimp) and many polymeric materials are largely impervious to H2O
2.
t� Shorter cycle dwell times allowing less overall time for adsorption are gener-
ally preferable.
t� Aeration periods can ordinarily be improved by additional air changes.
t� Liquid H2O
2 penetration through Tyvek has not been documented.
t� Some biological materials have demonstrated extreme sensitivity to H2O
2
requiring aeration to levels in the parts-per-billion range (17).
The adverse consequences of decontamination and sterilisation processes
should be considered in the development and control of every process. Vapour-
phase H2O
2 processes, because of their dual-phase nature, present new
challenges. Were other gases to be used, similar, but different, concerns would
present themselves and appropriate solutions would be identified. A more
penetrating agent would only increase the penetration/aeration difficulties
encountered, so while H2O
2 penetration/absorption/desorption is a problem,
the situation might be worse with alternative materials.
Biological indicator issues
Difficulties encountered in the destruction of biological indicators have been
commonly reported and are so well known that there are some who doubt the
efficacy of H2O
2 as a sterilant. These problems are multifaceted but resolvable
when the sterilisation process is properly established.
First, H2O
2 decontamination and sterilisation must be understood as a two-
phase system. Considering it as a single, gas-phase process has caused more
difficulties than anything else. The variability demonstrated in lethality is the
direct result of applying process constraints that are suitable for a gas process
but inadequate for two-phase H2O
2 processes. Adapting process models and
approaches from the most common gas sterilant, ethylene oxide (EO), to a
vapour process created much of the problem. The largest flaw in this thinking
is the deliberate avoidance of condensation in endeavoring to make what must
be a two-phase vapour process into one that operates in a single phase. Some
wrong assumptions are:
t� Process conditions (e.g., temperature, relative humidity and H2O
2 concentra-
tion) throughout the enclosure can be made uniform.
t� Condensation is to be avoided at all times.
t� Comparatively gentle mixing of the enclosure is adequate.
t� D-values for challenge microorganisms can be established.
+49-6134-2878-0www.colder.com/bio
© 2013 Colder Products Company
Quick and easy sterileconnections
AseptiQuik® connectors in a full range 1/8" to 1"
See our NEW genderless/universal sterile connectors at www.colder.com/bio

64 Pharmaceutical Technology Europe SEPTEMBER 2013 PharmTech.com
Sterilisation and Decontamination
In the actual two-phase H2O
2 process, none of these
assumptions is correct or attainable at the present
time. These assumptions led to the establishment of
vapour processes that are inadequate for their intended
purpose. They do not adequately induce condensation or
use sufficient mixing and thus fail to deliver reasonably
consistent conditions throughout the enclosure. The
experienced difficulties are a consequence of poor cycle
design and not problems with the lethality of H2O
2.
Second, biological indicators must be specifically designed
for the intended process. While there have been attempts at
this design, what has been accomplished is largely empirical.
The methods used for manufacturing H2O
2 biological indicators
may be identical to those used for other sterilisation processes,
but because correlation to actual process resistance is lacking,
the process suggestions inferred from labelled resistance
values are essentially unusable. In the absence of a BIER
(and thus truly reproducible biological indicator resistance),
the typical biological indicator process response can not be
expected for vapour-phase H2O
2 processes.
The most important attribute of any biological indicator is
its reproducible resistance to the intended process. There
is no established D-value method, which severely limits the
certainty of process understanding and biological-indicator
design and selection. Variable results with biological
indicators could be attributable to either variations in the
biological-indicator resistance or variation in the conditions
resulting from poorly conceived controls for a complex
process. Lacking a biological indicator whose response to
the process is precise, vapour-phase decontamination and
sterilisation becomes a more challenging process to control.
Third, there is a demonstrated biological indicator
concentration effect associated with the H2O
2 processes
unlike that seen in other sterilisation processes. Biological
indicators with a higher initial population have proven more
difficult to kill with H2O
2 than would be expected based upon
the results of the same lot at a lower concentration (18). This
phenomenon contradicts the core principle in all sterilisation
processes that microorganisms die at a constant logarithmic
rate regardless of population. Occurrence of this phenomenon
in H2O
2 processes can be attributed to several possible causes:
t� Excess cellular debris and perhaps both organic and
inorganic salts provide a protective layer of spores. This
problem is somewhat exacerbated by the use of stainless-
steel coupons that allow these materials to remain on the
surface adjacent to the spores.
t� The use of biological-indicator populations above what is
necessary for process certainty creates potential for
clumping of spores through which H2O
2 penetration may
not readily occur. FDA, US Pharmacopeia EMA, and the
Parenteral Drug Association all accept biological indicator
log reductions of 4–6 logs, where surface sterilisation is
not the objective (15, 19-21).
t� Some users adhere to an incorrect belief that a 106 spore
population of the resistant biological indicator must be
used to demonstrate a probability of nonsterile unit
(PNSU) of 1x10⁻⁶.
t� Inadequate processes that rely more on gas-phase kill
than the substantially more lethal liquid-phase kill only
serve to exacerbate all of the above problems.
All of these are correctable. Using a lower population
biological indicator eliminates the first two of these
difficulties. A hundred-fold reduction in spore population
reduces the amount of debris present at the edge of the
biological indicator drop and eliminates spore clumping
significantly. This single change would result in more linear
death curves than what has been evidenced. The third
difficulty is a common mistake that is all too prevalent in
the healthcare industry and has no basis in fact (22). The
food industry has used H2O
2 successfully for sterilisation for
many years and operates without this artificial and erroneous
expectation. The last issue is an artifact of the limited process
understanding still prevalent on many existing H2O
2 processes.
In cases for which condensation is actively promoted in the
process, fewer problems with sterilisation are encountered.
Much has been made recently of so-called “rogue”
biological indicators. These rogues (i.e., outliers) are
presumably biological indicators that failed to conform to the
user’s expectations of their demise. There is little doubt that
the production of spore crops, substrate selection and the
manufacture of biological indicators could result in clumping
and encapsulation in contaminants that could result in a
lack of uniform performance (23). Properly manufactured
biological indicators should be largely free of outliers. Greater
frequency of outliers detected in vapour H2O
2 processes
seems to be the result of poor understanding of vapour-
phase H2O
2 that results in marginally lethal processes and the
creation of biofilms and clumps of spores on stainless steel
at 106 concentrations, which result in what are effectively
false-positive biological indicators that do not represent the
elimination of normal flora at more diffuse concentrations.
Summary and recommendations
The successful use of any decontamination or sterilisation
process requires a thorough understanding of the under-
lying principles of the process with particular attention
to those aspects that differentiate it from other methods
because these represent potential new learning. The two-
phase nature of the vapour-phase H2O
2 process introduces
complexities that, if not well understood, can prevent suc-
cessful use. The healthcare industry has experienced con-
siderable difficulty in the implementation of this process.
The greatest improvements in operating these processes
can be obtained through the use of conditions that force
some measure of condensation and by recognition that
the desired log reduction of these processes need not be
excessive given the end use of the enclosure. Only product
contact parts must be sterilised, and shifting attention to
those locales within the enclosure alone would result in
substantial improvements in process outcomes.

Sterilisation and Decontamination
References
1. S. Block, “Peroxygen Compounds,” in Disinfection, Sterilisation &
Preservation, S. Block, Ed. (Lippincott, Williams, and Wilkins, Philadelphia,
PA, 5th ed., 2001), pp. 185-204.
2. CFR Title 21, Part 178.1005, Hydrogen Peroxide Solution (Government
Printing Office, Washington, DC), pp. 363-364.
3. EPA, List A: Antimicrobial Products Registered with the EPA as Sterilisers,
(Arlington, VA, Dec. 2011).
4. M. Ansari and A. Datta, Trans. IChemE 81 (C) 57-65 (2003).
5. C. Hultman, A. Hill, and G. McDonnell, Pharm. Eng. 27 (1) 23-30 (2007).
6. S. Block, “Peroxygen Compounds,” in Disinfection, Sterilisation &
Preservation, S. Block, Ed. (Lea & Febiger, Philadelphia, PA, 4th ed., 1991),
pp. 167-181.
7. J. L. Sagripanti and A. Bonifacino, Appl. Environ. Microbiol. 65 (9) 4255-
4260 (1999).
8. G. B. McNassor, Proceedings of the ISPE Barrier Isolation Technology
Conference (Arlington, VA, 1999).
9. S. M. Davenport, Proceedings of the ISPE Barrier Isolation Technology
Conference (Arlington, VA, 1999).
10. J. Rauschnabel, “Vapour Phase Hydrogen Peroxide–Process
Development, Qualification and Validation,” presentation at the PDA
Europe meeting (Berlin, Germany, 2008).
11. Arkema, “Hydrogen Peroxide 70% (all grades), Product code 04504,”
MSDS, Oct., 2010.
12. US Peroxide, “Hydrogen Peroxide Safety and Handling Guidelines,” www.
h2o2.com/technical-library/default.aspx?pid=66&name=Safety-amp-Han-
dling, accessed 29 July 2013.
13. CFR Title 29, Part 1910.1000, Table Z-1 (Government Printing Office,
Washington, DC), pp. 7-19.
14. CFR Title 29, Standard 1910.103, “Hazardous Materials, Hydrogen”
(Government Printing Office, Washington, DC), www.osha.gov/pls/
oshaweb/owadisp.show_document?p_table=STANDARDS&p_id=9749,
accessed 8 Aug. 2013.
15. FDA, Guidance for Industry: Sterile Drug Products Produced by Aseptic
Processing, (Rockville, MD, Sept., 2004).
16. J. Agalloco, private communication (1995).
17. A. Hui, S. Yim, K. Eppler, and X. Lam, Proceedings of ISPE Brussels
Conference on Risk-based Control Strategies in Pharmaceutical
Industries (Brussels, Sept. 2010).
18. E. Gillitzer, Spore News, Mesa Laboratories, 9 (3) 1-3 (2012).
19. USP General Chapter <1208>, “Sterility Testing—Validation Of Isolator
Systems“ (US Pharmacopeial Convention, Rockville, MD, 2011).
20. PIC/S, “Isolators Used For Aseptic Processing And Sterility Testing,”
PI 014-2 (Geneva, Switzerland, 2004).
21. PDA, “TR #34, Design and Validation of Isolator Systems for the
Manufacturing and Testing of Health Care Products,” (Bethesda, MD, 2001).
22. J. Agalloco, J. Akers, and R. Madsen, PDA J. of Pharm. Sci. Technol. 63 (2)
89-102 (2009).
23. K. McCauley and J. Gillis, “Aseptic Processing” supplement to Pharm.
Technol. 31 s26-31 (2007). PTE
… and if not taken correctly even the best medicine can be ineffective. Patient acceptance often depends on convenience, ease of swallowing and taste. We at HERMES PHARMA have over 40 years of experience in developing and manufacturing pharmaceuticals that are user-friendly, effective and increase compliance. This is how we generate added value – for patients and the pharmaceutical industry. More at www.hermes-pharma.com/bitter_pillScan to see video!
TAKING MEDICINESCAN BE A BITTER PILL TO SWALLOW ...
TABLET
PHOBIA
LONG-TERM
MEDICATION BEDRIDDEN ESOPHAGITIS
Meet us at CPhI 2013, booth 31E26

Ge
rma
n/E
+/G
ett
y Im
ag
es
The European Falsified Medicines Directive
(FMD) seeks to prevent falsified medicines
entering the legal supply chain in the European
Union (EU). The directive was adopted in July
2011, and EU member states began applying
provisions in January 2013. The purpose of
the directive is to harmonise and strengthen
safety and control measures across Europe in
four main areas: safety features of medicines,
the supply chain and good distribution
practices (GDPs), active substances and
excipients, and Internet sales (1–3).
From 2 July 2013, all active substances
manufactured outside of the EU and imported
into the EU must be accompanied by a written
confirmation from the competent authority
of the exporting country that confirms that
the standards of good manufacturing practice
(GMP) and control of the manufacturing plant
are equivalent to those in the EU (4). These
requirements constitute one of the main areas
of change of the new FMD to provide a clear
legal basis for the concept of international
cooperation on active substances, which is
based on sharing responsibilities with local
regulators (4). The written confirmation is
required per manufacturing site and per active
substance and should provide the following
assurances:
t� Standards of GMP applicable at the plant
are at least equivalent to those in force in
the EU.
t� The plant is subject to regular and strict
controls and effective enforcement of GMP,
including inspections.
t� Information on findings relating to
noncompliance is supplied by the
exporting third country without delay to
the authorities in the importing country
in the EU.
The duration of validity of the written
confirmation is established by the exporting
non-EU country (4). As noted by the
European Medicines Agency (EMA), these
new requirements reinforce the need for
pharmaceutical companies to ensure that
the active substance manufacturers they
are working with are registered with their
respective local authorities and subject to
adequate regulatory oversight (4).
Additionally, the directive specifies
that exporting countries with a regulatory
framework equivalent to that of the EU will
not need to issue written confirmations
subject to approval. Following a request from
a non-EU country, the European Commission
(EC), together with GMP experts from member
states and with the support of the EMA,
will assess the regulatory framework of the
requesters, and if the assessment is positive,
the county will be listed as an “equivalent
country” (4). As of 2 July 2013, four countries
have been listed by the EC: Australia, Japan,
Switzerland and the United States. An
equivalence assessment is ongoing for Brazil.
Israel and Singapore have requested to be
listed as an “equivalent country” (4).
To avoid the risk of shortages of medicines
if the required written confirmation cannot
be obtained, the FMD provides for a waiver
from the written confirmation in exceptional
circumstances. The waiver can be used where
an inspection by an authority of the European
Economic Area has been carried out with
a positive outcome and the issue of a GMP
certificate (4).
The FMD also puts into place measures on
the distribution side of the pharmaceutical
supply chain. It includes new responsibilities
for wholesalers and a definition of brokering
activities as well as new responsibilities
for brokers. The EMA’s revised guideline
on GDP, which was published in February
2013, includes specific provisions for
brokering activities (1–3, 5). Reflecting the
inclusion of GDP into European provisions,
the EudraGMDP database also now includes
information on GDP. EudraGMDP is a
modification of the EudraGMP database,
which was launched in April 2007 to facilitate
the exchange of information on compliance
and noncompliance with GMP among the
regulatory authorities within the European
Moderated by Adeline Siew, PhD
Implications forAPIs in the European Falsified Medicines Directive
Ensuring the quality of the pharmaceutical supply chain is of utmost
importance to the pharmaceutical industry. The European Falsified Medicines
Directive (FMD), which became effective in July 2013, requires that all active
substances manufactured outside the European Union (EU) be accompanied by
a written confirmation from the regulatory authority of the exporting country.
These statements are to be issued per manufacturing site and per active
substance to ensure that standards of good manufacturing practice (GMP),
equivalent to those in force in the EU, are upheld. To gain insight on these
provisions, two key industry groups, the Active Pharmaceuticals Ingredient
Committee (APIC) and the European Fine Chemicals Group (EFCG), both sector
groups of the European Chemical Industry Council (CEFIC), offered their
perspectives on the strengths and weaknesses of the FMD.
66 Pharmaceutical Technology Europe SEPTEMBER 2013 PharmTech.com

Parenteral Contract Manufacturing Service of Hospira
KNOWLEDGE | EXPERIENCE | EXPERTISE
Let’s talk about the benefits of
Complementary Capabilities
Let’s talk more
Call +1-224-212-2267 or
+44 (0) 1926 835 554
or e-mail [email protected]
iCSE/CPhI 2013
AAPS 2013
BIO-Europe 2013
PDA Europe Universe of Pre-filled Syringes & Injection Devices 2013
McPherson, USA
Zagreb, Croatia
Liscate, Italy
NORTHAMERICA
EUROPE
Biologics & small molecule fill & finish
Clinical & commercial supply to 45+ local markets
On-site development and bio-analytical expertise
Advanced lyophilization capabilities
Flexible labeling and packaging
Cold chain management
QP Release services
Hospira, Inc., 275 North Field Drive, Lake Forest, IL 60045 P13-4132/R1-197x267-Aug.,13

Falsified Medicines Directive
medicines network. The new database,
now called EudraGMDP, was a
deliverable of the FMD. It is gradually
being updated by medicines regulatory
authorities in EU member states with
distribution-related information and
will be maintained on an ongoing
basis (1, 5). The additional information
will include: wholesale distribution
authorisations; GDP certificates;
statements of noncompliance
with GDP; and registrations of
manufacturers, importers (including
information on their suppliers) and
distributors of active substances (1, 5).
Although the FMD took steps to
fortify the supply chain as it relates
to APIs coming into the EU, there
is concern that the FMD falls short
in adequately strengthening the
inspection process for APIs imported in
the EU. To gain a perspective on these
issues, Pharmaceutical Technology
Europe discussed the FMD as it relates
to API supply with representatives
from the Active Pharmaceutical
Ingredient Committee (APIC) and the
European Fine Chemicals Group (EFCG),
both sector groups of the European
Chemical Industry Council (CEFIC), the
trade association representing 29,000
large, medium and small chemical
companies in Europe. APIC represents
approximately 65 fine chemical
companies, contract manufacturers
and pharmaceutical companies. EFCG
represents approximately 40 small,
medium and large fine-chemical
companies including four national
and European industry associations:
APIC; ASCHIMFARMA—the Italian
Association of Manufacturers of
Active Ingredients and Intermediates;
CPA—Italy’s Chemical Pharmaceutical
Generic Association; and SICOS, which
represents French fine and biochemical
producers (6–8).
FMD sparks concernsPTE: Do you think the
measures contained in
the FMD are sufficient to
ensure the quality of
pharmaceutical ingredients coming into
the EU or are there other measures that
need to be taken?
APIC and EFCG: No, the FMD does
not sufficiently ensure the quality of
APIs entering the EU. We have been
very close to this topic since the FMD
Rx-360, a pharmaceutical industry supply-chain consortium, is
advancing approaches between pharmaceutical companies,
suppliers and contract manufacturers as a means to better secure
the pharmaceutical supply chain. Pharmaceutical Technology Europe
discussed the group’s recent activities and upcoming goals with
Brian Johnson, chair of Rx-360 and senior director of supply-chain
security at Pfizer.
PTE: Can you outline the key accomplishments of Rx-360 during the
past year and what is planned in the near term?
Johnson: We continue to see headlines around the world where
criminals are putting patient safety at risk to make money through
counterfeiting, product diversion, theft and intentional adulteration.
Substandard drugs with little or no active ingredient are being found
at very high levels in the legitimate supply chains of many poor
countries. Most experts and published data show that the problem is
getting worse, not better. Globalisation and increasing supply-chain
complexity are contributing to the problem. It is time to take action
and Rx-360 is leading the way. Rx-360 is a global nonprofit consortium
of more than 80 companies and organisations with a mission
to protect patient safety by sharing information and developing
processes related to the integrity of the healthcare supply chain and
the quality of materials within the supply chain. Rx-360 accomplishes
its mission through education, sharing information, promoting best
practices and sharing audits. A few highlights from the past year
demonstrate our commitment to action.
Education. Rx-360 believes that educating stakeholders on supply
chain risks and, more importantly, solutions is key for the industry
to be successful. A great example is Rx-360’s recent “Protect Your
Patients—Know Your Suppliers” campaign targeted at educating
healthcare practitioners on the risks of product diversion. Rx-360 also
conducted six free educational webinars for the industry this past year
providing solutions and best practices for other supply-chain threats.
Sharing information. Supply-chain security is not a competitive
advantage. Rx-360 believes that freely sharing information, such
as alerts on potential supply-chain threats, is vital to the industry’s
success. Over the past year, Rx-360 issued 14 alerts, including a
potential heparin shortage, use of ‘gutter oil’ in China, toxins in
glycerin, reports on Hurricane Sandy and Avastin (bevacizumab).
[Gutter oil is a term used in China to describe illicit cooking oil, which
has been recycled from waste oil collected from various sources,
such as restaurant fryers, drains, grease traps and slaughterhouse
waste; improper use of gutter oil involves its use in excipient
manufacture.] Rx-360 also published 80 summaries of new guidances,
legislation and regulations.
Promoting best practices. It is not enough to talk about the risks;
the industry needs to develop and share best practices. Over the past
18 months, Rx-360 developed and published seven white papers that
contain the industries best thinking on various supply-chain security
topics such as: preventing cargo theft; risks of drug shortages; tools
for product diversion; auditing logistics service providers (LSPs);
comprehensive supply-chain security programs; incident management
processes; and monitoring the marketplace for threats—these
examples are real solutions to real problems.
Sharing audits. Industry collaboration on sharing audit information
and jointly conducting audits is crucial to improving the transparency
of our increasingly complex and global supply chains. Rx-360 has
completed and published almost 100 audits to date, and in 2013, we
are on pace to double the number of audits completed in 2012, so we
are quickly gaining momentum. Helping drive this initiative was the
recent completion of a lean six sigma analysis of our audit programs
and making modifications in the process to make it easier, quicker
and more cost effective for companies to use. Our new database is
also coming online, which takes a manual process and automates it,
leading again to a simpler, more efficient process for all involved. We
are also launching a pilot to conduct good distribution practice (GDP)
audits, which we believe will help Rx-360 meet an important industry
need. Finally, over the past year, we have been promoting the licensing
of Rx360 audits by making it easy to purchase an audit already
conducted by Rx-360 and helping to defer costs that sponsors of the
original audit incurred. This approach allows companies sponsoring
an audit to put proceeds towards future audits, thereby, increasing
capacity and lowering costs.
For more information on Rx-360, including free tools and resources,
see www.rx-360.org.
Rx-360 advances supply-chain security
68 Pharmaceutical Technology Europe SEPTEMBER 2013 PharmTech.com

Falsified Medicines Directive
concept was born and we remain
concerned that, despite its objectives,
it fails to fully meet the needs of EU
patients with respect to product
quality. Its effectiveness is still too
dependent on industry’s supply chain
self-evaluation and open to corrupt
practices. Other measures that are
needed include:
t� Stricter enforcement of existing
laws by all member state regulatory
authorities, plus tough sanctions to
punish the violators
t� A consistent approach of
member states when transposing
the FMD into national law throughout
the EU
t� A change in the existing laws to
include mandatory inspections by
competent authorities of all API
manufacturers with the industry
paying for extra regulatory resources
if needed similar to the Generic Drug
User Fee Act (GDUFA) in the United
States
t� APIs contained in imported finished
and semifinished drug products,
mixtures of API with excipient(s)
and semifinished (crude, moist) APIs
should be included in the scope of
the FMD.
The EC should have rigorously
tested its assumption that there are
15,000–20,000 API manufacturers
selling APIs into Europe before they
decided not to propose the mandatory
inspection of all API producers. In
fact, the Heads of Medicines Agencies
survey of medicine manufacturers in
Europe, published on 27 Mar. 2013,
showed that the top 18 third-country
manufacturers/exporters of APIs to
Europe had only 1479 manufacturing
sites (9). It is, however, never too late
for the EC to re-consider mandatory
inspections to better protect EU
citizens and patients.
Inspection processPTE: One concern raised by
the FMD is the adequacy of
enforcement measures,
particularly the inspection
process with the new directive lacking
a provision requiring mandatory
inspections of API producers in third
countries (i.e., countries outside the
EU). From an industry perspective,
what are the advantages/
disadvantages of the current inspection
process of API producers in third
countries? In what areas can the
process be improved and at what level/
jurisdiction should it be made?
APIC and EFCG: The advantage of
the current inspection process eases
the continuity of supply of APIs from
third countries for EU patients and,
hence, avoids major product shortages.
The disadvantage is the continued risk
of substandard APIs/products entering
the EU due to a lack of adequate
enforcement and tough sanctions to
punish individuals and companies.
We suggest the following process
improvements:
t� Ideally, change the FMD to provide
for mandatory inspections by EU
authorities of API producers in third
countries with industry helping to
pay, or
t� Achieve the same end result by
providing for mandatory inspections
of third-country API producers by
European authorities together with
other country authorities applying
the same EU GMP standards to share
the inspection responsibility via
mutual recognition agreements (e.g.,
US, Australia and Japan)
t� Inspectors should be trained to
detect falsification or fraud, for
example, facade constructions,
ghost plants and falsified official
papers.
GDP guidelinesPTE: Earlier this year, the EU
finalised a guideline on GDP
for medicinal products in the
EU. Although it addresses the
distribution of medicinal products from
an end-market perspective, the intent
of the guideline is to further ensure the
quality of medicines coming into the
EU. From an industry perspective, what
are the implications for suppliers of
APIs and other pharmaceutical
ingredients?
APIC and EFCG: The industry
must ensure transparency of sources
and intermediaries (brokers and
traders) and a register of evidence of
compliance at each step along the
entire supply chain from raw-material
suppliers to the final medicine.
Additionally, the EC published in
The European Falsif ied Medicines Directive (FMD) and its
implementation continues to engender further insight by industry
members. Pharmaceutical Technology Europe spoke to Guy Villax,
CEO of Hovione, who offered additional perspective on the topic.
PTE: What are your thoughts on the FMD?
Guy Villax: The perspectives offered by the European Fine
Chemicals Group (EFCG) and the Active Pharmaceuticals
Ingredients Committee (APIC) of the European Chemical Industry
Council (CEFIC) represent the view of the vast majority of the
European Union’s API industry.
In one respect, the European Medicines Agency (EMA) and the
European Commission (EC) deserve credit for being innovative
and taking a historical step in the defense of the patient. Never
before the ‘written confirmation’ did so many regulators ever
truly talk to each other, understanding what systems were truly
in place in each country and finding common ground. The written
confirmation process is forcing regulators to understand each
others’ systems and to make use of these systems to protect
each others’ backs. The collaborative model that the FMD has put
forward is the right way to go, and for this, I say congratulations.
Yet, the tough job for EMA, the heads of agencies and the EC lies
ahead, and their success will be measured on two fronts.
Firstly, European regulators must take an uncompromising
stand. Trust and integrity are central for this global process to
succeed, and Europe must have the courage to blacklist publicly
any country that fails the test and stop goods at the borders.
Secondly, will regulators walk the talk? Will regulators truly make
the most of the system they have created? For example, will the
European Directorate for the Quality of Medicines & Healthcare
(EDQM) demand that a current China FDA GMP certificate be
included on a mandatory basis before a Certificate of Suitability
(CEP) is issued to a China located API producer? And will EDQM
suspend all such CEPs if such FDA GMP certificate is not on file
by December 2013? And when I say CEPs, I also mean every one
of the Chinese drug master files filed in support of marketing
authorisations issued by the 28 medicine agencies.
Industry perspective: The challenge for regulators
Pharmaceutical Technology Europe SEPTEMBER 2013 69

Falsified Medicines Directive
February 2013 a draft guideline on
the principles of Good Distribution
Practices for Active Substances as
part of the implementation of the
FMD. Although this guideline only lays
down the ‘principles’ of GDP, it will be
a step in the right direction.
Supply-chain securityPTE: From an industry
perspective, as regulatory
and industry groups seek
ways to fortify the
pharmaceutical supply chain in an
increasingly global environment, what
are the implications in the outsourcing
relationship, either from the
perspective of a sponsor company
(i.e., pharmaceutical company) or
contract manufacturer/supplier?
APIC and EFCG: The sponsor
company needs a contractor that it
can trust to meet appropriate GMP
standards in terms of product quality,
quality culture, regulatory compliance
with the laws of the country of
product destination and delivery at a
price they are prepared to pay. Roles
and responsibilities with respect
to manufacture and distribution,
including sub-contracting or use of
third party distributors, should be
clearly defined and understood by
both parties. The contractor should
be aware of the relevant regulations
and should be able to comply with
them. They must not fail their sponsor
by delivering sub-standard products.
Initiatives from APIC and EFCGPTE: Can you outline key
recent activities of APIC and
EFCG in 2012 and 2013 in
response to the EU FMD
implementation and other measures
that affect API supply into the EU?
APIC and EFCG: APIC and EFCG
have been very active opposite the
EC during the implementation of the
FMD. We have written letters and made
face-to-face representations to the
EC’s Directorate-General for Health
and Consumers (DG SANCO) to point
out the continuing risks to EU patients
(we are all patients) and to the EU API
manufacturing base (our members). The
latter suffer unfair competition mainly
from Asian API manufacturers, many
of whose facilities fall well short of the
EU-required GMP standard (ICH Q7) (10).
We have challenged the “loopholes” that
remain within the FMD, which unless rig-
orously enforced by the various national
regulatory authorities, will not prevent
substandard APIs from continuing to
enter the EU market, either as bulk API
(requiring written confirmations) or
through formulated products (where
there is no separate check on APIs). We
are pleased to note via DG SANCO that
the national authorities in China and
India have severely limited the number
of sites for whom written confirma-
tions are permitted. APIC and EFCG will
continue to press for mutual recognition
agreements with other countries (e.g.,
US, Japan and Australia) that operate to
the same GMP standards to help level
the global playing field.
References1. P. Van Arnum, Pharm. Technol. 37 (7)
62-63 (2013).
2. EMA, “Falsified Medicines,” www.
emaeuropa.eu/ema/index.
jsp?curl=pages/special_topics/
general/general_content_000186.
jsp&mid=WC0b01ac058002d4e8,
accessed 10 Aug. 2013.
3. EC Directive 2011/62/EU, Falsified
Medicines Directive (Brussels, July 2011).
4. EMA, “Falsified Medicines Directive:
Imported Active Substances Need
Written Confirmation to Guarantee GMP
Standards,” Press Release (2 July 2013).
5. EMA, “Key Deliverable of Falsified
Medicines Directive Achieved,”
Press Release (8 Apr. 2013).
6. CEFIC, www.cefic.org, accessed
10 Aug. 2013
7. APIC, www.apic.cefic.org, accessed
10 Aug. 2013.
8. EFCG, www.efcg.cefic.org, accessed
10 Aug. 2013.
9. European Commission website,
http://ec.europa.eu/health/files/
committee/70meeting/pharm622.pdf,
accessed 10 Aug. 2013.
10. ICH, Q7 Good Manufacturing Practice
Guide for Active Pharmaceutical
Ingredients, Step 4 version (2000), www.
ich.org/fileadmin/Public_Web_Site/
ICH_Products/Guidelines/Quality/Q7/
Step4/Q7_Guideline.pdf, accessed 10
Aug. 2013. PTE
In other work, scientists reported on
the application of latent variables-based
modeling to a reaction process in a
small-molecule synthesis based on con-
tinuous-flow hydrogenation (11). In
another study, scientists reported on
using a QbD approach for designing
improved stability studies (12). Also, sci-
entists at UCB and the Institut des
Sciences Moléculaires de Marseille in
France recently reported on the feasi-
bility of using online NIR spectroscopy as
a process analytical technology tool to
monitor in real time the API and residual
solvent content to control the seeding of
an API crystallisation process at indus-
trial scale. A quantitative method was
developed at laboratory scale using sta-
tistical design of experiments and multi-
variate data analysis (13).
References1. ICH, Q8 (R2) Pharmaceutical
Development (2009).
2. ICH, Q9 Quality Risk Management (2005).
3. ICH, Q10 Pharmaceutical Quality
System (2008).
4. ICH, Q11 Development and Manufacture
of Drug Substances (Chemical Entities
and Biotechnological/Biological Entities)
(2012).
5. FDA, “FDA, EMA Announce Pilot for
Parallel Assessment of Quality by
Design Applications,” Press Release,
16 Mar. 2011.
6. EMA, “European Medicines Agency
and US Food and Drug Administration
Announce Pilot Program for Parallel
Assessment of Quality by Design
Applications,” Press Release,
16 Mar. 2011.
7. EMA, “EMA–FDA Pilot Program for
Parallel Assessment of Quality-by-
Design Applications: Lessons Learnt
and Q&A Resulting from the First
Parallel Assessment,” Press Release,
20 Aug. 2013.
8. S.B. Brueggemeier et al., Org. Proc.
Res. Dev. 16 (4) 567-576 (2012).
9. J. Musters et al., Org. Process Res.
Dev. 17 (1) 87-96 (2013).
10. I. Figueroa, S. Vaidyaraman and S.
Viswanath, Org. Process Res. Dev., online,
DOI: 10.1021/op4001127, 22 July 2013.
11. Z. Shi, N. Zaborenkdo and D.E. Reed,
J. Pharm. Innov. 8 (10) 1-10 (2013).
12. S.T. Colgan, J. Pharm. Innov. 7 (3-4)
205-213 (2012).
13. C. Schaefer et al., J. Pharm. Biomed.
Anal., online, DOI.org/10.1016/j.
jpba.2013.05.015. 20 May 2013. PTE
Cover Story – contin. from page 30
70 Pharmaceutical Technology Europe SEPTEMBER 2013 PharmTech.com

For questions, contact Kristen Farrell at [email protected]
E V E N T O V E R V I E W
Pharmaceutical manufacturing of solid oral dosage forms such as tab-
lets and capsules involves several powder handling steps, including
blending, transfer, granulation, fluid bed drying, tablet compression,
and encapsulation. The inability to achieve reliable powder flow dur-
ing these steps can have a significant adverse effect on the manufac-
turing a product. Production costs can be significantly higher than
anticipated due to required intervention on the part of operators, low
yield, or unplanned process redesign. Powder characteristics such as
particle size distribution, bulk density, cohesiveness, stickiness, and
static behavior can have a significant influence on manufacturing
processes for small-scale or large commercial-scale operations. Low
melting or softening solids can add another handling challenge in
dosage form manufacturing, especially in cases where high speed
tableting is required for large-scale manufacturing. The experience
from multiple projects can help alleviate or solve many of these chal-
lenges regardless of the phase of the project.
During this 60-minute interactive web-
cast, two industry experts will discuss
challenges in powder and product
handling such as flowability, stickiness,
and the potential to soften or melt
during the manufacture of solid dos-
age forms. They also will discuss the
application of engineering solutions
to overcome these processing chal-
lenges. Case studies will be shared to
demonstrate possible solutions.
Anil Kane, Ph.D. Executive Director, Global Formulation Sciences,
PDS at Patheon will discuss case studies in application of innova-
tive solutions to solve critical powder handling issues in tableting/
encapsulation.
James Prescott, Senior Consultant/Director, Jenike & Johanson, Inc.,
will discuss the use of bench scale tests to predict powder flow and
segregation behaviors at production.
Presenters:
Anil Kane, Ph.D.
Executive Director,
Global Formulation Sciences, PDS
Patheon
James K. Prescott
Senior Consultant and Director,
Jenike & Johanson, Inc
Moderator:
Rita Peters
Editorial Director,
Pharmaceutical Technology
Who Should Attend:
■ Formulation scientists
■ Formulation R&D managers, directors, and group leaders
■ Process development scientists
■ Process development managers, directors, and group leaders
■ Section Heads
■ Project Managers
■ Technical personnel involved in formulation and development
■ Scientists, manager, directors, and group leaders involved with formulation
■ Manufacturing managers
■ Technical personnel involved with QA/QC
■ Technical personnel responsible for production scale work
■ Process Engineers
Presented by Sponsored by
ON-DEMAND WEBINAR
Register Free at www.pharmtech.com/solutions
Key Learning Objectives:
■ Techniques to solve and prevent powder handling challenges.
■ Innovative solutions to handle low melting, cohesive powders, and granulations in pharmaceutical manufacturing.
Application of Engineering Solutions to Solve Challenges in
Pharmaceutical Processing: Case Studies
from Development to Production Scale

soza
ijite
n/D
ata
cra
ft/G
ett
y Im
ag
es
Quality by design (QbD) is often misquoted,
misused and misunderstood. Pharmaceutical
QbD is a systematic scientific risk-based approach
to pharmaceutical development that begins with
predefined objectives that address product and
process understanding and process control (1). Many
articles focus on what is required with respect to
product quality, safety and efficacy but successful
approaches are not commonly shared. Successful
product development relies on consistent application
of a proven methodology. The key steps are the same
irrespective of the product or formulation being
developed. A proven methodology is described in this
article, with the framework shown in Figure 1. These
main steps are further described as outlined below.
Main steps of a QbD processCritical quality attributes (CQAs). CQAs are defined
based on the target drug profile. These are quality
characteristics of the drug that must be kept within
appropriate limits to ensure the desired product
quality (e.g., purity, crystalline form and particle size).
Conrad Winters*, PhD,
is director, Drug Product
Development Group,
and Filipe Neves, PhD,
is group leader, Drug
Product Development
Group, both at Hovione
FarmaCiencia SA.
*To whom all correspon-
dance should be addressed.
Optimising Quality by Design in Bulk Powdersand Solid DosageThe changing development paradigm resulting from the US Food and Drug Administration’s quality-
by-design (QbD) initiative and International Conference on Harmonisation (ICH) guidelines requires
increased process understanding of the drug substance and drug product throughout development
and manufacturing. A lack of information can result in delays in regulatory approval and higher costs.
Applying QbD principles leads to greater process understanding, facilitates regulatory approval
and streamlines postapproval changes. Case studies on the manufacture of a bulk powder and the
development of a tablet show the application of QbD principles, including defining critical quality
attributes, implementing risk assessment, optimising process development, developing a design
space and performing a criticality analysis.
72 Pharmaceutical Technology Europe SEPTEMBER 2013 PharmTech.com

Quality by Design
Risk assessment during the
development phase. For each CQA,
an analysis of the potential critical
process parameters (pCPPs) and
potential critical material attributes
(pCMAs) is conducted. The aim
is to evaluate in each process step,
operating parameters or raw
materials that have the potential
to affect a CQA within the known
ranges, and therefore, should be
monitored or controlled to ensure
the desired quality. Because the
number of parameters is usually
high, a risk assessment based on
prior knowledge of the product
or process is used to rank the
parameters in terms of perceived
criticality. The ultimate goal is to keep
the development process as lean
as possible by focusing the studies
on those parameters with a higher
likelihood of having a critical impact.
Process development. The
output of the risk assessment is a
qualitative match between CQAs
and pCPPs/pCMAs. To confirm
the dependences and quantify the
effects, a process-development stage
is conducted. Usually a statistical
approach is followed, through a
sequence of design of experiments
with different objectives—screening,
optimisation and robustness studies.
This development stage constitutes
the core of the QbD methodology
since most of the process knowledge
is generated during this stage.
Although not mandatory, a model,
either statistical and/or mechanistic,
is a usual outcome of this stage.
Process analytical tools can also be
considered at this stage based on the
need to improve the CQA monitoring
as the process is scaled up.
Design space and normal
operating ranges (NOR). Once
the impacts of the pCPPs/pCMAs
are quantified on the CQAs, a
feasible operating space can be
defined. This space, known as the
design space, will consider all the
interactions between operating
parameters and material attributes
and will often be multidimensional.
The NOR is established within the
design space and can be thought
of as the ranges where the process
typically operates.
Risk assessment during
manufacturing. After defining
the design space and NOR, an
exhaustive analysis of the process
is conducted at the manufacturing
scale. In this study, a failure
mode effect analysis (FMEA)
of all manufacturing aspects
are reviewed, challenging the
equipment operating ranges and
procedures against the process
knowledge gathered in the previous
steps. The purpose of this study is
to understand and quantify the risk
of batch or process failure and to
define actions to minimise failures.
Criticality analysis. By knowing
the feasible operating regions and
after evaluating the equipment/
procedures at the manufacturing
scale and the practical NOR, a final
criticality analysis will take place to
identify parameters and/or material
attributes that will require tight
monitoring or control. For example,
all parameters for which the
corresponding NORs are close to the
boundaries of the design space.
Process-control strategy. Once
the criticality around a process
parameter and/or raw material
attribute is confirmed, adequate
control strategies will be set in
place. The ultimate goal is to assure
that the operation is always taking
CQA definition
(Critical quality attributes)
Target profile
(quality, safety, efficacy)
Risk assessment I
(rank process parameters)
Risk assessment II
(process FMEA)
PAT Implementation
Criticality analysis
Change control &
implementation
Process control
strategy
Regulatory filing &
approval
Process development
(statistical, mechanistic)
Design space & NOR
(feasible & preferable)
PAT stra
teg
y
Figure 1: An overview of Hovione’s quality-by-design approach.
CQA is critical quality attribute, PAT is process analytical
technology, NOR is normal operating range, FMEA is failure mode
effect analysis.
Reaction(API synthesis)
pCritical pCritical
pCritical
pCritical
Noncritical
Noncritical
Noncritical
Noncritical
Noncritical
Processstep
CQAs
Organic purity
Residualsolvents
Particle sizebulk density
The respective process parameters must be analysed
Mixture(excipient added) Spray drying
Figure 2: Risk assessment. Decomposing the process in main
steps for a more structured criticality assessment (illustrative
example for the bulk powder manufacturing process). CQA is
critical quality attribute, p is potential.
All
fig
ure
s a
re c
ou
rte
sy o
f th
e a
uth
ors
.
Pharmaceutical Technology Europe SEPTEMBER 2013 73

Quality by Design
place within the design space,
therefore, assuring the quality of
the final product. For this purpose
and considering the dependence
of a control strategy on a given
monitoring capability, the final
implementation of process analytical
technology tools is carried out at
this stage. The subsequent steps are
mainly focused on the documentation
aspects associated with the filing
process and will not be addressed
in this article.
Bulk powder development case studyCQA definition. This case study
examines the preparation of bulk
powder that is subsequently
formulated as a tablet. The
preparation of the powder was
broken down into three stages:
synthesis, excipient addition and
spray drying. The spray-drying
stage was identified as being
potentially crucial for all CQAs and
will be examined in more detail (see
Figure 2). CQAs for the bulk powder
were determined to be purity,
residual solvent level, particle size
distribution and bulk density among
other but will not be addressed in
this article.
Risk assessment. A risk
assessment was completed to
prioritise and reduce the number
of parameters to be investigated in
the study. This process is subjective
and relies on the experience of
the team members involved in the
assessment. Having four or more
inputs will help reduce bias and
enable the top pCPPs to become
evident in general (see Figure 3). It
is important to recognise that at this
point, all process parameters are
only potentially critical; confirmation
of criticality is only conducted later
in the methodology.
Although identified as being a
pCPP, certain parameters may need
to be fixed because they impact
other aspects of the process such
as yield and throughput. In this
study, the concentration of the
feed solution was fixed and the
outlet temperature (T_out), the feed
pressure (P_feed) and the spraying
nozzle diameter (D_noz) were varied.
A series of experiments were
run as a screening study. Using
a statistically valid design of
experiments (DOE), eleven runs
were made. These trials considered
a 24-1 half-factorial design with
the centre point run in triplicates
(see Figure 4). Once complete,
the ranges of a DOE become the
knowledge space for your product.
Subsequent studies enlarge the
knowledge space.
Data from this study indicated
that a large portion of the knowledge
space is viable to produce
acceptable product. Subsequently,
an optimisation DOE was run. Study
resolution was enhanced with
the addition of a third level at the
midpoint. With two center point runs,
this second study required 16 runs.
RAM (Risk-assessment matrix)
CQA 1 = Particle size CQA 2 = Bulk density
5
4.5
4
3.5
3
2.5
2
1.5
1
0.5
0
T_out T_cond F_feed C_feed P_feed T_feedD_noz
Perc
eption
of criticality
5
4.5
4
3.5
3
2.5
2
1.5
1
0.5
0
Perc
eption
of criticality
Top pCPPs are easily identified
T_out T_cond F_feed C_feed P_feed T_feedD_noz
Screening DOE: 24-1+3
X4(+)
X3
X2
X1
D_noz
X variables (SD step)
0�����*���������%$$d
0�����*��������T_out
0�����*��������D_noz
0�����*��������T_cond
CQA 2 = Bulk densityCQA 1 = Particle size
No
rmalised
in
flu
ence
T_co
nd
T_out
T_out
P_fe
ed
5
4
3
2
1
0
No
rmalised
in
flu
ence
5
4
3
2
1
0
Knowledge space
���! +����%$$#������! +
���1������.-������1�
����1�����"��#������1�
74 < D_noz < 72
Targeted ranges
���2)��������������2)
�����&�""����������������&�""
X4(-)
"� �����������
"����������������s
"��������������
Figure 3: Risk assessment: ranking of potentially critical process
parameters per critical quality attribute (CQA) in each process
step as the output of a risk-assessment matrix (bulk powder
manufacturing process). T_out is drying gas temperature at the
outlet of the spray drying chamber (ºC); T_cond is drying gas
temperature at the exit of the condenser (ºC); P_feed is atomisation
pressure of the feed (pressure nozzle) (bar); D_noz is diameter of
the nozzle orifice (mm); T_feed is temperature of the solution fed to
the spray drier (ºC), F_feed is flow rate of feed solution (kg/h); and
C_feed is concentration of feed solution (% w/w).
Figure 4: Design of experiments (DOE) (screening phase).
Confirming the risk-assessment output by checking statistical
significance of the most ranked parameters (bulk powder
manufacturing process). CQA is critical quality attribute; SD is
spray drying; pCPP is potentially critical process parameter;
P_feed is atomisation pressure of the feed (pressure nozzle);
T_out is drying gas temperature at the outlet of the spray drying
chamber; D_noz is diameter of the nozzle orifice (mm); T_cond is
drying gas temperature at the exit of the condenser.
74 Pharmaceutical Technology Europe SEPTEMBER 2013 PharmTech.com

Meeting Regulatory and Technical
Requirements for Organic Impurity Analysis
EVENT OVERVIEW:
Organic impurities cover a wide spectrum of compounds that
have varying structures, behaviors, and characteristics. Organic
impurities can result from manufacturing, storage conditions, or
degradation resulting from light, heat, and other external factors.
Deciding what technology or analytical methods to use to detect
and measure organic impurities is a challenge. This 60-minute
webcast will provide insight on regulatory, compendial, and ICH
requirements on organic impurity control and analysis. Learn from
leading experts on best practices in analytical method develop-
ment, method selection, and method validation for detecting
and quantifying organic impurities in drug substances and drug
products.
Key Learning Objectives:
■ Learn from experts on the latest regulatory and compendial
requirements for organic impurity control and analysis in drug
substances and drug products
■ Gain insight on selecting the appropriate analytical methods for
detection, analysis, and quantification of organic impurities
■ Learn from case studies on how best to ensure product quality
Presented by Sponsored by
Presenters
Tim Watson, PhD
Research Fellow
GCMC Advisory Office
Pfizer
Mark Argentine, PhD
Senior Research Advisor
Analytical Sciences R&D
Eli Lilly
Hildegard Brümmer, PhD
Operational Laboratory Manager
SGS Life Science Services, Berlin
Moderator
Patricia Van Arnum
Executive Editor
Pharmaceutical Technology
Register free at www.pharmtech.com/organic
Who Should Attend:
■ Directors, group leaders, managers, and
senior staff of QA/QC
■ Directors, group leaders, managers, and
senior staff of regulatory affairs
■ Analytical chemists
■ Formulation scientists
■ Process development scientists
■ CMC (chemistry, manufacturing and
control) managers and directors
For questions contact Sara Barschdorf at [email protected]
LIVE WEBCAST: US: Tuesday, Sept. 24 at 11:00 am EDT | EU: Tuesday, Oct. 1 at 15:00 CET

Quality by Design
Data from this study led to a refinement
of the model and the generation
of quadratic terms to describe the
particle-size relationship (see Figure 5).
At this stage, models exist for each
CQA. As both CQAs must be met
simultaneously, the design space
will narrow, adding complexity to
the problem. One further level of
complexity comes from the uncertainty
in the model. Working at the edge of
a modeled range brings risk to the
process. Working, for example, at the
95% confidence interval of the model
reduces the risk of generating material
with CQAs outside the specification
limits while maintaining a broad
operating space (see Figure 6).
The NOR is defined as the preferable
operating range within the identified
design space. Working within this
sub-region of the design space, the
NOR may have benefits of reduced
operating costs and increased
productivity or preferential product
characteristics. The NOR is dependent
on the controllability of the process,
which may be equipment or plant
dependent. For example, the
temperature control of the equipment
may be limited to +/- 1.0 °C, thus
a NOR tighter than +/- 0.5 °C is not
achievable.
A criticality analysis will determine
which process parameters need to be
most closely monitored. Each process
parameter will have a different effect
on a CQA. Normalising these impacts
will highlight which parameter exerts
the greatest influence on a CQA. Larger
normalised values imply increased
sensitivity and potentially undesirable
effects on CQAs. Ideally, the NOR
should be away from the edge of the
design space and correspondingly, the
design space should be away from the
edge of failure. Proximity of the design
space towards the edge of failure could
mean that deviations from the design
space result in out-of-specification
material. In this specific example, the
achievable NOR in equipment “A” was
small relative to the design space
and control was readily achieved (see
Figure 7).
Drug product case studyThe identical methodology to that used
for the bulk powder can be applied to
the development of a drug product.
CQA definition. A finished
dosage form has a number of CQAs,
some under regulatory control and
others that are product specific. In
this example, a direct compression
formulation was considered, where
a spray-dried dispersion (SDD) was
a significant component of the
final formulation. The CQA of tablet
hardness will be examined in
greater detail.
Risk assessment. The
components of the formulation are
the SDD, excipients as compression
aids, the disintegrant and the
lubricant. The level of excipient was
fixed to limit the resulting tablet
size. The risk assessment for tablet
hardness determined that the SDD
properties, lubricant level and
mixing time, tablet press speed and
compression force were pCPPs.
Optimization DOE: CCD
�����������������
�������������������������� ���
��������� ��������
�������� ������
X3
X2
X1
X variables
�������������������d
�������������������
���������������� ��d
Screening model Optimisation model
CQA 1 CQA 1
model refinement
(T_out)2, (P_feed)2
T_o
ut
(ºC
)
P_feed (bar) P_feed (bar)
55
50
45
40
35
T_o
ut
(ºC
)
55
50
45
40
3540 50 60
6060
5555
65
65
70
70
5052.552.5
57.5
57.5
67.567.5
62.5
62.5
72.572.5
70 80 40 50 60 70 80
P_fe
ed
(ba
r)P
roba
bilit
y
Pro
ba
bilit
y
T_cond
(ºC
)
P_feed (bar)
T_out (ºC)
CQA 1 = Particle size (μm) CQA 2 = Bulk density (g/cc)
T_out (ºC)
T_co
nd
(ºC)
35 to 65 μm
(95% confidence)
0.25 to 0.45 g/cc
(95% confidence)
80
70
60
50
40
-2
-4
-6
-8
-1035 40
35
40
45
45
50
ObservedFitted
ObservedFitted
-3 -2 -0.02 -0.01 0.01 0.02 0.03-1 0 1 2 3 4
50 5060
70
80
-2
-4
-6
-8
-10
55T_out (ºC)
Model prediction error
35 40 45 50 55
0.20
0.15
0.10
0.05
0.12
0.08
0.04
Figure 5: Design of experiments (DOE) (optimisation phase).
Increasing the prediction accuracy of screening models (for
design space establishment) via refinement of the mathematical
relationships (bulk powder manufacturing process). CCD is central
composite design; CQA is critical quality attribute; T_out is drying
gas temperature at the outlet of the spray drying chamber; P_feed
is atomisation pressure of the feed (pressure nozzle).
Figure 6: Uncertainty analysis. Considering model prediction
errors to regress the boundaries of the design space and, in this
way, define confidence levels for the resulting operating spaces.
CQA is critical quality attribute; P_feed is atomisation pressure of
the feed (pressure nozzle); T_cond is drying gas temperature at
the exit of the condenser; T_out is drying gas temperature at the
outlet of the spray drying chamber.
76 Pharmaceutical Technology Europe SEPTEMBER 2013 PharmTech.com

Quality by Design
Process development. Figure 8
shows the relationships between
particle size (Dv50), bulk density
(BD) and moisture content (KF) that
were determined from a separate
series of DOE studies. Additionally,
it also shows the range of material
properties that could be prepared. For
the compression analysis, materials
indicated by the red points were
selected to give a broad range of
physical properties. Blends were
prepared and, after some preliminary
ranging studies, were run at two press
speeds and two compaction forces.
The resulting correlation with tablet
hardness for the process parameters
examined show a weak relationship
to KF and BD, and more sensitivity to
compaction force and press speed
despite studying a relatively low
range of press speeds (see Figure
9). From this study, target hardness
specifications were generated and
will be re-evaluated as the scale-up
work progresses.
Conclusion In summary, QbD is a synonym for
process understanding. The greater
the understanding of the process,
the less likely the generation of
out-of-specification material.
In the development process, a
qualitative risk assessment helps
contain the development scope
and use a manageable number of
experiments to define the design
space. The use of statistical design
approaches is essential to address an
appropriate number of parameters
and interactions. Once a model is
generated, uncertainty analysis should
be factored in to the definition of
the design space to ensure that the
operation is not taking place close
to the edge of failure, or when it is,
that a proper control strategy is set
accordingly.
Reference1. ICH, Q8 (R2) Pharmaceutical Development
(2009). PTE
P_fe
ed
(ba
r)
Equipment A Equipment B
CQA 1
80
70
60
50
40
P_fe
ed
(ba
r)
CQA 1
80
70
60
50
4035 40 45 50 55
T_out (ºC)35 40 45 50 55
T_out (ºC)
L-Design space
Feasible space
NOR
Non-feasible space
Press speed
(rpm)
BD (g/mL)
BD (g/mL)
KF (%w/w)
KF (%w/w)
Dv5
0 (
mic
rons)
Dv5
0 (
mic
rons)
Co
mp
ress
ion f
orc
e(K
N)
(-) (+)
+(-)
(+)
250
200
150
100
Compression
(KN)Press
speed (rpm)
Har
dnes
s(N
)15
6.64
49±
6.69
8537
KF
(% w/w)
BD
(g/mL)
Figure 7: Criticality analysis. Proximity of the normal operating
range (NOR) towards the boundaries of the linear-design space.
Desirable (Equipment A) and undesirable (Equipment B) scenarios
(bulk powder manufacturing process). CQA is critical quality
attribute; P_feed is atomisation pressure of the feed (pressure
nozzle); T_out is drying gas temperature at the outlet of the spray
drying chamber.
Figure 8: Design of experiments (screening phase). Linking critical
quality attributes of the intermediate bulk powder process with
potentially critical process parameters of the final dosage form
process (tabletting). Dv50 is volumetric mean particle size of the
product; KF is the residual moisture of the bulk powder by Karl-
Fischer; BD is the bulk density of the product.
Figure 9: Design of experiments (screening phase). Modeling
relationships between critical quality attributes (tablet hardness)
and different potentially critical process parameters (final dosage
form process). KF is the residual moisture of the bulk powder by
Karl-Fischer (% w/w); BD is the bulk density of the product (g/mL).
To view the on-demand Pharmaceutical Technology webcast, “Optimising Quality by Design in Bulk Powders and
Solid Dosage Forms,” go to www.PharmTech.com/bulk. The webcast provides insight on how to apply QbD by
learning how to define critical quality attributes, implement risk assessment, optimise process development,
develop a design space, perform criticality analysis and execute a control strategy with reference to two case-
studies involving bulk powders and solid dosage forms.
Pharmaceutical Technology Europe SEPTEMBER 2013 77

Sh
un
yu
Fa
n/G
ett
y Im
ag
es
Process chemists in the fine-chemicals and pharmaceutical
industries are tasked with developing optimal routes for
manufacturing pharmaceutical intermediates and APIs. Among
their challenges, they must develop approaches to improve
yield, purity, stereoselectivity and solid-state properties
for a given API while optimising production economics as
a product moves from development to commercial scale.
Some interesting recent developments include commercial-
scale amide formation and an improved process route for a
tetracycline derivative.
Commercial-scale amide formationIt is well known that amide-formation chemistry can be
inefficient and warrants further investigation. This issue
has been addressed in the chemical literature, most
recently in a study by the American Chemical Society Green
Chemistry Institute Roundtable that is particularly relevant to
pharmaceutical synthesis (1). The study found that, out of a
random selection of drug candidates, amide-bond formation
was used in the synthesis of 84% percent of drug candidates.
The only theoretical by-product of amide formation is water,
but examples of this type of reaction are incredibly rare,
according to Barrie Rhodes, director of technology development
for the CMO Aesica. “Frequently,” he says, “commercial-scale
amide syntheses for pharmaceutical manufacture require
overly complex stoichiometric coupling agents or reagents.”
Aesica has set as goals the reduction of this complexity
in conventional amide syntheses and the development of
more sustainable (green) chemical transformations that are
practical on a commercial scale. In the pursuit of those goals,
the company has partnered with the University of Nottingham
for the commercial development of alternative methods in
amide-bond synthesis. The partnership’s aim is to revolutionise
traditional amide-formation techniques by generating
alternative methods for amide-bond formation that will be
Advancing API SynthesisCommercial-scale amide formation and an improved process
route for a tetracycline derivative are some recent developments.
Cynthia A. Challener,
PhD, is a contributing
editor to Pharmaceutical
Technology Europe.
more eco-friendly and chemically versatile,
according to Rhodes.
The new approach should be
commercially available to Aesica customers
later in 2013. The company is actively
seeking commercial opportunities to work
with potential compounds that could
benefit from the novel technology. “We
envisage this new development helping
pharmaceutical companies that encounter
problems with amide synthesis, and due to
the utilisation of more sustainable reagents,
production costs will be lowered while
chemical yields will be increased,” Rhodes
notes.
The initial chemistry was developed in
2005 by Simon Woodward, professor of
synthetic organic chemistry at the University
of Nottingham in the United Kingdom. The
coupling reagent of interest is DABAL-Me3,
which is an adduct of trimethylaluminum
and DABCO (1,4-diazabicyclo[2.2.2]octane).
Unlike trimethylaluminum which is very
pyrophoric, DABAL-Me3 is a free-flowing
solid that can be handled in air (2). In
addition to its use in amide-bond formation
(3), DABAL-Me3 has been used for the
methylation of aldehydes and imines (4, 5),
the methylation of aryl
and vinyl halides (6), and conjugate additions
to enones (7).
With respect to amide bond-formation,
DABAL-Me3 can be used to generate amides
from unactivated esters and amines that,
with conventional routes, require the use of
trimethylaluminum or diisobutylaluminum
hydride (3). In addition, reactions with
DABAL-Me3 tolerate various functional
groups, including acetals, alcohols, alkenes,
alkynes, ethers, nitriles, hindered esters and
BOC groups. Stereocenters in non-peptidic
species are not racemised. Importantly,
the preparation of aromatic and aliphatic
amides can generally be carried out in an air
atmosphere. It should be noted that the rate
of the reaction can be accelerated with the
use of microwave irradiation, and products
can be isolated in 51–99% yield in 8–16
minutes (8).
Preliminary studies on DABAL-Me3 at
the university were undertaken using funds
awarded by the Engineering and Physical
Sciences Research Council (EPSRC) under
the Research Development (Pathways to
Impact) Funding Scheme. “Since realising
the initial development of our coupling
agent in 2005, one of our goals has been
to see this novel technology used in
larger-scale industrial environments,”
remarks Woodward. “We look forward to
78 Pharmaceutical Technology Europe SEPTEMBER 2013 PharmTech.com

API Synthesis
collaborating with Aesica and seeing
the full commercial potential of this
novel technology in API manufacture,”
he adds.
The chemistry that Aesica is
commercialising is more atom-
efficient than some other types of
amide-formation chemistry and
offers a novel synthetic route to
make amides from both esters
and carboxylic acids, according to
Rhodes. Some of the technology is in
the very early stages of development
and will likely be patentable, so
Rhodes is unable to disclose any
additional details. He does note that
the chemistry is generally applicable
and flexible in terms of its ability
to prepare amides, and therefore,
any API that either contains amide
bonds or goes through an amide
intermediate during its synthesis
could benefit from this technology.
In addition, Rhodes believes that the
new amide production technology will
enable cheaper and simpler routes to
market for many compounds.
This partnership with the University
of Nottingham is the Aesica
Innovation Board’s (AIB) fourth with
an academic institution in less than
six months, according to Rhodes. The
AIB was established to help bridge the
growing R&D gap by identifying early-
stage technologies for development
into commercial applications.
“The University of Nottingham
is renowned for its excellence in
chemistry research and has a strong
background in green and sustainable
chemistry. That, coupled with its
interest in open innovation (in that
risk and reward are shared) as a
model, has been very beneficial.
Effectively, the university has the
expertise in terms of the technology
while Aesica brings its expertise in
terms of commercialisation and a
global network in the pharmaceutical
industry,” Rhodes explains.
The partnership for the
development of amide bond-
formation chemistry is just the
start of a hopefully long-term
collaboration between Aesica and the
university, according to Rhodes. The
collaboration builds upon announced
plans by the University of Nottingham
to establish a Center of Excellence for
Sustainable Chemistry, which will be
partly funded by an investment from
the Higher Education Funding Council
for England UK Research Partnership
Investment Fund. The Center aims
to form creative partnerships with
innovative companies to develop
new chemical-based technologies
that minimise environmental impact
and are both energy and resource
efficient, according to a university
press release.
“As Aesica further enhances its
innovation program, we will seek to
develop new technologies, not only
with the University of Nottingham,
but with other academic institutions
as well, in the fields of both API and
formulated products manufacture,”
concludes Rhodes.
Process-scale synthesis of tetracycline derivativeTetracyclines comprise a group
of antibiotics that are recognised
as safe and effective and are thus
commonly used to treat serious
bacterial infections and other less
severe conditions such as acne.
Unfortunately, because tetracyclines
are commonly used, many bacteria
have developed resistance to the
older versions of these drugs. Recent
efforts have thus been directed
at developing new tetracycline
derivatives.
Scientists at Tetraphase
Pharmaceuticals are overcoming
this barrier by implementing
a new synthetic route first
reported by Myers in 2005 (9). This
approach involves the coupling
of a cyclohexenone intermediate
that contains the key tetracycline
functionalities with a second
functionalised aromatic intermediate
via a Michael-Dieckmann reaction,
thus enabling the incorporation of a
variety of different substituents at
various positions in the tetracycline
skeleton. Using this methodology,
Magnus Ronn, vice-president of
CMC at Tetraphase Pharmaceuticals
and his colleagues at the company
recently reported the successful
preparation of eravacycline, a
fully synthetic broad spectrum
7-fluorotetracycline in clinical
development, in multihundred gram
quantities (10). A summary of their
work is presented below.
The advantage of this approach
to the synthesis of tetracycline
analogues is that a single key
intermediate can be used to
access a wide range of substituted
tetracycline active pharmaceutical
ingredients (APIs),” says Ronn. This
key intermediate
is a tricyclic cyclohexenone with
three chiral centers (the synthesis
of this compound was reported
previously [11]). The enone is reacted
with a suitably functionalised phenol
bearing an ortho-carboxyphenyl
group and a meta-methyl substituent.
Other functionalities are included
as needed to produce the desired
tetracycline analogue.
This aromatic compound,
referred to by the researchers
as the lefthand piece (LHP), is
deprotonated with a strong base
to form a benzylic anion, which
then undergoes diastereoselective
1,4-conjugate (Michael) addition to
the enone moiety when added to the
cyclohexenone. The ketone enolate
that forms from this step undergoes
a Dieckmann-type condensation
with the phenyl ester to produce the
protected tetracycline compound.
To obtain the desired tetracycline
analogue, this intermediate is
subjected to subsequent silyl-ether
cleavage and hydrogenolysis of
the benzyl-protecting groups with
concomitant reductive ring opening
of the isoxazole (10). The LHP selected
for the preparation of eravacycline
is a benzyl-protected phenol with a
fluorine atom and a dibenzylamine
substituent. It was prepared from
a commercially available starting
material in seven steps, the synthesis
of which will be published in the
future (10).
One of the hurdles that the researchers had to overcome in developing the large-scale synthesis of eravacycline was the sensitivity of the Michael−Dieckmann transformation to the reaction conditions.
Pharmaceutical Technology Europe SEPTEMBER 2013 79

API Synthesis
One of the hurdles that the
researchers had to overcome in
developing the large-scale synthesis
of eravacycline was the sensitivity
of the Michael−Dieckmann
transformation to the reaction
conditions, according to Ronn.
Not only the order of addition, but
also the strength of the base was
important for the two different
deprotonation steps (10). Thus, the
researchers reported that it was
necessary to first deprotonate the
LHP (1.04 equivalents of LHP is used)
with lithium diisopropylamide (LDA,
1.13 equivalents) and then add the
generated anion to a solution of
the cyclohexenone and the weaker
base lithium bistrimethylsilylamide
(LiHMDS) at -70 °C. The desired
adduct was isolated after workup
and trituration with methanol in
> 90% yield a 98% purity (using high-
performance liquid chromatography),
even on the 200-g scale (10).
Because both the deprotonation
and the Michael−Dieckmann reaction
should be performed at -70 °C, two
cryogenic reactors are required. The
researchers reported that attempts
to eliminate one of those reactions
by raising the temperature of the
cyclohexenone solution to -20 °C led to
increased production of impurities (10).
To obtain eravacycline, the first
step after the Michael-Dieckmann
reaction involved cleavage of the
tert-butyl silyl (TBS) protecting group.
Despite the issues associated with
using hydrofluoric acid in commercial
manufacturing, the researchers
reported that this reagent gave
better results than other investigated
alternatives and it was thus selected
for scale-up (10).
Reductive ring opening of the
isoxazoline group and removal of the
four benzyl groups using palladium
on carbon(Pd/C)/hydrogen to give
the 9-amino-7-fluoro-sancycline
required extensive investigation by
the researchers (10). A mixed solvent
system of tetrahydrofuran (THF) in
methanol (1:3) was required because
of solubility issues. An acid additive
was also needed to improve the rate
of the hydrogenation reaction, but
epimerisation at the C-4 position
and reduction of undesired groups
led to the formation of impurities,
including one that was very difficult
to separate from the desired product.
The reaction was optimised using
concentrated aqueous hydrochloric
acid (HCl) because it is a stable
reagent with a reliable concentration.
The palladium on carbon was
removed using Celite, and residual
palladium was eliminated with the
metal scavenger (SiliaBond DMT,
Silicycle). The desired hydrochloride
salt was precipitated from water/
ethanol in approximately 80% yield
and high purity (< 2% of the undesired
impurities), even on a large scale (10).
Next, the hydrochloride salt of
the fully deprotected penultimate
intermediate was coupled with
the desired side chain to prepare
eravacycline. The reaction was
carried out in acetonitrile and water.
To achieve complete conversion,
several charges of the acid chloride
were necessary. It was also found
that adjustment of the pH from
approximately 3 to approximately 7
after the second charge aided the
complete dissolution of the starting
material, allowing the reaction to go
to completion. After the completion
of the coupling, the pH of the reaction
solution was brought to pH 6.8
to ensure hydrolysis of any over-
acylated compounds to the desired
tetracycline product.
Eravacycline was extracted using
dichloromethane at pH 7.4. As an
added benefit, the researchers found
that the undesired C-4 epimer was
partly removed in the aqueous layer
and when the dichloromethane
solution was dried with sodium
sulfate prior to evaporation,
thus increasing the purity of the
tetracycline product (10). Finally, the
bis-hydrochloride salt of eravacycline
was prepared using
an ethanol−methanol mixture
containing an excess of hydrogen
chloride and precipitated with
addition of ethyl acetate.
“While some of the steps
presented challenges, this overall
route to eravacycline has enabled the
production of sufficient quantities
of the API for clinical testing. This
tetracycline derivative has completed
Phase II clinical studies and has been
shown to be active against multidrug
resistant bacteria and is therefore
a candidate as a broad spectrum
antibiotic for serious hospital infections.
We are continuing to improve the
process for future larger-scale
manufacturing and are also developing
an isolation procedure that will be
suitable for commercial production of
eravacycline,” Ronn notes.
References1. D. J. C Constable et al., Green Chem. 9
(5) 411-420 (2007).
2. S. Woodward, Synlett. 10, 1490-1500
(2007).
3. A. Novak et al., Tetrahedron Lett. 47
(32) 5767-5769 (2006).
4. B. Kallolmay et al., Angew. Chem. Int.
Ed. 44 (15) 2232-2234 (2005).
5. Y. Mata, J. Org. Chem. 71 ( 21) 8159-
8165 (2006).
6. T. Cooper et al., Adv. Synth. Catal. 348
(6) 686-690 (2006).
7. A. Alexakis et al., Chem. Commun. 22
2843-2845 (2005).
8. D. Glynn et al., Tetrahedron Lett. 49
(39) 5687-5688 (2008).
9. M.G. Charest et al., Science 308 (5720)
395-398 (2005).
10. M. Ronn et al., Org. Process Res. Dev.
17 (5) 838-845 (2013).
11. J. D. Brubaker and A. G. Myers, Org.
Lett. 9 (18) 3523-3525 (2007). PTE
We are continuing to improve the process for future larger-scale manufacturing and are also developing an isolation procedure that will be suitable for commercial production of eravacycline.
Join the discussion
What approach to API synthesis does your company use?
Post your comments on www.pharmtech.com/linkedin or click the
QR code with your smartphone to go directly to the conversation.
80 Pharmaceutical Technology Europe SEPTEMBER 2013 PharmTech.com

Please fill in ovals as shown: ●
1. What is your company’s primary business?
(Fill in ONE only)
100 ◯ Pharmaceutical Manufacturing
110 ◯ Biopharmaceutical Manufacturing
150 ◯ Ingredients (e.g. Raw Materials, APIs, excipients,
chemicals, water)
141 ◯ Contract Services
160 ◯ Drug Delivery/Medical Product and Device
Manufacturing (e.g. inhalers)
105 ◯ Engineering/Facilities/Construction
080 ◯ University/Academia/Education
090 ◯ Government (including regulatory agencies and
bodies)
200 ◯ Other (please specify) _____________________
___________
2. What is your function? (Fill in ONE only)
010 ◯ Research/Development/Formulation
020 ◯ QA/QC/Validation/Regulatory Affairs
033 ◯ Supply Chain
044 ◯ Manufacturing/Processing
045 ◯ Information Technology
060 ◯ Engineering
080 ◯ Corporate Management
090 ◯ Project/Purchasing/Procurement/Contract
Management
095 ◯ Education Professional
200 ◯ Other (please specify) ______________________
3. Would you also be interested in Pharmaceutical
Technology Europe’s weekly e-newsletter?
(Your Email address is required above.) Y ◯ Yes
4. Does your job title or function include Vice
President, Director, Manager, Supervisor, Group
Leader or Department Head?
Y ◯ Yes N ◯ No
5. Does your job title or function include the approval
process for Contract Services? Y ◯ Yes N ◯ No
JULY 2012 Volume 24 Number 7 PharmTech.com
REGULATORY UPDATE
EMA and MHRA on the latest
inspection deficiencies
TROUBLESHOOTING
Lyophilisation challenges
INDUSTRY POSITION PAPER
Early development GMPs for
small-molecule drugs
Extended-
Release
Injectables
Meeting manufacturing
challenges
Advancing Development & Manufacturing
DECEMBER 2012 Volume 24 Number 12
ANTICOUNTERFEITING Protecting the supply
chain from fake medicines
PEER-REVIEWED Formulation of
modified-release tablets
INDUSTRY INSIDER Pharma cringes at
Germany’s pricing pressure
Advancing Development & Manufacturing
PharmTech.com
Job Security Annual employment survey shows
greater confidence in pharma industry
CODE: HSEAD2
*Free to qualifying readers in Europe
Signature Date
Mr/Mrs/Ms First name Family name
Job Title
Company
Address
Postcode City Country
To ensure delivery, please avoid using shared email address
Tel.
Fax
Sign here if you wish to receive (continue to receive) Pharmaceutical Technology Europe FREE
Print your name and address
Please quote your referencenumber if you have it:
PTEDWPP
Answer all questions by filling in the circles ●
Apply today for your subscriptionz Go to www.pharmtech.com — click on ‘Subscribe’ and scroll down to
Pharm Tech Europe, or
z Mail form to Pharmaceutical Technology Europe, Advanstar, 4A Bridgegate Pavilion, Chester Business Park, Wrexham Road, Chester CH4 9QH, United Kingdom, or
z Photocopy this form — complete all sections — fax it back
Fax back on (00)1-218-740-6417 or (00)1-218-740-6437FREE
Please let us have your email address – so we can keep our renewal costs down
Advanstar Communications provides certain customer contact data (such as
customers’ names, addresses, phone numbers and e-mail addresses) to third parties
who wish to promote relevant products, services and other opportunities which may
be of interest to you. If you do not want Advanstar Communications to make your
contact information available to third parties for marketing purposes, please contact us
by emailing [email protected] or by mail at Advanstar, 4A Bridgegate Pavilion,
Chester Business Park, Wrexham Road, Chester CH4 9QH, United Kingdom.

STATISTICAL SOLUTIONS
Christopher Burgess,
PhD, is an analytical
scientist at Burgess Analytical
Consultancy Limited,
‘Rose Rae,’ The Lendings,
Startforth, Barnard Castle,
Co Durham, DL12 9AB, UK;
+44 (0) 1833 637 446; chris@
burgessconsultancy.com;
www.burgessconsultancy.
com.
The Basics of Measurement Uncertainty in Pharma AnalysisHow good is a reportable value?
All measurements are subject to error. When a
reportable value is derived from a measurement
or series of measurements, this value is only an
estimate of the “true” value and has a range around
it associated with how confident one is that the
true value lies within it. Traditionally in the
pharmaceutical industry, a range is selected
corresponding to 95% confidence (1).
Reportable value data qualityThe quality of a reportable value or an analytical result
depends upon the size of the confidence interval.
The smaller the confidence interval is, the more
confident one is in relying on one’s reportable value
or analytical result. Unfortunately, also for historical
reasons relating primarily to physical metrological
considerations, the International Organisation on
Standardisation (ISO) uses the term “measurement
uncertainty” (MU) for the same concept (2).
One difference between the ISO MU approach
and the International Conference on Harmonisation
(ICH) Q2(R1) and United States Pharmacopeia
(USP) approaches is that in the latter, the effects
of imprecision and bias are considered separately
(3). It should be noted, however, that the USP
General Chapter <1225>, “Validation of Compendial
Procedures,” and related General Chapters <1224>,
“Transfer of Analytical Procedures,” and <1226>,
“Verification of Compendial Procedures,” are under
revision at present (4–6).
USP General Chapter <1010>, Analytical Data—
Interpretation and Treatment, clearly states that
accuracy has a different meaning from ISO (7). The USP
states, “In ISO, accuracy combines the concepts of
unbiasedness (termed trueness) and precision,” and
USP further defines a conventional 95% confidence
interval around the mean of
X ± t(0.05, n-1)
S√n .
The term S
√n is the standard error of the mean and
is called the standard uncertainty in ISO.
t(0.05, n-1)
is called the coverage factor.
t(0.05, n-1)
S√n
is called the expanded uncertainty in ISO.
Another difference is the way in which the standard
deviation (s) is calculated. The ISO approach is by
means of a calculated error budget (8), whereas
the ICH Q2(R1) relies upon information derived
from an experimentally designed analytical trial (3).
Theoretically, these two approaches should yield
similar results. In practice, however, this is not always
the case. ISO also uses a different nomenclature
from ICH. What would usually be called the analytical
measurement or result is called in ISO the measurand.
This measurand is the particular quantity subject
to measurement and is related to the measured
analytical response function by means of an equation
in the same way as an analytical result.
Concept of an error budget The idea behind an error budget is that if all sources
of error are known, it is possible to calculate an
estimate of the uncertainty of the measurand or
reportable value based upon converting all the errors
to standard deviations and then combining the
variances. If all the error processes are independent,
then an error budget can be defined in five steps:
t� Define all the process elements involved and their
interrelationships
t� Define the measurand in terms of these process
elements
t� Identify all error sources and group them as
required
t� Estimate their individual contributions and convert
them to standard deviations and combine them to
produce an overall estimate of standard deviation
t� Estimate the overall uncertainty using an
appropriate coverage factor as described previously.
Figure 1 shows the error budget process
diagrammatically.
An example of a simple error budget for a
standard solution. The error budget approach
may seem rather daunting, but a simple example
of the preparation of a standard solution will make
things clearer. This example is a common task in the
laboratory, but few calculate how good their standard
solutions are.
The reference standard purchased has a certified
purity of 99.46 ± 0.25. Approximately 100 mg of
this reference standard is weighed, by difference,
accurately using a five-place analytical balance. The
82 Pharmaceutical Technology Europe SEPTEMBER 2013 PharmTech.com

Statistical Solutions
reference standard is dissolved in
water and a solution is made up to
the mark with water in a Grade A
100.0 mL capacity volumetric flask
at ambient laboratory temperature.
It is assumed that the laboratory
temperature is controlled but may
vary between 16 °C and 24 °C. The
first step is to draw a flow diagram
of the analytical process used to
prepare the standard solution. This
diagram is shown in Figure 2.
Identify the measurand. In
this instance, the measurand (C) is
the concentration of the reference
material in the standard solution in
mg l-1 and is defined by the equation:
C = 1000 mg1-1mP
V
where m is the mass of reference
material in mg. P is the purity as a mass
fraction of the standard, and V is the
volume of the volumetric flask in mL.
Identify the error sources. Based
upon the analytical process flow
(see Figure 2), one can now identify
three main areas of error, namely, the
reference stand itself, the weighing
process and the solution and the
final volume of the solution. It is
helpful to use a Ishikawa diagram to
aid the identification and grouping of
error sources. For this example, the
Ishikawa diagram is shown in
Figure 3. In Figure 3, the possible
sources of error are shown for each
of the three groups. In this example,
it is assumed that the reference
standard is sufficiently homogeneous
to ignore any error contribution and is
freely and easily soluble in water.
Note that the volume of the
solution has three distinct uncertainty
components that need to be taken
into account:
t� The uncertainty in the marked
calibration volume of the
volumetric flask itself at 20 °C
t� The difference between the
calibration temperature of the
flask and the temperature at which
the solution was prepared
t� The uncertainty associated with
filling the flask to the calibration
mark.
Not all error contributions are of
equal importance. To find out which
error contributions are of importance,
however, it is essential to convert all
errors to standard deviations (8).
Processes to convert
specifications, ranges and
measurement data into a standard
deviation. The easiest method to
evaluate the standard deviation is
by the statistical analysis of series
of observations and assume the
normal distribution. In the example,
this method would be used in
determining the uncertainty of filling
the volumetric flask to the mark. This
direct determination is known as a
Type A uncertainty.
Type B uncertainties are derived
from two approaches:
t� Converting certificate ranges
where there is no knowledge of
the shape of the distribution so
the rectangular distribution is
assumed. For a range of ± a, the
corresponding estimate for the
standard deviation would be √3a . In
All
fig
ure
s a
re c
ou
rte
sy o
f th
e a
uth
or.
Step 1Description of the
measurement process
Flow chart with detailed
description of all steps of the
procedure
Define relationship between the
measurand and the variables of
the procedure
Draw a cause & effect diagram to
identify uncertainties of each
variable
Combine the uncertainties of each
variable to give a total uncertainty
Step 2Specification of the
measurand
Step 4 & 5Quantification and
combination of uncertainties
Step 3Identification of uncertainty
sources
Transfer approximately
100 mg of the reference
standard to a glass
weighing boat
Weigh on a five-
place analytical
balance
Transfer material to a
grade A 100.0 mL
volumetric flask
Reweigh on the
same five-place
analytical balance
Dissolve in water
Make up to volume
with water
Calculate reference
standard solution
concentration
WEIGH BYDIFFERENCE
Figure 1: Error budget process.
Figure 2: Analytical process flow for preparing the standard
solution in the example.
Pharmaceutical Technology Europe SEPTEMBER 2013 83

Statistical Solutions
the example, the uncertainty in the
purity of ± 0.25 would be converted
using the rectangular distribution.
t� If it is more likely that the value
lies closer to the central value,
then the triangular distribution is
assumed. For a range of ± a, the
corresponding estimate for the
standard deviation would be √6a
In the example, the uncertainty in
the grade A volumetric flask of ±
0.10 would be converted using the
triangular distribution.
Uncertainty contributions in the
example. Now we can proceed to
quantify all the uncertainties in our
analytical process in the following
manner:
Reference standard uncertainty,
uP. Using the rectangular distribution
we have:
uP = = 0.001443
0.0025
√3
Note that the purity and its
uncertainty have been converted to
mass fractions.
Weighing uncertainty, um. Using
the balance manufacturer’s data
(Type A) we have:
um = 0.05 mg
Note that our actual value of
weighed material was 100.28mg.
Volumetric uncertainty (uV). Here we
have three different contributions to uV:
The flask itself using the triangular
distribution:
uvc = = 0.04 mL
0.10
√6
The temperature effect assuming
the coefficient of expansion of water
of 0.00021 °C-1 and assuming the
rectangular distribution:
uvT
= = 0.05 mL
Volume variation =±(100(4)(0.00021))
=±0.084 mL
0.084
√3
Reference standard
Purity
Homogeneity
Accuracy
Precision
Temperature differences betweenthe calibration temperatureand the solution temperature
Uncertainty inthe certified volume
of the flask Variation in fillingto the mark
Volume of solution
Concentrationuncertainty
Weighing
Figure 3: Ishikawa diagram for our analytical process.
NOVEMBER 4–6, 2013VIENNA, AUSTRIA
MESSE WIEN EXHIBITON & CONGRESS CENTER
BIO-Europe® is Europe’s largest partnering conference, serving the global
biotechnology industry. The conference annually attracts international leaders from
ELRWHFK��SKDUPD�DQG��¿�QDQFH�DORQJ�ZLWK�WKH�PRVW�SURPLVLQJ�VWDUW�XSV�DQG�HPHUJLQJ�
companies. It is the “must attend” event for getting business done in the biotech
industry.
)HDWXULQJ� (%'� *URXS¶V� VRSKLVWLFDWHG�� ZHE�EDVHG� SDUWQHULQJ� V\VWHP��
partneringONE®�� WKH�HYHQW�HQDEOHV�GHOHJDWHV� WR�HI¿�FLHQWO\� LGHQWLI\��PHHW�DQG�JHW�
SDUWQHUVKLSV�VWDUWHG�ZLWK�FRPSDQLHV�DFURVV�WKH�OLIH�VFLHQFH�YDOXH�FKDLQ��,Q��DGGLWLRQ�
WR�SURGXFWLYH�SDUWQHULQJ��%,2�(XURSH�RIIHUV�KLJK�OHYHO�ZRUNVKRSV���SDQHOV���FRPSDQ\�
presentations and a lively exhibition.
Find out more: www.ebdgroup.com/bioeurope
B U I L D I N G VA L U E T H RO U G H PA RT N E R S H I P S
© 2
013
EBD
Gm
bHV
ienn
a im
age
© W
ienT
ouris
mus
/F 3
Host Sponsor
2013BIO-EUROPE
®
19th Annual International
Partnering Conference
Online Partnering starts September 23

Statistical Solutions
and the Type A uncertainty
associated with the filling of the flask
to the calibration mark. This was
determined by the filling repeatability
for n 6 assuming a normal
distribution; uvr=0.02 mL.
One can now combine these three
standard deviations to arrive at the
overall volumetric uncertainty
uv =√u2 + u2 + u2
vp vr vT
=√(0.04)2 + (0.02)2+ (0.05)2
= 0.07 mL
Finalising the error budget.
Now that all uncertainties have been
converted into standard deviations,
they can be combined to produce an
uncertainty for the measurand C
as shown in Table I and using the
variance combination equation:
uc
C
=√(0.001443)2 + (0.0005)2+ (0.0007)2
+√ ( )=
= 0.00168
up
P
2
+( )u
m
m
2
( )u
v
V
2
It is important to note that the
uncertainty contribution from the
reference standard is greater than
either the weighing or the volumetric
errors.
Expression of confidence:
calculating the reportable
value and its uncertainty. The
concentration of the reference
standard solution is directly available
from the measurand equation,
= 1000
= 997.4 mg1-1
mP
VC = 1000
100.28(0.9946)
100.0
The uncertainty in the measurand
uc and the expanded uncertainty U
are now readily available.
uc = 0.00168C
= 0.00168(997.4)
= 1.68mg
U = ± kuc
= ± 2uc
= ± 3.36
The coverage factor of k=2
corresponds to a confidence of
95.45%.
Based upon this expanded
uncertainty, we calculate that we have
confidence that the standard solution
uncertainty is approximately 0.34%.
SummaryThis article covered some of the
basics of error budgets and carried
out a calculation of an expanded
uncertainty for a standard solution.
The expanded uncertainty is small
(0.34%) and is dominated by the
contribution from the reference
standard itself. The more complex
the analytical procedure, however,
the more expanded uncertainties will
build.
In regulated laboratories, such
as the Official Medicines Control
Laboratories in Europe, it is a
prerequisite that analytical tests
are performed under a properly
functioning quality system, which
means that:
t� All balances and volumetric
glassware are under regular control
t� Official reference substances or
in-house reference substances are
properly qualified and stored
t� Instruments are regularly calibrated
t� Equipment is regularly requalified
t� Laboratory technicians are (re-)
qualified.
The uncertainties due to these
sources are under control and are
assumed to contribute little to the
total uncertainty of the test result (9).
References1. L. Torbeck, Pharm. Tech. 34 (7) (2010).
2. See, for example, NIST Reference on
Constants, Units and Uncertainty;
http://physics.nist.gov/cuu/Uncertainty/
index.html, accessed 12 Aug. 2013.
3. ICH, Q2(R1) Harmonised Tripartite
Guideline, Validation of Analytical
Procedures: Text And Methodology
(2005).
4. USP, General Chapter <1224>, “Transfer
of Analytical Procedures,” United States
Pharmacopeia, 36 (US Pharmacopeial
Convention, Rockville, Md, 2013).
5. USP, General Chapter <1225>,
“Validation of Compendial
Proceduures,” United States
Pharmacopeia, 36 (US Pharmacopeial
Convention, Rockville, Md, 2013).
6. USP, General Chapter <1226>,
“Verification of Compendial
Procedures,” United States
Pharmacopeia, 36 (US Pharmacopeial
Convention, Rockville, Md, 2013).
7. USP, General Chapter <1010>,
United States Pharmacopeia, 36 (US
Pharmacopeial Convention, Rockville,
Md, 2013).
8. S.L.R. Ellison and A Williams (Eds),
Eurachem/CITAC guide: Quantifying
Uncertainty in Analytical Measurement,
Third edition, (2012) ISBN 978-0-
948926-30-3, available at www.
eurachem.org/index.php/publications/
guides/quam, accessed 12 Aug. 2013.
9. PA/PH/OMCL (05) 49 DEF CORR— OMCL
Guideline on Uncertainty of Measurement
(for compliance testing) (2007), www.
edqm.eu/en/EDQM-Downloads-527.html,
accessed 12 Aug. 2013. PTE
Table I: Combined uncertainty for the measurand C.
Description x Value x Ux
ux
X
Purity of reference
standard
P 0.9946 UP
0.001443 uP
P
0.001443
Mass of the reference
standard mg
m 100.28 Um
0.05 um
m
0.0005
Volume in the flask ml V 100.0 UV
0.07 uv
V
0.0007
Pharmaceutical Technology Europe SEPTEMBER 2013 85

86 Pharmaceutical Technology Europe SEPTEMBER 2013 PharmTech.com
CORPORATE PROFILES
Contact details
Asahi Kasei Chemicals Corporation
1–105, Kanda Jinbocho, Chiyoda-ku,
Tokyo 101-8101, Japan
Tel. +81 (0)3.3296.3361
Fax: +81 (0)3.3296.3467
www.ceolus.com
Contact details
BENEO GmbH
Gottlieb Daimler Strasse 12;
68165 Mannheim ; Germany
Tel. +49-621-421-150
Fax: +49-621-421-160
http://www.galeniq.com
Asahi Kasei Chemicals Corporation
BENEO GmbH
Hall 6, Booth 6C15
Hall 9, Booth 9C29
Asahi Kasei
Corporation
is a leading
Japanese
chemical
conglomerate.
Asahi Kasei Chemicals is the core operating
company for all chemical-related operations
of the Asahi Kasei Group. Asahi Kasei
Chemicals provides the pharmaceutical
and biopharmaceutical industries with
excipients that offer innovative solutions for
solid dosage formulations.
Major products/services being exhibitedCEOLUSTM Microcrystalline cellulose
CEOLUSTM UF-711 provides high
compactibilty with excellent powder flow.
t� Low addition provides tablet hardness
and improves friability
t� Prevents tablet problems and
contributes to loss reduction
The BENEO product portfolio consists
of functional ingredients with
nutritional and technical advantages,
derived from chicory roots, beet sugar,
rice and wheat.
In 2005 BENEO launched its
multifunctional bulk excipient range
under the brand name galenIQ™. Now,
the pharmaceutical grade of isomalt has
found its way into a huge number and
broad variety of solid dosage forms. The
highly functional filler-binder is available
in various particle modifications and
different solubilities.
Major products/services being exhibited : galenIQ™The unique morphology of agglomerated
galenIQ™ grades eases especially in
powder blends the formulation with
different API particle sizes at the same
t� Reduces addition amount, enabling
smaller tablets
UF-702 has excellent flow without
compromising compactibility, therefore
is highly effective for high-speed
tableting. KG-1000 has an exceptional
compactibility, while KG-802 exhibits
good balance of compactibility and
powder flow. KG-802 is suitable for direct
compression with forcing feeder.
CELPHERETM CELPHERETM is a 100% MCC
seed core that is used in drug layering
and film coating applications, such as
controlled release granules.
SWELSTARTM SWELSTARTM MX-1 is specially
developed for gel matrix tablets and drug
release. PD-1 is a super disintegrant which
has excellent stability with various types
of drugs. WB-1 is designed for a binder
used in wet granulation and has excellent
binding and disintegrating properties.
time. The large specific surface area
enables the incorporation of high
concentrations of active ingredients on
the one hand without compromising the
flow properties of the final mixture. On
the other hand, the surface structure
prevents segregation even in very low
dose blends during the whole process,
thus ensuring the homogeneity of the
mixture and subsequently the required
content uniformity.
Derived from pure beet sugar,
galenIQ™ gives a pleasant sugar-like
taste, a decisive advantage for the
formulation of direct oral applications,
even in combination with active
ingredients of unpleasant taste profiles.
Being non cariogenic, galenIQ™ is the
PC-10 PC-10 is a high-swelling
pregelatinized starch with an extremely
low water-soluble content.
TREHALOSE A non-reducing disaccharide,
Trehalose provides functions such as low
reactivity with drugs.
KICCOLATETM KICCOLATETM is a
Croscarmellose sodium (Non-GMO) which
is known as a super disintegrant.
perfect choice for chewable, sublingual or
lozenge tablets, as well as for stick pack
forms for direct oral application.
All these properties make galenIQ™
an ideal base for the formulation of any
kind of powder blend; i.e. to compressed
tablets or in capsule fillings and sachets.

Pharmaceutical Technology Europe SEPTEMBER 2013 87
CORPORATE PROFILES
Contact details
Bischof + Klein GmbH & Co. KG
Rahestraße 47
49525 Lengerich
Tel. +49 5481 920 349
Fax: +49 5481 920-541
www.bk-international.com
Bischof + Klein GmbH & Co. KG
Hall 4.1, Booth 41J56
Bischof + Klein’s
product range
encompasses the
entire range of flexible
packaging – from
traditional industrial
packaging and consumer
packaging to special
films for technical applications – from
2-gramme portion packaging to flexible
liquid liners for 1,200 litres.
Major products/services being exhibitedWith our class 5 clean room production
facilities in accordance with DIN EN ISO
14644-1 at rest, we offer low-germ and
low-particle production of our packaging
material, guaranteeing “safety via
extremely pure quality”.
This specifically includes:t� Single-wound and tubular films
t� Open-mouth and side gusseted mitred
sealed bags
t� Bottle-shaped bags
t� Multiple-ply bags (Two- or three ply bags)
t� Laminated aluminium bags with three
sealing seams
t� Tyvek® / HDPE bags with three side
seals, autoclavable
t� HeaderBags with a Tyvek® strip
t� Packaging with DMF
Tailored to customers’ wishes, raw
materials which are safe according to the
FDA and LFGB can be used and specified
for the material. All production and quality
processes are oriented towards GMP.
Extrusion, printing and conversion
machines are available in the completely
encapsulated clean room to produce and
develop these packaging materials. Our
specially trained and motivated production
teams are supported by our internal
laboratory and testing facilities. The exclusive
use of safe raw materials according to FDA
and LMBG is equally a matter of course as
GMP-friendly quality assurance at all levels.
On customer request CleanFlex®
packaging could be additionally treated by
a sterilisation process. The particle-low
and sterilised packaging is therefore
ready-to-use for high-purity processes.
Contact details
Bosch Packaging Technology
Stuttgarter Str. 130,
71332 Waiblingen
Tel. +49 (0) 711 811 0
Fax: +49 (0) 711 811 45000
www.boschpackaging.com
Bosch Packaging Technology
Hall 4.1, Booth 41H30
Based in Waiblingen, Germany, and
employing 5,000 associates, the Bosch
Packaging Technology division is one of the
leading suppliers of process and packaging
technology. At over 30 locations in more
than 15 countries worldwide, a highly-
qualified workforce develops and produces
complete solutions for the pharmaceuticals,
food, and confectionery industries.
These solutions are complemented by a
comprehensive after-sales service portfolio.
A global service and sales network provides
customers with local points of contact
The product division Pharma is a leading
provider of process technology and
packaging solutions for the pharmaceutical
industry. The portfolio includes single
units, systems and complete solutions
for process technology of sterile liquids
and powder processing. It also comprises
primary packaging for sterile fill&finish and
solid dosage forms, secondary packaging
as well as inspection technology,
qualification, validation and services.
Major products/services being exhibitedThe two Bosch companies Hüttlin and Bosch
Packaging Technology Ltd, formerly known
as Manesty, offer part of the pharmaceutical
process portfolio. Hüttlin’s modular designed
equipment for granulating, drying and
coating ranges from single machines for
laboratory applications to large production
lines. From laboratory to production scale,
the customized Manesty tablet presses and
coaters offer highest quality and flexibility
to the pharmaceutical industry. Bosch
Packaging Technology offers pharmaceutical
manufacturers a tailor-made consulting
service for all laboratory requirements.
Customers can rent operating laboratories
equipped with the latest systems and
machinery for pharmaceutical solids for
research and on-site testing.
Bosch’s products are on show on booth
#41H30.

88 Pharmaceutical Technology Europe SEPTEMBER 2013 PharmTech.com
CORPORATE PROFILES
Contact details
CordenPharma
Otto-Hahn-Strasse
68723 Plankstadt, Germany
Tel. +49 6202 99-2299
Fax: +49 6202 99-2000
Website: www.cordenpharma.com
CordenPharma
Hall 3.1, Booth 31B32
CordenPharma
is your full-
service CMO partner
in the Contract
Development &
Manufacturing of
oral, sterile, highly
potent, cytotoxic,
non-cytotoxic,
and Beta-lactam
antibiotic pharmaceutical Drug Products,
their Active Pharmaceutical Ingredients
(APIs), and associated Packaging Services.
Through acquisitions of multiple cGMP
facilities across Europe and the US,
CordenPharma is linking together a legacy
of high-calibre scientists and capabilities
to provide you with balanced outsourcing
from R&D to Commercialization. Our
facilities are fully-inspected by all relevant
approval authorities such as the EMA,
FDA, ANVISA and PMDA.
Major products/services being exhibitedAPI Contract Development &
Manufacturing
t� R&D Custom Synthesis & Scale-Up
- Small molecules
- Peptides
- Synthetic Phospholipids
- Conjugates
- Carbohydrates
t� Highly Potent APIs (SafeBridge
Category 4, OEL ≤ 30 ng/m3)
t� Large-scale API Contract
Manufacturing
t� Synthetic Peptide Production from
multi-gram to ton quantities
t� Sterile APIs
t� CordenPharma Proprietary APIs &
Building Blocks
- >50 Generic APIs
- Synthetic Phospholipids
- AADs
- Pseudoproline Dipeptides
Drug Product Contract Development &
Manufacturing
t� Highly Potent Formulations (Solid Forms)
t� Cephalosporins & Penicillins (Oral &
Sterile)
t� Oncology Drug Products (Oral & Sterile)
t� Parenterals
t� Large Pre-Filled Syringes
t� Two-Layer Tablets
t� Packaging & Labeling
t� Pack Serialisation
Contact details
Catalent Pharma Solutions
Frankland Road, Blagrove,
Swindon, SN5 8YG, UK
Tel. +1 877-587-1835
www.catalent.com
Catalent Pharma Solutions
Hall 4.2, Booth 42FO3
Catalyst + Talent. Our name combines
these ideas. From drug and biologic
development services to delivery
technologies to supply solutions, we are
the catalyst for your success. With over
75 years of experience, we have the
deepest expertise, the broadest offerings,
and the most innovative technologies to
help you get more molecules to market
faster, enhance product performance and
provide superior, reliable manufacturing
and packaging results.Catalent develops.
With our broad range of expert services
we drive faster, more efficient development
timelines to help you take more molecules to
market and create more effective products.
Catalent delivers. As the world leader in
drug delivery innovations, we have a proven
record of enhancing bioavailability, solubility
and permeability, improving ease and route
of administration, and increasing patient
compliance for better treatments. Catalent
supplies.Globally positioned to serve all your
manufacturing and commercial packaging
needs, we provide integrated solutions to
take your product from design, to clinical
trial, to plant, and to pharmacy.
Catalent. More products. Better
treatments. Reliably supplied.™
Major products/services being exhibited Catalent’s OptiMeltTM hot melt extrusion
enhances the bioavailability of poorly soluble
APIs by producing an increased-energy
form of the drug through a combination of
the process and the chemical properties
of the excipient. The resulting product, or
extrudate, is then further processed and
converted into a final dose form to achieve
the desired final drug-delivery profile.
In addition to enhanced bioavailability,
the continuous processing applied with
OptiMelt allows for good process control and
scaleability, plus the extrudate is versatile in
its end use, allowing potential incorporation
in controlled-release delivery formulations.
The OptiMelt technology is also solvent-free
and can incorporate taste masking.
Catalent has invested significantly in its
OptiMelt hot melt extrusion capabilities,
both in the US and Europe, to help provide
additional options for bioavailability
solutions, including an innovative open
alliance model with BASF in this area.

Pharmaceutical Technology Europe SEPTEMBER 2013 89
CORPORATE PROFILES
Contact details
Croda Europe Ltd
Cowick Hall, Snaith, Nr Goole, East
Yorkshire, DN14 9AA, United Kingdom
Tel. +44 (0) 1405 860551
Fax: +44 (0) 1405 861767
http://www.croda.com/healthcare
Croda Europe Ltd
Hall 6.1, Booth 61E59
A FTSE 100 company, Croda is a global
leader in speciality chemicals and has
multiple manufacturing sites throughout
the world; supplying ingredients into
a wide range of industries, including
the pharmaceutical industry, where
performance and purity are paramount.
Croda utilises an in-house proprietary
flash chromatographic process to
manufacture superior quality excipients
for the global pharmaceutical industry.
This process is called Super Refining™,
which physically removes impurities
without altering their fundamental
structure.
Major products/services being exhibitedCroda offers a complete range of
products for topical dosage forms as well
as high purity multicompendial solvents,
solubilisers and surfactants suitable
for parenteral, oral, and ophthalmic
formulations. Featured products include
Super Refined™ ingredients: oils, oleic
acid, oleyl alcohol, isopropyl myristate,
PEGs, polysorbates and dimethyl
isosorbide and also medical grade
lanolins, poloxamers, GPI salts and omega
3 fatty acid concentrates.
Contact details
DFE Pharma
Klever Straße 187
Tel. +49 2823 9288 770
Fax: +49 2823 9288 7799
www.dfepharma.com
DFE Pharma
Hall 6.1, Booth 61C51
DFE Pharma is a global leader in
excipients. We develop, produce and
market excipients for oral solid-dose and
dry-powder formulations. Although the
new “DFE Pharma” name is still young,
our company’s roots go back more than
100 years ago, formed from the merger of
DMV International, Lactose New Zealand
and DOMO-pharma. With over 100 years’
experience DFE Pharma is a key global
excipient player in the industry. We are
on ‘the pursuit of excipient excellence’.
Excellence is what guides us on our way
to working together with our customers
and in developing the best possible
excipient solutions for them.
Through our international sales offices
in Germany, the US, Singapore, India and
Japan and our global network of over 100
distributors, our products can be found in
over 100 different countries. Production
locations in Germany, the Netherlands,
New Zealand and India, are based on
ISO 9001:2008, IPEC, PQG and cGMP and
where applicable, ICH Q7.
Major products/services being exhibitedDFE Pharma has perhaps the most
comprehensive excipient range in
the market, covering MCC, Starch,
Lactose, Inhalation Grade Lactose, and
Superdisintegrants. Our range consists
of well-known product brands such
as Pharmatose, Primojel, SuperTab,
Respitose and Pharmacel.
Through our newly introduced
Pharmacel (MCC) products we now
provide our customers with the synergy
of the two most widely used diluents,
lactose & MCC! Never before has any
supplier been able to offer customer this
combination.
The pursuit of excipient excellence
One brand: DFE Pharma
Two names: DMV-Fonterra Excipients and DOMO-pharma
With MCC in our portfolio DFE Pharma now
offers world’s main excipient categories,
unlocking potential synergies for you to
increase your efficiency.
Contact us on www.dfepharma.com
New in our portfolio:
MCC

90 Pharmaceutical Technology Europe SEPTEMBER 2013 PharmTech.com
CORPORATE PROFILES
Contact details
Greiner Bio-One GmbH
Bad Haller Strasse 32,
4550 Kremsmuenster, Austria
Tel. +43 7583 67910
Fax: +43 7583 6318
www.gbo.com
Greiner Bio-One GmbH
Hall 4.1, Booth 41H09
Greiner Bio-One is specialised in
the development, production and
distribution of plastic laboratory products.
The company is a technology partner for
universities, hospitals, research institutes
and the diagnostic, pharmaceutical and
biotechnology industries as well.
Greiner Bio-One GmbH is a division
of Greiner Bio-One International AG,
based in Kremsmuenster (Austria).
Today Greiner Bio-One International
AG generates a turnover of 364 million
euros. It has over 1,700 employees and
operates globally with 24 subsidiaries and
numerous distributors in more than 100
countries.
Major products/services being exhibitedGreiner Bio-One is a leading supplier of
special products for cell cultures and
microplates for high-throughput screening
and a developer of innovative biochips and
sample collection systems. The company
performs contract work from the
pharmaceutical industry, the diagnostic
and medical sectors. Greiner Bio-One
uses injection moulding to produce
a whole range of customised plastic
platforms for the life-sciences sector and
offers the complete product development
and production process from the idea
through to the finished product. The
company produces small and large series,
undertakes customer-specific branding
and can call on production facilities in
Europe, the USA and Asia.
Contact details
FeF Chemicals A/S
Koebenhavnsvej 216
Tel. +45 5667 1000
Fax: +45 5667 1001
www.fefchemicals.com
FeF Chemicals A/S
Hall 6.2, Booth 62B48
FeF Chemicals
is a Novo
Nordisk company
that specialises
in the supply of
ingredients for the
biopharmaceutical
and pharmaceutical industries, such
as Insulin Human for cell culture media
and cGMP manufactured Quaternary
Ammonium Compounds (usually referred to
as Quats) such as Benzalkonium Chloride,
Cetrimide and Cetrimonium Bromide.
For our cGMP manufactured Quats we
offer:
t� Global regulatory compliance
t� Manufacture in accordance with
the highest GMP standards on the
market, the ICH Guide Q7 for Active
Pharmaceutical Ingredients
t� High purity products
t� Analyses according to multicompendial
pharmacopoeias BP, Ph.Eur., USP/NF
and JP
t� Regulatory documentation
As an approved supplier by a large number
of global leading pharmaceutical companies,
FeF Chemicals can assure full traceability
and reliability of the raw materials. We have
a well-developed management system,
allowing tracing where the raw materials
are used. We also have close contact with
our suppliers and can meet with customer
requested specifications. For us, reliability is
not just in the system but also in the mindset
of our employees.
QUALITY ASSURANCEOur quality system meets DS/EN ISO
9001 and ICH’s cGMP Guide for Active
Pharmaceutical Ingredients (ICH Q7).
Uniform quality of finished products is
ensured by our efficient quality control
systems, computerised materials planning
and rigorous laboratory quality control.
CUSTOMIZING QUATSIf the required product is not in the
standard assortment, we can design
customized products. Our flexible
production process can meet customer
demands for special chain length
distribution and/or solutions of quats
mixed in various ratios.

Pharmaceutical Technology Europe SEPTEMBER 2013 91
CORPORATE PROFILES
Contact details
HERMES PHARMA – a Division of
Hermes Arzneimittel GmbH
Georg-Kalb-Strasse 5-8,
82049 Pullach, Germany
Tel. +49 89 79102 261
Fax: +49 89 79102 159
www.hermes-pharma.com
HERMES PHARMA – a Division of Hermes Arzneimittel GmbH
Hall 3.1, Booth 31E26
HERMES PHARMA is the expert in
developing and manufacturing
user-friendly solid oral dosage forms -
including effervescent and chewable
tablets, lozenges, instant drinks and
orally disintegrating granules. We offer
customized solutions at every point along
the pharmaceutical value chain, from new
product development to market success.
For more than 40 years, leading healthcare
companies around the globe have been
working with HERMES PHARMA to expand
their product lines and grow their brands.
HERMES PHARMA is a division of
Hermes Arzneimittel, a leading German
provider of high-quality medicines
marketed under its proprietary, well-
established brands.
Major products/services being exhibitedOur customized services include
t� New product design
t� Formulation and analytical
development
t� Stability testing
t� Registration procedures
t� Manufacturing of laboratory, pilot and
large-scale batches
t� Quality control and batch release
t� Packaging and delivery
t� Regulatory support and lifecycle
management
We specialize in user-friendly dosage
forms which are easy to swallow, offer
a variety of choice in terms of flavor and
can be taken with or without water to suit
individual preferences. And, in the case of
solubles and effervescents, they dissolve
easily and quickly leaving no residue or
foam.
We have built up unique expertise in
taste masking and flavoring. So even if
the API is bitter or difficult to process, we
know how to transform it into a dosage
form your customers will like to take.
Interested in growing your brands
through user-friendly dosage forms? Meet
us at CPhI 2013.
Contact details
hameln pharmaceuticals gmbh
Langes Feld 13,
31789 Hameln, Germany
Tel. +49515 158 10
Fax: +49515 158 1258
http://www.hameln-pharma.com
hameln pharmaceuticals gmbh
Hall 4.2, Booth G32
With over 60 years of experience
hameln pharma is a well-established
specialist for contract manufacturing of
parenteral solutions and suspensions
filled in ampoules and vials. In our
cGMP certified state-of-the-art facility
in Hameln more than 430 members of
staff manufacture, test, package and ship
pharmaceutical products to our customers
serving healthcare markets worldwide.
The focus in everything we do lies
on the product quality and safety –
and therefore the well-being of the
final patient. This makes us a valued
business partner for many of the top
pharmaceutical companies, renowned
generic houses as well as start-up
businesses from the biotech sector.
Major products/services being exhibitedContract manufacturing of sterile liquids:
t� Ampoules: 1ml - 30ml
t� Vials: 2ml - 100ml
t� compounding
t� filling
t� visual inspection
t� labelling
t� packaging
t� analytical tests
Dossiers for various diluents:
t� WfI
t� Sodium Chloride
t� Calcium Chloride
Special abilities:
Handling of:
t� Anaesthetics
t� Suspensions
t� Oxygen sensitive products
t� Flammable liquids
t� Cold chain products

92 Pharmaceutical Technology Europe SEPTEMBER 2013 PharmTech.com
CORPORATE PROFILES
Contact details
ISOCHEM
32 RUE LAVOISIER,
91710 Vert-Le-Petit
Tel. +33 (0) 1 64 99 05 50
Fax: +33 (0) 1 64 99 05 69
www.isochem.eu and
www.wychem.com
ISOCHEM
Hall 5.0, Booth 50D30
Reliable, Flexible and Competitive
ISOCHEM operates 4 production sites,
including 3 cGMP plants (FDA) and
offers its renowned skills in multi-steps
chemical synthesis. This includes the safe
implementation of hazardous reactions
like Phosgenation and Hydrogenation.
Through the acquisition of Wychem,
which supplies intermediates in quantities
ranging from 1 to 1000 kg to numerous
industries, including the pharmaceutical
industry, Isochem has significantly
expanded its range of intermediates,
particularly aromatic compounds, while
Wychem’s ‘‘kilolab’’ unit constitutes an
additional resource for the development
of Isochem intermediates.
Major products/services being exhibitedISOCHEM offers a wide range of products
including phosgene derivatives, functional
intermediates and active ingredients.
Contact details
Hospira One 2 OneTM
275 North Field Drive,
Lake Forest, IL, USA 60045
Tel. 44 (0) 1926 835 554
www.one2onecmo.com
Hospira One 2 OneTM
Hall 4.2, Booth 42D31
Hospira’s One 2 One™ business is a
global leader in injectable product
contract manufacturing. With more than 20
years of experience in biologics and small
molecule fill and finish manufacturing,
in-depth knowledge of the lyophilization
process and expertise in multiple drug-
delivery technologies, One 2 One™ is a
reliable partner to help you achieve your
development and commercialization goals.
The complementary capabilities of its
facilities in North America and Europe also
make clinical trial and commercial product
manufacturing more efficient, convenient
and secure.
Major products/services being exhibitedOne 2 One™ manufactures injectable
products in a broad range of delivery
systems including: vials, bottles and
ampoules; glass and plastic prefilled
syringes; cartridges for self-administration
devices; flexible containers. One2One™
has a broad range of capabilities and
experience with different types of
molecules and processes:
t� Biologics
t� Small molecules
t� Vaccines
t� Cytotoxics
t� Controlled Substances
t� Highly potent compounds
t� Aseptic Fill/Finish
t� Development services
t� Lyophilization
t� Sterile Powder Filling
t� Multilingual packaging and labeling
t� Cold chain management

Pharmaceutical Technology Europe SEPTEMBER 2013 93
CORPORATE PROFILES
Contact details
JRS Pharma GmbH & Co. KG
73494 Rosenberg / Germany
Tel. +49 7967 152 365
www.jrspharma.de
JRS Pharma GmbH & Co. KG
Hall 6.1, Booth 61C59
JRS Pharma is well known and valued
worldwide - the most successful
system partner for tabletting excipients
and services, driving the pharmaceutical
world with innovative excipients designed
for Direct Compression.
Major products/services being exhibitedPROSOLV EASYtab – the all in one, ready-
to-use composite - considered the biggest
invention in its class and a major mile stone
for significant cost cuttings in the industry!
JRS customers benefit from the
extensive expertise offered in various
fields by the JRS Pharma Family:
t� VIVACOAT ready-to-use coating systems,
t� CR0 and CMO for small molecules
t� Biotech.
One partner offering multiple benefits
- a win-win partnership at its best!
Contact details
Lonza
Muenchensteinerstrasse 38
CH-4002 Basel
Tel. +41 61 316 81 11
Fax: +41 61 316 91 11
www.lonza.com
Lonza
Hall 6.2, Booth 62C01
Lonza Custom Manufacturing has been
helping pharmaceutical and biotech
companies of all sizes improve and advance
their products for over 30 years. APIs,
HAPIs, conjugates, peptides, vaccines,
plasmid DNA, recombinant proteins, Fabs,
mAbs, and Cell Therapy are among the
many services Lonza provides. We have
the know-how and proven track record
to handle almost any pharmaceutical or
biotechnology challenge you may need.
From pre-clinical to commercial supply,
Lonza’s complete development services,
industry-leading manufacturing processes
and broad technology platform enable
your product to reach its full potential.
Major products/services being exhibitedLonza’s Custom Development and
Manufacturing Offering:
Innovative Technologies
t� FlowPlate™ MicroReactors
t� DuraSource™ Life Cycle Extension
Services
t� Easy Access™ Antibody Drug Conjugates
t� Epibase™ Immunogenicity Services
t� Light Path™ Custom Material Supply
Services
t� The GS Xceed™ Gene Expression System
t� XS Microbial Expression Technologies™
Complete Process Development Services
t� Process Development, Scale-up,
Validation and Transfer
t� Cell line Construction/Strain Design
Clinical through Commercial
Manufacturing
t� Mammalian
t� Microbial
t� Small Molecule APIs
t� Cytotoxic and Highly Potent APIs
t� Antibody Drug Conjugates
t� Cell Therapy
t� Viral Vaccines

94 Pharmaceutical Technology Europe SEPTEMBER 2013 PharmTech.com
CORPORATE PROFILES
Contact details
OPTIMA pharma GmbH
Otto-Hahn-Str. 1,
74523 Schwäbisch Hall, Germany
Tel. +49 791 9495-0
Fax: +49 791 9495-2610
www.optima-pharma.com
OPTIMA pharma GmbH
Hall 6, Booth E28
Meeting highest requirements of the pharmaceutical sector - OPTIMA pharma
The concept offers an immensely
diversified and innovative range
of filling and packing machines for
pharmaceutical products, e.g. sterile
liquids and powders, non-sterile
liquids and powders, pharmaceutical
freeze-drying as well as isolation and
containment technology.
Optima Pharma is your ideal partner
– also for the efficient and precise
realization of complex turnkey projects.
Contact details
MEGGLE Gruppe Wasserburg
BG Excipients & Technology
Megglestrasse 6-12
83512 Wasserburg, Germany
Tel. +49 8071 73 476
Fax: +49 8071 73 320
www.meggle-pharma.com
MEGGLE Gruppe Wasserburg BG Excipients & Technology
Hall 3.1, Booth 31F54
Experts in Excipients
MEGGLE Excipients & Technology is a
global leader in the manufacture of
lactose for the pharmaceutical industry.
Supporting supply chain security with
manufacturing facilities in Europe and
North America, MEGGLE offers a broad
product portfolio of lactose excipients,
co-processed technologies and excipient
contract manufacturing.
MEGGLE is a pioneer in co-processing
technologies that allow simple, robust
formulation development and manufacture.
Through co-processing, MEGGLE developed
highly functional excipients possessing
unique qualities for directly compressible
immediate and sustained release
pharmaceutical solid dosage forms.
As a family owned, German company,
MEGGLE has proudly produced quality
products for consumers and industry for
four generations.
MEGGLE Excipients & Technologies
serves the pharmaceutical and
biotechnology markets with a global
network of offices and authorized
agents. As an innovator in co-processed
technology, MEGGLE also provides
contract manufacturing services to
several other global excipient companies.
Our broad portfolio of products, multiple
manufacturing locations, technical centers in
major markets, and innovative technologies,
make MEGGLE the preferred supplier
and valued partner by large and small
pharmaceutical product manufacturers.
MEGGLE Excipients & Technologies
excipient products:
t� Lactose monohydrate
t� Anhydrous Lactose
t� Co-Processed Excipients
t� Lactose for Inhalation
t� Lactose for lyophilization and parentral
applications
t� Custom lactose products

Pharmaceutical Technology Europe SEPTEMBER 2013 95
CORPORATE PROFILES
Contact details
Pfizer CentreSource
Tel. +32.2.714.6502
www.pfizercentresource.com
Pfizer CentreSource
Hall 3.0, Booth 30D54
Pfizer CentreSource (PCS) integrates
Pfizer’s world-class analytical,
regulatory, technical support and
production expertise to provide greater
flexibility and help third-party customers
work in accelerated timeframes. Key
manufacturing assets include world-
class bioprocessing facilities in the
United States and Europe, as well as
high-containment capabilities in Europe.
PCS also offers specialty dosage form
manufacturing and an array of active
pharmaceutical ingredients and fine
chemical intermediates.
Major products/services being exhibitedt� High Containment solid oral dose
processing
t� Custom GMP fermentation and
bioprocessing services
t� Complex sterile manufacturing
services
t� Bulk Active Ingredients
Contact details
ROQUETTE
rue de la haute loge – 62080
Lestrem cedex - France
Tel. 00.33.(0)3.21.63.36.00
Fax: 00.33.(0)3.21.63.94.64
www.roquettepharma.com
ROQUETTE
Hall 6.1, Booth 61A70
ROQUETTE: A GLOBAL SUPPLIER FOR GLOBAL NEEDSRoquette is a long-
established supplier
of actives and
excipients for the
pharmaceutical and
cosmetic industries.
Our slogan “Simply formulate your wishes”
points to the many services we offer our
customers and to the strength of the
support that we want to provide them.
ROQUETTE PHARMA SOLUTIONS Our very wide range of excipients and
actives has exceptional potential for
meeting the needs of our customers,
notably in the areas of:
t� Injectables
t� Tablets obtained by direct compression
or wet granulation
t� Film forming and film coating
t� Syrups, suspensions, granules and sachets
t� Orodispersible tablets
t� OTC and nutraceuticals
t� Toothpastes and mouthwashes
Roquette also offers on-site assistance
for coating. More process insights: www.
readilycoat.com.
Today, the direct scale-up of formulations
is a new way to reduce drug development
time and cost. To further strengthen this
drive, Roquette provides a new compression
modeling service. More information on:
www.roquette-pharma.com/focus-on-
innovation/roquettes-services/
Our Pharma Application Development
Centers are also offering a new support
model: “Boost your NutraPharma
project”. Manufacturers of nutraceutical
and pharmaceutical products who want
to get new products onto the market
more quickly and reliably access a
state-of-the-art laboratory with modern
equipment & experienced application
experts. For more information on this
new service: www.roquette-pharma.
com/2013/product-development-boost-
your-nutrapharma-project

96 Pharmaceutical Technology Europe SEPTEMBER 2013 PharmTech.com
CORPORATE PROFILES
t� Filling machines
t� Capping machines
t� Isolator solutions
t� Decontaminating machines
All STERILINE equipment is in
compliance with CGMP, GAMP and 21
CFR Part 11 requirements
Contact details
STERILINE s.r.l.
via Tentorio, 30 – 22100
COMO – ITALY
Tel. +39 031 592 064
Fax: +39 031 591 976
www.steriline.it
STERILINE s.r.l.
Hall 4.1, Booth 41J39
STERILINE ASEPTIC PROCESSINGSTERILINE was established in 1989 for
the purpose of producing automatic
equipment for pharmaceutical companies.
STERILINE is currently one of the most
successful European manufacturers and
suppliers of process equipment in the
pharmaceutical industry, worldwide.
STERILINE offers a wide range of high
quality products which are specifically
designed to meet the customer needs for
high flexible applications.
STERILINE has meanwhile grown to
be one of the most trusted equipment
suppliers for the pharmaceutical industry,
which supplies its equipment to the largest
pharmaceutical companies worldwide.
Major products/services being exhibited
ASEPTIC FILLING LINES FOR PHARMACEUTICAL INDUSTRYSTERILINE offers a wide range of high quality
pharmaceutical equipment specifically
designed to meet customer needs.
STERILINE main products range from
complete aseptic filling lines to combined
lines for ampoules, vials, cartridges and
syringes.
STERILINE lines can consist of:
t� Washing machines
t� Depyrogenating tunnels
Contact details
Rovi Contract Manufacturing
Julián Camarillo 35, 28037
Madrid, Spain
Tel. +34 91 375 62 30
Fax: +34 91 375 63 51
www.rovicm.es
Rovi Contract Manufacturing
Hall 4.2, Booth 42L13
Rovi Contract Manufacturing provides
contract manufacturing of injectables
and solid forms products. The services
are carried out through our two
manufacturing sites:
ROVI CM: specialist in filling and
packaging of prefilled syringes and
vials. Aseptic filling and/or terminal
sterilization. All syringe formats available
from 0.5ml to 20ml (filled from 0.2ml).
ROVI Alcala: one of the biggest FDA-
approved plants for solid forms in Europe
with a capacity of 3000 million tablets/
year. Dry granulation (roller compactor) and
wet granulation (high shear and planetary
mixers), compression presses, film coating,
high speed and flexible packaging lines,
testing and storage are available.
Both manufacturing sites belong to
Laboratorios Farmacéuticos ROVI, S.A.,
a fully-integrated Spanish specialty
pharmaceutical company engaged in the
research, development, manufacturing
and marketing of small molecules
and biologic drugs. The company was
founded in 1946 and the group is quoted
on the Madrid Stock Exchange Market
since 2007. The number of employees is
approximately 915.

Pharmaceutical Technology Europe SEPTEMBER 2013 97
CORPORATE PROFILES
Contact details
Tereos Alcools
11 rue Pasteur
02390 Origny-Ste-Benoîte
France
Tel. + 33 (0)3 23 09 32 03
Fax: +33 (0)3 23 09 32 73
www.tereos.com
Tereos Alcools
Hall 6.1, Booth 61B56
Tereos Alcools is the dedicated company
for marketing the pharmaceutical and
traditional alcohols produced by Tereos
France, the specialist for sugar beet
processing in France. With five distilleries
in the northern part of France, Tereos
Alcools is the main player on the European
ethanol market and is specially focused on
the pharmaceutical industry.
Involved in the alcohol business
for nearly a century, with a wealth of
technical knowledge and the industrial
capability of Tereos group, Tereos Alcools
is a reliable partner for your ethanol
supply.
Major products & services Agricultural Alcohols
High qualities, sustainable and suitable
for all applications, alcohols marketed by
Tereos Alcools are from sugar beet grown
in France.
Both Absolute and 96% grades are of
the highest purity, rectified to give an
odour-neutral product that is able to meet
even the most exacting requirements and
comply with the standards of the
pharmaceutical industry.
A wide range of productst� Dehydrated Ethanol (absolute alcohol
99.9 %), Complies with Eur. Ph., USP
t� 96% Ethanol, Complies with Eur. Ph.
t� Post study denaturation by request
(general procedure and special
procedure).
Contact details
Vetter Pharma International GmbH
Eywiesenstrasse 5,
88212 Ravensburg, Germany
Tel. 0049-751-3700-0
Fax: 0049-751-3700-4000
www.vetter-pharma.com
Vetter Pharma International GmbH
Hall 4.2, Booth 42K29
Vetter is a leading contract development
and manufacturing organization
(CDMO) that specializes in the aseptic filling
of syringes, cartridges and vials. The
company has extensive experience with
biologics and other complex compounds,
including monoclonal antibodies, peptides,
interferons and vaccines. Collaborating
with pharma/biotech clients worldwide,
Vetter supports products from preclinical
development through global market supply.
Through its U.S. and European facilities,
Vetter Development Service provides
state-of-the-art support for early-stage
products, with seamless transfer at Phase
III to Vetter Commercial Manufacturing for
large-scale production. The company offers
state-of-the-art technology and innovative
processes to promote product quality and
maximize API yield.
Major products/services being exhibitedVetter Development Service
t� Formulation support
t� Process development
t� Clinical trial manufacturing
t� Analytical service
t� Regulatory support
Vetter Commercial Manufacturing
t� Fill and finish
t� Analytical service
t� Regulatory support
t� Product life cycle management
Vetter Packaging Solutions
t� Customized packaging development
t� Specialized technologies
t� Proven platform technologies
t� Packaging services
t� Logistic services

98 Pharmaceutical Technology Europe SEPTEMBER 2013 PharmTech.com
ASK THE EXPERT
John Yin, an applications specialist with
Freeman Technology, discusses the importance
of powder-characterisation techniques
for optimising pharmaceutical product
development and manufacturing processes.
Q. What advances in powder characterisation
have been achieved in recent years?
A.In the past, much of the focus on powder characterisation
has been at the single aspect level where one standard or
number is expected to dictate ‘good’ or ‘bad’ once and for all. In
reality, we rely on multiple techniques for explaining behavioural
differences when being subjected to many processing conditions.
While some information can be obtained with traditional
methods, such as bulk-tapped density, flow through an orifice and
angle of repose, these techniques are not at all representative
of the conditions that powders see under process conditions
and, therefore, are not able to provide process-relevant and
differentiating information given the process technologies in use
today in the pharmaceutical industry.
The multivariate approach for characterising powders has made
it possible to gain much greater insights into how the combination
of powder physical properties and external variables affect their
behaviour. Dynamic testing for example, which measures the
flow energy of a powder with respect to external conditions, such
as aeration, flow rate and consolidation, is a newer technique
enjoying considerable industrial uptake. Advances in shear testing
are also improving both the precision and reproducibility of this
important analytical method.
Q.What limitations remain with respect to
powder-characterisation technology for the
pharma industry? Why are these issues important?
A.One of the biggest limitations at this point is the lack
of understanding of powder behaviour at the level
needed to describe such behaviour mathematically or from
an axiom perspective. There are so many variables, not
just particle size and density, which are often perceived as
the only critical factors that influence powder behaviour,
but also the surface texture, particle shape, stiffness and
porosity as well as external influences, such as air, moisture,
consolidation stress and flow rate, which can all contribute
to the picture. There is much work to be done in this area
and it will be a steep learning curve. A second challenge is
the need to make the pharmaceutical industry and other
powder-processing industries (that share similar challenges)
aware of the benefits of more comprehensive powder
characterisation.
Q.What advances in powder-characterisation
technology might be expected?
A.The adoption of continuous manufacturing for the
production of solid dosage forms will have an impact
on powder-characterisation technology. In addition, as
the amount of data gathered on different powder systems
increases, we will continue to gain more knowledge about
powder properties and behaviour and be able to expand our
insight into performance with respect to different processing
conditions. PTE
COMPANY PAGE COMPANY PAGE COMPANY PAGE
Ad Index3M Drug Delivery Systems Div. .................... 99
Agilent Technologies..................................... 55
Asahi Kasei Chemicals Corp ..................33, 86
Baxter Healthcare Corp ................................ 35
BENEO-Palatinit GmbH ........................... 29, 86
BISCHOF & KLEIN GMBH & CO KG ......... 25, 87
Bosch Packag Tech Int .............................57, 87
Catalent Pharma Solutions ..................88, 100
Charles River .................................................. 28
Colder Products Company ........................... 63
Contec ............................................................ 47
Coperion GmbH ............................................... 5
CORDEN PHARMA INTL GMBH .............. 21, 88
Croda Inc ...................................................27, 89
DMV-Fonterra Excipients ...........Cover Tip, 89
Dr Paul Lohmann GmbH KG ......................... 22
EasyFairs UK Ltd .......................................Insert
EBD Group AG ................................................ 84
EVONIK INDUSTRIES AG ................................ 31
FEF CHEMICALS AS ....................................9, 90
GREINER BIO-ONE ..................................... 2, 90
HAMELN PHARMACEUTICALS GMBH ... 18, 91
Hermes Pharma GmbH .......................... 65, 91
Hospira Worldwide Inc .............................67, 92
ISOCHEM .................................................. 14, 92
JRS Pharma GmbH & Co KG ................... 10, 93
KEOFITT .......................................................... 56
LONZA BIOLOGICS INC ............................19, 93
Meggle Group Wasserburg .................... 13, 94
Mueller GmbH ................................................ 30
Optima Packaging GmbH ........................61, 94
Patheon Pharmaceuticals .............................71
PETRO CANADA .............................................51
Pfizer CentreSource .................................59, 95
Powder Systems Ltd ..................................... 53
Rommelag AG .................................................11
Roquette Freres ....................................... 15, 95
Rovi Contract Manufacturing ..................41, 96
SGS Life Science Services ............................ 75
Shimadzu Europe .......................................... 37
SIGNTRADE .................................................... 44
Steriline Srl ............................................... 50, 96
Tereos Union SDA-Beghin Say ............... 39, 97
Thermo Fisher ................................................17
Veltek Associates Inc ...................................... 7
Vetter Pharma-Fertigung GmbH ............49, 97
Waters Chromatography .............................. 43
Multivariate Approaches
for Powder Characterisation

3M DRUG DELIVERY SYSTEMS
MICRONEEDLE SYSTEMS
Increasing commercial success is virtually painless
with patient-friendly 3M Microneedle Technology.
Focusing on patient-friendly drug delivery systems can help protect your
large commercial product franchise. As a microneedle expert, 3M offers
innovative technology and a depth of expertise that can also enable you to
improve the lives of patients.
· Wide range of active pharmaceutical ingredients in a transdermal format.
· Targeted intradermal devices ideal for microneedle delivery including
Autoimmune diseases and vaccines.
3M’s team can meet your needs from development through the clinical
stage to commercial scale.
Start improving patients’ lives today at www.3M.com/MTS
3M™ Microneedle Systems provide innovative solutions in a
variety of formats to ensure your commercial success.
US: (1) 800 643 8086UK: (44) 1509 613626ASIA: (65) 6450 8888
® 3M 2013. All Rights Reserved. 3M is a trademark of 3M Company
Frances wanted a more patient-friendly, less painful treatment.
You don’t mess with Frances.
E N A B L I N G Y O U R S U C C E S S

˝ 2
013
Cata
len
t P
harm
a S
olu
tio
ns.
All r
igh
ts r
eserv
ed
.
OS
DrC
is a
reg
iste
red
tra
dem
ark
of
San
wa K
ag
aku
Ken
kyu
sh
o C
o.
Catalent. More products. Better treatments. Reliably supplied.™
eu +00800 8855 6178 [email protected] www.catalent.com/betteroutcomes
INNOVATIVE
DELIVERY OPTIONS
Solutions for more molecules
with versatile, proven RP
Scherer softgel technologies.
optishell™ for complex
fill formulations
optigel bio™ for macromolecules
optigel lock™ for abuse deterrence
ENHANCED BIOAVAILABILITY
Improved solubility and
permeablity. Optimized final
dose forms. Integrated services
from development to supply.
rp scherer softgel technologies
optimelt™ hme technology
zydis® nano technology
OPTIMIZED CONTROLLED RELEASE
Better outcomes with improved
regimens and target release
profiles. A wide range of
dosing options: combination,
dividable and pulsed release.
controlled release technologies
osdrc® optidose™ tablets
SOLUTIONS FOR TARGET POPULATIONS
Better adherence and patient
outcomes. Ideal for pediatric and
geriatric populations, specific
conditions and disease areas.
zydis® fast-dissolve
tablets & granules
optigel micro™ technology
Every molecule has a challenge. We have a solution. From orphan drugs to blockbusters, our development
expertise, delivery technologies and reliable supply deliver better outcomes for payers, patients and innovators.
optimized delivery technologies.better outcomes.
Related Documents


