The pulp and paper overview paper Sector analysis for the Climate Strategies Project on Inclusion of Consumption in Carbon Pricing Overview paper May 2016 Authors Susanna Roth Lars Zetterberg William AcWorth Hannah-Liisa Kangas Karsten Neuhoff Vera Zipperer

Welcome message from author
This document is posted to help you gain knowledge. Please leave a comment to let me know what you think about it! Share it to your friends and learn new things together.
Transcript

14
The pulp and paper overview paper
Sector analysis for the Climate Strategies Project on Inclusion of Consumption in Carbon Pricing
Overview paper
May 2016
Authors
Susanna Roth
Lars Zetterberg
William AcWorth
Hannah-Liisa Kangas
Karsten Neuhoff
Vera Zipperer

15
About the Authors
Susanna Roth
Swedish Environmental Research Institute (IVL)
Lars Zetterberg
Swedish Environmental Research Institute (IVL)
William AcWorth
International Carbon Action Partnership (ICAP)
Hannah-Liisa Kangas
Finnish Environment Institute (SYKE)
Karsten Neuhoff
the German Institute for Economic Research (DIW Berlin)
Vera Zipperer
the German Institute for Economic Research (DIW Berlin)
About the Project
A project led jointly by Climate Strategies and DIW Berlin has been exploring whether inclusion of
domestic sales of selected energy intensive commodities (e.g. steel) in domestic emission trading
schemes is an effective and feasible approach towards restoring the carbon price signal in these sectors,
without damaging competitiveness. It has been delivered by a multidisciplinary, international team of
researchers from a number of institutions, representing various fields (EU law and institutions, climate
policy and economics, energy market and infrastructure policy and economics).
Acknowledgements
This report is an output from the Inclusion of Consumption project. The authors would like to thank
Sebastian Martinez for his excellent research assistance as well as Nilla Dahlin and Nicola Rega for very
valuable comments on an earlier version of this paper. Furthermore, the authors gratefully acknowledge
funding from the Mistra Indigo programme. The views expressed and information contained in this paper
are not necessarily those of or endorsed by the funders which can accept no responsibility or liability for
such views, completeness or accuracy of the information or for any reliance placed on them.
About Climate Strategies
Climate Strategies is an international organisation that convenes networks of leading academic
experts around specific climate change policy challenges. From this it offers rigorous,
independent research to governments and the full range of stakeholders, in Europe and beyond.
We provide a bridge between research and international policy challenges. Our aim is to help
government decision makers manage the complexities both of assessing the options, and of
securing stakeholder and public consensus around them. Our reports and publications have a
record of major impact with policy-makers and business.

1
Table of Contents
List of Figures ..................................................................................................................... 2
List of Tables ...................................................................................................................... 2
Executive Summary ............................................................................................................. 3
Pulp and Paper sector dynamics driven by demand development .................................... 3
Opportunities for pulp and paper production from climate policy .................................... 3
Areas that need further attention and issues that may be important ................................ 3
1. Introduction .......................................................................................................... 5
2. The current situation of the European pulp and paper sector ................................. 5
2.1. Paper products and the production processes ....................................................... 6
2.2. Production and consumption in EU member states ................................................ 7
Pulp 9
Paper 10
2.3. International trade .............................................................................................. 12
Pulp 12
Paper 13
2.4. Energy intensity .................................................................................................. 14
Energy use in pulp production 15
Energy use in paper production 16
Energy use in integrated production 17
3. Low-carbon technologies: options and incentives ................................................ 18
3.1. Technical options for mitigation .......................................................................... 18
3.1.1. Enhancing energy efficiency in conventional production processes ...................... 19
Opportunities for mitigation 19
Key Drivers 21
3.1.2. Fuel Mix Change .................................................................................................. 23
Opportunities for mitigation 23
Key Drivers 24
3.1.3. Increased recycling ............................................................................................. 25
Opportunities for mitigation 25
Key Drivers 26
3.1.4. Breakthrough technologies .................................................................................. 27
Key Drivers 29
3.2. Policies, incentives and other drivers and barriers for mitigation ........................ 30
3.3. Benchmarks for free allocation of allowances ...................................................... 32
Benchmarks in the EU ETS 32
Global outlook 34
4. Potential applicability of Inclusion of Consumption to the pulp and paper sector . 35
4.1. The Inclusion of Consumption approach .............................................................. 36
4.2. Benchmarks for Inclusion of Consumption ........................................................... 38
Biomass Carbon Accounting 38
Inclusion of indirect emissions from electricity use in the consumption fee and
compensation to paper producers 40
4.3. Discussion .......................................................................................................... 40
References and consulted literature .................................................................................. 42

2
List of Figures
Figure 1. Paper and Paperboard Production Process ............................................................ 7
Figure 2. Industry evolution, 2000-2014. .............................................................................. 8
Figure 3. Pulp Production by Country, 2014. ........................................................................ 9
Figure 4. Pulp Production and Consumption by Region (worldwide), 2014. .......................... 10
Figure 5. Paper and Board Production, CEPI Countries, 2014. ............................................ 11
Figure 6. Paper & Paperboard Production and Consumption by Region (worldwide),
2014. .................................................................................................................. 11
Figure 7. CEPI countries paper consumption in tonnes, by paper grade, 2014. .................... 12
Figure 8. EU Pulp Net Imports by region, 2000-2014. ......................................................... 13
Figure 9. EU Paper and Paperboard Net Exports by Region, 2000-2014. ............................. 13
Figure 10. Fuels consumption in 2013 ................................................................................ 14
Figure 11. Emissions from pulp and paper Production, 1991 - 2013. .................................. 19
Figure 12. European power prices 2004 to 2014. ................................................................ 20
Figure 13. European pulp and paper fuel mix, 2000 to 2013. .............................................. 24
Figure 14. Utilization, net trade and recycling rates in Europe, 1991-2014. ......................... 26
Figure 15. Expenditure on research and development as a proportion of sales, 2013. .......... 30
Figure 16. Emission reduction potential, 1990-2050, in million tonnes. ............................... 31
Figure 17. CO2 Carbon intensity benchmarks in EU. ............................................................ 33
Figure 18. Schematic picture of Inclusion of consumption in non-integrated pulp and
paper mills (IoCL=Inclusion of Consumption Liability) ........................................... 37
Figure 19. Treatment of biomass in carbon accounting for the paper and pulp sector .......... 39
List of Tables
Table 1. Sector Progress 2000-2014. ................................................................................... 8 Table 2. Total pulp production in Europe by production process, 2014. ................................. 9 Table 3. Average fuel mix in selected EU countries for the period 2005-2007 ....................... 15 Table 4. Energy consumption and recovery of energy in mechanical pulping. ....................... 15 Table 5. Best-practice specific heat consumption for the production of virgin pulp. .............. 16 Table 6. Final energy intensity for different paper products (excluding electricity use) .......... 17 Table 7 Average specific energy consumption per process for four different paper
grades in the Netherlands .................................................................................... 17 Table 8. World Best Practice Final Energy Intensity Values for Integrated Pulp and
Paper Mills (values are per air dried metric tonnes) .............................................. 18 Table 9. Available technologies for pulp and paper production processes............................. 21 Table 10. Savings from use of recycled fibres ..................................................................... 25 Table 11. Emissions factor and proposed benchmarks values for virgin pulp products ......... 32 Table 12. Proposed benchmark for different paper products ............................................... 33 Table 13. Benchmarks in the Californian Cap-and-Trade Program for paper production ....... 34 Table 14. Basis for allocation for pulp and paper in Australia .............................................. 35

3
Executive Summary
Pulp and Paper sector dynamics driven by demand development
The European pulp and paper sector has undergone significant consolidation since
the turn of the century. While in the lead up to the European economic crisis in 2009,
production of pulp and paper was rising on the back of larger more efficient mills,
since 2007 production has declined and remained below the pre-crisis level. Further,
paper and paperboard consumption has not recovered from the pre-crisis levels, but
rather has continued to decline, partly due to digitalization.
Economic development in Asia has triggered growing demand and thus a shift of
global demand. While Europe is a net importer of pulp, the net export of paper has,
however, steadily grown over the last decade. With declining demand volumes, the
sector anticipates and some companies actively explore opportunities in higher value
papers, such as coated fine papers for magazines and advertisement, which are,
however, also under pressure from digitalization. Further prospects for the pulp and
paper sector are expected from the bioeconomy; for example food-packaging and
pulp-based fabric.
Opportunities for pulp and paper production from climate policy
Climate policy could trigger more mitigation opportunities for the sector than might
be otherwise anticipated. Globally, the pulp and paper industry is the fourth largest
industrial energy consumer. Energy costs make up, on average, 16% of total
production cost. Reported carbon emissions of the sector are low because over half of
the energy used (55%) comes from biomass and most of the rest from natural gas
(38%). This explains why, despite the pulp and paper sector is a very energy intensive,
reported carbon intensity is low.
With new production processes, a share of the biomass used for heat in the pulp and
paper sector could be freed up for use in other sectors, thus reducing carbon
emissions there. Given the overall shortage of biomass, any biomass saved in the
sector could be used in other sectors, if there is market demand, for example meeting
peak power demands, providing raw material for bio-plastics and securing low-carbon
energy for transport.
Technological options to realize these mitigation opportunities can be structured in
three groups: (1) improving the carbon efficiency of the current machinery stock; (2)
production process changes; and (3) new low-carbon machinery. However, to date
most of the efforts have focussed on increasing energy efficiency and increased use of
biomass residuals for heat and power generation. This may be partially linked to the
commodity type nature of the product and the focus on short-term cost minimization
by producers. But such efforts will not be sufficient to reach the long-term
decarbonisation of the pulp and paper industry.
Areas that need further attention and issues that may be important
An important issue to ensure material efficiency and to avoid market distortions is
that the scheme also includes materials that are in close competition to paper
products. This concerns for instance plastic and glass as packaging materials, but

4
also electronic products that compete with paper products such as newsprint and
graphic paper. Further investigations regarding which products to include are needed.
The focus of the sector on increased use of biomass for heat and power production
reflects the nature of the sector, which receives renewable support granted for power
produced from bio-energy burned in combined heat and power installations and is
rewarded by the EU ETS that considers bio-energy to be carbon neutral. Thus, while
energy prices and competitive pressure create incentives for efficiency use of biomass,
the EU ETS does not create any such incentives and renewable support even reduces
incentive for more efficient use of bio-energy in paper production and efficient paper
use.
The energy and climate package for 2030 is now under construction – therefore the
next few years will determine climate energy policy in the post-2020 era in the EU.
Many options are on the table for EU ETS design with respect to the treatment of
biomass and further development of forestry policy. Furthermore the discussions on
resource efficiency and circular economy raise the question of whether it will remain
economically viable to use biomass for base-load heat provision, rather than as input
for bio-materials, fuels for mobile applications, or as storable energy that meets peak
heat or power demands.
This raises the question how the policy framework could evolve to strengthen
incentives for innovation and use of new material types and production processes.
This will likely involve both push and pull policy elements. The discussions on sector
road maps – like the CEPI Two Team Project – have initiated a debate on innovative
new materials and processes. It needs to be considered whether public support can
contribute to an accelerated further development of set of these technology options.
Private leadership and co-funding can help identify credible technology options as
well as rapid development and commercialization. This will require a credible
business case for larger scale roll out – thus directly raising questions as to how EU
ETS and renewable support policies need to be adapted in order to create a level
playing field for different commercialized technologies options.
Investors will consider in parallel a set of interlinked policy dimensions including
allowance allocation, power price compensation, renewable support provisions and
carbon neutrality definitions. They need to therefore be jointly discussed when
evaluating policy options, including, for example, the Inclusion of Consumption (IoC)
of paper into EU ETS so as to correct for disincentives that result from the use of free
allowance allocation for leakage protection purposes.

5
1. Introduction
The European pulp and paper sector has undergone significant consolidation since
the turn of the century. While in the lead up to the European crisis, production was
rising on the back of larger more efficient mills, since 2007 production has declined
and remained below the pre-crisis level. Paper and paperboard consumption has also
not recovered from the pre-crisis levels, but rather has continued to decline such that
in 2013, consumption was 17% lower than in 2006. At the same time, European
producers are facing increased competition from Asia, which is sometimes driven not
only by market fundamentals, but also output and employment targets. These factors
are not related to climate change, but make the sector sensitive to climate policy and
its impact on competitiveness.
Although energy intensive, the pulp and paper industry has low carbon intensity as
biomass, which is considered carbon neutral, dominates the fuel mix. However, if the
sector is to achieve its long term decarbonisation goals, increased adoption of Best
Available Technologies and energy efficiency measures is required in addition to
continued fuel switching and break-through technologies. Hence, any post-2020
reform must provide a clear and long-term perspective, built upon three policy
elements. First, an effective carbon price emerging from the European Union
Emissions Trading System that is relevant both for producers, to facilitate switching
to lower-carbon production, and also for intermediate and final consumers in order to
create a viable long-term business case for large-scale investments in lower carbon
processes, materials, and efficient use. Second, public funding for innovation and
demonstration of breakthrough technologies. Third, institutional adjustments and
additional regulatory instruments to facilitate implementation of sector roadmaps.
In this paper we assess the opportunities and challenges for the European pulp and
paper sector. We provide a detailed perspective on the sector in terms of production
and consumption patterns, international trade, and energy intensity. We then assess
the opportunities, drivers, and barriers for greenhouse gas reduction within the sector.
Finally Inclusion of Consumption is discussed as a viable option for EU ETS reform
with a specific focus on the design opportunities and challenges for the European
pulp and paper sector.
2. The current situation of the European pulp and paper sector
Paper products are frequently used in a variety of every day applications, from paper
for writing to paperboard as packaging material. In this section we give a brief
introduction to the European pulp and paper industry, focusing on different
production processes as well as recent trends in production and consumption, trade
patterns, energy and carbon intensities.
6
2.1. Paper products and the production processes
The main inputs for paper and paperboard are different forms of pulp, which in turn
are made from wood or other raw materials containing cellulose fibres. In Europe,
wood is the main raw material, although in a few cases cellulose material, such as
straw, hemp, grass or cotton, is used (BREF, 2013).
Pulp and paper mills can either be integrated or separated. An integrated mill
produces pulp on site, while in a non-integrated pulp mill market pulp is dried and
pressed before being transported to the paper mill. Since pulp is a product by itself,
pulp and paper are treated separately throughout this report.
The pulp for papermaking can be produced from virgin fibre or from re-pulping of
recycled paper. To produce virgin pulp, wood logs are first debarked and chipped.
Then water and heat are added and by mechanical or chemical means the wood is
separated into individual fibres.
Mechanical pulping is primarily used in integrated pulp and paper mills. In this
process fibres are separated through the use of mechanical energy. With a raw
material conversion efficiency 1 of 45%, mechanical pulping is considered both a
simple and efficient process, but with the disadvantage that wood fibres are often
damaged (Healy & Schumacher, 2011). Therefore, mechanical pulping is mainly used
for weaker paper such as newspaper, printing paper, towelling, tissue, or paperboard.
Sometimes chemical pulp is mixed for additional strength. Electricity is the main
energy input for mechanical pulping (Worrell, 2007). Mechanical pulp production
yields substantial amounts of heat as side product, which can be used for district
heating.
Chemical pulp is used both in integrated and non-integrated pulp and paper mills.
Through chemical pulping, non-cellulose wood components are removed leaving the
cellulose fibres intact (Bajpai, 2012). Hence, chemical pulp is better suited for high
quality paper (Healy & Schumacher, 2011). There are mainly two different processes
for chemical pulping: Kraft (sulphate) and Sulphite. Black liquor is an energy rich by-
product of chemical pulping, which is burned in recovery boilers to produce combined
heat and power.
Paper can also be made from Recycled pulp, where scrap paper is recovered,
shredded, heated, cleaned and de-inked. The resulting product is recycled pulp that
can be processed into paper products.
Pulp is made into paper in the paper making process, which roughly can be divided in
the following steps (See Figure 1):
1. Stock preparation. Raw stock is converted into finished stock for the paper
machine. This includes blending of different pulps, dilution and addition of
chemicals.
2. Paper machine. In the paper machine, water is removed and the papers’
properties are developed.
1 Conversion efficiency refers to how many units of virgin biomass are required to produce a unit of pulp.

7
3. Finishing and coating. The paper is coated, depending on the desired end
product.
Paper products can be split into two broad categories: paper and paperboard. Paper
products are either coated with a compound or polymer to deliver a certain quality
(weight, gloss, etc.) or are uncoated such as copy (graphic) paper, newsprint, or
tissue/sanitation products. Paperboard is similarly treated or processed to deliver
specific qualities and is used in case materials, as cartons for consumer products or
packaging. Often, a combination of different kinds of pulps is used in the process and
a certain product may be produced through different processes.
Figure 1. Paper and Paperboard Production Process
Source: Authors’ illustration
2.2. Production and consumption in EU member states
Figure 2 illustrates the evolution of the pulp and paper industry in Europe2 from 2000
to 2014. Since the turn of the century, there was an upward trend in the production of
pulp and paper. For example, pulp and paper consumption grew 14% and production
grew 11% between 2000 and 2007 (see Figure 2). Production fell starting with the
advent of the financial crisis in 2007. Despite a slight recovery between 2009 and
2010, production remains 13% below the pre-crisis level. This decrease in
consumption has been sustained relatively equally over all paper grades.
2 Data is based on the Confederation of European Paper Industries (CEPI) Statistics. CEPI members
include Austria, Belgium, Czech Republic, Finland, France, Germany, Hungary, Italy, the Netherlands,
Norway, Poland, Portugal, Romania, Slovak Republic, Slovenia, Spain, Sweden and the United Kingdom.

8
Figure 2. Industry evolution, 2000-2014.
Source: CEPI key statistics, 2014.
There has been a steady decrease in the number of companies and the number of
paper mills in the European Union since 2000. Technological innovation has reduced
labour intensity, which has resulted in reduced employment and increased industry
consolidation. Compared to 2000, the number of companies has decreased by 31%,
the number of pulp mills has been reduced by 32%, and the number of paper and
paperboard mills has decreased by 30% (see Table 1). This decrease was slightly
more noticeable during the financial crisis, while a more stable trend has existed
since 2012. According to (CEPI, 2011), consolidation will continue with small and
medium enterprises supplying local markets.
Table 1. Sector Progress 2000-2014.
Industry Structure 2000 2013 2014 % Change
2014/2013 2014/2000
Number of Companies 929 636 628 -1.3% -32.4%
Number of Mills 1,309 941 920 -2.2% -29.7%
Pulp 233 164 159 -3.0% -31.8%
Paper and Board 1,076 777 761 -2.1% -29.3%
Number of Paper Machines 1,858 1,307 1,283 -1.8% -30.9%
Employment (Jobs) 279,987 183,690 181,111 -1.4% -35.3%
Turnover (Million Euros) 79,388 74,987 74,500 -0.6% -6.2%
Investments (Million Euros) 5,637 3,431 3,500 2.0% -37.9%
Added Value (Million Euros) 24,413 16,500 16,000 -3.0% -34.5%
Pulp Production (Million tonnes) 40.0 37.3 36.5 -2.0% -8.8%
Paper Production (Million tonnes) 92.0 91.1 91.0 -0.1% -1.1%
Source: CEPI Key Statistics, 2014.
10 000
20 000
30 000
40 000
50 000
60 000
70 000
80 000
90 000
100 000
110 000
500
700
900
1 100
1 300
1 500
1 700
1 900
Pro
du
ctio
n (
tho
uan
ds
of
ton
ne
s)
Nu
mb
er
of
Co
mp
anie
s/M
ills/
Pap
er
Mac
hin
es
Number of Companies Number of Mills
Number of Paper Machines Paper Production
Pulp Production Paper Consumption
Pulp Consumption

9
Pulp
In 2014, total European pulp production was 36.5 million tonnes, of which Sweden
and Finland contributed the largest shares: 32% and 28%, respectively (Figure 3).
Germany and Portugal are also large producers, each contributing 7% of the total
European pulp produced. The remaining 26% is spread across 14 countries.
Figure 3. Pulp Production by Country, 2014.
Source: CEPI Key Statistics, 2014.
About a third of the pulp produced in Europe today is market pulp with the rest
produced in integrated mills. Within Europe, 72% of total pulp is made from chemical
pulping (see Table 2).
Table 2. Total pulp production in Europe by production process, 2014.
Pulp production
process
Total
Production
(Mt) Share (%)
Chemical pulp 26.264 71.9
Mechanical pulp 10.109 27.7
Other pulp 0.172 0.5
Total 36.545 100
Source: CEPI Key Statistics, 2014.
Globally the production of pulp is led by North America, which accounts for over one-
third of the pulp production and generates an excess supply of 5%. Europe and Asia
follow, each with close to one fourth of global pulp production (see Figure 4). The
overall production of pulp in 2014 equalled 178.5 million tonnes, with total
consumption equalling 179.6 million tonnes.
32%
28%
7%
7%
5%
5%
4%
3% 9% Sweden
Finland
Portugal
Germany
Spain
France
Austria
Poland
Rest of CEPI Countries

10
Figure 4. Pulp Production and Consumption by Region (worldwide), 2014.
Source: CEPI Key Statistics 2014.
Based on a survey by the Food and Agriculture Organization (FAO, 2015), stable
trends for pulp production are expected over the next five years. Specifically, global
capacity is expected to increase 5.9%, while European capacity is expected to
increase only 1.6%. Global capacity growth is driven largely by Brazil and Russia,
which expect a 48% and 18% expansion, respectively. Despite lower European
capacity growth as a whole, large capacity growth is expected in France and Spain of
14% and 8%, respectively.
Paper
Total European paper and board production was 91.1 million tonnes in 2014. In that
year Germany was the leading country for paper production with 25% of the
production, while Sweden and Finland each provided 11% (Figure 5). These three
countries combined accounted for almost half of the European paper production.
Figure 5 also shows other important producers: Italy (10%), France (9%) and Spain
(7%).
0%
5%
10%
15%
20%
25%
30%
35%
40%
45%
50%
Europe North America
Asia Latin America Rest of the World
Pro
du
ctio
n/C
on
sum
pti
on
Production Consumption

11
Figure 5. Paper and Board Production, CEPI Countries, 2014.
Source: CEPI Key Statistics, 2014.
Globally, the production of paper and board in 2014 was 406 million tonnes, with
407.6 million tonnes consumed. Asia is the leader in both production and
consumption with about 45% in both categories (see Figure 6). European production
represents 26%. In contrast to the pulp sector, in Europe paper and paperboard
production is slightly higher than its consumption. In term of future capacity, future
trends in the paper and board industry show a stable production over the next five
years (FAO, 2015).
Figure 6. Paper & Paperboard Production and Consumption by
Region (worldwide), 2014.
Source: CEPI Key Statistics, 2014.
Figure 7 describes the shares of different paper grades in European paper. Packaging
paper represents almost half of all paper products consumed. Graphic papers and
25%
11%
11% 10%
9%
7%
5%
5%
17%
Germany
Sweden
Finland
Italy
France
Spain
Austria
United Kingdom
Rest of CEPI Countries
0%
5%
10%
15%
20%
25%
30%
35%
40%
45%
50%
Europe North America Asia Latin America Rest of the World
Pro
du
ctio
n/C
on
sum
pti
on
Production Consumption

12
newsprint consume 29% and 9%, respectively. Sanitary and household paper
products represent only 9% of consumption. However, this paper grade is expected to
increase due to changes in consumption patterns associated with the ageing
population. Conversely, newsprint and other graphic papers are expected to decline in
more developed digitalized economies. However, this decline could be offset by
increased demand for graphic papers by emerging economies (Hetemäki, et al.,
2014).
Figure 7. CEPI countries paper consumption in tonnes, by paper grade, 2014.
Source: CEPI Key Statistics, 2014.
2.3. International trade
There is significant international trading with pulp and paper products. In short,
Europe mainly imports low quality products, such as market pulp and newsprints,
while exporting high quality products such as coated paper. Key trends in
international trade are discussed below.
Pulp
Europe imports considerably more pulp than it exports. Trade of pulp between Europe
and the rest of the world is mainly focused in exports to Asia and imports from Latin
America and North America (Figure 8). Comparison between years shows that Europe
has shifted away from imports from North America toward Latin America.
Furthermore, exports of pulp to Asia have increased since 2000. Finally, total net pulp
imports have decreased by around 2 million tonnes since 2000 to a total value of 4.7
million in 2014.
9%
29%
9%
32%
4%
7%
5% 5%
Newsprint
Other Graphic Papers
Sanitary & Household
Case Materials
Wrappings
Carton Board
Other P&B for Packaging
Other Paper and Board

13
Figure 8. EU Pulp Net Imports by region, 2000-2014.
Source: CEPI Key Statistics, 2014.
Note: CEPI Countries only. Trade flows between European countries not represented here.
Paper
In contrast to pulp, Europe exports around 9 million tonnes more paper than it
imports. Net exports have grown steadily over the last decade, with net exports in
2014 almost double that of 2000. Growth has been enjoyed in the Asian, Latin
American and Rest of the World markets (Figure 9). While net exports are relatively
low for North America, this is not to suggest that there is little trade between the
regions. In fact, trade flows between North America and Europe totalled almost 3.5
million tonnes in 2013, with European exports offsetting imports from North America
by around half a million tonnes.
Figure 9. EU Paper and Paperboard Net Exports by Region, 2000-2014.
Source: CEPI Key Statistics, 2014.
Note: CEPI Countries only. Trade flows between European countries not represented
here.
-3
-2
-1
0
1
2
3
4
5
6
2000 2005 2010 2014 Ne
t P
ulp
Imp
ort
s (M
t)
North America
Latin America
Asia
Rest of the World
0
1
1
2
2
3
3
4
4
5
5
2000 2005 2010 2014
Pap
er
Ne
t Ex
po
rts
(Mt)
North America
Latin America
Asia
Rest of the World

14
2.4. Energy intensity
Globally, the pulp and paper industry is the fourth largest industrial energy consumer
(IEA, 2008) after iron and steel, chemicals, and non-metallic minerals. Production of
pulp and paper requires energy input in the form of heat and electricity. On average,
energy costs make up 16% of production costs (CEPI, 2014), but can be as high as
30% at specific sites. Therefore, rising energy costs are a concern for the industry.
Based on overall totals of energy and production data, specific primary energy use in
the European pulp and paper industry was 13.3 GJ per tonne market pulp and paper
and paperboard. This includes 1.8 GJ per tonne of specific net bought electricity. In
2013, the industry produced 51% of the electricity it consumed (CEPI, 2014). Most of
the electricity produced (96%) originates from Combined Heat and Power (CHP)
generation. It has, however, been estimated that only 40% of CHP potential is
installed (JRC, 2011).
At the European level more than half of the energy used by the industry originates
from biomass, with most of the rest coming from natural gas (see Figure 10). The
pulp and paper sector is one of the largest producers of bioenergy, generating 20% of
bioenergy used in Europe (CEPI, 2012). That said, energy sources vary for different
countries, depending on, above all, availability of biomass (see Table 3). Sweden,
Portugal and Finland have the highest share of biomass in the fuel mix while Italy, the
Netherlands and the UK have the lowest.
Figure 10. Fuels consumption in 2013
Source: CEPI Key Statistics, 2014.
Biomass, 56.5%
Other, 0.5%
Other fossil fuel, 0.9%
Gas, 36.2%
Coal, 3.6% Fuel oil, 2.3%

15
Table 3. Average fuel mix in selected EU countries for the period 2005-2007
Coal Gas Fuel oil Other
fossil
Biomass Waste
Austria 7% 45% 2% 0% 46% 0%
Belgium 7% 33% 11% 1% 48% 0%
Czech Republic 16% 19% 5% 0% 59% 0%
Finland 0% 14% 4% 6% 73% 2%
France 5% 40% 5% 0% 51% 0%
Germany 13% 62% 2% NA 21% 2%
Italy 0% 95% 5% 0% 0% 0%
Netherlands 0% 97% 0% 0% 2% 0%
Poland 25% 3% 4% 0% 69% 0%
Portugal 0% 15% 10% 1% 74% 0%
Slovakia 18% 23% 0% 0% 59% 0%
Spain 1% 62% 5% 0% 32% 0%
Sweden 0% 1% 9% 1% 89% 0%
UK 6% 88% 1% 0% 5% 0%
Source: Ecofys, 2009.
Energy use in pulp production
Energy use in the pulping production process depends on the particular pulping
process, properties of the raw material and the quality demands of the end product
(Ecofys, 2009).
There are several types of processes that can be used for mechanical pulping (see
Table 4). Only a fraction of the mechanical energy supplied to the process is used for
pulping. Therefore heat is recovered in the form of hot water and steam. This heat can
be used for other purposes in the processes e.g. drying in the paper machine or
generating hot steam for use in the paper machine (for integrated mills) or in district
heating. According to Ecofys (2009), the Thermo-mechanical pulp (TMP) process can
be a net energy exporting process.
Table 4. Energy consumption and recovery of energy in mechanical pulping.
Mechanical pulping technology Energy
consumption
(kWh/t) for oven
dry pulp1
Recoverable energy
(hot water) %
Recoverable energy
(steam) %2
Groundwood pulp 1100-2300 20-30 20
Thermo-mechanical pulp (TMP) 1800-3600 20 40-80
Chemi-thermo-mechanical pulp 1000-4300 20 40-45
Source: 1Ecofys, 2009; 2BREF, 2013
The specific energy consumption in chemical pulping varies depending on the
process used. Both Kraft pulping and Sulphite pulping are energy-intensive, but the
Sulphite process demands greater fuel input (see Table 5). In both the Kraft process
and the Sulphite pulping process, energy can be recovered. Modern non-integrated
Kraft pulp mills are energy-self-sufficient, primarily because of energy recovery when

16
burning the by-products such as bark and black liquor as a fuel (BREF, 2013). For
Kraft pulping, lime kiln is an integral part of the process, which can result in
emissions from the use of fossil fuel, but also process emissions. Sulphite pulp mills
are around 90% self-sufficient, mainly because of energy recovery from burning
incoming wood and the use of auxiliary boiler fuel (BREF, 2013).
Table 5. Best-practice specific heat consumption for the production of
virgin pulp.
Chemical pulping technology Heat consumption1
(kWh/adt)2
Electricity
consumption (kWh/t)3
The Kraft (sulphate) process 2777-3888 600-800
Bleached Sulphite pulp 4444-5000 550-750
1Converted from GJ/Adt to kWh/adt
2Source: Ecofys, 2009
3Source: BREF, 2013
To give an example of energy distribution in pulp mills, for bleached Kraft pulp
making, the major heat consumption steps are the cooking process (15%),
evaporation (30%) and pulp drying (20%) (Ecofys, 2009). Pulp drying is, however,
avoided in an integrated mill.
Recycled paper is often used as input in integrated pulp and paper mills. Recovered
fibres account for more than 50% of the total raw materials for European paper
manufacturing (CEPI, 2014). For pulping of recycled paper, cleaning of contamination
is needed and sometime deinking, depending on the end product. Processing of
recycled fibre requires energy use, with the average heat demand at about 0.3 GJ/adt
(Ecofys, 2009).
Energy use in paper production
Energy intensity varies between different technologies and paper products. Energy use
in the papermaking process is concentrated in the paper machine. The energy use
depends, among other things, on the specific grade of paper to be produced and the
fibre quality (Ecofys, 2009). Tissue products and coated fine paper have the highest
final energy intensity (see Table 6).

17
Table 6. Final energy intensity for different paper products (excluding electricity use)
Raw material Product Process Fuel use for steam
(kWh/Adt)1
Recovered paper Recovered paper processing 83
pulp Uncoated fine paper Paper machine 1800-2500
Coated fine paper Paper machine 1944-3055
Tissue mill Paper machine 1527-2083
Newsprint Paper machine 1416
Board Paper machine 1861
Containerboard Paper machine 1638
1Converted from GJ/Adt
Source: Ecofys, 2009
An example of energy use in the different processes in papermaking is provided in
Table 7. The table illustrates average specific energy consumption, focusing on the
papermaking process only, for different products with virgin pulp and recovered pulp
as input in the Netherlands. Pre-drying is the most energy intensive process
representing on average 49% of all energy use.
Table 7 Average specific energy consumption per process for four different paper grades in
the Netherlands
Deinking
(GJ/adt)
Dispersion
(GJ/adt)
Other
stock
prep
(GJ/a
dt)
Wire and
press
(GJ/adt)
Pre-
drying
(GJ/adt)
Coating/
sizing/
laminati
ng
(GJ/adt)
After
drying
(GJ/adt)
Other
processe
s paper
machine
(GJ/adt)
Total
(GJ/adt)
Board 0 0 1.0 1.5 4.5 0 0.3 0.3 7.5
Graphical 0 0 2.8 1.5 4.7 0.2 2.6 0.7 12.5
Tissue 0.8 1.5 3.3 1.9 6.9 0 0.0 0.3 14.7
Other 0.6 0.4 1.1 1.5 4.9 0.1 0.5 0.4 9.4
Source: Laurijssen et al, 2013
Energy use in integrated production
Integration of pulp and paper mills results in energy savings due to reduced need for
drying the pulp and opportunities for better heat integration (Worrell, 2007). Table 8
illustrates energy intensity values for different products in an integrated pulp and
paper mill.

18
Table 8. World Best Practice Final Energy Intensity Values for Integrated Pulp and Paper Mills (values are per air dried metric tonnes)
Raw material Product Process Fuel use for steam
(KWh/adt)1
Electricity
(kWh/adt)
Wood Bleached Uncoated
Fine
Kraft 3889 1200
Kraftliner and bag
paper
Kraft 3889 1000
Bleached Coated Fine Sulphite 4722 1500
Bleached Uncoated
Fine
Sulphite 5000 1200
Newsprint Thermo-
mechanical
process
-361 2200
Magazine paper TMP -83 2100
Board TMP 972 2300
Recovered
paper
Board (no deinking) 2222 900
Newsprint 1111 1000
Tissue (deinked) 1944 1200
Source: Worell, 2007
3. Low-carbon technologies: options and incentives
3.1. Technical options for mitigation
Emissions of greenhouse gases in the pulp and paper industry come mostly from the
combustion of on-site fuels and non-energy related emission sources (for example, by-
product emissions from the lime kiln chemical reactions and emissions from
wastewater treatment). In addition, emissions of GHG associated with the off-site
generation of steam and electricity contribute to the indirect emissions of the pulp
and paper sector.
Although the industry is energy intensive, carbon intensity is relatively low compared
to other sectors, since biomass dominates the fuel mix. In 2013, the sector was
responsible for around 43 million tonnes of CO2, of which 33.2 million were direct
emissions and 9.8 million were indirect (through power use, see Figure 11). When
production levels are taken into account, this translates to a direct emissions intensity
of 0.32 (kt CO2/kt product)3 and an indirect emissions intensity of 0.1 (kt CO2/kt
product).
3 CO2 Emissions are the fossil emissions produced by the pulp and paper mills and connected energy
plants.
19
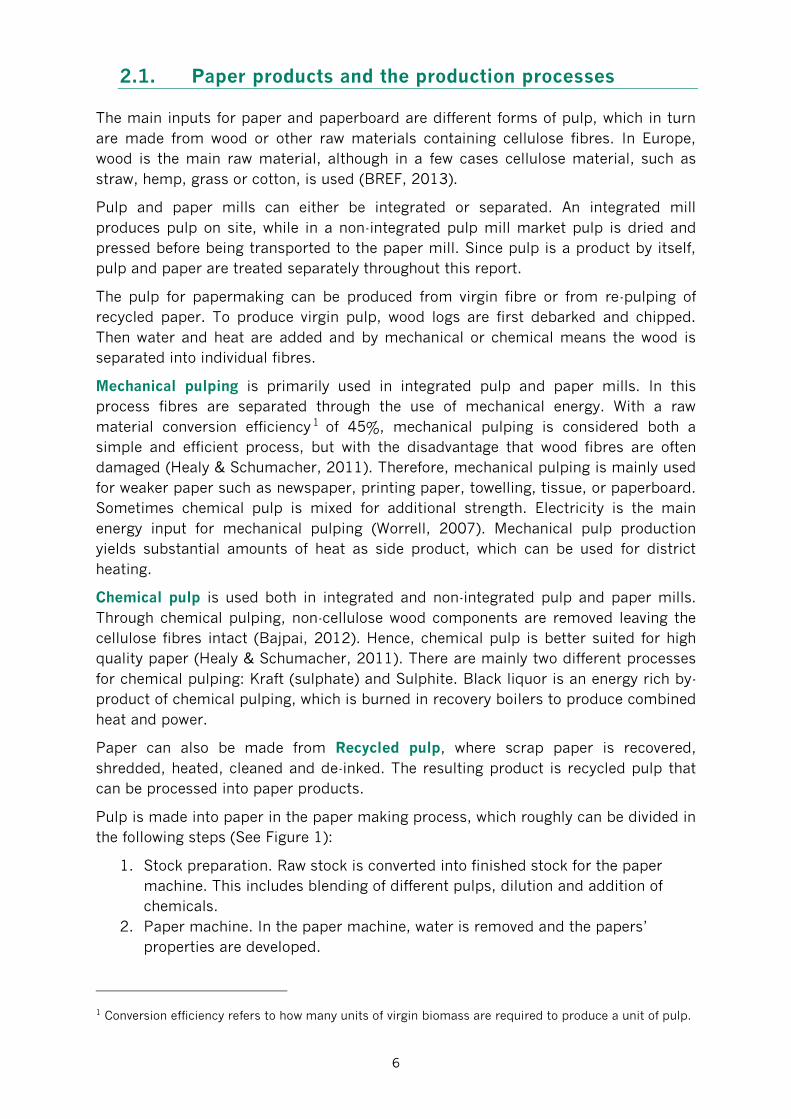
Despite increasing production, the sector has achieved a 20% reduction in CO2
emission intensity since 2000 (Figure 11). The sections that follow discuss how
adoption of more efficient technologies, fuel-mix change and increased recycling has
assisted the sector to decarbonise. We then turn to address breakthrough
technologies that could assist the sector achieve more ambitious mitigation targets.
Figure 11. Emissions from pulp and paper Production, 1991 - 2013.
Source: CEPI Key Statistics, 2014.
3.1.1. Enhancing energy efficiency in conventional production processes
Opportunities for mitigation
Within the pulp and paper sector, implementing Best Available Technologies (BATs)
offers emission reduction opportunities. The opportunities can be divided to (1)
improving the carbon efficiency of the current machinery stock; (2) production
process changes; and (3) new and more efficient machinery. In particular, the carbon
efficiency of the current machinery stock can be improved by improving the energy
efficiency. Many of these BATs have low to medium investment costs with relatively
short payback periods. As an example, it is estimated that upgrades to burners and
burner controls could reduce emissions in the United Kingdom pulp and paper sector
by 2.4% and have a modest payback period of around a year and a half (WSP, 2015).
The production process changes include, for example, shifts to less energy intensive
pulping. The mitigation options that require a replacement of the machinery stock, for
example boilers that can also use renewable electricity4 or improved paper machines
4 Boilers that are powered from electricity.
0
0,1
0,2
0,3
0,4
0,5
0,6
1991 2000 2005 2010 2011 2012 2013
Kt
CO
2/k
t o
f p
rod
uct
Direct CO2 Emissions Indirect CO2 Emissions
20
can be expected to come to markets over the coming decades. According to CEPI
(2011), the full adoption of BAT should be complete by 2050 and will result in a 25%
emissions reduction compared to 2010. A summary of BAT and the expected
emission reductions is found in table 9 below.
Improved processes control can also enhance the performance of existing equipment
by optimising the energy use to production ratio. According to (WSP, 2015) improved
process control could reduce variability in energy consumption over the operating
time of a paper mill while at the same time increasing production.
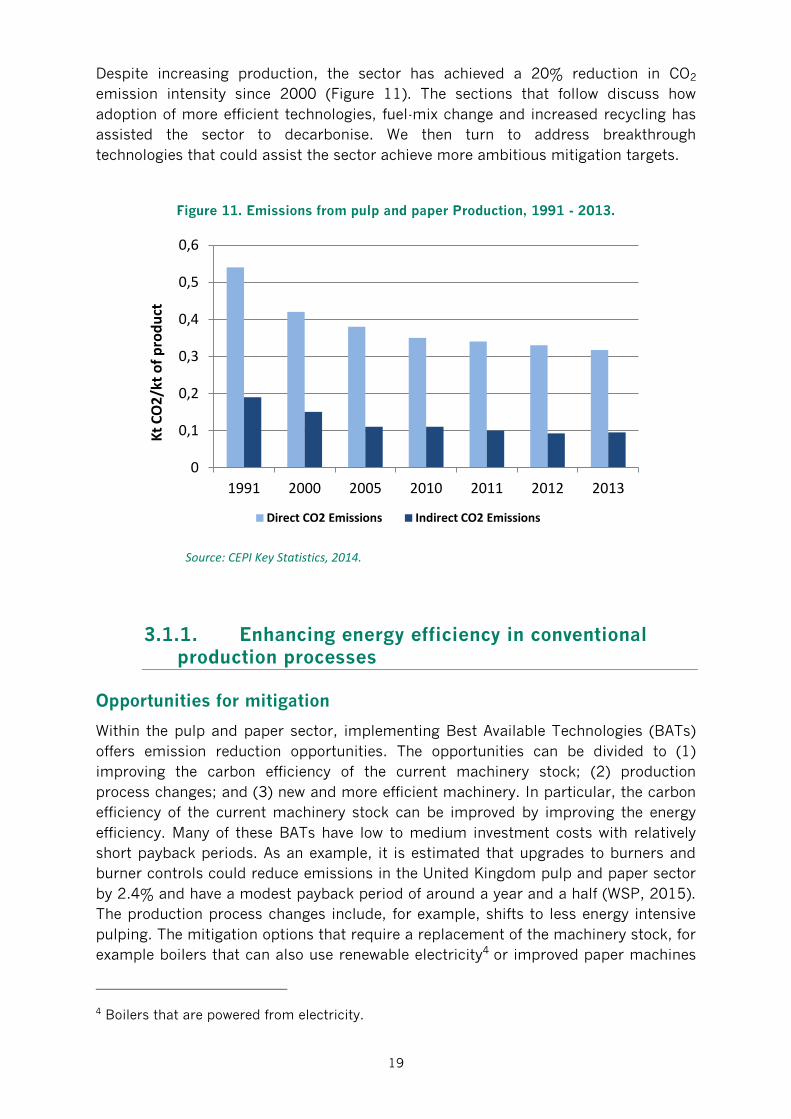
Figure 12. European power prices 2004 to 2014.
Source: EEX Spot, APX Power UK Spot Base Load Index, EPEX SPOT, OMEL-Elec. Spain Baseload

21
Table 9. Available technologies for pulp and paper production processes.
Process Mitigation options Reduction
potential
Boilers
Burner replacement, Boiler process control,
Reduction of excess air, Blow down steam
recovery
12.5% Emissions
Chemical Recovery
Furnaces
Black liquor solids concentration, Quaternary air
injection, Improved composite tubes for recovery
furnaces
30% Energy
20% Fuel5
Turbines Boiler/steam turbine CHP, Combined cycle CHP,
Steam injected gas turbines
14% Electricity
Natural-Gas Fired Dryers
and Thermal Oxidizers
Selection of technologies requiring less fuel
consumption, Proper design and attention to
monitoring and maintenance
Kraft and Soda Lime Kilns Piping of stack gas to adjacent PCC plant, Lime
kiln oxygen enrichment
7-12% Fuel
Makeup Chemicals
Practices to ensure good chemical recovery
rates in the pulping and chemical recovery
processes
40% Energy
Flue Gas Desulfurization
Systems
Use of sorbents other than carbonates, Use of
lower-emitting FGD systems
Wastewater Treatment
Use of mechanical clarifiers or aerobic biological
treatment systems (instead of anaerobic
treatment systems), Minimization of potential
for formation of anaerobic zones in wastewater
treatment systems
On-site Landfills
Dewatering and burning of wastewater treatment
plant residuals in on-site boiler, Capture and
control of landfill gas by burning it in onsite
combustion device (e.g., boilers) for energy
recovery and solid waste management
Sources: (CEPI, 2011) & (Ernest Orlando Lawrence Berkeley National Laboratory, 2009)
Key Drivers
As European paper manufactures face an increasingly competitive environment, they
will seek to reduce production costs, including energy costs. As detailed in Figure 12,
electricity prices have been volatile since the turn of the century and are on an upward
trend. Given the energy intensity of the sector, European paper manufactures are
exposed to both electricity price increases and price hikes. In response to these
competitive challenges, fuel mix change, shifting away from fossil fuel based
electricity (discussed below), reducing energy consumption and optimising energy use
across the production process has occured.
Ericsson et al. (2011) assess the impact of increasing electricity prices on the
Swedish pulp and paper sector. According to the authors, increased electricity prices
triggered the industry to develop new energy strategies and may explain the increased
5Industrial Efficiency Technology Database: http://ietd.iipnetwork.org/content/pulp-and-paper

22
investments in onsite electricity, in combination with other factors such as the green
certificate system. For example, the industry’s onsite electricity production increased
from 851 MWh in 2000 to 1060 MWh in 2007 (Ericsson, et al., 2011). In addition, the
industry supplied a greater share of heat delivery to municipal district heating.
The pulp and paper sector is also covered under the EU ETS. At the current prices
below 10 € /tonne CO2 it is difficult to assess to what extent carbon prices affect
investments in BAT. For example Rogge et al. (2011) state that the EU ETS has had a
very limited impact on the innovation activities of German pulp and paper sector.
Although the EU ETS has not to date had a significant effect on carbon mitigation
measures, it has played a role in mitigation in the sector. For example a study by
Gulbrandsen & Stenqvist (2013) highlights that even though EU ETS has not triggered
innovation for low carbon solutions, it has reinforced commitments to improve energy
efficiency and reduce carbon dioxide emissions. Moreover, activities for monitoring
and accounting for CO2-prices have become more significant. In that way, the EU ETS
can have a signal value. With the introduction of the Market Stability Reserve, the EU
has shown that it is committed to reducing carbon emissions and that carbon pricing
is here to stay (European Union, 2014).
National policies have also driven adoption of more efficient production technologies
as well as the increased public focus on climate mitigation. Sweden offers an
informative example. Increased energy efficiency and increased use of locally
produced bioenergy, such as bark, are the main reasons for the dramatic decrease of
carbon emissions in the Swedish pulp and paper industry. However, it is unclear if
this development has been driven by energy efficiency policies. The Swedish Program
for Improving Energy Efficiency (PFE) was a voluntary agreement for electricity
intensive industries.6 Participating industries received a tax reduction on electricity in
exchange for improvements in electricity efficiency. For the pulp and paper industry
the program resulted in energy audits that led to process innovations and
strengthened environmental management system (Scoradato, et al., 2013). Scorado
et al. (2013) note that the PFE resulted in significant investments from the industry,
according to the Swedish Energy Agency. Investments of € 36 million took place
during the first phase, 2004-2009. The effect from the program is, however, debated
and it is unclear whether the investments would have taken place even without
participation in the program. Swedish industry representatives explain that these
investments probably would have happened anyway but took place earlier because of
the PFE.
In a comprehensive study of the United Kingdom paper industry, three barriers to the
adoption of BAT were identified (WSP, 2015). First, uncertainty regarding the impact
of new technologies on machine operability, with known technologies being favoured
in new investment choices. This is linked to the integrate nature of the paper machine
where many parts must operate in sync, making incremental adjustments with new
technologies difficult. Second, a lack of awareness and limited access to information
regarding new technologies and their performance. Third, a lack of skilled labour
6 The program was introduced in 2005, but repealed in 2012.

23
necessary to operate new machines and processes also acts as a barrier to adoption
of BAT.
3.1.2. Fuel Mix Change
Opportunities for mitigation
Since 2000 the industry has changed the composition of its fuel mix, increasing the
use of biomass and decreasing reliance on fuel oil and, to a small degree, coal (Figure
13). This shift in fuel mix has contributed to the decrease in carbon intensity within
the sector.
There exists opportunities to further increase the use of bioenergy within the
European pulp and paper sector. For example, switching from fossil fuels to bioenergy
in lime kilns is estimated to reduce European emissions by 5-6Mt CO2 by 2050.
Biomass CHP in sawmills and panel-board production can render these facilities
energy self-sufficient and almost carbon neutral, reducing emissions by an estimated
1-2 Mt CO2 (by 2050) (CEPI, 2011). However, the pulp and paper industry is currently
competing with the European energy sector and potentially in the future also with
other sectors like transport for the same bio-energy resources.
In addition, emerging technologies will facilitate bio-refineries to be integrated with
pulp and paper production. Within a bio-refinery, the residual wood, virgin biomass or
by-products of the processes can be used to produce energy products such as
electricity or transportation fuels, and other bio-based products such as biochemical.
For example, black liquor gasification in pulp mills is a process of creating clean
syngas from the biomass contained within black liquor (a by-product from pulp
production). The syngas can then be used in boilers and in combined cycle processes
to generate on-site electricity, steam or in the production of transportation fuels
(Kramer, et al., 2009). Other technologies could also extract value from black liquor,
for example lignin extraction. Further integration of bio-refineries with pulp and paper
mills should increase the conversion efficiency of raw materials.

24
Figure 13. European pulp and paper fuel mix, 2000 to 2013.
Source: CEPI Key Statistics, 2014.
Key Drivers
Sweden has a higher share of biomass in the pulp and paper fuel mix than any other
EU country (89%). A study by Thollander & Ottoson (2008), shows that the Swedish
green certificate system has been key to increasing the share of biomass in Sweden.
The green certificate system was introduced in 2003 with the objective of increasing
the production of renewable electricity. Electricity producers receive one green
certificate for each MWh produced from renewable sources. New installations receive
certificates for 15 years. The certificates are then traded on an open market.
Purchasers are Swedish or Norwegian parties with quota obligations (e.g. electricity
distributors). In a study by Ericsson et al. (2011), the green certificate system was
described as crucial for investments in electricity production from biomass in the
pulp and paper industry. Companies have benefited from this program since they are
excluded from the obligation to surrender certificates for power acquired on wholesale
markets and can generate certificates with their own power production that they can
sell to third parties. The system has, however, been criticized for not driving technical
development, which was one of the purposes with the system (Bergek & Jacbosson,
2010). In addition, other EU member states have implemented renewable energy
support mechanisms that cover bio-energy for power generation.
Most European member states have implemented support mechanisms for the power
production in combined heat and power installations. CHP installations either receive
some form of feed-in tariff or premium payments for the electricity they produce or
investment subsidies (Austria, Belgium, Bulgaria, Czech Republic, Cyprus, Finland,
Germany, Greece, Ireland), excise duty exemption, energy tax exemption (Belgium,
0
200 000
400 000
600 000
800 000
1 000 000
1 200 000
1 400 000
1991 2000 2005 2010 2013
Tj
BIOMASS GAS FUEL OIL COAL OTHER FOSSIL FUELS OTHER
25
Finland, Germany, UK), preferential treatment for grid access (Estonia, Slovakia,
Bulgaria), or fuel subsidy (gas used as input fuel for CHP in Bulgaria, wood chips in
Finland)(COGEN 2007a).
The full decarbonisation potential of biomass for the pulp and paper sector is unclear.
While potential exists for increased fuel switching and better use of waste streams,
the availability and cost of feedstock is uncertain. Indeed power generation for the
grid or in other industrial sectors as well use in other sectors including domestic
heating and transport will compete for the same, limited resources. Bioenergy policy
will need to be developed with careful consideration of the economy wide trade-offs in
the allocation of biomass feed stocks.
3.1.3. Increased recycling
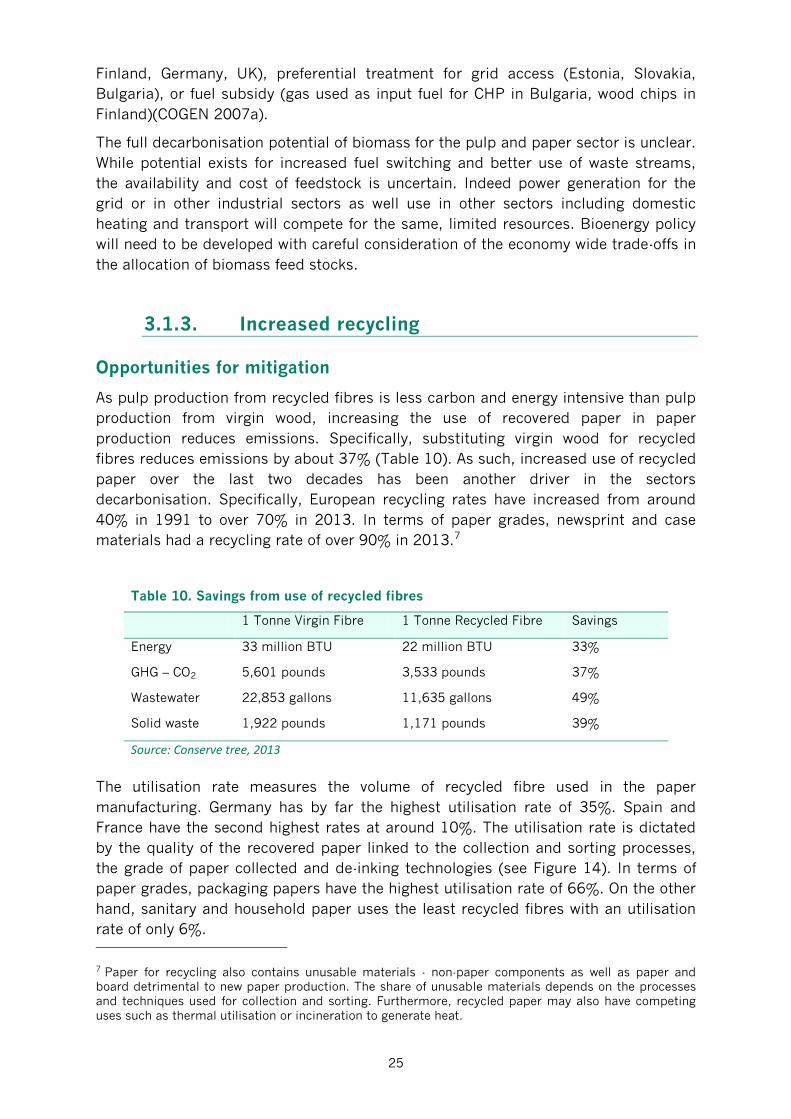
Opportunities for mitigation
As pulp production from recycled fibres is less carbon and energy intensive than pulp
production from virgin wood, increasing the use of recovered paper in paper
production reduces emissions. Specifically, substituting virgin wood for recycled
fibres reduces emissions by about 37% (Table 10). As such, increased use of recycled
paper over the last two decades has been another driver in the sectors
decarbonisation. Specifically, European recycling rates have increased from around
40% in 1991 to over 70% in 2013. In terms of paper grades, newsprint and case
materials had a recycling rate of over 90% in 2013.7
Table 10. Savings from use of recycled fibres
1 Tonne Virgin Fibre 1 Tonne Recycled Fibre Savings
Energy 33 million BTU 22 million BTU 33%
GHG – CO2 5,601 pounds 3,533 pounds 37%
Wastewater 22,853 gallons 11,635 gallons 49%
Solid waste 1,922 pounds 1,171 pounds 39%
Source: Conserve tree, 2013
The utilisation rate measures the volume of recycled fibre used in the paper
manufacturing. Germany has by far the highest utilisation rate of 35%. Spain and
France have the second highest rates at around 10%. The utilisation rate is dictated
by the quality of the recovered paper linked to the collection and sorting processes,
the grade of paper collected and de-inking technologies (see Figure 14). In terms of
paper grades, packaging papers have the highest utilisation rate of 66%. On the other
hand, sanitary and household paper uses the least recycled fibres with an utilisation
rate of only 6%.
7 Paper for recycling also contains unusable materials - non-paper components as well as paper and
board detrimental to new paper production. The share of unusable materials depends on the processes
and techniques used for collection and sorting. Furthermore, recycled paper may also have competing
uses such as thermal utilisation or incineration to generate heat.

26
Figure 14. Utilization, net trade and recycling rates in Europe, 1991-2014.
Source: CEPI, 2014b
Since 2001, Europe has exported an increasing share of paper for recycling. Exports
are not consistent across countries with the UK, France and Italy exporting the largest
share. A number of countries, including Germany, Austria and Spain, are net
importers of recovered paper. In 2013, European exports of paper for recycling were
around 10 million tonnes, with 95% flowing to Asia. This reflects the fact that
recovered paper collection has been increasing faster than utilisation. However, not all
trade is driven by market fundamentals, but also reflects the large capacity of empty
ships returning to Asia after importing goods to Europe. Maintaining these fibres in
Europe would increase the stock of recycled fibres available for low emission pulp
production.
Key Drivers
The increase in the use of recycled paper can be attributed to cost savings in paper
production as well as a broad range of dedicated recycling policies. Recovered paper
represents a valuable input into the paper making processes. Indeed the price of
recovered newspapers increased from around €90 per tonne in 2006 to over €120 per
tonne in 2011 (UNECE/FAO, 2012), increasing the incentive for waste collection
facilities to recover and sell the material.

27
Public policy and social suasion has also been important. The European Commission
proposes an 75% recycling goal for European countries by 2025 (European
Commission, 2015a). As not all paper is collectable or suitable for recycling, this
reflects the upper bound of what is possible for the sector. The revision to the
European Standards for paper and paperboard recycling has contributed to increased
recycling rates. The shortcomings found in the previous standard included zero
tolerance levels for non-paper components and unusable material, missing detailed
grade descriptions, and a need for adaptation to market realities (new grades, out-
dated grades).
Demand driven policies, such as the “Blue Angel” eco-label in Germany, have been
successful in providing environmentally conscience consumers options to consume
recycled paper. Separate collection targets for municipal waste as well as landfill and
incineration restrictions for recovered paper have also contributed to increased
recycling rates.
In addition increased recycling has been facilitated through technological advances in
pulp production. Specifically, a new process to re-pulp wet-strength paper, the
implementation of scorecards on de-inkability, and removability of adhesive
applications has increased the number of times fibres can be reused (ERPC, 2013).
The changing structure of the paper market could create barriers to further increasing
recycling rates. Digitalization reduces the use of newspapers and other highly
recyclable papers, such as telephone catalogues and directories. Accordingly,
newspaper grades that are easily recovered and reused are declining in the share of
overall paper product consumption. Conversely, packaging papers are increasing their
share from 40.8% in 1992 to 47.5% in 2013 (CEPI, 2014), but are less suitable for
reuse due to contaminations.
3.1.4. Breakthrough technologies
Technologies used today will be insufficient to achieve the level of emissions
reductions that is envisaged by the European Commission. New technologies are
required. The Two Team project was an initiative by CEPI that, following the 2050
CEPI roadmap, gave two research teams the challenge of developing breakthrough
technologies in paper and paperboard production (CEPI, 2013). The breakthrough
technologies emerging from the project are summarised in the points that follow.
Deep Eutectic Solvents (DES) Pulping: DES are produced naturally by plants and can
break down wood and selectively extract cellulose fibres required in the paper making
process. Therefore it offers a new concept for pulping that does not rely on high heat
and energy inputs. With further research, as cellulose is soluble in DES, they could
also be used to recover cellulose from waste and dissolve ink residues in recovered
paper. It is estimated that DES pulping could reduce emissions by 20% compared to
2011.
Flash condensing with Steam: Large dry fibres are blasted into a forming zone with
agitated steam and condensed into a web using one/thousandth of the volume of
water used today. High gas velocities make the paper forming section very short, with

28
little extra heating required for drying, as water content after the process is greatly
reduced. The process is most readily applicable to virgin fibres produced with
chemical pulping, but can also be applied to recovered and mechanically pulped
fibres. Emissions savings come from the greatly reduced water volumes used in the
forming process and hence the reduced drying requirements. If applied across the
sector, the process could reduce emissions by up to 50% compared to 2011 levels.
Dry-pulp for cure-formed paper: this innovation introduces two technologies that
allow for the production of paper without the use of water. First, a new dry pulp
technology, where fibres are treated to protect them from shear, and then suspended
in a viscous solution at up to 40% concentration. The solution is then pressed out and
the thin sheet cured with a choice of additives to deliver the end-product required.
The process removes the use of water and therefore eliminates emissions associated
with drying and effluent treatment (around 55% total emissions).
Supercritical CO2: can be foremost used to dry paper with vast reductions in energy
requirements. Second, it can be used to remove containments from recycled paper
and therefore increase utilisation rates. Emissions savings are estimated at 45%
compared to 2011 levels, because of reduced steam and heat use in the drying
process.
100% Electricity: Using electricity rather than fossil fuel power to generate heat will
cut all CO2 emissions as the power sector shifts to renewable energy. The sector
would also provide a buffer and storage capacity for the grid, storing energy as
hydrogen or pulp. The concept can be introduced incrementally, by first replacing
gas-fired boilers with electric boilers. As technologies develop, heat and steam dryers
can be replaced with electrified dryers. Electricity can be used to develop Thermo
Mechanical Pulp (TMP) and Hydrogen. At times of peak electricity demand, the
Hydrogen can be used to drive turbines and generate electricity for the grid. With the
current power mix, 100% electrification would reduce emissions by 20%. The greater
the share of renewables in the grid is, the larger the potential for decarbonisation of
this breakthrough technology.
Functional Surface: the idea is to reduce the weight of paper without impacting its
quality or structure. Advances in sheet formation and new cocktails of raw materials
will lead the way to the lightweight papers. Lighter weight paper is then easier and
less energy intensive to dry.
Steam: rather than allowing heat and energy to escape as hot air, temperature and
humidity are increased to form pure vapour. At this point, the vapour can be collected,
thus heat and energy are not lost from the system. The steam is then used in the
paper making process. With full implementation, emissions could be reduced by half
compared to 2011.

29
Key Drivers
The NER 300 program 8 uses the revenues from the sale of European Union
Allowances (EUAs) to new entrants as a means to fund innovation in Carbon Capture
and Sequestration (CCS) and low carbon processes, providing an opportunity for
funding innovation in new low-carbon technologies and processes. However, the
opportunities that were provided from the NER 300 fund were considered too risky by
many central office managers, since support for a demonstration project would have
had to have been returned in the event that the technology failed. Indeed stakeholder
interviews9 revealed innovation in such new processes were considered to be outside
their “core business.”
In addition, under the 7th Framework Programme within the “Forest-based Sector EU
Research” €3.7 billion euros were allocated for the Bio Economy through a Public-
Private Partnership (European Commission, 2014). Other sources of funding include
the COST (Cooperation in Science and Technology), which had forests, their products
and their services on their research agenda10.
Private spending on R&D, particularly on technologies that are close to
commercialisation and have a clear link to consumers, will also be important.
However, spending on research and development compared to sales has been
considerably lower in the forestry and paper sector compared to the average across
all sectors, representing just 0.8% in 2013 (see Figure 15). Anecdotal evidence points
to three barriers that may be reducing the level of investment in the sector. Firstly,
papermaking requires a complex set of technologies that must be compatible with
one another. As such, it is difficult to innovate only a single part of the production
process. Secondly, market concentration in the technology supply market may have
reduced incentives for innovation. Indeed, it appears that over the last ten years, the
focus has been on increasing the scale of machines to meet the growing Asian and
Latin American markets, rather than on enhancing carbon or energy efficiency. Finally,
it is not clear to what extent pulp and paper companies have the skills or capacity to
undertake research.
8 The NER300 program was established by the revised Emissions Trading Directive 2009/29/EC.
According to article 10(a) 8, proceeds from the sale from up to 300 million allowances should be used to
finance commercial demonstration projects in the area of CCS and renewable energies. European
Commission (2015b): NER 300 program. 9 Interviews were conducted at the Workshop “Inclusion of Consumption for Carbon Pricing– Relevance
and feasibility for the pulp and paper sector” held by DIW Berlin and IVL in Brussels on June 8,2015. 10 See website of the COST project: www.cost.eu

30
Figure 15. Expenditure on research and development as a proportion of sales, 2013.
Source: R&D Scoreboard, 2014.
Furthermore, the decreasing demand for paper products and the overcapacity seen in
several plants and subsectors (FAO, 2015), diminishes revenue streams and future
profits. This increases the uncertainty for the future of the industry, reducing
investments that might increase efficiency and decrease costs. Additionally, long-term
contracts between paper manufacturers and their most important costumers make
the sector unattractive to new entrants who might encourage competition and/or use
newer technology for production.
3.2. Policies, incentives and other drivers and barriers for mitigation
The pulp and paper sector will need to be highly energy efficient and innovative in a
future that is shaped by ambitious climate and energy policy goals. Figure 16 below
outlines one path to decarbonisation, as developed by CEPI in their 2050 roadmap.
To achieve 80% emission reductions by 2050, the sector needs to reduce emissions
by 48Mt compared to 1990 levels. Continued adoption of best available technologies
is expected to contribute 10 Mt to this effort with continued fuel mix change reducing
emissions by a further 5Mt. Significant decarbonisation of the European power
market is expected between now and 2050, such that technologies allowing for heat
generation from electricity rather than conventional fuels will also play a leading role.
However, known technologies are insufficient. At least 10Mt must come from
breakthrough technologies.

31
Figure 16. Emission reduction potential, 1990-2050, in million tonnes.
Source: CEPI, 2015
Achieving the emission reductions outlined above will require a positive perspective
toward carbon and energy improvements so as to attract investment, skilled labour,
increase efficiency, and remain among the technology leaders. While there are
significant opportunities, there are also serious challenges and risks. Therefore, both
effective policy and forward looking and innovative companies are required to
translate the set roadmaps into tangible investments and innovation.
Both the views derived from conventional economics and experience with the sector to
date confirms that carbon pricing will be fundamental in driving a pulp and paper
sector transition. Importantly, the price signal will need to be felt by not just the
producers, in order to improve the efficiency of production, but also consumers, in
order to create a business case for low carbon paper products, breakthrough
technologies and bio-based products in other sectors. An effective carbon price for
intermediate and final consumers is necessary to provide a credible basis for the
large-scale use of innovative materials and production processes.
As well as carbon pricing, coordination may be required in some member states to
ensure that collected paper can be most effectively utilised. Best practice in terms of
collection, sorting and re-pulping should be seen as a priority in waste collection
tendering contracts.
Finally, innovation and strategic investment may be required. While the pulp and
paper sector are not reliant on CCS and CCSU for decarbonisation, unlike the
materials sectors (for example, steel and cement), break-through technologies are
still in infancy. Where markets are fragmented, timescales are long, risks are large,
and public technology has a high spill over, there may be a case for public funding to
complement private investments. If demonstrations of breakthrough technologies
require significant risks, public-private risk sharing arrangements may also be
required.

32
3.3. Benchmarks for free allocation of allowances
Free allocation in the EU ETS is based on benchmarks for carbon emissions per tonne
of production in different sectors. In this section we describe the current benchmarks
in the EU ETS system for the third trading period as well as benchmarks in other
trading schemes in the pulp and paper sector.
Benchmarks in the EU ETS
The production process for different types of paper is very diverse. For example, virgin
pulp is used for carton board and sanitary and household products, but it is not
possible to split this into mechanical or chemical pulping. Moreover, it is difficult to
associate emissions for individual products in mills that produce several products.
Therefore constructing benchmarks based on the 10% most efficient installations in
EU was complicated in the pulp and paper industry. Consequently, Ecofys (2009)
recommended basing emission benchmarks in the pulp and paper sector on the most
energy efficient processes, in combination with assumptions on energy conversion
efficiency and reference fuels.
When benchmarks were developed for pulp making in the EU, energy intensity from
BAT was converted to carbon intensity. Ecofys (2009) advised that there is no need
for free allocation for pulp making for heat consumption since biomass dominates as
fuel source in countries where most pulp is produced. The exception is the lime kiln in
Kraft pulping, which is associated with some process emissions. A separate
benchmark for Kraft pulp was therefore proposed (see Table 11 for proposed
benchmark values for virgin pulp).
Table 11. Emissions factor and proposed benchmarks values for virgin pulp products
Emission
factor t
CO2/adt
Benchmark Emissions
factor (proposed but
not final) t CO2/adt
Bleached Kraft pulp 0.048
- Bleached kraft pulp excluding lime kiln 0 0
- Lime kiln 0.048
Bleached Sulphite pulp 0 0
TMP and other mechanical pulp 0
Source: Ecofys, 2009
Carbon intensities vary for different paper products and depend on the energy source.
When benchmarks were developed for paper products, Ecofys proposed to assume
gas as the default fuel. Table 12 illustrates emissions factors for different products,
based on the proposed benchmarks for paper products by Ecofys (2009), given their
different energy intensities.

33
Table 12. Proposed benchmark for different paper products
Product Benchmark Emissions factor
(proposed but not final) t
CO2/adt
Newsprint 0.318
Uncoated fine paper 0.405
Coated fine paper 0.463
Tissue 0.343
Containerboard 0.368
Carton board 0.418
Other papers No benchmark
Source: Ecofys, 2009
The EU Commission subsequently consulted with stakeholder on the initial proposal
and adjusted benchmarks. The resulting benchmarks used in the pulp and paper
industry in the EU are presented in Figure 17. These benchmarks differ somewhat
from the emissions factors and proposed benchmarks in Table 11 and Table 12.
Benchmarks are based on non-integrated mills, which can be considered favourable
for integrated pulp and paper mills that use biomass rather than gas to meet heat
demand, meaning that pulp input are not included in the paper benchmarks. The
reason for choosing non-integrated mills as reference was that otherwise the
allocation for non-integrated paper mills was considered too low and difficulties were
incurred in splitting up the process between pulp and paper in an integrated mill
(Ecofys, 2009).
Figure 17. CO2 Carbon intensity benchmarks in EU.
Source: European Commission, 2011.
0,12
0,06
0,02
0,039
0,298
0,318
0,318
0,334
0,248
0,237
0,273
0 0,05 0,1 0,15 0,2 0,25 0,3 0,35 0,4
Short fibre kraft pulp
Long fibre kraft pulp
Sulphite pulp, thermo-mechanical and …
Recovered paper pulp
Newsprint
Uncoated fine paper
Coated fine paper
Tissue
Testliner and Fluting
Uncoated carton board
Coated carton board
Allowances/t

34
The EU benchmarks for pulp and paper raise a number of questions. First, what fuel
input is used as default fuel? While in other sectors this has been gas, in pulp
production it was biomass. It could also be that biomass should be treated in an
alternative way, given that this biomass could be used elsewhere in the economy and
replace fossil fuel. From this perspective, there might be other more cost effective
fields of application for biomass. In this discussion one must, however, take into
account that a significant part of the used biomass/bioenergy is inherent to the
process and cannot be replaced by other fuels and that there must be joint research
with other sectors, i.e. buyers of the bioenergy products, for those investments to take
place.
Global outlook
Similar to the EU, the Californian cap-and-trade program allocates allowances to
leakage exposed sectors based on product benchmarks. The benchmarks were set at
90% of average emissions intensities (CARB, 2011) 11 . No pulp is produced in
California and accordingly the benchmarks only concerns paper products. There are
paper benchmarks for four different paper processes, which are compared with the
EU benchmarks. Compared to the EU, the product benchmarks are approximately
twice as high. One explanation for this could be that EU benchmarks are based on
best available technology while the Californian benchmarks represent 90% of average
emissions per product.
Table 13. Benchmarks in the Californian Cap-and-Trade Program for paper production
Sector Activity Californian Benchmark
(Allowances / metric
tonne)
Comparison EU
Benchmark
(Allowances /
metric tonne)
Paper (except newsprint) Through-Air-Dried (TAD)
Tissue Manufacturing
1.43 Not available
Paperboard mills Recycled Boxboard
Manufacturing
0.550 0.273
Paperboard mills Recycled Linerboard
(Testliner) Manufacturing
0.516 0.248
Paperboard mills Recycled Medium
(Fluting) Manufacturing
0.434 0.248
Source: CARB, 2011.
The proposed Carbon Pricing Mechanism in Australia, which was repealed in 2014,
also had benchmarks for allocation to carbon leakage exposed sectors. The
benchmarks were based on average performance within the sector. Compared to the
EU benchmarks, the Australian benchmarks also included indirect emissions from
11 In some sectors, this approach resulted in more stringent levels than current emissions for any
existing facility in California. In these cases benchmarks were based on the “best-in-class” value in
California.

35
grid electricity usage.12 A standalone benchmark for newsprint was developed since it
was identified that most newsprint is produced in integrated mills. Regarding other
paper products (packaging, carton board, printing and tissue), separate benchmarks
were developed for non-integrated mills but with an additional common baseline for
wet pulp manufacturing applied to integrated mills. The benchmark for wet pulp does
not distinguish between different types of pulp and is applied to all pulp and paper
activities. 13 In addition, one benchmark was developed for non-integrated pulp
making.
Table 14 illustrates direct emissions for different pulp and paper products in Australia,
serving as basis for allocation of free allowances. The listed paper categories are not
directly comparable to EU products, but the benchmarks in Australia seem distinctly
higher than in the EU. Possible explanations could be that the Australian benchmarks
include indirect emissions, which the EU ones do not, and that the Australian
benchmarks are based on average performance, compared to BAT in EU.
Table 14. Basis for allocation for pulp and paper in Australia
Sector Description Direct + Indirect
emissions
(CO2/tonne)
Newsprint Per air dried tonne of newsprint 0.496
Packaging and industrial paper Per tonne of saleable rolls of uncoated
packaging and industrial paper.
0.338
Carton board Per tonne of saleable rolls of carton board 0.886
Printing and writing paper Per tonne of saleable rolls of coated and
uncoated printing and writing paper
0.617
Tissues Per tonne of saleable rolls of uncoated
tissue paper
0.646
Dry pulp Per tonne of saleable rolls of dry pulp 0.873
Wet pulp Air dried equivalent pulp from either or
both of woodchips and sawdust
0.130
Source: Australian government, 2012.
4. Potential applicability of Inclusion of Consumption to the pulp and paper sector
Europe is about to embark on a debate regarding structural reform options for the
post-2020 European Union Emissions Trading System (EU ETS). A key aspect of this
debate will be the treatment of emission intensive trade exposed industries that are at
risk of leakage. In the EU ETS, leakage protection is provided through partial free
allocation of allowances to carbon and trade intensive industries. Today, while there
are differences across sectors, international competition limits the possibility for
carbon intensive sectors in EU ETS to pass carbon costs on to consumers (Ecorys,
12 A national grid emissions factor was applied, fixed to 1 tonne CO2e/MWh but subject to adjustments
for very large existing electricity supply contracts (Ecofys, 2014). 13 The reason for this was the government’s principle of taking into account intermediate products when
defining the activities.

36
2013), which constrains the ability of EU ETS to incentivize mitigation options down
the value chain. Moreover it could jeopardize the ability of the EU ETS to drive a long
term decarbonisation of the European Economy. A third concern is that free allocation
is to be phased out, which may lead to increased risk for carbon leakage.
Hence it is worthwhile to explore new approaches to restore incentives for investment
in mitigation and innovation in the value chain, where these incentives are largely
muted from the use of free allowance allocation as leakage protection mechanism.
One such approach is the Inclusion of Consumption (IoC) for carbon intensive
materials in the EU ETS. The production of carbon intensive commodities would
remain covered by the EU ETS but an additional consumption charge is levied.
The aim of this section is to identify the key design choices, opportunities and
challenges of applying Inclusion of Consumption to the European pulp and paper
industry. Specifically, the chapter discusses:
How the Inclusion of Consumption to the European pulp and paper sector
can be implemented,
The choice of benchmarks and the metric upon which to base the
consumption charge,
Treatment of indirect emissions.
4.1. The Inclusion of Consumption approach
Under the Inclusion of Consumption, the production of carbon intensive commodities,
like steel, cement and paper, would still be ensured with partial free allocation of
allowances. To preserve incentives for energy and carbon efficiency improvements in
primary production, the use of BAT benchmarks determines the volume of the free
allocation (Ecofys, 2009).
As an additional measure in the Inclusion of Consumption approach, a consumption
charge is levied for carbon intensive commodities. The charge is the same for
domestic and imported commodities, so it balances the competitiveness of EU
production and imports. Again, the carbon price of production signals the costs of
externalities beyond primary production and can support innovation.
The inclusion of consumption of carbon intensive materials post-2020 will:
i) Allow for carbon leakage protection to be continued by (benchmark based)
free allocation;
ii) Avoid distortions to competitiveness of EU production by same
consumption charges for domestic and imported products; and
iii) Restore the carbon price signal that is muted, resulting in substitution away
from carbon intensive commodities and providing an incentive for e.g.
lighter paper innovations.14
14 For further details on the Inclusion of Consumption approach see Neuhoff et al. (2015).

37
The charge is levied per tonne of material consumed. In order to arrive at the amount
of the charge, the weight is multiplied by a benchmark emissions value (carbon
emissions per tonne of the commodity) and the carbon price, according to the
following formula:
The consumption charge is levied for all consumption of carbon intensive materials at
the same benchmark rate – irrespective of the origin or production process of the
material. Thus discrimination across different installations and distortions of
production decisions are avoided, and the mechanism is not considered to be a trade
related measure.
Conceptually, Inclusion of Consumption can be modelled after consumption levies
that are well established, such as excise charges on fuels, alcohol and tobacco.
Simple and effective schemes functioning in Europe (and globally) based on
computerized systems, can be replicated.
Under IoC, the production of carbon intensive materials generates a liability per tonne
of material, e.g. pulp or paper, produced or imported. The producer or importer then
passes the liability on with the sale of their product; see Figure 18 for a schematic
picture. The payment of the charge is suspended through the intermediate good chain
and only comes due at the time the good is released for consumption. As long as no
release for consumption has taken place, the charge is not due. For a detailed
overview of the approach see Neuhoff et al. (2015) and for its implementation see
Acworth et al. (2014).
Figure 18. Schematic picture of Inclusion of consumption in non-integrated pulp and paper
mills (IoCL=Inclusion of Consumption Liability)

38
4.2. Benchmarks for Inclusion of Consumption
There are several issues that need to be investigated when it comes to designing
benchmarks in the Inclusion of Consumption approach. Below we discuss different
possible metrics for deciding benchmarks, treatment of indirect emissions and
recycling.
The production process for different types of paper is diverse and benchmarks
currently used in the EU ETS for free allocation are based on assumptions of the most
energy efficient processes, in combination with energy conversion factors for
reference fuels. An important issue for the Inclusion of Consumption approach for
pulp and paper is deciding on the metrics for the consumption fee. The most
straightforward approach would be to replicate the current EU framework for
benchmarks for determining the consumption fee.
Another option would be to produce a set of internationally harmonized benchmarks
considering the ones used by EU, California, Australia and other countries. Other
changes in the EU climate and energy policy for the post-2020 era, e.g. the renewal of
the RES directive, will also impact the benchmarking question.
Biomass Carbon Accounting
The pulp and paper production processes require heat and electricity; biomass is a
common energy source. Part of this energy could be replaced and produced by e.g.
other renewable energy sources. This could free up biomass - such as branches or tall
oil - that could be used elsewhere in the economy, for instance for producing
transport fuels or bioplastics.
It would require a change of mind set and possibly incentives to enable such
developments. Currently the use of biomass in co-generation is incentivized with
renewable energy and CHP support mechanisms. They are structured to correct for
increases in biomass prices linked to alternative use options. As the incentives are
provided in proportion to electricity production and, therefore, also heat use, this
does however create disincentives for more efficient use of produced by CHP plants in
pulp and paper production.
Currently, pulp and paper entities are required to acquire and surrender allowances
only for those emissions released by the combustion of fossil fuels, such as coal, oil
and gas, thus they receive correspondingly small levels of free allocation. Emissions
released via the combustion of biomass are assumed neutral and, therefore, do not
create a carbon liability or implicit credit. Instead one may consider associating
replaceable biomass with a benchmark based on fossil gas. This would be analogous
to the EU benchmark for district heating, which is based on gas, even though in some
countries the most common fuel for district heating is bioenergy. A gas based
benchmark on replaceable biomass would provide pulp producers’ free allocation and
would improve incentives for more efficient and high-value use of the bioenergy
carriers whether within pulp or paper or other sectors. A gas based benchmark would
also somewhat reduce incentives for bioenergy in CHP production.

39
This is not to be confused with the debate on carbon neutrality of bioenergy, but
addresses the issue that part of the biomass used in pulp and paper production could
be provided by other energy sources. Hence, there is a shadow carbon cost of using
this replaceable biomass for heat and electricity purposes. It should be noted that a
significant share of the biomass that is used is inherent to the process and cannot be
replaced by other fuels. The process related biomass, such as black liquor, can only
be used locally. This non-replaceable share of biomass has no carbon liability under
the EU ETS and IoC framework (see Figure 18).
Implementing a fossil benchmark on replaceable bioenergy would have a set of
implications:
- The support level for CHP and RE could be reduced. This would increase
incentives for efficient use of heat from co-generation based on bio-mass.
- Free allocation would increase to the sector (in the EU ETS), which would allow
for the sales of surplus allowances.
- Incentives for more efficient and high-value use of the bioenergy carriers would
increase.
- As a result, the sector would become more concerned about the cross-sector
reduction factorThis enhances incentives for efficiency improvements and other
mitigation options and free up bio-energy for new “bioeconomy” production
processes.
Inclusion of Consumption could:
- Both drive efficiency upstream in the pulp and paper production processes but
also create a stable business case for breakthrough technologies as final
consumers pay a charge corresponding to the upstream carbon price incentive.
- Furthermore, Inclusion of Consumption in EU ETS reflects the externality costs
in final product prices, and thus contributes to a business case for innovative
products, for example lighter paper
Figure 19. Treatment of biomass in carbon accounting for the paper and pulp sector
Biomass with
carbon liability
Biomass with no
carbon liability
Emissions
from fossil
fuels
Option Two:
Benchmark based
on emissions
assuming fossil
fuel input
Option One:
Current
benchmarks
Calculated assuming but not rewarding carbon neutrality of biomass
Portugal
USA

40
Inclusion of indirect emissions from electricity use in the consumption
fee and compensation to paper producers
Although the discussion of compensation for indirect costs is broader than the scope
of this project, it is worth investigating whether Inclusion of Consumption could offer
new prospects when it comes to incentives for electricity intensity measures and
compensation for indirect costs. Power price compensation is an important issue for
the pulp and paper sector. During interviews with Swedish pulp and paper mills,
indirect costs from electricity consumption were described as the main issue
regarding carbon leakage (IVL, 2015).
The current framework for compensation for indirect costs in the EU ETS by the
European Commission states which sectors and sub-sectors are eligible for
compensation15. Manufacture of paper and paperboard, as well as mechanical pulp,
are included on the list. The decision to compensate sectors depends, however, on
the respective Member States. As of today, only a handful number of member states
in the EU grant state aid to compensate for electricity intensive sectors.16
In the Australian Carbon Pricing Mechanism, indirect emissions were proposed to be
included in the product benchmarks and a similar approach could be an option in the
EU to protect against carbon leakage from indirect emissions.
If compensation is granted for power price increases linked to indirect emissions,
then in the Inclusion of Consumption approach correspondingly the consumption
charge could be increased, thus ensuring that the carbon price is reflected in
production and consumption decisions throughout the value chain.
4.3. Discussion
Materials play a key role in the transition to a low carbon economy. From a material
efficiency perspective Inclusion of Consumption could strengthened the link between
the producer and the consumer. Inclusion of Consumption could incentivise
mitigation as the carbon price signal is preserved along the value chain. As such, the
scheme makes low carbon products more competitive and incentivizes the
substitution away from carbon intensive alternatives. Specifically, this could
incentivize consumers to choose more material efficient packaging and paper
products, such as lighter packaging and paper products as well as digitally based
alternatives.
A consumption charge could also support the free allowance allocation to production
at a fossil fuel based benchmark as the same charge is subsequently levied at the
consumption end. This in turn could then allow for reduction of CHP and RE support
provided and improve thereby incentives for efficient use of heat produced from CHP.
15 In order to be eligible, a sector or sub-sector must have a trade intensity higher than 10% and the sum
of indirect additional costs induced by the EU ETS would lead to an increase in production amounting to
at least 5% of gross value added (European Commission, 2012). 16 The countries are Belgium, Germany, Greece, Netherlands, Spain and United Kingdom.

41
An important issue to ensure material efficiency and to avoid market distortions is
that the scheme also includes materials that are in close competition to paper
products. This concerns for instance plastic and glass as packaging materials, but
also electronic products that compete with paper products such as newsprint and
graphic paper. Further investigations regarding which products to include are needed.
Perhaps most important with the proposed scheme is that it could provide long term
certainty regarding allocation of free allowances and therefore prevent carbon leakage
from EU. Long term certainty on leakage protection could also stimulate new
innovations, funding of break-through technology in Europe and prevent investment
leakage.
A number of issues must, however, be clarified before Inclusion of Consumption can
be materialized in the EU. For the pulp and paper industry especially metrics for
determining the consumption fee must be further investigated as well as treatment of
indirect emissions from electricity consumption and recycled material. Regarding
benchmarks, the most straightforward option would be to replicate the current
framework for benchmarks to determine the consumption fee. One may also consider
applying a gas based benchmark on the share of biomass that is replaceable (such as
branches). This could create incentives to free up biomass that could be used
elsewhere in the economy, for instance for producing transport fuels or bioplastics.
Treatment of recycling and indirect costs within the scheme are issues that concern
not only the pulp and paper industry, but needs to harmonized for all the sectors that
would be covered by the proposed scheme.
42
References and consulted literature
Acworth, W., M. Haussner, R. Ismer, K. Neuhoff (2014) Including consumption in the EU ETS –
Administrative implementation of a consumption based charge, Climate Strategies, September 2014.
Australian Government (2012) Establishing the eligibility of emissions-intensive, trade-exposed activities
under the Jobs and Competitiveness Program and Renewable Energy Target.
Bajpai, P. (2012) Brief Description of the Pulp and Paper Making Process, Biotechnology for Pulp and
Paper Processing. Springer.
Bergek, A. & S. Jacbosson (2010) Are tradable green certificates a cost-efficient policy driving technical
change or a rent-generating machine? Lessons from Sweden 2003-2008. Energy Policy , 38, 1255-1271.
BREF (2013) Best Available Technologies (BAT) Reference Document for the Production of Pulp, Paper
and Board. European Commission, Industrial Emissions Directive, Brussels.
CARB, California Air Resources Board, (2011) Cap-and-Trade Regulation: July 2011, Appendix B:
Development of Product Benchmarks for Allowance Allocation.
CEPI (2011) The Forest Fibre Industry: 2050 Roadmap to a low-carbon bio-economy. Confederation of
European Paper Industries, CEPI, Brussels.
CEPI (2012) Enabling the bio-economy: The future has begun, CEPI, Brussels.
CEPI (2013) The Two Tem Project, CEPI, Brussels.
CEPI Key Statistics (2014) Key Statistics 2014, Brussels, CEPI.
CEPI (2014b) Paper Recycling Monitoring Report 2014, CEPI, Brussels.
COGEN (2007) Financial and regulatory support for cogeneration in the EU, COGEN, Brussels.
Ecofys (2009) Methodology for the free allocation of emission allowances in the EU ETS post 2012,
Sector report for the pulp and paper industry. Fraunhofer Institute for Systems and Innovation
Research Öko-Institut By order of the European Commission.
Ecofys (2014) Emissions intensity benchmarks for the South African carbon tax – Technical support
study, by order of the World Bank.
Ecorys (2013) Carbon Leakage Evidence Project – Factsheets for selected sectors, Project report for EC
DG Climate Action.
Ericsson, K., Nilsson, L. J., & Nilsson, M. (2011) New energy strategies in the Swedish pulp and paper
industry - The role of national and EU climate and energy policies. Energy Policy , 39 (3), 1439-1449.
Ernest Orlando Lawrence Berkeley National Laboratory (2009). Energy Efficieny Improvement and Cost
Saving Opportunities for the Pulp and Paper Industry. Berkeley: Berkelely Lab.
ERPC (2013) Paper Recycling Monitoring Report 2013, European Declaration on Paper Recycling 2011-
2015, European Recovered Paper Council Publishing.
European Commission (2011) Commission Decision of 27 April 2011, determining transitional Union-
wide rules for harmonised free allocation of emission allowances pursuant to Article 10a of Directive
2003/87/EC of the European Parliament and of the Council, (notified under document C(2011) 2772),
(2011/278/EU).
European Commission (2012) Communication from the Commission on Guidelines on certain State aid
measures in the context of the greenhouse gas emission allowance trading scheme post-2012, SWD
(2012) 130 final and 131 final, Official Journal of the European Union, 2012/C 158/04.
European Commission (2014) Website of the Bioeconomy, DG Research&Innovation, link:
https://ec.europa.eu/research/bioeconomy/index.cfm?pg=policy&lib=bbpp
European Commission (2015a) Proposal for a Directive of the European Parliament and of the Council
amending Directive 94/62/EC on packaging and packaging waste, SWD (2015) 259 and 260 final,
COM(2015) 596 final, p.11.
European Commission (2015b) Website of NER 300 Program, link:
http://ec.europa.eu/clima/policies/lowcarbon/ner300/index_en.htm
European Union, 2014, Decision of the European Parliament and of the Council concerning the
establishment and operation of a market stability reserve for the Union greenhouse gas emission
trading scheme and amending Directive 2003/87/EC. January 22, 2014.

43
FAO (2015) Pulp and paper capacities survey 2013-2018. United Nations, Food & Agriculture
Organization, United Nations.
Gulbrandsen, L. H., & Stenqvist, C. (2013) The limited effect of EU emissions trading on corporate
climate strategies: Comparison of a Swedish and a Norwegian pulp and paper company. Energy Policy,
56, 516-525.
Healy, S., & Schumacher, K. (2011) Product Classification and its implications on competitiveness and
carbon leakage: pulp, paper and paperboard. Climate Strategues.
Hetemäki, L., Hänninen, R., & Moiseyev, A. (2014) Markets and Market Forces for Pulp and Paper
Products. European Forest Institute, Finnish Forest Research Institute, Norwegian University of Life
Sciences, The Global Forest Sector.
International Energy Agency (2008) Worldwide trends in enery use and efficiency-key insights from IEA
Indicator Analysis.
IVL (2015) Industriintervjuer klimatinvesteringar (Industry interviews on drivers for climate investments),
for Swedish Environmental Protection Agency.
JRC (2011) Technology Map of the European Strategic Energy Technology Plan (SET-Plan) Technology
Descriptions.
Kramer, K. J., Masanet, E., Xu, T., & Worrell, E. (2009) Energy Efficiency Improvement and Cost Saving
Opportunities for the Pulp and Paper Industry An ENERGY STAR Guide for Energy and Plant Managers.
Energy Star. US Environmental Protection Agency.
Neuhoff, K, W. Acworth, J. Barrett, A. Owen, C. Fisher, C. Munnings, R. Ismer, Y. G. Kim, S. Pauliuk, R.
Wood, O. Sartor, T. Sterner, Z. Xiliang, L. Zetterberg & S. Roth (2015) Inclusion of Consumption of
Carbon Intensive Commodities in Carbon Pricing Mechanisms, Climate Strategies Policy Paper, May
2015.
R&D Scoreboard (2014) The 2014 EU Industrial R&D Investment Scoreboard, European Commission,
JRC/DG RTD, link:
http://iri.jrc.ec.europa.eu/documents/10180/354280/Scoreboard%202014%20Ranking%202500
Rogge, K.S., Schleich, J., Haussmann, P., Roser, A., Reitze, Felix. (2011) The role of the regulatory
framework for innovation activities: The EU ETS and the German paper industry. Working paper
sustainability and innovation. Econstor. S1/2011.
Scoradato, L., Klitkou, A., & Coenen, L. (2013) Betydelsen av politiska styrmedel för ökad hållbarhet och
konkurrenskraft i massa- och pappersindustrin: Sverige i ett jämförande perspektiv, NIFU,
Arbetsrapport 19A/2013. .
Thollander, P., & Ottosson, M. (2008) An energy efficient Swedish pulp and paper industry – exploring
barriers to and driving forces for cost-effective energy efficiency investments, Energy Efficiency, 1(1), 21-
34.
UNECE/FAO (2012) Forest Products – Annual Market Review 2001-2012, Geneva Timber and Forest
Study Paper 30, ECE/TIM/SP/30, p.86, United Nations Publication.
Worrell, E. L. (2007) World Best Practice Energy Intensity Values for Selected Industrial Sectors. Ernest
Orlando Lawrence Berkeley National Laboratory.
WSP (2015) Industrial Decarbonisation & Energy Efficiency Roadmaps to 2050: Pulp and Paper.

Climate Strategies is a leading independent,
international research organisation based in the UK.
Through our network of global experts, we assist
governments and industrial stakeholders around the
world in developing climate change and energy policies.
We are a not-for-profit organisation with all our
activities funded through a broad spectrum of
governments, businesses and foundations.
Companies House Number 05796323.
Climate Strategies
www.climatestrategies.org
Related Documents