The Protonation Behavior of Metal Oxide Surfaces to Hydrothermal Conditions M.L. Machesky a , D.J. Wesolowski b , M. K. Ridley c , D. A. Palmer b , J. Rosenqvist b , S. N. Lvov d , M. Fedkin d , M. Předota e , and L. Vlcek f a Illinois State Water Survey, Champaign, Illinois 61820, USA b Oak Ridge National Laboratory, Oak Ridge, Tennessee 37831, USA c Department of Geosciences, Texas Tech University, Lubbock, Texas 79409, USA d Department of Energy and Geo-Environmental Energy, The Pennsylvania State University, University Park, Pennsylvania, 16802, USA e Department of Medical Physics and Biophysics, University of South Bohemia, Czech Republic f Department of Chemical Engineering, Vanderbilt University, Nashville, Tennessee 37235, USA Metal oxide surface protonation under hydrothermal conditions is summarized. Important concepts and definitions are introduced first, followed by a brief overview of experimental methods and presentation of representative results. Finally, the modeling methods that are most useful in predicting surface protonation behavior between 0 and 300 o C are presented and compared. Introduction and Background The under-coordinated surfaces of metal oxides interact with water molecules via either associative or dissociative mechanisms (1), as schematically depicted for a generic titanium oxide surface in the top portion of Figure 1. Under the associative adsorption mechanism, water molecules remain intact after they adsorb to surface metal cations, while under the dissociative mechanism the water molecules dissociate, with protons attaching to adjacent surface oxygen atoms, which results in a surface populated by hydroxyl (e.g., Ti-OH) groups. Surface protonation refers to the development of a pH- dependent charge on such surfaces through the adsorption/desorption of protons from the bulk solution as schematically depicted in Figure 1 (bottom) for a hydroxylated surface. In essence, proton adsorption/desorption occurs because surface-bound water or hydroxyl groups possess acid/base properties. However, the water adsorption and surface protonation mechanisms are much more detailed at the molecular level than depicted in Figure 1 (1, 2). An important reference quantity for surface protonation is that pH value where the pH-dependent charge due solely to proton adsorption/desorption is zero. That pH value is termed the point of zero net proton charge, or pH znpc (3, 4). pH znpc values are most commonly determined from potentiometric titrations of metal oxide powders of known surface area in so-called indifferent electrolyte solutions (e.g., NaCl, KNO 3 ) at several ionic strengths and equating the common intersection point of those titration curves with the pH znpc (3). In reality, however, the common intersection point is a relative measure, which can only be equated with the pH znpc by some independent confirming method (4). In any case, these titrations are typically termed “surface charge” titrations. Electrophoretic mobility titrations are also commonly used to infer the charge state of metal oxide powders (5), although surface charge itself is not actually measured

Welcome message from author
This document is posted to help you gain knowledge. Please leave a comment to let me know what you think about it! Share it to your friends and learn new things together.
Transcript
The Protonation Behavior of Metal Oxide Surfaces to Hydrothermal Conditions
M.L. Macheskya, D.J. Wesolowskib, M. K. Ridleyc, D. A. Palmerb, J. Rosenqvistb, S. N. Lvovd, M. Fedkind, M. Předotae, and L. Vlcekf
a Illinois State Water Survey, Champaign, Illinois 61820, USA
b Oak Ridge National Laboratory, Oak Ridge, Tennessee 37831, USA c Department of Geosciences, Texas Tech University, Lubbock, Texas 79409, USA
d Department of Energy and Geo-Environmental Energy, The Pennsylvania State University, University Park, Pennsylvania, 16802, USA
e Department of Medical Physics and Biophysics, University of South Bohemia, Czech Republic
f Department of Chemical Engineering, Vanderbilt University, Nashville, Tennessee 37235, USA
Metal oxide surface protonation under hydrothermal conditions is summarized. Important concepts and definitions are introduced first, followed by a brief overview of experimental methods and presentation of representative results. Finally, the modeling methods that are most useful in predicting surface protonation behavior between 0 and 300oC are presented and compared.
Introduction and Background
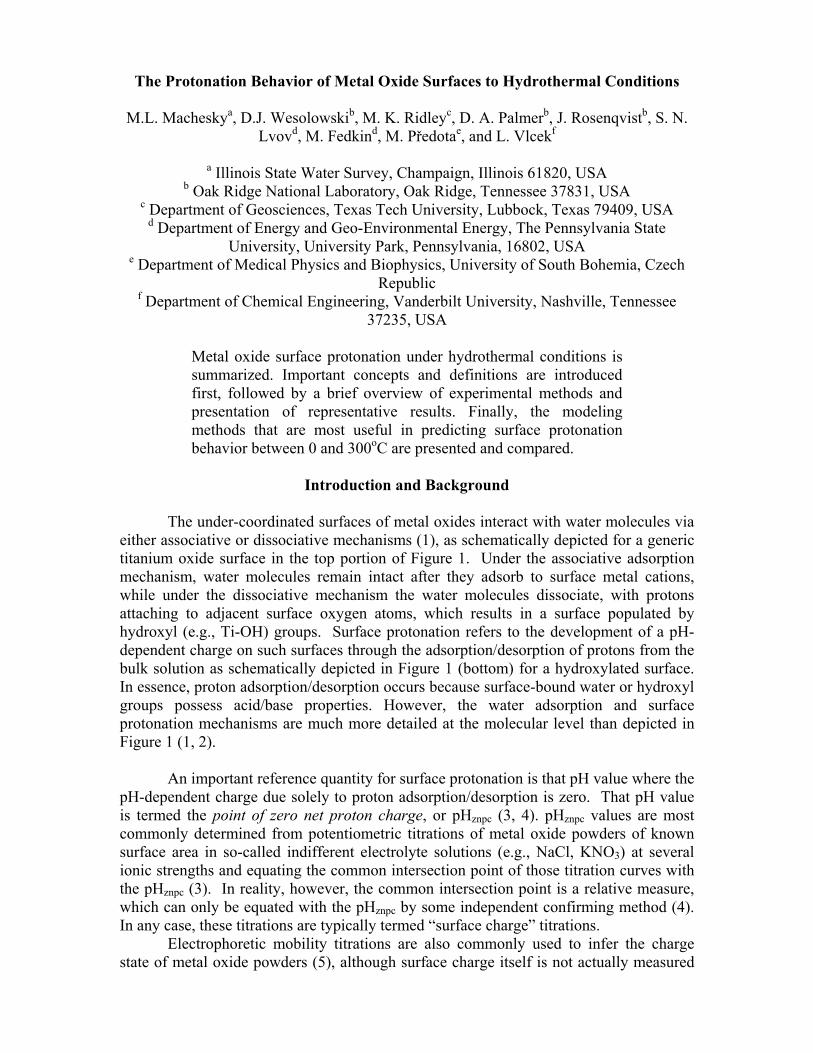
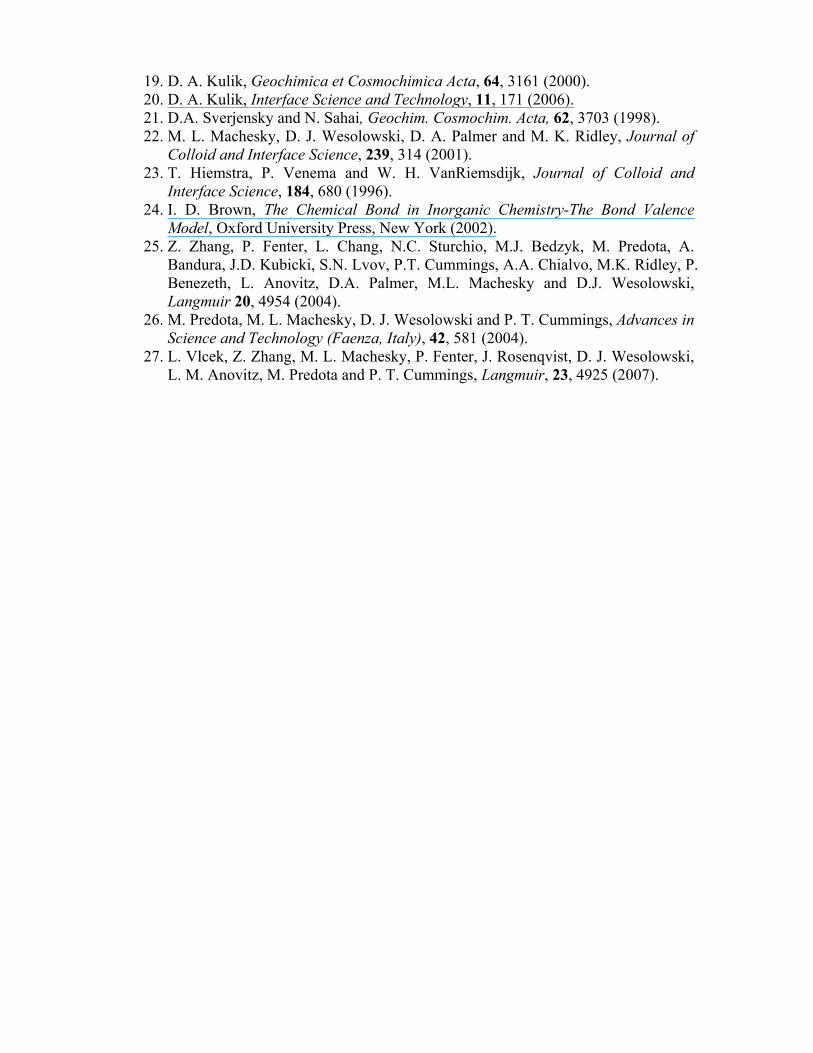
The under-coordinated surfaces of metal oxides interact with water molecules via either associative or dissociative mechanisms (1), as schematically depicted for a generic titanium oxide surface in the top portion of Figure 1. Under the associative adsorption mechanism, water molecules remain intact after they adsorb to surface metal cations, while under the dissociative mechanism the water molecules dissociate, with protons attaching to adjacent surface oxygen atoms, which results in a surface populated by hydroxyl (e.g., Ti-OH) groups. Surface protonation refers to the development of a pH-dependent charge on such surfaces through the adsorption/desorption of protons from the bulk solution as schematically depicted in Figure 1 (bottom) for a hydroxylated surface. In essence, proton adsorption/desorption occurs because surface-bound water or hydroxyl groups possess acid/base properties. However, the water adsorption and surface protonation mechanisms are much more detailed at the molecular level than depicted in Figure 1 (1, 2).
An important reference quantity for surface protonation is that pH value where the pH-dependent charge due solely to proton adsorption/desorption is zero. That pH value is termed the point of zero net proton charge, or pHznpc (3, 4). pHznpc values are most commonly determined from potentiometric titrations of metal oxide powders of known surface area in so-called indifferent electrolyte solutions (e.g., NaCl, KNO3) at several ionic strengths and equating the common intersection point of those titration curves with the pHznpc (3). In reality, however, the common intersection point is a relative measure, which can only be equated with the pHznpc by some independent confirming method (4). In any case, these titrations are typically termed “surface charge” titrations. Electrophoretic mobility titrations are also commonly used to infer the charge state of metal oxide powders (5), although surface charge itself is not actually measured
with this technique. In this instance, the pH value at which the electrophoretic mobility (particle movement in an applied electric field) is zero is termed the isoelectric point pH value (pHiep). Typically, these measurements are also conducted at several ionic strengths in order confirm that the common intersection point coincides closely with zero electrophoretic mobility. In any case, demonstration that the pHznpc equals the pHiep for a particular metal oxide-electrolyte pair is confirmation that the electrolyte is indifferent, and that the pHznpc inferred from the common intersection point indeed corresponds to the zero proton charge condition. Moreover, the pHiep and pHznpc shift in opposite directions if the cations and anions of the electrolyte medium exhibit different adsorption affinities for the metal oxide surface (3, 6). The point of zero charge or pHpzc value is the most commonly used term to describe the zero charge condition. Nonetheless, as pointed out by Sposito (4), the pHpzc strictly refers to the pH value where the total net particle charge is zero, including any contributions from cations or anions other than H+ or OH- adsorbed anywhere in the electrical double layer. However, in indifferent electrolyte solutions where pHznpc= pHiep, it also follows that, pHpzc= pHznpc= pHiep. Establishing the true zero proton charge state is important for both qualitative and quantitative reasons. If ambient pH values are greater than the pHznpc then cation adsorption is preferred due to the net negative charge of the surface. Conversely, anions are predominately adsorbed below the pHznpc. Also, when ambient pH values are near the pHznpc and/or pHiep then particle aggregation is enhanced because repulsive electrostatic forces are minimized. On a quantitative level, experimentally determined pHznpc values can be compared to those calculated or inferred from any of the available surface protonation schemes. Moreover, determining pHznpc (or pHiep) values over an extended temperature range provides the data necessary to develop and calibrate models that predict pHznpc values and surface protonation behavior into the hydrothermal regime, which is the primary subject of this contribution.
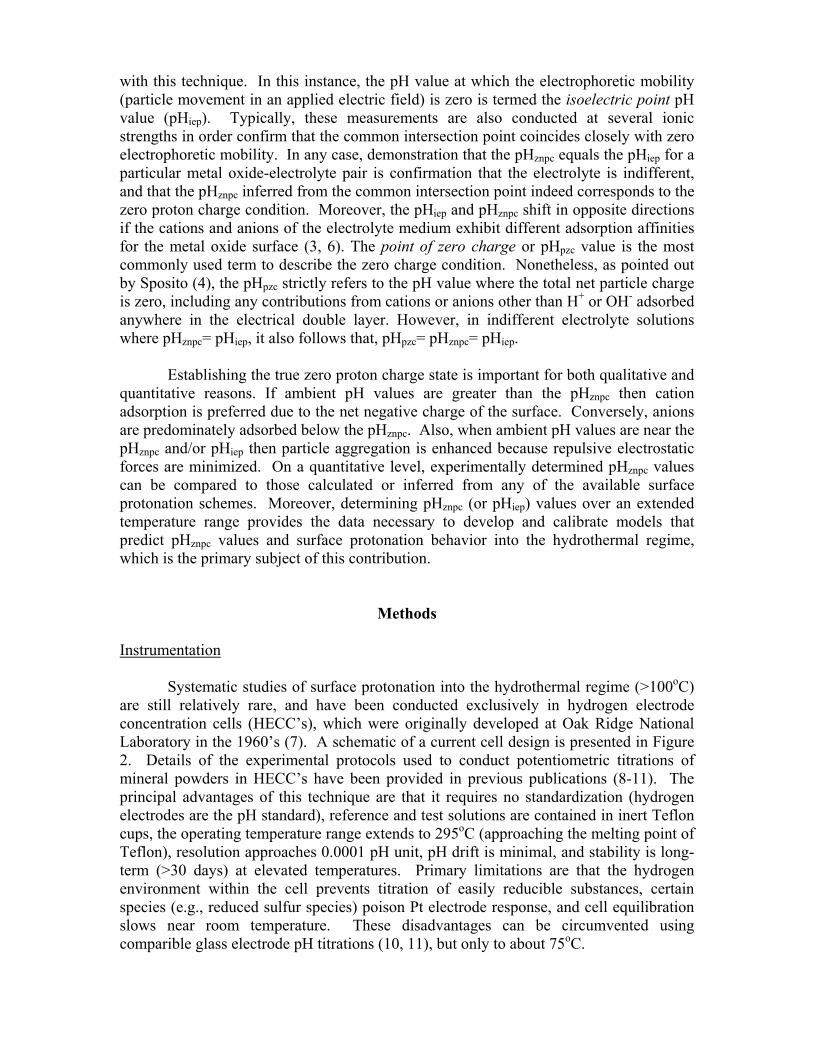
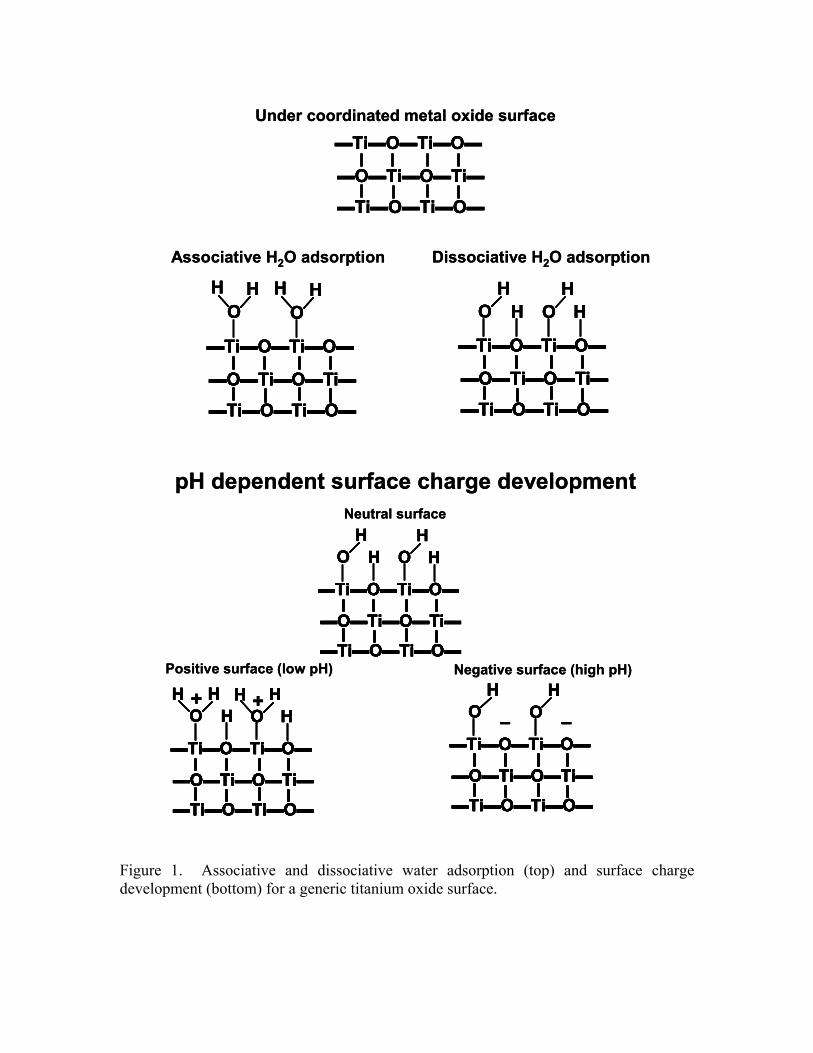
Methods Instrumentation Systematic studies of surface protonation into the hydrothermal regime (>100oC) are still relatively rare, and have been conducted exclusively in hydrogen electrode concentration cells (HECC’s), which were originally developed at Oak Ridge National Laboratory in the 1960’s (7). A schematic of a current cell design is presented in Figure 2. Details of the experimental protocols used to conduct potentiometric titrations of mineral powders in HECC’s have been provided in previous publications (8-11). The principal advantages of this technique are that it requires no standardization (hydrogen electrodes are the pH standard), reference and test solutions are contained in inert Teflon cups, the operating temperature range extends to 295oC (approaching the melting point of Teflon), resolution approaches 0.0001 pH unit, pH drift is minimal, and stability is long-term (>30 days) at elevated temperatures. Primary limitations are that the hydrogen environment within the cell prevents titration of easily reducible substances, certain species (e.g., reduced sulfur species) poison Pt electrode response, and cell equilibration slows near room temperature. These disadvantages can be circumvented using comparible glass electrode pH titrations (10, 11), but only to about 75oC.
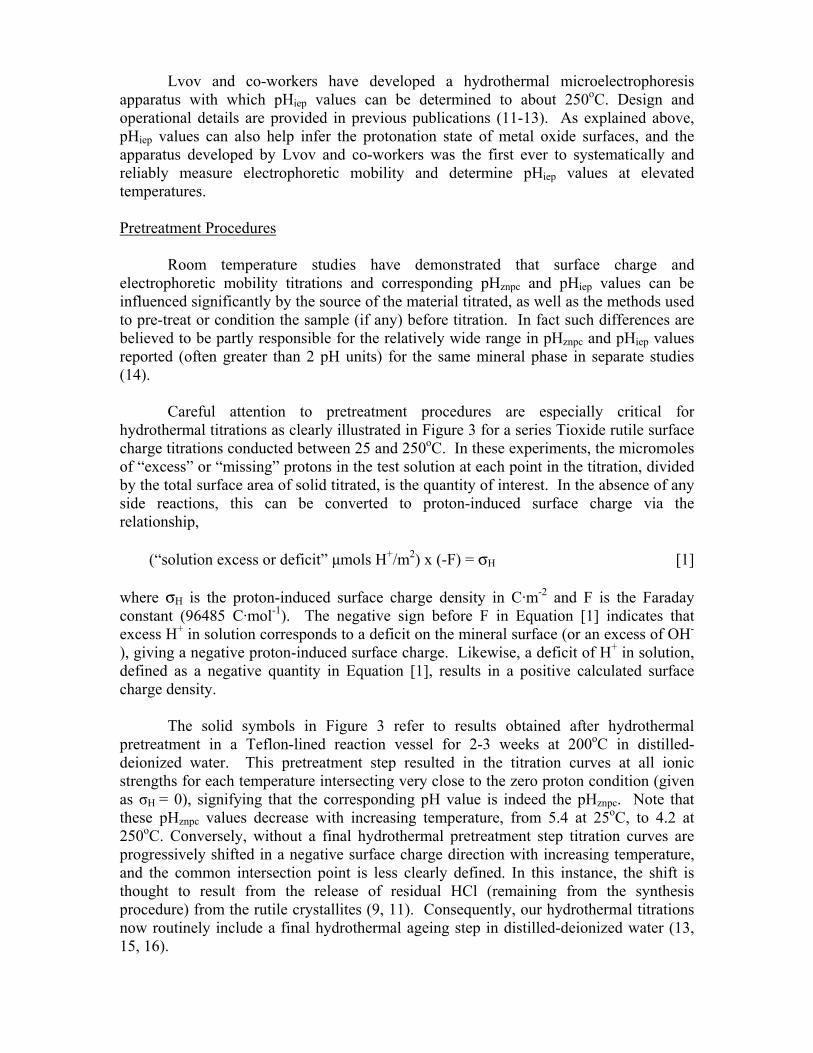
Lvov and co-workers have developed a hydrothermal microelectrophoresis apparatus with which pHiep values can be determined to about 250oC. Design and operational details are provided in previous publications (11-13). As explained above, pHiep values can also help infer the protonation state of metal oxide surfaces, and the apparatus developed by Lvov and co-workers was the first ever to systematically and reliably measure electrophoretic mobility and determine pHiep values at elevated temperatures. Pretreatment Procedures Room temperature studies have demonstrated that surface charge and electrophoretic mobility titrations and corresponding pHznpc and pHiep values can be influenced significantly by the source of the material titrated, as well as the methods used to pre-treat or condition the sample (if any) before titration. In fact such differences are believed to be partly responsible for the relatively wide range in pHznpc and pHiep values reported (often greater than 2 pH units) for the same mineral phase in separate studies (14). Careful attention to pretreatment procedures are especially critical for hydrothermal titrations as clearly illustrated in Figure 3 for a series Tioxide rutile surface charge titrations conducted between 25 and 250oC. In these experiments, the micromoles of “excess” or “missing” protons in the test solution at each point in the titration, divided by the total surface area of solid titrated, is the quantity of interest. In the absence of any side reactions, this can be converted to proton-induced surface charge via the relationship,
(“solution excess or deficit” µmols H+/m2) x (-F) = σH [1] where σH is the proton-induced surface charge density in C·m-2 and F is the Faraday constant (96485 C·mol-1). The negative sign before F in Equation [1] indicates that excess H+ in solution corresponds to a deficit on the mineral surface (or an excess of OH-
), giving a negative proton-induced surface charge. Likewise, a deficit of H+ in solution, defined as a negative quantity in Equation [1], results in a positive calculated surface charge density. The solid symbols in Figure 3 refer to results obtained after hydrothermal pretreatment in a Teflon-lined reaction vessel for 2-3 weeks at 200oC in distilled-deionized water. This pretreatment step resulted in the titration curves at all ionic strengths for each temperature intersecting very close to the zero proton condition (given as σH = 0), signifying that the corresponding pH value is indeed the pHznpc. Note that these pHznpc values decrease with increasing temperature, from 5.4 at 25oC, to 4.2 at 250oC. Conversely, without a final hydrothermal pretreatment step titration curves are progressively shifted in a negative surface charge direction with increasing temperature, and the common intersection point is less clearly defined. In this instance, the shift is thought to result from the release of residual HCl (remaining from the synthesis procedure) from the rutile crystallites (9, 11). Consequently, our hydrothermal titrations now routinely include a final hydrothermal ageing step in distilled-deionized water (13, 15, 16).
Representative Experimental Results
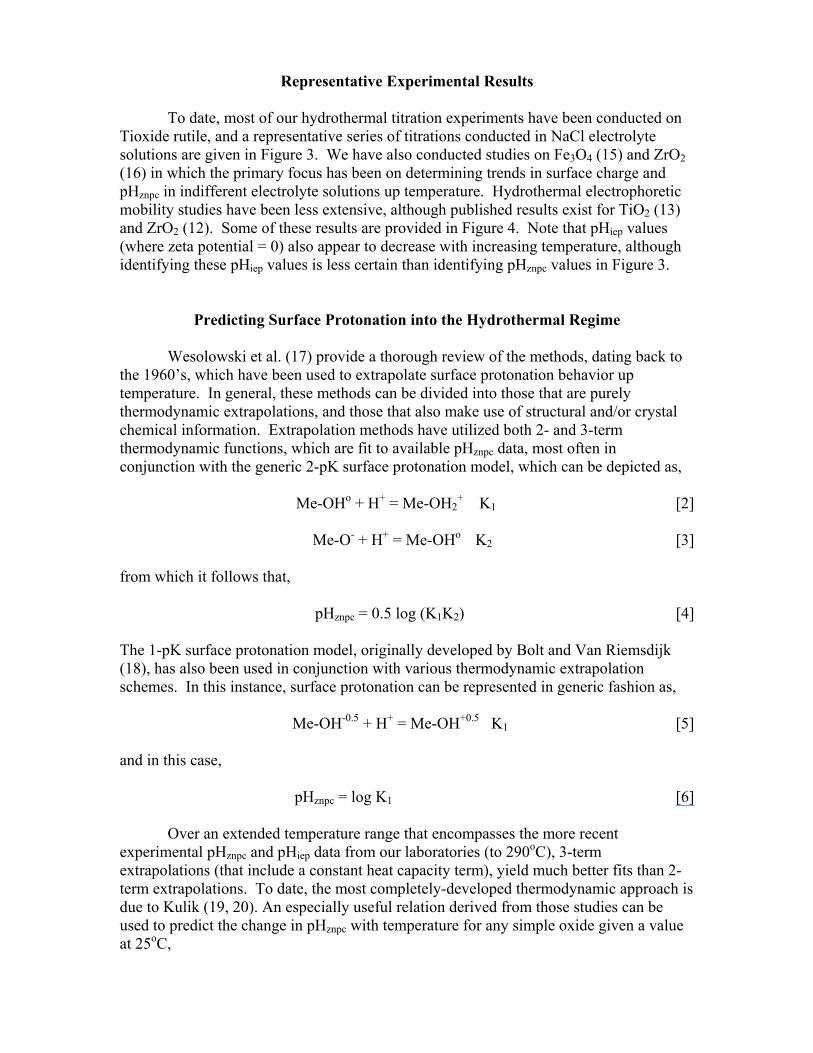
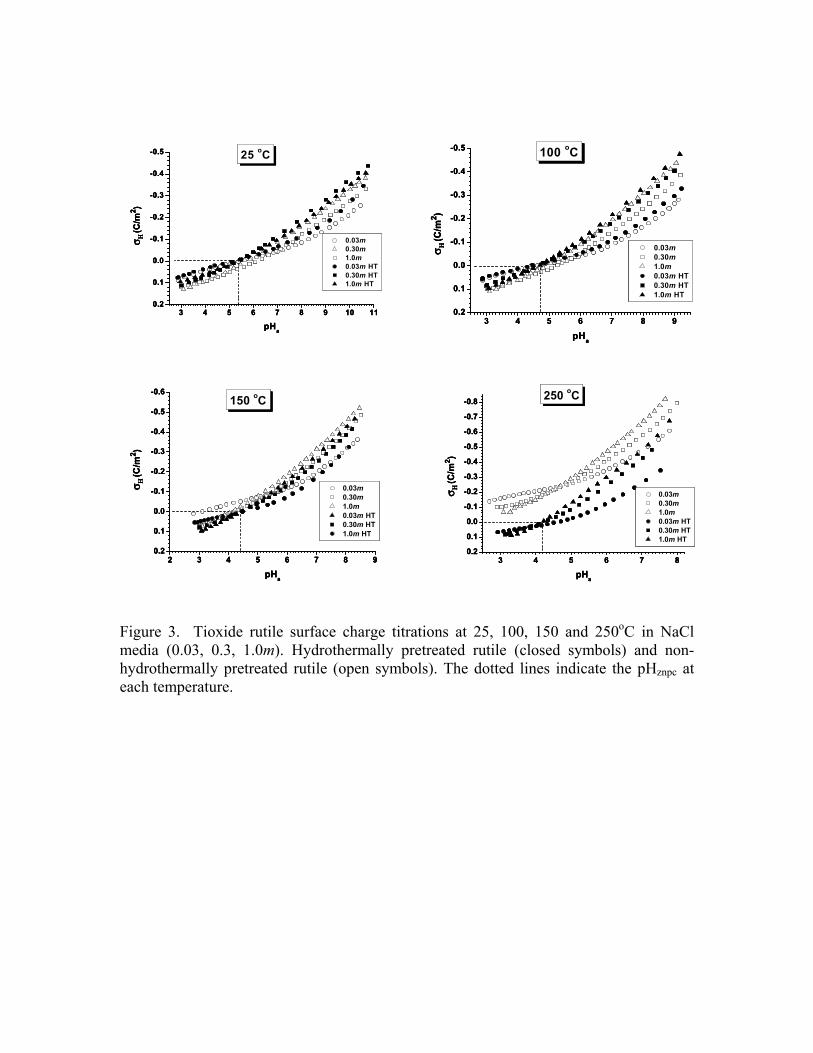
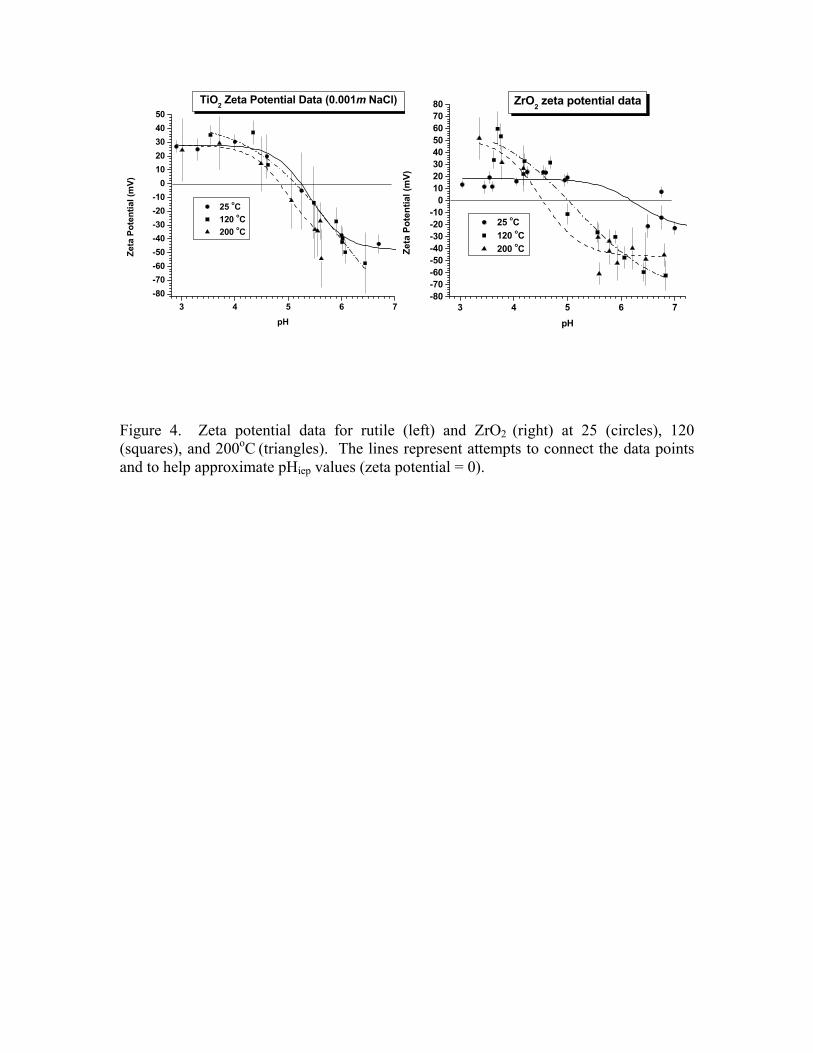
To date, most of our hydrothermal titration experiments have been conducted on Tioxide rutile, and a representative series of titrations conducted in NaCl electrolyte solutions are given in Figure 3. We have also conducted studies on Fe3O4 (15) and ZrO2 (16) in which the primary focus has been on determining trends in surface charge and pHznpc in indifferent electrolyte solutions up temperature. Hydrothermal electrophoretic mobility studies have been less extensive, although published results exist for TiO2 (13) and ZrO2 (12). Some of these results are provided in Figure 4. Note that pHiep values (where zeta potential = 0) also appear to decrease with increasing temperature, although identifying these pHiep values is less certain than identifying pHznpc values in Figure 3.
Predicting Surface Protonation into the Hydrothermal Regime
Wesolowski et al. (17) provide a thorough review of the methods, dating back to the 1960’s, which have been used to extrapolate surface protonation behavior up temperature. In general, these methods can be divided into those that are purely thermodynamic extrapolations, and those that also make use of structural and/or crystal chemical information. Extrapolation methods have utilized both 2- and 3-term thermodynamic functions, which are fit to available pHznpc data, most often in conjunction with the generic 2-pK surface protonation model, which can be depicted as,
Me-OHo + H+ = Me-OH2+ K1 [2]
Me-O- + H+ = Me-OHo K2 [3]
from which it follows that,
pHznpc = 0.5 log (K1K2) [4] The 1-pK surface protonation model, originally developed by Bolt and Van Riemsdijk (18), has also been used in conjunction with various thermodynamic extrapolation schemes. In this instance, surface protonation can be represented in generic fashion as,
Me-OH-0.5 + H+ = Me-OH+0.5 K1 [5] and in this case,
pHznpc = log K1 [6] Over an extended temperature range that encompasses the more recent experimental pHznpc and pHiep data from our laboratories (to 290oC), 3-term extrapolations (that include a constant heat capacity term), yield much better fits than 2-term extrapolations. To date, the most completely-developed thermodynamic approach is due to Kulik (19, 20). An especially useful relation derived from those studies can be used to predict the change in pHznpc with temperature for any simple oxide given a value at 25oC,
pHznpc,T = -29.134 + [ (T298.15/T) (pHznpc, 298.15 + 3.2385)] + 4.545 lnT [7] This predictive relationship assumes that both the standard entropy of surface protonation (∆So
prot, 298) and the corresponding heat capacity (∆Cpoprot, 298) are constant at 25 and 87 J·
K-1·mol-1, respectively, for all oxide surfaces. These standard values were derived from a 3-term thermodynamic fit of the pHznpc values for rutile to 250oC (9). Both Sverjensky and Sahai (21) and Machesky et al. (22) have developed schemes that utilize structural and/or crystal chemical information to help predict the temperature dependence of surface protonation or corresponding pHznpc and pHiep values. Sverjensky and Sahai (21) combined Born solvation and Pauling bond valence theory with least squares regression of available oxide surface protonation data collected at various temperatures, to derive their predictive equations. However, at the time they derived their relationships, available data were primarily limited to temperatures < 100oC. Accordingly, their fits to those data did not include a constant heat capacity term. As a result, their relations are less consistent with data now available for several oxides to 290oC, although their approach could be extended to include those results as well. Machesky et al. (22) extended the revised MUtiSIte Complexation (MUSIC) of Hiemstra et al. (23) to higher temperatures. According to the temperature-extended MUSIC Model, surface protonation constants are estimated from the empirical relationship,
log KH,T = -AT(V + Σ exp((ro – rMe-o)/0.37) + Σ m(sDH) + Σ n(sAH)) [8] where AT is a temperature dependent constant (the slope) obtained from regressions of log KH,T values of homogeneous aqueous metal ion hydrolysis reactions (from 0 to 300oC) versus the “undersaturation of charge” on the respective oxygen ligands, V is the formal valence of oxygen (-2) and Σ exp((ro - rSn-o)/0.37) is the sum (over 1, 2 or 3 for single, double or triple coordination, respectively, of surface oxygen’s with coordinated metal ions in the truncated crystal structure) of the bond valence values for the metal-oxygen bonds of interest. These bond valence values are estimated using the relevant metal-oxygen bond lengths (rMe-o), a reference bond length (ro) which we calculate from the bulk crystal structure, and an empirical constant (0.37) as detailed in (24). The remaining terms account for hydrogen bonding to surface oxygens, where m is the number of donating hydrogen bonds to associated water molecules (requires that an H atom is present in the surface complex), n is the number of accepting H-bonds from adsorbed water molecules, and sDH and sAH are the assumed valence contributions of donating and accepting H-bonds, respectively. MUSIC model outputs include both the partial charges of protolyzable surface oxygens and their protonation constants, from which it is then possible to calculate the pHznpc of a surface. These estimated pHznpc values can then be compared to those determined experimentally. Typically, bulk crystal bond lengths and bulk water H-bonding configurations have been used to derive MUSIC Model estimates of surface protonation constants and corresponding pHznpc values. In practice, however, the distribution of crystal planes, and/or Me-O and H-bond lengths must usually be modified from ideal values in order that predicted pHznpc values best match those determined experimentally. In fact, Equation [8] above is modified from the original and
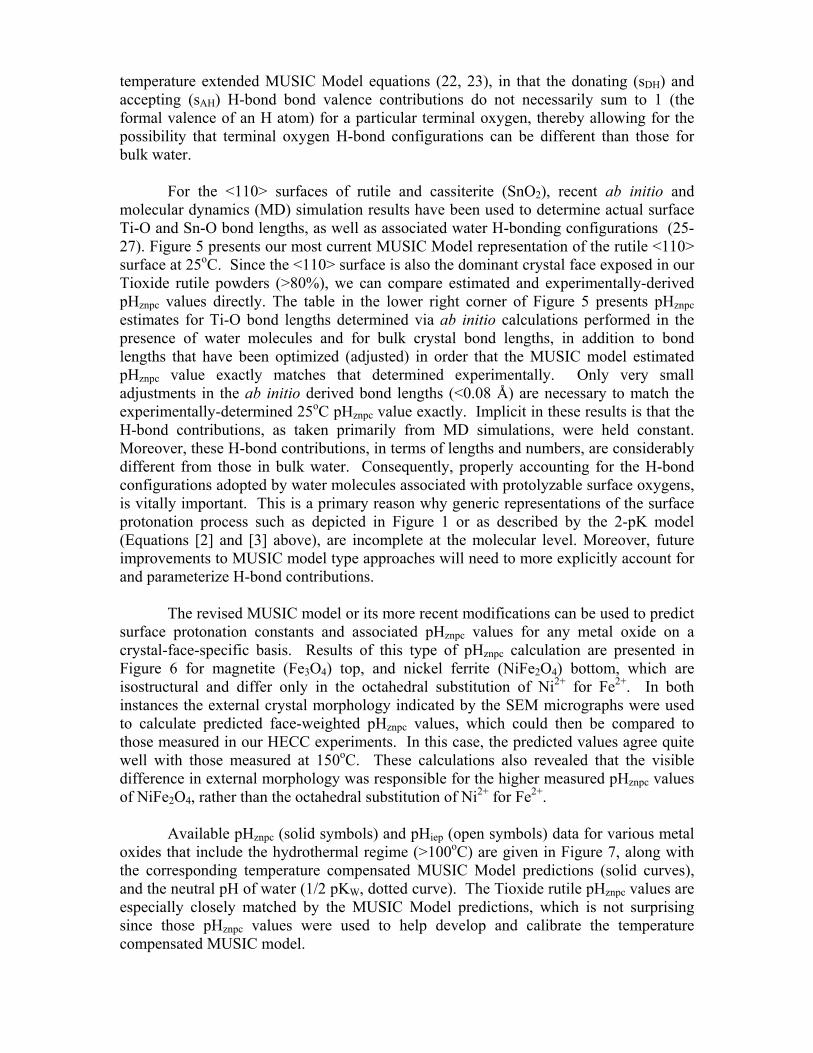
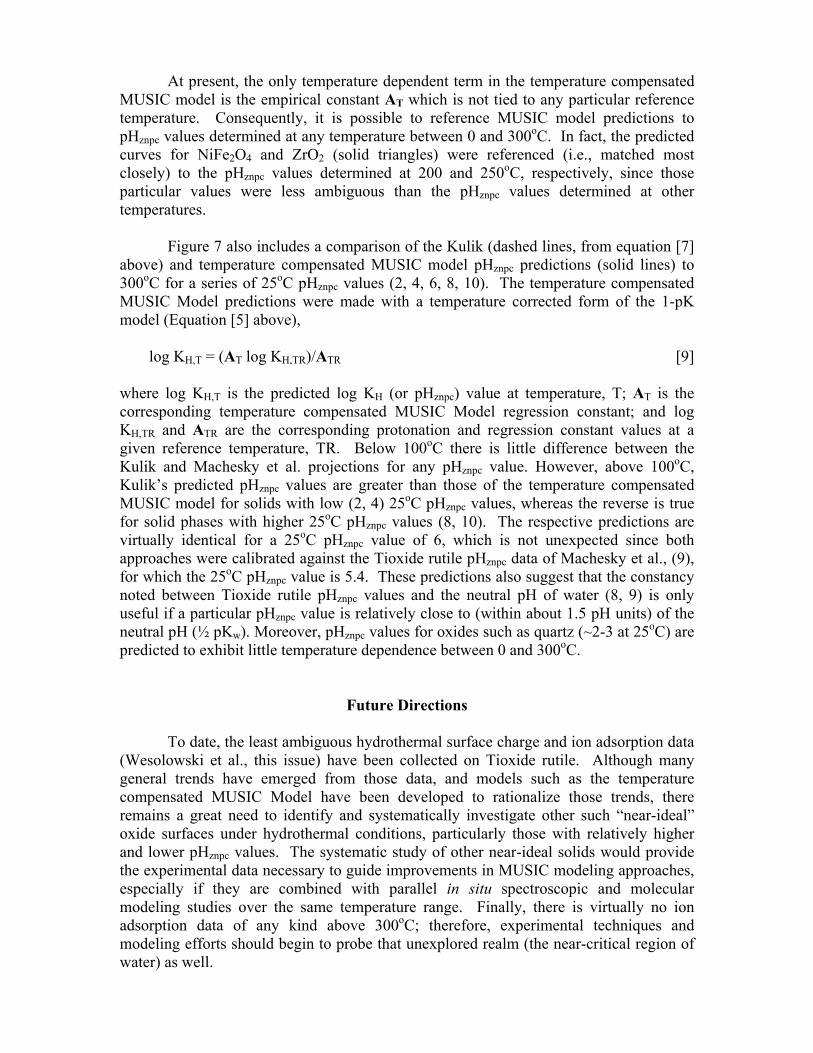
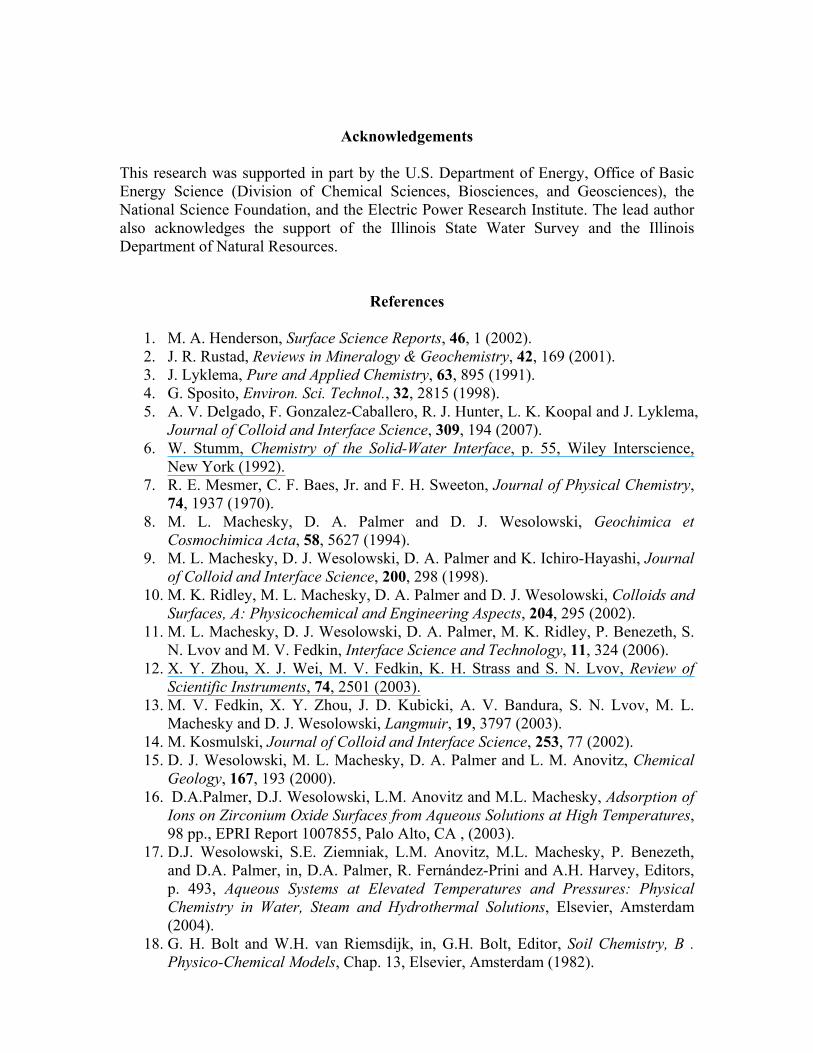
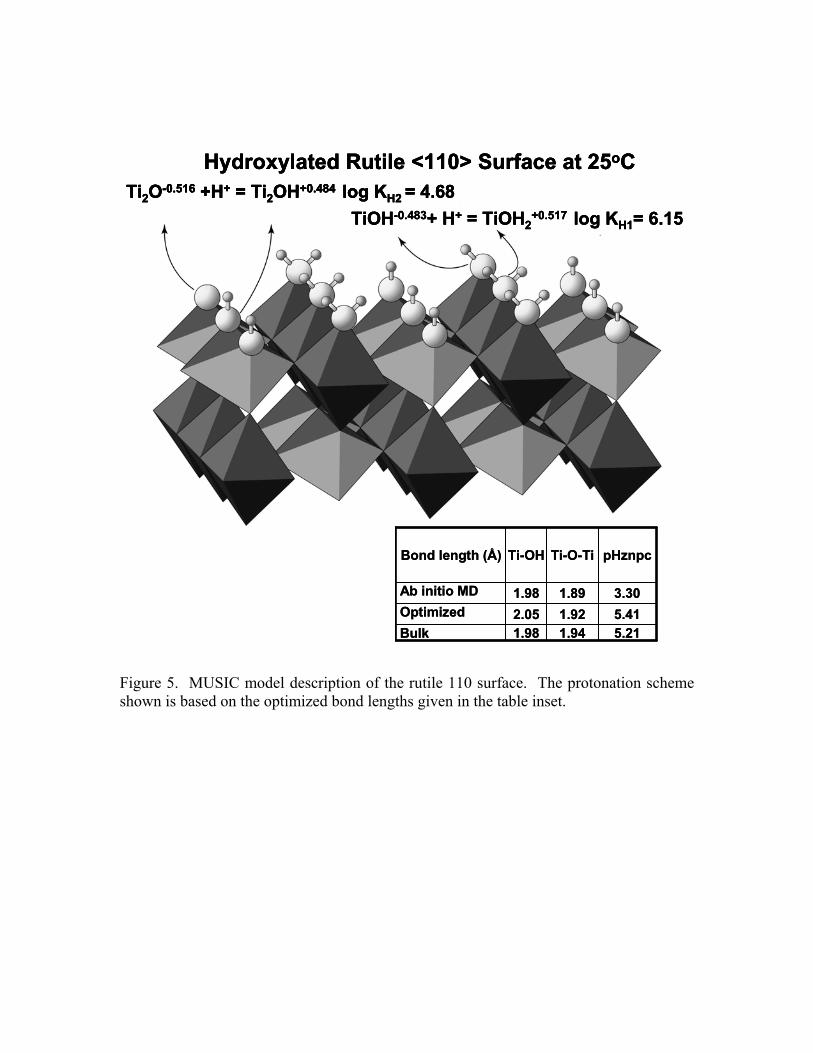
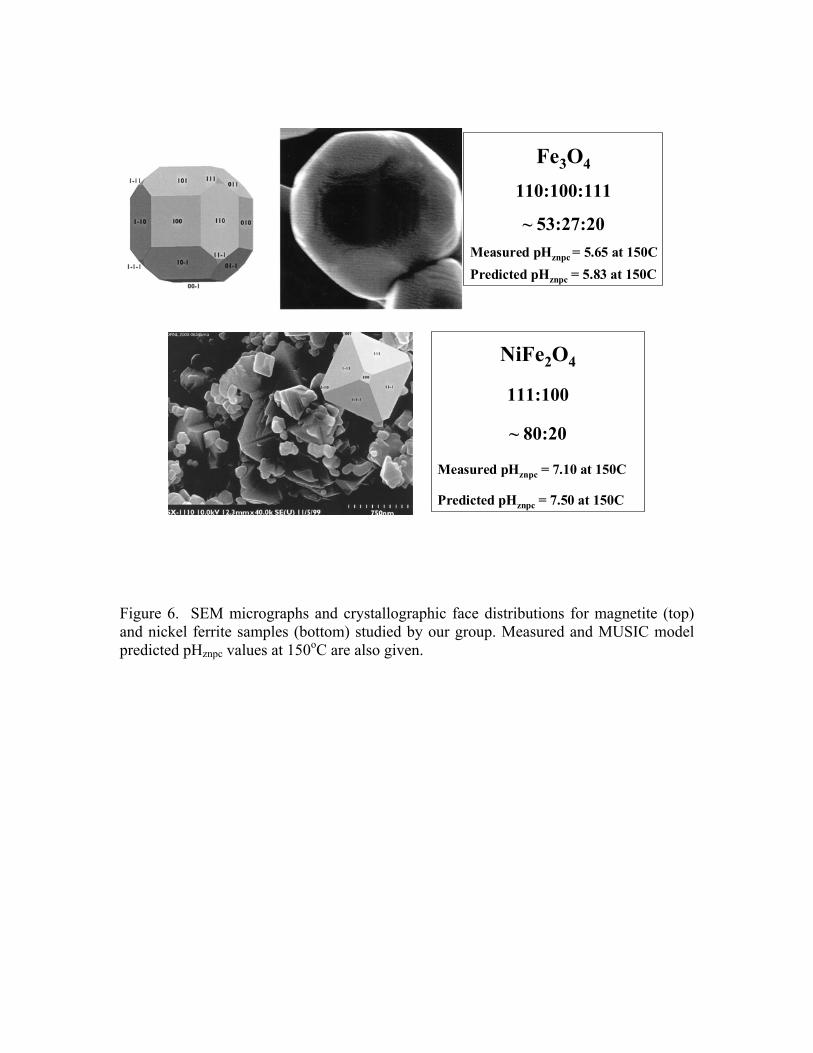
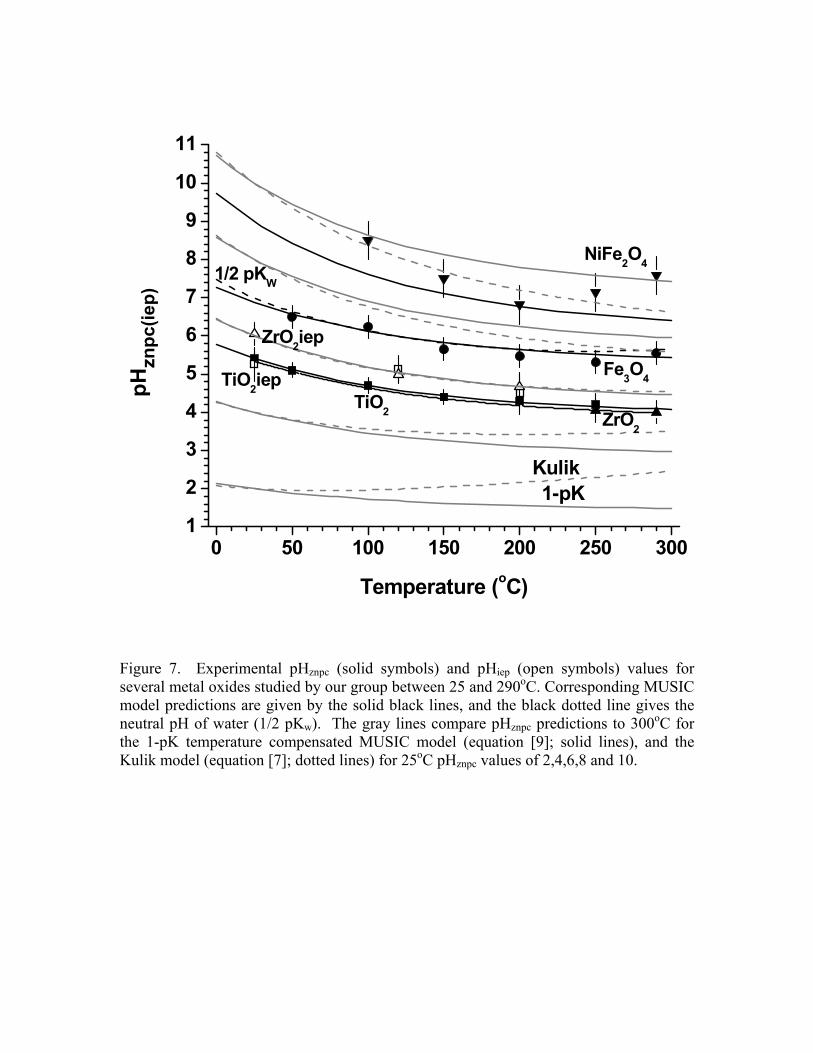
temperature extended MUSIC Model equations (22, 23), in that the donating (sDH) and accepting (sAH) H-bond bond valence contributions do not necessarily sum to 1 (the formal valence of an H atom) for a particular terminal oxygen, thereby allowing for the possibility that terminal oxygen H-bond configurations can be different than those for bulk water. For the <110> surfaces of rutile and cassiterite (SnO2), recent ab initio and molecular dynamics (MD) simulation results have been used to determine actual surface Ti-O and Sn-O bond lengths, as well as associated water H-bonding configurations (25-27). Figure 5 presents our most current MUSIC Model representation of the rutile <110> surface at 25oC. Since the <110> surface is also the dominant crystal face exposed in our Tioxide rutile powders (>80%), we can compare estimated and experimentally-derived pHznpc values directly. The table in the lower right corner of Figure 5 presents pHznpc estimates for Ti-O bond lengths determined via ab initio calculations performed in the presence of water molecules and for bulk crystal bond lengths, in addition to bond lengths that have been optimized (adjusted) in order that the MUSIC model estimated pHznpc value exactly matches that determined experimentally. Only very small adjustments in the ab initio derived bond lengths (<0.08 Å) are necessary to match the experimentally-determined 25oC pHznpc value exactly. Implicit in these results is that the H-bond contributions, as taken primarily from MD simulations, were held constant. Moreover, these H-bond contributions, in terms of lengths and numbers, are considerably different from those in bulk water. Consequently, properly accounting for the H-bond configurations adopted by water molecules associated with protolyzable surface oxygens, is vitally important. This is a primary reason why generic representations of the surface protonation process such as depicted in Figure 1 or as described by the 2-pK model (Equations [2] and [3] above), are incomplete at the molecular level. Moreover, future improvements to MUSIC model type approaches will need to more explicitly account for and parameterize H-bond contributions. The revised MUSIC model or its more recent modifications can be used to predict surface protonation constants and associated pHznpc values for any metal oxide on a crystal-face-specific basis. Results of this type of pHznpc calculation are presented in Figure 6 for magnetite (Fe3O4) top, and nickel ferrite (NiFe2O4) bottom, which are isostructural and differ only in the octahedral substitution of Ni2+ for Fe2+. In both instances the external crystal morphology indicated by the SEM micrographs were used to calculate predicted face-weighted pHznpc values, which could then be compared to those measured in our HECC experiments. In this case, the predicted values agree quite well with those measured at 150oC. These calculations also revealed that the visible difference in external morphology was responsible for the higher measured pHznpc values of NiFe2O4, rather than the octahedral substitution of Ni2+ for Fe2+. Available pHznpc (solid symbols) and pHiep (open symbols) data for various metal oxides that include the hydrothermal regime (>100oC) are given in Figure 7, along with the corresponding temperature compensated MUSIC Model predictions (solid curves), and the neutral pH of water (1/2 pKW, dotted curve). The Tioxide rutile pHznpc values are especially closely matched by the MUSIC Model predictions, which is not surprising since those pHznpc values were used to help develop and calibrate the temperature compensated MUSIC model.
At present, the only temperature dependent term in the temperature compensated MUSIC model is the empirical constant AT which is not tied to any particular reference temperature. Consequently, it is possible to reference MUSIC model predictions to pHznpc values determined at any temperature between 0 and 300oC. In fact, the predicted curves for NiFe2O4 and ZrO2 (solid triangles) were referenced (i.e., matched most closely) to the pHznpc values determined at 200 and 250oC, respectively, since those particular values were less ambiguous than the pHznpc values determined at other temperatures. Figure 7 also includes a comparison of the Kulik (dashed lines, from equation [7] above) and temperature compensated MUSIC model pHznpc predictions (solid lines) to 300oC for a series of 25oC pHznpc values (2, 4, 6, 8, 10). The temperature compensated MUSIC Model predictions were made with a temperature corrected form of the 1-pK model (Equation [5] above),
log KH,T = (AT log KH,TR)/ATR [9] where log KH,T is the predicted log KH (or pHznpc) value at temperature, T; AT is the corresponding temperature compensated MUSIC Model regression constant; and log KH,TR and ATR are the corresponding protonation and regression constant values at a given reference temperature, TR. Below 100oC there is little difference between the Kulik and Machesky et al. projections for any pHznpc value. However, above 100oC, Kulik’s predicted pHznpc values are greater than those of the temperature compensated MUSIC model for solids with low (2, 4) 25oC pHznpc values, whereas the reverse is true for solid phases with higher 25oC pHznpc values (8, 10). The respective predictions are virtually identical for a 25oC pHznpc value of 6, which is not unexpected since both approaches were calibrated against the Tioxide rutile pHznpc data of Machesky et al., (9), for which the 25oC pHznpc value is 5.4. These predictions also suggest that the constancy noted between Tioxide rutile pHznpc values and the neutral pH of water (8, 9) is only useful if a particular pHznpc value is relatively close to (within about 1.5 pH units) of the neutral pH (½ pKw). Moreover, pHznpc values for oxides such as quartz (~2-3 at 25oC) are predicted to exhibit little temperature dependence between 0 and 300oC.
Future Directions
To date, the least ambiguous hydrothermal surface charge and ion adsorption data (Wesolowski et al., this issue) have been collected on Tioxide rutile. Although many general trends have emerged from those data, and models such as the temperature compensated MUSIC Model have been developed to rationalize those trends, there remains a great need to identify and systematically investigate other such “near-ideal” oxide surfaces under hydrothermal conditions, particularly those with relatively higher and lower pHznpc values. The systematic study of other near-ideal solids would provide the experimental data necessary to guide improvements in MUSIC modeling approaches, especially if they are combined with parallel in situ spectroscopic and molecular modeling studies over the same temperature range. Finally, there is virtually no ion adsorption data of any kind above 300oC; therefore, experimental techniques and modeling efforts should begin to probe that unexplored realm (the near-critical region of water) as well.
Acknowledgements
This research was supported in part by the U.S. Department of Energy, Office of Basic Energy Science (Division of Chemical Sciences, Biosciences, and Geosciences), the National Science Foundation, and the Electric Power Research Institute. The lead author also acknowledges the support of the Illinois State Water Survey and the Illinois Department of Natural Resources.
References
1. M. A. Henderson, Surface Science Reports, 46, 1 (2002). 2. J. R. Rustad, Reviews in Mineralogy & Geochemistry, 42, 169 (2001). 3. J. Lyklema, Pure and Applied Chemistry, 63, 895 (1991). 4. G. Sposito, Environ. Sci. Technol., 32, 2815 (1998). 5. A. V. Delgado, F. Gonzalez-Caballero, R. J. Hunter, L. K. Koopal and J. Lyklema,
Journal of Colloid and Interface Science, 309, 194 (2007). 6. W. Stumm, Chemistry of the Solid-Water Interface, p. 55, Wiley Interscience,
New York (1992). 7. R. E. Mesmer, C. F. Baes, Jr. and F. H. Sweeton, Journal of Physical Chemistry,
74, 1937 (1970). 8. M. L. Machesky, D. A. Palmer and D. J. Wesolowski, Geochimica et
Cosmochimica Acta, 58, 5627 (1994). 9. M. L. Machesky, D. J. Wesolowski, D. A. Palmer and K. Ichiro-Hayashi, Journal
of Colloid and Interface Science, 200, 298 (1998). 10. M. K. Ridley, M. L. Machesky, D. A. Palmer and D. J. Wesolowski, Colloids and
Surfaces, A: Physicochemical and Engineering Aspects, 204, 295 (2002). 11. M. L. Machesky, D. J. Wesolowski, D. A. Palmer, M. K. Ridley, P. Benezeth, S.
N. Lvov and M. V. Fedkin, Interface Science and Technology, 11, 324 (2006). 12. X. Y. Zhou, X. J. Wei, M. V. Fedkin, K. H. Strass and S. N. Lvov, Review of
Scientific Instruments, 74, 2501 (2003). 13. M. V. Fedkin, X. Y. Zhou, J. D. Kubicki, A. V. Bandura, S. N. Lvov, M. L.
Machesky and D. J. Wesolowski, Langmuir, 19, 3797 (2003). 14. M. Kosmulski, Journal of Colloid and Interface Science, 253, 77 (2002). 15. D. J. Wesolowski, M. L. Machesky, D. A. Palmer and L. M. Anovitz, Chemical
Geology, 167, 193 (2000). 16. D.A.Palmer, D.J. Wesolowski, L.M. Anovitz and M.L. Machesky, Adsorption of
Ions on Zirconium Oxide Surfaces from Aqueous Solutions at High Temperatures, 98 pp., EPRI Report 1007855, Palo Alto, CA , (2003).
17. D.J. Wesolowski, S.E. Ziemniak, L.M. Anovitz, M.L. Machesky, P. Benezeth, and D.A. Palmer, in, D.A. Palmer, R. Fernández-Prini and A.H. Harvey, Editors, p. 493, Aqueous Systems at Elevated Temperatures and Pressures: Physical Chemistry in Water, Steam and Hydrothermal Solutions, Elsevier, Amsterdam (2004).
18. G. H. Bolt and W.H. van Riemsdijk, in, G.H. Bolt, Editor, Soil Chemistry, B . Physico-Chemical Models, Chap. 13, Elsevier, Amsterdam (1982).
19. D. A. Kulik, Geochimica et Cosmochimica Acta, 64, 3161 (2000). 20. D. A. Kulik, Interface Science and Technology, 11, 171 (2006). 21. D.A. Sverjensky and N. Sahai, Geochim. Cosmochim. Acta, 62, 3703 (1998). 22. M. L. Machesky, D. J. Wesolowski, D. A. Palmer and M. K. Ridley, Journal of
Colloid and Interface Science, 239, 314 (2001). 23. T. Hiemstra, P. Venema and W. H. VanRiemsdijk, Journal of Colloid and
Interface Science, 184, 680 (1996). 24. I. D. Brown, The Chemical Bond in Inorganic Chemistry-The Bond Valence
Model, Oxford University Press, New York (2002). 25. Z. Zhang, P. Fenter, L. Chang, N.C. Sturchio, M.J. Bedzyk, M. Predota, A.
Bandura, J.D. Kubicki, S.N. Lvov, P.T. Cummings, A.A. Chialvo, M.K. Ridley, P. Benezeth, L. Anovitz, D.A. Palmer, M.L. Machesky and D.J. Wesolowski, Langmuir 20, 4954 (2004).
26. M. Predota, M. L. Machesky, D. J. Wesolowski and P. T. Cummings, Advances in Science and Technology (Faenza, Italy), 42, 581 (2004).
27. L. Vlcek, Z. Zhang, M. L. Machesky, P. Fenter, J. Rosenqvist, D. J. Wesolowski, L. M. Anovitz, M. Predota and P. T. Cummings, Langmuir, 23, 4925 (2007).
▬Ti▬O▬Ti▬O▬
▬O▬Ti▬O▬Ti▬
▬Ti▬O▬Ti▬O▬
▬Ti▬O▬Ti▬O▬
▬O▬Ti▬O▬Ti▬
▬Ti▬O▬Ti▬O▬
OH H
OH H
▬Ti▬O▬Ti▬O▬
▬O▬Ti▬O▬Ti▬
▬Ti▬O▬Ti▬O▬
OH
HOH
H
Under coordinated metal oxide surface
Associative H2O adsorption Dissociative H2O adsorption
▬Ti▬O▬Ti▬O▬
▬O▬Ti▬O▬Ti▬
▬Ti▬O▬Ti▬O▬
▬Ti▬O▬Ti▬O▬
▬O▬Ti▬O▬Ti▬
▬Ti▬O▬Ti▬O▬
▬Ti▬O▬Ti▬O▬
▬O▬Ti▬O▬Ti▬
▬Ti▬O▬Ti▬O▬
▬Ti▬O▬Ti▬O▬
▬O▬Ti▬O▬Ti▬
▬Ti▬O▬Ti▬O▬
OH H
OH H
▬Ti▬O▬Ti▬O▬
▬O▬Ti▬O▬Ti▬
▬Ti▬O▬Ti▬O▬
▬Ti▬O▬Ti▬O▬
▬O▬Ti▬O▬Ti▬
▬Ti▬O▬Ti▬O▬
▬Ti▬O▬Ti▬O▬
▬O▬Ti▬O▬Ti▬
▬Ti▬O▬Ti▬O▬
OH H
OH H
OH H
OH H
▬Ti▬O▬Ti▬O▬
▬O▬Ti▬O▬Ti▬
▬Ti▬O▬Ti▬O▬
OH
HOH
H
▬Ti▬O▬Ti▬O▬
▬O▬Ti▬O▬Ti▬
▬Ti▬O▬Ti▬O▬
OH
HOH
H
▬Ti▬O▬Ti▬O▬
▬O▬Ti▬O▬Ti▬
▬Ti▬O▬Ti▬O▬
▬Ti▬O▬Ti▬O▬
▬O▬Ti▬O▬Ti▬
▬Ti▬O▬Ti▬O▬
▬Ti▬O▬Ti▬O▬
▬O▬Ti▬O▬Ti▬
▬Ti▬O▬Ti▬O▬
OH
HOH
H
Under coordinated metal oxide surface
Associative H2O adsorption Dissociative H2O adsorption
▬Ti▬O▬Ti▬O▬
▬O▬Ti▬O▬Ti▬
▬Ti▬O▬Ti▬O▬
OH
HOH
H
▬Ti▬O▬Ti▬O▬
▬O▬Ti▬O▬Ti▬
▬Ti▬O▬Ti▬O▬
OH
HOH
HH H+ + H
▬Ti▬O▬Ti▬O▬
▬O▬Ti▬O▬Ti▬
▬Ti▬O▬Ti▬O▬
OOH
▬ ▬
pH dependent surface charge developmentNeutral surface
Positive surface (low pH) Negative surface (high pH)
▬Ti▬O▬Ti▬O▬
▬O▬Ti▬O▬Ti▬
▬Ti▬O▬Ti▬O▬
OH
HOH
H
▬Ti▬O▬Ti▬O▬
▬O▬Ti▬O▬Ti▬
▬Ti▬O▬Ti▬O▬
OH
HOH
H
▬Ti▬O▬Ti▬O▬
▬O▬Ti▬O▬Ti▬
▬Ti▬O▬Ti▬O▬
▬Ti▬O▬Ti▬O▬
▬O▬Ti▬O▬Ti▬
▬Ti▬O▬Ti▬O▬
▬Ti▬O▬Ti▬O▬
▬O▬Ti▬O▬Ti▬
▬Ti▬O▬Ti▬O▬
OH
HOH
H
▬Ti▬O▬Ti▬O▬
▬O▬Ti▬O▬Ti▬
▬Ti▬O▬Ti▬O▬
OH
HOH
HH H+ +
▬Ti▬O▬Ti▬O▬
▬O▬Ti▬O▬Ti▬
▬Ti▬O▬Ti▬O▬
OH
HOH
H
▬Ti▬O▬Ti▬O▬
▬O▬Ti▬O▬Ti▬
▬Ti▬O▬Ti▬O▬
OH
HOH
H
▬Ti▬O▬Ti▬O▬
▬O▬Ti▬O▬Ti▬
▬Ti▬O▬Ti▬O▬
▬Ti▬O▬Ti▬O▬
▬O▬Ti▬O▬Ti▬
▬Ti▬O▬Ti▬O▬
▬Ti▬O▬Ti▬O▬
▬O▬Ti▬O▬Ti▬
▬Ti▬O▬Ti▬O▬
OH
HOH
HHH HH+ + H
▬Ti▬O▬Ti▬O▬
▬O▬Ti▬O▬Ti▬
▬Ti▬O▬Ti▬O▬
OOH
▬ ▬
H
▬Ti▬O▬Ti▬O▬
▬O▬Ti▬O▬Ti▬
▬Ti▬O▬Ti▬O▬
OOH
▬ ▬
HH
▬Ti▬O▬Ti▬O▬
▬O▬Ti▬O▬Ti▬
▬Ti▬O▬Ti▬O▬
OOH
▬ ▬
▬Ti▬O▬Ti▬O▬
▬O▬Ti▬O▬Ti▬
▬Ti▬O▬Ti▬O▬
▬Ti▬O▬Ti▬O▬
▬O▬Ti▬O▬Ti▬
▬Ti▬O▬Ti▬O▬
▬Ti▬O▬Ti▬O▬
▬O▬Ti▬O▬Ti▬
▬Ti▬O▬Ti▬O▬
OOH
▬ ▬
pH dependent surface charge developmentNeutral surface
Positive surface (low pH) Negative surface (high pH)
Figure 1. Associative and dissociative water adsorption (top) and surface charge development (bottom) for a generic titanium oxide surface.
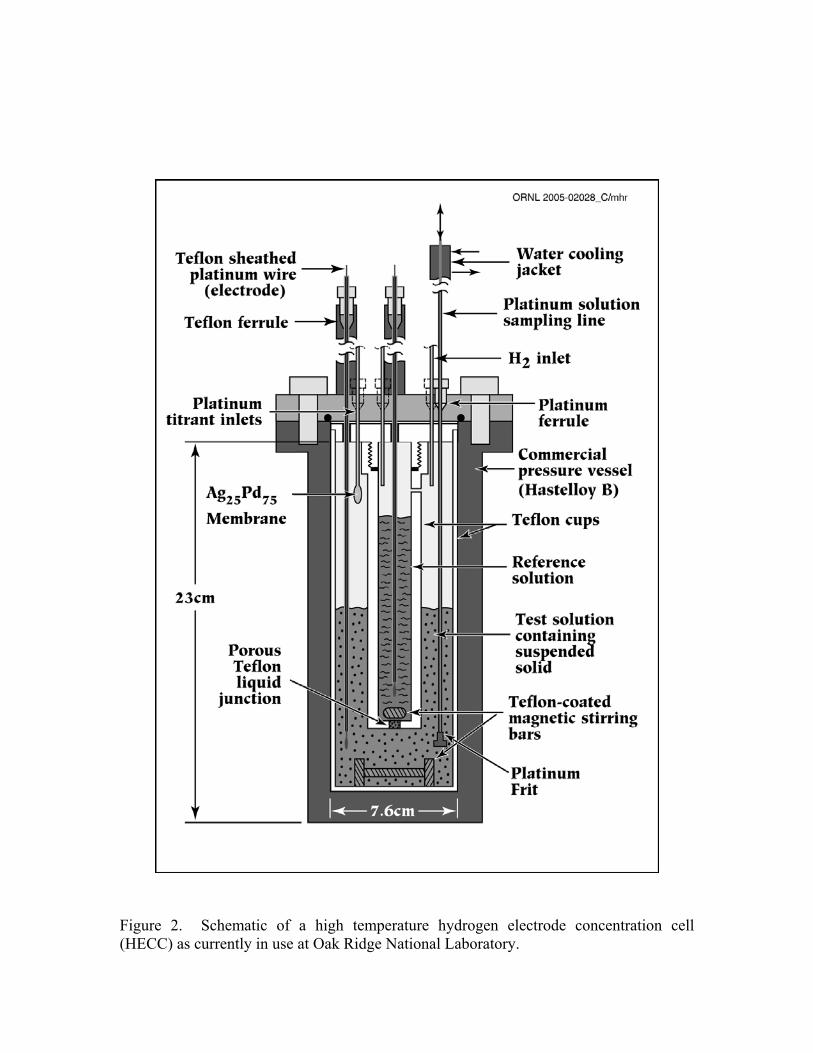
Figure 2. Schematic of a high temperature hydrogen electrode concentration cell (HECC) as currently in use at Oak Ridge National Laboratory.
3 4 5 6 7 8 9 10 110.2
0.1
0.0
-0.1
-0.2
-0.3
-0.4
-0.5 25 oC
0.03m 0.30m 1.0m 0.03m HT 0.30m HT 1.0m HT
σ Η (C
/m2 )
pHa3 4 5 6 7 8 9
0.2
0.1
0.0
-0.1
-0.2
-0.3
-0.4
-0.5 100 oC
σ Η (C
/m2 )
0.03m 0.30m 1.0m 0.03m HT 0.30m HT 1.0m HT
pHa
2 3 4 5 6 7 8 90.2
0.1
0.0
-0.1
-0.2
-0.3
-0.4
-0.5
-0.6
0.03m 0.30m 1.0m 0.03m HT 0.30m HT 1.0m HT
σ Η (C
/m2 )
pHa
150 oC
3 4 5 6 7 80.2
0.1
0.0
-0.1
-0.2
-0.3
-0.4
-0.5
-0.6
-0.7
-0.8 250 oC
0.03m 0.30m 1.0m 0.03m HT 0.30m HT 1.0m HT
σ Η (C
/m2 )
pHa
3 4 5 6 7 8 9 10 110.2
0.1
0.0
-0.1
-0.2
-0.3
-0.4
-0.5 25 oC
0.03m 0.30m 1.0m 0.03m HT 0.30m HT 1.0m HT
σ Η (C
/m2 )
pHa3 4 5 6 7 8 9
0.2
0.1
0.0
-0.1
-0.2
-0.3
-0.4
-0.5 100 oC
σ Η (C
/m2 )
0.03m 0.30m 1.0m 0.03m HT 0.30m HT 1.0m HT
pHa
3 4 5 6 7 8 9 10 110.2
0.1
0.0
-0.1
-0.2
-0.3
-0.4
-0.5 25 oC
0.03m 0.30m 1.0m 0.03m HT 0.30m HT 1.0m HT
σ Η (C
/m2 )
pHa3 4 5 6 7 8 9
0.2
0.1
0.0
-0.1
-0.2
-0.3
-0.4
-0.5 100 oC
σ Η (C
/m2 )
0.03m 0.30m 1.0m 0.03m HT 0.30m HT 1.0m HT
pHa
2 3 4 5 6 7 8 90.2
0.1
0.0
-0.1
-0.2
-0.3
-0.4
-0.5
-0.6
0.03m 0.30m 1.0m 0.03m HT 0.30m HT 1.0m HT
σ Η (C
/m2 )
pHa
150 oC
3 4 5 6 7 80.2
0.1
0.0
-0.1
-0.2
-0.3
-0.4
-0.5
-0.6
-0.7
-0.8 250 oC
0.03m 0.30m 1.0m 0.03m HT 0.30m HT 1.0m HT
σ Η (C
/m2 )
pHa
2 3 4 5 6 7 8 90.2
0.1
0.0
-0.1
-0.2
-0.3
-0.4
-0.5
-0.6
0.03m 0.30m 1.0m 0.03m HT 0.30m HT 1.0m HT
σ Η (C
/m2 )
pHa
150 oC
3 4 5 6 7 80.2
0.1
0.0
-0.1
-0.2
-0.3
-0.4
-0.5
-0.6
-0.7
-0.8 250 oC
0.03m 0.30m 1.0m 0.03m HT 0.30m HT 1.0m HT
σ Η (C
/m2 )
pHa
Figure 3. Tioxide rutile surface charge titrations at 25, 100, 150 and 250oC in NaCl media (0.03, 0.3, 1.0m). Hydrothermally pretreated rutile (closed symbols) and non-hydrothermally pretreated rutile (open symbols). The dotted lines indicate the pHznpc at each temperature.
3 4 5 6 7-80-70-60-50-40-30-20-10
01020304050
25 oC 120 oC 200 oC
Zeta
Pot
entia
l (m
V)
pH
TiO2 Zeta Potential Data (0.001m NaCl)
3 4 5 6 7-80-70-60-50-40-30-20-10
01020304050607080
25 oC 120 oC 200 oCZe
ta P
oten
tial (
mV)
pH
ZrO2 zeta potential data
Figure 4. Zeta potential data for rutile (left) and ZrO2 (right) at 25 (circles), 120 (squares), and 200oC (triangles). The lines represent attempts to connect the data points and to help approximate pHiep values (zeta potential = 0).
Hydroxylated Rutile <110> Surface at 25oCTi2O-0.516 +H+ = Ti2OH+0.484 log KH2 = 4.68
TiOH-0.483+ H+ = TiOH2+0.517 log KH1= 6.15
Hydroxylated Rutile <110> Surface at 25oCTi2O-0.516 +H+ = Ti2OH+0.484 log KH2 = 4.68
TiOH-0.483+ H+ = TiOH2+0.517 log KH1= 6.15
Hydroxylated Rutile <110> Surface at 25oCTi2O-0.516 +H+ = Ti2OH+0.484 log KH2 = 4.68
TiOH-0.483+ H+ = TiOH2+0.517 log KH1= 6.15
Ti2O-0.516 +H+ = Ti2OH+0.484 log KH2 = 4.68TiOH-0.483+ H+ = TiOH2
+0.517 log KH1= 6.15
5.411.922.05Optimized5.211.941.98Bulk
3.301.891.98Ab initio MD
pHznpcTi-O-TiTi-OHBond length (Å)
5.411.922.05Optimized5.211.941.98Bulk
3.301.891.98Ab initio MD
pHznpcTi-O-TiTi-OHBond length (Å)
Figure 5. MUSIC model description of the rutile 110 surface. The protonation scheme shown is based on the optimized bond lengths given in the table inset.
Fe3O4
110:100:111
~ 53:27:20Measured pHznpc = 5.65 at 150CPredicted pHznpc = 5.83 at 150C
NiFe2O4
111:100
~ 80:20
Measured pHznpc = 7.10 at 150C
Predicted pHznpc = 7.50 at 150C
Figure 6. SEM micrographs and crystallographic face distributions for magnetite (top) and nickel ferrite samples (bottom) studied by our group. Measured and MUSIC model predicted pHznpc values at 150oC are also given.
0 50 100 150 200 250 3001
2
3
4
5
6
7
8
9
10
11
1-pK
TiO2iep
ZrO2iep
pHzn
pc(ie
p)
Temperature (oC)
NiFe2O41/2 pKW
Fe3O4
TiO2 ZrO2
Kulik
Figure 7. Experimental pHznpc (solid symbols) and pHiep (open symbols) values for several metal oxides studied by our group between 25 and 290oC. Corresponding MUSIC model predictions are given by the solid black lines, and the black dotted line gives the neutral pH of water (1/2 pKw). The gray lines compare pHznpc predictions to 300oC for the 1-pK temperature compensated MUSIC model (equation [9]; solid lines), and the Kulik model (equation [7]; dotted lines) for 25oC pHznpc values of 2,4,6,8 and 10.
Related Documents