The prostaglandin D 2 pathway in rhinovirus-induced asthma exacerbations A thesis submitted to Imperial College for the degree of Doctor of Philosophy by Dr Hugo Andres Farne National Heart & Lung Institute Imperial College London August 2018

Welcome message from author
This document is posted to help you gain knowledge. Please leave a comment to let me know what you think about it! Share it to your friends and learn new things together.
Transcript
The prostaglandin D2 pathway in
rhinovirus-induced asthma exacerbations
A thesis submitted to Imperial College for the degree of Doctor of Philosophy by
Dr Hugo Andres Farne
National Heart & Lung Institute
Imperial College London
August 2018
2/233
Declaration of Originality
I declare that the work presented in this thesis was undertaken by myself, under the
supervision of Professor Sebastian Johnston, Dr David Jackson and Dr Mike Edwards, unless
otherwise stated.
Specifically, I was present and undertook the clinical assessments and sampling for nearly
every screening and sampling visit, with a small number covered by our research nurse,
Belen Trujillo-Torralbo. I carried out measurement of serum neutralizing antibodies and the
measurement of virus load by Taqman for a proportion of the samples, the remainder being
completed by research assistants Tatiana Kebadze and Julia Aniscenko respectively. I
performed the measurement of soluble mediators in the samples by multiple immunoassay
(using the Meso Scale Delivery (MSD) platform) and a prostaglandin D2 (PGD2)-MOX assay,
with the support of another research assistant for the MSD assay, Eteri Bakhsoliani. I was
assisted in the flow cytometry by Dr Nick Glanville. The Bronchial Epithelial Cell (BEC)
cultures and ex vivo experiments were set up by Dr Mike Edwards and Kate Strong, while
the immunohistochemistry was performed by Dr Jie Zhu.
Dr Hugo Farne
August 2018
3/233
Copyright declaration
‘The copyright of this thesis rests with the author and is made available under a Creative Commons Attribution Non-Commercial No Derivatives licence. Researchers are free to copy, distribute or transmit the thesis on the condition that they attribute it, that they do not use it for commercial purposes and that they do not alter, transform or build upon it. For any reuse or redistribution, researchers must make clear to others the licence terms of this work.’

4/233
Acknowledgements
I would like to thank my supervisors, Professor Sebastian Johnston, Dr David Jackson, and Dr Mike Edwards for their guidance, their patience in reading drafts of this manuscript, and their encouragement when things weren’t working as expected.
As alluded to in the declaration of originality, I am indebted to the other members of the group who contributed to the successful completion of this ambitious project: Belen Trujillo-Torralbo, Tatiana Kebadze, Julia Aniscenko, Eteri Bakhsoliani, Dr Nick Glanville, Kate Strong, Dr Jie Zhu, and the consultants who supervised my bronchoscopies, Dr Patrick Mallia and Professor Onn Min Kon. I really couldn’t have done it without you. Particular thanks goes to Dr Nick Glanville, who was enormously patient with me and gave up far too much of his time out of hours, and did so with good humour. I owe you.
For their moral support, thanks to my comrades in clinical academia, principally Dr Jaideep Dhariwal, Dr Aran Singanayagam, Dr Ernie Wong, but also Dr Andy Ritchie and Dr Doug Fink who have been on this journey with me.
I would like to take this rare opportunity to thank my family in print. My parents brought me up to have a curious mind and compassion for others, which no doubt led to my interest in clinical research. Thank you for my education.
Last but not least, my wife Camilla. The greatest success of the last three years of research was getting married to you. Your presence has been a rock throughout the ups and downs of this project; I cannot imagine having done it without your inspiration and support. I hope this message provides some small consolation for all the hours I abandoned you to finish writing.
5/233
Abstract
Background: Despite currently available treatments, many asthma sufferers continue to
experience exacerbations of their disease. This is driven by excess ‘type 2’ inflammation in a
large proportion of these individuals. Antiviral interferon responses are also deficient in
asthma, possibly as a consequence of excess type 2 inflammation.
The CRTH2 receptor is present on cells that are instrumental in promoting type 2
inflammation, and both CRTH2 and its ligand Prostaglandin D2 (PGD2) are upregulated in
asthma, making it an attractive target. Trials to date have only shown that in mild asthma
and stable disease, when presumably type 2 inflammation is quiescent, CRTH2 antagonism
is relatively ineffective.
Methods: The effect of the CRTH2 antagonist OC459 on the type 2 inflammation induced by
experimental rhinovirus infection in asthma was assessed in the placebo-controlled trial. A
parallel mechanistic analysis was conducted to evaluate the effect of OC459 on CRTH2+ cell
recruitment and activation to release type 2 cytokines, on antiviral immunity, and to
understand the relative importance of PGD2-CRTH2 signalling in the pathophysiology of
asthma exacerbations.
Results: Rhinovirus infection resulted in type 2 inflammation and associated worsening of
asthma symptoms and lung function, which were unaffected by treatment with OC459.
PGD2 was not induced by rhinovirus, with little change in CRTH2+ cell numbers in the lungs.
Correlations with alternative proposed regulators of type 2 inflammation suggest IL-33 and
TSLP are the predominant factors during asthma exacerbations. Antiviral immunity was not
altered by OC459.
Conclusion: CRTH2 antagonism did not prevent the virally-induced worsening of asthma
pathology and symptoms. Mechanistic analyses suggests PGD2-CRTH2 signalling is
redundant in the recruitment of type 2 inflammatory cells and induction of type 2 cytokines
in response to viral infection. Absent an effect on type 2 inflammation, it was not possible to
test the hypothesis that this suppresses antiviral immunity.
6/233
Abbreviations
ACK Ammonium-Chloride-Potassium (red blood cell lysis buffer) ACQ Asthma control questionnaire AEC Airway epithelial cell ANOVA analysis of variance AQLQ Asthma Quality of Life Questionnaire ATS American Thoracic Society AUC Area under the curve BAL Bronchoalveolar lavage bdp Beclometasone dipropionate BEBM Bronchial epithelial basal medium BEC Bronchial epithelial cell BEGM Bronchial Epithelial Growth Media BSA Bovine Serum Albumin CCL Chemokine (C-C motif) ligand (e.g. CCL11, CCL17, CCL22, CCL26) CD Cluster of differentiation/designation COX Cyclooxygenases CPE Cytopathic effect CRE Cockroach extract
CRTH2 Chemoattractant receptor-homologous molecule expressed on T helper type 2 (Th2) cells (also known as the DP2 receptor)
CXCL-8 Chemokine (C-X-C motif) ligand 8 DAB Diaminobenzidine DC Dendritic cell DK-PGD₂ 13,14-dihydro-15-keto-PGD₂ (a CRTH2 receptor agonist) DMEM Dulbecco’s modified Eagle's medium DP1 D prostanoid receptor 1 dsDNA Double-stranded DNA dsRNA Double-stranded RNA DTT Dithiothreitol ECP Eosinophil cationic protein EDTA Ethylenediaminetetraacetic acid
EG2 Monoclonal antibody that binds eosinophil cationic protein and eosinophil-derived neurotoxin
ELISA Enzyme-linked immunosorbent assays ERS European Respiratory Society FACS Fluorescence-activated cell sorting FeNO Fractional exhaled nitric oxide FEV1 Forced expiratory volume in 1 second FMO Fluorescence minus one FOXA3 Forkhead box protein A3 FSC Forward scatter G-CSF Granulocyte–colony-stimulating factor GINA Global Initiative for Asthma HDM House dust mite hTK Human tissue kallikrein
7/233
ICAM-1 Intercellular adhesion molecule-1 ICS Inhaled corticosteroids IDO Indoleamine 2,3-dioxygenase IFN Interferon IFNAR IFN-α receptor IFNLR1 IFN-λ receptor 1 Ig Immunoglobulin IL Interleukin IL-4Rα α subunit of the IL-4 receptor IL-5Rα α subunit of the IL-5 receptor ILC Innate lymphoid cell ILC2 Group 2 innate lymphoid cell iNOS Inducible nitric oxide synthase IP-10 IFN γ-induced protein 10 (also known as CXCL10) ISG Interferon stimulated gene KB Equilibrium dissociation constant Ki Inhibition constant LABA Long-acting β2 agonist LLOD Lower Limit of Detection LOX Lipoxygenase LPS Lipopolysaccharide LT Leukotrienes MBP Major basic protein MDC Macrophage-derived chemokine (also known as CCL22) MDC Minimum detectable concentration MHRA Medicines and Healthcare products Regulatory Agency MOX Methoxime mRNA Messenger ribonucleic acid NIHR National Institute for Health Research NO Nitric oxide NOS Nitric oxide synthase NTC Non-template controls OCS Oral corticosteroids PBMC Peripheral blood mononuclear cells PBS Phosphate buffered saline
PC20 The provocation concentration of histamine producing a 20% fall in the forced expiratory volume in 1 second (FEV1)
PCR Polymerase chain reaction pDC Plasmacytoid dendritic cell PEF Peak expiratory flow PFA Paraformaldehyde PGD2 Prostaglandin D2 PGDS PGD2 synthase PGH2 Prostaglandin H2 PMT Photomultiplier tube ppb Parts per billion PRR Pattern recognition receptor PTGS Prostaglandin-endoperoxide synthases PVM Pneumonia virus of mice qPCR Quantitative polymerase chain reaction
8/233
RANTES Regulated on Activation, Normal T Cell Expressed and Secreted RBCs Red blood cells RPMI Roswell Park Memorial Institute RSV Respiratory Syncytial Virus rtPCR Real time PCR RV Rhinovirus RV-16 Rhinovirus serotype 16 RV-1B Rhinovirus serotype 1B SABA Short acting β2 agonist SAM Synthetic absorptive matrix SBU Standardized biological units SD Standard deviation SEM Standard error of the mean SGRQ St George's Respiratory Questionnaire (SGRQ) sICAM-1 Soluble intracellular adhesion molecule-1 SOCS1 Suppressor of cytokine signalling 1 SSC Side scatter ssRNA Single-stranded RNA TARC Thymus and activation regulated chemokine (also known as CCL17) TBS Tris buffered saline Tc Cytotoxic T cell TCID50 50% tissue culture infective dose TE Tris-EDTA buffer Th2 Type 2 helper T cells TLR Toll-like receptor TSLP Thymic stromal lymphopoietin
9/233
Table of contents
1 Introduction 22
1.1 Overview ......................................................................................................... 22
1.2 Asthma ............................................................................................................ 22
1.2.1 Definition, prevalence and disease burden ................................................................ 22
1.3 Asthma exacerbations ..................................................................................... 22
1.3.1 Clinical importance ..................................................................................................... 22
1.3.2 Risk factors ................................................................................................................. 23
1.3.3 Causes ........................................................................................................................ 24
1.4 Immunopathology of asthma and asthma exacerbations .............................. 24
1.4.1 Pathophysiology and ‘type 2’ inflammation .............................................................. 24
1.4.2 Type 2 inflammation during exacerbations ................................................................ 25
1.4.3 Induction of type 2 inflammation in asthma exacerbations ...................................... 27
1.4.4 Other (non-type 2) immune changes during exacerbations ...................................... 30
1.5 Antiviral immunity in asthma .......................................................................... 32
1.5.1 Interferons in antiviral responses .............................................................................. 32
1.5.2 Interferon deficiency in asthma ................................................................................. 33
1.5.3 Effect of reconstituting interferon responses in asthma ........................................... 34
1.5.4 Link between type 2 inflammation and interferon responses ................................... 35
1.6 The role of prostaglandin D2 and the CRTH2 receptor in asthma ................... 35
1.6.1 Prostaglandin D2 biology ............................................................................................ 35
1.6.2 Prostaglandin D2 and the CRTH2 receptor in asthma ................................................. 36
1.6.3 Rationale for CRTH2 receptor blockade ..................................................................... 37
1.7 Human rhinovirus challenge as a model of asthma exacerbations ................ 38
10/233
1.7.1 Advantages of human experimental infection studies ............................................... 38
1.7.2 Human challenge with respiratory viruses ................................................................. 38
1.7.3 Experimental rhinovirus infection in asthma ............................................................. 39
1.7.4 Experimental rhinovirus infection in clinical trials ..................................................... 44
1.8 Previous studies of CRTH2 antagonists and OC459 in asthma ........................ 46
1.8.1 CRTH2 antagonists in development for asthma ......................................................... 46
1.8.2 Choice of OC459 ......................................................................................................... 47
1.8.3 Clinical studies of OC459 and other CRTH2 antagonists in asthma ........................... 48
1.8.4 Clinical studies of OC459 in other disease groups ...................................................... 52
1.9 Rationale, hypotheses and aims ..................................................................... 53
1.9.1 Rationale .................................................................................................................... 53
1.9.2 Hypotheses ................................................................................................................. 54
1.9.3 Aims ............................................................................................................................ 54
2 Materials and methods 56
2.1 Materials ......................................................................................................... 56
2.1.1 Rhinovirus inoculum ................................................................................................... 56
2.1.2 Clinical consumables .................................................................................................. 58
2.1.3 Clinical instruments .................................................................................................... 59
2.1.4 Buffers and reagents .................................................................................................. 60
2.1.5 Media and supplements ............................................................................................. 63
2.1.6 Commercially available kits ........................................................................................ 64
2.1.7 Antibodies for cell staining (flow cytometry and immunohistochemistry) ................ 65
2.1.8 RV-16 qPCR primer and probe sequences .................................................................. 66
2.1.9 Laboratory instruments .............................................................................................. 66
2.1.10 Computer software .................................................................................................... 66
2.2 Clinical trial methods ...................................................................................... 67
11/233
2.2.1 Study design ............................................................................................................... 67
2.2.2 Sample size calculation .............................................................................................. 67
2.2.3 Regulatory permissions and consent ......................................................................... 68
2.2.4 Study subjects ............................................................................................................ 68
2.2.5 Intervention ................................................................................................................ 69
2.2.6 Randomization and blinding ....................................................................................... 70
2.2.7 Virus inoculation ........................................................................................................ 70
2.3 Clinical assessments and sampling procedures .............................................. 71
2.3.1 Skin prick testing ........................................................................................................ 71
2.3.2 Asthma Control Questionnaire ................................................................................... 72
2.3.3 Spirometry .................................................................................................................. 72
2.3.4 Bronchial provocation test ......................................................................................... 73
2.3.5 Exhaled nitric oxide (FeNO) ........................................................................................ 74
2.3.6 Symptom scores ......................................................................................................... 74
2.3.7 Nasal sampling ........................................................................................................... 75
2.3.8 Lower airways sampling ............................................................................................. 76
2.3.9 Sputum induction ....................................................................................................... 78
2.3.10 Blood sampling ........................................................................................................... 79
2.4 Laboratory methods ........................................................................................ 79
2.4.1 Viral serology .............................................................................................................. 79
2.4.2 Quantification of virus copies .................................................................................... 79
2.4.3 Soluble mediator (protein and PGD2) quantification ................................................. 80
2.4.4 Flow cytometry .......................................................................................................... 81
2.4.5 Ex vivo infection studies in bronchial epithelial cells ................................................. 85
2.4.6 Immunohistochemistry (bronchial biopsies) .............................................................. 86
2.5 Statistical analysis ........................................................................................... 88
12/233
2.5.1 Analysis sets ............................................................................................................... 88
2.5.2 Statistical Methodology ............................................................................................. 88
3 Results: Validation of the human rhinovirus challenge model of asthma
exacerbations 91
3.1 Introduction .................................................................................................... 91
3.2 Hypothesis and aims ....................................................................................... 92
3.3 Results ............................................................................................................. 93
3.3.1 Study population ........................................................................................................ 93
3.3.2 Confirmation of RV-16 infection ................................................................................ 93
3.3.3 Baseline demographics and clinical characteristics .................................................... 95
3.3.4 RV infection led to increased upper respiratory symptoms ....................................... 96
3.3.5 RV infection was associated with a trend towards reduced lung function ................ 97
3.3.6 Airway hyperresponsiveness was not altered by RV infection ................................ 100
3.3.7 RV-16 infection kinetics varied by subject and correlated with upper respiratory
symptoms ................................................................................................................................ 101
3.3.8 Type 2 cytokines were induced in nasal but not bronchial samples ........................ 103
3.3.9 There was no induction of Prostaglandin D2 following RV-16 infection ................... 108
3.3.10 RV-16 produced modest increases in CRTH2+ staining in the epithelium and
subepithelium, but not the airway lumen ............................................................................... 111
3.3.11 Exhaled nitric oxide (FeNO) was increased during RV infection ............................... 120
3.3.12 Baseline ACQ-6 predicted lower respiratory symptoms, whereas PC20, FeNO and skin
prick testing predicted lung function decline .......................................................................... 124
3.4 Discussion ..................................................................................................... 126
3.4.1 RV challenge in the asthma subjects recruited reproduced most of the asthma
pathology in earlier studies ..................................................................................................... 126
3.4.2 Reductions in lung function during RV infection were muted compared to previous
127
13/233
3.4.3 PGD2 was not induced by RV infection, but levels still correlated with type 2
cytokines 130
3.4.4 CRTH2+ cell counts in the lower airways were little changed by RV infection ......... 131
3.4.5 Baseline FeNO did not predict outcomes, but levels during infection may be a marker
of underlying inflammation ..................................................................................................... 133
3.5 Summary of key points ................................................................................. 135
4 Results: Effect of CRTH2 blockade on clinical response to rhinovirus
challenge in asthma 136
4.1 Introduction .................................................................................................. 136
4.2 Hypothesis and aims ..................................................................................... 137
4.3 Results: Clinical effect of CRTH2 blockade in stable asthma ......................... 137
4.3.1 Baseline demographics and clinical characteristics .................................................. 137
4.3.2 CRTH2 antagonism did not suppress RV infection-induced changes in upper or lower
respiratory symptoms ............................................................................................................. 139
4.3.3 CRTH2 antagonism did not alter RV infection-induced changes in lung function .... 142
4.3.4 Airway hyperresponsiveness was similar across treatment groups and timepoints 144
4.3.5 FeNO increased following RV infection by an equivalent amount in the placebo and
OC459 groups .......................................................................................................................... 146
4.3.6 OC459 had a good safety profile .............................................................................. 146
4.3.7 Baseline ACQ-6 predicted lower respiratory symptoms, whereas PC20, FeNO and skin
prick testing predicted lung function decline .......................................................................... 147
4.4 Discussion ..................................................................................................... 148
4.4.1 OC459 did not improve symptoms or lung function during RV infection in asthma
compared to placebo ............................................................................................................... 148
4.4.2 OC459 was safe and well tolerated .......................................................................... 152
4.4.3 ACQ-6 was the only predictor of lower respiratory symptoms during infection;
several other measures at baseline predicted lung function decline ...................................... 152
4.5 Summary of key points ................................................................................. 153
14/233
5 Results: Effect of CRTH2 blockade on type 2 inflammation in asthma 154
5.1 Introduction .................................................................................................. 154
5.2 Hypothesis and aims ..................................................................................... 155
5.3 Results ........................................................................................................... 156
5.3.1 PGD2 was not induced by RV infection in either group ............................................ 156
5.3.2 OC459 prevented the RV-induced increase in CRTH2 epithelial and subepithelial
staining, but had no effect on CRTH2+ cells in the BAL ............................................................ 158
5.3.3 Neither RV challenge or OC459 treatment altered the proportion of activated ILC2s
164
5.3.4 OC459 did not alter the induction of type 2 cytokines by RV infection ................... 166
5.3.5 Relationships between PGD2, type 2 inflammatory mediators and CRTH2+ cells .... 171
5.4 Discussion ..................................................................................................... 174
5.4.1 OC459 did not affect PGD2 levels, which were not induced by RV infection ........... 174
5.4.2 OC459 prevented the increase in CRTH2+ cells in the bronchial wall, but had no effect
on numbers in the airway lumen ............................................................................................. 175
5.4.3 OC459 did not impact the RV-induced increase in type 2 cytokines ........................ 176
5.4.4 Type 2 cytokine levels were closely related; the role of IL-4 and IL-13 may slightly
diverge from IL-5 ..................................................................................................................... 177
5.4.5 Strong correlations between type 2 cytokines and IL-33 and TSLP persisted in the
presence of CRTH2 antagonism ............................................................................................... 178
5.5 Summary of key points ................................................................................. 179
6 Results: Effect of CRTH2 blockade on antiviral immunity in asthma 180
6.1 Introduction .................................................................................................. 180
6.2 Hypothesis and aims ..................................................................................... 181
6.3 Results ........................................................................................................... 181
6.3.1 CRTH2 antagonism did not reduce virus load .......................................................... 181
15/233
6.3.2 CRTH2 antagonism had a minimal effect on IFN-α or –λ1 responses to RV-16 in vivo
183
6.3.3 Type 2 cytokines are positively correlated with antiviral IFN in nasal samples ....... 187
6.3.4 IFN-β and –λ mRNA was equally induced by RV infection in BECs from OC459-treated
and placebo-treated subjects .................................................................................................. 190
6.3.5 IFN responses to RV-16 infection ex vivo did not correlate with virus load or IFN
levels after RV-16 infection in vivo .......................................................................................... 192
6.4 Discussion ..................................................................................................... 193
6.4.1 CRTH2 antagonism did not alter IFN responses to RV-16 infection in vivo or in ex vivo
experiments with primary BECs ............................................................................................... 193
6.4.2 Higher RV-16 virus loads were associated with higher nasal IFN-α and –λ1
concentrations ......................................................................................................................... 194
6.4.3 Type 2 cytokines were positively correlated with IFNs in nasal samples ................. 195
6.4.4 Ex vivo IFN responses did not predict virological outcomes in vivo ......................... 196
6.5 Summary of key points ................................................................................. 197
7 Discussion 198
7.1 Introduction .................................................................................................. 198
7.2 Key findings ................................................................................................... 198
7.2.1 RV challenge largely reproduced the features of previous studies in asthma ......... 198
7.2.2 CRTH2 antagonism had no effect on clinical outcomes after RV challenge ............. 200
7.2.3 Overall the mechanistic analyses suggest PGD2-CRTH2 signalling is not central to
virus-induced pathology in asthma ......................................................................................... 200
7.3 Limitations .................................................................................................... 202
7.4 Future directions ........................................................................................... 205
8 Appendices 208
8.1 Inclusion and exclusion criteria ..................................................................... 208
9 References 210
16/233
List of Figures
Figure 1.1 Pathophysiology of asthma exacerbations ............................................................ 30
Figure 1.2 (a) The CRTH2 receptor agonist (and natural ligand) PGD2 (b) the antagonist
OC459 ..................................................................................................................................... 48
Figure 2.1 Overview of study design ...................................................................................... 67
Figure 2.2 Participant daily diary card record ........................................................................ 75
Figure 2.3 Nasosorption ......................................................................................................... 76
Figure 2.4 Bronchosorption device ........................................................................................ 77
Figure 3.1 Consolidated Standards of Reporting Trials (CONSORT) diagram of patient
enrolment ............................................................................................................................... 94
Figure 3.2 RV infection led to increased upper respiratory symptoms and, together with
bronchoscopy, lower respiratory symptoms .......................................................................... 96
Figure 3.3 Upper and lower respiratory symptom scores were positively correlated ........... 97
Figure 3.4 RV infection was associated with a trend in reduced lung function ...................... 98
Figure 3.5 There was a trend towards an inverse relationship between lung function change
and upper and lower respiratory symptoms .......................................................................... 99
Figure 3.6 Airway hyperresponsiveness was not altered by RV infection ............................ 100
Figure 3.7 Nasal RV-16 virus copies peaked at day 3, but with different kinetics for each
subject .................................................................................................................................. 101
Figure 3.8 RV-16 virus load correlated with upper respiratory symptoms but not lower
respiratory symptoms or lung function ................................................................................ 102
Figure 3.9 Peak nasal levels of type 2 cytokines were significantly higher than baseline .... 104
Figure 3.10 Bronchial type 2 cytokines were not significantly different on day 5 versus day -8
.............................................................................................................................................. 105
17/233
Figure 3.11 Levels of soluble mediators in nasosorption samples were correlated with levels
in bronchosorption samples, both at baseline and during infection .................................... 106
Figure 3.12 Nasal type 2 cytokine levels are inversely related to changes in lung function
during RV-16 infection .......................................................................................................... 107
Figure 3.13 There was no induction of PGD2 following RV infection ................................... 109
Figure 3.14 PGD2 levels positively correlated with IL-4 and IL-13, but not IL-5, in nasal
samples ................................................................................................................................. 109
Figure 3.15 Levels of nasal PGD2 were not associated with symptom scores or changes in
lung function ........................................................................................................................ 110
Figure 3.16 Flow cytometry gating strategy for discarding duplets and dead cells ............. 112
Figure 3.17 Flow cytometry gating strategy for Th2 cells (either CD4+CRTH2+ or CD4+GATA3+)
.............................................................................................................................................. 112
Figure 3.18 Flow cytometry gating strategy for granulocytes and ILC2s .............................. 113
Figure 3.19 Flow cytometry counts of blood eosinophils corresponded closely to hospital
pathology lab measurements ............................................................................................... 114
Figure 3.20 The proportion of CRTH2+ cells and CRTH2+ eosinophils, basophils, ILC2s and Th2
cells did not change in the blood or airway lumen after RV-16 infection ............................ 117
Figure 3.21 There were modest increases in epithelial and subepithelial CRTH2 staining after
RV-16 infection ..................................................................................................................... 118
Figure 3.22 Nasal PGD2 levels were positively correlated with BAL CRTH2+ cell counts, but
bronchial PGD2 was inversely associated with epithelial and subepithelial CRTH2 staining 119
Figure 3.23 FeNO was increased during RV infection ........................................................... 121
Figure 3.24 FeNO was (non-significantly) associated changes in lung function and type 2
cytokines, but not symptom scores or PGD2 ........................................................................ 122
Figure 4.1 OC459 did not alter RV infection-induced increases in upper respiratory
symptoms ............................................................................................................................. 139
18/233
Figure 4.2 OC459 did not alter RV infection-induced changes in lower respiratory symptoms
.............................................................................................................................................. 140
Figure 4.3 Upper and lower respiratory symptoms did not change overall during the run-in
period ................................................................................................................................... 141
Figure 4.4 OC459 did not alter the RV-16-induced changes in lung function ...................... 142
Figure 4.5 Lung function did not change overall during the run-in period ........................... 143
Figure 4.6 Airway hyperresponsiveness did not change significantly throughout the study145
Figure 4.7 FeNO increased following RV infection by an equivalent amount in the placebo
and OC459 groups ................................................................................................................ 146
Figure 5.1 Nasal PGD2 was not induced by RV-16 in either group ....................................... 156
Figure 5.2 There was an inverse association between prescribed ICS dose and nasal PGD2
levels during infection .......................................................................................................... 157
Figure 5.3 OC459 did not alter BAL CRTH2+ cell populations before or after infection ....... 159
Figure 5.4 RV-induced increases in epithelial and subepithelial CRTH2 staining were not seen
with OC459 treatment .......................................................................................................... 160
Figure 5.5 Examples of CRTH2 and EG2 staining in bronchial biopsy sections ..................... 161
Figure 5.6 The ILC1:ILC2 ratio increased during infection in the OC459 group, but the
neutrophil:eosinophil and CD3+CD4+T-bet+:CD3+CD4+GATA3+ ratios were unchanged ....... 162
Figure 5.7 During infection, the proportion of BAL CRTH2+ cells was related to clinical
outcomes (upper respiratory symptoms, lung function, FeNO) and viral load .................... 163
Figure 5.8 Neither RV challenge or OC459 treatment altered the proportion of ILC2s staining
for intracellular IL-5 .............................................................................................................. 165
Figure 5.9 Type 2 cytokines were induced in nasal samples in both treatment groups with no
statistically differences between OC459 and placebo ......................................................... 167
Figure 5.10 Bronchial IL-5 and IL-13 were induced after RV challenge in the OC459 group but
not placebo ........................................................................................................................... 168
Figure 5.11 There was a strong association between nasal levels of IL-4, IL-5 and IL-13 ..... 169
19/233
Figure 5.12 Peak nasal IL-5 levels correlated with clinical outcome measures .................... 170
Figure 5.13 Nasal PGD2 levels were positively correlated with type 2 cytokines despite
CRTH2 blockade .................................................................................................................... 172
Figure 6.1 There were RV-16 viral loads in both treatment groups ..................................... 182
Figure 6.2 IFN-α and –λ1 were equally induced in both groups in nasal and bronchial
samples (overleaf) ................................................................................................................ 184
Figure 6.3 RV-16 virus load was strongly correlated with nasal IFN-α and –λ1 concentrations
.............................................................................................................................................. 186
Figure 6.4 Peak virus load was positively correlated with peak IFN-α/-λ1 in nasal samples 186
Figure 6.5 Levels of type 2 cytokines and IFN-α/-λ1 were positively correlated in nasal
samples ................................................................................................................................. 188
Figure 6.6 RV-16 was correlated with nasal IL-5, but not IL-4 or IL-13 ................................. 189
Figure 6.7 Antiviral IFNs were equally induced by RV infection in BECs from placebo or
OC459-treated subjects ........................................................................................................ 191
20/233
List of Tables
Table 1.1 Previous human rhinovirus challenge studies in asthma ........................................ 40
Table 1.2 CRTH2 antagonists in active clinical development for asthma ............................... 47
Table 1.3 Completed clinical studies of CRTH2 antagonists in asthma .................................. 50
Table 2.1 Experimental infection studies using the same rhinovirus inoculum ..................... 57
Table 2.2 Clinical consumables ............................................................................................... 58
Table 2.3 Clinical instruments ................................................................................................ 59
Table 2.4 Buffers and reagents ............................................................................................... 60
Table 2.5 Media and supplements ......................................................................................... 63
Table 2.6 Commercially available kits .................................................................................... 64
Table 2.7 Antibodies for flow cytometry: granulocyte and ILC panel .................................... 65
Table 2.8 Antibodies for flow cytometry: T cell panel ............................................................ 65
Table 2.9 Antibodies for bronchial biopsy immunohistochemistry ........................................ 65
Table 2.10 RV-16 qPCR primer and probe sequences ............................................................ 66
Table 2.11 Laboratory instruments ........................................................................................ 66
Table 2.12 Computer software ............................................................................................... 66
Table 2.13 Inclusion and exclusion criteria ............................................................................. 69
Table 2.14 Summary of study visits with assessments and samples obtained ....................... 71
Table 3.1 Baseline demographics and clinical characteristics ................................................ 95
Table 3.2 Relationship between select baseline characteristics and clinical outcome
measures .............................................................................................................................. 125
Table 4.1 Baseline demographics and clinical characteristics .............................................. 138
21/233
Table 4.2 Relationship between select baseline characteristics and clinical outcome
measures .............................................................................................................................. 147
Table 5.1 Relationship between epithelial cytokines and IL-4, IL-5 and IL-13 in nasal samples
.............................................................................................................................................. 173
Introduction
22/233
1 Introduction
1.1 Overview The goal of this introduction is to furnish the reader with background information relevant
to the original data that follows. It outlines in turn the importance of the clinical problem
(asthma exacerbations), its pathophysiology and hence the logic behind the target pathway,
why antiviral immunity might also be impacted, and previous studies providing the basis for
the experimental approach taken.
1.2 Asthma
1.2.1 Definition, prevalence and disease burden
Existing definitions of asthma describe a clinical syndrome encompassing a constellation of
symptoms including wheeze, breathlessness, chest tightness and cough. Typically these
symptoms fluctuate over time and in severity, are precipitated by characteristic triggers, and
relieved by bronchodilators1. Asthma can be stratified by severity, the level of treatment
required, and the degree of symptom control, i.e. the presence of ongoing symptoms
despite current therapy.
Asthma is common: the most recent estimates put the number affected at ~340 million
worldwide2. It causes considerable morbidity in sufferers and although mortality is rare,
given the high prevalence, the absolute number of asthma-related deaths is substantial. In
the UK, asthma is responsible for 2.7 million GP consultations, 121,000 hospital
attendances, 93,900 admissions, and over 1,000 deaths every year, incurring £1 billion in
healthcare costs alone, before accounting for the cost of absenteeism from schools and
workplaces3. This is despite well-established and readily available therapies such as inhaled
corticosteroids (ICS) and bronchodilators.
1.3 Asthma exacerbations
1.3.1 Clinical importance
The natural history of asthma is punctuated by episodes of acute symptomatology requiring
an increase in treatment, called exacerbations. These exacerbations account for the bulk of
Introduction
23/233
asthma-related morbidity, mortality and healthcare resource utilization. In a large survey
including almost 3,000 individuals with asthma, a history of exacerbations in the last 12
months was associated with lower health-related quality of life scores across a range of
measures4. Those who have exacerbations incur roughly double the total and asthma-
related healthcare costs of those who remain exacerbation-free, as seen in a separate
cohort of >12,500 with moderate and severe asthma5. An international systematic review of
the cost associated with asthma similarly found that hospitalization, which was nearly
always due to severe exacerbations, accounted for the largest proportion of asthma-related
costs6. In addition, exacerbations are associated with excess lung function decline7.
Exacerbation prevention is therefore prioritised as one of the twin goals of asthma
management in international guidelines, alongside symptom reduction1. However despite
existing treatments, almost half of asthma sufferers reported having an exacerbation
requiring oral steroids in the last year8. Exacerbations therefore represent a major unmet
need in asthma management.
1.3.2 Risk factors
Retrospective analyses of large cohorts of asthma patients have identified various risk
factors associated with patients who have exacerbations. These include: the presence of
uncontrolled asthma symptoms9, frequent reliever use10, poor adherence with maintenance
therapy11, poor inhaler technique12, reduced lung function13, exposure to tobacco smoke or
allergens13, psychosocial problems14, obesity15, allergic rhinitis16, food allergy17, evidence of
airways inflammation i.e. either sputum or blood eosinophilia18,19 or elevated exhaled nitric
oxide20, pregnancy21, and previous severe exacerbations in the last 12 months22 or
admission to intensive care for asthma at any time23.
The first of these, poor symptom control, is associated with a three- to six-fold increase in
exacerbations necessitating corticosteroids and/or hospitalization9. Given this, objective
measures of asthma symptoms such as the Asthma Control Questionnaire (ACQ)24 are used
as screening criteria for entry into trials in which exacerbation reduction is a primary
endpoint.
Introduction
24/233
1.3.3 Causes
Numerous precipitants can trigger asthma exacerbations. These include viral or bacterial
infections, aeroallergens (house dust mite (HDM), pollens, animal dander), inhaled irritants
(tobacco smoke, air pollution particulate matter), certain drugs (e.g. aspirin, non-steroidal
anti-inflammatory drugs), and exercise. These factors may interact and are variably
important in each individual, depending on their sensitivities to specific aeroallergens or
drugs.
The most significant of these are viral infections. Multiple community-based studies using
highly sensitive polymerase chain reaction (PCR) techniques have demonstrated the
presence of viruses in the airway secretions of ~41-78% of adults experiencing asthma
attacks25. Cyclical patterns of asthma exacerbations, with peaks observed in September
when schools re-open, correspond with seasonal patterns of viral epidemics26 – although
other factors, such as seasonal allergens and poor adherence with maintenance therapy
over the summer holidays, are also likely to play a role in the September epidemic27.
Of the respiratory viruses detected during exacerbations, rhinoviruses (RV) are most
commonly identified25, with influenza, respiratory syncytial virus (RSV) and others found less
frequently. That rhinoviruses, cause of the common cold, can cause asthma exacerbations is
supported by the demonstration that experimentally infecting volunteers with asthma with
rhinovirus induces symptoms mimicking those of a naturally-occurring exacerbation28.
Unfortunately a rhinovirus vaccine has proved elusive, owing to the extensive sequence
variation amongst the >150 different rhinovirus serotypes and strains (~100 serotypes of
rhinovirus A and B subgroups, plus in the C subgroup an additional estimated 60 which are
classed as strains rather than serotypes as they are difficult to grow and therefore
characterise, so based on sequence analysis)29.
1.4 Immunopathology of asthma and asthma exacerbations
1.4.1 Pathophysiology and ‘type 2’ inflammation
The marked heterogeneity across individuals with the same label of ‘asthma’, in terms of
presenting symptoms, severity, treatment response etc, is inconsistent with a single disease
entity. Early researchers recognised this30, dividing asthma into extrinsic and intrinsic
Introduction
25/233
phenotypes, the former characterised by early onset and co-existing atopy and/or atopic
conditions (e.g. atopic dermatitis, allergic rhinitis) whereas the latter was effectively a
heterogeneous group of everything else. Current thinking is that there are a much larger
number of distinct clinical phenotypes and molecular endotypes, although there remains no
consensus on how to classify asthma31.
A number of these phenotypes, and the majority of asthma sufferers32, share a pattern of
‘type 2’ inflammation, so-called because of the presence of an elevated number of type 2
helper T (Th2) cells and the cytokines they secrete, interleukin(IL)-4, IL-5, and IL-1333,34
(other cells are now known to also produce these). The effect of these cytokines is to
produce the characteristic features of asthma:
• elevated serum immunoglobulin (Ig) E, produced by IL-4-induced B cell Ig class
switching35;
• blood or airway eosinophilia, a consequence of raised levels of the eosinophil
proliferation, activation and localization factor, IL-536); and
• mucus hypersecretion and airway hyperresponsiveness, both associated with IL-1337.
Type 2 inflammation has clinical relevance: a study of steroid-naïve asthma patients
randomized to ICS or placebo found those with a ‘type 2 high’ gene signature (defined as
upregulation of three IL-13-induced genes, POSTN, CLCA1, and SERPINB2 in bronchial
epithelial brushings) responded to ICS, whereas those who were ‘type 2 low’ did not38.
Following the relatively recent description of group 2 innate lymphoid cells (ILC2s), which
can produce IL-4, IL-5 and IL-13 but predominantly IL-5 and IL-13, it has been suggested that
within the broader category of asthma with type 2 inflammation there may be two groups:
one in which pathology is driven by Th2 cells, another in which ILC2s are responsible39. In
the absence of Th2 cells, one would expect IL-4 and hence IgE levels to be normal, producing
a phenotype that is non-allergic yet eosinophilic.
1.4.2 Type 2 inflammation during exacerbations
The presence of Th2 cells and type 2 cytokines in stable asthma was established by studies
in the 1990s33,34. It has also long been known that during exacerbations, the numbers of
Introduction
26/233
both immune cells (e.g. eosinophils40, neutrophils41) and inflammatory mediators (e.g. IL-
842) in the airways increases acutely.
It seems likely that the pattern of inflammation at exacerbation varies by trigger and asthma
phenotype/endotype. Research has primarily focused on those with ‘atopic’ asthma, which
likely corresponds to underlying type 2 inflammation and which in practical terms is
relatively easy to screen for by skin prick testing. In vitro and in human experimental
infection, rhinovirus infection is the trigger most often studied, reflecting its status as the
most frequent precipitant of asthma exacerbations. (Mice are not natural hosts for
rhinoviruses as 90% of the known serotypes, the major group rhinoviruses, cannot bind the
murine counterpart of human intercellular adhesion molecule-1 (ICAM-1), the receptor by
which they gain entry to airway epithelial cells (AECs). Minor group rhinoviruses can infect
mice, as can major group rhinoviruses in transgenic mice expressing human ICAM-1, but in
both cases infection is only replicative for 24-36 hours and then aborted for reasons not
currently understood43.)
The first suggestion that an imbalance towards type 2 inflammation might be at play in
asthma exacerbations came from an experimental rhinovirus infection study in subjects with
atopic asthma and allergic rhinitis44. Specifically, the investigators found the ratio of the
mRNA of a Th1 cytokine (interferon (IFN)-γ) to that of a Th2 cytokine (IL-5) in induced
sputum samples was correlated with peak cold symptoms and time to virus clearance
(unfortunately cytokine levels could not be measured directly due to the presence of
inhibitors of the enzyme-linked immunosorbent assays (ELISA) in the sputum). In a
subsequent experimental rhinovirus infection study in healthy and subjects with asthma28,
intracellular cytokine staining of samples taken at baseline identified relationships between:
• higher type 1 cytokine expression (IFN-γ) in blood CD4+ T cells and lower virus loads;
• higher type 1 cytokine expression (IFN-γ) in CD4+ T cells from bronchoalveolar lavage
(BAL) and smaller falls in lung function (peak expiratory flow, PEF);
• higher type 2 cytokine expression (IL-4, IL-5, IL-13) in BAL CD4+ T cells and more
severe lower respiratory symptoms.
Novel airway sampling techniques that avoid the dilution of traditional lavage, combined
with highly sensitive low volume protein detection methods using multiplex immunoassays,
Introduction
27/233
have enabled the direct measurement of many cytokines in the airways. Applying these,
Jackson and colleagues showed that following experimental infection, levels of IL-4, IL-5 and
IL-13 rose in the airways of subjects with asthma but not healthy controls45. Moreover levels
of IL-5 and IL-13 were correlated with clinical markers and viral load, implying their
functional relevance in exacerbations.
The efficacy of monoclonal antibody treatments directed against type 2 cytokines reinforces
their importance in the pathophysiology of exacerbations. The anti-IL-5 agents,
mepolizumab and reslizumab, have been approved on the basis of studies showing a
reduction of approximately half in the rate of exacerbations in subjects with an eosinophilic
phenotype46. Benralizumab, which targets the IL-5 receptor α subunit (IL-5Rα), is similarly
effective and likely to be approved soon. Dupilumab targets the IL-4 receptor α subunit (IL-
4Rα), a component of the receptors for both IL-4 and IL-13, blocking the signalling of both
cytokines. In a study of 52 subjects with eosinophilic asthma, dupilumab reduced
exacerbations by 87% following discontinuation of inhaled long-acting β2 agonist (LABA) and
corticosteroid therapy31. A much larger phase 2b trial found a 71% risk reduction (81% in the
eosinophilic subgroup) in severe exacerbations, i.e. those requiring at least three days
treatment with systemic corticosteroids47.
1.4.3 Induction of type 2 inflammation in asthma exacerbations
Events in the airway epithelium appear to regulate the subsequent host response. Epithelial
cells represent the first line of defence against viral infection, acting both as a physical
barrier and a component of the innate immune system. They are armed with a plethora of
pattern recognition receptors (PRRs) for detecting microbes and cell damage, and are
capable of producing a large number of cytokines, chemokines, and other soluble mediators
to initiate inflammatory responses48.
The airway epithelium is now known to be a source of pro-Th2 factors that may initiate Th2
responses relevant to asthma. These include IL-33, IL-25, thymic stromal lymphopoietin
(TSLP) and prostaglandin D2 (PGD2), all of which have been implicated in orchestrating type
2 immunopathology. Each is released following rhinovirus infection of human AECs in
vitro45,49-51 and is capable of stimulating type 2 cytokine release by Th2 cells52-54 (in the case
of TSLP, via TSLP-activated dendritic cells (DCs)55) and ILC2s56,57. The recruitment and
Introduction
28/233
activation of the recently discovered ILC2s is of particular interest as they are the most
potent source of type 2 cytokines and do not require antigen-specific activation58. These
epithelial-derived cytokines also have activity on a number of other cells, e.g. TSLP is a
potent activator of mast cells59, promotes basophil population expansion in the bone
marrow60 and activates DCs to promote type 2 inflammatory pathways55.
IL-3345, IL-2549 and PGD261 are also released in vivo after experimental rhinovirus infection in
asthma. As with the type 2 cytokines, IL-33 levels correlate with viral load, and PGD2 with
symptom scores and lung function changes, implying clinical relevance. Levels of TSLP were
below the limit of detection of the assay used62, although studies of naturally occurring
rhinovirus infection in children with asthma have reported increased levels of nasal
TSLP63,64.
In the experimental rhinovirus infection study cited, healthy controls also experienced
induction of IL-25 and IL-33, the latter not quite achieving statistical significance but in a
relatively small group (n=11) whose primary bronchial epithelial cells (BECs) produced IL-33
after ex vivo rhinovirus infection45. It may be that the airway epithelium produces the same
amount of these master cytokines in asthma as in health, but that in asthma there are more
effector cells primed to respond to these (e.g. Th2 cells, ILC2s). Alternatively the airway
epithelium in asthma may be different: BECs taken from subjects with asthma produced
more IL-25 when infected with rhinovirus ex vivo, with a trend towards higher in vivo
induction of IL-25 in asthma than healthy controls49.
With several mediators implicated, each of which can theoretically initiate a cascade of type
2 inflammation, there is the possibility of redundancy in one or more of these pathways.
Testing this requires the use of compounds that selectively disrupt signalling by each
mediator. To date, only compounds targeting TSLP and PGD2 have entered clinical trials,
although a phase 2a trial of a monoclonal directed at the IL-33 receptor (GSK3772847)
opened in July 2017 (ClinicalTrials.gov identifier NCT0320724365). An anti-TSLP monoclonal
antibody, tezepelumab, dampened allergen-induced early and late asthmatic responses,
blood and sputum eosinophil counts, and fractional exhaled nitric oxide (FeNO) in subjects
with mild asthma66. A subsequent randomized, placebo-controlled trial in patients with
Introduction
29/233
uncontrolled asthma recently reported reductions in exacerbation rates of between 61%
and 71%67. Compounds targeting the PGD2 receptor CRTH2 are discussed below.
It therefore seems likely that airway epithelial damage following virus infection leads to
production of IL-33, IL-25, TSLP and PGD2, possibly to a greater extent in asthmatic lungs.
This may be due to a greater susceptibility of asthmatic epithelium to respiratory viruses.
Epithelial cells from asthma subjects have higher expression of ICAM-1, the target receptor
for major group rhinoviruses68. In addition, allergen exposure decreases airway epithelial
tight junction proteins69, which could facilitate virus (and allergen) penetration, and viral
infection likewise compromises epithelial integrity70. Real world evidence that allergens
contribute to virus-induced exacerbations comes from the observations being sensitized and
exposed to an allergen(s) is an independent risk factor for admission with an asthma
exacerbation and has a synergistic relationship with viral infection in both adults71 and
children72, and that HDM- and mouse-specific serum IgE levels correlate with exacerbation
severity in children73.
Cells other than epithelial cells are also resident in the airway, and therefore encounter
viruses early and may play a part in determining the subsequent immune response. These
include alveolar macrophages, dendritic cells and mast cells74. Alveolar macrophages are
negatively regulated by airway epithelial cells, becoming activated following epithelial
damage75, thus unlikely to provide the initial trigger. However mast cells can be activated by
toll-like receptor (TLR) 3, which recognises double stranded RNA, an intermediary of many
RNA virus life cycles76. Mast cells are thought to be the predominant source of PGD2, and
can also produce IL-3377, IL-2578 and, uniquely amongst haematopoietic cells, TSLP79.
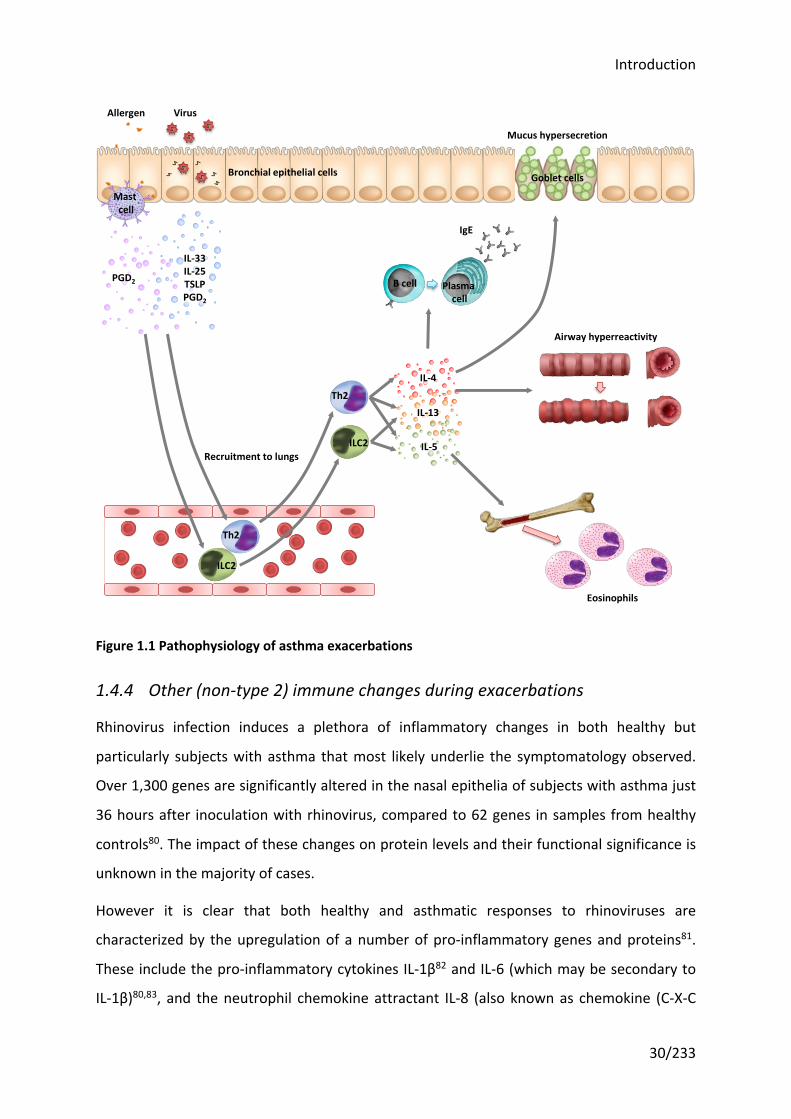
In summary, current schema hypothesise that respiratory viruses infect airway epithelial
cells, the body’s initial protective barrier and the primary site of replication for most
respiratory viruses, triggering the release of the epithelial ‘alarmins’ IL-33, IL-25, TSLP and
PGD2, amongst others. These in turn recruit and activate ILC2s and Th2 cells to secrete the
type 2 cytokines that drive asthma symptoms and pathology (see Figure 1.1).
Introduction
30/233
Figure 1.1 Pathophysiology of asthma exacerbations
1.4.4 Other (non-type 2) immune changes during exacerbations
Rhinovirus infection induces a plethora of inflammatory changes in both healthy but
particularly subjects with asthma that most likely underlie the symptomatology observed.
Over 1,300 genes are significantly altered in the nasal epithelia of subjects with asthma just
36 hours after inoculation with rhinovirus, compared to 62 genes in samples from healthy
controls80. The impact of these changes on protein levels and their functional significance is
unknown in the majority of cases.
However it is clear that both healthy and asthmatic responses to rhinoviruses are
characterized by the upregulation of a number of pro-inflammatory genes and proteins81.
These include the pro-inflammatory cytokines IL-1β82 and IL-6 (which may be secondary to
IL-1β)80,83, and the neutrophil chemokine attractant IL-8 (also known as chemokine (C-X-C
Th2
ILC2
Eosinophils
ILC2
Th2
B cell Plasma cell
IgE
Mucus hypersecretion
Goblet cellsBronchial epithelial cells
Airway hyperreactivity
Recruitment to lungs
IL-4
IL-13
IL-5
Mast cell
Allergen Virus
IL-33IL-25TSLPPGD2
PGD2
Introduction
31/233
motif) ligand 8, CXCL-8)83. There are also differences in non-inflammatory pathways: IL-18 is
induced following experimental rhinovirus infection, with greater rises in healthy subjects
compared to those with asthma, suggesting it may be protective84.
In addition to elevated type 2 cytokines, rhinovirus-infected airways of subjects with asthma
also show excess increases in ‘type 2 chemokines’ compared to healthy controls. These
include two chemokines that bind Th2 cells (thymus and activation regulated chemokine
(TARC), also known as chemokine (C-C motif) ligand 17, CCL17; and macrophage-derived
chemokine (MDC), or CCL22) and two that bind eosinophils (eotaxin/CCL11, eotaxin-
3/CCL26)62, although for MDC the increase over controls did not reach statistical
significance.
Viruses induce the production of antiviral interferons (IFNs), and there is some evidence
that IFN-λ (also known as IL-29 (IFN-λ1), IL-28A (IFN-λ2) and IL-28B (IFN-λ3)) may be
elevated62,85. IFNs are discussed in detail below in the context of antiviral immunity in
asthma.
Early rhinovirus challenge studies in asthma concluded that deficient type 1 inflammation
(i.e. corresponding to Th1 cells and the mediators they secrete), in addition to excess type 2
inflammation, was associated with rhinovirus-induced exacerbations28,44. However these
studies did not directly measure type 1 inflammatory mediators. A subsequent rhinovirus
challenge study found that the type 1 cytokines, IFN-γ and IL-10, are increased, as is a
chemokine that binds Th1 cells, IFN γ-induced protein 10 (IP10, also known as CXCL10)62. For
IFN-γ and IP10, this increase was significantly greater in asthma than in healthy controls.
This could still be consistent with a relative deficiency of type 1 inflammation in asthma, if
that deficiency were to lead to greater virus loads that in turn stimulate greater type 1
responses, masking the initial deficiency. It also demonstrates that type 1 and type 2
inflammation co-exist, but in asthma may be inappropriately skewed towards type 2.
Meanwhile the paediatric literature has suggested a possible role of Th17-produced
cytokines. Th17 cells are capable of inducing marked neutrophilic inflammation86 and may
be associated with severe, steroid-resistant asthma87; they also produce the type 2 master
cytokine IL-25 (also known as IL-17E). Severely premature infants with confirmed rhinovirus
infection have elevated levels of type 2 cytokines and IL-17 in nasal washings, compared to
both uninfected premature and older rhinovirus-infected controls88. IL-4 and IL-17 levels
Introduction
32/233
were associated with subsequent intensive care admissions in the first two years of life.
However a separate study of children under two years with bronchiolitis, infected mainly
with RSV (51%) or rhinoviruses (12%), found high nasal IL-17 was associated with a
decreased risk of hospitalization89. In vitro and murine data supports the possibility that IL-
17 may be protective90. Further clouding the water, nasal IL-17A was increased following
experimental infection in allergic adults with mild-to-moderate asthma, but not in healthy
controls62. There are currently no published studies reporting in vivo levels of the other
Th17-produced cytokines IL-17F and IL-22, or IL-23, which is essential for Th17
differentiation, during rhinovirus-induced asthma exacerbations.
IL-15 is an important cytokine in orchestrating the antiviral responses of Natural Killer (NK)
cells and CD8+ T cells91. It is constitutively expressed by a variety of cell types including
respiratory epithelia, macrophages and dendritic cells. Studies in stable asthma and
infecting cells from subjects with asthma ex vivo have previously found deficient levels of IL-
15e.g.92. In vivo nasal and bronchial measurements during experimental rhinovirus infection
found IL-15 concentrations increased with an excess rise in asthma compared to healthy
controls62. Much like type 1 mediators, this may be a consequence of more severe viral
infection in asthma leading to greater virally-induced inflammation following an initially (IL-
15) deficient state at baseline.
1.5 Antiviral immunity in asthma
1.5.1 Interferons in antiviral responses
Robust type I and III IFN production is a key component of the host defence to virus
infection. Type I IFNs include IFN-α and -β, which signal through the same IFN-α receptor
(IFNAR), a heterodimeric complex composed of IFNAR1 and IFNAR2 subunits. IFN-α, -β,
IFNAR1/2 are constitutively expressed, although plasmacytoid dendritic cells (pDCs) can
produce particularly large amounts and are also primed to respond to low levels of IFN. The
type III IFNs are IFN-λ1 (also called IL-29), -λ2 (IL-28A), -λ3 (IL-28B), and the recently
discovered IFN-λ493. They are preferentially expressed at mucosal surfaces, such as the
respiratory and gastrointestinal tract, reflecting their role in host defence against viral
infections at mucosal surfaces. The type III IFNs signal through the IFN-λ receptor 1 (IFNLR1),
whose expression is limited to myeloid cells, mucosal epithelial cells, and hepatocytes.
Introduction
33/233
Binding of the type I IFNs to IFNAR or the type III IFNs to IFNLR1 have similar pleiotropic
effects, mediating an antiviral gene expression programme via the up- and down-regulation
of hundreds of interferon stimulated genes (ISGs). Their effects include blocking viral entry
to prevent spread to neighbouring cells, cleaving viral nucleic acid to block replication,
inhibiting translation of viral proteins, inducing apoptosis of infected cells, and upregulating
molecules for viral sensing and signalling94. In addition, the genes for cytokines and
chemokines are modulated to recruit and activate immune cells to aid in viral clearance and
disease control. The type I and III IFNs are ISGs themselves, completing a positive feedback
loop.
1.5.2 Interferon deficiency in asthma
A number of in vitro studies have investigated whether type I and III IFN production is
impaired in asthma following viral infections. The different studies have taken various cell
types, usually bronchial epithelial cells (BECs)95-97, which are the first cell type encountered
and principal site of replication for respiratory viruses, pDCs98, which produce large amounts
of IFNs, peripheral blood mononuclear cells (PBMCs)99, which contain pDCs, or BAL cells,
which are predominantly alveolar macrophages100,101, and infected them with respiratory
viruses ex vivo before measuring induction of IFNs and ISGs (in terms of protein and
messenger ribonucleic acid (mRNA) levels). Most, but not all, have found that cells taken
from subjects with asthma produce less IFN than those from healthy controls (reviewed in 102,103). This is more consistently found in more severe and/or less well controlled asthma.
A sophisticated mouse model, that seeks to closely mirror asthma pathogenesis by exposing
mice to a ‘dual hit’ of virus and allergen both early and later in life (as it is hypothesized
happens in man104), reinforces the results of ex vivo infection studies. Mice inoculated with
pneumonia virus of mice (PVM) and cockroach extract (CRE) after one and seven weeks
developed the hallmark features of asthma, specifically pulmonary eosinophilia, mucus
hypersecretion, and airway remodelling105. Interestingly, these mice display reduced levels
of IFN-α and –λ compared to mice exposed to PVM alone. Impaired induction of IFN-α is
again seen when these animals are infected with rhinovirus four weeks later, mimicking a
human asthma exacerbation106.
Introduction
34/233
Human exacerbation studies have not demonstrated the same, but this is entirely in keeping
with the hypothesis that IFN responses are deficient in asthma. Thus whilst the initial
reaction to viral infection may be inadequate production of IFN, the result of low IFN levels
would be to enable viral proliferation to go unchecked. The resulting higher viral loads
stimulate greater IFN production, as IFN responses are blunted but not absent, masking any
initial deficiency. Thus it is not altogether surprising that asthma subjects experimentally
infected with rhinovirus had higher levels of IFN-β and IFN-λ1 compared to healthy controls
but also higher viral loads45, which were correlated with IFN-β levels62. As expected, the
degree of IFN deficiency in ex vivo experiments correlated with the in vivo exacerbation
severity and viral load when the same subjects were experimentally infected96.
1.5.3 Effect of reconstituting interferon responses in asthma
Although a trial of inhaled IFN-β therapy, given within 24 hours of cold symptoms in patients
with moderate-to-severe asthma and a history of exacerbations, had a negative result
overall, a subset with moderately severe disease had reduced symptom scores and
improved lung function107. These were the only subjects who developed a significant
increase in symptom scores suggesting that, in appropriately selected patients, this
treatment may be effective. Indeed patients with more severe asthma have more frequent
exacerbations108, and may therefore represent a group with IFN deficiency.
Reconstituting IFN responses by means other than exogenous replacement after the onset
of symptoms should be more beneficial, but until recently appeared to be a distant goal.
However anti-IgE treatment with omalizumab, which is effective in reducing exacerbations,
has now been shown to increase IFN-α production by PBMCs infected with rhinovirus in the
presence of IgE cross-linking109. Moreover, the children whose PBMCs showed above
average increases in IFN-α production in vitro had the greatest reduction in exacerbation
frequency. The exact mechanism remains unclear but dysregulation of pattern recognition
receptors on pDCs, the main source of IFN-α, in the presence of IgE cross-linking has been
observed98, so it may be through restoration of viral sensing molecules. There may be
additional mechanisms in other cell types, such as increased nuclear expression of
suppressor of cytokine signalling 1 (SOCS1) in asthmatic BECs110 and deficient expression of
TLR7 in BAL macrophages101.
Introduction
35/233
1.5.4 Link between type 2 inflammation and interferon responses
Type 2 cytokines have been shown to negatively regulate IFN production. In vitro, addition
of IL-4 or IL-13 to BEC cultures prior to viral infection inhibits IFN-β and –λ levels, but not
other pro-inflammatory cytokines111. Similarly, IL-13 pretreatment suppressed IFN-λ1
production in airway epithelial cells in response to a synthetic viral mimic, poly(I:C), and IFN-
λ2/3 mRNA expression in alveolar macrophages112. These investigators went on to show
that in vivo, intratracheal dsRNA-induced IFN-λ2/3 mRNA was increased in IL-13 knockout
mice.
A separate study setting out the role of SOCS1 as possibly mediating this effect, showed that
pre-treatment of mice with intranasal IL-13 significantly reduced IFN-α protein production,
with a trend towards reduced IFN-λ protein, after infection with RV-1B compared to levels in
SOCS1 knockout mice110. There was no wild-type control for these experiments, but as the
effect of IL-13 was via upregulation of SOCS1, the levels in the knockout mouse can be
assumed to approximate to those of a wild-type control. SOCS1 is induced via IL-4 and IL-13,
and was increased in allergic asthma with a positive correlation with the number of positive
skin prick tests.
Pre-treating mice with IL-33 can also reduce IFN-α and -λ levels in the BAL105. In the same
study the authors demonstrated that IL-33-exposed pDCs produced significantly less IFN-α
in response to stimulation of TLR7, a pattern recognition receptor that detects single-
stranded RNA (ssRNA) virus particles.
A number of mechanisms have been proposed, including IL-5-induced suppression of
TLR7113; IL-4/13-mediated induction of SOCS1110; IL-13-induced forkhead box protein A3
(FOXA3) expression114; and IL-4/13-mediated reduction in TLR3 expression111. In each of
these studies, biopsies from asthma patients demonstrated findings consistent with the
hypothesis.
1.6 The role of prostaglandin D2 and the CRTH2 receptor in asthma
1.6.1 Prostaglandin D2 biology
Prostaglandin D2 (PGD2) is a lipid inflammatory mediator that is a downstream product of
the arachidonic acid cascade. Arachidonic acid is catabolized by lipoxygenases (LOX) to
Introduction
36/233
produce leukotrienes (LT), and by cyclooxygenases (COX), also known as prostaglandin-
endoperoxide synthases (PTGS), to produce the prostanoid precursor prostaglandin H2
(PGH2). PGD2 synthase (PGDS) catalyses the conversion of PGH2 to PGD2. There are two
forms of the PGDS enzyme: haematopoietic PGDS, found in circulating haematopoietic cells,
and lipocalin PGDS, which is primarily found in the central nervous system.
The principal cellular source of PGD2 are mast cells, which release large quantities on
binding of their IgE receptors115. Respiratory syncytial virus (RSV) infection in children with
severe bronchiolitis is associated with high levels of PGD2 in the upper airways, which may
at least partly be due to AEC infection (in vitro, RSV infection of AECs from healthy children
induced PGD2 production)51. In addition, macrophages treated with lipopolysaccharide
(LPS), a component of gram-negative bacterial cell walls, upregulate lipocalin PGDS to
produce significant volumes of PGD2116. Antigen-stimulated Th2 cells may also produce
biologically important amounts117. Dendritic cells118, basophils119, and eosinophils120
produce relatively smaller amounts of uncertain significance.
PGD2 binds the D prostanoid (DP) 1 and DP2 receptors, the latter more commonly known by
the name given to it prior to the discovery of PGD2 as its natural ligand – the
chemoattractant receptor-homologous molecule expressed on Th2 cells (CRTH2). DP1 is
expressed on a broad range of cells and is largely anti-inflammatory. CRTH2 on the other
hand is found almost exclusively on Th2 cells, ILC2s, eosinophils, and basophils – the cells
associated with type 2 responses. CRTH2 binding on these cells triggers their chemotaxis
and activation, with type 2 cytokine release by Th2 cells54 and ILC2s57, eosinophil shape
change and degranulation121, and enhancement of IgE-mediated basophil degranulation122.
PGD2 signalling via CRTH2 could therefore be pivotal in diseases characterized by excess
type 2 inflammation, e.g. asthma, allergic rhinitis and atopic dermatitis.
1.6.2 Prostaglandin D2 and the CRTH2 receptor in asthma
There is evidence that this pathway is upregulated in asthma with:
• higher levels of PGD2 at baseline123;
• a greater capacity for PGD2 synthesis, with higher expression of the synthetic
enzymes COX-2124 and haematopoietic PGDS125, and greater numbers of the
Introduction
37/233
principal cellular source of PGD2, mast cells (reviewed in 126), in the lungs of subjects
with asthma; and
• a greater sensitivity to PGD2, with higher numbers of CRTH2+ cells expressing a
greater density of CRTH2 receptors125,127-129.
These observations are more marked in subjects with poor asthma control and a history of
recent exacerbation(s)125, although there are no published reports of CRTH2+ cell numbers
during exacerbations.
In addition, several polymorphisms in the CRTH2 gene are linked with asthma130,131, and one
of these is associated with an increase in blood eosinophils and CRTH2+ cells as a proportion
of total cells131.
It is worth noting that animal studies have been limited by critical differences in the pattern
of expression of CRTH2, present on Th1 as well as Th2 cells in mice. As a consequence, mice
in which CRTH2 signalling is disrupted by either a receptor antagonist or gene knockout yield
contradictory decreased and increased eosinophilia respectively after allergen sensitization
and challenge132,133.
1.6.3 Rationale for CRTH2 receptor blockade
Given its expression on cells associated with type 2 inflammation and the effect its
activation has on them, the CRTH2 receptor is an attractive target. It offers the prospect of
selectively dampening type 2 inflammation in asthma, acting upstream to potentially
combine the benefits of IL-4, IL-5 and IL-13 reduction as demonstrated in trials of
monoclonal antibodies targeting these cytokines.
There are additional practical benefits to CRTH2 receptor blockade. CRTH2 antagonists are
small molecules, not monoclonal antibodies, and can therefore be manufactured at a
fraction of the cost, stored for longer and without refrigeration, and administered orally
rather than by injection, without the additional cost incurred or risk of infusion reactions or
immunogenicity. As such, they present a potential solution to the prospective enormous
financial burden of treating the large numbers of asthma patients with expensive antibody
treatments (>£10,000 a year per patient).
Introduction
38/233
1.7 Human rhinovirus challenge as a model of asthma exacerbations
1.7.1 Advantages of human experimental infection studies
Since Edward Jenner inoculated an 8 year old child with cowpox in 1796, the study of
intentionally infected humans has provided important insights into various infectious
diseases. Such human challenge experiments have also served as models for testing
antimicrobial drugs and vaccines, much as in Jenner’s original thesis.
The study of experimental infection presents numerous advantages over that of naturally
occurring infections. With the timing of infection known, the pre-infection host baseline can
be characterized in detail, and sample taking at pre-specified intervals allows dissection of
the subsequent events, including those before the participant would have been
symptomatic and presented in another setting. Variability in the pathogen is removed, the
risk of co-infection far less likely, and variability in the host population can be minimized
through selective participant recruitment. The corresponding limitation is that it is uncertain
whether the findings of such studies are applicable to naturally occurring infections with a
variety of pathogens in a more heterogeneous population. However these studies are
clearly superior in this respect to in vitro experiments or animal models.
1.7.2 Human challenge with respiratory viruses
The study of respiratory viruses in the UK dates back to 1931, when Sir Christopher Andrews
infected students from St Bartholomew’s Hospital with influenza. The students he noted
“were cheaper than chimpanzees”, an important consideration in the great depression.
However they were not quarantined which not only posed a danger to public health but also
risked confounding the results with concomitant community acquired infection.
Quarantine housing was eventually established in a former US military hospital building,
erected in the isolation of the Salisbury countryside. The first volunteers were inoculated in
1946 and numerous challenge studies with a number of viruses took place there until it
closed in 1989134. The unit attained notoriety in the media, with the trials described as “a
holiday not to be sneezed at”, and the programme was frequently over-subscribed with
volunteers. These studies demonstrated, amongst other things, that colds could be
transmitted by nasal secretions that were subsequently shown to contain rhinoviruses.
Introduction
39/233
1.7.3 Experimental rhinovirus infection in asthma
After initial studies in healthy volunteers and atopic subjects, rhinovirus challenge was
introduced in subjects with asthma135. Since then over 20 such studies have been
conducted. These have yielded important insights, showing that rhinoviruses produce
greater upper airway symptoms and systemic and airway inflammation in subjects with
asthma compared to healthy controls (see Table 1.1). In addition, subjects with asthma
report lower respiratory symptoms, develop airflow obstruction (measured by the forced
expiratory volume in 1 second, FEV1) and airway hyperresponsiveness (as measured by PC20,
the provocation concentration of histamine producing a 20% fall in FEV1), and a pattern of
type 2 inflammation including airway eosinophilia.
To limit the risk of inducing severe asthma exacerbations, recruitment into such studies was
initially restricted to subjects with mild asthma. Withdrawals due to acute exacerbations
requiring medical intervention were rare (one subject requiring oral steroids in each of four
studies, only one of whom was hospitalized83,135-137, and none in any of the other 14 studies
prior to 2014). But questions remained over whether the findings were applicable to those
with more severe asthma, not only because of potential differences in the underlying
disease but also the impact of ICS treatment. Moreover these are the patients with the
greater clinical need, as exacerbations are potentially more serious to their health.
Given this, the rhinovirus challenge model was safely extended to a group of subjects with
moderate asthma requiring ICS for maintenance138. This confirmed the increases in upper
and lower respiratory symptoms correlating with nasal and sputum viral loads seen in
milder subjects. However lung function was preserved, which may have been due to
increased bronchodilator use, and airway hyperresponsiveness unchanged, which was
attributed to long term ICS use.
A subsequent study45 experimentally infected subjects requiring ICS maintenance therapy,
some of whom in addition had poor symptom control as defined by an ACQ score ≥1.5, and
compared them to a group of ICS-naïve subjects with asthma and controls without asthma.
Disease severity and, in particular, poor symptom control were associated with greater
symptom scores and reductions in lung function during exacerbation139. It should be noted
that although these participants had more severe and less well-controlled asthma than
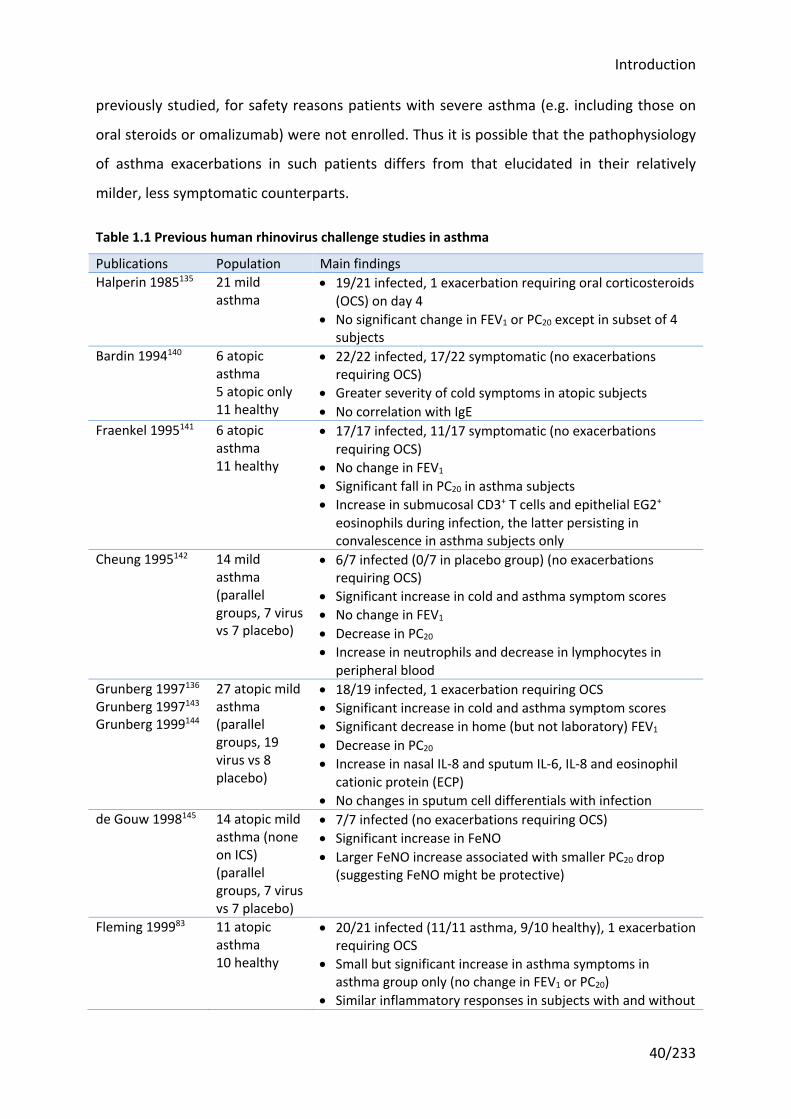
Introduction
40/233
previously studied, for safety reasons patients with severe asthma (e.g. including those on
oral steroids or omalizumab) were not enrolled. Thus it is possible that the pathophysiology
of asthma exacerbations in such patients differs from that elucidated in their relatively
milder, less symptomatic counterparts.
Table 1.1 Previous human rhinovirus challenge studies in asthma
Publications Population Main findings Halperin 1985135 21 mild
asthma • 19/21 infected, 1 exacerbation requiring oral corticosteroids
(OCS) on day 4 • No significant change in FEV1 or PC20 except in subset of 4
subjects Bardin 1994140 6 atopic
asthma 5 atopic only 11 healthy
• 22/22 infected, 17/22 symptomatic (no exacerbations requiring OCS)
• Greater severity of cold symptoms in atopic subjects • No correlation with IgE
Fraenkel 1995141 6 atopic asthma 11 healthy
• 17/17 infected, 11/17 symptomatic (no exacerbations requiring OCS)
• No change in FEV1 • Significant fall in PC20 in asthma subjects • Increase in submucosal CD3+ T cells and epithelial EG2+
eosinophils during infection, the latter persisting in convalescence in asthma subjects only
Cheung 1995142 14 mild asthma (parallel groups, 7 virus vs 7 placebo)
• 6/7 infected (0/7 in placebo group) (no exacerbations requiring OCS)
• Significant increase in cold and asthma symptom scores • No change in FEV1 • Decrease in PC20 • Increase in neutrophils and decrease in lymphocytes in
peripheral blood Grunberg 1997136 Grunberg 1997143 Grunberg 1999144
27 atopic mild asthma (parallel groups, 19 virus vs 8 placebo)
• 18/19 infected, 1 exacerbation requiring OCS • Significant increase in cold and asthma symptom scores • Significant decrease in home (but not laboratory) FEV1 • Decrease in PC20 • Increase in nasal IL-8 and sputum IL-6, IL-8 and eosinophil
cationic protein (ECP) • No changes in sputum cell differentials with infection
de Gouw 1998145 14 atopic mild asthma (none on ICS) (parallel groups, 7 virus vs 7 placebo)
• 7/7 infected (no exacerbations requiring OCS) • Significant increase in FeNO • Larger FeNO increase associated with smaller PC20 drop
(suggesting FeNO might be protective)
Fleming 199983 11 atopic asthma 10 healthy
• 20/21 infected (11/11 asthma, 9/10 healthy), 1 exacerbation requiring OCS
• Small but significant increase in asthma symptoms in asthma group only (no change in FEV1 or PC20)
• Similar inflammatory responses in subjects with and without
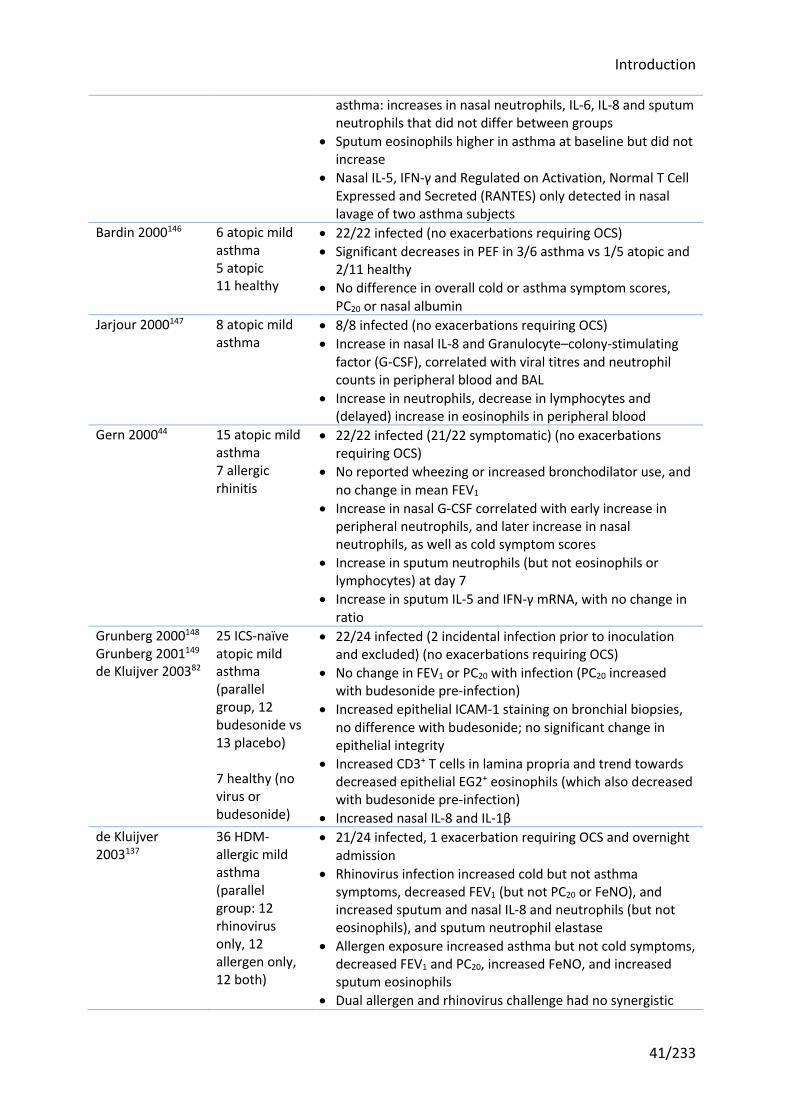
Introduction
41/233
asthma: increases in nasal neutrophils, IL-6, IL-8 and sputum neutrophils that did not differ between groups
• Sputum eosinophils higher in asthma at baseline but did not increase
• Nasal IL-5, IFN-γ and Regulated on Activation, Normal T Cell Expressed and Secreted (RANTES) only detected in nasal lavage of two asthma subjects
Bardin 2000146 6 atopic mild asthma 5 atopic 11 healthy
• 22/22 infected (no exacerbations requiring OCS) • Significant decreases in PEF in 3/6 asthma vs 1/5 atopic and
2/11 healthy • No difference in overall cold or asthma symptom scores,
PC20 or nasal albumin Jarjour 2000147 8 atopic mild
asthma • 8/8 infected (no exacerbations requiring OCS) • Increase in nasal IL-8 and Granulocyte–colony-stimulating
factor (G-CSF), correlated with viral titres and neutrophil counts in peripheral blood and BAL
• Increase in neutrophils, decrease in lymphocytes and (delayed) increase in eosinophils in peripheral blood
Gern 200044 15 atopic mild asthma 7 allergic rhinitis
• 22/22 infected (21/22 symptomatic) (no exacerbations requiring OCS)
• No reported wheezing or increased bronchodilator use, and no change in mean FEV1
• Increase in nasal G-CSF correlated with early increase in peripheral neutrophils, and later increase in nasal neutrophils, as well as cold symptom scores
• Increase in sputum neutrophils (but not eosinophils or lymphocytes) at day 7
• Increase in sputum IL-5 and IFN-γ mRNA, with no change in ratio
Grunberg 2000148 Grunberg 2001149 de Kluijver 200382
25 ICS-naïve atopic mild asthma (parallel group, 12 budesonide vs 13 placebo) 7 healthy (no virus or budesonide)
• 22/24 infected (2 incidental infection prior to inoculation and excluded) (no exacerbations requiring OCS)
• No change in FEV1 or PC20 with infection (PC20 increased with budesonide pre-infection)
• Increased epithelial ICAM-1 staining on bronchial biopsies, no difference with budesonide; no significant change in epithelial integrity
• Increased CD3+ T cells in lamina propria and trend towards decreased epithelial EG2+ eosinophils (which also decreased with budesonide pre-infection)
• Increased nasal IL-8 and IL-1β de Kluijver 2003137
36 HDM-allergic mild asthma (parallel group: 12 rhinovirus only, 12 allergen only, 12 both)
• 21/24 infected, 1 exacerbation requiring OCS and overnight admission
• Rhinovirus infection increased cold but not asthma symptoms, decreased FEV1 (but not PC20 or FeNO), and increased sputum and nasal IL-8 and neutrophils (but not eosinophils), and sputum neutrophil elastase
• Allergen exposure increased asthma but not cold symptoms, decreased FEV1 and PC20, increased FeNO, and increased sputum eosinophils
• Dual allergen and rhinovirus challenge had no synergistic
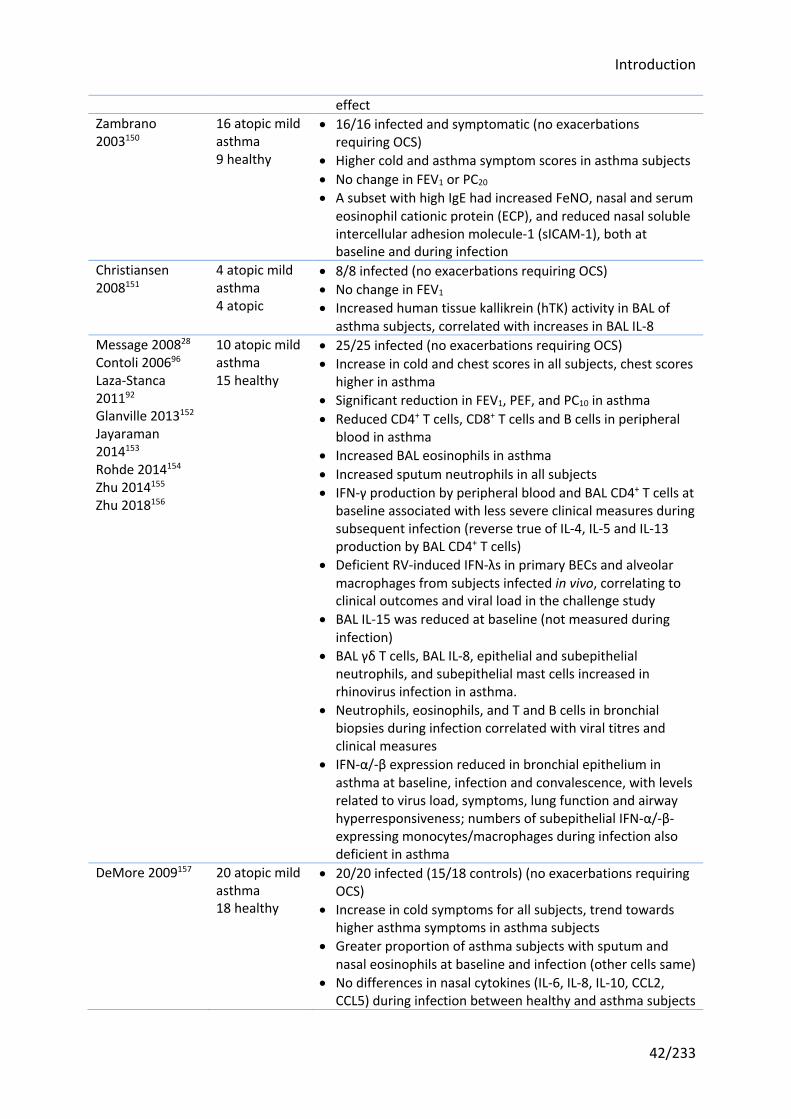
Introduction
42/233
effect Zambrano 2003150
16 atopic mild asthma 9 healthy
• 16/16 infected and symptomatic (no exacerbations requiring OCS)
• Higher cold and asthma symptom scores in asthma subjects • No change in FEV1 or PC20 • A subset with high IgE had increased FeNO, nasal and serum
eosinophil cationic protein (ECP), and reduced nasal soluble intercellular adhesion molecule-1 (sICAM-1), both at baseline and during infection
Christiansen 2008151
4 atopic mild asthma 4 atopic
• 8/8 infected (no exacerbations requiring OCS) • No change in FEV1 • Increased human tissue kallikrein (hTK) activity in BAL of
asthma subjects, correlated with increases in BAL IL-8 Message 200828 Contoli 200696 Laza-Stanca 201192 Glanville 2013152 Jayaraman 2014153 Rohde 2014154 Zhu 2014155 Zhu 2018156
10 atopic mild asthma 15 healthy
• 25/25 infected (no exacerbations requiring OCS) • Increase in cold and chest scores in all subjects, chest scores
higher in asthma • Significant reduction in FEV1, PEF, and PC10 in asthma • Reduced CD4+ T cells, CD8+ T cells and B cells in peripheral
blood in asthma • Increased BAL eosinophils in asthma • Increased sputum neutrophils in all subjects • IFN-γ production by peripheral blood and BAL CD4+ T cells at
baseline associated with less severe clinical measures during subsequent infection (reverse true of IL-4, IL-5 and IL-13 production by BAL CD4+ T cells)
• Deficient RV-induced IFN-λs in primary BECs and alveolar macrophages from subjects infected in vivo, correlating to clinical outcomes and viral load in the challenge study
• BAL IL-15 was reduced at baseline (not measured during infection)
• BAL γδ T cells, BAL IL-8, epithelial and subepithelial neutrophils, and subepithelial mast cells increased in rhinovirus infection in asthma.
• Neutrophils, eosinophils, and T and B cells in bronchial biopsies during infection correlated with viral titres and clinical measures
• IFN-α/-β expression reduced in bronchial epithelium in asthma at baseline, infection and convalescence, with levels related to virus load, symptoms, lung function and airway hyperresponsiveness; numbers of subepithelial IFN-α/-β-expressing monocytes/macrophages during infection also deficient in asthma
DeMore 2009157 20 atopic mild asthma 18 healthy
• 20/20 infected (15/18 controls) (no exacerbations requiring OCS)
• Increase in cold symptoms for all subjects, trend towards higher asthma symptoms in asthma subjects
• Greater proportion of asthma subjects with sputum and nasal eosinophils at baseline and infection (other cells same)
• No differences in nasal cytokines (IL-6, IL-8, IL-10, CCL2, CCL5) during infection between healthy and asthma subjects
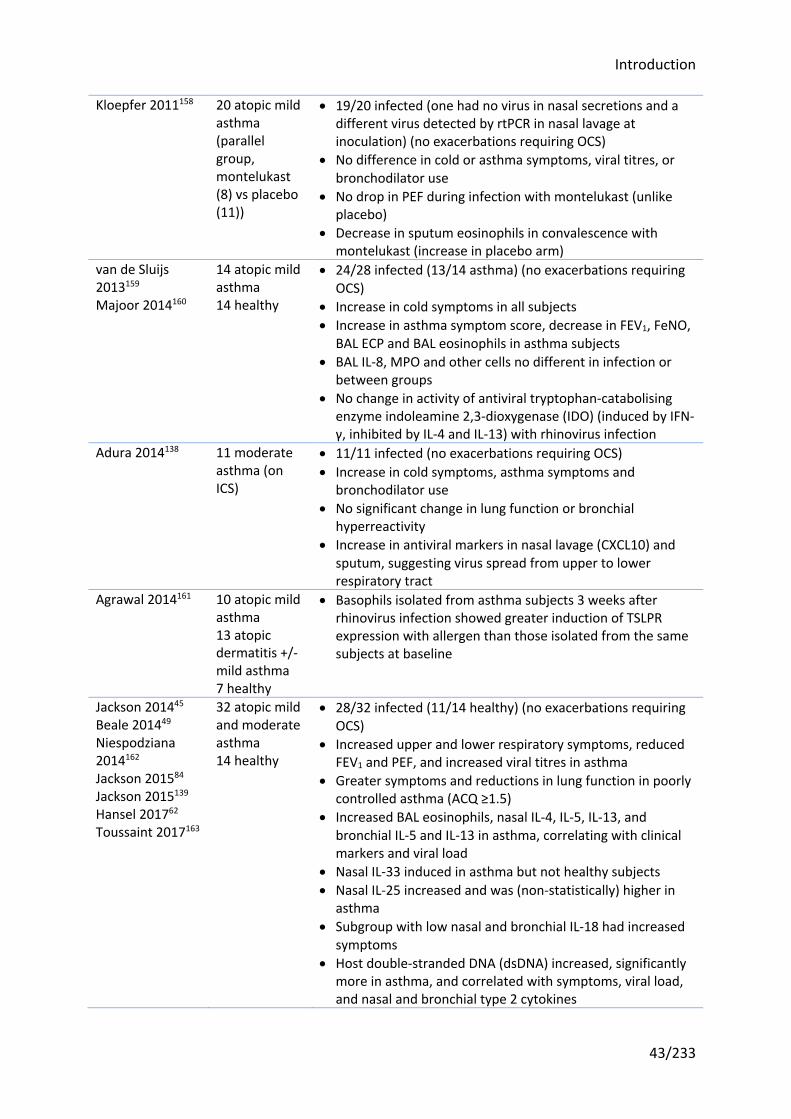
Introduction
43/233
Kloepfer 2011158
20 atopic mild asthma (parallel group, montelukast (8) vs placebo (11))
• 19/20 infected (one had no virus in nasal secretions and a different virus detected by rtPCR in nasal lavage at inoculation) (no exacerbations requiring OCS)
• No difference in cold or asthma symptoms, viral titres, or bronchodilator use
• No drop in PEF during infection with montelukast (unlike placebo)
• Decrease in sputum eosinophils in convalescence with montelukast (increase in placebo arm)
van de Sluijs 2013159 Majoor 2014160
14 atopic mild asthma 14 healthy
• 24/28 infected (13/14 asthma) (no exacerbations requiring OCS)
• Increase in cold symptoms in all subjects • Increase in asthma symptom score, decrease in FEV1, FeNO,
BAL ECP and BAL eosinophils in asthma subjects • BAL IL-8, MPO and other cells no different in infection or
between groups • No change in activity of antiviral tryptophan-catabolising
enzyme indoleamine 2,3-dioxygenase (IDO) (induced by IFN-γ, inhibited by IL-4 and IL-13) with rhinovirus infection
Adura 2014138 11 moderate asthma (on ICS)
• 11/11 infected (no exacerbations requiring OCS) • Increase in cold symptoms, asthma symptoms and
bronchodilator use • No significant change in lung function or bronchial
hyperreactivity • Increase in antiviral markers in nasal lavage (CXCL10) and
sputum, suggesting virus spread from upper to lower respiratory tract
Agrawal 2014161 10 atopic mild asthma 13 atopic dermatitis +/- mild asthma 7 healthy
• Basophils isolated from asthma subjects 3 weeks after rhinovirus infection showed greater induction of TSLPR expression with allergen than those isolated from the same subjects at baseline
Jackson 201445 Beale 201449 Niespodziana 2014162 Jackson 201584 Jackson 2015139 Hansel 201762 Toussaint 2017163
32 atopic mild and moderate asthma 14 healthy
• 28/32 infected (11/14 healthy) (no exacerbations requiring OCS)
• Increased upper and lower respiratory symptoms, reduced FEV1 and PEF, and increased viral titres in asthma
• Greater symptoms and reductions in lung function in poorly controlled asthma (ACQ ≥1.5)
• Increased BAL eosinophils, nasal IL-4, IL-5, IL-13, and bronchial IL-5 and IL-13 in asthma, correlating with clinical markers and viral load
• Nasal IL-33 induced in asthma but not healthy subjects • Nasal IL-25 increased and was (non-statistically) higher in
asthma • Subgroup with low nasal and bronchial IL-18 had increased
symptoms • Host double-stranded DNA (dsDNA) increased, significantly
more in asthma, and correlated with symptoms, viral load, and nasal and bronchial type 2 cytokines
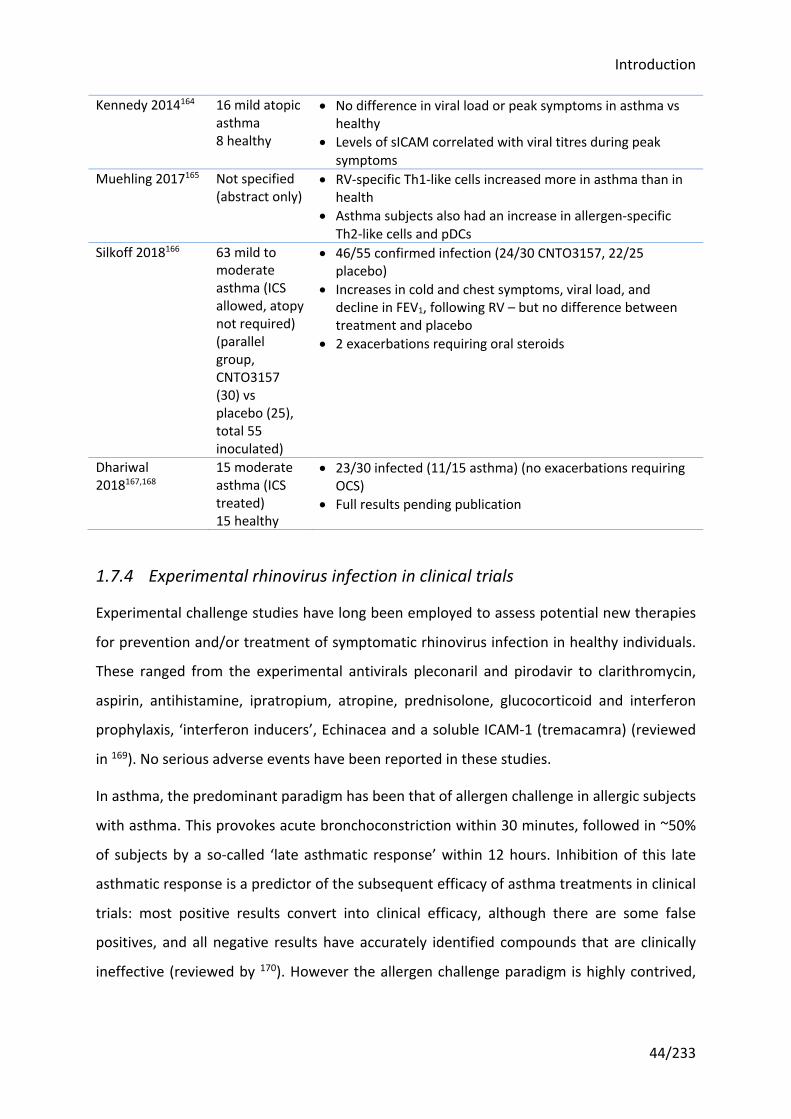
Introduction
44/233
Kennedy 2014164 16 mild atopic asthma 8 healthy
• No difference in viral load or peak symptoms in asthma vs healthy
• Levels of sICAM correlated with viral titres during peak symptoms
Muehling 2017165 Not specified (abstract only)
• RV-specific Th1-like cells increased more in asthma than in health
• Asthma subjects also had an increase in allergen-specific Th2-like cells and pDCs
Silkoff 2018166 63 mild to moderate asthma (ICS allowed, atopy not required) (parallel group, CNTO3157 (30) vs placebo (25), total 55 inoculated)
• 46/55 confirmed infection (24/30 CNTO3157, 22/25 placebo)
• Increases in cold and chest symptoms, viral load, and decline in FEV1, following RV – but no difference between treatment and placebo
• 2 exacerbations requiring oral steroids
Dhariwal 2018167,168
15 moderate asthma (ICS treated) 15 healthy
• 23/30 infected (11/15 asthma) (no exacerbations requiring OCS)
• Full results pending publication
1.7.4 Experimental rhinovirus infection in clinical trials
Experimental challenge studies have long been employed to assess potential new therapies
for prevention and/or treatment of symptomatic rhinovirus infection in healthy individuals.
These ranged from the experimental antivirals pleconaril and pirodavir to clarithromycin,
aspirin, antihistamine, ipratropium, atropine, prednisolone, glucocorticoid and interferon
prophylaxis, ‘interferon inducers’, Echinacea and a soluble ICAM-1 (tremacamra) (reviewed
in 169). No serious adverse events have been reported in these studies.
In asthma, the predominant paradigm has been that of allergen challenge in allergic subjects
with asthma. This provokes acute bronchoconstriction within 30 minutes, followed in ~50%
of subjects by a so-called ‘late asthmatic response’ within 12 hours. Inhibition of this late
asthmatic response is a predictor of the subsequent efficacy of asthma treatments in clinical
trials: most positive results convert into clinical efficacy, although there are some false
positives, and all negative results have accurately identified compounds that are clinically
ineffective (reviewed by 170). However the allergen challenge paradigm is highly contrived,
Introduction
45/233
bearing little resemblance to any clinical scenario, and ignores the reality that the vast
majority of asthma exacerbations are virus-induced.
Rhinovirus infection reliably induces exacerbations in subjects with asthma, offering the
ability to investigate treatment effects on asthma exacerbations with relatively few
volunteers and minimize the numbers exposed to a new drug with limited safety data. In
contrast, drug trials powered to evaluate an effect on naturally occurring asthma
exacerbations require much large numbers of volunteers and a study period long enough to
capture sufficient events. This exposes more subjects for longer periods to experimental
drugs and makes the trials significantly more expensive to carry out.
To date, three randomized-controlled trials using the human rhinovirus challenge model
have been published. In the first, ICS-naïve subjects were randomized to twice daily
budesonide at a dose of 800mcg for 16 days prior to rhinovirus inoculation149. Rhinovirus
infection had no effect on lung function or airway hyperresponsiveness in either group,
suggesting the study participants had mild disease. The same study included a mechanistic
analysis, looking at the effect of budesonide on the rhinovirus-induced influx of
inflammatory cells in bronchial biopsies (specifically the number of cells staining positively
with CD3, CD4, CD8, EG2, elastase and tryptase), and found no effect on any cell type.
The second trial was a pilot study to assess whether the leukotriene receptor antagonist
montelukast could attenuate the severity of asthma symptoms following rhinovirus
challenge158. The investigators found no difference in asthma symptoms, cold symptoms, or
viral load, but a reduced drop in lung function (PEF) with montelukast. There was no
difference in eosinophil counts during the infection phase, although there was a decrease in
sputum eosinophils in convalescence in the montelukast group only. Again the subjects had
mild asthma, treated only with short acting bronchodilators as required.
A study of an inhibitory anti-TLR3 monoclonal antibody (CNTO 3157), which allowed
recruitment of participants on low to medium dose ICS, reported increases in cold and chest
symptoms, viral load, and a decline in FEV1 following rhinovirus infection, but no effect of
the study drug on these166. In addition there were two exacerbations requiring oral steroids
in the treatment group (out of 30 in this group who were inoculated with rhinovirus).
Introduction
46/233
Two other drug trials in rhinovirus challenge are listed on the clinicaltrials.gov register. One
examined whether anti-IgE treatment with omalizumab reduces lower respiratory tract
symptom scores after rhinovirus infection in subjects with mild asthma (defined as requiring
no more than short-acting β2 agonist (SABA) treatment less than daily, with relatively
preserved lung function) and atopy (serum IgE >125IU/mL, positive skin prick test)
(ClinicalTrials.gov identifier NCT02388997)171. Full results have yet to be published, but from
the registry entry anti-IgE had no effect on the primary outcome, lower respiratory
symptom scores during the first four days, or any secondary outcomes except a post hoc
analysis of time to peak lower respiratory symptom scores (16.0 days in the treatment
group versus 7.8 days with placebo, P=0.037).
The second unreported trial listed in the registry aims to assess whether a single dose of the
anti-IL-5 drug, mepolizumab, reduces symptoms, lung function changes, bronchial
inflammation, and affects antiviral immune responses following rhinovirus infection
(ClinicalTrials.gov identifier NCT01520051)172. This was due to complete in 2014 and the
record has not been updated for two years.
1.8 Previous studies of CRTH2 antagonists and OC459 in asthma
1.8.1 CRTH2 antagonists in development for asthma
CRTH2 receptor blockade is hypothesized to suppress type 2 inflammation, and therefore to
benefit those with asthma in whom type 2 inflammation is a key driver of disease. Proof of
concept was demonstrated in a nasal allergen challenge study in subjects with allergic
rhinitis. Allergic rhinitis is considered to be a more clear-cut type 2 inflammatory disease,
and nasal allergen challenges have been shown to reliably provoke nasal symptoms and the
release of large quantities of type 2 cytokines (IL-4, IL-5, IL-13) within hours173,174. In a
randomized cross-over trial in subjects with allergic rhinitis, CRTH2 antagonism with OC459
markedly reduced nasal and ocular symptoms following allergen challenge, an effect that
persisted in a second cross-over treatment period despite a three week washout175.
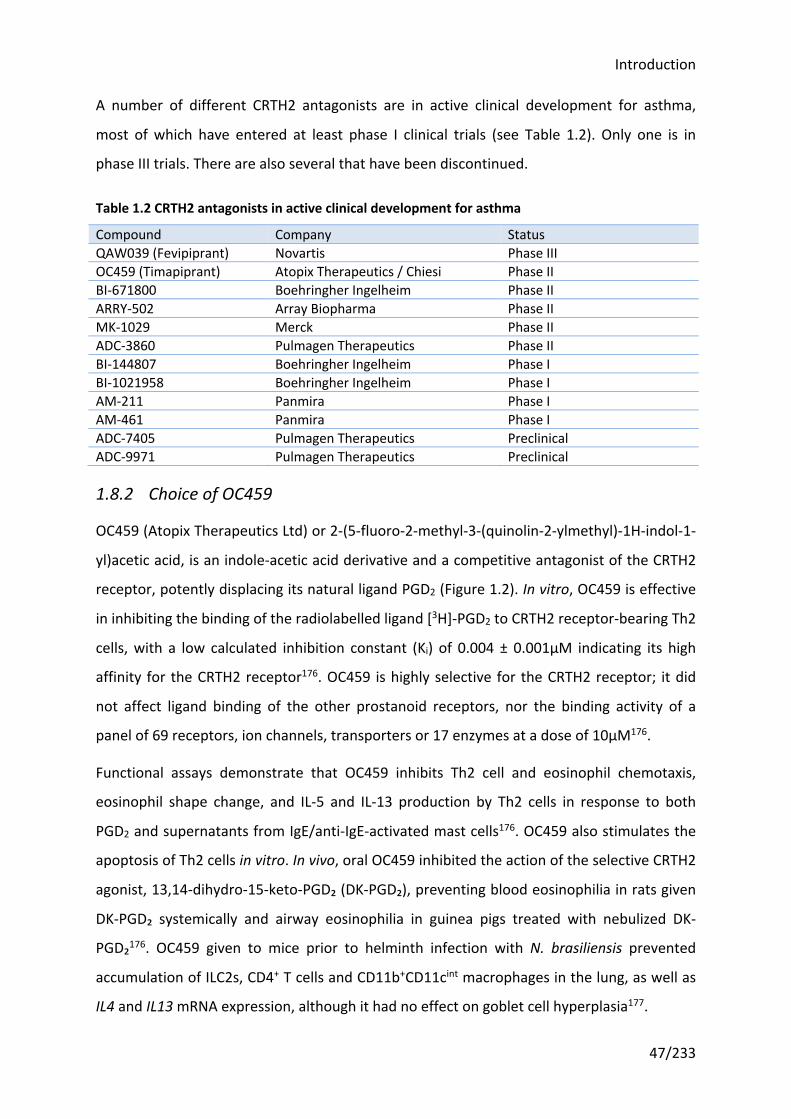
Introduction
47/233
A number of different CRTH2 antagonists are in active clinical development for asthma,
most of which have entered at least phase I clinical trials (see Table 1.2). Only one is in
phase III trials. There are also several that have been discontinued.
Table 1.2 CRTH2 antagonists in active clinical development for asthma
Compound Company Status QAW039 (Fevipiprant) Novartis Phase III OC459 (Timapiprant) Atopix Therapeutics / Chiesi Phase II BI-671800 Boehringher Ingelheim Phase II ARRY-502 Array Biopharma Phase II MK-1029 Merck Phase II ADC-3860 Pulmagen Therapeutics Phase II BI-144807 Boehringher Ingelheim Phase I BI-1021958 Boehringher Ingelheim Phase I AM-211 Panmira Phase I AM-461 Panmira Phase I ADC-7405 Pulmagen Therapeutics Preclinical ADC-9971 Pulmagen Therapeutics Preclinical
1.8.2 Choice of OC459
OC459 (Atopix Therapeutics Ltd) or 2-(5-fluoro-2-methyl-3-(quinolin-2-ylmethyl)-1H-indol-1-
yl)acetic acid, is an indole-acetic acid derivative and a competitive antagonist of the CRTH2
receptor, potently displacing its natural ligand PGD2 (Figure 1.2). In vitro, OC459 is effective
in inhibiting the binding of the radiolabelled ligand [3H]-PGD2 to CRTH2 receptor-bearing Th2
cells, with a low calculated inhibition constant (Ki) of 0.004 ± 0.001μM indicating its high
affinity for the CRTH2 receptor176. OC459 is highly selective for the CRTH2 receptor; it did
not affect ligand binding of the other prostanoid receptors, nor the binding activity of a
panel of 69 receptors, ion channels, transporters or 17 enzymes at a dose of 10μM176.
Functional assays demonstrate that OC459 inhibits Th2 cell and eosinophil chemotaxis,
eosinophil shape change, and IL-5 and IL-13 production by Th2 cells in response to both
PGD2 and supernatants from IgE/anti-IgE-activated mast cells176. OC459 also stimulates the
apoptosis of Th2 cells in vitro. In vivo, oral OC459 inhibited the action of the selective CRTH2
agonist, 13,14-dihydro-15-keto-PGD₂ (DK-PGD₂), preventing blood eosinophilia in rats given
DK-PGD₂ systemically and airway eosinophilia in guinea pigs treated with nebulized DK-
PGD₂176. OC459 given to mice prior to helminth infection with N. brasiliensis prevented
accumulation of ILC2s, CD4+ T cells and CD11b+CD11cint macrophages in the lung, as well as
IL4 and IL13 mRNA expression, although it had no effect on goblet cell hyperplasia177.
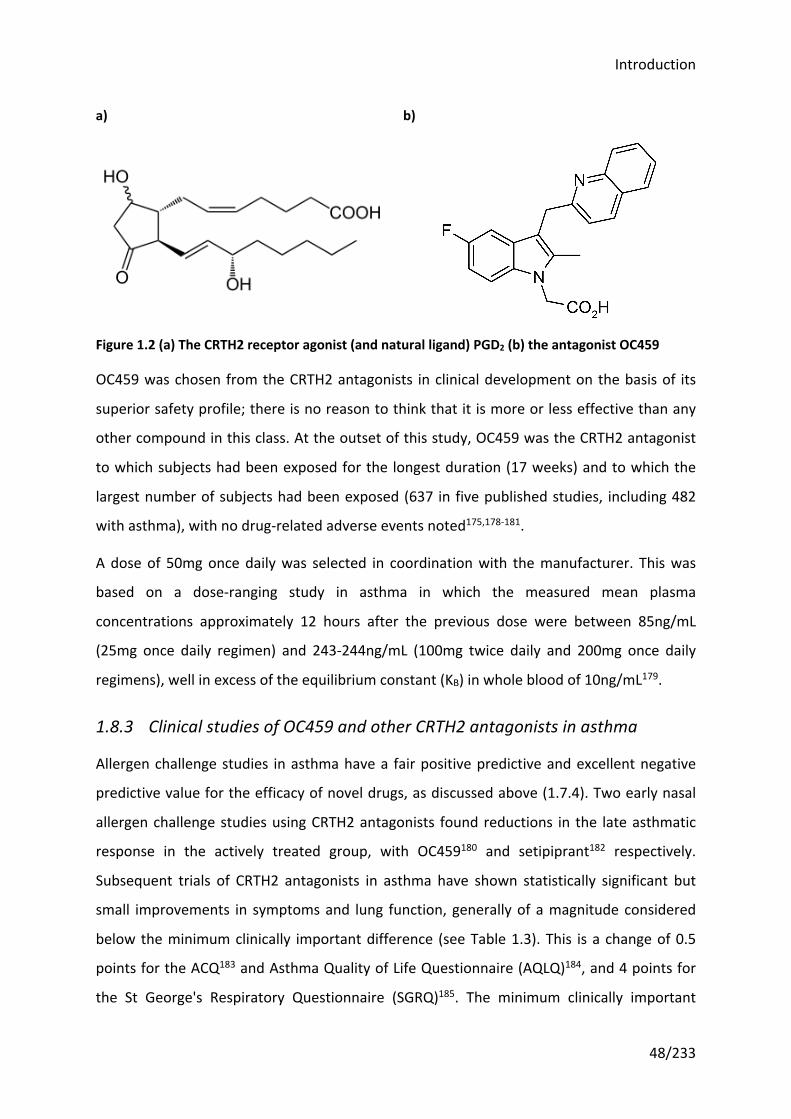
Introduction
48/233
OC459 was chosen from the CRTH2 antagonists in clinical development on the basis of its
superior safety profile; there is no reason to think that it is more or less effective than any
other compound in this class. At the outset of this study, OC459 was the CRTH2 antagonist
to which subjects had been exposed for the longest duration (17 weeks) and to which the
largest number of subjects had been exposed (637 in five published studies, including 482
with asthma), with no drug-related adverse events noted175,178-181.
A dose of 50mg once daily was selected in coordination with the manufacturer. This was
based on a dose-ranging study in asthma in which the measured mean plasma
concentrations approximately 12 hours after the previous dose were between 85ng/mL
(25mg once daily regimen) and 243-244ng/mL (100mg twice daily and 200mg once daily
regimens), well in excess of the equilibrium constant (KB) in whole blood of 10ng/mL179.
1.8.3 Clinical studies of OC459 and other CRTH2 antagonists in asthma
Allergen challenge studies in asthma have a fair positive predictive and excellent negative
predictive value for the efficacy of novel drugs, as discussed above (1.7.4). Two early nasal
allergen challenge studies using CRTH2 antagonists found reductions in the late asthmatic
response in the actively treated group, with OC459180 and setipiprant182 respectively.
Subsequent trials of CRTH2 antagonists in asthma have shown statistically significant but
small improvements in symptoms and lung function, generally of a magnitude considered
below the minimum clinically important difference (see Table 1.3). This is a change of 0.5
points for the ACQ183 and Asthma Quality of Life Questionnaire (AQLQ)184, and 4 points for
the St George's Respiratory Questionnaire (SGRQ)185. The minimum clinically important
a) b)
Figure 1.2 (a) The CRTH2 receptor agonist (and natural ligand) PGD2 (b) the antagonist OC459
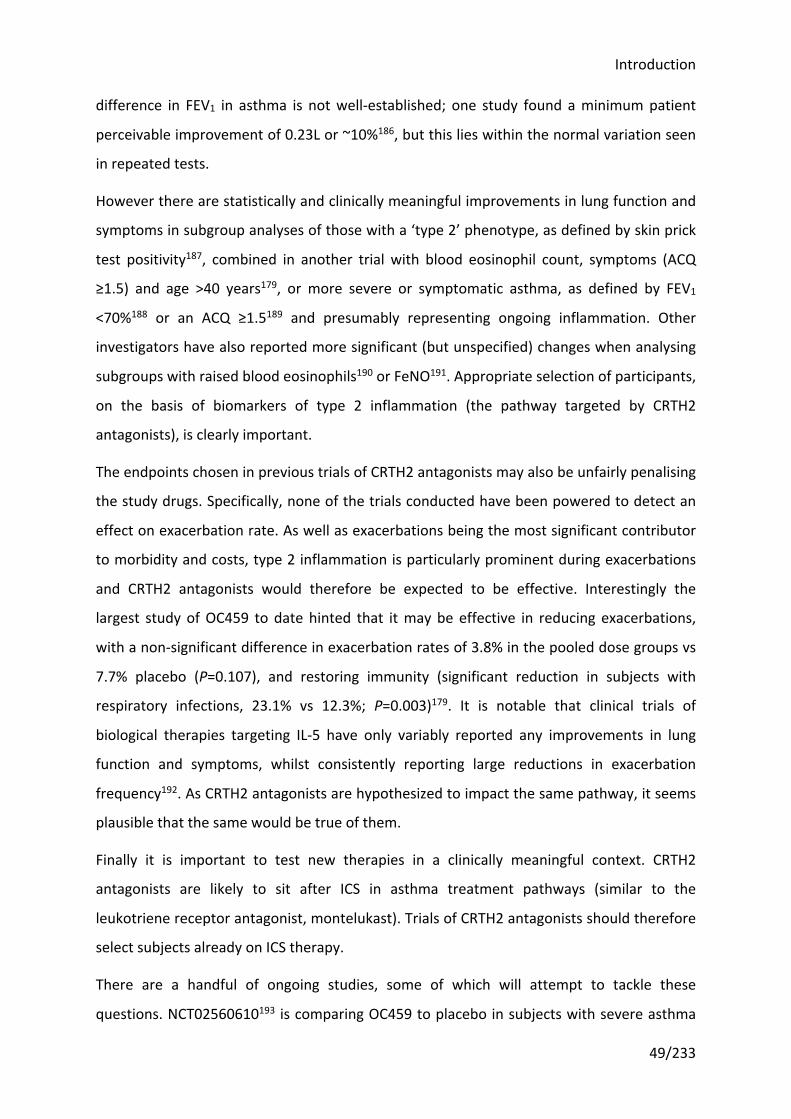
Introduction
49/233
difference in FEV1 in asthma is not well-established; one study found a minimum patient
perceivable improvement of 0.23L or ~10%186, but this lies within the normal variation seen
in repeated tests.
However there are statistically and clinically meaningful improvements in lung function and
symptoms in subgroup analyses of those with a ‘type 2’ phenotype, as defined by skin prick
test positivity187, combined in another trial with blood eosinophil count, symptoms (ACQ
≥1.5) and age >40 years179, or more severe or symptomatic asthma, as defined by FEV1
<70%188 or an ACQ ≥1.5189 and presumably representing ongoing inflammation. Other
investigators have also reported more significant (but unspecified) changes when analysing
subgroups with raised blood eosinophils190 or FeNO191. Appropriate selection of participants,
on the basis of biomarkers of type 2 inflammation (the pathway targeted by CRTH2
antagonists), is clearly important.
The endpoints chosen in previous trials of CRTH2 antagonists may also be unfairly penalising
the study drugs. Specifically, none of the trials conducted have been powered to detect an
effect on exacerbation rate. As well as exacerbations being the most significant contributor
to morbidity and costs, type 2 inflammation is particularly prominent during exacerbations
and CRTH2 antagonists would therefore be expected to be effective. Interestingly the
largest study of OC459 to date hinted that it may be effective in reducing exacerbations,
with a non-significant difference in exacerbation rates of 3.8% in the pooled dose groups vs
7.7% placebo (P=0.107), and restoring immunity (significant reduction in subjects with
respiratory infections, 23.1% vs 12.3%; P=0.003)179. It is notable that clinical trials of
biological therapies targeting IL-5 have only variably reported any improvements in lung
function and symptoms, whilst consistently reporting large reductions in exacerbation
frequency192. As CRTH2 antagonists are hypothesized to impact the same pathway, it seems
plausible that the same would be true of them.
Finally it is important to test new therapies in a clinically meaningful context. CRTH2
antagonists are likely to sit after ICS in asthma treatment pathways (similar to the
leukotriene receptor antagonist, montelukast). Trials of CRTH2 antagonists should therefore
select subjects already on ICS therapy.
There are a handful of ongoing studies, some of which will attempt to tackle these
questions. NCT02560610193 is comparing OC459 to placebo in subjects with severe asthma
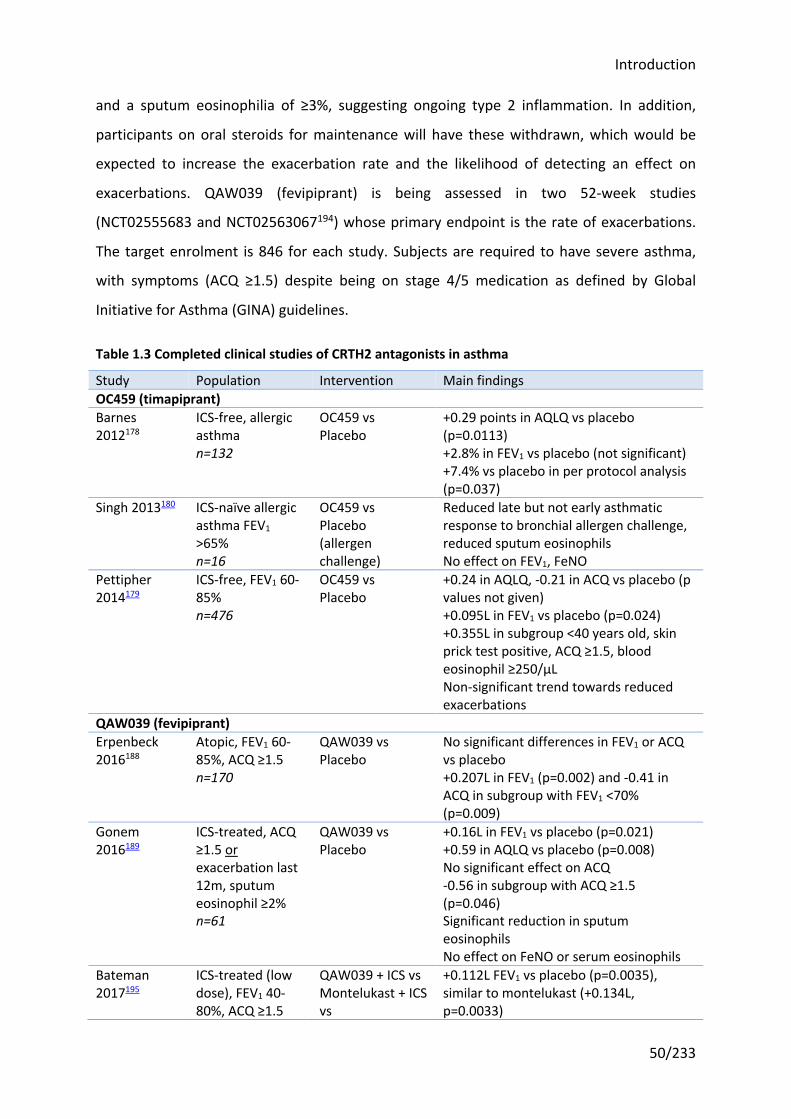
Introduction
50/233
and a sputum eosinophilia of ≥3%, suggesting ongoing type 2 inflammation. In addition,
participants on oral steroids for maintenance will have these withdrawn, which would be
expected to increase the exacerbation rate and the likelihood of detecting an effect on
exacerbations. QAW039 (fevipiprant) is being assessed in two 52-week studies
(NCT02555683 and NCT02563067194) whose primary endpoint is the rate of exacerbations.
The target enrolment is 846 for each study. Subjects are required to have severe asthma,
with symptoms (ACQ ≥1.5) despite being on stage 4/5 medication as defined by Global
Initiative for Asthma (GINA) guidelines.
Table 1.3 Completed clinical studies of CRTH2 antagonists in asthma
Study Population Intervention Main findings OC459 (timapiprant) Barnes 2012178
ICS-free, allergic asthma n=132
OC459 vs Placebo
+0.29 points in AQLQ vs placebo (p=0.0113) +2.8% in FEV1 vs placebo (not significant) +7.4% vs placebo in per protocol analysis (p=0.037)
Singh 2013180 ICS-naïve allergic asthma FEV1 >65% n=16
OC459 vs Placebo (allergen challenge)
Reduced late but not early asthmatic response to bronchial allergen challenge, reduced sputum eosinophils No effect on FEV1, FeNO
Pettipher 2014179
ICS-free, FEV1 60-85% n=476
OC459 vs Placebo
+0.24 in AQLQ, -0.21 in ACQ vs placebo (p values not given) +0.095L in FEV1 vs placebo (p=0.024) +0.355L in subgroup <40 years old, skin prick test positive, ACQ ≥1.5, blood eosinophil ≥250/μL Non-significant trend towards reduced exacerbations
QAW039 (fevipiprant) Erpenbeck 2016188
Atopic, FEV1 60-85%, ACQ ≥1.5 n=170
QAW039 vs Placebo
No significant differences in FEV1 or ACQ vs placebo +0.207L in FEV1 (p=0.002) and -0.41 in ACQ in subgroup with FEV1 <70% (p=0.009)
Gonem 2016189
ICS-treated, ACQ ≥1.5 or exacerbation last 12m, sputum eosinophil ≥2% n=61
QAW039 vs Placebo
+0.16L in FEV1 vs placebo (p=0.021) +0.59 in AQLQ vs placebo (p=0.008) No significant effect on ACQ -0.56 in subgroup with ACQ ≥1.5 (p=0.046) Significant reduction in sputum eosinophils No effect on FeNO or serum eosinophils
Bateman 2017195
ICS-treated (low dose), FEV1 40-80%, ACQ ≥1.5
QAW039 + ICS vs Montelukast + ICS vs
+0.112L FEV1 vs placebo (p=0.0035), similar to montelukast (+0.134L, p=0.0033)
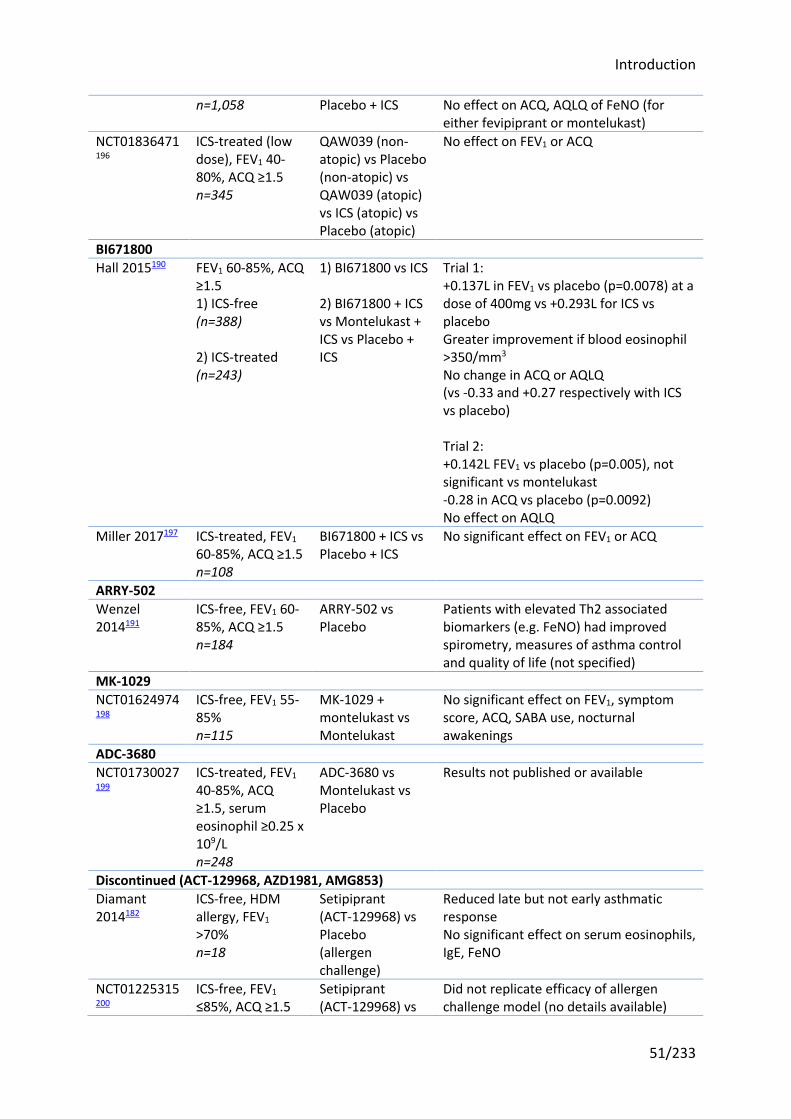
Introduction
51/233
n=1,058 Placebo + ICS No effect on ACQ, AQLQ of FeNO (for either fevipiprant or montelukast)
NCT01836471196
ICS-treated (low dose), FEV1 40-80%, ACQ ≥1.5 n=345
QAW039 (non-atopic) vs Placebo (non-atopic) vs QAW039 (atopic) vs ICS (atopic) vs Placebo (atopic)
No effect on FEV1 or ACQ
BI671800 Hall 2015190 FEV1 60-85%, ACQ
≥1.5 1) ICS-free (n=388) 2) ICS-treated (n=243)
1) BI671800 vs ICS 2) BI671800 + ICS vs Montelukast + ICS vs Placebo + ICS
Trial 1: +0.137L in FEV1 vs placebo (p=0.0078) at a dose of 400mg vs +0.293L for ICS vs placebo Greater improvement if blood eosinophil >350/mm3 No change in ACQ or AQLQ (vs -0.33 and +0.27 respectively with ICS vs placebo) Trial 2: +0.142L FEV1 vs placebo (p=0.005), not significant vs montelukast -0.28 in ACQ vs placebo (p=0.0092) No effect on AQLQ
Miller 2017197 ICS-treated, FEV1 60-85%, ACQ ≥1.5 n=108
BI671800 + ICS vs Placebo + ICS
No significant effect on FEV1 or ACQ
ARRY-502 Wenzel 2014191
ICS-free, FEV1 60-85%, ACQ ≥1.5 n=184
ARRY-502 vs Placebo
Patients with elevated Th2 associated biomarkers (e.g. FeNO) had improved spirometry, measures of asthma control and quality of life (not specified)
MK-1029 NCT01624974198
ICS-free, FEV1 55-85% n=115
MK-1029 + montelukast vs Montelukast
No significant effect on FEV1, symptom score, ACQ, SABA use, nocturnal awakenings
ADC-3680 NCT01730027199
ICS-treated, FEV1 40-85%, ACQ ≥1.5, serum eosinophil ≥0.25 x 10⁹/L n=248
ADC-3680 vs Montelukast vs Placebo
Results not published or available
Discontinued (ACT-129968, AZD1981, AMG853) Diamant 2014182
ICS-free, HDM allergy, FEV1 >70% n=18
Setipiprant (ACT-129968) vs Placebo (allergen challenge)
Reduced late but not early asthmatic response No significant effect on serum eosinophils, IgE, FeNO
NCT01225315200
ICS-free, FEV1 ≤85%, ACQ ≥1.5
Setipiprant (ACT-129968) vs
Did not replicate efficacy of allergen challenge model (no details available)
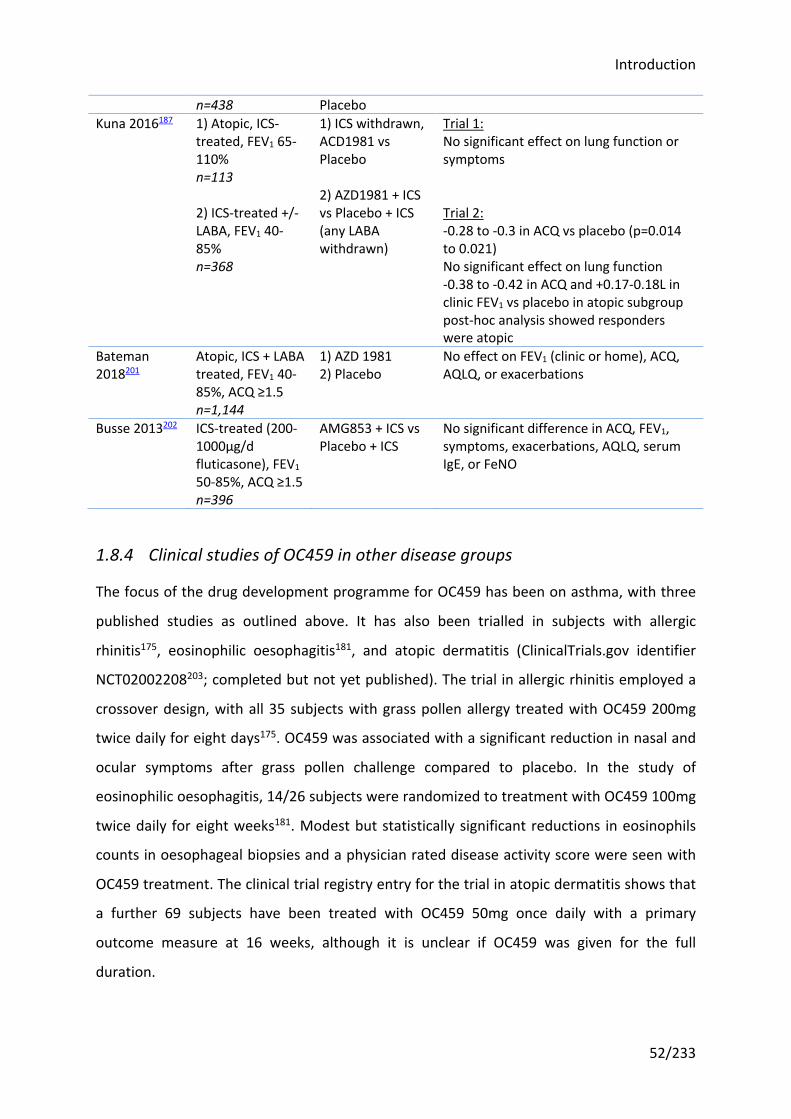
Introduction
52/233
n=438 Placebo Kuna 2016187 1) Atopic, ICS-
treated, FEV1 65-110% n=113 2) ICS-treated +/- LABA, FEV1 40-85% n=368
1) ICS withdrawn, ACD1981 vs Placebo 2) AZD1981 + ICS vs Placebo + ICS (any LABA withdrawn)
Trial 1: No significant effect on lung function or symptoms Trial 2: -0.28 to -0.3 in ACQ vs placebo (p=0.014 to 0.021) No significant effect on lung function -0.38 to -0.42 in ACQ and +0.17-0.18L in clinic FEV1 vs placebo in atopic subgroup post-hoc analysis showed responders were atopic
Bateman 2018201
Atopic, ICS + LABA treated, FEV1 40-85%, ACQ ≥1.5 n=1,144
1) AZD 1981 2) Placebo
No effect on FEV1 (clinic or home), ACQ, AQLQ, or exacerbations
Busse 2013202 ICS-treated (200-1000μg/d fluticasone), FEV1 50-85%, ACQ ≥1.5 n=396
AMG853 + ICS vs Placebo + ICS
No significant difference in ACQ, FEV1, symptoms, exacerbations, AQLQ, serum IgE, or FeNO
1.8.4 Clinical studies of OC459 in other disease groups
The focus of the drug development programme for OC459 has been on asthma, with three
published studies as outlined above. It has also been trialled in subjects with allergic
rhinitis175, eosinophilic oesophagitis181, and atopic dermatitis (ClinicalTrials.gov identifier
NCT02002208203; completed but not yet published). The trial in allergic rhinitis employed a
crossover design, with all 35 subjects with grass pollen allergy treated with OC459 200mg
twice daily for eight days175. OC459 was associated with a significant reduction in nasal and
ocular symptoms after grass pollen challenge compared to placebo. In the study of
eosinophilic oesophagitis, 14/26 subjects were randomized to treatment with OC459 100mg
twice daily for eight weeks181. Modest but statistically significant reductions in eosinophils
counts in oesophageal biopsies and a physician rated disease activity score were seen with
OC459 treatment. The clinical trial registry entry for the trial in atopic dermatitis shows that
a further 69 subjects have been treated with OC459 50mg once daily with a primary
outcome measure at 16 weeks, although it is unclear if OC459 was given for the full
duration.
Introduction
53/233
In all the studies of OC459 to date, rates of adverse events were comparable across OC459
and placebo groups, with no drug-related side effects noted. Other CRTH2 antagonists have
similar safety profiles, although there was less extensive experience of these at the outset of
this study.
1.9 Rationale, hypotheses and aims
1.9.1 Rationale
Prevention and treatment of virally-induced asthma exacerbations represents a major
unmet need. The majority of these are characterized by increased levels of type 2 cytokines.
The release of PGD2 and its binding on CRTH2 receptors (found on e.g. Th2 cells, ILC2s and
eosinophils) has been hypothesized to be the initiating event. Clinical trials of CRTH2
antagonists in asthma have been underwhelming, but most have focused on those with mild
or moderate asthma who are unlikely to have ongoing type 2 inflammation, and none have
been powered to assess an effect on exacerbations, when there are rapid increases in type 2
inflammation.
Previous studies have also suggested there is deficient release of antiviral interferons in
asthma. In vitro and in mice, type 2 cytokines have been shown to negatively regulate
interferon induction in response to viruses110-112. Given CRTH2 antagonism should suppress
type 2 inflammation in vivo, if the hypothesis is correct, this should restore interferon
responses to virus.
Experimental infection studies offer a model to test novel therapies with low numbers of
participants for a short period of time. Rhinovirus challenge in asthma that is of moderate
severity, or is not well controlled at the time of virus challenge, reliably induces an
exacerbation. This model can therefore be used to assess the effect of CRTH2 antagonists on
asthma exacerbations and, by addition of a programme of sampling, provide a simultaneous
mechanistic analysis of the drug, in particular its effect on CRTH2+ cells and the compounds
they release, and antiviral interferon production.
OC459 was chosen of the 12 CRTH2 antagonists in active clinical development because of its
superior safety profile. There was also the suggestion from a previous study in asthma that
it may be effective in reducing exacerbations and respiratory infections179.
Introduction
54/233
1.9.2 Hypotheses
1. CRTH2 blockade prevents the recruitment and activation of CRTH2+ cells (including
Th2 cells, ILC2s and eosinophils) following viral infection in asthma
2. Consequently CRTH2 blockade prevents the virus-induced worsening of symptoms
and lung function in asthma
3. CRTH2 restores antiviral interferon responses to virus by dampening down type 2
inflammation
1.9.3 Aims
1. Confirm that PGD2 is raised in RV-induced asthma exacerbations, and assess whether
CRTH2 blockade modulates this
2. Assess the primary and secondary endpoints of the clinical trial, specifically to test
whether blockade of the CRTH2 receptor with OC459 in subjects with asthma
infected with RV results in:
a) reduced symptoms
b) improved lung function and inflammation (spirometry, histamine challenge,
FeNO; also type 2 cytokines and inflammatory cells – see below)
c) reduced viral load
3. Assess the mechanism of action of OC459, specifically whether it:
a) attenuates recruitment of eosinophils, ILC2 and Th2 cells after drug
treatment (but before RV challenge) and following RV infection
b) reduces levels of type 2 cytokines (from activated ILC2 and Th2 cells), after
drug treatment (but before RV challenge) and following RV infection
4. Assess the relative contributions of PGD2 versus other mediators proposed to
orchestrate type 2 inflammation i.e. IL-33, IL-25, and TSLP, in RV-induced asthma
pathology
5. Determine whether deficiencies in innate antiviral immunity are seen in these
subjects with asthma, specifically type I and III interferons, and if so, whether these
Introduction
55/233
are reversed by CRTH2 blockade. Specifically bronchial epithelial cells from subjects
exposed to OC459 or placebo will be cultured and infected ex vivo with respiratory
viruses, with quantification of interferon protein and mRNA in the supernatants and
cell lysates respectively.
Results: Validation of the human rhinovirus challenge model of asthma exacerbations
56/233
2 Materials and methods
To address the hypotheses and aims, a prospective, parallel-group, double-blind,
randomized, placebo-controlled trial was carried out utilizing the rhinovirus experimental
infection model, coupled with regular clinical assessment and sampling. This chapter
describes the materials and methods used throughout the study.
2.1 Materials
2.1.1 Rhinovirus inoculum
The rhinovirus inoculum used was initially harvested from subjects infected with an
inoculum of RV-16 donated by E. Dick and W. Busse. The preparation of this RV-16 inoculum
was performed according to the current international recommendations of 1992204 under
the guidance and supervision of Dr David Tyrrell, former Director of the MRC Common Cold
Unit. The details of the source and preparation of the RV-16 inocolum have previously been
published205, which included extensive safety testing that identified no contaminating
viruses or other infectious agents.
The inoculum has been stored in the original sealed cryotube vials at -80°C. The vials were
sealed prior to safety testing and have remained sealed since. The inoculum does not have a
defined shelf-life, but has maintained efficacy in initiating common cold symptoms in ~85%
of subjects, with no reduction in infection frequency over time, it is thus expected to have
an almost indefinite shelf life at the storage temperature of -80°C. It has been used in 11
completed human challenge studies with comparable infection rates28,45,159,167,205-210, with
the exception of one study in which the inoculum was diluted to the dosed level then stored
for a prolonged period of time209, and no unexpected adverse events (Table 2.1).
Infection rates are not affected by the inoculum dose (TCID50; 50% tissue culture infective
dose), although anecdotally the experience in the group is that higher doses are associated
with an earlier onset of clinical symptoms and detectable virus copies.
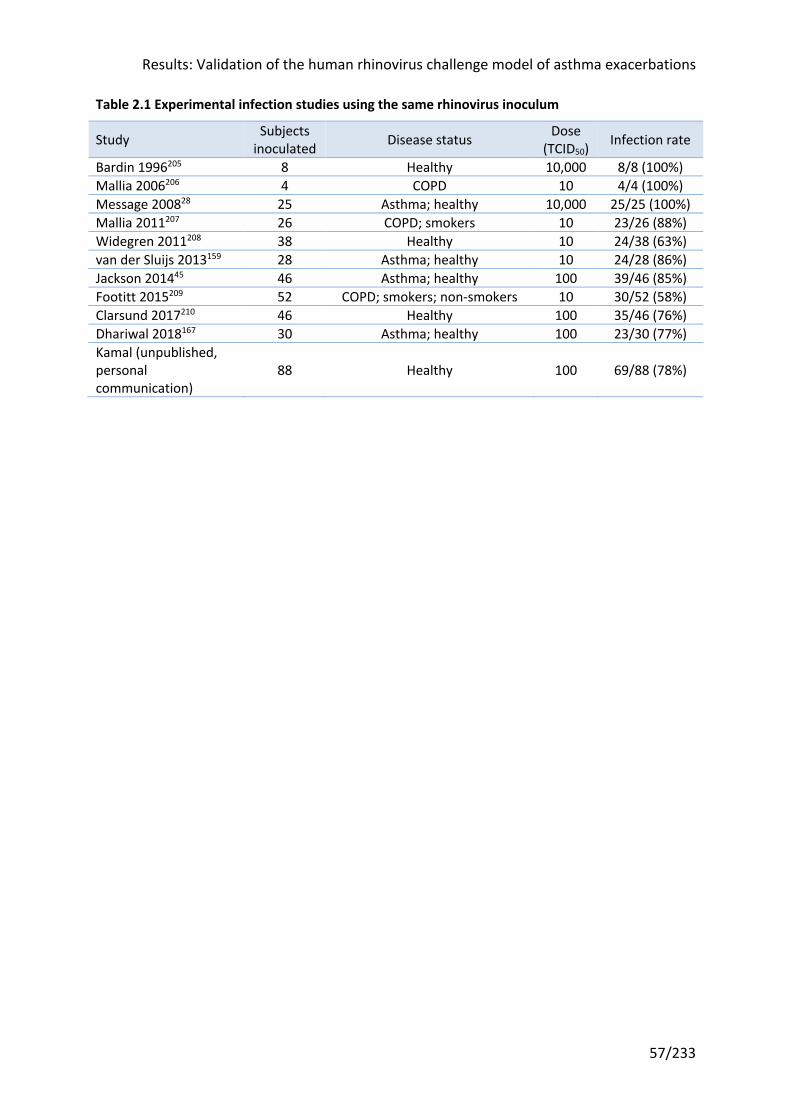
Results: Validation of the human rhinovirus challenge model of asthma exacerbations
57/233
Table 2.1 Experimental infection studies using the same rhinovirus inoculum
Study Subjects inoculated Disease status Dose
(TCID50) Infection rate
Bardin 1996205 8 Healthy 10,000 8/8 (100%) Mallia 2006206 4 COPD 10 4/4 (100%) Message 200828 25 Asthma; healthy 10,000 25/25 (100%) Mallia 2011207 26 COPD; smokers 10 23/26 (88%) Widegren 2011208 38 Healthy 10 24/38 (63%) van der Sluijs 2013159 28 Asthma; healthy 10 24/28 (86%) Jackson 201445 46 Asthma; healthy 100 39/46 (85%) Footitt 2015209 52 COPD; smokers; non-smokers 10 30/52 (58%) Clarsund 2017210 46 Healthy 100 35/46 (76%) Dhariwal 2018167 30 Asthma; healthy 100 23/30 (77%) Kamal (unpublished, personal communication)
88 Healthy 100 69/88 (78%)
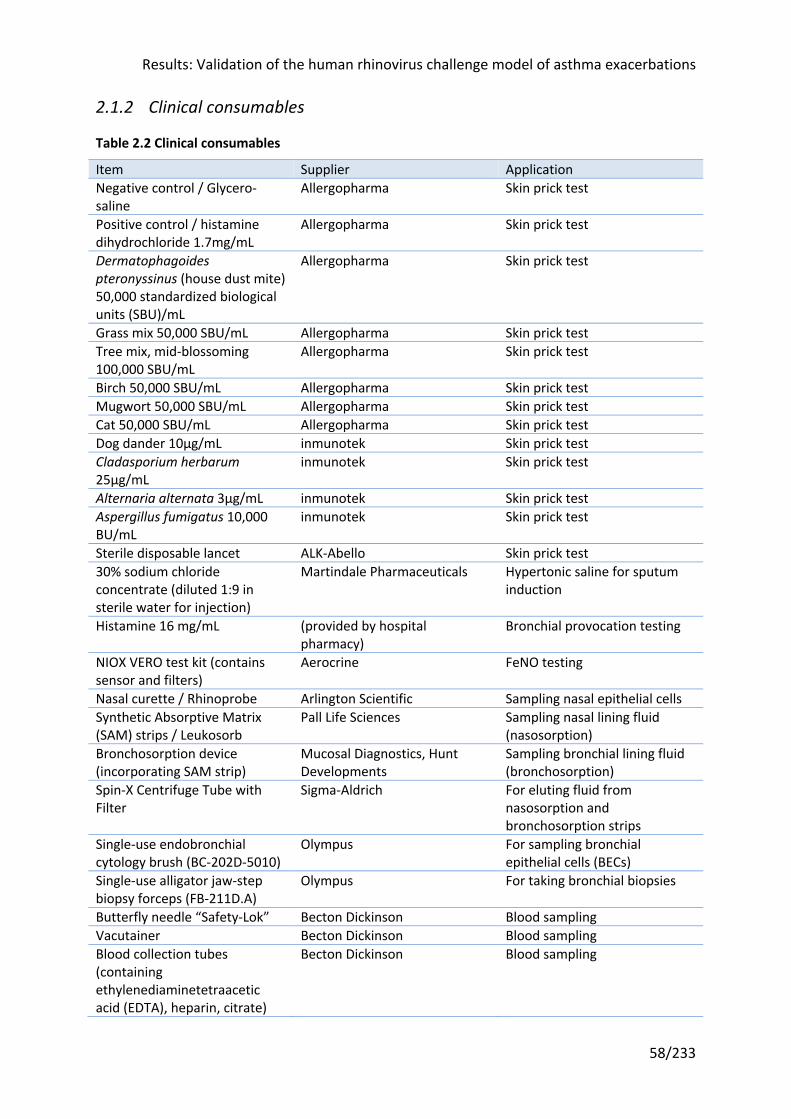
Results: Validation of the human rhinovirus challenge model of asthma exacerbations
58/233
2.1.2 Clinical consumables
Table 2.2 Clinical consumables
Item Supplier Application Negative control / Glycero-saline
Allergopharma Skin prick test
Positive control / histamine dihydrochloride 1.7mg/mL
Allergopharma Skin prick test
Dermatophagoides pteronyssinus (house dust mite) 50,000 standardized biological units (SBU)/mL
Allergopharma Skin prick test
Grass mix 50,000 SBU/mL Allergopharma Skin prick test Tree mix, mid-blossoming 100,000 SBU/mL
Allergopharma Skin prick test
Birch 50,000 SBU/mL Allergopharma Skin prick test Mugwort 50,000 SBU/mL Allergopharma Skin prick test Cat 50,000 SBU/mL Allergopharma Skin prick test Dog dander 10µg/mL inmunotek Skin prick test Cladasporium herbarum 25µg/mL
inmunotek Skin prick test
Alternaria alternata 3µg/mL inmunotek Skin prick test Aspergillus fumigatus 10,000 BU/mL
inmunotek Skin prick test
Sterile disposable lancet ALK-Abello Skin prick test 30% sodium chloride concentrate (diluted 1:9 in sterile water for injection)
Martindale Pharmaceuticals Hypertonic saline for sputum induction
Histamine 16 mg/mL (provided by hospital pharmacy)
Bronchial provocation testing
NIOX VERO test kit (contains sensor and filters)
Aerocrine FeNO testing
Nasal curette / Rhinoprobe Arlington Scientific Sampling nasal epithelial cells Synthetic Absorptive Matrix (SAM) strips / Leukosorb
Pall Life Sciences Sampling nasal lining fluid (nasosorption)
Bronchosorption device (incorporating SAM strip)
Mucosal Diagnostics, Hunt Developments
Sampling bronchial lining fluid (bronchosorption)
Spin-X Centrifuge Tube with Filter
Sigma-Aldrich For eluting fluid from nasosorption and bronchosorption strips
Single-use endobronchial cytology brush (BC-202D-5010)
Olympus For sampling bronchial epithelial cells (BECs)
Single-use alligator jaw-step biopsy forceps (FB-211D.A)
Olympus For taking bronchial biopsies
Butterfly needle “Safety-Lok” Becton Dickinson Blood sampling Vacutainer Becton Dickinson Blood sampling Blood collection tubes (containing ethylenediaminetetraacetic acid (EDTA), heparin, citrate)
Becton Dickinson Blood sampling
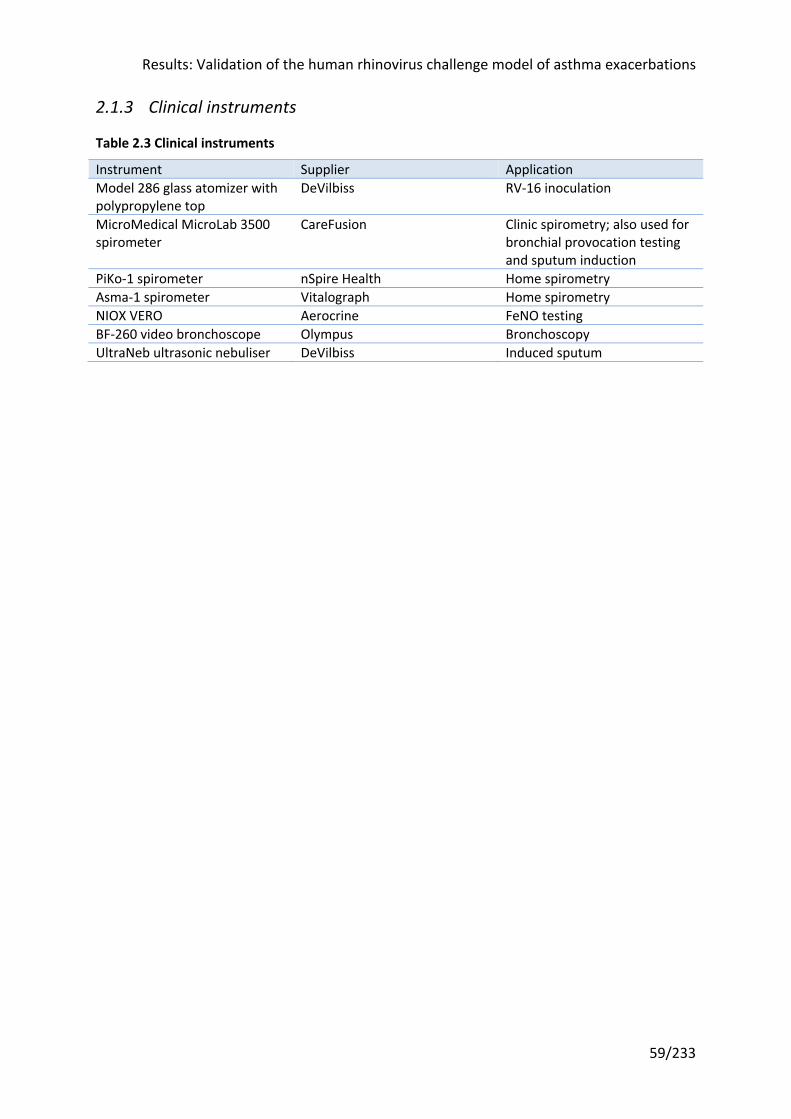
Results: Validation of the human rhinovirus challenge model of asthma exacerbations
59/233
2.1.3 Clinical instruments
Table 2.3 Clinical instruments
Instrument Supplier Application Model 286 glass atomizer with polypropylene top
DeVilbiss RV-16 inoculation
MicroMedical MicroLab 3500 spirometer
CareFusion Clinic spirometry; also used for bronchial provocation testing and sputum induction
PiKo-1 spirometer nSpire Health Home spirometry Asma-1 spirometer Vitalograph Home spirometry NIOX VERO Aerocrine FeNO testing BF-260 video bronchoscope Olympus Bronchoscopy UltraNeb ultrasonic nebuliser DeVilbiss Induced sputum
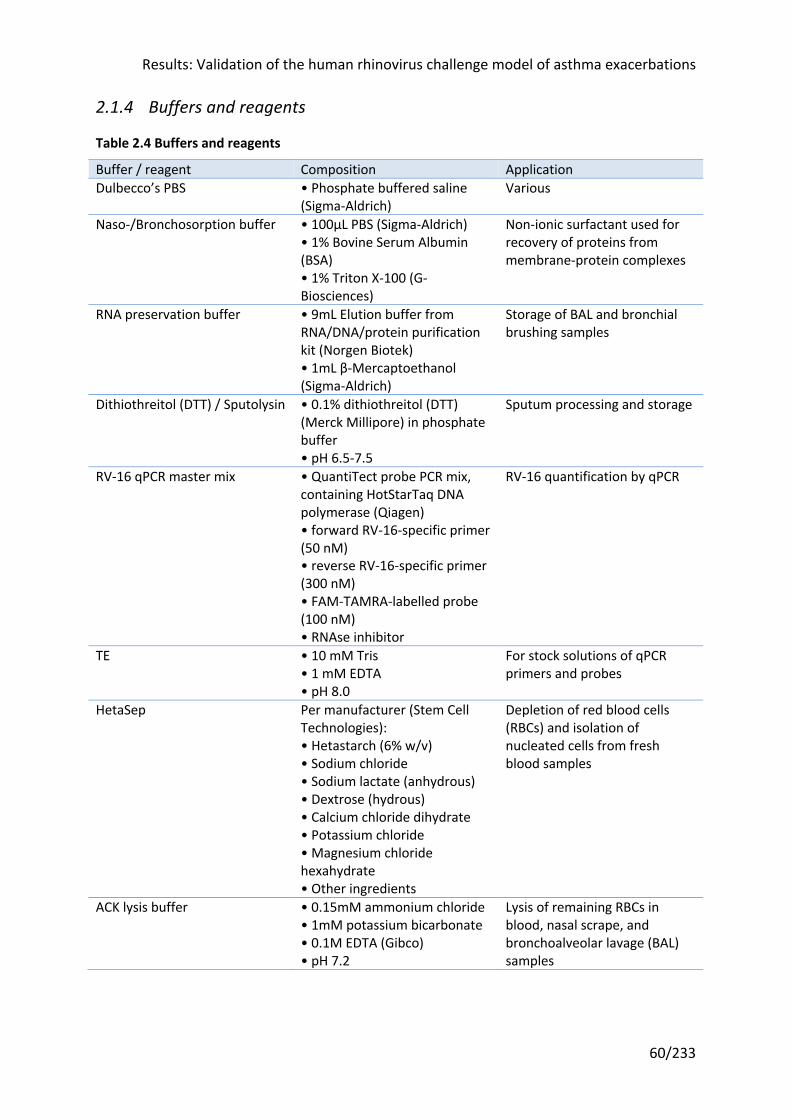
Results: Validation of the human rhinovirus challenge model of asthma exacerbations
60/233
2.1.4 Buffers and reagents
Table 2.4 Buffers and reagents
Buffer / reagent Composition Application Dulbecco’s PBS • Phosphate buffered saline
(Sigma-Aldrich) Various
Naso-/Bronchosorption buffer • 100μL PBS (Sigma-Aldrich) • 1% Bovine Serum Albumin (BSA) • 1% Triton X-100 (G-Biosciences)
Non-ionic surfactant used for recovery of proteins from membrane-protein complexes
RNA preservation buffer • 9mL Elution buffer from RNA/DNA/protein purification kit (Norgen Biotek) • 1mL β-Mercaptoethanol (Sigma-Aldrich)
Storage of BAL and bronchial brushing samples
Dithiothreitol (DTT) / Sputolysin • 0.1% dithiothreitol (DTT) (Merck Millipore) in phosphate buffer • pH 6.5-7.5
Sputum processing and storage
RV-16 qPCR master mix • QuantiTect probe PCR mix, containing HotStarTaq DNA polymerase (Qiagen) • forward RV-16-specific primer (50 nM) • reverse RV-16-specific primer (300 nM) • FAM-TAMRA-labelled probe (100 nM) • RNAse inhibitor
RV-16 quantification by qPCR
TE • 10 mM Tris • 1 mM EDTA • pH 8.0
For stock solutions of qPCR primers and probes
HetaSep Per manufacturer (Stem Cell Technologies): • Hetastarch (6% w/v) • Sodium chloride • Sodium lactate (anhydrous) • Dextrose (hydrous) • Calcium chloride dihydrate • Potassium chloride • Magnesium chloride hexahydrate • Other ingredients
Depletion of red blood cells (RBCs) and isolation of nucleated cells from fresh blood samples
ACK lysis buffer • 0.15mM ammonium chloride • 1mM potassium bicarbonate • 0.1M EDTA (Gibco) • pH 7.2
Lysis of remaining RBCs in blood, nasal scrape, and bronchoalveolar lavage (BAL) samples
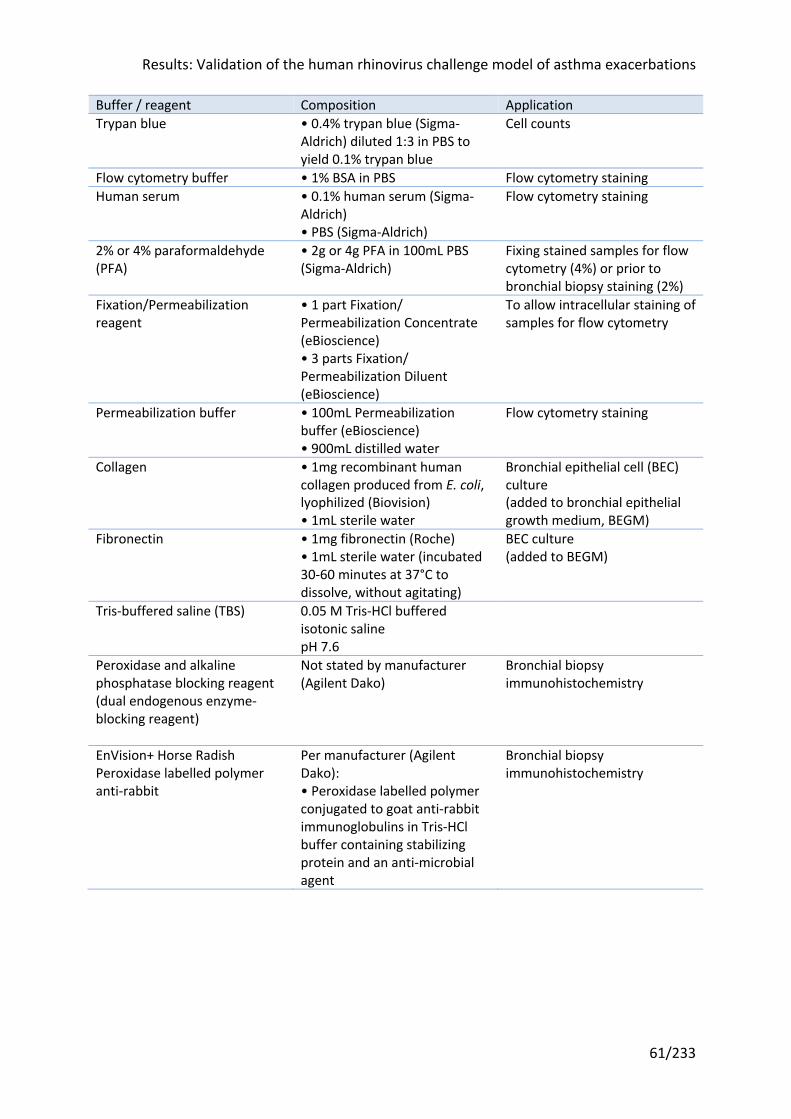
Results: Validation of the human rhinovirus challenge model of asthma exacerbations
61/233
Buffer / reagent Composition Application Trypan blue • 0.4% trypan blue (Sigma-
Aldrich) diluted 1:3 in PBS to yield 0.1% trypan blue
Cell counts
Flow cytometry buffer • 1% BSA in PBS Flow cytometry staining Human serum • 0.1% human serum (Sigma-
Aldrich) • PBS (Sigma-Aldrich)
Flow cytometry staining
2% or 4% paraformaldehyde (PFA)
• 2g or 4g PFA in 100mL PBS (Sigma-Aldrich)
Fixing stained samples for flow cytometry (4%) or prior to bronchial biopsy staining (2%)
Fixation/Permeabilization reagent
• 1 part Fixation/ Permeabilization Concentrate (eBioscience) • 3 parts Fixation/ Permeabilization Diluent (eBioscience)
To allow intracellular staining of samples for flow cytometry
Permeabilization buffer • 100mL Permeabilization buffer (eBioscience) • 900mL distilled water
Flow cytometry staining
Collagen • 1mg recombinant human collagen produced from E. coli, lyophilized (Biovision) • 1mL sterile water
Bronchial epithelial cell (BEC) culture (added to bronchial epithelial growth medium, BEGM)
Fibronectin • 1mg fibronectin (Roche) • 1mL sterile water (incubated 30-60 minutes at 37°C to dissolve, without agitating)
BEC culture (added to BEGM)
Tris-buffered saline (TBS) 0.05 M Tris-HCl buffered isotonic saline pH 7.6
Peroxidase and alkaline phosphatase blocking reagent (dual endogenous enzyme-blocking reagent)
Not stated by manufacturer (Agilent Dako)
Bronchial biopsy immunohistochemistry
EnVision+ Horse Radish Peroxidase labelled polymer anti-rabbit
Per manufacturer (Agilent Dako): • Peroxidase labelled polymer conjugated to goat anti-rabbit immunoglobulins in Tris-HCl buffer containing stabilizing protein and an anti-microbial agent
Bronchial biopsy immunohistochemistry
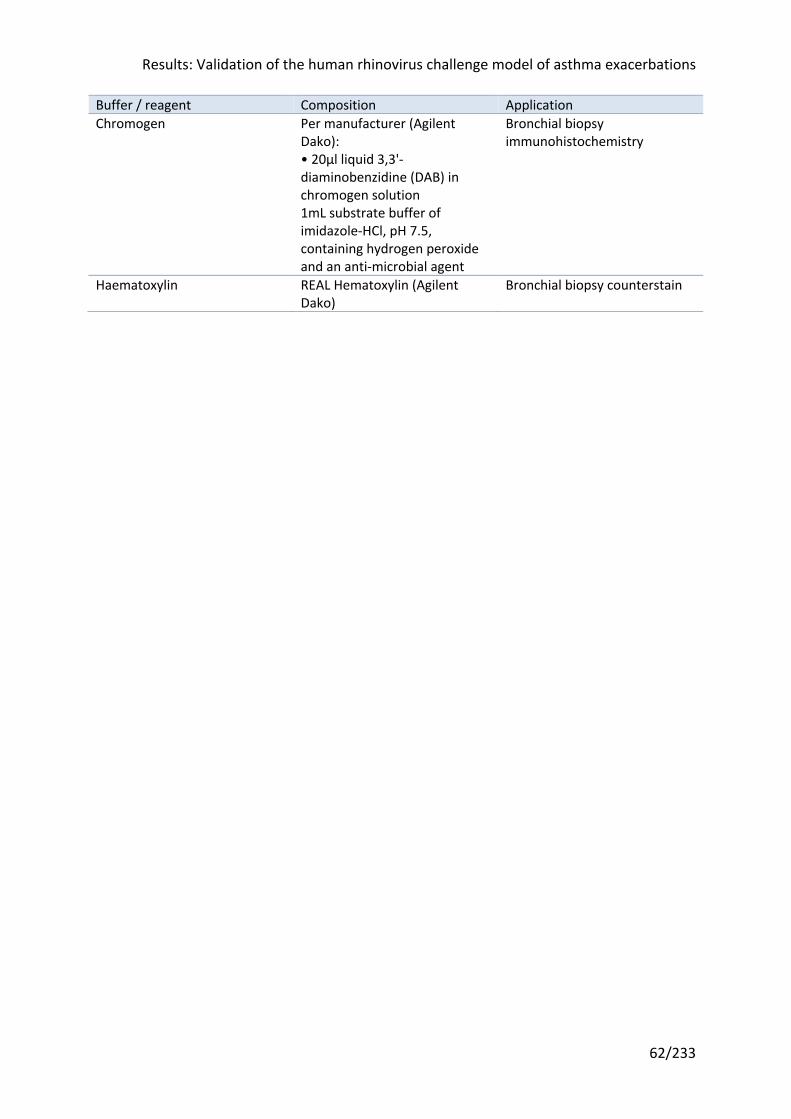
Results: Validation of the human rhinovirus challenge model of asthma exacerbations
62/233
Buffer / reagent Composition Application Chromogen Per manufacturer (Agilent
Dako): • 20µl liquid 3,3'-diaminobenzidine (DAB) in chromogen solution 1mL substrate buffer of imidazole-HCl, pH 7.5, containing hydrogen peroxide and an anti-microbial agent
Bronchial biopsy immunohistochemistry
Haematoxylin REAL Hematoxylin (Agilent Dako)
Bronchial biopsy counterstain
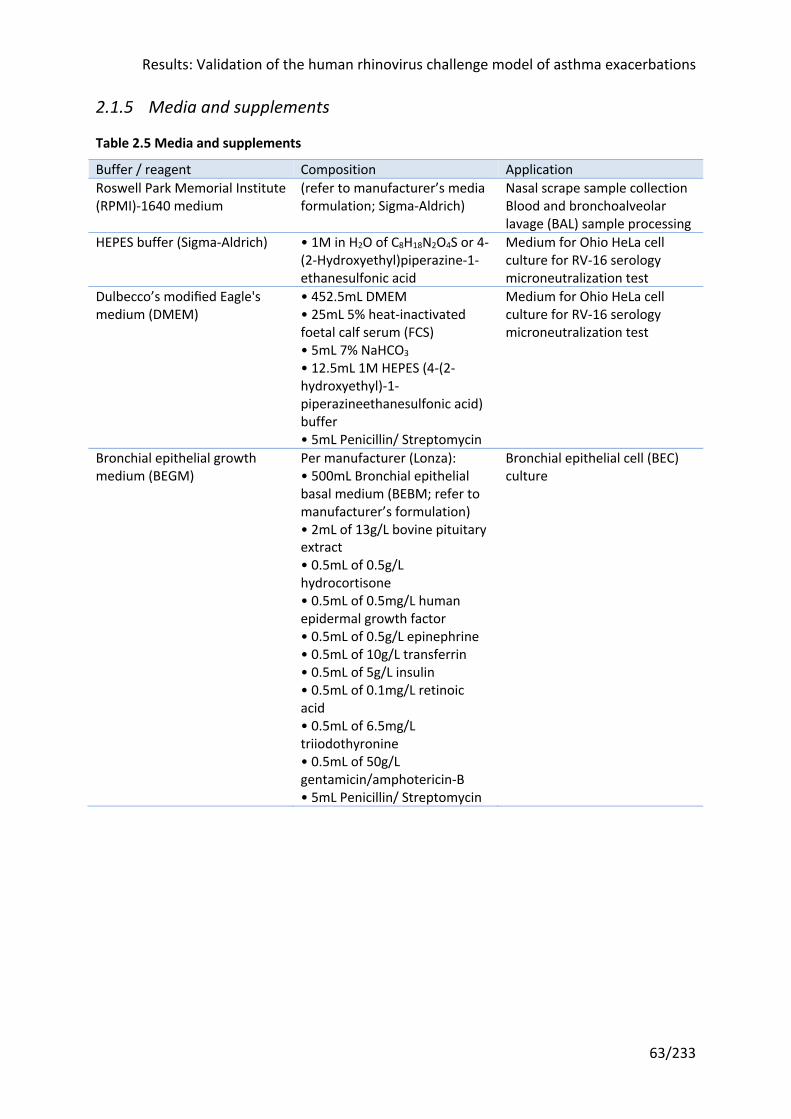
Results: Validation of the human rhinovirus challenge model of asthma exacerbations
63/233
2.1.5 Media and supplements
Table 2.5 Media and supplements
Buffer / reagent Composition Application Roswell Park Memorial Institute (RPMI)-1640 medium
(refer to manufacturer’s media formulation; Sigma-Aldrich)
Nasal scrape sample collection Blood and bronchoalveolar lavage (BAL) sample processing
HEPES buffer (Sigma-Aldrich) • 1M in H2O of C8H18N2O4S or 4-(2-Hydroxyethyl)piperazine-1-ethanesulfonic acid
Medium for Ohio HeLa cell culture for RV-16 serology microneutralization test
Dulbecco’s modified Eagle's medium (DMEM)
• 452.5mL DMEM • 25mL 5% heat-inactivated foetal calf serum (FCS) • 5mL 7% NaHCO3 • 12.5mL 1M HEPES (4-(2-hydroxyethyl)-1-piperazineethanesulfonic acid) buffer • 5mL Penicillin/ Streptomycin
Medium for Ohio HeLa cell culture for RV-16 serology microneutralization test
Bronchial epithelial growth medium (BEGM)
Per manufacturer (Lonza): • 500mL Bronchial epithelial basal medium (BEBM; refer to manufacturer’s formulation) • 2mL of 13g/L bovine pituitary extract • 0.5mL of 0.5g/L hydrocortisone • 0.5mL of 0.5mg/L human epidermal growth factor • 0.5mL of 0.5g/L epinephrine • 0.5mL of 10g/L transferrin • 0.5mL of 5g/L insulin • 0.5mL of 0.1mg/L retinoic acid • 0.5mL of 6.5mg/L triiodothyronine • 0.5mL of 50g/L gentamicin/amphotericin-B • 5mL Penicillin/ Streptomycin
Bronchial epithelial cell (BEC) culture
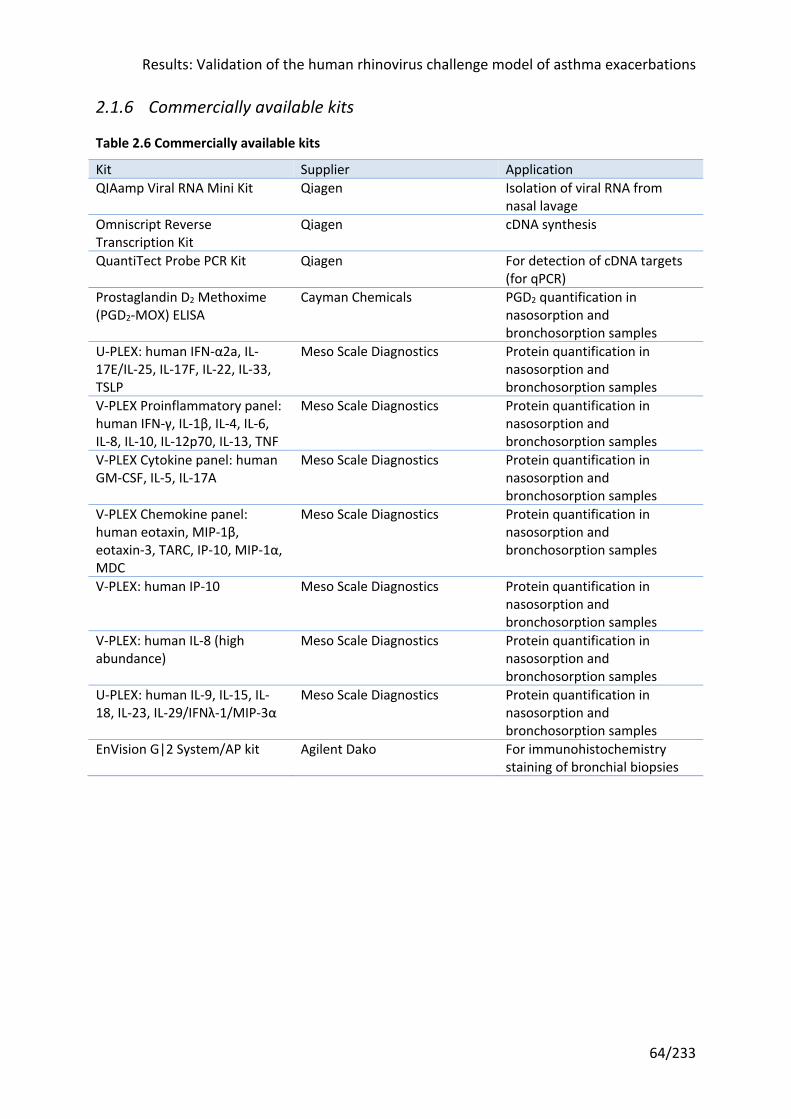
Results: Validation of the human rhinovirus challenge model of asthma exacerbations
64/233
2.1.6 Commercially available kits
Table 2.6 Commercially available kits
Kit Supplier Application QIAamp Viral RNA Mini Kit Qiagen Isolation of viral RNA from
nasal lavage Omniscript Reverse Transcription Kit
Qiagen cDNA synthesis
QuantiTect Probe PCR Kit Qiagen For detection of cDNA targets (for qPCR)
Prostaglandin D2 Methoxime (PGD2-MOX) ELISA
Cayman Chemicals PGD2 quantification in nasosorption and bronchosorption samples
U-PLEX: human IFN-α2a, IL-17E/IL-25, IL-17F, IL-22, IL-33, TSLP
Meso Scale Diagnostics Protein quantification in nasosorption and bronchosorption samples
V-PLEX Proinflammatory panel: human IFN-γ, IL-1β, IL-4, IL-6, IL-8, IL-10, IL-12p70, IL-13, TNF
Meso Scale Diagnostics Protein quantification in nasosorption and bronchosorption samples
V-PLEX Cytokine panel: human GM-CSF, IL-5, IL-17A
Meso Scale Diagnostics Protein quantification in nasosorption and bronchosorption samples
V-PLEX Chemokine panel: human eotaxin, MIP-1β, eotaxin-3, TARC, IP-10, MIP-1α, MDC
Meso Scale Diagnostics Protein quantification in nasosorption and bronchosorption samples
V-PLEX: human IP-10 Meso Scale Diagnostics Protein quantification in nasosorption and bronchosorption samples
V-PLEX: human IL-8 (high abundance)
Meso Scale Diagnostics Protein quantification in nasosorption and bronchosorption samples
U-PLEX: human IL-9, IL-15, IL-18, IL-23, IL-29/IFNλ-1/MIP-3α
Meso Scale Diagnostics Protein quantification in nasosorption and bronchosorption samples
EnVision G|2 System/AP kit Agilent Dako For immunohistochemistry staining of bronchial biopsies
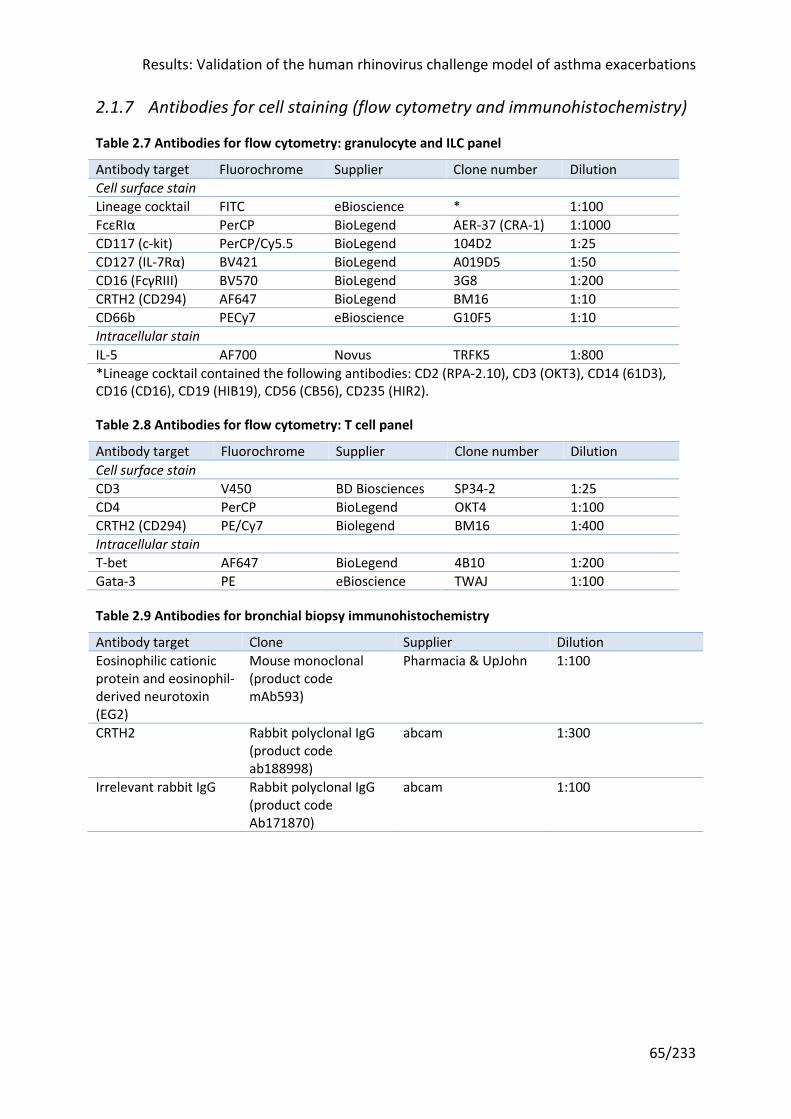
Results: Validation of the human rhinovirus challenge model of asthma exacerbations
65/233
2.1.7 Antibodies for cell staining (flow cytometry and immunohistochemistry)
Table 2.7 Antibodies for flow cytometry: granulocyte and ILC panel
Antibody target Fluorochrome Supplier Clone number Dilution Cell surface stain Lineage cocktail FITC eBioscience * 1:100 FcεRIα PerCP BioLegend AER-37 (CRA-1) 1:1000 CD117 (c-kit) PerCP/Cy5.5 BioLegend 104D2 1:25 CD127 (IL-7Rα) BV421 BioLegend A019D5 1:50 CD16 (FcγRIII) BV570 BioLegend 3G8 1:200 CRTH2 (CD294) AF647 BioLegend BM16 1:10 CD66b PECy7 eBioscience G10F5 1:10 Intracellular stain IL-5 AF700 Novus TRFK5 1:800 *Lineage cocktail contained the following antibodies: CD2 (RPA-2.10), CD3 (OKT3), CD14 (61D3), CD16 (CD16), CD19 (HIB19), CD56 (CB56), CD235 (HIR2).
Table 2.8 Antibodies for flow cytometry: T cell panel
Antibody target Fluorochrome Supplier Clone number Dilution Cell surface stain CD3 V450 BD Biosciences SP34-2 1:25 CD4 PerCP BioLegend OKT4 1:100 CRTH2 (CD294) PE/Cy7 Biolegend BM16 1:400 Intracellular stain T-bet AF647 BioLegend 4B10 1:200 Gata-3 PE eBioscience TWAJ 1:100
Table 2.9 Antibodies for bronchial biopsy immunohistochemistry
Antibody target Clone Supplier Dilution Eosinophilic cationic protein and eosinophil-derived neurotoxin (EG2)
Mouse monoclonal (product code mAb593)
Pharmacia & UpJohn 1:100
CRTH2 Rabbit polyclonal IgG (product code ab188998)
abcam 1:300
Irrelevant rabbit IgG Rabbit polyclonal IgG (product code Ab171870)
abcam 1:100
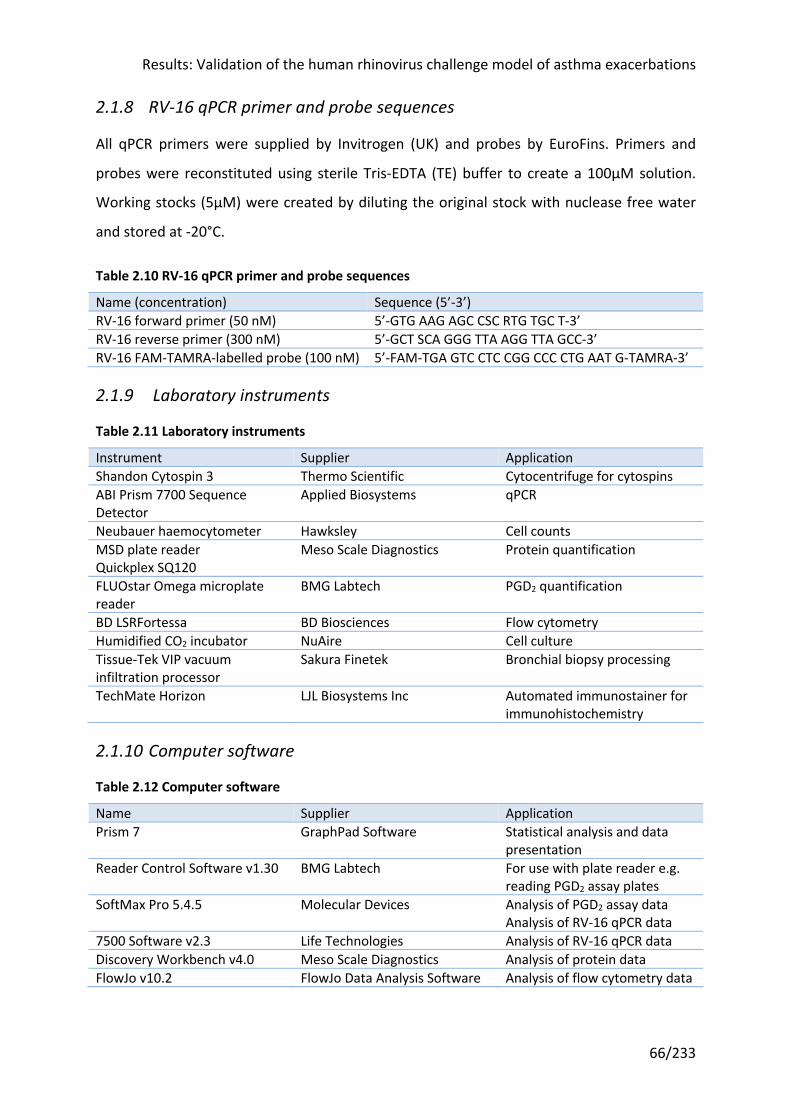
Results: Validation of the human rhinovirus challenge model of asthma exacerbations
66/233
2.1.8 RV-16 qPCR primer and probe sequences
All qPCR primers were supplied by Invitrogen (UK) and probes by EuroFins. Primers and
probes were reconstituted using sterile Tris-EDTA (TE) buffer to create a 100μM solution.
Working stocks (5μM) were created by diluting the original stock with nuclease free water
and stored at -20°C.
Table 2.10 RV-16 qPCR primer and probe sequences
Name (concentration) Sequence (5’-3’) RV-16 forward primer (50 nM) 5’-GTG AAG AGC CSC RTG TGC T-3’ RV-16 reverse primer (300 nM) 5’-GCT SCA GGG TTA AGG TTA GCC-3’ RV-16 FAM-TAMRA-labelled probe (100 nM) 5’-FAM-TGA GTC CTC CGG CCC CTG AAT G-TAMRA-3’
2.1.9 Laboratory instruments
Table 2.11 Laboratory instruments
Instrument Supplier Application Shandon Cytospin 3 Thermo Scientific Cytocentrifuge for cytospins ABI Prism 7700 Sequence Detector
Applied Biosystems qPCR
Neubauer haemocytometer Hawksley Cell counts MSD plate reader Quickplex SQ120
Meso Scale Diagnostics Protein quantification
FLUOstar Omega microplate reader
BMG Labtech PGD2 quantification
BD LSRFortessa BD Biosciences Flow cytometry Humidified CO2 incubator NuAire Cell culture Tissue-Tek VIP vacuum infiltration processor
Sakura Finetek Bronchial biopsy processing
TechMate Horizon LJL Biosystems Inc Automated immunostainer for immunohistochemistry
2.1.10 Computer software
Table 2.12 Computer software
Name Supplier Application Prism 7 GraphPad Software Statistical analysis and data
presentation Reader Control Software v1.30 BMG Labtech For use with plate reader e.g.
reading PGD2 assay plates SoftMax Pro 5.4.5 Molecular Devices Analysis of PGD2 assay data
Analysis of RV-16 qPCR data 7500 Software v2.3 Life Technologies Analysis of RV-16 qPCR data Discovery Workbench v4.0 Meso Scale Diagnostics Analysis of protein data FlowJo v10.2 FlowJo Data Analysis Software Analysis of flow cytometry data
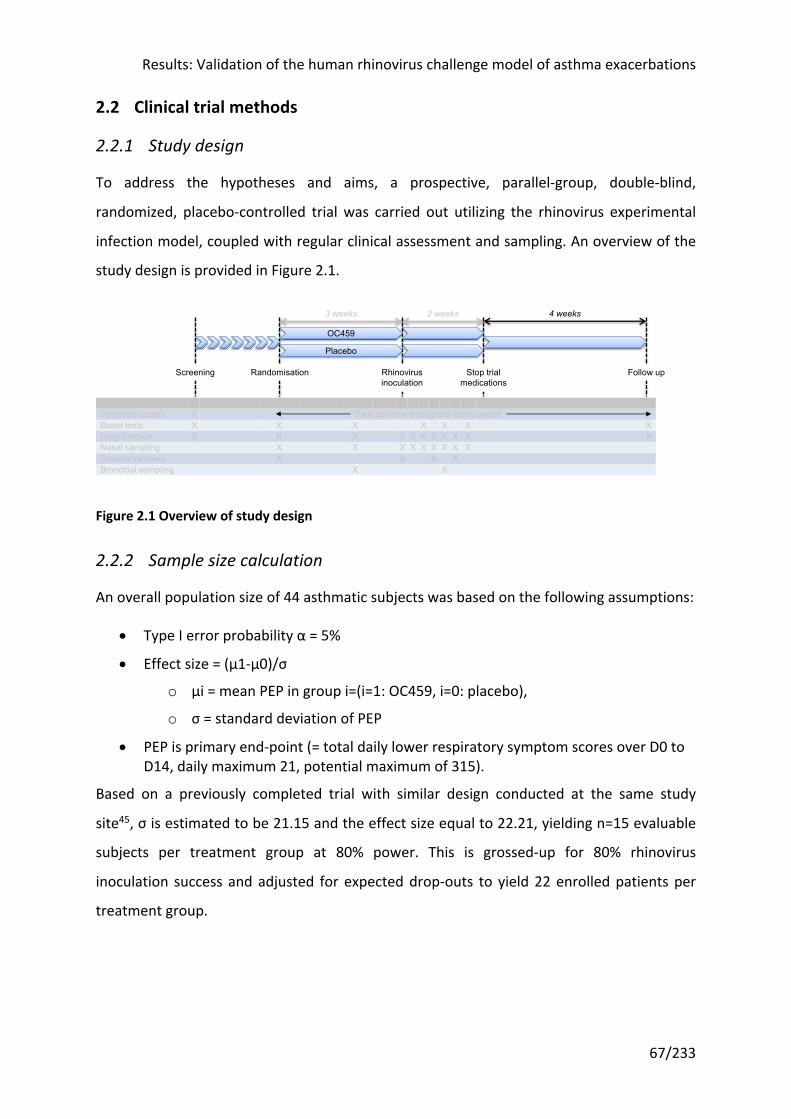
Results: Validation of the human rhinovirus challenge model of asthma exacerbations
67/233
2.2 Clinical trial methods
2.2.1 Study design
To address the hypotheses and aims, a prospective, parallel-group, double-blind,
randomized, placebo-controlled trial was carried out utilizing the rhinovirus experimental
infection model, coupled with regular clinical assessment and sampling. An overview of the
study design is provided in Figure 2.1.
Figure 2.1 Overview of study design
2.2.2 Sample size calculation
An overall population size of 44 asthmatic subjects was based on the following assumptions:
• Type I error probability α = 5%
• Effect size = (μ1-μ0)/σ
o μi = mean PEP in group i=(i=1: OC459, i=0: placebo),
o σ = standard deviation of PEP
• PEP is primary end-point (= total daily lower respiratory symptom scores over D0 to D14, daily maximum 21, potential maximum of 315).
Based on a previously completed trial with similar design conducted at the same study
site45, σ is estimated to be 21.15 and the effect size equal to 22.21, yielding n=15 evaluable
subjects per treatment group at 80% power. This is grossed-up for 80% rhinovirus
inoculation success and adjusted for expected drop-outs to yield 22 enrolled patients per
treatment group.
Day - -21 -9/-8 0 2 3 4 5 7 10 42Symptom scores X Daily at home throughout study periodBlood tests X X X X X X XLung function X X X X X X X X X X XNasal sampling X X X X X X X X XSputum samples X X X XBronchial sampling X X
3 weeks 2 weeks
Screening Randomisation Rhinovirusinoculation
Stop trialmedications
Follow up
4 weeks
OC459
Placebo
Results: Validation of the human rhinovirus challenge model of asthma exacerbations
68/233
2.2.3 Regulatory permissions and consent
Ethical approval was granted by the Brighton & Sussex Research Ethics Committee (ref:
15/LO/1666) and regulatory approval by the UK’s Medicines and Healthcare products
Regulatory Agency (MHRA) (EudraCT number: 2015-002555-10). Written informed consent
was obtained from all participants prior to screening, in accordance with the Declaration of
Helsinki and Good Clinical Practice guidelines.
2.2.4 Study subjects
As discussed earlier, asthma is a heterogeneous condition. Much like anti-IL-5 therapies are
primarily effective in asthma patients with increased eosinophils, CRTH2 antagonists are
most likely to be effective in asthma patients with evidence of type 2 inflammation. In order
to identify a population most likely to respond to CRTH2 antagonism, based on the
physiological mechanism and results from previous clinical trials of CRTH2 antagonists, study
candidates were selected for:
• Atopy, based on skin prick test positivity
• Ongoing symptoms, evidenced by an ACQ score of >0.75
In addition, as CRTH2 antagonist are envisioned to be an add-on therapy to ICS, subjects
were all required to be on ICS treatment. Anti-leukotrienes (e.g. montelukast) were
considered potential confounders and prospective volunteers taking these were excluded.
Oral steroid and monoclonal antibody treatments serve as markers of severe asthma and
therefore are exclusion criteria on safety grounds. Full inclusion and exclusion criteria are
shown in Table 2.13 below.
Volunteers were identified through: advertisements in local newspapers; advertisements in
materials published by the charity and patient support group Asthma UK; advertisements on
campus, websites and in clinics at participant identification centres (this included Kings
College London and University College London, who kindly included the study on research
mailings to staff and students); from volunteers to previous research projects (where
eligible and permission had been given); and via mailings to patients identified from a
search of GP surgery databases, kindly coordinated by the National Institute for Health
Research (NIHR) Clinical Research Network team. Prospective volunteers who responded to
advertisements were pre-screened over the telephone and/or email (e.g. to confirm they
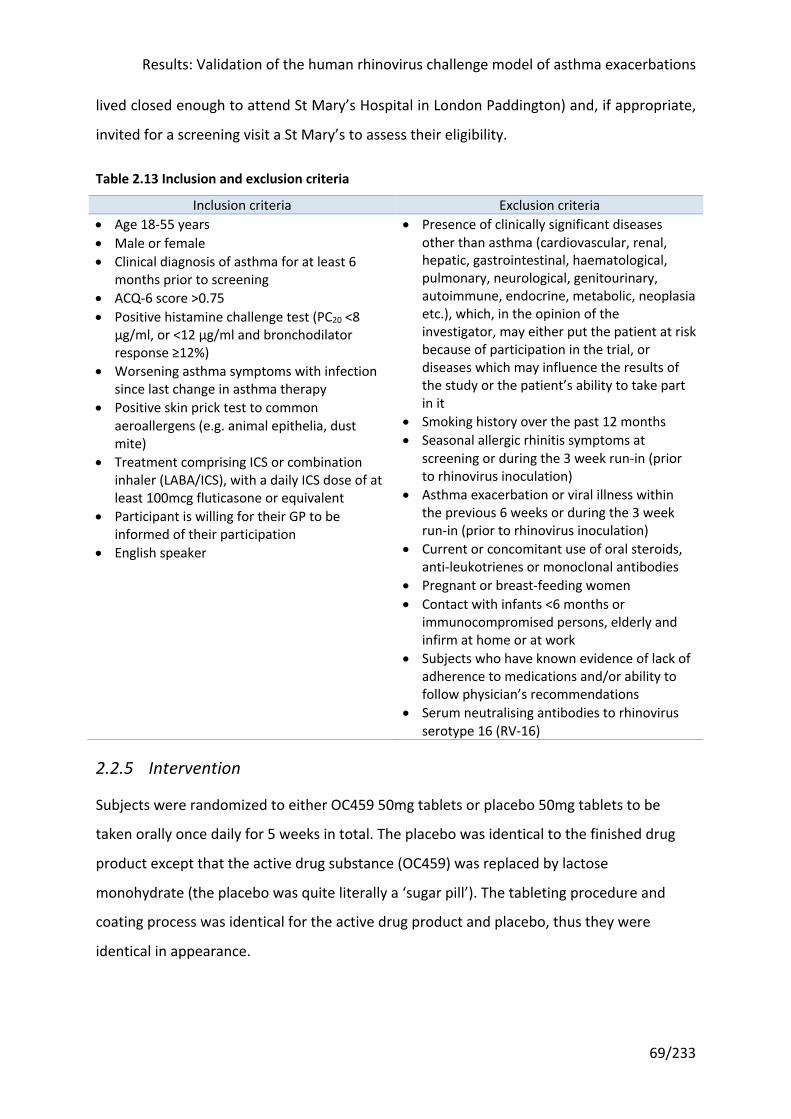
Results: Validation of the human rhinovirus challenge model of asthma exacerbations
69/233
lived closed enough to attend St Mary’s Hospital in London Paddington) and, if appropriate,
invited for a screening visit a St Mary’s to assess their eligibility.
Table 2.13 Inclusion and exclusion criteria
Inclusion criteria Exclusion criteria • Age 18-55 years • Male or female • Clinical diagnosis of asthma for at least 6
months prior to screening • ACQ-6 score >0.75 • Positive histamine challenge test (PC20 <8
µg/ml, or <12 µg/ml and bronchodilator response ≥12%)
• Worsening asthma symptoms with infection since last change in asthma therapy
• Positive skin prick test to common aeroallergens (e.g. animal epithelia, dust mite)
• Treatment comprising ICS or combination inhaler (LABA/ICS), with a daily ICS dose of at least 100mcg fluticasone or equivalent
• Participant is willing for their GP to be informed of their participation
• English speaker
• Presence of clinically significant diseases other than asthma (cardiovascular, renal, hepatic, gastrointestinal, haematological, pulmonary, neurological, genitourinary, autoimmune, endocrine, metabolic, neoplasia etc.), which, in the opinion of the investigator, may either put the patient at risk because of participation in the trial, or diseases which may influence the results of the study or the patient’s ability to take part in it
• Smoking history over the past 12 months • Seasonal allergic rhinitis symptoms at
screening or during the 3 week run-in (prior to rhinovirus inoculation)
• Asthma exacerbation or viral illness within the previous 6 weeks or during the 3 week run-in (prior to rhinovirus inoculation)
• Current or concomitant use of oral steroids, anti-leukotrienes or monoclonal antibodies
• Pregnant or breast-feeding women • Contact with infants <6 months or
immunocompromised persons, elderly and infirm at home or at work
• Subjects who have known evidence of lack of adherence to medications and/or ability to follow physician’s recommendations
• Serum neutralising antibodies to rhinovirus serotype 16 (RV-16)
2.2.5 Intervention
Subjects were randomized to either OC459 50mg tablets or placebo 50mg tablets to be
taken orally once daily for 5 weeks in total. The placebo was identical to the finished drug
product except that the active drug substance (OC459) was replaced by lactose
monohydrate (the placebo was quite literally a ‘sugar pill’). The tableting procedure and
coating process was identical for the active drug product and placebo, thus they were
identical in appearance.
Results: Validation of the human rhinovirus challenge model of asthma exacerbations
70/233
The dose was decided in conjunction with the manufacturer, Atopix Therapeutics, and
based on the results of a previous dose-ranging study179. This found that a dose of 25mg
once daily led to mean plasma concentrations between 85-102ng/mL, well in excess of the
whole-blood KB (equilibrium dissociation constant) level of 10ng/mL176. All doses brought
about statistically significant improvements in lung function, with 25mg once daily as
effective as 200mg once daily or 100mg twice daily. Reduced dose frequency is associated
with higher compliance and therefore desirable211.
The high cost of measuring plasma concentrations meant it was not possible to do so in this
study. Compliance was therefore assessed by subject self-report on diary cards and pill
counts at the end of the study (45 tablets were supplied, i.e. a surplus of 10). Self-report
measures provide similar estimates of adherence as electronic or refill measures212. A cut-
off of 80% is generally accepted to demarcate adherence from non-adherence, and has
reasonable sensitivity and specificity212, therefore this was adopted.
2.2.6 Randomization and blinding
Subjects who met the relevant criteria and provided informed consent were randomized to
either OC459 or placebo in a 1:1 ratio. Randomization occurred at a baseline visit after the
screening visit(s), and was in blocks of four in order to balance the number of subjects
allocated to each treatment group. A statistician working independently of the trial created
the randomization list, which was entered into the study database. This file was password
protected, with unblinding instructions provided by the database development team to the
investigators. The unblinded randomization list was also provided to the manufacturer,
Atopix Ltd, in order to label the active study drug/placebo appropriately prior to dispensing
to pharmacy.
At randomization, the database was interrogated and each new subject was assigned the
next sequential randomization item on the list, and pharmacy dispensed the packets with
the corresponding number. Thus the investigators, pharmacy and subjects were all blinded.
2.2.7 Virus inoculation
A dose of 100 TCID50 (50% tissue culture infective dose) rhinovirus serotype 16 (RV-16) was
diluted in 250µL of 0.9% saline and introduced into both nostrils using an atomizer (no. 286,
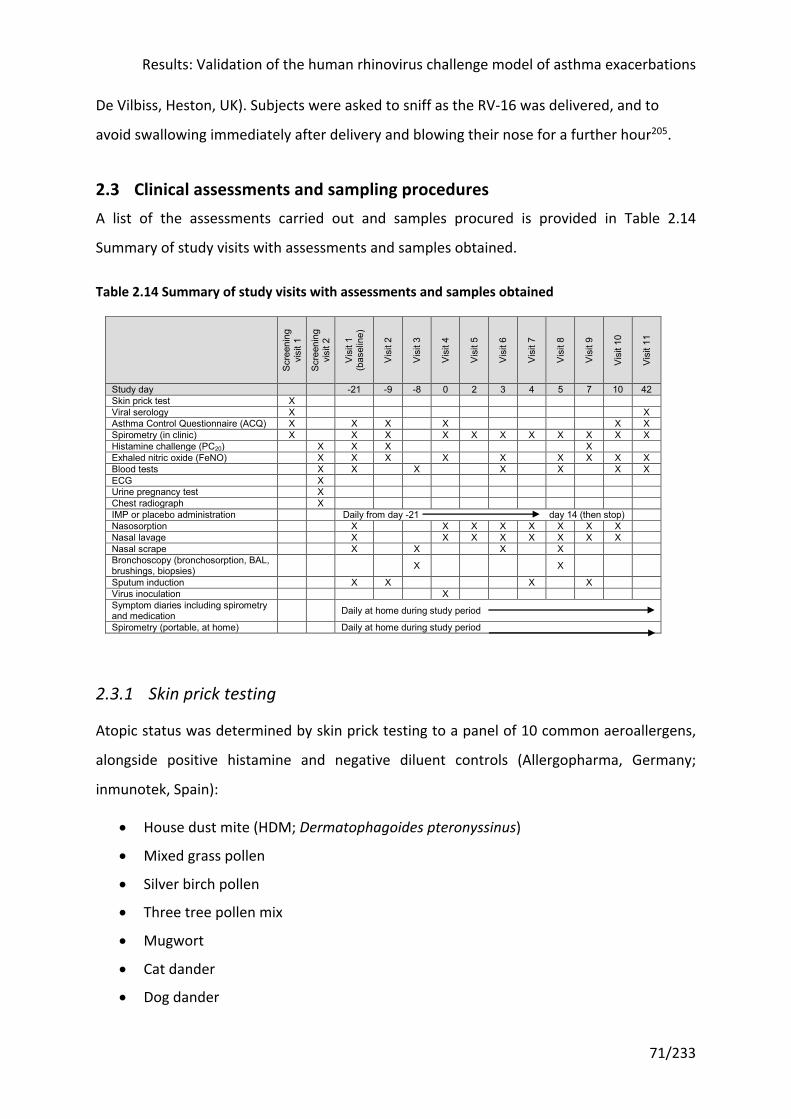
Results: Validation of the human rhinovirus challenge model of asthma exacerbations
71/233
De Vilbiss, Heston, UK). Subjects were asked to sniff as the RV-16 was delivered, and to
avoid swallowing immediately after delivery and blowing their nose for a further hour205.
2.3 Clinical assessments and sampling procedures A list of the assessments carried out and samples procured is provided in Table 2.14
Summary of study visits with assessments and samples obtained.
Table 2.14 Summary of study visits with assessments and samples obtained
2.3.1 Skin prick testing
Atopic status was determined by skin prick testing to a panel of 10 common aeroallergens,
alongside positive histamine and negative diluent controls (Allergopharma, Germany;
inmunotek, Spain):
• House dust mite (HDM; Dermatophagoides pteronyssinus)
• Mixed grass pollen
• Silver birch pollen
• Three tree pollen mix
• Mugwort
• Cat dander
• Dog dander
Scre
enin
g vi
sit 1
Scre
enin
g vi
sit 2
Visi
t 1
(bas
elin
e)
Visi
t 2
Visi
t 3
Visi
t 4
Visi
t 5
Visi
t 6
Visi
t 7
Visi
t 8
Visi
t 9
Visi
t 10
Visi
t 11
Study day -21 -9 -8 0 2 3 4 5 7 10 42 Skin prick test X Viral serology X X Asthma Control Questionnaire (ACQ) X X X X X X Spirometry (in clinic) X X X X X X X X X X X Histamine challenge (PC20) X X X X Exhaled nitric oxide (FeNO) X X X X X X X X X Blood tests X X X X X X X ECG X Urine pregnancy test X Chest radiograph X IMP or placebo administration Daily from day -21 day 14 (then stop) Nasosorption X X X X X X X X Nasal lavage X X X X X X X X Nasal scrape X X X X Bronchoscopy (bronchosorption, BAL, brushings, biopsies) X X
Sputum induction X X X X Virus inoculation X Symptom diaries including spirometry and medication Daily at home during study period
Spirometry (portable, at home) Daily at home during study period
Results: Validation of the human rhinovirus challenge model of asthma exacerbations
72/233
• Aspergillus fumigatus
• Cladosporium herbarum
• Alternaria alternata
Subjects were asked to avoid anti-histamine medication for a minimum of 48 hours prior to
skin prick testing. At least one positive reaction (wheal 3mm greater than the negative
control after 10 minutes) was considered diagnostic of atopy.
2.3.2 Asthma Control Questionnaire
The ACQ is a validated tool for assessing asthma symptom control24. An abbreviated form
consisting of six questions, the ACQ-6, was used in keeping with previous studies
undertaken by our group45,167. This slightly shortened version of the ACQ has been validated
in a number of large clinical trials and correlates highly with shorter (five question) and
longer (seven question) variants of the ACQ183.
Each question asks the subject to grade their experience of an asthma symptom (e.g.
breathlessness, wheeze) over the previous seven days on a seven-point scale, with zero
points for the absence of that symptom and six for the maximum. The scores are averaged
across the questions, giving a possible range of zero to six. Standard cut-offs were used to
defined well-controlled (≤0.75), partially controlled (>0.75 and <1.5) and poorly controlled
(≥1.5) asthma183. A change of ≥0.5 points is the minimum clinically important difference i.e.
that subjects can perceive183.
2.3.3 Spirometry
Spirometry was performed using a MicroLab spirometer (CareFusion, Kent, UK) according to
joint American Thoracic Society (ATS) / European Respiratory Society (ERS) guidelines213.
The best of three tests was recorded. The same spirometer was used for all participants and
was regularly calibrated according to the manufacturer’s instructions.
Reversibility was performed at screening. Subjects were instructed not to take their inhalers
for 12 hours before the visit. Spirometry was recorded before and 10 minutes after 200μg
salbutamol was administered via a metered dose inhaler and volumatic spacer.
Home spirometry was performed on waking each morning, prior to inhaler use, using a Piko-
1 (nSpire Health, USA) or Asma-1 handheld spirometer (Vitalograph, UK). The best of three
Results: Validation of the human rhinovirus challenge model of asthma exacerbations
73/233
attempts for FEV1 and PEF were recorded in the subject’s study diary. This had the
advantage over clinic spirometry of being performed at the same time each day, with the
same temporal relationship to inhaler usage. Home spirometry is less variable, but still
highly correlated to clinic spirometry214.
There is no established minimum clinically important difference in lung function, although
one study found it to be an improvement of 230mL or 10.38% in FEV1 versus baseline186,
which is comparable to the generally accepted consensus of ≥12% and ≥200mL.
2.3.4 Bronchial provocation test
Bronchial provocation testing can be conducted with histamine, methacholine, or mannitol
challenges. It has a high negative predictive value for asthma diagnosis and therefore is a
useful test for excluding volunteers215. However it is only weakly correlated with lung
function and airway inflammation in the form of sputum eosinophils216.
This was performed according to ERS guidelines217 using histamine as the challenge agent.
Participants were given nebulized aerosols for 2 minutes, starting with the diluent (0.9%
saline), then doubling dosages of histamine from 0.03125mg/mL up to a maximum of
8mg/mL. FEV1 was recorded at 1 and 3 minutes after each nebulized dose in order to
calculate the provocative concentration of histamine causing a 20% reduction in FEV1 (PC20).
log 𝑃𝐶&' = log 𝐶) +(log 𝐶& − log 𝐶))(20 − 𝑅))
(𝑅& − 𝑅))
where 𝐶) = penultimate histamine concentration
𝐶& = final histamine concentration
𝑅) = penultimate FEV1
𝑅& = final FEV1
Strictly speaking, ICS or ICS/LABA combinations should be stopped 1-2 weeks prior to
bronchial provocation testing to minimize the potential for false negatives. For example, a
real-life study of methacholine and mannitol challenge testing in community-diagnosed
asthma patients found 30% unresponsive to both218. These patients were treated with a
mean beclomethasone equivalent dose of 1000µg and 68% additionally had a LABA.
However for the purposes of this study it was considered impractical and potentially
unethical to ask all volunteers to withhold maintenance therapy for 1-2 weeks prior to
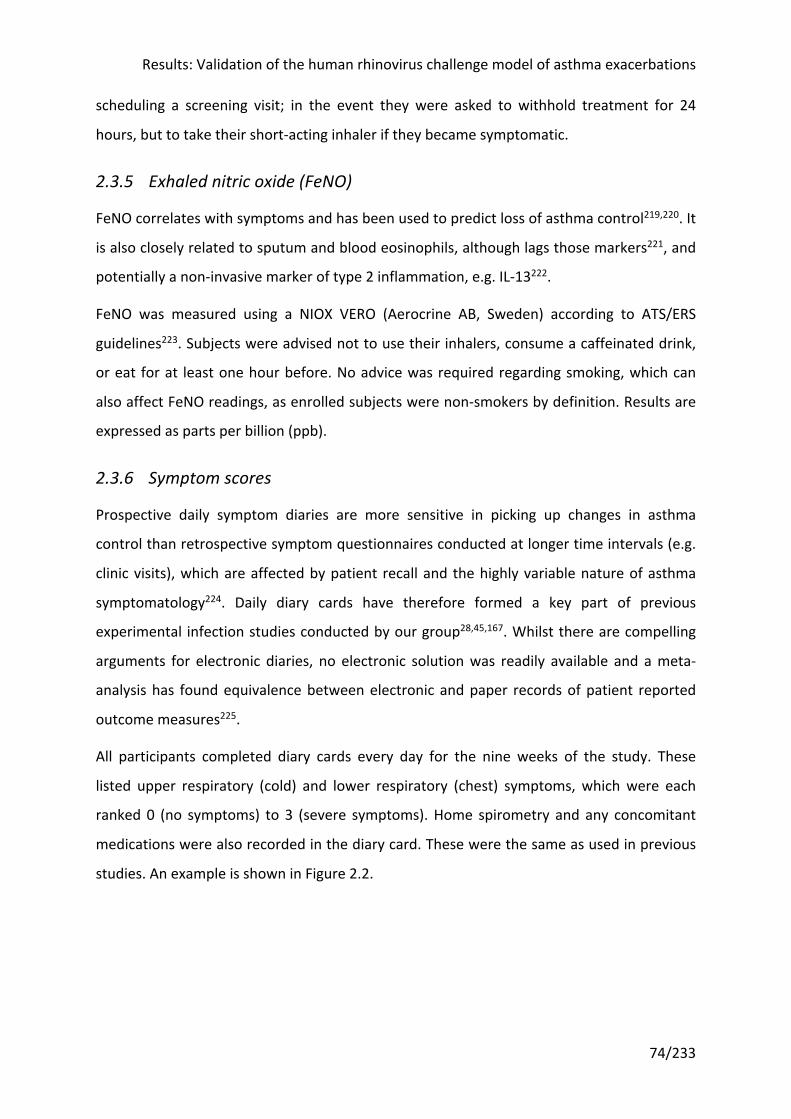
Results: Validation of the human rhinovirus challenge model of asthma exacerbations
74/233
scheduling a screening visit; in the event they were asked to withhold treatment for 24
hours, but to take their short-acting inhaler if they became symptomatic.
2.3.5 Exhaled nitric oxide (FeNO)
FeNO correlates with symptoms and has been used to predict loss of asthma control219,220. It
is also closely related to sputum and blood eosinophils, although lags those markers221, and
potentially a non-invasive marker of type 2 inflammation, e.g. IL-13222.
FeNO was measured using a NIOX VERO (Aerocrine AB, Sweden) according to ATS/ERS
guidelines223. Subjects were advised not to use their inhalers, consume a caffeinated drink,
or eat for at least one hour before. No advice was required regarding smoking, which can
also affect FeNO readings, as enrolled subjects were non-smokers by definition. Results are
expressed as parts per billion (ppb).
2.3.6 Symptom scores
Prospective daily symptom diaries are more sensitive in picking up changes in asthma
control than retrospective symptom questionnaires conducted at longer time intervals (e.g.
clinic visits), which are affected by patient recall and the highly variable nature of asthma
symptomatology224. Daily diary cards have therefore formed a key part of previous
experimental infection studies conducted by our group28,45,167. Whilst there are compelling
arguments for electronic diaries, no electronic solution was readily available and a meta-
analysis has found equivalence between electronic and paper records of patient reported
outcome measures225.
All participants completed diary cards every day for the nine weeks of the study. These
listed upper respiratory (cold) and lower respiratory (chest) symptoms, which were each
ranked 0 (no symptoms) to 3 (severe symptoms). Home spirometry and any concomitant
medications were also recorded in the diary card. These were the same as used in previous
studies. An example is shown in Figure 2.2.
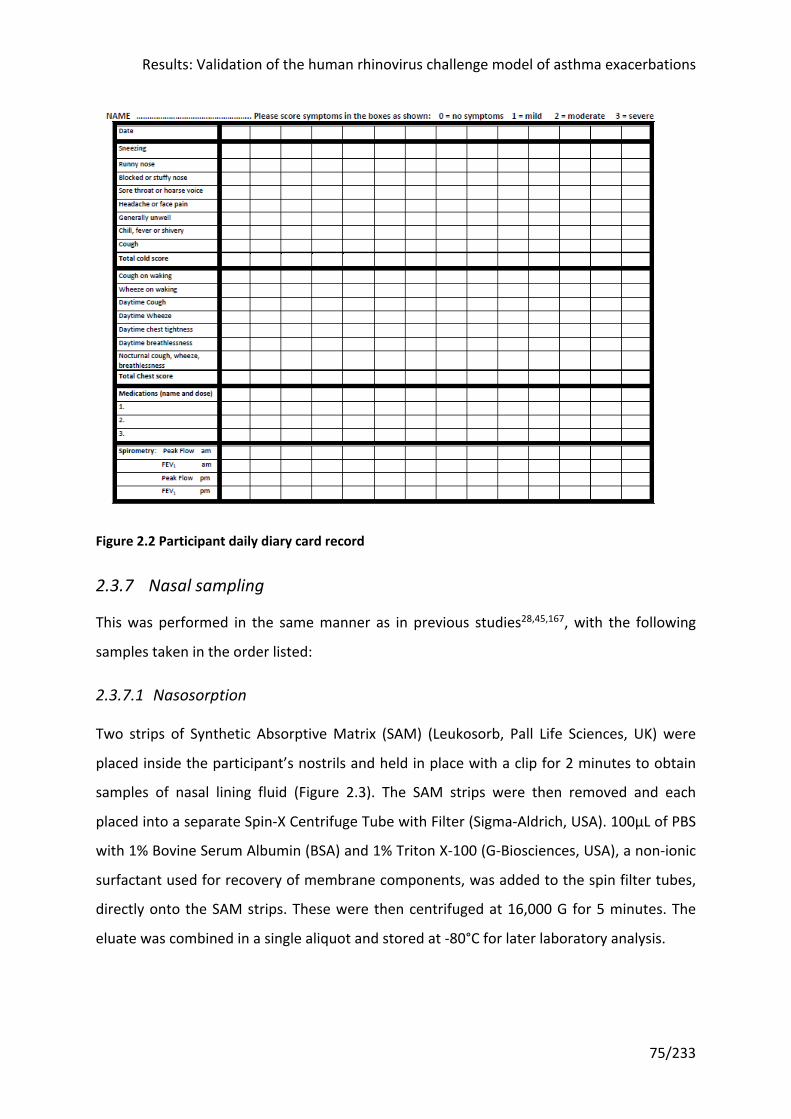
Results: Validation of the human rhinovirus challenge model of asthma exacerbations
75/233
Figure 2.2 Participant daily diary card record
2.3.7 Nasal sampling
This was performed in the same manner as in previous studies28,45,167, with the following
samples taken in the order listed:
2.3.7.1 Nasosorption
Two strips of Synthetic Absorptive Matrix (SAM) (Leukosorb, Pall Life Sciences, UK) were
placed inside the participant’s nostrils and held in place with a clip for 2 minutes to obtain
samples of nasal lining fluid (Figure 2.3). The SAM strips were then removed and each
placed into a separate Spin-X Centrifuge Tube with Filter (Sigma-Aldrich, USA). 100μL of PBS
with 1% Bovine Serum Albumin (BSA) and 1% Triton X-100 (G-Biosciences, USA), a non-ionic
surfactant used for recovery of membrane components, was added to the spin filter tubes,
directly onto the SAM strips. These were then centrifuged at 16,000 G for 5 minutes. The
eluate was combined in a single aliquot and stored at -80°C for later laboratory analysis.
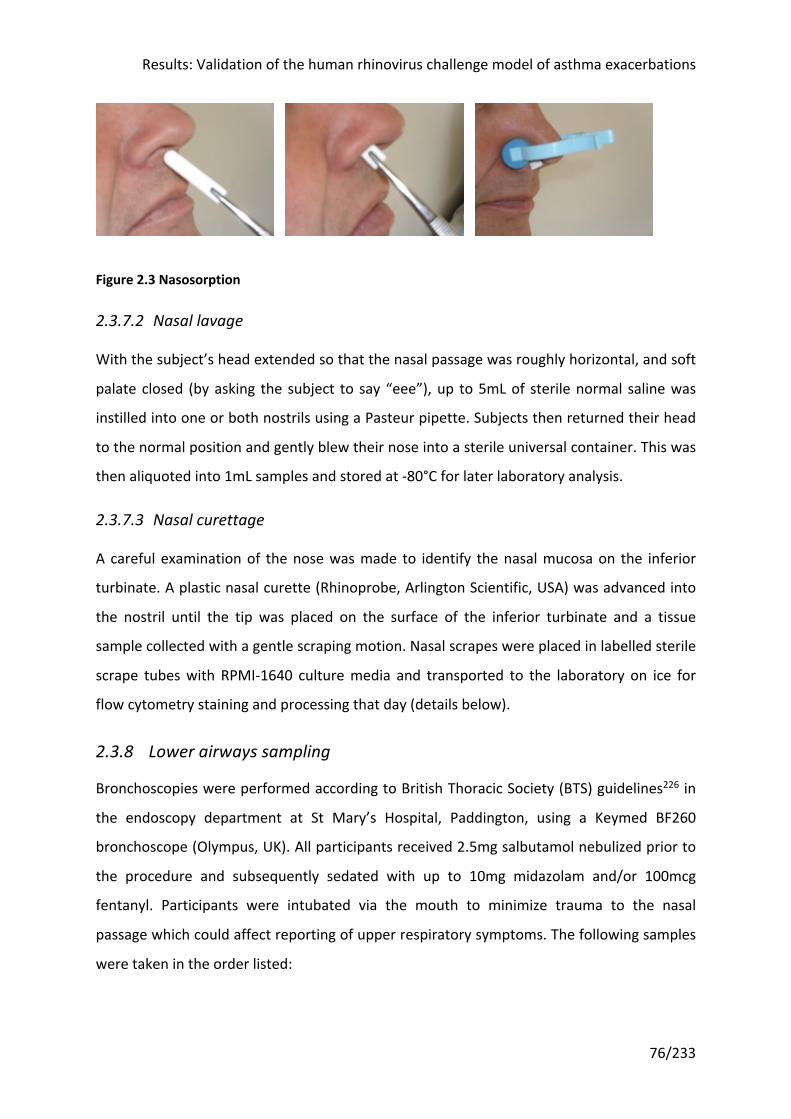
Results: Validation of the human rhinovirus challenge model of asthma exacerbations
76/233
Figure 2.3 Nasosorption
2.3.7.2 Nasal lavage
With the subject’s head extended so that the nasal passage was roughly horizontal, and soft
palate closed (by asking the subject to say “eee”), up to 5mL of sterile normal saline was
instilled into one or both nostrils using a Pasteur pipette. Subjects then returned their head
to the normal position and gently blew their nose into a sterile universal container. This was
then aliquoted into 1mL samples and stored at -80°C for later laboratory analysis.
2.3.7.3 Nasal curettage
A careful examination of the nose was made to identify the nasal mucosa on the inferior
turbinate. A plastic nasal curette (Rhinoprobe, Arlington Scientific, USA) was advanced into
the nostril until the tip was placed on the surface of the inferior turbinate and a tissue
sample collected with a gentle scraping motion. Nasal scrapes were placed in labelled sterile
scrape tubes with RPMI-1640 culture media and transported to the laboratory on ice for
flow cytometry staining and processing that day (details below).
2.3.8 Lower airways sampling
Bronchoscopies were performed according to British Thoracic Society (BTS) guidelines226 in
the endoscopy department at St Mary’s Hospital, Paddington, using a Keymed BF260
bronchoscope (Olympus, UK). All participants received 2.5mg salbutamol nebulized prior to
the procedure and subsequently sedated with up to 10mg midazolam and/or 100mcg
fentanyl. Participants were intubated via the mouth to minimize trauma to the nasal
passage which could affect reporting of upper respiratory symptoms. The following samples
were taken in the order listed:
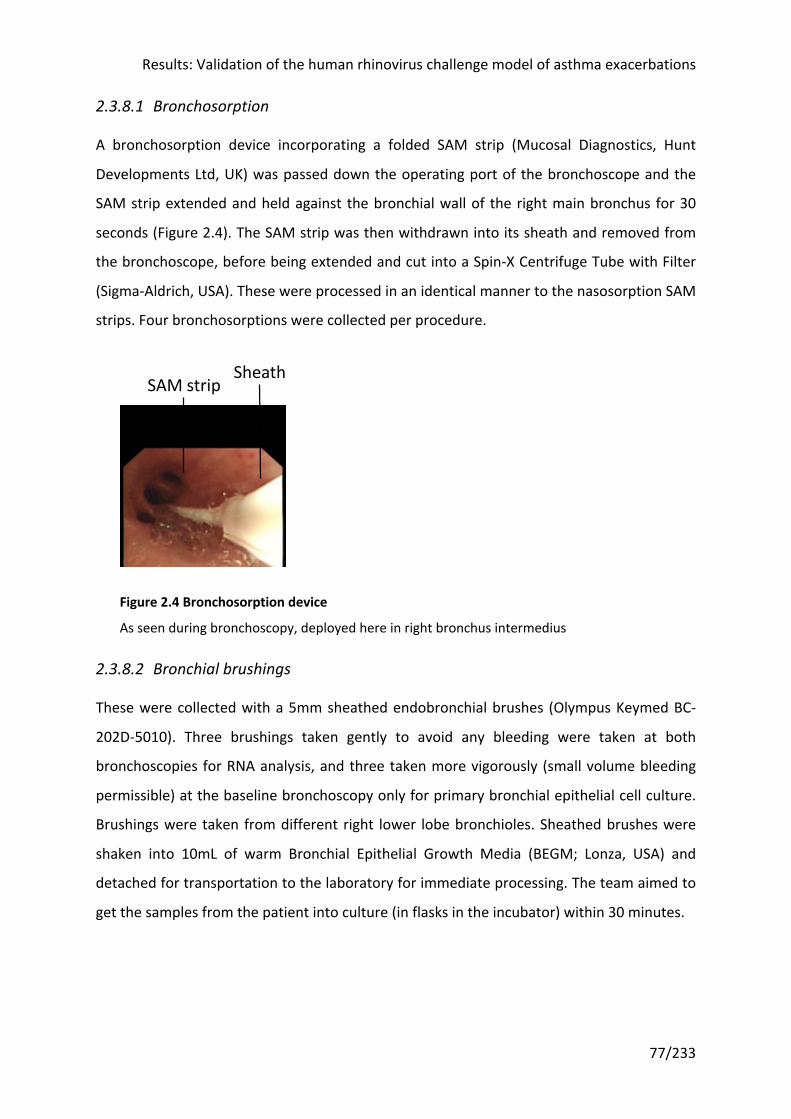
Results: Validation of the human rhinovirus challenge model of asthma exacerbations
77/233
2.3.8.1 Bronchosorption
A bronchosorption device incorporating a folded SAM strip (Mucosal Diagnostics, Hunt
Developments Ltd, UK) was passed down the operating port of the bronchoscope and the
SAM strip extended and held against the bronchial wall of the right main bronchus for 30
seconds (Figure 2.4). The SAM strip was then withdrawn into its sheath and removed from
the bronchoscope, before being extended and cut into a Spin-X Centrifuge Tube with Filter
(Sigma-Aldrich, USA). These were processed in an identical manner to the nasosorption SAM
strips. Four bronchosorptions were collected per procedure.
Figure 2.4 Bronchosorption device
As seen during bronchoscopy, deployed here in right bronchus intermedius
2.3.8.2 Bronchial brushings
These were collected with a 5mm sheathed endobronchial brushes (Olympus Keymed BC-
202D-5010). Three brushings taken gently to avoid any bleeding were taken at both
bronchoscopies for RNA analysis, and three taken more vigorously (small volume bleeding
permissible) at the baseline bronchoscopy only for primary bronchial epithelial cell culture.
Brushings were taken from different right lower lobe bronchioles. Sheathed brushes were
shaken into 10mL of warm Bronchial Epithelial Growth Media (BEGM; Lonza, USA) and
detached for transportation to the laboratory for immediate processing. The team aimed to
get the samples from the patient into culture (in flasks in the incubator) within 30 minutes.
SAM stripSheath
Results: Validation of the human rhinovirus challenge model of asthma exacerbations
78/233
2.3.8.3 Bronchial biopsies
These were obtained using fenestrated forceps (Olympus Keymed FB-211D). Four were
taken from the left lower lobe and fixed in 4% paraformaldehyde for further processing.
2.3.8.4 Bronchoalveolar lavage (BAL)
This was performed by instilling sterile normal saline in 60mL aliquots into the right middle
lobe bronchus and manually aspirating back via a syringe. The volume retrieved was
transported to the laboratory on ice, where two aliquots of 0.5mL were collected, and the
remainder processed for flow cytometry staining and analysis that day (details below). One
of the 0.5mL aliquots was stored as is, the other was pelleted and resuspended in RNA
preservation buffer (Norgen Biotek, Canada) for later RNA analysis. These were stored at -
80°C.
2.3.9 Sputum induction
This was performed according to ERS guidelines227. Participants were given a salbutamol
nebuliser before inhaling hypertonic (3%) saline for two minutes at a time using an
ultrasonic nebuliser (UltraNeb, DeVilbiss, UK), up to a maximum of three times, whilst being
encouraged to cough throughout the procedure into a universal container. FEV1 was
checked before sputum induction and after each saline nebuliser. If at any time the subject’s
FEV1 dropped by 20% or if they experienced excessive symptoms, the induction was stopped
immediately and rescue therapy given.
The sputum was transferred to the laboratory on ice and processed immediately. Solid
material was separated from saliva in a petri dish by forceps. A portion of sputum (~150μg)
was stored at -80°C without further processing for virology. 0.1% dithiothreitol (DTT) was
added to the remainder, adding four times the volume of DTT to the sample and mixing
thoroughly before pelleting. The supernatants were aliquoted and the cell pellets
resuspended in PBS, and counted using 0.1% Trypan blue. Sputum cells were diluted to
2x10⁶/mL and 100μL loaded into a spin funnel and centrifuged onto cytoslides (Shandon,
Thermo Scientific, UK) at 28xG for 5 minutes using a cytocentrifuge (Shandon Cytospin 3,
Thermo Scientific, UK). Slides were air dried overnight for future staining. The remaining
cells were stored in a lysis buffer for later RNA analysis at -80°C.
Results: Validation of the human rhinovirus challenge model of asthma exacerbations
79/233
2.3.10 Blood sampling
Venous blood was sampled from peripheral veins using a butterfly needle and vacutainer
system, at the timepoints specified in Table 2.14.
2.4 Laboratory methods
2.4.1 Viral serology
A microneutralization test was performed for neutralizing antibody to rhinovirus serotype
16 (RV-16) at screening, at day 3 after inoculation (the first time point after inoculation
when a blood sample was taken), and convalescence.
50µL doubling dilutions of sera were made from 1:2 to 1:128 and placed in a 96-well plate,
diluted in DMEM medium. 50µL diluted stock RV-16 containing 100 TCID50 was added to
each well. The plate was shaken for 1h at room temperature. 100µL of freshly stripped Ohio
HeLa cells (at a concentration of 2x10⁵ cells/mL) were added and the plates were incubated
for 48h-72h at 37°C. Six wells were reserved for positive (RV-16 and HeLa cells, without
serum) and negative (HeLa cells and serum, without RV-16) controls. Plates were examined
for cytopathic effect (CPE) after 48h; if the negative control cells were not confluent, they
were incubated for a further 24h. Antibody titre was defined as the greatest serum dilution
completely neutralizing viral CPE.
2.4.2 Quantification of virus copies
RNA was extracted from 140µL of nasal lavage samples (QIAamp Viral RNA Mini Kit; Qiagen,
UK) and reverse-transcribed with random hexamers (Omniscript Reverse Transcription Kit,
Qiagen). 23µL of RNA was extracted, of which 13µL were used to synthesize 20µL of DNA.
Quantitative polymerase chain reaction (qPCR) was performed on 1µL of cDNA to detect RV-
16. PCR mastermix was made up according to the manufacturer’s instruction (Quantitect
Probe PCR Kit, Qiagen). 11.5µL of mastermix were added to 1µL of cDNA in each well of a 96
well Taqman plate. To generate a standard curve, 10µL of RV plasmid was serially diluted
10-fold from 107 to 100 copies. Non-template controls (NTCs) were added to control for non-
specific amplification and contained 1 uL of water instead of cDNA template.
Results: Validation of the human rhinovirus challenge model of asthma exacerbations
80/233
The ABI Prism 7700 Sequence Detector (Applied Biosystems, USA) was used with AmpliTaq
Gold DNA Polymerase (Applied Biosystems), an RV-16 specific primer pair, and a FAM-
TAMRA-labelled RV-16 probe. The following thermal cycle conditions were used: 50°C
2mins, 95°C 10mins, then 45 cycles x 95°C 15s / 60°C 1 min.
Data was read using 7500 Software v2.3 (Life Technologies, USA) and exported into Excel
(Microsoft). SoftMax Pro 5.4.5 software (Molecular Devices, USA) was used to generate
standard curves and convert data to virus copies. Results were expressed as copies/mL of
nasal lavage.
A sample was considered positive when the copy number was greater than the minimum
detectable concentration (MDC), which was determined to be 2x mean + standard deviation
(SD) of the Lower Limit of Detection (LLOD).
The LLOD was calculated by taking the mean and standard error of the mean (SEM) of the Ct
value of each point of the standard (100 copies, 10 copies, 1 copy etc), for all standard
curves run during the study, and analysis of variance (ANOVA) was used to determine if the
NTC was significantly different from each point. The LLOD was therefore the lowest point on
the standard curve that was statistically different from the NTC. This was typically 10 copies.
A master standard curve from all assays run during the study was then used to input the Ct
data as unknowns to determine the actual mean copy number and SD for the LLOD across
all the assays. The MDC was defined as 2x mean + SD of the LLOD (17.86 copies).
2.4.3 Soluble mediator (protein and PGD2) quantification
Levels of soluble protein mediators were measured in the eluates from nasosorption and
bronchosorption SAM strips using ultrasensitive Meso Scale Discovery (MSD) multi-spot
human protein assays (Meso Scale Diagnostics, USA). Samples were read with the –
Quickplex SQ 120 plate reader (Meso Scale Diagnostics). The plates and mediators are set
out above.
PGD2 levels were measured with a commercial PGD2-MOX enzyme immunoassay kit
(Cayman Chemical Company, USA). Plates were read on a FLUOstar Omega plate reader
with associated software (BMG Labtech) and analysed with SoftMax Pro 5.4.5 software
(Molecular Devices).
Results: Validation of the human rhinovirus challenge model of asthma exacerbations
81/233
2.4.4 Flow cytometry
2.4.4.1 Sample preparation
Flow cytometry was performed on blood, nasal epithelium, and bronchoalveolar lavage to
enumerate cells and perform phenotypic analysis. Samples were prepared as follows:
• Blood: Nucleated cells were separated from red blood cells (RBCs) by adding HetaSep
(Stem Cell Technologies, Canada) to blood in a ratio of 1:5 and leaving to stand for 30
minutes at room temperature to sediment the RBCs. The supernatant was removed and
diluted with four times the volume of PBS before centrifuging for 10 minutes at 120xG
18°C with no brake, to pellet the nucleated cells. The supernatant containing platelets
was discarded and the pellet resuspended in ACK RBC-lysing buffer for 5 minutes (10mL
ACK for 16mL initial blood volume), before dilution with double volume PBS and re-
pelleting the cells for 5 minutes at 247xG 18°C. The resulting pellet was re-suspended in
10mL of RPMI medium.
• Nasal epithelium: Nasal epithelia were dislodged from curettes and centrifuged for 5
minutes at 400xG 4°C and the supernatant carefully removed. 1mL of flow buffer was
added and a single cell suspension formed by pipetting 30 times with a 19G needle and
1mL syringe. The syringe was subsequently rinsed with 5mL flow buffer. If the scrape
was bloody, the cells were pelleted and re-suspended in 0.5mL ACK for 1 minute, diluted
in 1mL PBS, then re-pelleted and suspended in 1mL flow buffer.
• Bronchoalveolar lavage (BAL): Prior to BAL processing, two 0.5mL aliquots of ‘raw’ BAL
were taken. One was stored at -80°C without further processing, the other pelleted, the
supernatant removed and cells resuspended in 0.35mL of RNA preservation buffer
(Norgen Biotek, Canada) prior to storing at -80°C for gene expression analysis. The
remaining BAL was then transferred to 50mL Falcon tubes and centrifuged for 8 minutes
at 215xG 4°C. The supernatant was filtered, aliquoted and frozen. The cells were
resuspended in 2mL ACK for 3 minutes, then diluted in double volume PBS and re-
pelleted. If the sample was especially bloody, the ACK step was repeated. The cells were
then resuspended in 4mL of RPMI.
Results: Validation of the human rhinovirus challenge model of asthma exacerbations
82/233
2.4.4.2 Cell counts
Cell suspensions were diluted 1:10 (blood, BAL) or 1:2 (nasal epithelium) with 0.1% Trypan
Blue (Sigma-Aldrich, UK) in PBS, then loaded onto a Neubauer haemocytometer (Hawksley,
UK) to enumerate viable cells on a light microscope (x200).
2.4.4.3 Staining for flow cytometry
Samples were stained with two panels of antibodies: one to identify ILCs and granulocytes
(Table 2.7); and a second to identify T cells (Table 2.8). For some of the BAL samples, the T
cell panel additionally included markers for identifying plasmacytoid dendritic cells (not
shown). Appropriate concentrations were established in previous studies, with titration
performed as required.
Blood and nasal cell suspensions were added to a 96-well polypropylene round bottom
plate, with individual wells containing 2x10⁶ blood cells per subject sample, all the nasal
cells per subject samples, and 1x10⁶ blood cells per well for fluorescence minus one (FMO)
controls. BAL cell suspensions were transferred to polystyrene fluorescence-activated cell
sorting (FACS) tubes (BD Falcon), with 4x10⁶ cells per subject sample, and 1x10⁶ cells for
FMOs when there were sufficient BAL cells after pooling the samples taken that day.
The plate containing blood and nasal samples was pelleted for 2 minutes at 438xG 4°C. BAL
samples in FACS tubes were pelleted for 8 minutes at 215xG 4°C. Supernatants were
discarded and cell pellets resuspended in 50µL (blood/nasal) or 100µL (BAL) 1:1000 human
serum and incubated for 15 minutes at 4°C.
Antibody cocktails were made up at double concentration in FACS buffer. 50µL
(blood/nasal) or 100µL (BAL) was added to the cells and human serum. The cells were then
incubated for a further 30 minutes in the dark at 4°C. Cells were pelleted for 2 minutes at
438xG 4°C then washed with PBS (150µL for blood/nasal samples, 500µL for BAL samples)
before re-pelleting and resuspending in 100µL (blood/nasal) or 200µL (BAL) 1:1000 fixable
viability dye eFluor® 455UV (eBioscience) and incubating for 20 minutes in the dark at 4°C.
Cells which were only undergoing cell surface staining (i.e. most of those stained with the
ILC and granulocyte panel) were then washed and resuspended in 100µL 2%
paraformaldehyde and incubated for 20 minutes in the dark at room temperature, before
Results: Validation of the human rhinovirus challenge model of asthma exacerbations
83/233
being washed twice and resuspended in 150µL FACS buffer. They were kept in the dark at
4°C until acquired on a LSR Fortessa flow cytometer (BD Biosciences, UK).
Cells undergoing intracellular staining (i.e. all those on the T cell panel, and a blood sample
for each patient plus an FMO for the ILC and granulocyte panel) were permeabilized by
washing and resuspending in fixation/permeabilization concentrate (eBioscience) (100µL for
blood samples, 200µL for BAL samples) and incubated for 30 minutes in the dark at 4°C.
They were then pelleted, washed in permeabilization buffer (150µL for blood samples,
500µL for BAL samples) and resuspended in intranuclear antibodies made up at single
concentration in permabilization buffer (100µL for blood samples, 200µL for BAL samples).
They were incubated for a further 30 minutes in the dark at 4°C before washing twice in
permeabilization buffer and resuspending in FACS buffer. They were kept in the dark at 4°C
until acquired on a LSR Fortessa flow cytometer.
2.4.4.4 Flow cytometry
Photomultiplier tube (PMT) voltages were optimized at the outset to reduce spectral
overlap and increase precision. The same voltages were used for acquisition of samples at
every time point.
Compensation controls were performed each time before cells were acquired using anti-
mouse and anti-rat compensation beads (BD Biosciences, UK). Blood cells that were heated
to 80°C for 10 minutes were mixed with live cells and used as the live/dead compensation
control.
Samples were acquired on an LSR Fortessa flow cytometer equipped with 20mW 355nm,
50mW 405nm, 50mW 488nm, 50mW 561nm, 20mW 633nm lasers and an ND1.0 filter in
front of the forward scatter photodiode.
2.4.4.5 Analysis of flow cytometry data
Flow cytometry data was analysed in FlowJo v10.1r5 for Windows (Treestar Inc, USA).
Biexponential scaling was used as it enables the display of a large range of values (unlike
linear scaling) including negative values (unlike logarithmic scaling).
As cells pass through the laser beams in a flow cytometer, the light refracts and is scattered
at all angles. This is picked up by detectors, which measure the light intensity in the forward
Results: Validation of the human rhinovirus challenge model of asthma exacerbations
84/233
direction (forward scatter, FSC), which approximates to cell size, and also at large angles
(side scatter, SSC), which is proportional to the internal complexity of the cell, for each
fluorescence channel. Each cell passing through will generate a voltage pulse that is
translated into three pieces of data: the height (H) or peak of the voltage pulse; the width
(W) of the pulse, which is how long the cell takes the pass through the cytometer and
therefore correlates with cell size; and ‘area’ (A), which is calculated as the area under the
curve when the height is plotted against the width.
Doublets tend to line themselves up with the direction of flow, and so while they generate a
voltage pulse with the same peak intensity as single cells, they will have roughly double the
width and a far greater area. Plotting height versus width or area therefore allows for
discrimination of doublets (and clumps of more than two cells), which appear as having a
larger area relative to height. A strategy of excluding doublets on plots of height versus area
on forward and side scatter sequentially was adopted.
Dead cells and debris were then excluded using the fixable viability dye (plotted against
forward scatter area). The gating strategies shown in Figure 3.16, Figure 3.17 and Figure
3.18 were then adopted to identify the following cell populations, defined by the cell
surface markers as shown:
• Eosinophils: CD66b+ CD16-
• Neutrophils: CD66b+ CD16+
• Basophils: Lineage- FcεRIα+ CRTH2+ CD117-
• Mast cells: Lineage- FcεRIα+ CRTH2- CD117+
• ILC1s: FSC-Alo SSC-Alo Lineage- FcεRIα- CD127+ CRTH2- CD117-
• ILC2s: FSC-Alo SSC-Alo Lineage- FcεRIα- CD127+ CRTH2+
• ILC3s: FSC-Alo SSC-Alo Lineage- FcεRIα- CD127+ CRTH2- CD117+
• Th2 cells: FSC-Alo SSC-Alo CD3+ CD4+ and either CRTH2+ or GATA3+
Results: Validation of the human rhinovirus challenge model of asthma exacerbations
85/233
2.4.5 Ex vivo infection studies in bronchial epithelial cells
2.4.5.1 Culture of primary bronchial epithelial cells from bronchial brushings
Primary bronchial epithelial cells (BECs) were cultured from bronchial brushings obtained at
the pre-infection bronchoscopy. 25cm2 flasks (Nunc) were pre-coated with 2-3mL of the
following mixture: 9mL Bronchial Epithelial Growth Media (BEGM), 1mL 1% BSA, 100μL
recombinant human like collagen, and 100μL fibronectin (pure) (Lonza, USA). They were
incubated for at least 2 hours at 37°C prior to use.
Bronchial brushes were transported from the bronchoscopy suite in 10mL of warm BEGM.
Bronchial epithelial cells were detached from the brushes by vortexing gently, with the
brushes then passed through a modified pipette tip to remove adhered cells, and the
pipette tip and brush sheath flushed with BEGM. The BEGM (containing cells) was
centrifuged at 145xG for 6 minutes to pellet the cells, which were resuspended in BEGM
using a 19G sterile needle to reduce clumping. Cells were diluted in 0.1% Trypan blue for
enumeration with a Neubauer haemocytometer. The remainder were made up to 10mL
using BEGM and placed in a pre-coated 25cm2 flask (p0). Cells were incubated at 37°C, 5%
CO2, in a humidified incubator. The medium was replaced after 2 days.
Cells were passaged once they were 80-90% confluent (usually after 1 week but with
extensive variability amongst samples). They continued to be passaged until there were a
sufficient number for the planned experiments (usually p2 after 4 weeks).
2.4.5.2 Virus culture
Rhinovirus serotypes 16 (RV-16) and 1B (RV-1B) were grown in Ohio HeLa cells as previously
described228.
2.4.5.3 Ex vivo infection experiments
Cultured human BECs were seeded onto collagen-coated 24 well plates at a concentration
of 0.8x10⁵ cells and cultured until 80% confluent. BECs were then incubated with RV-16 and
RV-1B at a multiplicity of infection of 1, with media as a control, for 1 hour at room
temperature with shaking. Supernatants and cell lysates were harvested after 6, 24 and 48
hours.
Results: Validation of the human rhinovirus challenge model of asthma exacerbations
86/233
2.4.6 Immunohistochemistry (bronchial biopsies)
2.4.6.1 Bronchial biopsy fixing and processing
Bronchial biopsies were fixed immediately in freshly prepared 4% PFA at room temperature
for at least 3 hours, before being transferred to 15% sucrose in PBS, at 4°C. Within 72 hours
the biopsies were processed into paraffin blocks using a Tissue-Tek VIP vacuum infiltration
processor (Sakura Finetek, Japan). 5µM-thick paraffin sections were cut.
2.4.6.2 EG2 immunostaining (alkaline phosphatase technique)
EG2 is the cleaved form of eosinophil cationic protein and was used as an eosinophil marker.
It was stained using mouse anti-EG2 (Pharmacia & UpJohn Ltd, UK) at a dilution of 1:100.
Stained sections were visualized using the alkaline phosphatase method229 with the EnVision
G|2 System/AP kit (Agilent Dako, USA) in an automated immunostainer (TechMate Horizon,
LJL Biosystems Inc, USA) according to the manufacturer’s instructions.
Briefly, tissue sections were brought to room temperature before being incubated with 10%
normal rabbit immunoglobulin in TBS. Sections were washed in TBS, incubated for 30
minutes with anti-EG2 monoclonal antibody diluted in TBS, washed again in TBS, then
incubated with a second layer antibody (rabbit anti-mouse Ig 1:30 in TBS). After another
wash in TBS, sections were incubated with alkaline phosphatase reagent (1:30 in TBS) for 30
minutes. After a further wash in TBS, sections were incubated in alkaline phosphatase
substrate for 20 minutes, revealing bound anti-EG2 as a red deposit. The reaction was
stopped by washing in TBS followed by water. Sections were counterstained with
haematoxylin (Agilent Dako).
2.4.6.3 CRTH2 immunostaining (peroxidase technique)
CRTH2 was identified using rabbit anti-CRTH2 (abcam, UK) at a dilution of 1:300, and the
EnVision peroxidase staining method (Agilent Dako, USA).
Briefly, sections were deparaffinized and boiled in a microwave at over 100°C for 10 minutes
in 0.01M citric acid buffer (pH 6.0) for better antigen retrieval. Endogenous peroxidases
were blocked by incubating with peroxidase-blocking solution (Agilent Dako, USA) for 5
minutes. After washing, sections were then incubated overnight at 4°C with the primary
antibody, rabbit anti-CRTH2 (abcam, UK) or, as a negative control, irrelevant rabbit IgG
Results: Validation of the human rhinovirus challenge model of asthma exacerbations
87/233
(abcam). The sections were washed again before incubating with a secondary antibody, the
EnVision peroxidase labelled polymer conjugated to goat anti-rabbit antibodies (Agilent
Dako, USA), for 30 minutes. After a further wash, the sections were incubated with DAB
chromogen (Agilent Dako) for 5-10 minutes. Slides were counterstained with haematoxylin
(Agilent Dako) to provide nuclear and morphologic detail, and mounted.
2.4.6.4 Quantification
Slides were coded to avoid observer bias, with the observer blinded to treatment, timepoint
and infection status. Epithelial and subepithelial area, excluding muscle and glands, was
quantified in mm2 using a Leitz Dialux 20 light microscope at 400X magnification (Leitz
Wetzlar, Germany), Apple Macintosh computer and Image 1.5 software (Apple, USA).
Subepithelial CRTH2+ cells and subepithelial and epithelial EG2+ eosinophils were counted by
light microscopy. Total counts were divided by total area to normalize as cells per unit area.
The data for bronchial biopsy cell counts were expressed as the number of cut cell profiles
with a nucleus visible (i.e. positive cells) per mm2 of the subepithelium and per 0.1 mm2
epithelium. Epithelial and subepithelial areas and CRTH2+ and EG2+ cell counts were
performed on two to three bronchial biopsies from each bronchoscopy to take account of
within subject variability. The within observer variability, expressed as coefficient of
variation for repeat counts of cells immunopositive for CRTH2+ and EG2+, ranged from 5% to
6%.
The immunostaining intensity for CRTH2 on bronchial epithelium was quantified using
hybrid (H)-score system230,231. CRTH2 expression was scored based on both intensity and the
proportion of positive cells. The intensity score ranged from 0 to 4, defined as: 0 = negative
compared with the background or no specific staining; 1 = barely detectable staining in the
cytoplasm; 2 = weak staining distinctly marking the epithelial cytoplasm; 3 = moderate
staining in the cytoplasm; or 4 = strong staining of cytoplasm. The proportion of positive
cells was quantified as a percentage (0-100%). The total score was calculated by multiplying
the intensity score (0-4) and percentage of positive cells in each score, to produce a total
score of 0-400 as previously reported230,231.
Results: Validation of the human rhinovirus challenge model of asthma exacerbations
88/233
2.5 Statistical analysis
2.5.1 Analysis sets
2.5.1.1 Safety analysis set
The safety analysis set includes all subjects who were randomized and received at least one
dose of study medication.
2.5.1.2 Full analysis set
The full analysis set (FAS) includes subjects who:
• Are randomized into the study (day -21)
• Have been inoculated with the RV-16 challenge virus (day 0)
• Have confirmed RV-16 infection, defined as either (i) positive RV-16 PCR in nasal
lavage at any time after inoculation (day 0) or (ii) seroconversion (positive antibodies
to RV-16 at a titre of at least 1:4 at the final study visit)
• Have completed at least 14 days post inoculation with RV-16.
These subjects are defined as ‘evaluable’ and form the basis of the power calculation.
The FAS will be used to assess the primary objective and will be used to analyse all efficacy
endpoints plus any post-infection mechanistic outcomes.
2.5.1.3 Extended analysis set
The extended analysis set expands on the FAS by including any subject who completed the
study, regardless of whether they had confirmed RV-16 infection. The set will be used to
investigate pre-infection mechanistic effects of OC459 and will also be used for any ex-vivo
analyses.
2.5.2 Statistical Methodology
2.5.2.1 Baseline demographics
Baseline demographic variables and other relevant clinical baseline characteristics were
summarized for each treatment group. Summaries of continuous variables were presented
as means and standard deviations if data was consistent with that from a normal population
Results: Validation of the human rhinovirus challenge model of asthma exacerbations
89/233
distribution, and as medians and inter-quartile ranges for data that was inconsistent.
Categorical variables were presented as frequencies and percentages.
2.5.2.2 Analysis of outcome variables
Analysis to investigate any difference in effect of OC459 and placebo for each outcome
variable was performed using the difference in values via unpaired (two-sample) t-test for
parametric data or Mann-Whitney U tests for non-parametric data. Differences were
considered significant at P < 0.05. All P values are two-sided.
Differences between timepoints within groups were investigated using 2-tailed paired t-
tests for parametric data or Wilcoxon signed rank test for non-parametric data. This was
used to analyse the effect of OC459 by comparing outcomes pre- and post-treatment in the
OC459-treated group, and the effect of RV-16 infection by comparing pre- and post-
infection in the placebo-treated group.
Potential causal relationships between outcome variables were investigated using
Spearman’s rank correlations.
One of the aims of the study was to understand what the best outcome measures would be
when using the rhinovirus challenge model to test a drug in asthma. As a result, many of the
statistical tests were considered exploratory and uncorrected for multiple comparisons.
Most of these variables are independent and have been analysed separately (rather than
aggregating many variables into a single analysis). Clearly any significant results of an
exploratory analysis must be treated with caution and will require subsequent verification.
2.5.2.3 Data handling and transformation
Viral loads below the limit of quantification were treated as zero. Viral load data was
transformed using base 10 logarithm. To account for zero values, one was added to each
viral load measurement before being transformed.
Soluble mediators which generated a detectable signal but were below the lower limit of
detection were assigned an assumed value of half the lower limit of detection; those for
which no signal was detected were assigned a value of zero. Soluble mediators which were
above the upper limit of detection were assigned an assumed value of the highest reading
of all the samples on the same assay performed at that time.
Results: Validation of the human rhinovirus challenge model of asthma exacerbations
90/233
Area under the curve (AUC) values were calculated using the linear trapezoidal method.
Missing values were extrapolated where required. Imputation and analysis involving missing
and imputed data was taken under the assumption that the data was missing-at-random.
2.5.2.4 Software
Statistical analysis and graphical output was performed using GraphPad Prism v7 (GraphPad
Software, USA).
Results: Validation of the human rhinovirus challenge model of asthma exacerbations
91/233
3 Results: Validation of the human rhinovirus challenge model of asthma exacerbations
3.1 Introduction The clinical trial of a CRTH2 antagonist was built on the premise that rhinovirus challenge in
subjects with asthma reproducibly induced features of an exacerbation. As the proposed
place for CRTH antagonists in the treatment algorithm is as an additional controller after ICS
(much like the leukotriene receptor antagonist, montelukast), the logical approach was to
study subjects already prescribed ICS. This is in contrast to the two previous (negative)
clinical trials using rhinovirus challenge in asthma that had been published at the outset of
this study, which recruited subjects with mild asthma who were ICS-naïve149,158.
At the time, only two rhinovirus challenge studies had been completed in subjects with
moderate asthma requiring ICS maintenance therapy45,138, only one of which included a
control group without asthma45. Both studies demonstrated significant increases in cold and
chest symptom scores following inoculation, peaking at a daily score of 6-8 (out of a
maximum 24) and 4-5 (out of a maximum 21) respectively, significantly higher than the
scores in the healthy controls. One found a significant decrease in lung function (in a pooled
group of ICS-treated and ICS-naïve subjects)45, which has subsequently been reproduced in a
pure population of ICS-treated asthma subjects167, albeit with a smaller reduction in a
smaller sample.
Using innovative non-dilutional techniques for sampling the airway lining fluid, Jackson et al
also showed increases in ‘type 2’ cytokines45 and, importantly for this current study,
induction of PGD2, the ligand for the CRTH2 receptor in nasal (but not bronchial) samples61.
Nitric oxide (NO) is an endothelial-derived relaxing factor that can be detected in exhaled
breath. Bronchoscopic studies isolating the lower airways show that exhaled NO (FeNO)
comes largely from the lower airways rather than the nose232. NO is synthesized by a family
of nitric oxide synthase (NOS) enzymes. Of these, inducible NOS (iNOS) is constitutively
expressed by airway epithelial cells233. As the name suggests, its expression is inducible by
various inflammatory cytokines, and inhibited by steroids233,234. At least in vitro these
include IL-13222, which may also affect iNOS expression in vivo as FeNO levels predict
Results: Validation of the human rhinovirus challenge model of asthma exacerbations
92/233
response to anti-IL-13235 and are reduced by dupilumab, which blocks IL-4 and IL-13
signalling47.
FeNO is elevated in asthma236, with levels relating to asthma control (e.g. 237) and ICS dose
and treatment compliance (e.g. 238). Its ease of measurement and relatively low cost make it
an attractive biomarker, particularly compared to bronchial provocation or sputum cell
differentials.
No previous RV challenge study has assessed whether baseline FeNO predicts outcomes,
although four have assessed changes in FeNO after infection137,145,159,166. However FeNO
levels at baseline predict response to anti-IgE239 and anti-IL-13235. If FeNO is an indicator of
IL-13 activity, and by extension type 2 pathways, it might predict response to CRTH2
antagonism and be a useful screening tool in future drug studies using the RV challenge
model.
There are elevated numbers of CRTH2+ cells in subjects with asthma, particularly where
asthma control is poor and following recent exacerbation(s)125. PGD2 leads to chemotaxis of
CRTH2+ Th2 cells and ILC2s in vitro, and lung eosinophilia in guinea pigs; these effects can be
blocked by CRTH2 antagonism56,176. However whether CRTH2+ cells are increased in the
airways during an asthma exacerbation is not known.
3.2 Hypothesis and aims The first aim was to demonstrate that the rhinovirus challenge model of human asthma
exacerbations could be successfully reproduced and extended to assess additional measures
salient to this study. Specifically, I hypothesized that human rhinovirus challenge in asthma
causes:
i. an increase in lower and upper respiratory symptoms, a decrease in lung function,
and an increase in type 2 cytokines (IL-4, IL-5, IL-13) and PGD2 in the airways
(demonstrating reproducibility of the model)
ii. an increase in FeNO
iii. an increase in CRTH2 receptor positive cells in the airways (lumen and
epithelium/subepithelium)
Results: Validation of the human rhinovirus challenge model of asthma exacerbations
93/233
3.3 Results
3.3.1 Study population
44 volunteers with asthma were enrolled and randomized into the study, of whom 38 were
inoculated with RV-16 (Figure 3.1). The remaining six were withdrawn prior to inoculation:
three incidentally contracted a respiratory viral infection from the community and one a
radiologically-confirmed pneumonia during the run-in phase prior to inoculation; another
two did not attend a key visit and were deemed too unreliable to continue, one of whom
had additionally been non-adherent with their ICS treatment resulting in a marked loss of
asthma control.
3.3.2 Confirmation of RV-16 infection
All 38 inoculated were seronegative for RV-16 at screening, defined as the absence of serum
neutralizing antibodies to RV-16 at a titre of ≥1:4. In addition none had detectable
rhinovirus by standard PCR or qPCR in nasal lavage, sputum or BAL on samples taken prior
to inoculation.
Serology was repeated at the earliest opportunity post-inoculation (blood sampling was not
scheduled for day 0, and day 3 or 5 was sufficiently early to precede the development of
antibodies relating to the experimental infection). One subject had positive rhinovirus
serology, at this stage and was excluded from further analysis.
Infection was defined as the detection of rhinovirus by standard PCR or qPCR in nasal
lavage, sputum, or BAL at any time point after inoculation, or seroconversion, i.e. converting
from an absence to a presence of serum neutralizing antibodies to RV-16 at a titre of ≥1:4 at
six weeks post-inoculation. 30 subjects met these criteria: 26 had quantifiable levels of RV-
16 in nasal lavage; one had detectable rhinovirus by standard PCR (on more than one
sample); and three seroconverted in the absence of detectable RV-16 copies. In total 23/30
had seroconverted at 6 weeks after inoculation.
One further subject had a single positive sputum sample by standard PCR seven days after
inoculation, but no other positive samples by qPCR or standard PCR including nasal samples
the same day, two days prior to, and three days after the sputum sample. As this subject did
not meet the Jackson criteria for the clinical diagnosis of a cold240 either and it was not
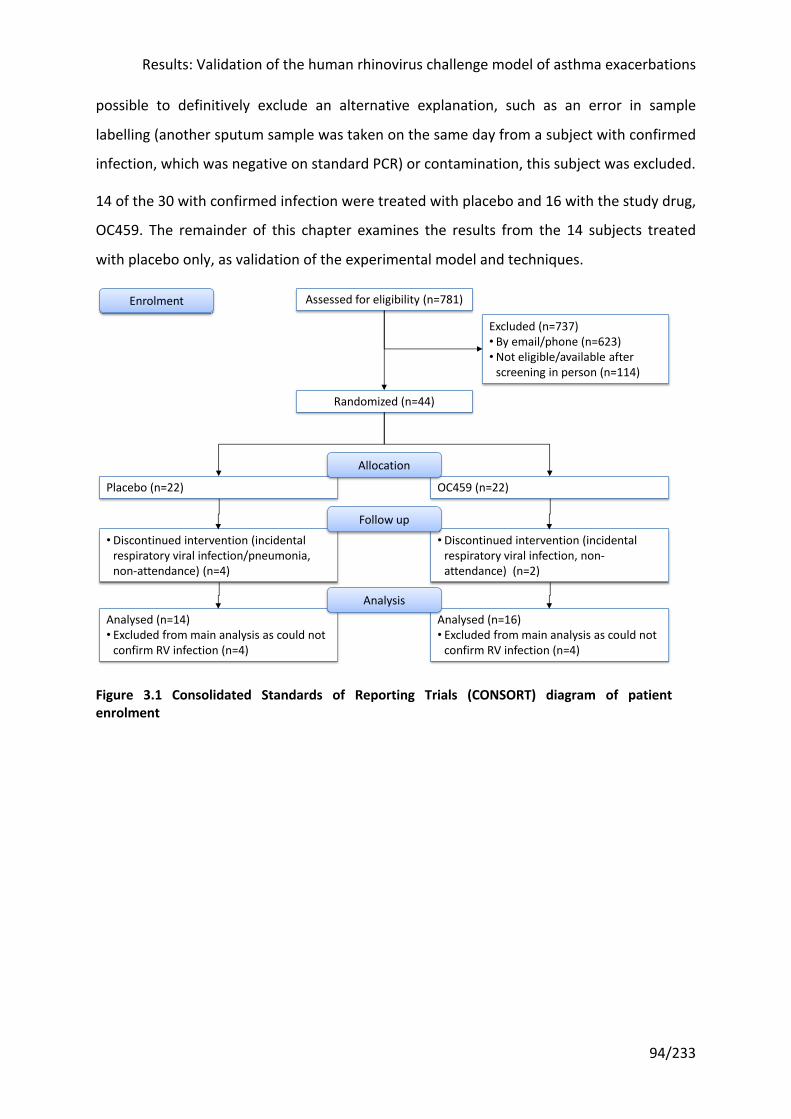
Results: Validation of the human rhinovirus challenge model of asthma exacerbations
94/233
possible to definitively exclude an alternative explanation, such as an error in sample
labelling (another sputum sample was taken on the same day from a subject with confirmed
infection, which was negative on standard PCR) or contamination, this subject was excluded.
14 of the 30 with confirmed infection were treated with placebo and 16 with the study drug,
OC459. The remainder of this chapter examines the results from the 14 subjects treated
with placebo only, as validation of the experimental model and techniques.
Figure 3.1 Consolidated Standards of Reporting Trials (CONSORT) diagram of patient enrolment
Assessed for eligibility (n=781)
Randomized (n=44)
Excluded (n=737)• By email/phone (n=623)•Not eligible/available after
screening in person (n=114)
OC459 (n=22)Placebo (n=22)
•Discontinued intervention (incidental respiratory viral infection, non-attendance) (n=2)
•Discontinued intervention (incidental respiratory viral infection/pneumonia, non-attendance) (n=4)
Analysed (n=16)• Excluded from main analysis as could not
confirm RV infection (n=4)
Analysed (n=14)• Excluded from main analysis as could not
confirm RV infection (n=4)
Enrolment
Allocation
Follow up
Analysis
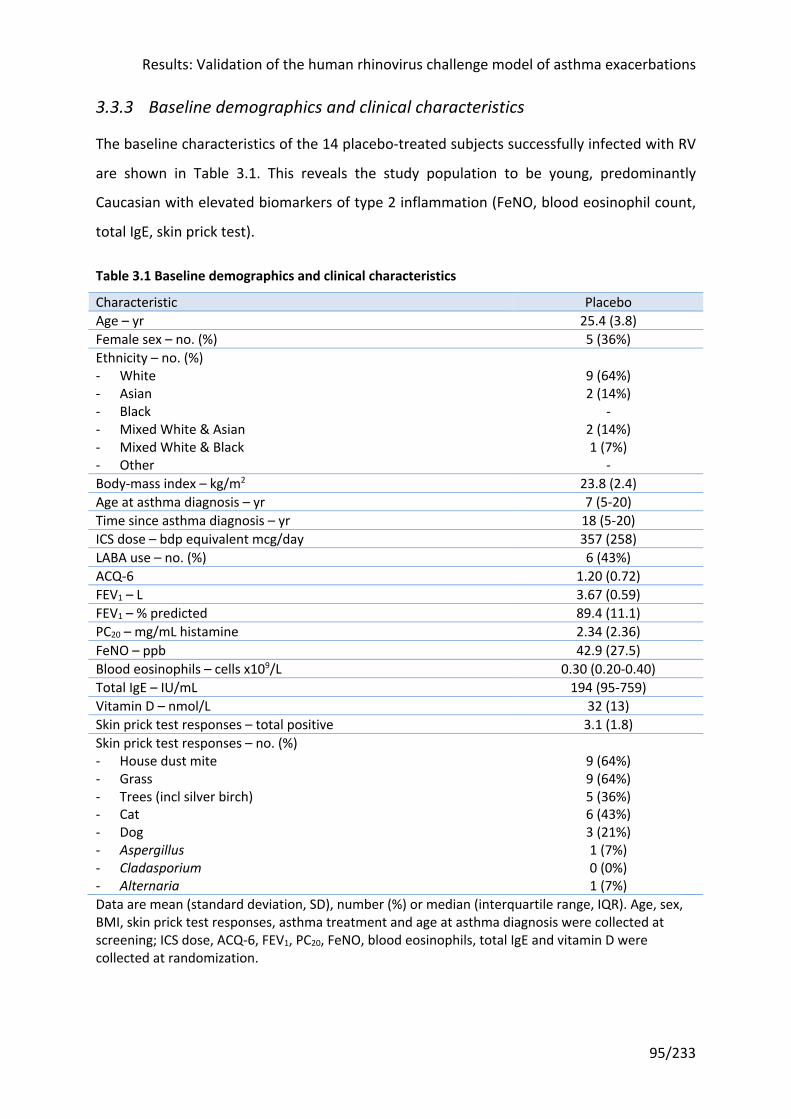
Results: Validation of the human rhinovirus challenge model of asthma exacerbations
95/233
3.3.3 Baseline demographics and clinical characteristics
The baseline characteristics of the 14 placebo-treated subjects successfully infected with RV
are shown in Table 3.1. This reveals the study population to be young, predominantly
Caucasian with elevated biomarkers of type 2 inflammation (FeNO, blood eosinophil count,
total IgE, skin prick test).
Table 3.1 Baseline demographics and clinical characteristics
Characteristic Placebo Age – yr 25.4 (3.8) Female sex – no. (%) 5 (36%) Ethnicity – no. (%) - White - Asian - Black - Mixed White & Asian - Mixed White & Black - Other
9 (64%) 2 (14%)
- 2 (14%) 1 (7%)
- Body-mass index – kg/m2 23.8 (2.4) Age at asthma diagnosis – yr 7 (5-20) Time since asthma diagnosis – yr 18 (5-20) ICS dose – bdp equivalent mcg/day 357 (258) LABA use – no. (%) 6 (43%) ACQ-6 1.20 (0.72) FEV1 – L 3.67 (0.59) FEV1 – % predicted 89.4 (11.1) PC20 – mg/mL histamine 2.34 (2.36) FeNO – ppb 42.9 (27.5) Blood eosinophils – cells x109/L 0.30 (0.20-0.40) Total IgE – IU/mL 194 (95-759) Vitamin D – nmol/L 32 (13) Skin prick test responses – total positive 3.1 (1.8) Skin prick test responses – no. (%) - House dust mite - Grass - Trees (incl silver birch) - Cat - Dog - Aspergillus - Cladasporium - Alternaria
9 (64%) 9 (64%) 5 (36%) 6 (43%) 3 (21%) 1 (7%) 0 (0%) 1 (7%)
Data are mean (standard deviation, SD), number (%) or median (interquartile range, IQR). Age, sex, BMI, skin prick test responses, asthma treatment and age at asthma diagnosis were collected at screening; ICS dose, ACQ-6, FEV1, PC20, FeNO, blood eosinophils, total IgE and vitamin D were collected at randomization.
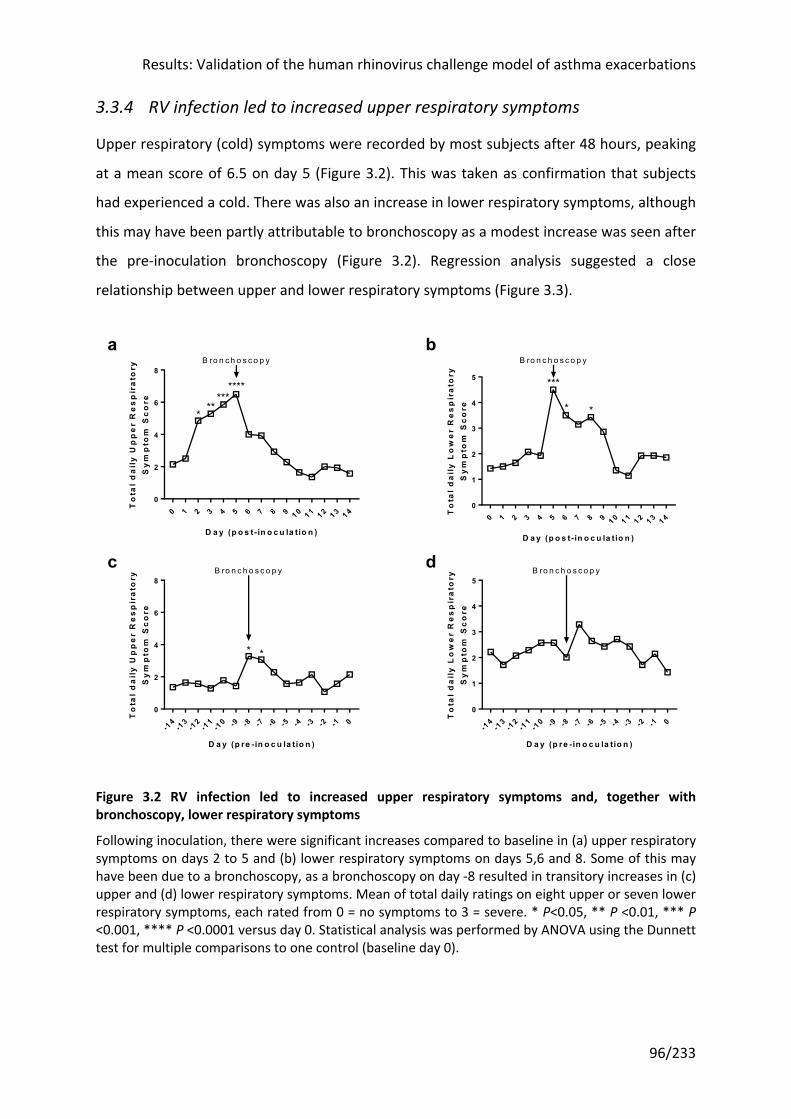
Results: Validation of the human rhinovirus challenge model of asthma exacerbations
96/233
3.3.4 RV infection led to increased upper respiratory symptoms
Upper respiratory (cold) symptoms were recorded by most subjects after 48 hours, peaking
at a mean score of 6.5 on day 5 (Figure 3.2). This was taken as confirmation that subjects
had experienced a cold. There was also an increase in lower respiratory symptoms, although
this may have been partly attributable to bronchoscopy as a modest increase was seen after
the pre-inoculation bronchoscopy (Figure 3.2). Regression analysis suggested a close
relationship between upper and lower respiratory symptoms (Figure 3.3).
Figure 3.2 RV infection led to increased upper respiratory symptoms and, together with bronchoscopy, lower respiratory symptoms
Following inoculation, there were significant increases compared to baseline in (a) upper respiratory symptoms on days 2 to 5 and (b) lower respiratory symptoms on days 5,6 and 8. Some of this may have been due to a bronchoscopy, as a bronchoscopy on day -8 resulted in transitory increases in (c) upper and (d) lower respiratory symptoms. Mean of total daily ratings on eight upper or seven lower respiratory symptoms, each rated from 0 = no symptoms to 3 = severe. * P<0.05, ** P <0.01, *** P <0.001, **** P <0.0001 versus day 0. Statistical analysis was performed by ANOVA using the Dunnett test for multiple comparisons to one control (baseline day 0).
0 1 2 3 4 5 6 7 8 9 1 0 1 1 1 2 1 3 1 40
2
4
6
8
D a y (p o s t- in o c u la tio n )
To
tal
da
ily
Up
pe
r R
es
pir
ato
ryS
ym
pto
m S
co
re
*******
***
B ro n c h o s c o p y
0 1 2 3 4 5 6 7 8 9 1 0 1 1 1 2 1 3 1 40
1
2
3
4
5
D a y (p o s t- in o c u la tio n )
To
tal
da
ily
Lo
we
r R
es
pir
ato
ryS
ym
pto
m S
co
re
***
* *
B ro n c h o s c o p y
-14
-13
-12
-11
-10 -9 -8 -7 -6 -5 -4 -3 -2 -1 0
0
2
4
6
8
D a y (p re - in o c u la tio n )
To
tal
da
ily
Up
pe
r R
es
pir
ato
ryS
ym
pto
m S
co
re
**
B ro n c h o s c o p y
-14
-13
-12
-11
-10 -9 -8 -7 -6 -5 -4 -3 -2 -1 0
0
1
2
3
4
5
D a y (p re - in o c u la tio n )
To
tal
da
ily
Lo
we
r R
es
pir
ato
ryS
ym
pto
m S
co
re
B ro n c h o s c o p y
ba
dc
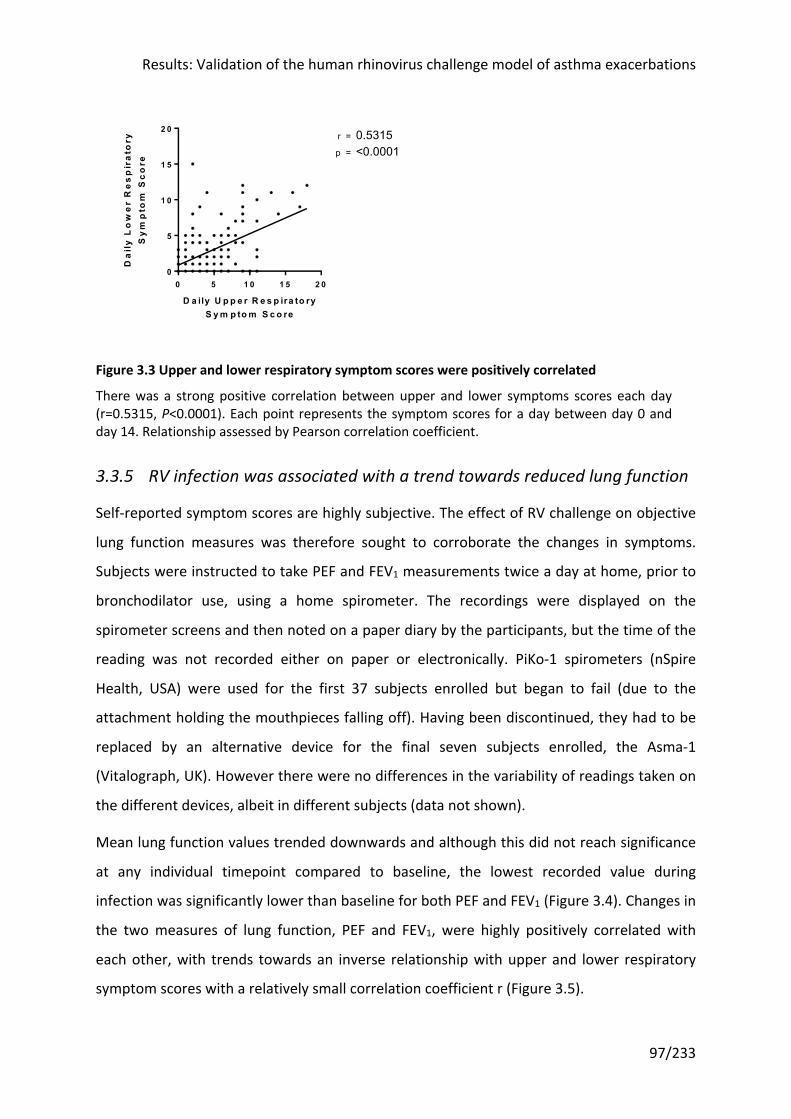
Results: Validation of the human rhinovirus challenge model of asthma exacerbations
97/233
Figure 3.3 Upper and lower respiratory symptom scores were positively correlated
There was a strong positive correlation between upper and lower symptoms scores each day (r=0.5315, P<0.0001). Each point represents the symptom scores for a day between day 0 and day 14. Relationship assessed by Pearson correlation coefficient.
3.3.5 RV infection was associated with a trend towards reduced lung function
Self-reported symptom scores are highly subjective. The effect of RV challenge on objective
lung function measures was therefore sought to corroborate the changes in symptoms.
Subjects were instructed to take PEF and FEV1 measurements twice a day at home, prior to
bronchodilator use, using a home spirometer. The recordings were displayed on the
spirometer screens and then noted on a paper diary by the participants, but the time of the
reading was not recorded either on paper or electronically. PiKo-1 spirometers (nSpire
Health, USA) were used for the first 37 subjects enrolled but began to fail (due to the
attachment holding the mouthpieces falling off). Having been discontinued, they had to be
replaced by an alternative device for the final seven subjects enrolled, the Asma-1
(Vitalograph, UK). However there were no differences in the variability of readings taken on
the different devices, albeit in different subjects (data not shown).
Mean lung function values trended downwards and although this did not reach significance
at any individual timepoint compared to baseline, the lowest recorded value during
infection was significantly lower than baseline for both PEF and FEV1 (Figure 3.4). Changes in
the two measures of lung function, PEF and FEV1, were highly positively correlated with
each other, with trends towards an inverse relationship with upper and lower respiratory
symptom scores with a relatively small correlation coefficient r (Figure 3.5).
0 5 1 0 1 5 2 00
5
1 0
1 5
2 0
D a ily U p p e r R e s p ira to ryS y m p to m S c o re
Da
ily
Lo
we
r R
es
pir
ato
ryS
ym
pto
m S
co
rep =
r = 0.5315<0.0001
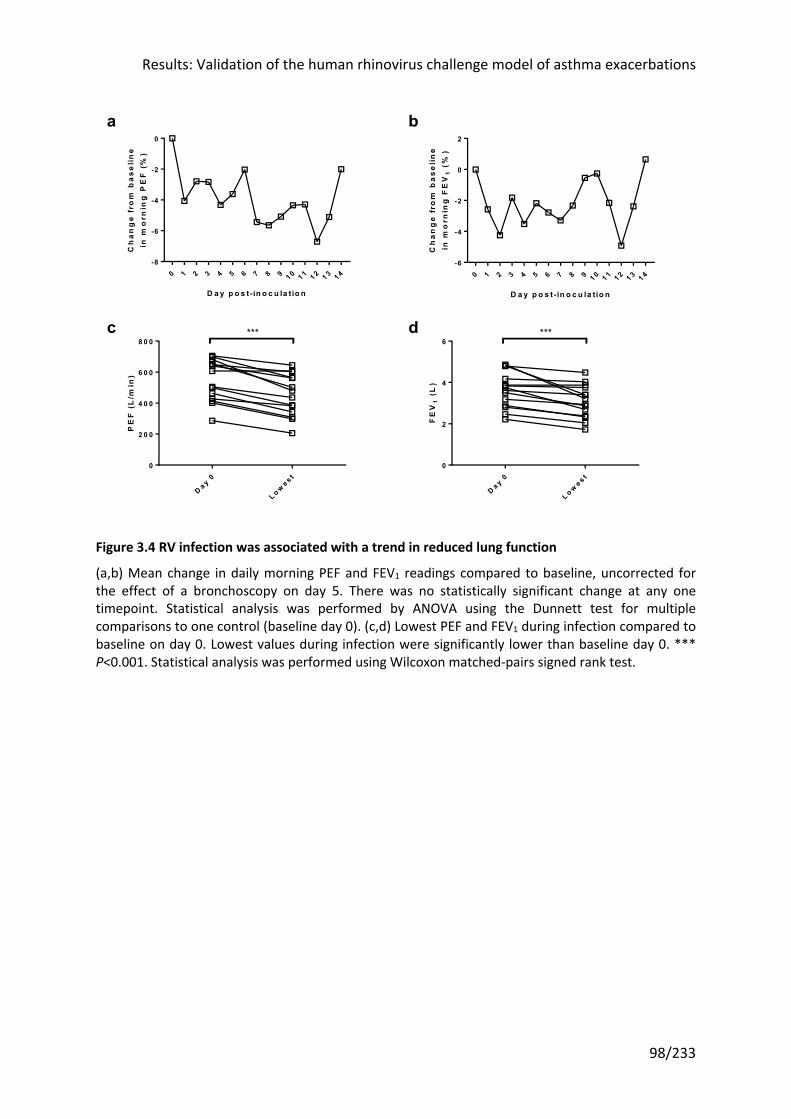
Results: Validation of the human rhinovirus challenge model of asthma exacerbations
98/233
Figure 3.4 RV infection was associated with a trend in reduced lung function
(a,b) Mean change in daily morning PEF and FEV1 readings compared to baseline, uncorrected for the effect of a bronchoscopy on day 5. There was no statistically significant change at any one timepoint. Statistical analysis was performed by ANOVA using the Dunnett test for multiple comparisons to one control (baseline day 0). (c,d) Lowest PEF and FEV1 during infection compared to baseline on day 0. Lowest values during infection were significantly lower than baseline day 0. *** P<0.001. Statistical analysis was performed using Wilcoxon matched-pairs signed rank test.
0 1 2 3 4 5 6 7 8 9 1 0 1 1 1 2 1 3 1 4-8
-6
-4
-2
0
D a y p o s t- in o c u la tio n
Ch
an
ge
fro
m b
as
eli
ne
in m
orn
ing
PE
F (
%)
0 1 2 3 4 5 6 7 8 9 1 0 1 1 1 2 1 3 1 4-6
-4
-2
0
2
D a y p o s t- in o c u la tio n
Ch
an
ge
fro
m b
as
eli
ne
in m
orn
ing
FE
V1
(%
)
D a y 0
L o we s t
0
2 0 0
4 0 0
6 0 0
8 0 0
PE
F (
L/m
in)
***
D a y 0
L o we s t
0
2
4
6
FE
V1
(L
)
***dc
ba
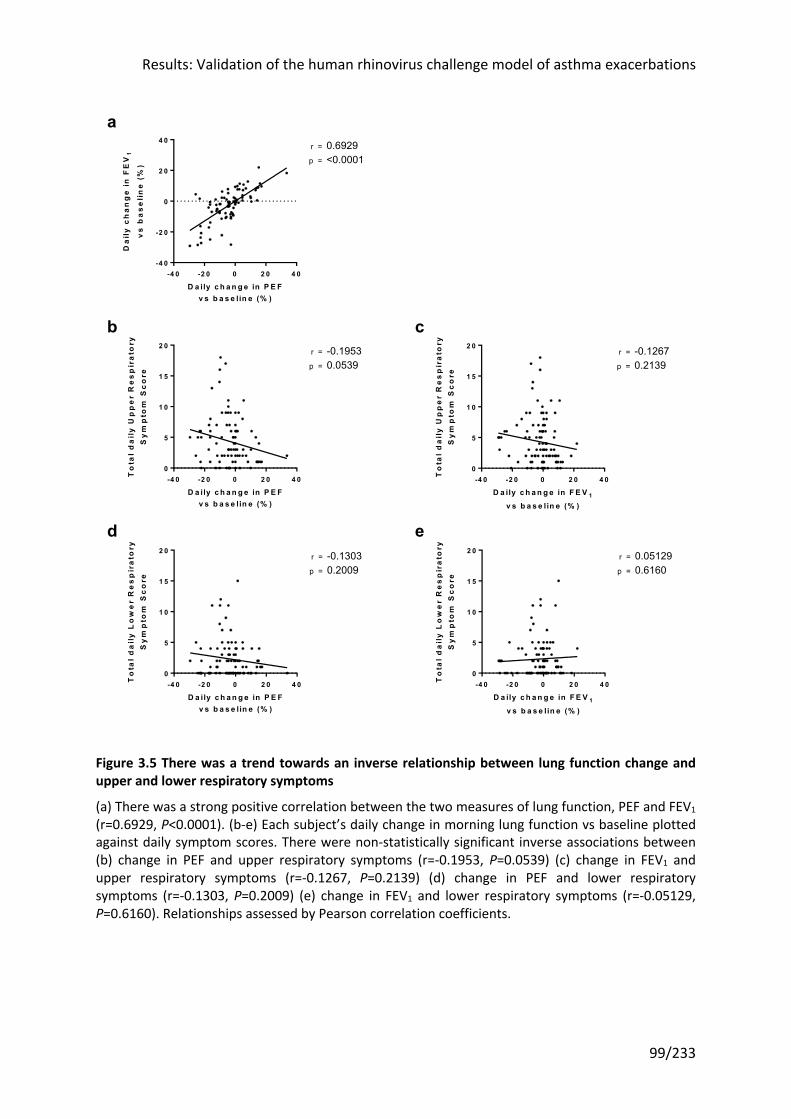
Results: Validation of the human rhinovirus challenge model of asthma exacerbations
99/233
Figure 3.5 There was a trend towards an inverse relationship between lung function change and upper and lower respiratory symptoms
(a) There was a strong positive correlation between the two measures of lung function, PEF and FEV1 (r=0.6929, P<0.0001). (b-e) Each subject’s daily change in morning lung function vs baseline plotted against daily symptom scores. There were non-statistically significant inverse associations between (b) change in PEF and upper respiratory symptoms (r=-0.1953, P=0.0539) (c) change in FEV1 and upper respiratory symptoms (r=-0.1267, P=0.2139) (d) change in PEF and lower respiratory symptoms (r=-0.1303, P=0.2009) (e) change in FEV1 and lower respiratory symptoms (r=-0.05129, P=0.6160). Relationships assessed by Pearson correlation coefficients.
-4 0 -2 0 0 2 0 4 0-4 0
-2 0
0
2 0
4 0
D a ily c h a n g e in P E Fv s b a s e lin e (% )
Da
ily
ch
an
ge
in
FE
V1
vs
ba
se
lin
e (
%) p =
r = 0.6929<0.0001
-4 0 -2 0 0 2 0 4 00
5
1 0
1 5
2 0
D a ily c h a n g e in P E Fv s b a s e lin e (% )
To
tal
da
ily
Up
pe
r R
es
pir
ato
ryS
ym
pto
m S
co
re
p =
r = -0.19530.0539
-4 0 -2 0 0 2 0 4 00
5
1 0
1 5
2 0
D a ily c h a n g e in F E V 1
v s b a s e lin e (% )
To
tal
da
ily
Up
pe
r R
es
pir
ato
ryS
ym
pto
m S
co
re
p =
r = -0.12670.2139
-4 0 -2 0 0 2 0 4 00
5
1 0
1 5
2 0
D a ily c h a n g e in P E Fv s b a s e lin e (% )
To
tal
da
ily
Lo
we
r R
es
pir
ato
ryS
ym
pto
m S
co
re
p =
r = -0.13030.2009
-4 0 -2 0 0 2 0 4 00
5
1 0
1 5
2 0
D a ily c h a n g e in F E V 1
v s b a s e lin e (% )
To
tal
da
ily
Lo
we
r R
es
pir
ato
ryS
ym
pto
m S
co
re
p =
r = 0.051290.6160
ed
a
cb
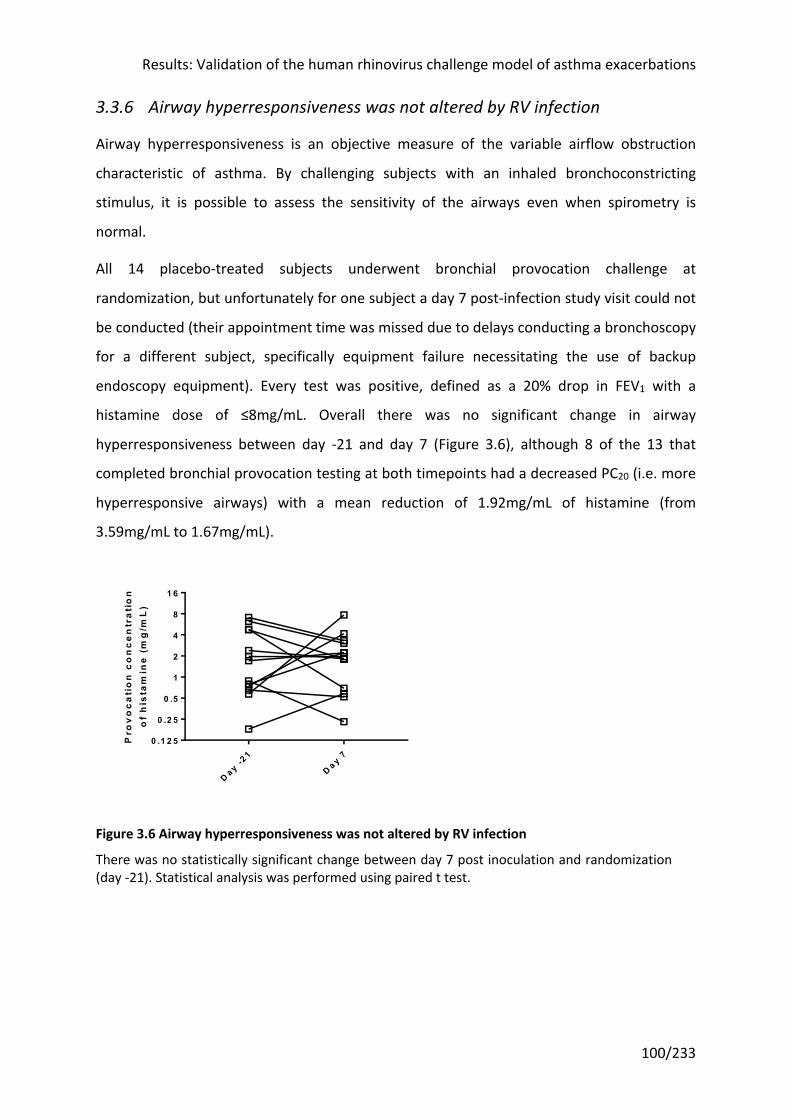
Results: Validation of the human rhinovirus challenge model of asthma exacerbations
100/233
3.3.6 Airway hyperresponsiveness was not altered by RV infection
Airway hyperresponsiveness is an objective measure of the variable airflow obstruction
characteristic of asthma. By challenging subjects with an inhaled bronchoconstricting
stimulus, it is possible to assess the sensitivity of the airways even when spirometry is
normal.
All 14 placebo-treated subjects underwent bronchial provocation challenge at
randomization, but unfortunately for one subject a day 7 post-infection study visit could not
be conducted (their appointment time was missed due to delays conducting a bronchoscopy
for a different subject, specifically equipment failure necessitating the use of backup
endoscopy equipment). Every test was positive, defined as a 20% drop in FEV1 with a
histamine dose of ≤8mg/mL. Overall there was no significant change in airway
hyperresponsiveness between day -21 and day 7 (Figure 3.6), although 8 of the 13 that
completed bronchial provocation testing at both timepoints had a decreased PC20 (i.e. more
hyperresponsive airways) with a mean reduction of 1.92mg/mL of histamine (from
3.59mg/mL to 1.67mg/mL).
Figure 3.6 Airway hyperresponsiveness was not altered by RV infection
There was no statistically significant change between day 7 post inoculation and randomization (day -21). Statistical analysis was performed using paired t test.
D a y -21
D a y 70 .1 2 5
0 .2 5
0 .5
1
2
4
8
1 6
Pro
vo
ca
tio
n c
on
ce
ntr
ati
on
of
his
tam
ine
(m
g/m
L)
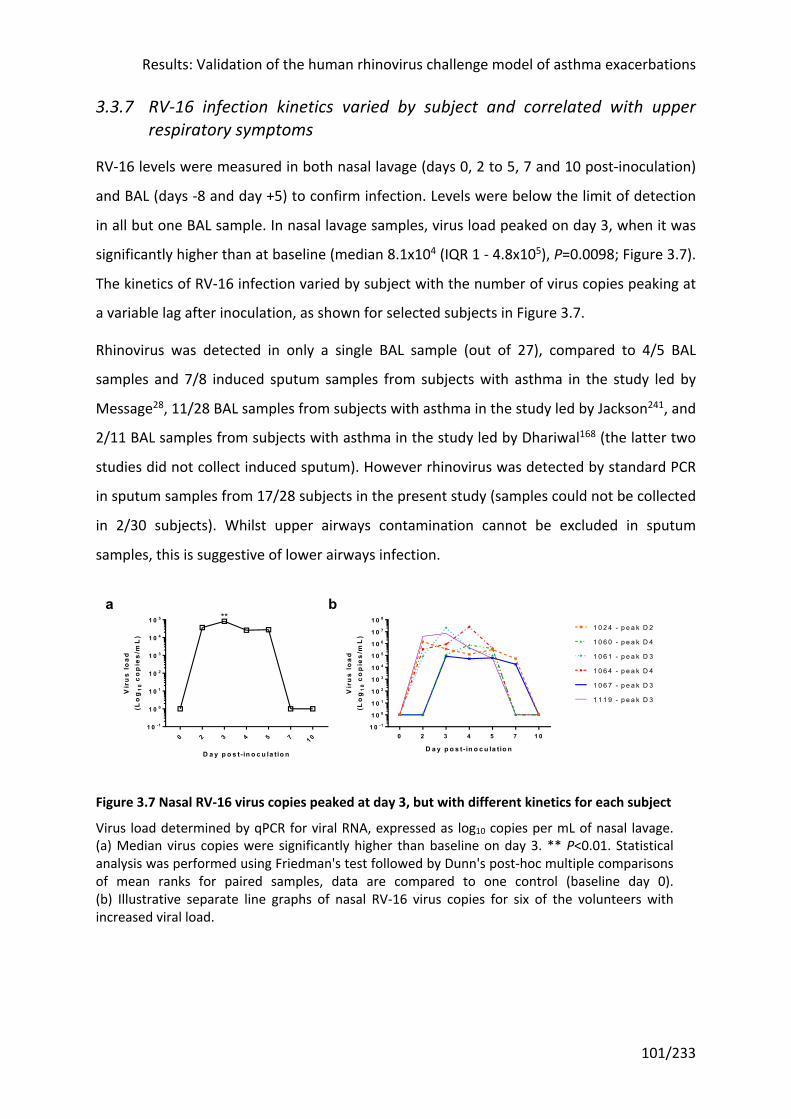
Results: Validation of the human rhinovirus challenge model of asthma exacerbations
101/233
3.3.7 RV-16 infection kinetics varied by subject and correlated with upper respiratory symptoms
RV-16 levels were measured in both nasal lavage (days 0, 2 to 5, 7 and 10 post-inoculation)
and BAL (days -8 and day +5) to confirm infection. Levels were below the limit of detection
in all but one BAL sample. In nasal lavage samples, virus load peaked on day 3, when it was
significantly higher than at baseline (median 8.1x10⁴ (IQR 1 - 4.8x10⁵), P=0.0098; Figure 3.7).
The kinetics of RV-16 infection varied by subject with the number of virus copies peaking at
a variable lag after inoculation, as shown for selected subjects in Figure 3.7.
Rhinovirus was detected in only a single BAL sample (out of 27), compared to 4/5 BAL
samples and 7/8 induced sputum samples from subjects with asthma in the study led by
Message28, 11/28 BAL samples from subjects with asthma in the study led by Jackson241, and
2/11 BAL samples from subjects with asthma in the study led by Dhariwal168 (the latter two
studies did not collect induced sputum). However rhinovirus was detected by standard PCR
in sputum samples from 17/28 subjects in the present study (samples could not be collected
in 2/30 subjects). Whilst upper airways contamination cannot be excluded in sputum
samples, this is suggestive of lower airways infection.
Figure 3.7 Nasal RV-16 virus copies peaked at day 3, but with different kinetics for each subject
Virus load determined by qPCR for viral RNA, expressed as log10 copies per mL of nasal lavage. (a) Median virus copies were significantly higher than baseline on day 3. ** P<0.01. Statistical analysis was performed using Friedman's test followed by Dunn's post-hoc multiple comparisons of mean ranks for paired samples, data are compared to one control (baseline day 0). (b) Illustrative separate line graphs of nasal RV-16 virus copies for six of the volunteers with increased viral load.
0 2 3 4 5 7 1 01 0 -1
1 0 0
1 0 1
1 0 2
1 0 3
1 0 4
1 0 5
D a y p o s t- in o c u la tio n
Vir
us
lo
ad(L
og
10
co
pie
s/m
L)
**
0 2 3 4 5 7 1 01 0 -1
1 0 0
1 0 1
1 0 2
1 0 3
1 0 4
1 0 5
1 0 6
1 0 7
1 0 8
D a y p o s t- in o c u la tio n
Vir
us
lo
ad(L
og
10
co
pie
s/m
L)
1 0 2 4 - p e a k D 2
1 0 6 0 - p e a k D 4
1 0 6 1 - p e a k D 3
1 0 6 4 - p e a k D 4
1 0 6 7 - p e a k D 3
1 1 1 9 - p e a k D 3
ba
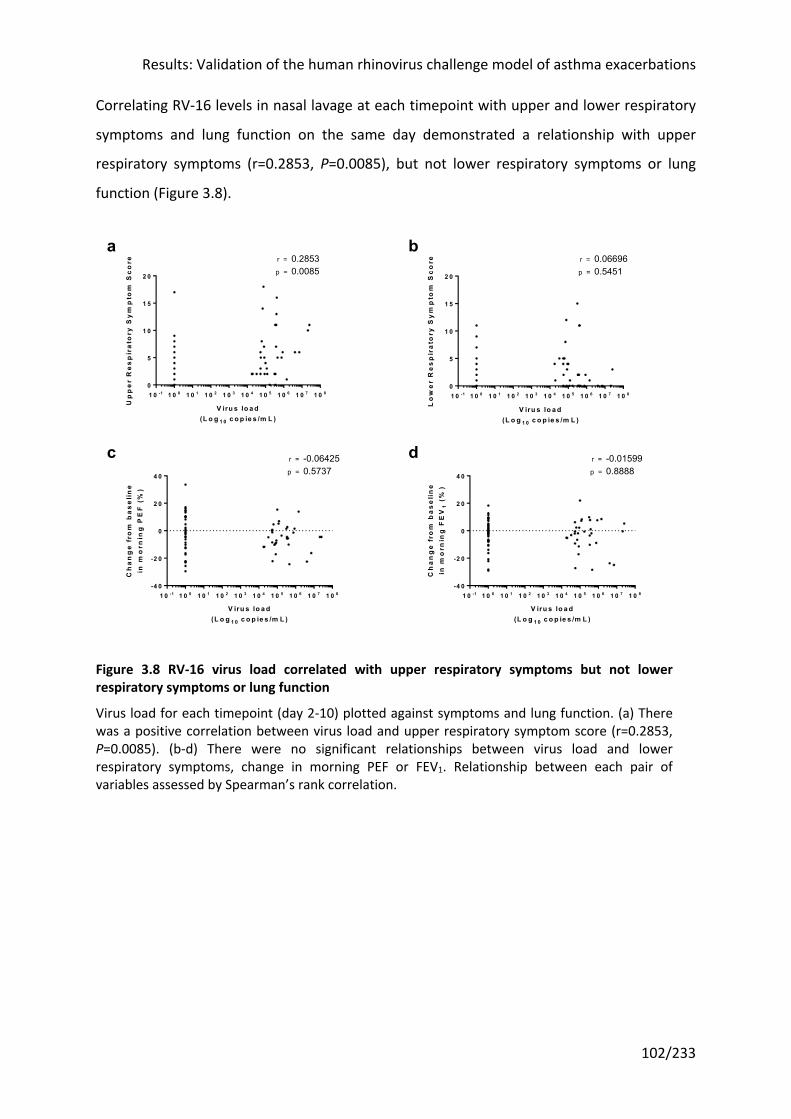
Results: Validation of the human rhinovirus challenge model of asthma exacerbations
102/233
Correlating RV-16 levels in nasal lavage at each timepoint with upper and lower respiratory
symptoms and lung function on the same day demonstrated a relationship with upper
respiratory symptoms (r=0.2853, P=0.0085), but not lower respiratory symptoms or lung
function (Figure 3.8).
Figure 3.8 RV-16 virus load correlated with upper respiratory symptoms but not lower respiratory symptoms or lung function
Virus load for each timepoint (day 2-10) plotted against symptoms and lung function. (a) There was a positive correlation between virus load and upper respiratory symptom score (r=0.2853, P=0.0085). (b-d) There were no significant relationships between virus load and lower respiratory symptoms, change in morning PEF or FEV1. Relationship between each pair of variables assessed by Spearman’s rank correlation.
1 0 -1 1 0 0 1 0 1 1 0 2 1 0 3 1 0 4 1 0 5 1 0 6 1 0 7 1 0 80
5
1 0
1 5
2 0
V iru s lo a d(L o g 1 0 c o p ie s /m L )
Up
pe
r R
es
pir
ato
ry S
ym
pto
m S
co
re 0.28530.0085
r =
p =
1 0 -1 1 0 0 1 0 1 1 0 2 1 0 3 1 0 4 1 0 5 1 0 6 1 0 7 1 0 80
5
1 0
1 5
2 0
V iru s lo a d(L o g 1 0 c o p ie s /m L )
Lo
we
r R
es
pir
ato
ry S
ym
pto
m S
co
re r =
p =
0.066960.5451
1 0 -1 1 0 0 1 0 1 1 0 2 1 0 3 1 0 4 1 0 5 1 0 6 1 0 7 1 0 8-4 0
-2 0
0
2 0
4 0
V iru s lo a d(L o g 1 0 c o p ie s /m L )
Ch
an
ge
fro
m b
as
eli
ne
in m
orn
ing
PE
F (
%)
-0.064250.5737
r =
p =
1 0 -1 1 0 0 1 0 1 1 0 2 1 0 3 1 0 4 1 0 5 1 0 6 1 0 7 1 0 8-4 0
-2 0
0
2 0
4 0
V iru s lo a d(L o g 1 0 c o p ie s /m L )
Ch
an
ge
fro
m b
as
eli
ne
in m
orn
ing
FE
V1
(%
)
r =
p =
-0.015990.8888
dc
ba
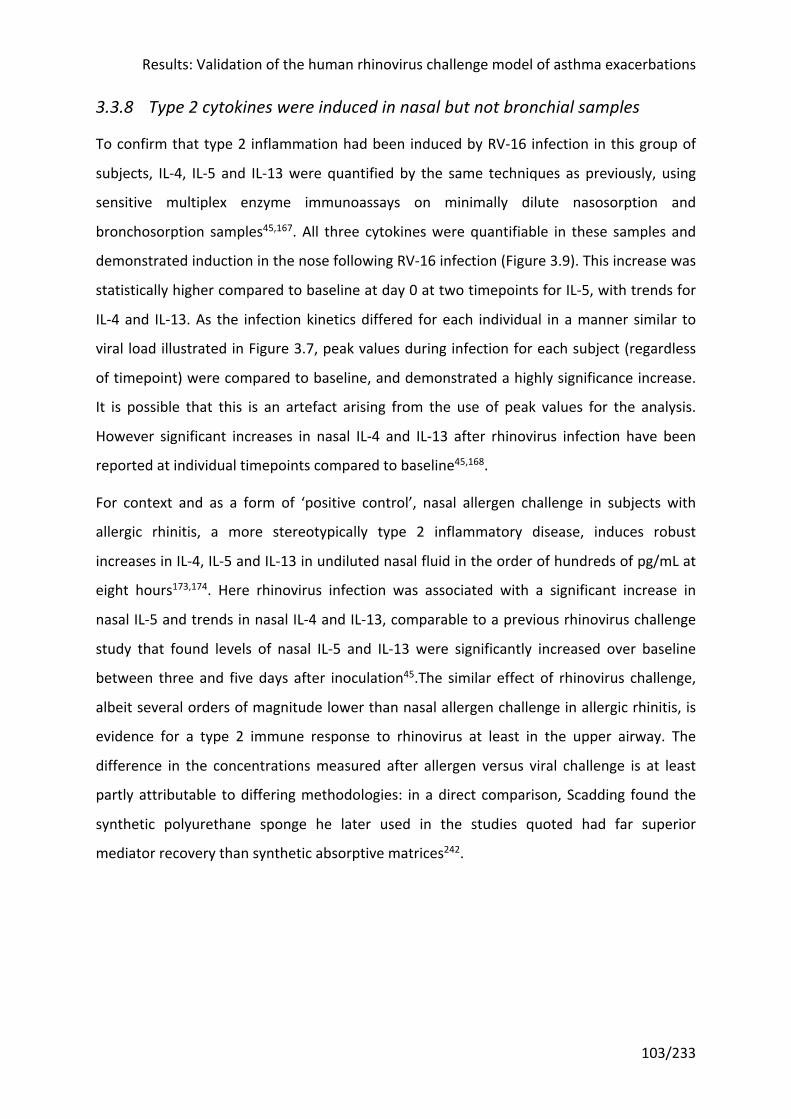
Results: Validation of the human rhinovirus challenge model of asthma exacerbations
103/233
3.3.8 Type 2 cytokines were induced in nasal but not bronchial samples
To confirm that type 2 inflammation had been induced by RV-16 infection in this group of
subjects, IL-4, IL-5 and IL-13 were quantified by the same techniques as previously, using
sensitive multiplex enzyme immunoassays on minimally dilute nasosorption and
bronchosorption samples45,167. All three cytokines were quantifiable in these samples and
demonstrated induction in the nose following RV-16 infection (Figure 3.9). This increase was
statistically higher compared to baseline at day 0 at two timepoints for IL-5, with trends for
IL-4 and IL-13. As the infection kinetics differed for each individual in a manner similar to
viral load illustrated in Figure 3.7, peak values during infection for each subject (regardless
of timepoint) were compared to baseline, and demonstrated a highly significance increase.
It is possible that this is an artefact arising from the use of peak values for the analysis.
However significant increases in nasal IL-4 and IL-13 after rhinovirus infection have been
reported at individual timepoints compared to baseline45,168.
For context and as a form of ‘positive control’, nasal allergen challenge in subjects with
allergic rhinitis, a more stereotypically type 2 inflammatory disease, induces robust
increases in IL-4, IL-5 and IL-13 in undiluted nasal fluid in the order of hundreds of pg/mL at
eight hours173,174. Here rhinovirus infection was associated with a significant increase in
nasal IL-5 and trends in nasal IL-4 and IL-13, comparable to a previous rhinovirus challenge
study that found levels of nasal IL-5 and IL-13 were significantly increased over baseline
between three and five days after inoculation45.The similar effect of rhinovirus challenge,
albeit several orders of magnitude lower than nasal allergen challenge in allergic rhinitis, is
evidence for a type 2 immune response to rhinovirus at least in the upper airway. The
difference in the concentrations measured after allergen versus viral challenge is at least
partly attributable to differing methodologies: in a direct comparison, Scadding found the
synthetic polyurethane sponge he later used in the studies quoted had far superior
mediator recovery than synthetic absorptive matrices242.
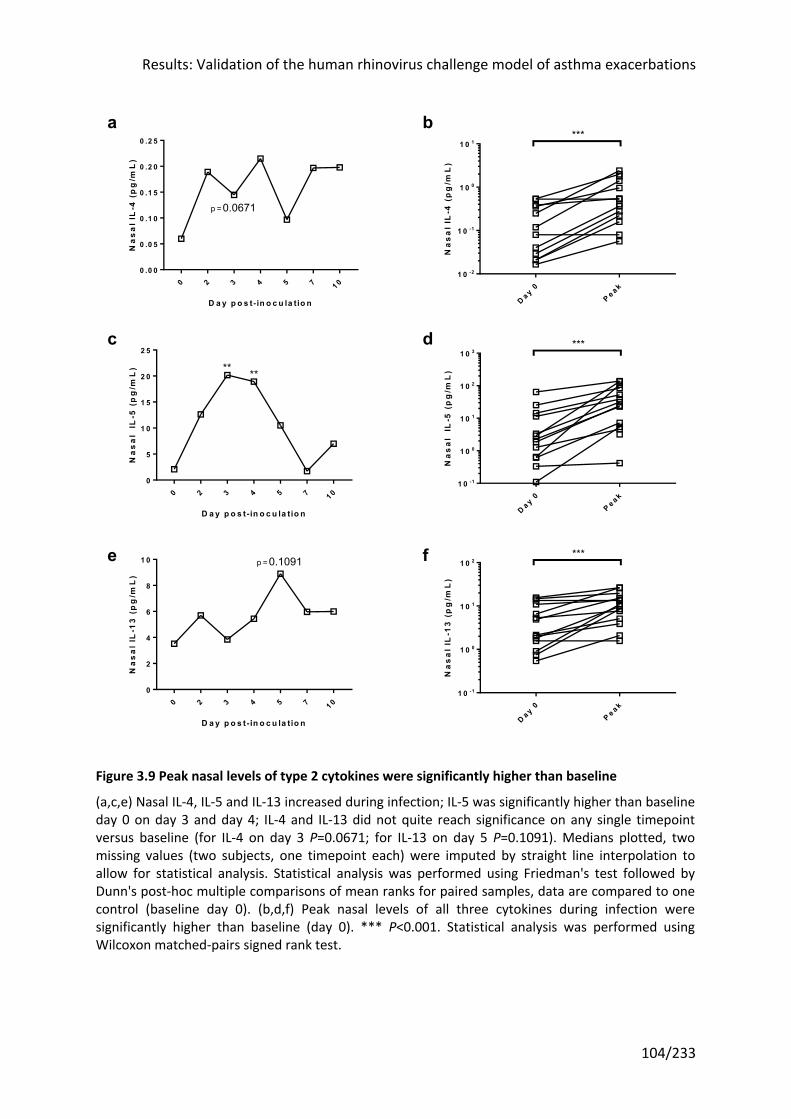
Results: Validation of the human rhinovirus challenge model of asthma exacerbations
104/233
Figure 3.9 Peak nasal levels of type 2 cytokines were significantly higher than baseline
(a,c,e) Nasal IL-4, IL-5 and IL-13 increased during infection; IL-5 was significantly higher than baseline day 0 on day 3 and day 4; IL-4 and IL-13 did not quite reach significance on any single timepoint versus baseline (for IL-4 on day 3 P=0.0671; for IL-13 on day 5 P=0.1091). Medians plotted, two missing values (two subjects, one timepoint each) were imputed by straight line interpolation to allow for statistical analysis. Statistical analysis was performed using Friedman's test followed by Dunn's post-hoc multiple comparisons of mean ranks for paired samples, data are compared to one control (baseline day 0). (b,d,f) Peak nasal levels of all three cytokines during infection were significantly higher than baseline (day 0). *** P<0.001. Statistical analysis was performed using Wilcoxon matched-pairs signed rank test.
0 2 3 4 5 7 1 00 .0 0
0 .0 5
0 .1 0
0 .1 5
0 .2 0
0 .2 5
D a y p o s t- in o c u la tio n
Na
sa
l IL
-4 (
pg
/mL
)
0.0671p =
D a y 0P e a k
1 0 -2
1 0 -1
1 0 0
1 0 1
Na
sa
l IL
-4 (
pg
/mL
)
***ba
0 2 3 4 5 7 1 00
5
1 0
1 5
2 0
2 5
D a y p o s t- in o c u la tio n
Na
sa
l I
L-5
(p
g/m
L) ** **
D a y 0P e a k
1 0 -1
1 0 0
1 0 1
1 0 2
1 0 3
Na
sa
l I
L-5
(p
g/m
L)
***
0 2 3 4 5 7 1 00
2
4
6
8
1 0
D a y p o s t- in o c u la tio n
Na
sa
l IL
-13
(p
g/m
L)
0.1091p =
D a y 0P e a k
1 0 -1
1 0 0
1 0 1
1 0 2
Na
sa
l IL
-13
(p
g/m
L)
***fe
dc
Results: Validation of the human rhinovirus challenge model of asthma exacerbations
105/233
In the lower airways, there were no significant differences in any of the cytokines measured
at the infection and baseline bronchial sampling timepoints (Figure 3.10). There was only a
single sampling timepoint during infection (day 5 post-inoculation). Had nasal samples only
been taken on day 5, only IL-5 would have been significantly elevated. Indeed the peak
timepoint in the nasal samples was highly variable across subjects, with no single timepoint
representing the peak for more than three subjects for IL-4 or IL-13, or five subjects for IL-5.
Figure 3.10 Bronchial type 2 cytokines were not significantly different on day 5 versus day -8
(a-c) There was no significant difference between bronchial IL-4, IL-5 and IL-13 levels at baseline (day -8) and during infection (day +5). Statistical analysis was performed using Wilcoxon matched-pairs signed rank test.
D a y -8
D a y +5
1 0 -2
1 0 -1
1 0 0
Bro
nc
hia
l IL
-4 (
pg
/mL
)
ns
D a y -8
D a y +5
1 0 -2
1 0 -1
1 0 0
1 0 1
Bro
nc
hia
l IL
-5 (
pg
/mL
)
nsba
D ay -8
D a y +5
1 0 -1
1 0 0
1 0 1
Bro
nc
hia
l IL
-13
(p
g/m
L)
nsc
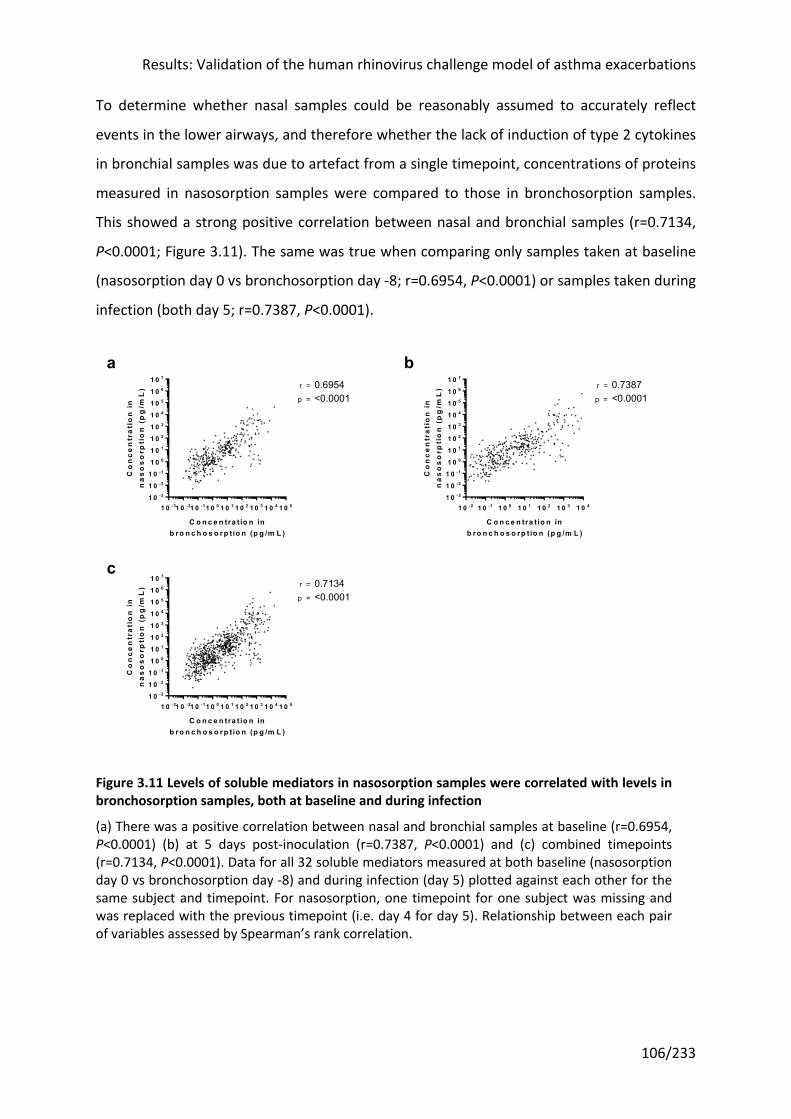
Results: Validation of the human rhinovirus challenge model of asthma exacerbations
106/233
To determine whether nasal samples could be reasonably assumed to accurately reflect
events in the lower airways, and therefore whether the lack of induction of type 2 cytokines
in bronchial samples was due to artefact from a single timepoint, concentrations of proteins
measured in nasosorption samples were compared to those in bronchosorption samples.
This showed a strong positive correlation between nasal and bronchial samples (r=0.7134,
P<0.0001; Figure 3.11). The same was true when comparing only samples taken at baseline
(nasosorption day 0 vs bronchosorption day -8; r=0.6954, P<0.0001) or samples taken during
infection (both day 5; r=0.7387, P<0.0001).
Figure 3.11 Levels of soluble mediators in nasosorption samples were correlated with levels in bronchosorption samples, both at baseline and during infection
(a) There was a positive correlation between nasal and bronchial samples at baseline (r=0.6954, P<0.0001) (b) at 5 days post-inoculation (r=0.7387, P<0.0001) and (c) combined timepoints (r=0.7134, P<0.0001). Data for all 32 soluble mediators measured at both baseline (nasosorption day 0 vs bronchosorption day -8) and during infection (day 5) plotted against each other for the same subject and timepoint. For nasosorption, one timepoint for one subject was missing and was replaced with the previous timepoint (i.e. day 4 for day 5). Relationship between each pair of variables assessed by Spearman’s rank correlation.
1 0 -31 0 -21 0 -11 0 0 1 0 1 1 0 2 1 0 3 1 0 4 1 0 51 0 -3
1 0 -2
1 0 -1
1 0 0
1 0 1
1 0 2
1 0 3
1 0 4
1 0 5
1 0 6
1 0 7
C o n c e n tra t io n inb ro n c h o s o rp tio n (p g /m L )
Co
nc
en
tra
tio
n i
nn
as
os
orp
tio
n (
pg
/mL
)
p =
r = 0.6954<0.0001
1 0 -2 1 0 -1 1 0 0 1 0 1 1 0 2 1 0 3 1 0 41 0 -3
1 0 -2
1 0 -1
1 0 0
1 0 1
1 0 2
1 0 3
1 0 4
1 0 5
1 0 6
1 0 7
C o n c e n tra t io n inb ro n c h o s o rp tio n (p g /m L )
Co
nc
en
tra
tio
n i
nn
as
os
orp
tio
n (
pg
/mL
)
p =
r = 0.7387<0.0001
1 0 -31 0 -21 0 -11 0 0 1 0 1 1 0 2 1 0 3 1 0 4 1 0 51 0 -3
1 0 -2
1 0 -1
1 0 0
1 0 1
1 0 2
1 0 3
1 0 4
1 0 5
1 0 6
1 0 7
C o n c e n tra t io n inb ro n c h o s o rp tio n (p g /m L )
Co
nc
en
tra
tio
n i
nn
as
os
orp
tio
n (
pg
/mL
)
p =
r = 0.7134<0.0001
c
ba
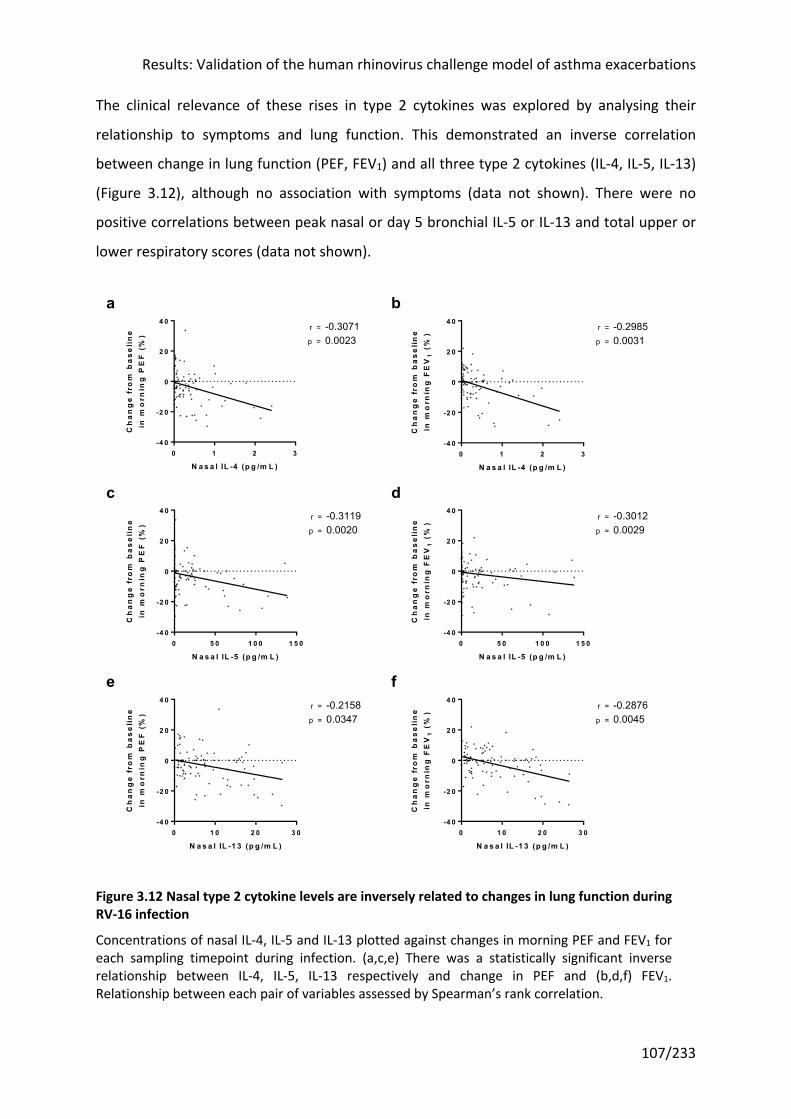
Results: Validation of the human rhinovirus challenge model of asthma exacerbations
107/233
The clinical relevance of these rises in type 2 cytokines was explored by analysing their
relationship to symptoms and lung function. This demonstrated an inverse correlation
between change in lung function (PEF, FEV1) and all three type 2 cytokines (IL-4, IL-5, IL-13)
(Figure 3.12), although no association with symptoms (data not shown). There were no
positive correlations between peak nasal or day 5 bronchial IL-5 or IL-13 and total upper or
lower respiratory scores (data not shown).
Figure 3.12 Nasal type 2 cytokine levels are inversely related to changes in lung function during RV-16 infection
Concentrations of nasal IL-4, IL-5 and IL-13 plotted against changes in morning PEF and FEV1 for each sampling timepoint during infection. (a,c,e) There was a statistically significant inverse relationship between IL-4, IL-5, IL-13 respectively and change in PEF and (b,d,f) FEV1. Relationship between each pair of variables assessed by Spearman’s rank correlation.
0 1 2 3-4 0
-2 0
0
2 0
4 0
N a s a l IL -4 (p g /m L )
Ch
an
ge
fro
m b
as
eli
ne
in m
orn
ing
PE
F (
%)
p =
r = -0.30710.0023
0 1 2 3-4 0
-2 0
0
2 0
4 0
N a s a l IL -4 (p g /m L )
Ch
an
ge
fro
m b
as
eli
ne
in m
orn
ing
FE
V1
(%
)
p =
r = -0.29850.0031
0 5 0 1 0 0 1 5 0-4 0
-2 0
0
2 0
4 0
N a s a l IL -5 (p g /m L )
Ch
an
ge
fro
m b
as
eli
ne
in m
orn
ing
PE
F (
%)
p =
r = -0.31190.0020
0 5 0 1 0 0 1 5 0-4 0
-2 0
0
2 0
4 0
N a s a l IL -5 (p g /m L )
Ch
an
ge
fro
m b
as
eli
ne
in m
orn
ing
FE
V1
(%
)
p =
r = -0.30120.0029
0 1 0 2 0 3 0-4 0
-2 0
0
2 0
4 0
N a s a l IL -1 3 (p g /m L )
Ch
an
ge
fro
m b
as
eli
ne
in m
orn
ing
PE
F (
%)
p =
r = -0.21580.0347
0 1 0 2 0 3 0-4 0
-2 0
0
2 0
4 0
N a s a l IL -1 3 (p g /m L )
Ch
an
ge
fro
m b
as
eli
ne
in m
orn
ing
FE
V1
(%
)
p =
r = -0.28760.0045
fe
a b
c d
Results: Validation of the human rhinovirus challenge model of asthma exacerbations
108/233
3.3.9 There was no induction of Prostaglandin D2 following RV-16 infection
For a receptor antagonist to be effective in attenuating the viral infection-induced changes,
it was important to demonstrate that the ligand of the receptor was present and also
induced by infection. PGD2, the substrate of the CRTH2 receptor, was measured in minimally
dilute nasosorption and bronchosorption samples using a commercially available modified
ELISA kit (Cayman Chemicals, USA). The required modification to the standard ELISA is the
conversion of PGD2, an unstable lipid mediator that spontaneously degrades, to a stable
methoxime (MOX) derivative. To minimize spontaneous loss of PGD2, samples were
transported to the laboratory on ice and, once eluted from the nasosorption and
bronchosorption strips by centrifugation in a spin filter tube, stored at -80°C.
Unlike type 2 cytokines, PGD2 levels in nasal samples were not obviously increased at any
timepoint following infection, confirmed by statistical analysis (Figure 3.13). As a result an
analysis of peak values was not undertaken. As for the other soluble inflammatory
mediators, no increase was seen in PGD2 concentration in bronchial samples taken at a
single timepoint pre- and during infection.
This study assumes that PGD2 is the principal driver of type 2 cytokine release and so the
relationship between these was investigated (Figure 3.14). PGD2 was positively correlated
with all three type 2 cytokines in nasal samples, achieving statistical significance for IL-4
(r=0.2745, P=0.0037) and IL-13 (r=0.3307, P=0.0004).
The author next investigated the relationship between PGD2 and clinical outcomes, but
found no statistically significant relationships with symptoms scores or lung function (Figure
3.15).
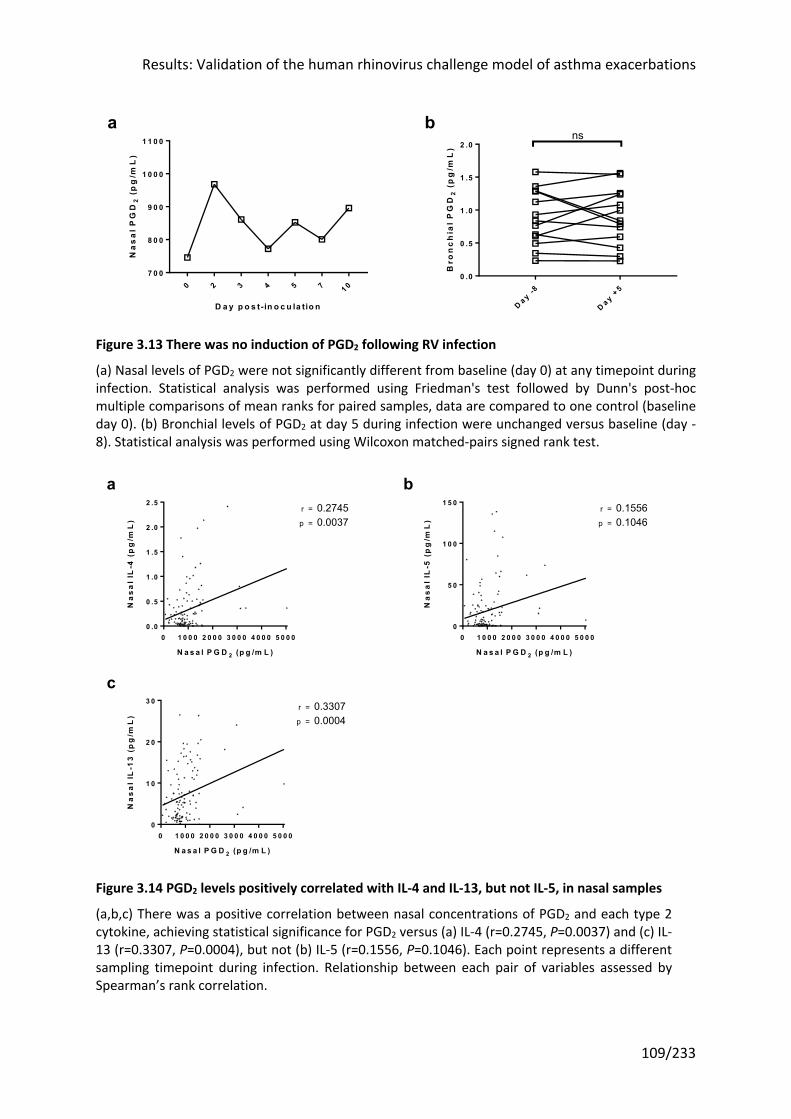
Results: Validation of the human rhinovirus challenge model of asthma exacerbations
109/233
Figure 3.13 There was no induction of PGD2 following RV infection
(a) Nasal levels of PGD2 were not significantly different from baseline (day 0) at any timepoint during infection. Statistical analysis was performed using Friedman's test followed by Dunn's post-hoc multiple comparisons of mean ranks for paired samples, data are compared to one control (baseline day 0). (b) Bronchial levels of PGD2 at day 5 during infection were unchanged versus baseline (day -8). Statistical analysis was performed using Wilcoxon matched-pairs signed rank test.
Figure 3.14 PGD2 levels positively correlated with IL-4 and IL-13, but not IL-5, in nasal samples
(a,b,c) There was a positive correlation between nasal concentrations of PGD2 and each type 2 cytokine, achieving statistical significance for PGD2 versus (a) IL-4 (r=0.2745, P=0.0037) and (c) IL-13 (r=0.3307, P=0.0004), but not (b) IL-5 (r=0.1556, P=0.1046). Each point represents a different sampling timepoint during infection. Relationship between each pair of variables assessed by Spearman’s rank correlation.
0 2 3 4 5 7 1 07 0 0
8 0 0
9 0 0
1 0 0 0
1 1 0 0
D a y p o s t- in o c u la tio n
Na
sa
l P
GD
2 (
pg
/mL
)
D a y -8
D a y +5
0 .0
0 .5
1 .0
1 .5
2 .0
Bro
nc
hia
l P
GD
2 (
pg
/mL
)
nsba
0 1 0 0 0 2 0 0 0 3 0 0 0 4 0 0 0 5 0 0 00 .0
0 .5
1 .0
1 .5
2 .0
2 .5
N a s a l P G D 2 (p g /m L )
Na
sa
l IL
-4 (
pg
/mL
) p =
r = 0.27450.0037
0 1 0 0 0 2 0 0 0 3 0 0 0 4 0 0 0 5 0 0 00
5 0
1 0 0
1 5 0
N a s a l P G D 2 (p g /m L )
Na
sa
l IL
-5 (
pg
/mL
) p =
r = 0.15560.1046
0 1 0 0 0 2 0 0 0 3 0 0 0 4 0 0 0 5 0 0 00
1 0
2 0
3 0
N a s a l P G D 2 (p g /m L )
Na
sa
l IL
-13
(p
g/m
L)
p =
r = 0.33070.0004
a b
c
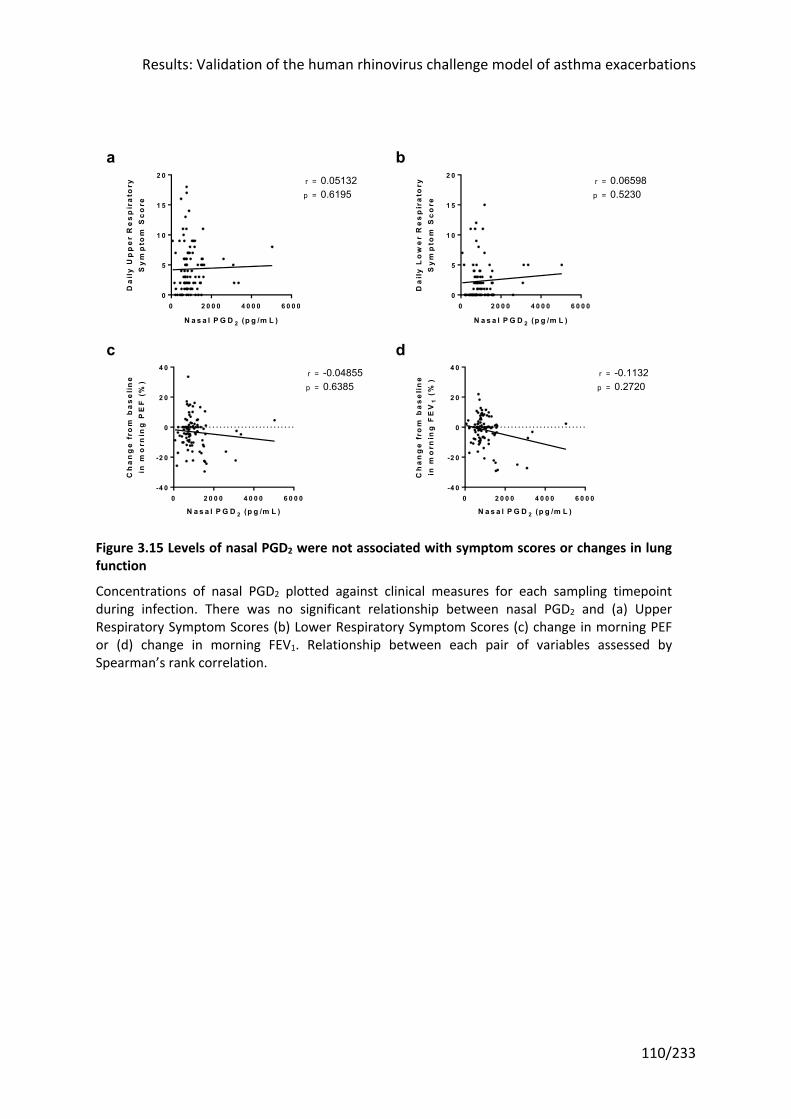
Results: Validation of the human rhinovirus challenge model of asthma exacerbations
110/233
Figure 3.15 Levels of nasal PGD2 were not associated with symptom scores or changes in lung function
Concentrations of nasal PGD2 plotted against clinical measures for each sampling timepoint during infection. There was no significant relationship between nasal PGD2 and (a) Upper Respiratory Symptom Scores (b) Lower Respiratory Symptom Scores (c) change in morning PEF or (d) change in morning FEV1. Relationship between each pair of variables assessed by Spearman’s rank correlation.
0 2 0 0 0 4 0 0 0 6 0 0 00
5
1 0
1 5
2 0
N a s a l P G D 2 (p g /m L )
Da
ily
Up
pe
r R
es
pir
ato
ryS
ym
pto
m S
co
re
p =
r = 0.051320.6195
0 2 0 0 0 4 0 0 0 6 0 0 00
5
1 0
1 5
2 0
N a s a l P G D 2 (p g /m L )
Da
ily
Lo
we
r R
es
pir
ato
ryS
ym
pto
m S
co
re
p =
r = 0.065980.5230
0 2 0 0 0 4 0 0 0 6 0 0 0-4 0
-2 0
0
2 0
4 0
N a s a l P G D 2 (p g /m L )
Ch
an
ge
fro
m b
as
eli
ne
in m
orn
ing
PE
F (
%)
p =
r = -0.048550.6385
0 2 0 0 0 4 0 0 0 6 0 0 0-4 0
-2 0
0
2 0
4 0
N a s a l P G D 2 (p g /m L )
Ch
an
ge
fro
m b
as
eli
ne
in m
orn
ing
FE
V1
(%
)
p =
r = -0.11320.2720
a b
c d
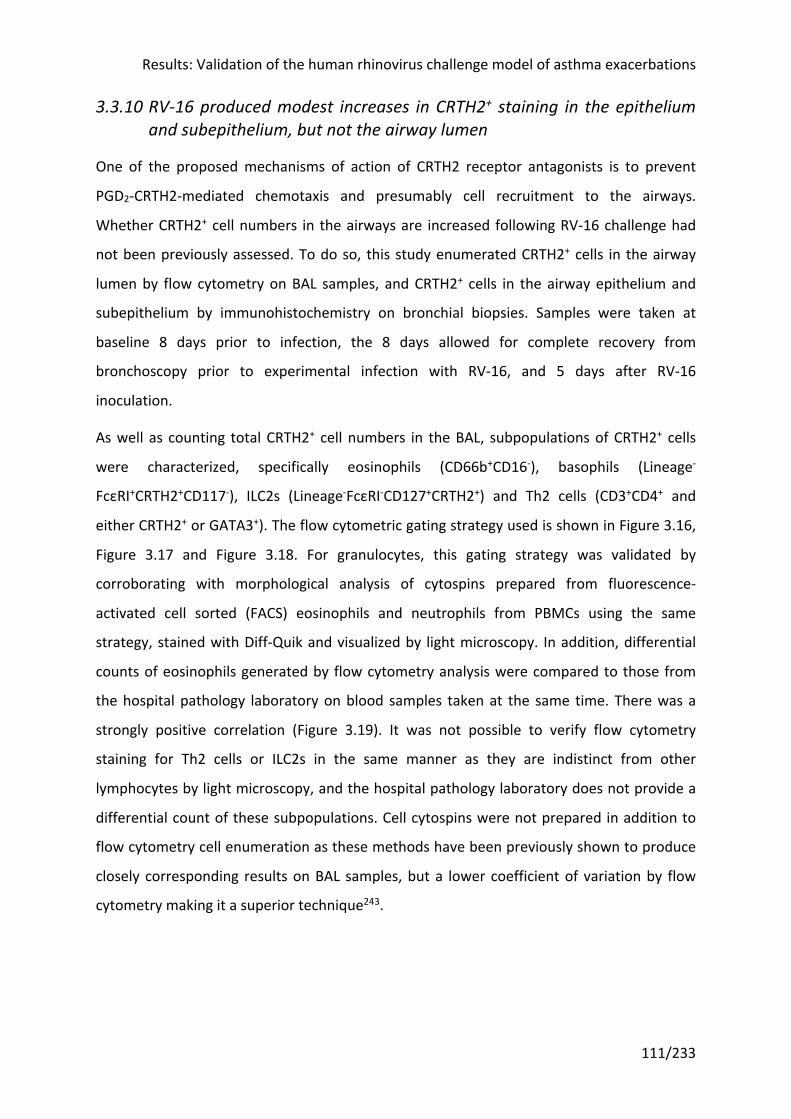
Results: Validation of the human rhinovirus challenge model of asthma exacerbations
111/233
3.3.10 RV-16 produced modest increases in CRTH2+ staining in the epithelium and subepithelium, but not the airway lumen
One of the proposed mechanisms of action of CRTH2 receptor antagonists is to prevent
PGD2-CRTH2-mediated chemotaxis and presumably cell recruitment to the airways.
Whether CRTH2+ cell numbers in the airways are increased following RV-16 challenge had
not been previously assessed. To do so, this study enumerated CRTH2+ cells in the airway
lumen by flow cytometry on BAL samples, and CRTH2+ cells in the airway epithelium and
subepithelium by immunohistochemistry on bronchial biopsies. Samples were taken at
baseline 8 days prior to infection, the 8 days allowed for complete recovery from
bronchoscopy prior to experimental infection with RV-16, and 5 days after RV-16
inoculation.
As well as counting total CRTH2+ cell numbers in the BAL, subpopulations of CRTH2+ cells
were characterized, specifically eosinophils (CD66b+CD16-), basophils (Lineage-
FcεRI+CRTH2+CD117-), ILC2s (Lineage-FcεRI-CD127+CRTH2+) and Th2 cells (CD3+CD4+ and
either CRTH2+ or GATA3+). The flow cytometric gating strategy used is shown in Figure 3.16,
Figure 3.17 and Figure 3.18. For granulocytes, this gating strategy was validated by
corroborating with morphological analysis of cytospins prepared from fluorescence-
activated cell sorted (FACS) eosinophils and neutrophils from PBMCs using the same
strategy, stained with Diff-Quik and visualized by light microscopy. In addition, differential
counts of eosinophils generated by flow cytometry analysis were compared to those from
the hospital pathology laboratory on blood samples taken at the same time. There was a
strongly positive correlation (Figure 3.19). It was not possible to verify flow cytometry
staining for Th2 cells or ILC2s in the same manner as they are indistinct from other
lymphocytes by light microscopy, and the hospital pathology laboratory does not provide a
differential count of these subpopulations. Cell cytospins were not prepared in addition to
flow cytometry cell enumeration as these methods have been previously shown to produce
closely corresponding results on BAL samples, but a lower coefficient of variation by flow
cytometry making it a superior technique243.
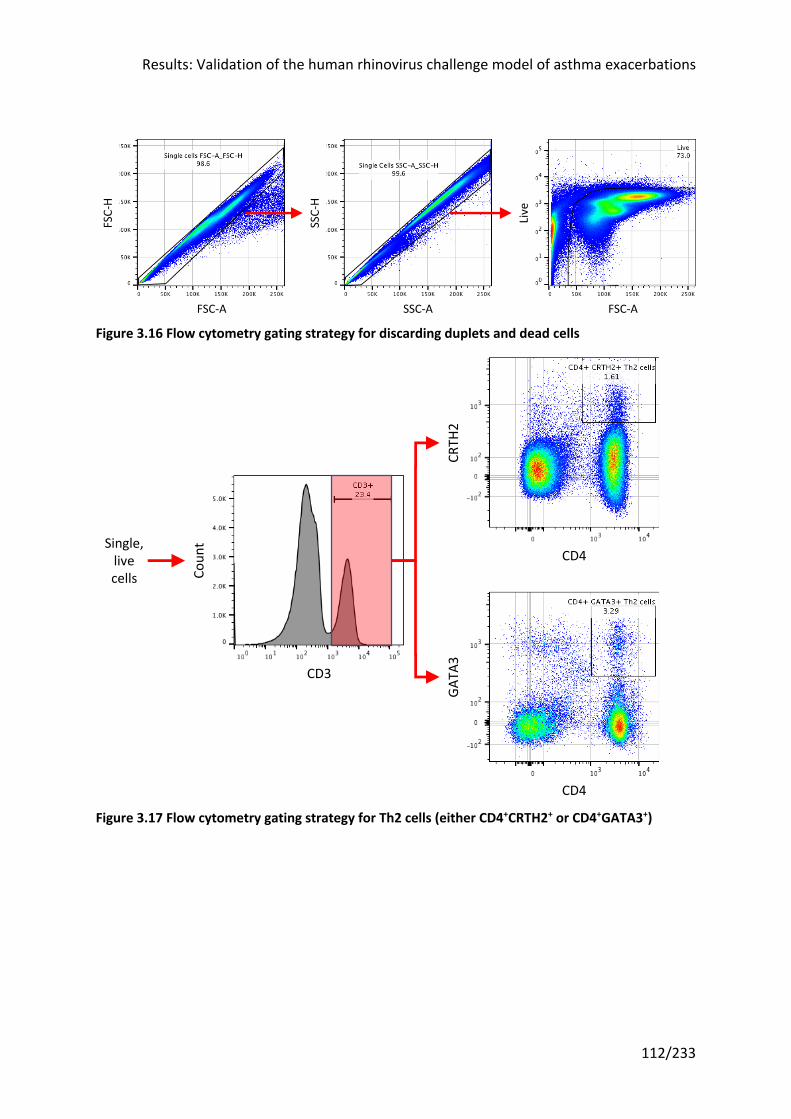
Results: Validation of the human rhinovirus challenge model of asthma exacerbations
112/233
Figure 3.16 Flow cytometry gating strategy for discarding duplets and dead cells
Figure 3.17 Flow cytometry gating strategy for Th2 cells (either CD4+CRTH2+ or CD4+GATA3+)
FSC-A
FSC-H
SSC-H
SSC-A
Live
FSC-A
CD3
Coun
t
CD4
CRTH
2
CD4
GATA
3
Single,livecells
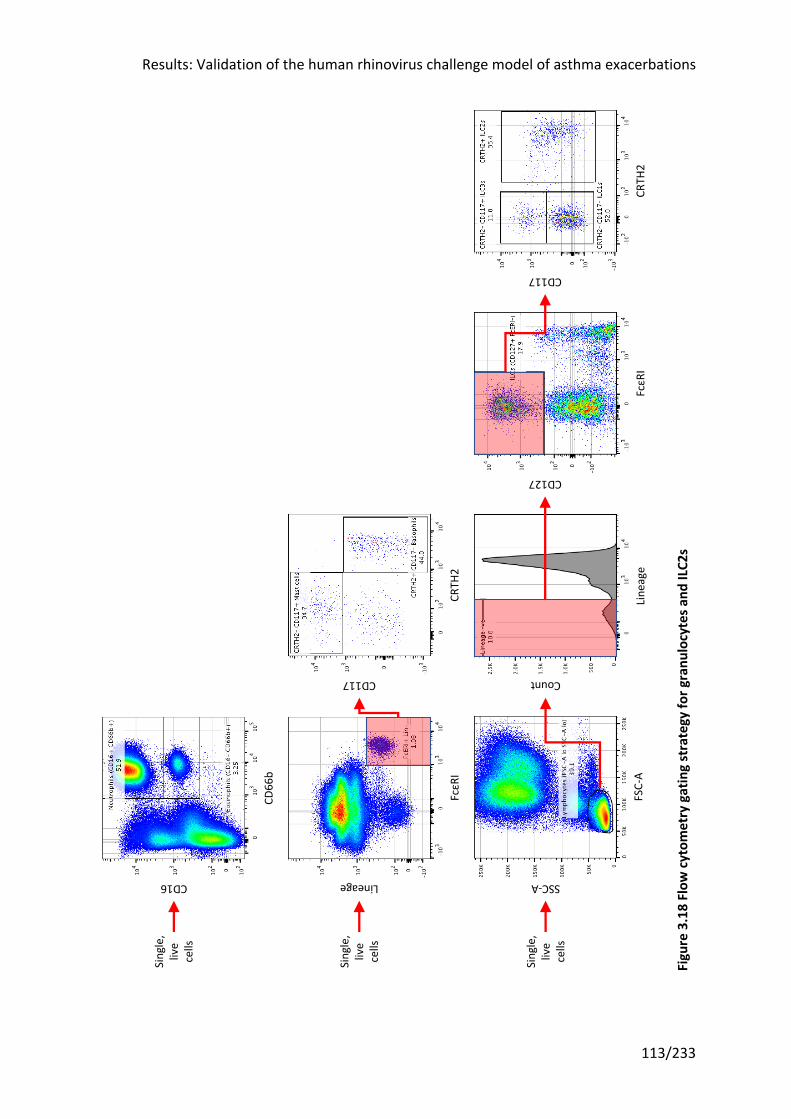
Results: Validation of the human rhinovirus challenge model of asthma exacerbations
113/233
Fi
gure
3. 1
8 Fl
ow c
ytom
etry
gat
ing
stra
tegy
for g
ranu
locy
tes a
nd IL
C2s
Single,
live
cells
CRTH
2
CD117
FcεRI
CD127FSC-A
SSC-A
Line
age
Count
CD16
CD66
b
Single,
live
cells
CRTH
2
CD117
FcεRI
Lineage
Single,
live
cells
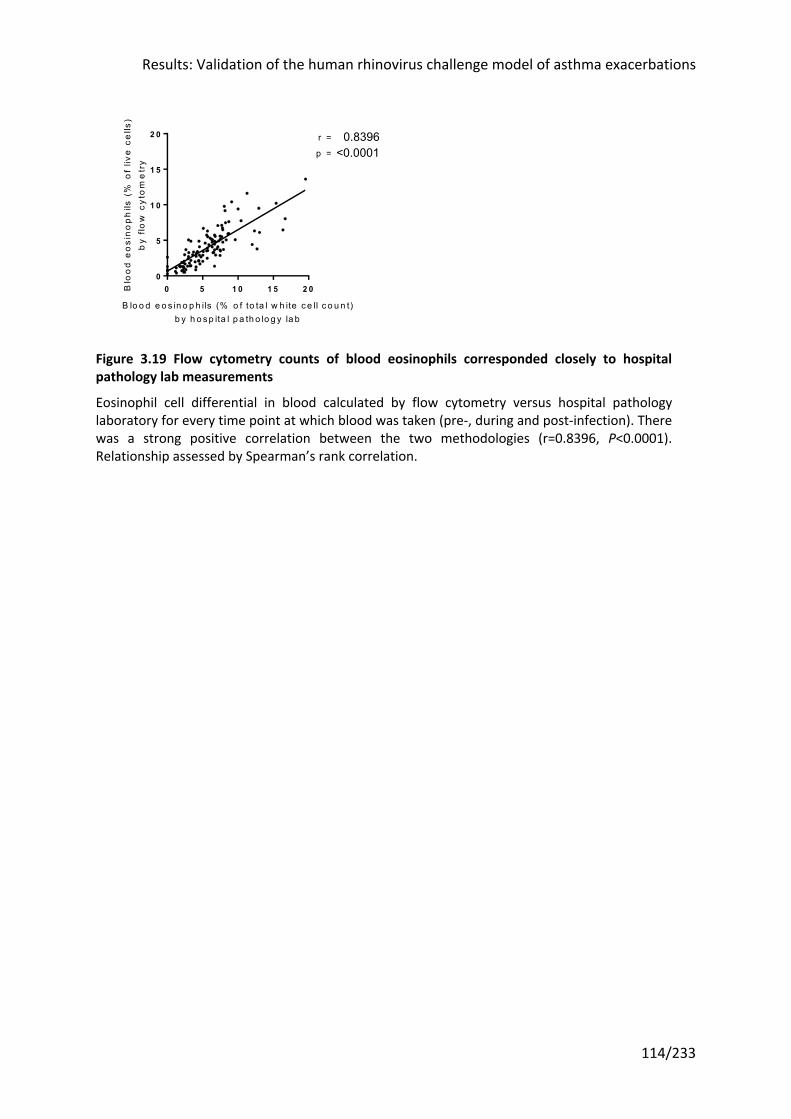
Results: Validation of the human rhinovirus challenge model of asthma exacerbations
114/233
Figure 3.19 Flow cytometry counts of blood eosinophils corresponded closely to hospital pathology lab measurements
Eosinophil cell differential in blood calculated by flow cytometry versus hospital pathology laboratory for every time point at which blood was taken (pre-, during and post-infection). There was a strong positive correlation between the two methodologies (r=0.8396, P<0.0001). Relationship assessed by Spearman’s rank correlation.
0 5 1 0 1 5 2 00
5
1 0
1 5
2 0
B lo o d e o s in o p h ils (% o f to ta l w h ite c e ll c o u n t)b y h o s p ita l p a th o lo g y la b
Blo
od
eo
sin
op
hils
(%
of
live
ce
lls)
by
flow
cyt
om
etr
y0.8396<0.0001
r =
p =
Results: Validation of the human rhinovirus challenge model of asthma exacerbations
115/233
There was no change in CRTH2+ cells, eosinophils, basophils, ILC2s or Th2 cells in the blood
or airway lumen five days after inoculation with RV-16, shown as a differential cell count in
Figure 3.20. There were however modest increases in CRTH2 staining in epithelial and
subepithelial sections from the bronchial biopsies taken at day 5 post-infection compared to
baseline (day -8) (Figure 3.21). EG2 staining for eosinophils was unchanged by RV-16
infection.
To ensure that analysing the BAL CRTH2+ cell data as a percentage of live cells was not
masking differences in absolute cell numbers, the cell differentials were converted into
absolute cell counts per mL of BAL using the total BAL volume return and total cell count
(determined with a haemocytometer and light microscopy after trypan blue staining); the
result was unchanged (data not shown). The total volume of blood taken was not recorded
and this calculation therefore could not be performed on blood cell differentials.
The relationship between PGD2 levels and CRTH2 cell numbers was investigated to assess
the underlying hypothesis that PGD2 was an important stimulus in CRTH2+ cell chemotaxis.
There was a positive correlation between nasal, but not bronchial, PGD2 levels and CRTH2+
cell numbers in the airway lumen, despite the lack of additional recruitment of CRTH2+ cells
into the airway lumen following RV-16 infection (Figure 3.22). Epithelial and subepithelial
CRTH2 staining was unrelated to nasal PGD2 levels but inversely correlated with bronchial
PGD2 levels (Figure 3.22). This could reflect transepithelial migration of CRTH2+ cells on
PGD2-CRTH2 receptor binding.
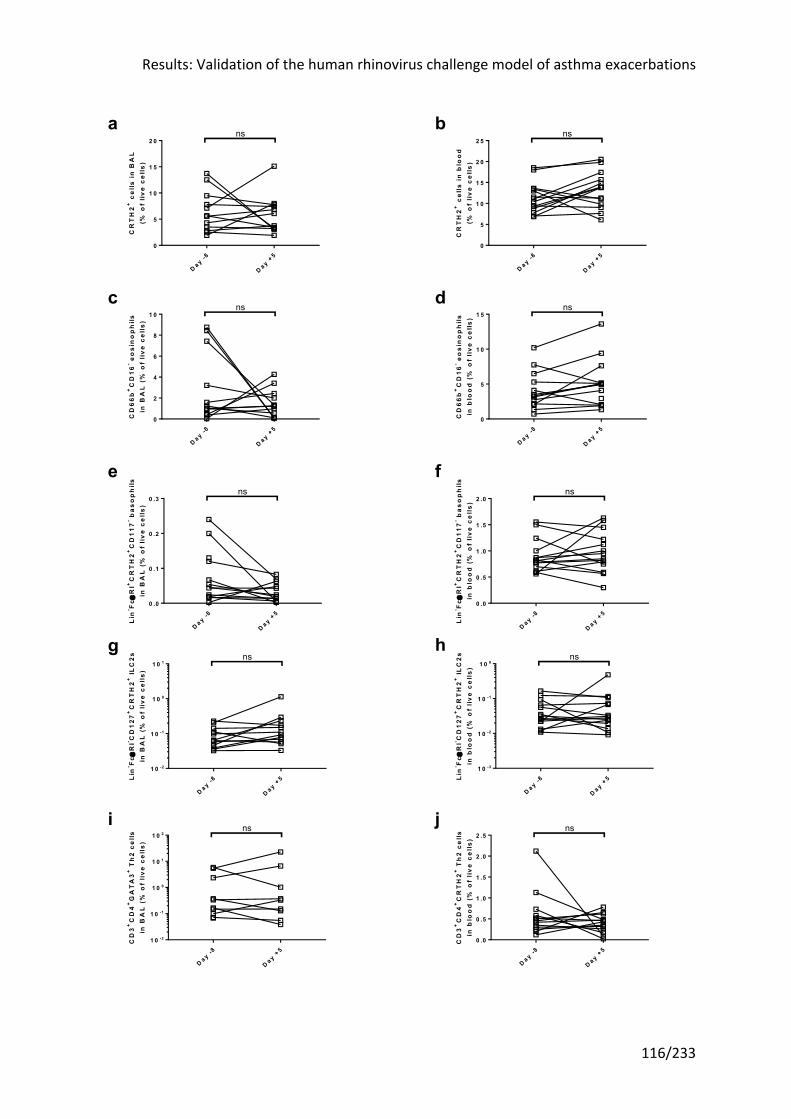
Results: Validation of the human rhinovirus challenge model of asthma exacerbations
116/233
D a y -8
D a y +5
0
5
1 0
1 5
2 0C
RT
H2
+ c
ell
s i
n B
AL
(% o
f li
ve
ce
lls
)ns
D a y -8
D a y +5
0
5
1 0
1 5
2 0
2 5
CR
TH
2+
ce
lls
in
blo
od
(% o
f li
ve
ce
lls
)
ns
D a y -8
D a y +5
0
2
4
6
8
1 0
CD
66
b+
CD
16
- eo
sin
op
hils
in B
AL
(%
of
liv
e c
ell
s)
ns
D a y -8
D a y +5
0
5
1 0
1 5
CD
66
b+
CD
16
- eo
sin
op
hils
in b
loo
d (
% o
f li
ve
ce
lls
)
ns
D a y -8
D a y +5
0 .0
0 .1
0 .2
0 .3
Lin
- Fce
RI+
CR
TH
2+
CD
11
7- b
as
op
hils
in B
AL
(%
of
liv
e c
ell
s)
ns
D a y -8
D a y +5
0 .0
0 .5
1 .0
1 .5
2 .0
Lin
- Fce
RI+
CR
TH
2+
CD
11
7- b
as
op
hils
in b
loo
d (
% o
f li
ve
ce
lls
)
ns
D a y -8
D a y +5
1 0 -2
1 0 -1
1 0 0
1 0 1
Lin
- Fce
RI- C
D1
27
+C
RT
H2
+IL
C2s
in B
AL
(%
of
liv
e c
ell
s)
ns
D a y -8
D a y +5
1 0 -3
1 0 -2
1 0 -1
1 0 0
Lin
- Fce
RI- C
D1
27
+C
RT
H2
+IL
C2s
in b
loo
d (
% o
f li
ve
ce
lls
)
ns
D a y -8
D a y +5
1 0 -2
1 0 -1
1 0 0
1 0 1
1 0 2ns
CD
3+
CD
4+
GA
TA
3+
Th
2 c
ells
in B
AL
(%
of
liv
e c
ell
s)
D a y -8
D a y +5
0 .0
0 .5
1 .0
1 .5
2 .0
2 .5
CD
3+
CD
4+
CR
TH
2+
Th
2 c
ells
in b
loo
d (
% o
f li
ve
ce
lls
)
ns
e
ba
ji
hg
dc
f
Results: Validation of the human rhinovirus challenge model of asthma exacerbations
117/233
Figure 3.20 The proportion of CRTH2+ cells and CRTH2+ eosinophils, basophils, ILC2s and Th2 cells did not change in the blood or airway lumen after RV-16 infection
Differential counts of CRTH2+ cells and relevant subpopulations before and during infection, shown as a percentage of live cells. (a-j) There were no statistically significant differences in any population during infection, specifically (a,b) CRTH2+ cells (c,d) eosinophils (e,f) basophils (g,h) ILC2s (I,j) Th2 cells, in BAL (a,c,e,g,i) or blood (b,d,f,h,j) samples. Statistical analysis was performed using Wilcoxon matched pairs signed rank test.
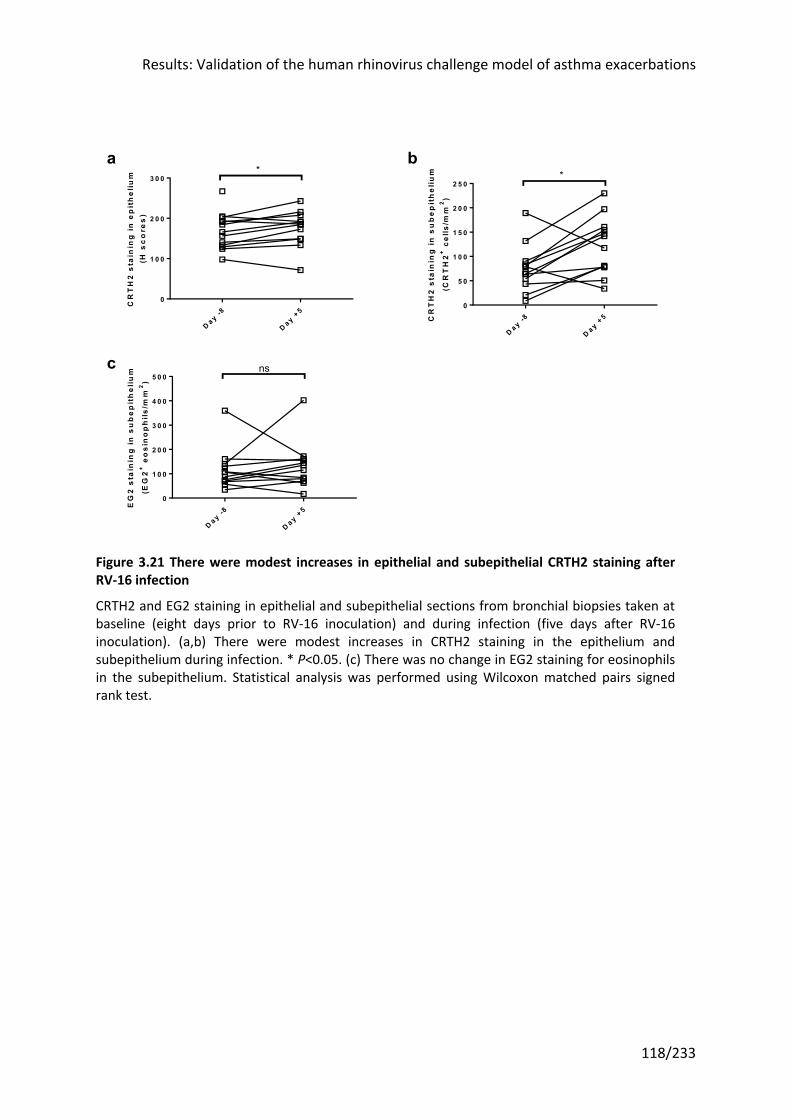
Results: Validation of the human rhinovirus challenge model of asthma exacerbations
118/233
Figure 3.21 There were modest increases in epithelial and subepithelial CRTH2 staining after RV-16 infection
CRTH2 and EG2 staining in epithelial and subepithelial sections from bronchial biopsies taken at baseline (eight days prior to RV-16 inoculation) and during infection (five days after RV-16 inoculation). (a,b) There were modest increases in CRTH2 staining in the epithelium and subepithelium during infection. * P<0.05. (c) There was no change in EG2 staining for eosinophils in the subepithelium. Statistical analysis was performed using Wilcoxon matched pairs signed rank test.
D a y -8
D a y +5
0
1 0 0
2 0 0
3 0 0
CR
TH
2 s
tain
ing
in
ep
ith
eliu
m(H
sc
ore
s)
*
D a y -8
D a y +5
0
5 0
1 0 0
1 5 0
2 0 0
2 5 0
CR
TH
2 s
tain
ing
in s
ub
ep
ith
eliu
m
(CR
TH
2+
cel
ls/m
m2
)
*
D a y -8
D a y +5
0
1 0 0
2 0 0
3 0 0
4 0 0
5 0 0
EG
2 s
tain
ing
in s
ub
ep
ith
eliu
m
(EG
2+
eo
sin
op
hils
/mm
2)
nsc
ba
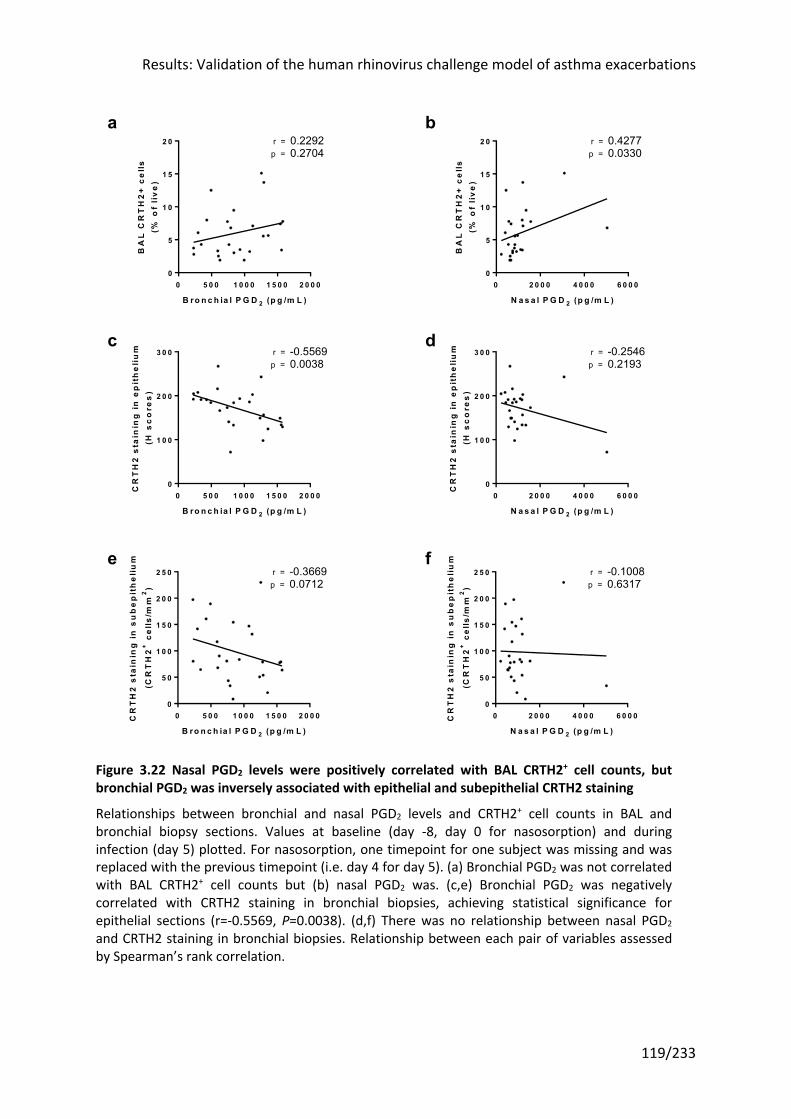
Results: Validation of the human rhinovirus challenge model of asthma exacerbations
119/233
Figure 3.22 Nasal PGD2 levels were positively correlated with BAL CRTH2+ cell counts, but bronchial PGD2 was inversely associated with epithelial and subepithelial CRTH2 staining
Relationships between bronchial and nasal PGD2 levels and CRTH2+ cell counts in BAL and bronchial biopsy sections. Values at baseline (day -8, day 0 for nasosorption) and during infection (day 5) plotted. For nasosorption, one timepoint for one subject was missing and was replaced with the previous timepoint (i.e. day 4 for day 5). (a) Bronchial PGD2 was not correlated with BAL CRTH2+ cell counts but (b) nasal PGD2 was. (c,e) Bronchial PGD2 was negatively correlated with CRTH2 staining in bronchial biopsies, achieving statistical significance for epithelial sections (r=-0.5569, P=0.0038). (d,f) There was no relationship between nasal PGD2 and CRTH2 staining in bronchial biopsies. Relationship between each pair of variables assessed by Spearman’s rank correlation.
0 5 0 0 1 0 0 0 1 5 0 0 2 0 0 00
5
1 0
1 5
2 0
B ro n c h ia l P G D 2 (p g /m L )
BA
L C
RT
H2
+ c
ell
s(%
of
liv
e)
0.2292p =r =
0.2704
0 2 0 0 0 4 0 0 0 6 0 0 00
5
1 0
1 5
2 0
N a s a l P G D 2 (p g /m L )
BA
L C
RT
H2
+ c
ell
s(%
of
liv
e)
0.4277p =r =
0.0330
0 5 0 0 1 0 0 0 1 5 0 0 2 0 0 00
1 0 0
2 0 0
3 0 0
B ro n c h ia l P G D 2 (p g /m L )
CR
TH
2 s
tain
ing
in
ep
ith
eli
um
(H s
co
res
)
-0.5569p =r =
0.0038
0 2 0 0 0 4 0 0 0 6 0 0 00
1 0 0
2 0 0
3 0 0
N a s a l P G D 2 (p g /m L )
CR
TH
2 s
tain
ing
in
ep
ith
eli
um
(H s
co
res
)
-0.2546p =r =
0.2193
0 5 0 0 1 0 0 0 1 5 0 0 2 0 0 00
5 0
1 0 0
1 5 0
2 0 0
2 5 0
B ro n c h ia l P G D 2 (p g /m L )
CR
TH
2 s
tain
ing
in
su
be
pit
he
liu
m
(CR
TH
2+
cel
ls/m
m2
)
-0.3669p =r =
0.0712
0 2 0 0 0 4 0 0 0 6 0 0 00
5 0
1 0 0
1 5 0
2 0 0
2 5 0
N a s a l P G D 2 (p g /m L )
CR
TH
2 s
tain
ing
in
su
be
pit
he
liu
m
(CR
TH
2+
cel
ls/m
m2
)
-0.1008p =r =
0.6317
fe
c d
a b
Results: Validation of the human rhinovirus challenge model of asthma exacerbations
120/233
3.3.11 Exhaled nitric oxide (FeNO) was increased during RV infection
To assess whether FeNO was induced by RV infection and whether it was a marker of type 2
inflammation, levels were measured at multiple timepoints throughout infection. FeNO
levels trended upwards following RV infection, but this was not statistically significant at any
timepoint (Figure 3.23). However the peak FeNO during infection (irrespective of timepoint)
was significantly higher than the baseline value (median at baseline 30ppb (IQR 21 - 56.25)
vs 51ppb (32.75 - 91.5) at peak; P=0.0005), with the caveat that the use of peak values may
have generated a spurious positive result.
There was no relationship between baseline FeNO level and any of total upper or lower
respiratory symptom scores, lung function, virus load area-under-the-curve (AUC) during
infection, or nasal IL-4, IL-5, IL-13 or PGD2 AUC levels, suggesting baseline FeNO does not
predict response to RV-16 (data not shown). However relationships between peak FeNO
levels and the same variables, although not statistically significant, showed a trend towards
a relationship with lung function and IL-4 and IL-5, but not IL-13 or PGD2 (Figure 3.24).
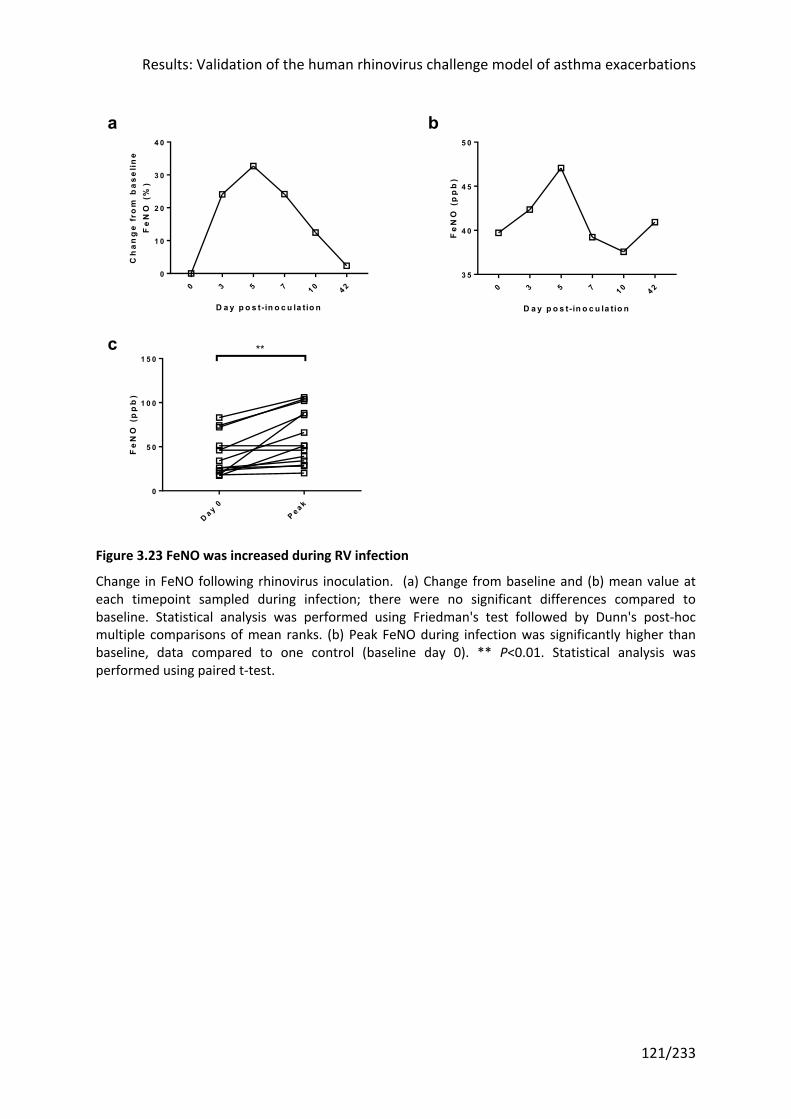
Results: Validation of the human rhinovirus challenge model of asthma exacerbations
121/233
Figure 3.23 FeNO was increased during RV infection
Change in FeNO following rhinovirus inoculation. (a) Change from baseline and (b) mean value at each timepoint sampled during infection; there were no significant differences compared to baseline. Statistical analysis was performed using Friedman's test followed by Dunn's post-hoc multiple comparisons of mean ranks. (b) Peak FeNO during infection was significantly higher than baseline, data compared to one control (baseline day 0). ** P<0.01. Statistical analysis was performed using paired t-test.
0 3 5 7 1 0 4 20
1 0
2 0
3 0
4 0
D a y p o s t- in o c u la tio n
Ch
an
ge
fro
m b
as
eli
ne
Fe
NO
(%
)
0 3 5 7 1 0 4 23 5
4 0
4 5
5 0
D a y p o s t- in o c u la tio n
Fe
NO
(p
pb
)
D a y 0P e a k
0
5 0
1 0 0
1 5 0
Fe
NO
(p
pb
)
**
ba
c
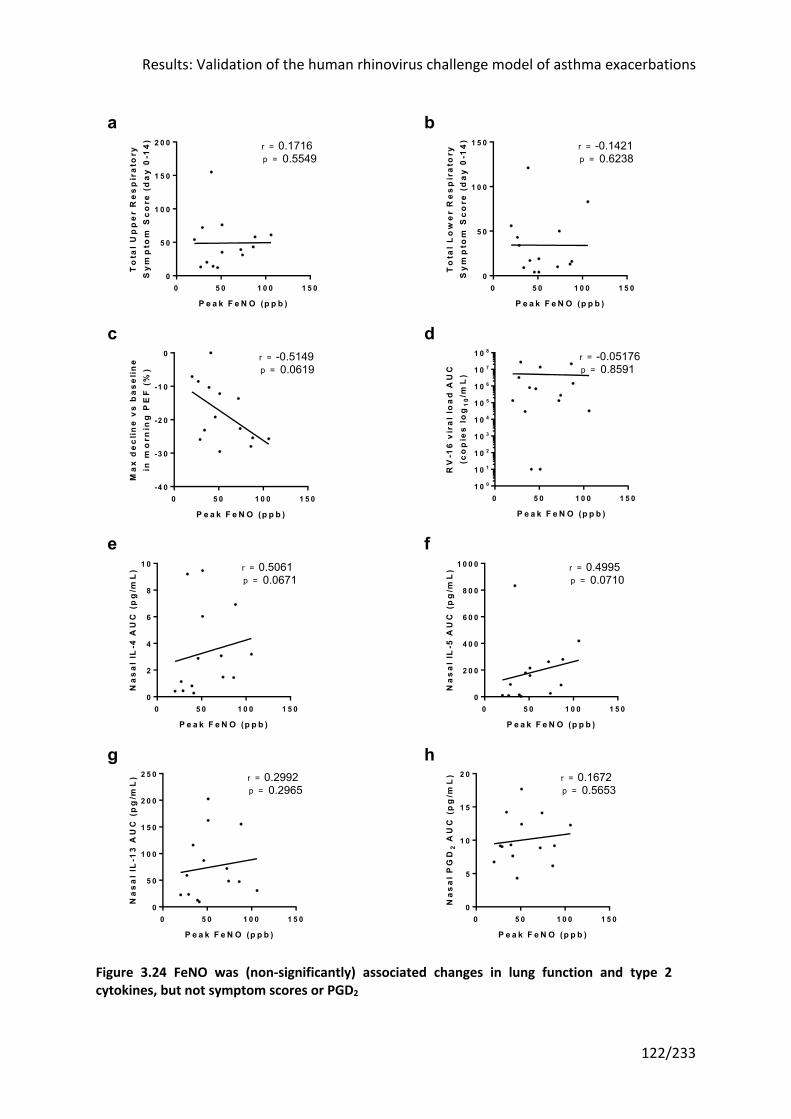
Results: Validation of the human rhinovirus challenge model of asthma exacerbations
122/233
Figure 3.24 FeNO was (non-significantly) associated changes in lung function and type 2 cytokines, but not symptom scores or PGD2
0 5 0 1 0 0 1 5 00
5 0
1 0 0
1 5 0
2 0 0
P e a k F e N O (p p b )
To
tal
Up
pe
r R
es
pir
ato
ryS
ym
pto
m S
co
re (
da
y 0
-14
) 0.17160.5549
r =p =
0 5 0 1 0 0 1 5 00
5 0
1 0 0
1 5 0
P e a k F e N O (p p b )
To
tal
Lo
we
r R
es
pir
ato
ryS
ym
pto
m S
co
re (
da
y 0
-14
) -0.14210.6238
r =p =
0 5 0 1 0 0 1 5 0-4 0
-3 0
-2 0
-1 0
0
P e a k F e N O (p p b )
Ma
x d
ec
line
vs
ba
se
lin
ein
mo
rnin
g P
EF
(%
)
-0.51490.0619
r =p =
0 5 0 1 0 0 1 5 01 0 0
1 0 1
1 0 2
1 0 3
1 0 4
1 0 5
1 0 6
1 0 7
1 0 8
P e a k F e N O (p p b )
RV
-16
vir
al
loa
d A
UC
(co
pie
s l
og
10
/mL
)
-0.051760.8591
r =p =
0 5 0 1 0 0 1 5 00
2
4
6
8
1 0
P e a k F e N O (p p b )
Na
sa
l IL
-4 A
UC
(p
g/m
L) 0.5061
0.0671r =p =
0 5 0 1 0 0 1 5 00
2 0 0
4 0 0
6 0 0
8 0 0
1 0 0 0
P e a k F e N O (p p b )
Na
sa
l IL
-5 A
UC
(p
g/m
L) 0.4995
0.0710r =p =
0 5 0 1 0 0 1 5 00
5 0
1 0 0
1 5 0
2 0 0
2 5 0
P e a k F e N O (p p b )
Na
sa
l IL
-13
AU
C (
pg
/mL
) 0.29920.2965
r =p =
0 5 0 1 0 0 1 5 00
5
1 0
1 5
2 0
P e a k F e N O (p p b )
Na
sa
l P
GD
2 A
UC
(p
g/m
L) 0.1672
0.5653r =p =
hg
b
dc
a
fe
Results: Validation of the human rhinovirus challenge model of asthma exacerbations
123/233
Correlations with peak FeNO during infection. There were no significant relationships with (a) upper respiratory symptom score (b) lower respiratory symptom score (c) change in morning PEF (d) virus load (e) nasal IL-4 AUC (f) nasal IL-5 AUC (g) nasal IL-13 AUC or (h) PGD2 AUC. There were trends with (c) change in PEF (r=-0.5149, P=0.0619), (e) nasal IL-4 AUC (r=0.5061, P=0.0671) and (f) nasal IL-5 AUC (r=0.4995, P=0.0710). Relationship between each pair of variables assessed by Spearman’s rank correlation.
Results: Validation of the human rhinovirus challenge model of asthma exacerbations
124/233
3.3.12 Baseline ACQ-6 predicted lower respiratory symptoms, whereas PC20, FeNO and skin prick testing predicted lung function decline
This study sought to replicate the results of a previous study on which the power calculation
was based45 by recruiting a similar population. Analyses of that study identified subjects
with worse asthma control (as defined by ACQ score) as experiencing the greatest RV-
induced pathology139; a similar observation was made regarding disease severity (defined by
required treatment intensity)241. As a result, to maximize statistical power and the likelihood
of seeing an effect, the study selected subjects based on asthma control, disease severity
and atopy (an inclusion criteria for all previous RV challenge studies in asthma in our group).
However clearly future studies would benefit from any additional insights that could be
gleaned at baseline that would predict outcomes. Moreover this might more broadly inform
risk factors for asthma exacerbations at a population level, which could help identify
subjects suitable for personalized therapies aimed at reducing exacerbations. To answer this
question, a series of correlations were undertaken which are shown in the matrix in Table
3.2. Baseline characteristics that are readily assessed in the clinic, and therefore of practical
use for clinical trial screening and in clinical practice, were chosen for analysis: ACQ-6, skin
prick test results, airway hyperresponsiveness, FeNO, and blood eosinophil count. Results
from assays measuring soluble mediators and inflammatory cell counts were not used.
Baseline was taken as the closest reading prior to inoculation on day 0.
ACQ-6 was the only measure at baseline that corresponded to lower respiratory symptoms,
with none associated with upper respiratory symptoms or peak viral load. However
baseline airway hyperresponsiveness (PC20), FeNO and the number of positive skin prick
tests at screening were all associated with falls in lung function (either PEF, FEV1, or both).
Oddly ACQ-6 showed a significant positive correlation with the maximal fall in PEF, i.e. a
higher symptom burden was correlated to a smaller decline in PEF. However this may be a
statistical artefact arising from the relatively small sample size (n=14) and the number of
tests undertaken. No correction was made for multiple testing in this instance as these
analyses were considered exploratory.
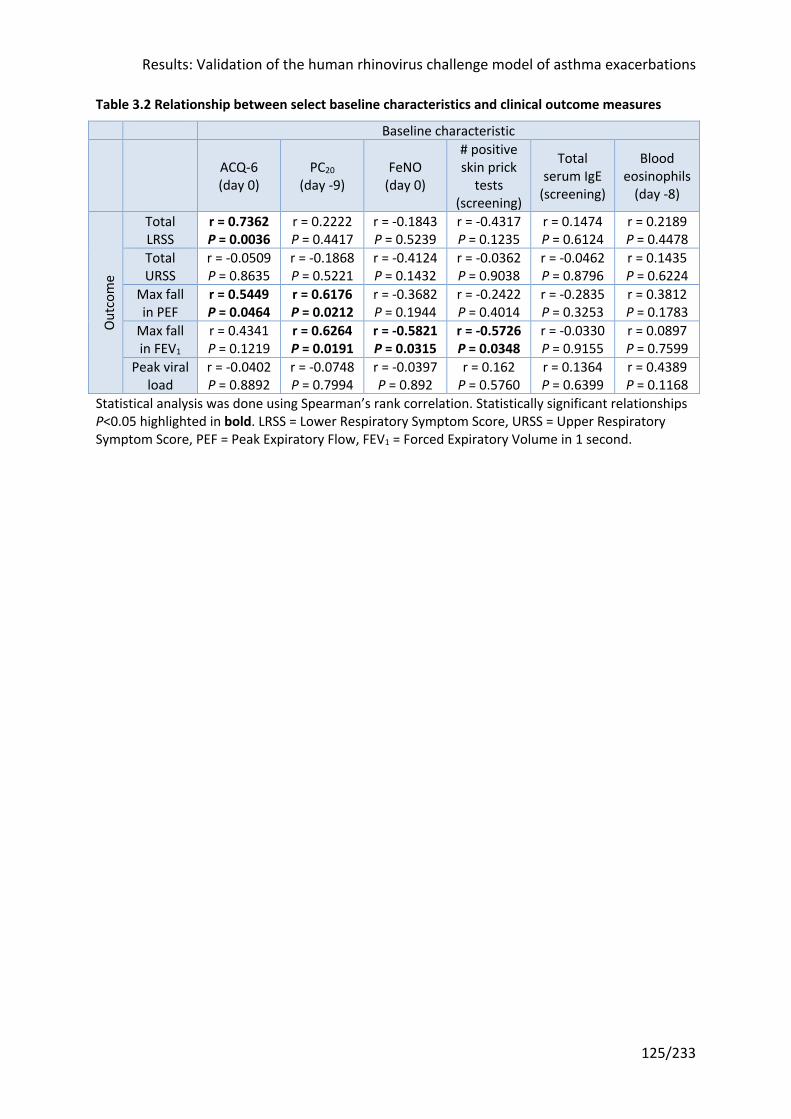
Results: Validation of the human rhinovirus challenge model of asthma exacerbations
125/233
Table 3.2 Relationship between select baseline characteristics and clinical outcome measures
Baseline characteristic
ACQ-6 (day 0)
PC20 (day -9)
FeNO (day 0)
# positive skin prick
tests (screening)
Total serum IgE
(screening)
Blood eosinophils
(day -8)
Out
com
e
Total LRSS
r = 0.7362 P = 0.0036
r = 0.2222 P = 0.4417
r = -0.1843 P = 0.5239
r = -0.4317 P = 0.1235
r = 0.1474 P = 0.6124
r = 0.2189 P = 0.4478
Total URSS
r = -0.0509 P = 0.8635
r = -0.1868 P = 0.5221
r = -0.4124 P = 0.1432
r = -0.0362 P = 0.9038
r = -0.0462 P = 0.8796
r = 0.1435 P = 0.6224
Max fall in PEF
r = 0.5449 P = 0.0464
r = 0.6176 P = 0.0212
r = -0.3682 P = 0.1944
r = -0.2422 P = 0.4014
r = -0.2835 P = 0.3253
r = 0.3812 P = 0.1783
Max fall in FEV1
r = 0.4341 P = 0.1219
r = 0.6264 P = 0.0191
r = -0.5821 P = 0.0315
r = -0.5726 P = 0.0348
r = -0.0330 P = 0.9155
r = 0.0897 P = 0.7599
Peak viral load
r = -0.0402 P = 0.8892
r = -0.0748 P = 0.7994
r = -0.0397 P = 0.892
r = 0.162 P = 0.5760
r = 0.1364 P = 0.6399
r = 0.4389 P = 0.1168
Statistical analysis was done using Spearman’s rank correlation. Statistically significant relationships P<0.05 highlighted in bold. LRSS = Lower Respiratory Symptom Score, URSS = Upper Respiratory Symptom Score, PEF = Peak Expiratory Flow, FEV1 = Forced Expiratory Volume in 1 second.
Results: Validation of the human rhinovirus challenge model of asthma exacerbations
126/233
3.4 Discussion
3.4.1 RV challenge in the asthma subjects recruited reproduced most of the asthma pathology in earlier studies
The first aim of this study was to demonstrate that the RV challenge model of human
asthma exacerbations could be reliably reproduced. The methods chosen were those that
had been developed and effectively employed by Jackson, Dhariwal and colleagues in our
group: the same dose of inoculum (lower than in earlier studies to more closely mimic a
naturally-occurring infection), recruitment criteria (moderate asthma requiring ICS
maintenance, with ongoing symptoms defined as an ACQ >0.75), and assessment and
sampling tools. In addition the author looked to extend the model to capture outcomes
salient to the study of CRTH2 antagonism: counts of CRTH2+ cells and FeNO.
Aspects of the study were consistent with previous reports, including upper respiratory
symptom scores, virus load, and induction of soluble inflammatory mediators. The screen
success rate was comparable with earlier studies (44 randomized out of 781 assessed, vs 49
out of 743 across Dhariwal et al’s nasal allergen244 and RV challenge167,168 studies). Increases
in upper respiratory symptoms mirrored those seen previously, although the peak upper
respiratory symptom score was slightly lower (6.5 vs almost 8) and later (day 5 vs day 4)
than in earlier studies45,167, coinciding with a bronchoscopy. 30/38 (79%) asthma volunteers
inoculated were successfully infected, compared to 28/32 (88%) and 11/15 (73%) in the
studies in our group led by Jackson45 and Dhariwal167 respectively.
Whilst rhinovirus was only detected in a single BAL sample, a sampling technique with a high
degree of dilution, rhinovirus was detected in over half of sputum samples, consistent with
lower airways involvement. The choice of day 5 post-inoculation as the bronchoscopic
sampling timepoint, rather than day 428,45 in the Message and Jackson studies in a which a
larger proportion of BAL samples were positive for rhinovirus, may also have affected the
result. Previous studies have provided direct evidence that rhinoviruses infect the lower
airways, with the detection of RV-16 by in situ hybridization and PCR on bronchial biopsies
from five out of 10 experimentally infected subjects245, findings confirmed in a later
study246.
Results: Validation of the human rhinovirus challenge model of asthma exacerbations
127/233
Virus copies in nasal lavage were significantly higher than baseline as expected (Figure 3.7)
and correlated with upper respiratory symptoms (Figure 3.8). The peak was lower than
previous studies (median 8.1x10⁴ (1 x10⁵ - 4.8x10⁵) vs 1.68x10⁶ (1.6x10⁴ - 1.3x10⁷)45 and
5.8x10⁶ (2.8x10⁵ 1.8x10⁷)167) but may at least partly be due to changes in the sampling
methodology: the use of nasal olives, either washable or disposable, is no longer permitted
under new infection control regulations at the hospital. A high degree of variability was seen
in the infection kinetics for different subjects, with peak viral loads as early as day 2 and late
as day 10 in one subject (Figure 3.7b). This supported the use of peak values, rather than
arbitrarily chosen timepoints, although when a single baseline value is compared with the
peak value of multiple measures, one would expect an increase.
IL-5 was induced following RV-16 infection in samples of nasal airway lining fluid with trends
in IL-4 and IL-13 (Figure 3.9), consistent with the type 2 inflammation induced by nasal
allergen challenge in sensitised individuals173,174, albeit of a smaller magnitude. These
increases were not seen in bronchosorption samples of lower airway lining fluid from a
single timepoint, day 5 post-infection (Figure 3.10). The peak timepoint for the nasal
samples was highly variable, and it is likely that the same applies to the lower airways,
particularly given the high degree of correlation between nasosorption and bronchosorption
samples (Figure 3.11). Thus the lack of significant cytokine induction in the bronchosorption
samples may be entirely an artefact arising from the timing of the single infection sample.
Nasal levels of IL-4, IL-5 and IL-13 were all inversely related to changes in lung function, in
keeping with earlier reports of the clinical relevance of these cytokines45.
3.4.2 Reductions in lung function during RV infection were muted compared to previous
Despite adopting similar methodology, not all the previous findings were replicated. Unlike
previous RV challenge studies in our group, the decline in lung function was not statistically
significant at any timepoint, although the maximal fall was significant and at a mean of -18%
and -15% versus baseline for morning PEF and FEV1 respectively, comparable to previous
studies (Figure 3.4). Those studies found a relationship between symptoms and lung
function which was not present in the current trial (Figure 3.5), which may reflect the
varying scale of lung function changes produced.
Results: Validation of the human rhinovirus challenge model of asthma exacerbations
128/233
Whilst most RV challenge experiments have found a significant drop in lung function, this is
by no means universal44,83,135,138,141,142,150,151, including one in subjects with moderate
asthma138. Several factors are likely to be at play, including differences in methodology,
asthma control, disease severity, and variable concomitant use of (permitted)
bronchodilators. Many of the earlier RV challenge studies relied on lung function measured
in the clinic, often at variable times of day, whereas more recently subjects have been asked
to take readings at the same time in the morning and before their bronchodilator(s), the
assessment method adopted here.
Asthma control correlated with falls in lung function in a follow up analysis of the Jackson
study139. The subjects in this study were better controlled (mean ACQ-6 at baseline = 1.20)
that those with moderate asthma in the Jackson study (1.38)45 or the asthma subjects
infected by Dhariwal et al (1.59)167. Greater disease severity, as defined by treatment
required for maintenance, is also associated with larger drops in lung function after RV
infection241. Whilst this study, Jackson et al45 and Dhariwal et al167 all enrolled subjects with
moderate asthma requiring ICS, the median dose prescribed was lower in this study (mean
357mcg beclometasone dipropionate (bdp) equivalent ICS a day, vs 427mcg bdp/day and
873mcg bdp/day respectively). ICS treatment is thought to be protective against RV-induced
pathology, and whilst the subjects in this study were on a lower dose, 13/28 asthma
subjects analysed by Jackson et al were not on ICS treatment at all and compliance was not
assessed in the remaining 1545, or in the 11 subjects in the Dhariwal study167. The
ClinicalTrials.gov registry entry of another RV challenge study in 23 subjects on low-dose ICS
maintenance therapy (bdp equivalent ≤500mcg/day) found a mean maximal drop in FEV1 of
-6.838% (95% CI -9.315 to -4.835) versus baseline, comparable to this study
(ClinicalTrials.gov identifier NCT01866306247).
Short acting bronchodilator use was permitted in all these studies but not measured.
Significantly increased use could confound spirometry. Nor was there any record of the
timing of lung function readings in relation to regular inhalers, to confirm that they were
pre-bronchodilator. Long acting β2 agonists (LABA) were also allowed in all of the studies in
moderate asthma except NCT01866306247. In the current trial, six of the 14 successfully
infected subjects in the placebo group were prescribed LABAs. LABAs have known effects on
Results: Validation of the human rhinovirus challenge model of asthma exacerbations
129/233
lung function and symptoms in addition to ICS248, thus their use may have attenuated the
effect of RV infection on lung function.
Sample size and allergen exposure could also have affected the likelihood of finding a
change in lung function. There is a high degree of inter-subject variability in lung function
which, given the relatively modest effect size expected (up to 20% reduction), would
indicate that a large sample would be required to see a significant difference. The study by
Jackson et al had the largest sample size (n=28)45, although Dhariwal et al observed a drop
in lung function with just 11 subjects167. Differences in allergen exposure, arising from a
different mix of subjects allergic to perennial (e.g. house dust mite) versus seasonal
allergens (e.g. grass or tree pollens), might be important given observational data71,72, even
if a single dual allergen/virus challenge study found no synergy between the challenge
agents137.
There was an issue with the home spirometers used in this study, with the Piko-1 devices
being replaced with Asma-1 spirometers for the last few subjects. Whether some of the
earlier readings with the Piko-1 were less accurate is unclear, although the variance of
readings taken with the Piko-1 and Asma-1 were similar.
Whilst the study diaries in this trial were largely complete, it is possible that the data quality,
specifically the proportion that was fabricated, may have differed from previous studies. In a
study of 26 subjects with moderate to severe asthma who were asked to record PEF twice
daily, seven not only almost never did from the outset (<5% of the time) but were also
found to have fabricated entries in their paper diaries, as evidenced by the memory of the
electronic PEF meter supplied249. Electronic tools with twice daily reminders might have
helped mitigate against this. In addition it is known that diary completeness diminishes over
time; 12 months into the study cited, across all subjects only a third of readings were taken.
Whilst this study was shorter at nine weeks, the requirement for a run-in period on the drug
meant it was two weeks longer than previous RV challenge studies. Given that ultimately
only morning PEF and FEV1 readings from 14 days during the infection (day 0 to day 14)
were used, rationing the number of readings required of subjects might have improved
completeness and data quality.
Results: Validation of the human rhinovirus challenge model of asthma exacerbations
130/233
3.4.3 PGD2 was not induced by RV infection, but levels still correlated with type 2 cytokines
Importantly for this trial, PGD2 was not induced in upper or lower airways samples (Figure
3.13), unlike the only previous RV challenge study to have measured this, in nasal samples
only61. That study had a larger sample size (n=28, vs n=14 in the placebo group shown
above), which could account for the difference. It also included participants who were ICS-
naïve; ICS treatment might plausibly attenuate virally-induced increases in PGD2. However
there were positive correlations between nasal PGD2 and nasal IL-4 and IL-13 levels, and a
trend with nasal IL-5 (Figure 3.14). This indicates CRTH2 antagonism may nonetheless be
efficacious.
The previously observed positive correlation between RV-16 virus load and exacerbation
severity, in terms of symptoms and lung function decline45, was not replicated in the
present study, which only found a relationship with upper respiratory symptoms (Figure
3.8). Earlier reports of a relationship between virus load and clinical outcomes may not be
robust, as another RV challenge study in our group also failed to find a relationship between
virus load and lung function changes167, although again this may be a function of sample size
as the study showing a relationship had 28 subjects compared to 11 in the other study and
14 in the placebo arm of the current trial.
Similarly correlations between type 2 cytokines or PGD2 and symptoms were absent,
although these cytokines were negatively correlated with changes in lung function (Figure
3.12 and Figure 3.15). This may also be a function of limited numbers, as Jackson et al saw
relationships between type 2 cytokines and symptoms45, and PGD2 and symptoms61.
However whilst characteristic symptoms and lung function demonstrating variable airflow
obstruction are both considered necessary to make a diagnosis of asthma, and a
deterioration in both defines an exacerbation1, it is well recognized that these represent
distinct features of asthma250 and that the relationship between them is weak at best251,252.
It is therefore possible that type 2 cytokines correlate with one and not the other. This does
not lessen the importance of type 2 cytokines in the pathophysiology, as both symptoms
and lung function define asthma control. If type 2 cytokines are in fact related to lung
function and only to a lesser degree to symptoms (or not at all), arguably the primary
Results: Validation of the human rhinovirus challenge model of asthma exacerbations
131/233
outcome of trials assessing interventions directed at type 2 inflammation should be
measures of lung function rather than symptoms.
3.4.4 CRTH2+ cell counts in the lower airways were little changed by RV infection
There were two principal novel extensions to the RV challenge paradigm in asthma that has
been previously used in our group, namely enumerating CRTH2+ cells in the airways (lumen
and airway wall), and incorporating FeNO into the routine clinical assessments as a non-
invasive measure of lower airways inflammation.
This study is the first to have counted total CRTH2+ cells during RV infection in asthma in the
blood and the airways (BAL and bronchial biopsies). There was a modest increase in CRTH2
staining in bronchial biopsies, in both epithelial and subepithelial sections (Figure 3.21), but
no change in blood or BAL samples from the airway lumen (Figure 3.20). This may have been
limited by the single timepoint sampled, analogous to the bronchosorption samples.
Nonetheless it suggests limited scope for a CRTH2 antagonist to reduce airway
inflammation.
Despite the lack of recruitment to the airway lumen, nasal PGD2 levels correlated with
CRTH2+ cells in the BAL, if not CRTH2 staining in bronchial biopsies (Figure 3.22). Contrary to
the hypothesis, bronchial PGD2 was inversely correlated with epithelial and subepithelial
CRTH2 staining. This could reflect transepithelial migration of CRTH2+ cells on PGD2-CRTH2
receptor binding, or may be a spurious relationship consequent upon the number of tests
performed. If not, then CRTH2 antagonism has had the opposite effect to that predicted or
desired.
There are many potential explanations, aside from sampling artefact, why CRTH2+ cell
numbers did not increase in the airway lumen or by more in the bronchial biopsies. For one,
cells expressing the CRTH2 receptor include various different subpopulations (e.g.
eosinophils, basophils, Th2 cells, etc), each of which bear many other chemotactic receptors
that respond to different chemotactic signals (e.g. eotaxin and its receptor CCR3 on CRTH2+
eosinophils). The relative importance and contribution of PGD2-CRTH2 signalling in the
context of all these other signals is unknown.
Results: Validation of the human rhinovirus challenge model of asthma exacerbations
132/233
Secondly, it is possible that the lack of induction of PGD2 in lower airways sampling
accurately represented events in the lower airways, rather than the limitations of subject
numbers and/or infrequent lower airways sampling. The lack of recruitment of CRTH2+ cells
to the lungs could be a reflection of the absence of a rise in PGD2 in the lower airways.
Third, the effect of RV challenge may also have been blunted by ICS treatment. It is long
established the ICS reduce eosinophils, T cells and mast cells in bronchial biopsies253, and
eosinophils and mast cells in BAL254, including attenuating airway eosinophilia after allergen
challenge255. In a previous RV challenge study, ICS-treated subjects with asthma had
numerically lower BAL eosinophil and lymphocyte cell differentials following RV challenge
than ICS naïve subjects, although this did not reach statistical significance45. Other RV
challenge studies in which an increase in BAL eosinophils was reported were conducted in
ICS-naïve asthma subjects28,159. In nasal polyps, systemic corticosteroid treatment is
associated with a 50% reduction in ILC2s256. Given all the subjects in the current study were
prescribed ICS, the potential for a reduction in the remaining ‘steroid-resistant’
inflammatory cells may have been limited.
The proportion of each subpopulation of cells in the BAL was in keeping with previous
reports. Eosinophils represented a median 1.02% (baseline) to 1.24% (day 5 post
inoculation) of total live BAL cells, comparable to those seen previously in this model in
cytospins prepared from BAL with a median of 0.5% (baseline) and 1.2% (day 4 post
inoculation)45. Basophils make up 0-0.49% of BAL cells in subjects with mild intermittent
asthma257, again similar to the results here (0-0.24%). ILC2s have been reported at 0-0.4% of
lymphoid cells in the BAL of children with severe asthma258; expressed as a proportion of
lymphocytes (rather than total live cells), there were a median of 0.2% ILC2s in the BAL. In
this study Th2 cells were defined by intracellular staining for the master Th2 transcription
factor GATA3 amongst CD3+CD4+ T helper cells. As a proportion of CD3+CD4+ Th cells, a
median of 7% stained positively for GATA3, of which roughly half were also negatively
stained for the Th1 transcription factor T-bet (data not shown). Previously, 2% of CD3+CD4+
(Th) cells in the BAL of asthma subjects have stained positively for intracellular IL-4,
suggesting they are Th2 cells259, which again is consistent with the numbers seen above.
Unfortunately the staining panel did not capture CD8+ type 2 T cytotoxic (Tc) cells, some of
Results: Validation of the human rhinovirus challenge model of asthma exacerbations
133/233
which also express CRTH2260 and which have recently been postulated to be important in
severe eosinophilic asthma261.
3.4.5 Baseline FeNO did not predict outcomes, but levels during infection may be a marker of underlying inflammation
Three previous studies have measured FeNO during RV challenge in asthma, none of which
included ICS-treated subjects137,145,159. One found no increase after RV-16 infection137,
another a significant but very small increase (4.2ppb) in subjects who had a low median
baseline FeNO (1.9ppb)145. The only previous study using commercially available equipment
(NIOX) found FeNO increased in subjects with asthma from 58.7ppb at baseline to 72.2ppb
on day 6 after infection, compared to values of 17.5ppb and 16.5ppb respectively in RV-16-
infected healthy controls159.
Here, in subjects on ICS-treatment, there was a trend towards increased in FeNO, not
reaching significant at any individual timepoint, despite the FeNO-lowering effects of ICS238.
Taking peak data, FeNO rose from a median 30ppb at baseline to 51ppb (Figure 3.23).
FeNO levels at baseline were not correlated with cumulative symptom scores, maximal fall
in lung function, RV-16 AUC or type 2 cytokine AUC levels (Table 3.2). This suggests FeNO
screening may not be of utility in future screening of subjects for RV challenge studies or
potentially of subjects suitable for treatments to prevent naturally-occurring virus-induced
exacerbations, such as anti-IgE109. Peak FeNO levels however, although not statistically
significant, showed trends towards relationships with lung function and type 2 cytokine
levels (but not symptom scores or virus load), consistent with FeNO being a marker of
underlying airways inflammation (Figure 3.24).
Experimental infection studies provide a unique opportunity to sample volunteers at
baseline and known intervals after inoculation. As such there is the potential to glean
information about which factors at baseline predict worse outcomes following infection.
The only previous attempt to systematically assess this has been carried out by a group
undertaking commercial RV challenge studies in asthma, but their population was small
(n=11) and only contained subjects with mild asthma thus the results are difficult to
interpret262. They also included protein biomarkers that are not readily available in clinic.
Results: Validation of the human rhinovirus challenge model of asthma exacerbations
134/233
The analyses here considered factors that are in common clinical use and easily obtained. Of
these, only ACQ-6 predicted lower respiratory symptoms during infection, mirroring
previous reports139. The ACQ-6 is a symptom score and both this and the lower respiratory
symptom score are therefore subjective. The correlation between the two may reflect how
each individual interprets and reports their symptoms, at baseline or during exacerbations.
Baseline PC20, FeNO, and the number of positive skin prick tests at screening predicted
maximal falls in lung function during infection, with the caveat that changes in lung function
tended to be relatively modest in this study. PC20 is a measure of airway
hyperresponsiveness to a bronchoconstricting challenge, and it seems logical that another
challenge stimulus, in this case RV infection, would produce similar effects. FeNO reflects
the degree of airway inflammation and therefore adequacy of treatment and asthma
control. Other authors have noted that baseline FeNO is predictive of future exacerbations
in the naturally occurring setting220. The association with skin prick test positivity is
consistent with reports that allergen sensitization and exposure are independent risk factors
for naturally occurring exacerbations71,72. There was no relationship between lung function
and baseline ACQ-6 as seen by Jackson et al139, but subjects in that study had a broader
range of ACQ scores as this did not form part of the inclusion criteria.
None of the factors assessed were associated with upper respiratory symptoms or peak viral
load, which are correlated with each other. A previous rhinovirus challenge study found
subjects with higher baseline ACQ score had higher peak viral loads167, but the number in
this study were small (n=11).
Blood eosinophils are not related to symptoms or naturally occurring exacerbations in mild
asthma263, consistent with the lack of association with clinical changes following RV
challenge in this study. They therefore may not be the best criteria for selecting subjects for
enrolment into trials whose primary endpoint is exacerbations. This may be due to a
confounding effect of ICS treatment, as ICS use is known to suppress blood eosinophil
counts in stable asthma264.
Results: Validation of the human rhinovirus challenge model of asthma exacerbations
135/233
3.5 Summary of key points • The current study successfully reproduced the majority of the features of the RV
challenge model of human asthma exacerbations
• However the changes were more muted, particularly in lower respiratory symptoms and
lung function; as a result, the parallel clinical trial may lack power to detect any effect of
an intervention (in this case, a CRTH2 antagonist)
• Importantly for the clinical trial, PGD2, the natural ligand of the CRTH2 receptor, was not
induced by RV infection in the upper or lower airways
• However nasal PGD2 levels were positively correlated with type 2 cytokines, reaching
statistical significance for IL-4 and IL-13, but not directly related to symptoms or lung
function; if CRTH2 antagonism reduces type 2 cytokines, it may be yet be effective as
drugs targeting these cytokines have proven benefits46,47
• Relatively low subject numbers may have limited the ability to demonstrate statistically
significant changes in lower respiratory symptoms, lung function and/or relationships
between soluble mediator levels and symptoms or lung function
• There was a modest increase in CRTH2+ cells in some airways compartments, but this
was inversely associated with levels of PGD2 in the lower airways
• FeNO was a useful non-invasive correlate of airways inflammation, but baseline FeNO
did not predict outcome after RV challenge
• ACQ-6 was the only measure at baseline that predicted lower respiratory symptoms
during infection, itself a symptom score. However the number of positive skin prick
tests, airway hyperresponsiveness and FeNO at baseline were associated with maximal
falls in lung function. None of the measures predicted upper respiratory symptoms or
peak viral load.
Results: Effect of CRTH2 blockade on clinical response to rhinovirus challenge in asthma
136/233
4 Results: Effect of CRTH2 blockade on clinical response to rhinovirus challenge in asthma
4.1 Introduction This chapter describes the results of the randomized controlled trial of OC459 in terms of
the clinical endpoints, specifically symptom scores, lung function, airway
hyperresponsiveness and FeNO. In addition, to assess whether a relatively large placebo
effect (e.g. due to increased compliance with maintenance therapy) could have confounded
the results, changes in outcome measures during the three week run in period were also
analysed.
As set out in the introduction, there is a strong rationale for using the RV challenge model to
study a novel therapy in asthma. Despite this, RV challenge has been infrequently employed
in phase 2 clinical trials in asthma, most likely due to a lack of expertise and experience of
experimentally infecting subjects with asthma. Only two previous examples of phase 2
clinical trials conducted in the context of RV challenge had been completed and published at
the outset of this study149,158. Neither found a significant effect of the intervention, ICS or
montelukast, compared to placebo on most outcome measures in a cohort of ICS-naïve
subjects with mild asthma. It should be noted that RV challenge had only a limited effect on
asthma pathology in these subjects with mild disease. Between the publication of those
clinical trials in RV challenge and the start of the current one, other studies demonstrated
that RV challenge is safe in ICS-treated subjects with moderate asthma and moreover elicits
greater asthma pathology, particularly in those with ongoing symptoms45,138,139. The current
trial therefore enrolled subjects with moderate, partially controlled asthma.
A CRTH2 antagonist is hypothesized to reduce the number of CRTH2+ cells in the lungs
(including eosinophils, Th2 cells and ILC2s) and prevent their activation with the subsequent
release of the type 2 cytokines IL-4, IL-5 and IL-13. CRTH2+ cell numbers have not been
previously measured in asthma exacerbations, although sputum eosinophils and type 2
cytokines have been shown to increase and are correlated with lung function and symptoms
after RV infection in asthma, suggesting clinical relevance45. An agent that reduced type 2
cytokines would therefore be expected to improve the RV infection-induced changes in lung
Results: Effect of CRTH2 blockade on clinical response to rhinovirus challenge in asthma
137/233
function and symptoms. Of course the previously documented relationship between
eosinophils, type 2 cytokines, lung function and symptoms is a correlation and does not
confer causation. In the event of no effect on lung function or symptoms, as in the earlier
studies of ICS and montelukast, measuring CRTH2+ cell counts and airway cytokine levels
(results reported in section 5.3) will provide a mechanistic analysis that might further inform
the relationship to clinical measures.
As discussed in the introduction to chapter 3, FeNO is a non-invasive and easily obtained
measurement that is proposed to indirectly measure type 2 inflammation. Levels may
therefore indicate the response to RV infection and/or CRTH2 antagonism. Baseline FeNO
levels have been shown to predict exacerbation reduction with anti-IgE treatment239 and
anti-IL-13 treatment235, and drugs targeting type 2 inflammation also reduce FeNO (e.g.
dupilumab, targeting the IL-4 receptor α subunit47, and tezepelumab, targeting TSLP67).
4.2 Hypothesis and aims The overall aim was to assess whether a CRTH2 antagonist, OC459, was effective in
attenuating the response to RV challenge in asthma.
Specific hypotheses:
i) That the placebo and OC459 groups were evenly matched
In addition that following rhinovirus infection in asthma, CRTH2 blockade (with OC459)
compared to placebo leads to
ii) relatively fewer lower respiratory symptoms
iii) a smaller decline in lung function
iv) less hyper-reactive airways, as measured by bronchial provocation challenge
v) a smaller increase in FeNO
4.3 Results: Clinical effect of CRTH2 blockade in stable asthma
4.3.1 Baseline demographics and clinical characteristics
The 30 subjects successfully infected with RV were randomly assigned to placebo (n=14) and
OC459 (n=16) in blocks of four. The groups were matched for age, sex, BMI, age at and time
since diagnosis, treatment (ICS dose, LABA use), asthma control (ACQ-6), lung function
(FEV1), airway hyperresponsiveness (PC20), and markers of type 2 inflammation (FeNO,
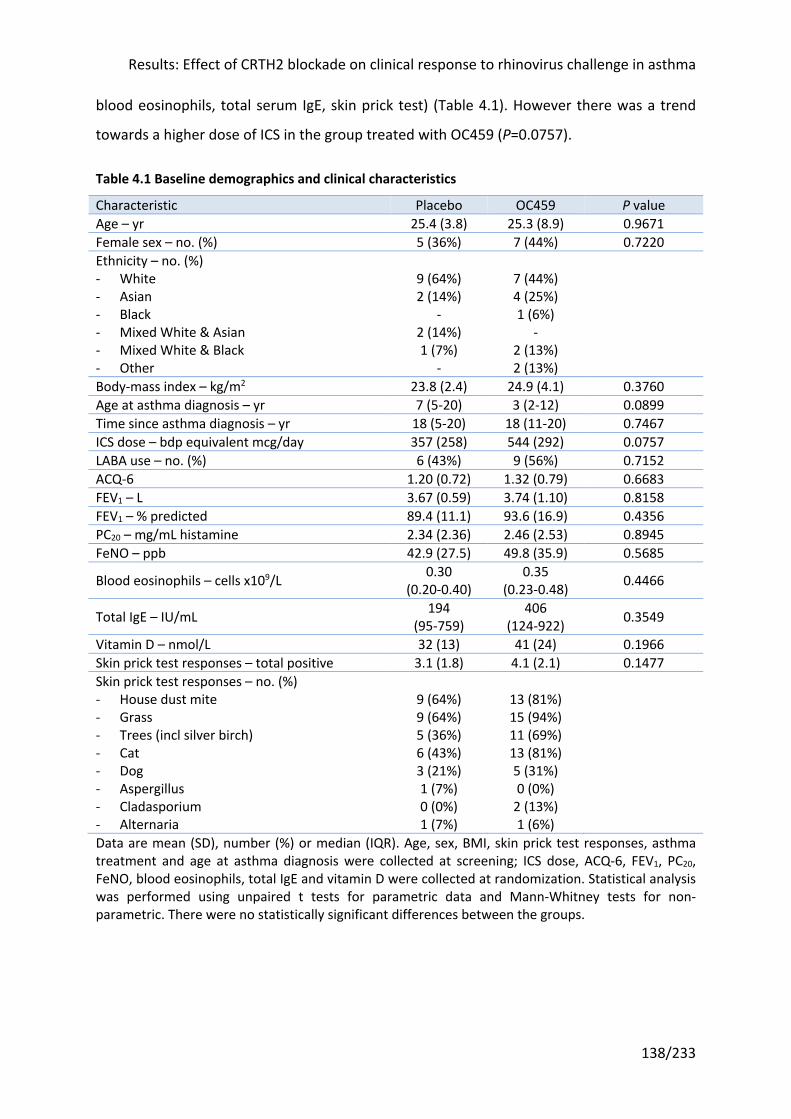
Results: Effect of CRTH2 blockade on clinical response to rhinovirus challenge in asthma
138/233
blood eosinophils, total serum IgE, skin prick test) (Table 4.1). However there was a trend
towards a higher dose of ICS in the group treated with OC459 (P=0.0757).
Table 4.1 Baseline demographics and clinical characteristics
Characteristic Placebo OC459 P value Age – yr 25.4 (3.8) 25.3 (8.9) 0.9671 Female sex – no. (%) 5 (36%) 7 (44%) 0.7220 Ethnicity – no. (%) - White - Asian - Black - Mixed White & Asian - Mixed White & Black - Other
9 (64%) 2 (14%)
- 2 (14%) 1 (7%)
-
7 (44%) 4 (25%) 1 (6%)
- 2 (13%) 2 (13%)
Body-mass index – kg/m2 23.8 (2.4) 24.9 (4.1) 0.3760 Age at asthma diagnosis – yr 7 (5-20) 3 (2-12) 0.0899 Time since asthma diagnosis – yr 18 (5-20) 18 (11-20) 0.7467 ICS dose – bdp equivalent mcg/day 357 (258) 544 (292) 0.0757 LABA use – no. (%) 6 (43%) 9 (56%) 0.7152 ACQ-6 1.20 (0.72) 1.32 (0.79) 0.6683 FEV1 – L 3.67 (0.59) 3.74 (1.10) 0.8158 FEV1 – % predicted 89.4 (11.1) 93.6 (16.9) 0.4356 PC20 – mg/mL histamine 2.34 (2.36) 2.46 (2.53) 0.8945 FeNO – ppb 42.9 (27.5) 49.8 (35.9) 0.5685
Blood eosinophils – cells x109/L 0.30 (0.20-0.40)
0.35 (0.23-0.48) 0.4466
Total IgE – IU/mL 194 (95-759)
406 (124-922) 0.3549
Vitamin D – nmol/L 32 (13) 41 (24) 0.1966 Skin prick test responses – total positive 3.1 (1.8) 4.1 (2.1) 0.1477 Skin prick test responses – no. (%) - House dust mite - Grass - Trees (incl silver birch) - Cat - Dog - Aspergillus - Cladasporium - Alternaria
9 (64%) 9 (64%) 5 (36%) 6 (43%) 3 (21%) 1 (7%) 0 (0%) 1 (7%)
13 (81%) 15 (94%) 11 (69%) 13 (81%) 5 (31%) 0 (0%)
2 (13%) 1 (6%)
Data are mean (SD), number (%) or median (IQR). Age, sex, BMI, skin prick test responses, asthma treatment and age at asthma diagnosis were collected at screening; ICS dose, ACQ-6, FEV1, PC20, FeNO, blood eosinophils, total IgE and vitamin D were collected at randomization. Statistical analysis was performed using unpaired t tests for parametric data and Mann-Whitney tests for non-parametric. There were no statistically significant differences between the groups.
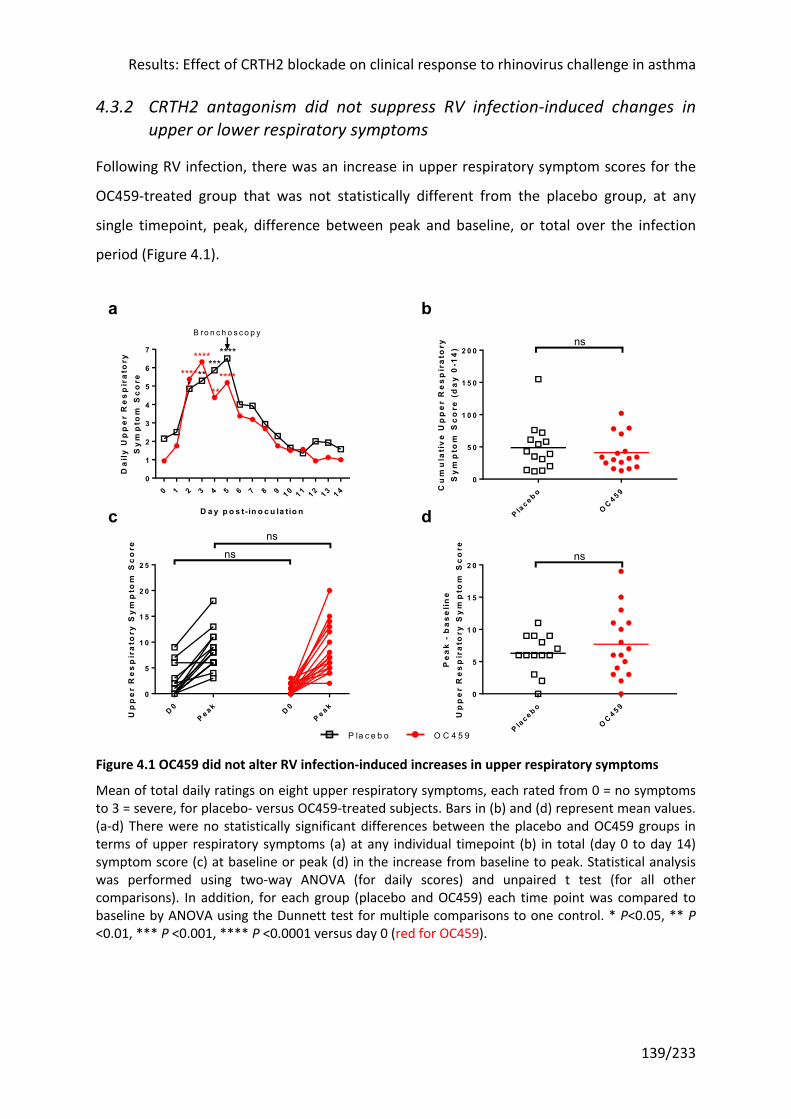
Results: Effect of CRTH2 blockade on clinical response to rhinovirus challenge in asthma
139/233
4.3.2 CRTH2 antagonism did not suppress RV infection-induced changes in upper or lower respiratory symptoms
Following RV infection, there was an increase in upper respiratory symptom scores for the
OC459-treated group that was not statistically different from the placebo group, at any
single timepoint, peak, difference between peak and baseline, or total over the infection
period (Figure 4.1).
Figure 4.1 OC459 did not alter RV infection-induced increases in upper respiratory symptoms
Mean of total daily ratings on eight upper respiratory symptoms, each rated from 0 = no symptoms to 3 = severe, for placebo- versus OC459-treated subjects. Bars in (b) and (d) represent mean values. (a-d) There were no statistically significant differences between the placebo and OC459 groups in terms of upper respiratory symptoms (a) at any individual timepoint (b) in total (day 0 to day 14) symptom score (c) at baseline or peak (d) in the increase from baseline to peak. Statistical analysis was performed using two-way ANOVA (for daily scores) and unpaired t test (for all other comparisons). In addition, for each group (placebo and OC459) each time point was compared to baseline by ANOVA using the Dunnett test for multiple comparisons to one control. * P<0.05, ** P <0.01, *** P <0.001, **** P <0.0001 versus day 0 (red for OC459).
0 1 2 3 4 5 6 7 8 9 1 0 1 1 1 2 1 3 1 40
1
2
3
4
5
6
7
D a y p o s t- in o c u la tio n
Da
ily
Up
pe
r R
es
pir
ato
ryS
ym
pto
m S
co
re
B ro n c h o s c o p y
**********
********
******
P lac e b o
OC 4 5 9
0
5 0
1 0 0
1 5 0
2 0 0
Cu
mu
lati
ve
Up
pe
r R
es
pir
ato
ryS
ym
pto
m S
co
re (
da
y 0
-14
)
ns
D 0P e a k D 0
P e a k0
5
1 0
1 5
2 0
2 5
Up
pe
r R
es
pir
ato
ry S
ym
pto
m S
co
re
nsns
P lac e b o
OC 4 5 9
0
5
1 0
1 5
2 0
Pe
ak
- b
as
eli
ne
Up
pe
r R
es
pir
ato
ry S
ym
pto
m S
co
re
ns
a b
c d
P la c e b o O C 4 5 9
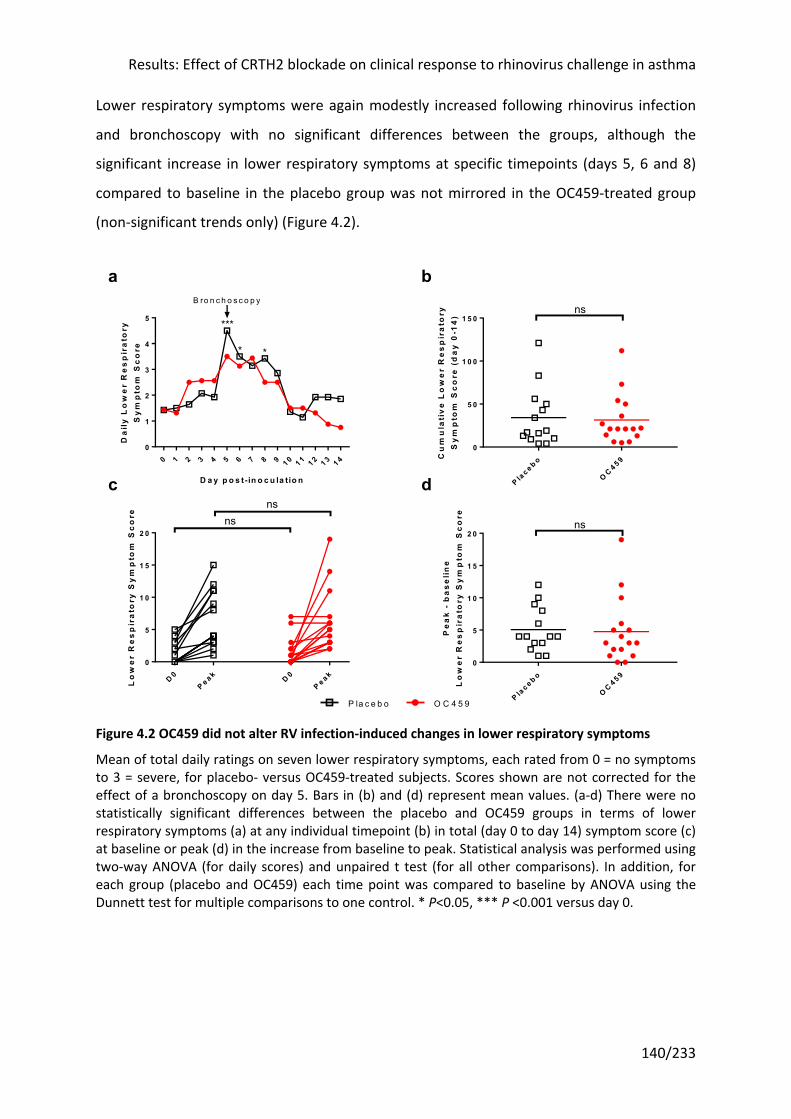
Results: Effect of CRTH2 blockade on clinical response to rhinovirus challenge in asthma
140/233
Lower respiratory symptoms were again modestly increased following rhinovirus infection
and bronchoscopy with no significant differences between the groups, although the
significant increase in lower respiratory symptoms at specific timepoints (days 5, 6 and 8)
compared to baseline in the placebo group was not mirrored in the OC459-treated group
(non-significant trends only) (Figure 4.2).
Figure 4.2 OC459 did not alter RV infection-induced changes in lower respiratory symptoms
Mean of total daily ratings on seven lower respiratory symptoms, each rated from 0 = no symptoms to 3 = severe, for placebo- versus OC459-treated subjects. Scores shown are not corrected for the effect of a bronchoscopy on day 5. Bars in (b) and (d) represent mean values. (a-d) There were no statistically significant differences between the placebo and OC459 groups in terms of lower respiratory symptoms (a) at any individual timepoint (b) in total (day 0 to day 14) symptom score (c) at baseline or peak (d) in the increase from baseline to peak. Statistical analysis was performed using two-way ANOVA (for daily scores) and unpaired t test (for all other comparisons). In addition, for each group (placebo and OC459) each time point was compared to baseline by ANOVA using the Dunnett test for multiple comparisons to one control. * P<0.05, *** P <0.001 versus day 0.
0 1 2 3 4 5 6 7 8 9 1 0 1 1 1 2 1 3 1 40
1
2
3
4
5
D a y p o s t- in o c u la tio n
Da
ily
Lo
we
r R
es
pir
ato
ryS
ym
pto
m S
co
re
B ro n c h o s c o p y
***
* *
P lac e b o
OC 4 5 9
0
5 0
1 0 0
1 5 0
Cu
mu
lati
ve
Lo
we
r R
es
pir
ato
ryS
ym
pto
m S
co
re (
da
y 0
-14
)
ns
D 0P e a k D 0
P e a k0
5
1 0
1 5
2 0
Lo
we
r R
es
pir
ato
ry S
ym
pto
m S
co
re nsns
P lac e b o
OC 4 5 9
0
5
1 0
1 5
2 0
Pe
ak
- b
as
eli
ne
Lo
we
r R
es
pir
ato
ry S
ym
pto
m S
co
re
ns
a b
c d
P la c e b o O C 4 5 9
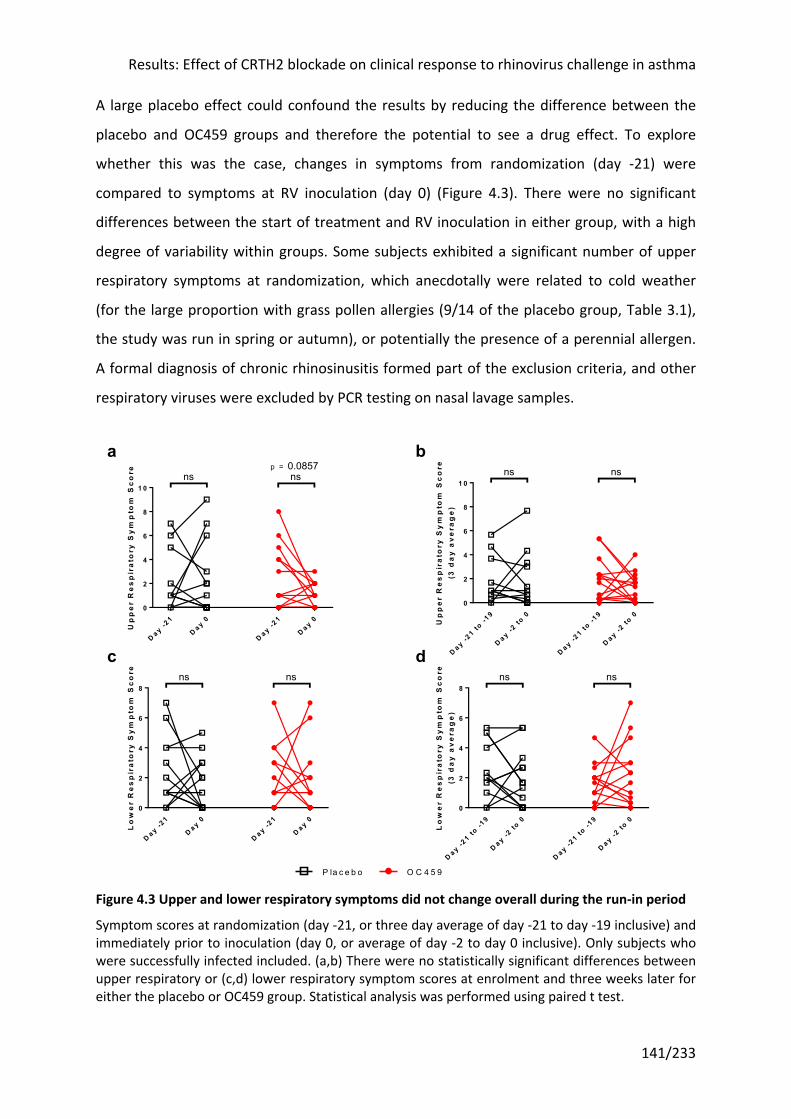
Results: Effect of CRTH2 blockade on clinical response to rhinovirus challenge in asthma
141/233
A large placebo effect could confound the results by reducing the difference between the
placebo and OC459 groups and therefore the potential to see a drug effect. To explore
whether this was the case, changes in symptoms from randomization (day -21) were
compared to symptoms at RV inoculation (day 0) (Figure 4.3). There were no significant
differences between the start of treatment and RV inoculation in either group, with a high
degree of variability within groups. Some subjects exhibited a significant number of upper
respiratory symptoms at randomization, which anecdotally were related to cold weather
(for the large proportion with grass pollen allergies (9/14 of the placebo group, Table 3.1),
the study was run in spring or autumn), or potentially the presence of a perennial allergen.
A formal diagnosis of chronic rhinosinusitis formed part of the exclusion criteria, and other
respiratory viruses were excluded by PCR testing on nasal lavage samples.
Figure 4.3 Upper and lower respiratory symptoms did not change overall during the run-in period
Symptom scores at randomization (day -21, or three day average of day -21 to day -19 inclusive) and immediately prior to inoculation (day 0, or average of day -2 to day 0 inclusive). Only subjects who were successfully infected included. (a,b) There were no statistically significant differences between upper respiratory or (c,d) lower respiratory symptom scores at enrolment and three weeks later for either the placebo or OC459 group. Statistical analysis was performed using paired t test.
D a y -21
D a y 0
D a y -21
D a y 00
2
4
6
8
1 0
Up
pe
r R
es
pir
ato
ry S
ym
pto
m S
co
re ns ns0.0857p =
D a y -21 to
-19
D a y -2 to
0
D a y -21 to
-19
D a y -2 to
00
2
4
6
8
1 0
Up
pe
r R
es
pir
ato
ry S
ym
pto
m S
co
re(3
da
y a
ve
rag
e)
ns ns
D a y -21
D a y 0
D a y -21
D a y 00
2
4
6
8
Lo
we
r R
es
pir
ato
ry S
ym
pto
m S
co
re ns ns
D a y -21 to
-19
D a y -2 to
0
D a y -21 to
-19
D a y -2 to
00
2
4
6
8
Lo
we
r R
es
pir
ato
ry S
ym
pto
m S
co
re(3
da
y a
ve
rag
e)
ns ns
P la c e b o O C 4 5 9
a b
c d
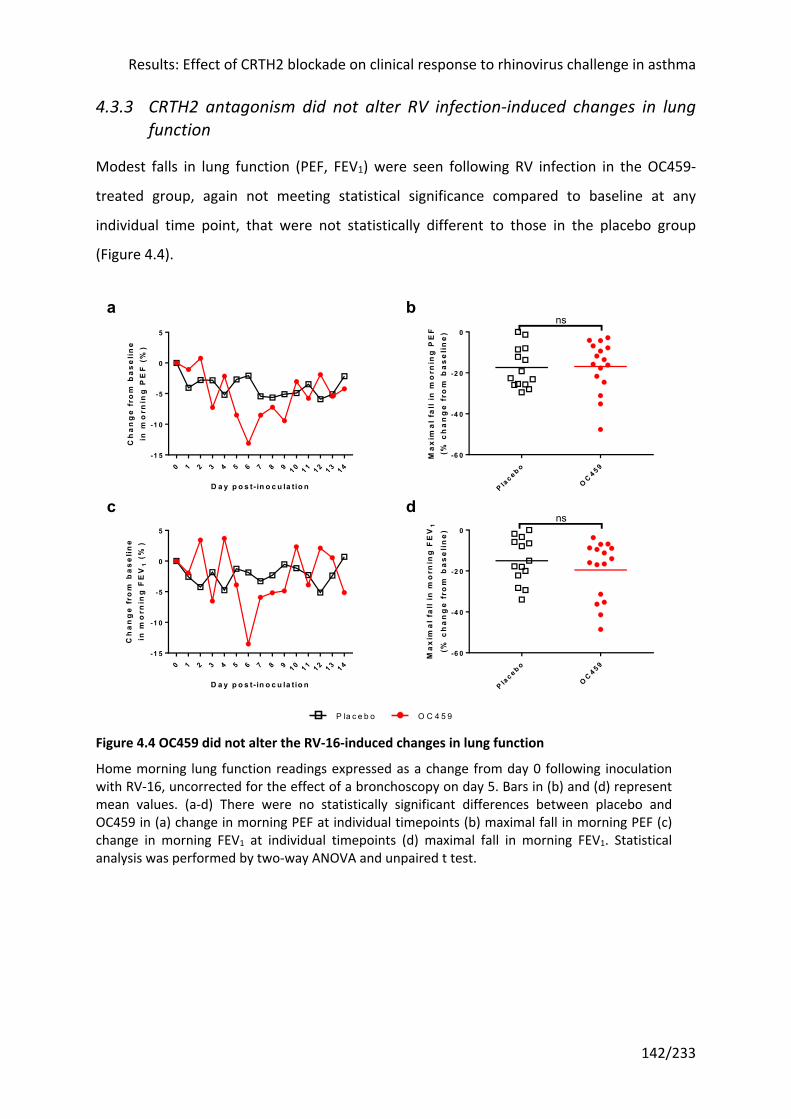
Results: Effect of CRTH2 blockade on clinical response to rhinovirus challenge in asthma
142/233
4.3.3 CRTH2 antagonism did not alter RV infection-induced changes in lung function
Modest falls in lung function (PEF, FEV1) were seen following RV infection in the OC459-
treated group, again not meeting statistical significance compared to baseline at any
individual time point, that were not statistically different to those in the placebo group
(Figure 4.4).
Figure 4.4 OC459 did not alter the RV-16-induced changes in lung function
Home morning lung function readings expressed as a change from day 0 following inoculation with RV-16, uncorrected for the effect of a bronchoscopy on day 5. Bars in (b) and (d) represent mean values. (a-d) There were no statistically significant differences between placebo and OC459 in (a) change in morning PEF at individual timepoints (b) maximal fall in morning PEF (c) change in morning FEV1 at individual timepoints (d) maximal fall in morning FEV1. Statistical analysis was performed by two-way ANOVA and unpaired t test.
0 1 2 3 4 5 6 7 8 9 1 0 1 1 1 2 1 3 1 4-1 5
-1 0
-5
0
5
D a y p o s t- in o c u la tio n
Ch
an
ge
fro
m b
as
eli
ne
in m
orn
ing
PE
F (
%)
P lac e b o
OC 4 5 9
-6 0
-4 0
-2 0
0
Ma
xim
al
fall
in m
orn
ing
PE
F(%
ch
an
ge
fro
m b
as
eli
ne
)
ns
0 1 2 3 4 5 6 7 8 9 1 0 1 1 1 2 1 3 1 4-1 5
-1 0
-5
0
5
D a y p o s t- in o c u la tio n
Ch
an
ge
fro
m b
as
eli
ne
in m
orn
ing
FE
V1
(%
)
P lac e b o
OC 4 5 9
-6 0
-4 0
-2 0
0
Ma
xim
al
fall
in m
orn
ing
FE
V1
(% c
ha
ng
e f
rom
ba
se
lin
e)
ns
a b
c d
P la c e b o O C 4 5 9
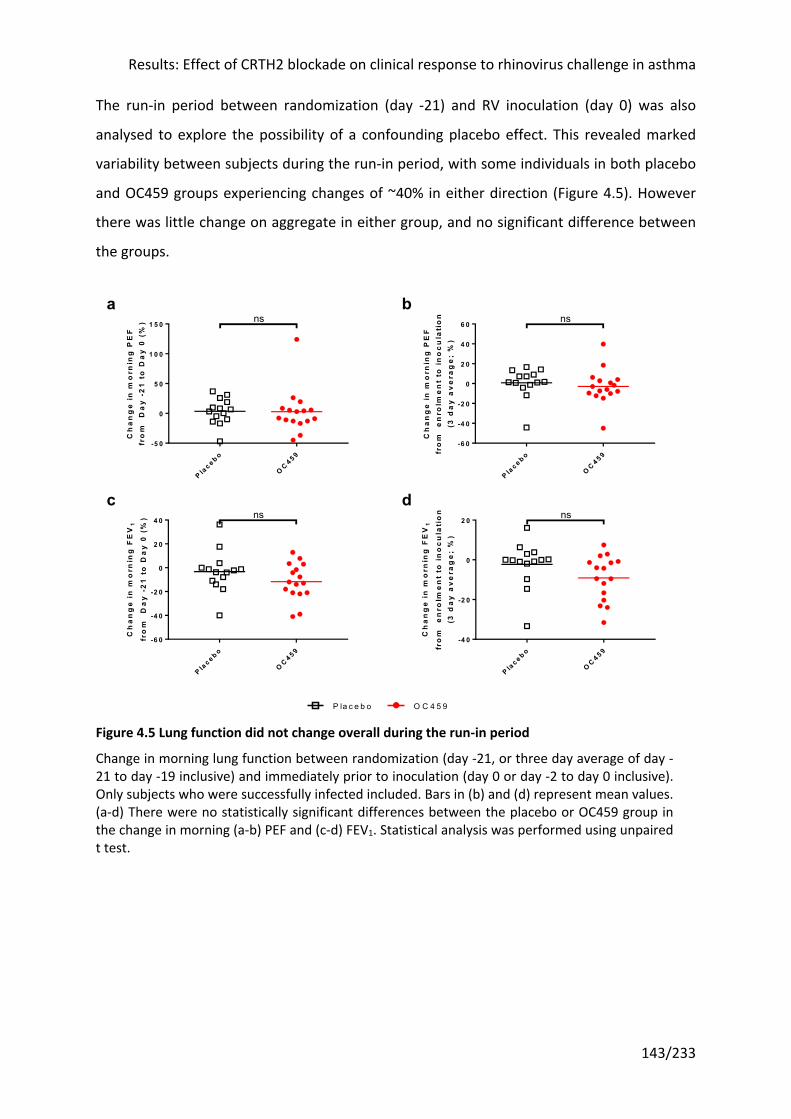
Results: Effect of CRTH2 blockade on clinical response to rhinovirus challenge in asthma
143/233
The run-in period between randomization (day -21) and RV inoculation (day 0) was also
analysed to explore the possibility of a confounding placebo effect. This revealed marked
variability between subjects during the run-in period, with some individuals in both placebo
and OC459 groups experiencing changes of ~40% in either direction (Figure 4.5). However
there was little change on aggregate in either group, and no significant difference between
the groups.
Figure 4.5 Lung function did not change overall during the run-in period
Change in morning lung function between randomization (day -21, or three day average of day -21 to day -19 inclusive) and immediately prior to inoculation (day 0 or day -2 to day 0 inclusive). Only subjects who were successfully infected included. Bars in (b) and (d) represent mean values. (a-d) There were no statistically significant differences between the placebo or OC459 group in the change in morning (a-b) PEF and (c-d) FEV1. Statistical analysis was performed using unpaired t test.
P lac e b o
OC 4 5 9
-5 0
0
5 0
1 0 0
1 5 0
Ch
an
ge
in
mo
rnin
g P
EF
fro
m
Da
y -
21
to
Da
y 0
(%
) ns
P lac e b o
OC 4 5 9
-6 0
-4 0
-2 0
0
2 0
4 0
6 0
Ch
an
ge
in
mo
rnin
g P
EF
fro
m
en
rolm
en
t to
in
oc
ula
tio
n(3
da
y a
ve
rag
e;
%)
ns
P lac e b o
OC 4 5 9
-6 0
-4 0
-2 0
0
2 0
4 0
Ch
an
ge
in
mo
rnin
g F
EV
1
fro
m
Da
y -
21
to
Da
y 0
(%
) ns
P lac e b o
OC 4 5 9
-4 0
-2 0
0
2 0
Ch
an
ge
in
mo
rnin
g F
EV
1
fro
m
en
rolm
en
t to
in
oc
ula
tio
n(3
da
y a
ve
rag
e;
%)
ns
P la c e b o O C 4 5 9
a b
c d
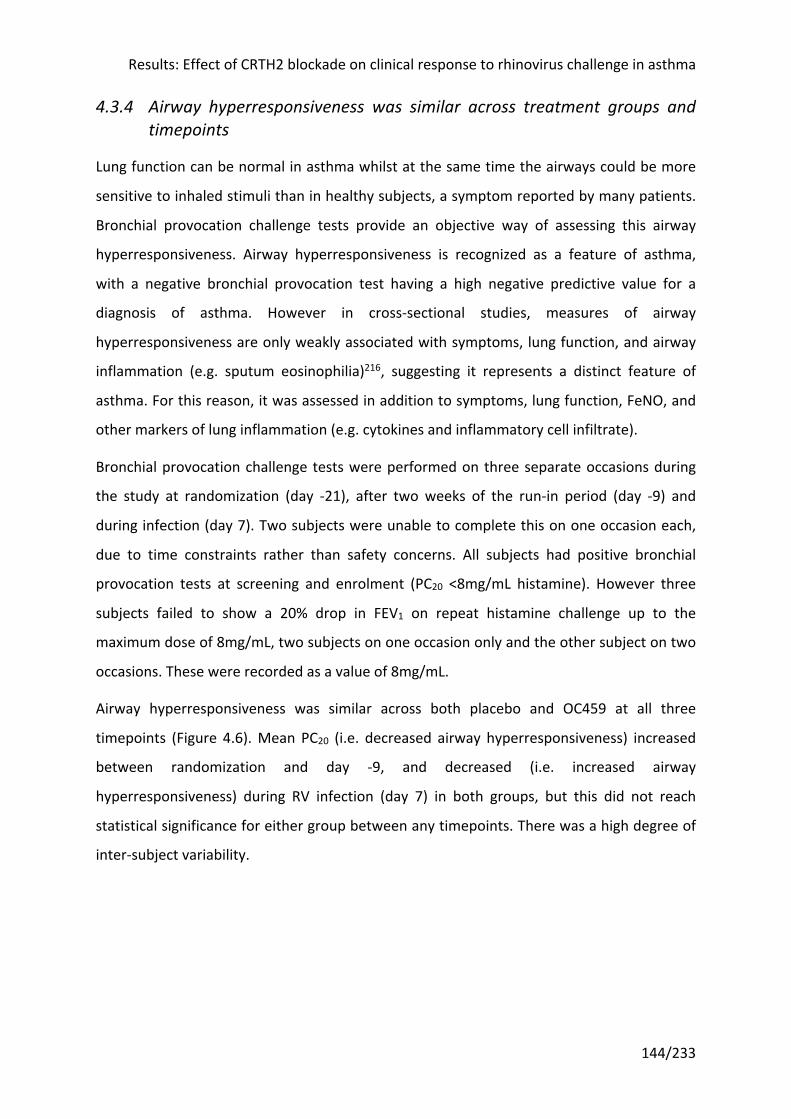
Results: Effect of CRTH2 blockade on clinical response to rhinovirus challenge in asthma
144/233
4.3.4 Airway hyperresponsiveness was similar across treatment groups and timepoints
Lung function can be normal in asthma whilst at the same time the airways could be more
sensitive to inhaled stimuli than in healthy subjects, a symptom reported by many patients.
Bronchial provocation challenge tests provide an objective way of assessing this airway
hyperresponsiveness. Airway hyperresponsiveness is recognized as a feature of asthma,
with a negative bronchial provocation test having a high negative predictive value for a
diagnosis of asthma. However in cross-sectional studies, measures of airway
hyperresponsiveness are only weakly associated with symptoms, lung function, and airway
inflammation (e.g. sputum eosinophilia)216, suggesting it represents a distinct feature of
asthma. For this reason, it was assessed in addition to symptoms, lung function, FeNO, and
other markers of lung inflammation (e.g. cytokines and inflammatory cell infiltrate).
Bronchial provocation challenge tests were performed on three separate occasions during
the study at randomization (day -21), after two weeks of the run-in period (day -9) and
during infection (day 7). Two subjects were unable to complete this on one occasion each,
due to time constraints rather than safety concerns. All subjects had positive bronchial
provocation tests at screening and enrolment (PC20 <8mg/mL histamine). However three
subjects failed to show a 20% drop in FEV1 on repeat histamine challenge up to the
maximum dose of 8mg/mL, two subjects on one occasion only and the other subject on two
occasions. These were recorded as a value of 8mg/mL.
Airway hyperresponsiveness was similar across both placebo and OC459 at all three
timepoints (Figure 4.6). Mean PC20 (i.e. decreased airway hyperresponsiveness) increased
between randomization and day -9, and decreased (i.e. increased airway
hyperresponsiveness) during RV infection (day 7) in both groups, but this did not reach
statistical significance for either group between any timepoints. There was a high degree of
inter-subject variability.
Results: Effect of CRTH2 blockade on clinical response to rhinovirus challenge in asthma
145/233
Figure 4.6 Airway hyperresponsiveness did not change significantly throughout the study
Mean provocation concentration of histamine required to induce a ≥20% drop in FEV1 (PC20) at enrolment, at the end of the run-in period, and day 7 during infection. (a) There were no significant differences between placebo and OC459 at any timepoint. (b) PC20 values shown per subject. Statistical analysis was performed using unpaired t-tests, for comparing placebo to OC459 at each timepoint, and paired t-tests, for comparing changes within treatment groups but across different timepoints.
-21 -9 7
0 .0 6 2 5
0 .1 2 5
0 .2 5
0 .5
1
2
4
8
S tu d y d a y re la tiv e to R V in o c u la t io n
Pro
vo
ca
tio
n c
on
ce
ntr
ati
on
of
his
tam
ine
(m
g/m
L)
- 21 -9 7
-21 -9 7
0 .0 6 2 5
0 .1 2 5
0 .2 5
0 .5
1
2
4
8
1 6
S tu d y d a y re la tiv e to R V in o c u la t io n
Pro
vo
ca
tio
n c
on
ce
ntr
ati
on
of
his
tam
ine
(m
g/m
L)
O C 459P la ce bo
a b
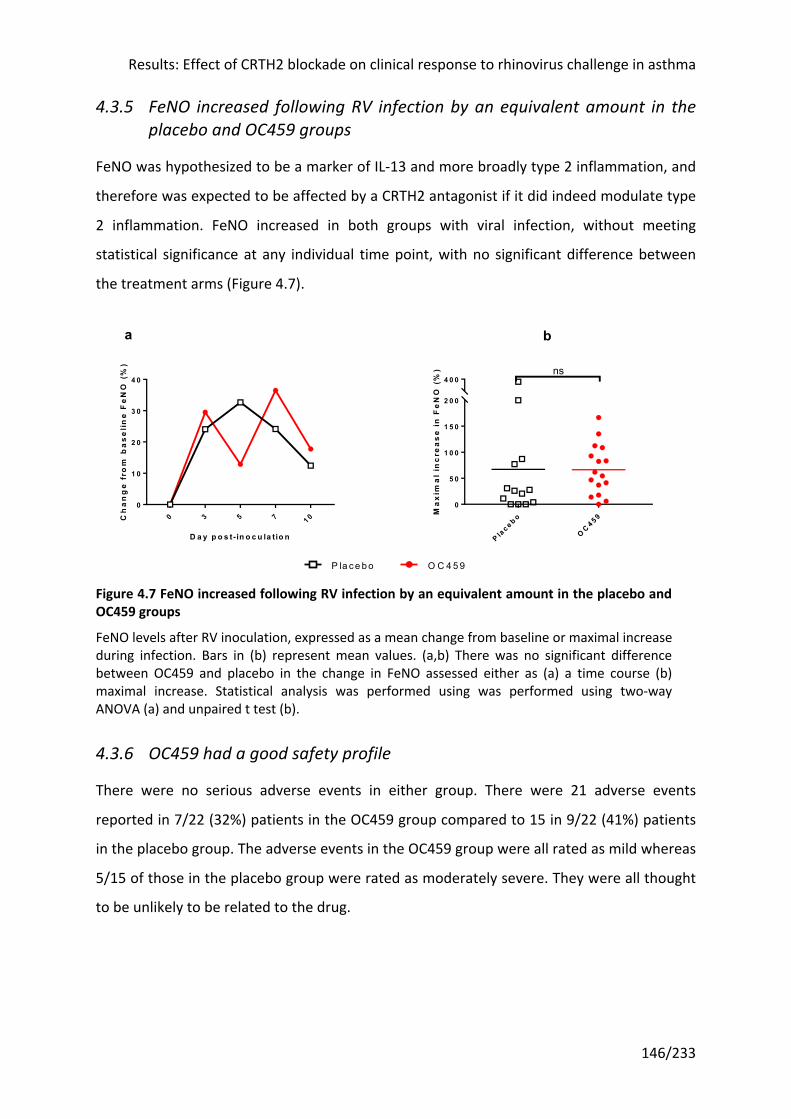
Results: Effect of CRTH2 blockade on clinical response to rhinovirus challenge in asthma
146/233
4.3.5 FeNO increased following RV infection by an equivalent amount in the placebo and OC459 groups
FeNO was hypothesized to be a marker of IL-13 and more broadly type 2 inflammation, and
therefore was expected to be affected by a CRTH2 antagonist if it did indeed modulate type
2 inflammation. FeNO increased in both groups with viral infection, without meeting
statistical significance at any individual time point, with no significant difference between
the treatment arms (Figure 4.7).
Figure 4.7 FeNO increased following RV infection by an equivalent amount in the placebo and OC459 groups
FeNO levels after RV inoculation, expressed as a mean change from baseline or maximal increase during infection. Bars in (b) represent mean values. (a,b) There was no significant difference between OC459 and placebo in the change in FeNO assessed either as (a) a time course (b) maximal increase. Statistical analysis was performed using was performed using two-way ANOVA (a) and unpaired t test (b).
4.3.6 OC459 had a good safety profile
There were no serious adverse events in either group. There were 21 adverse events
reported in 7/22 (32%) patients in the OC459 group compared to 15 in 9/22 (41%) patients
in the placebo group. The adverse events in the OC459 group were all rated as mild whereas
5/15 of those in the placebo group were rated as moderately severe. They were all thought
to be unlikely to be related to the drug.
0 3 5 7 1 00
1 0
2 0
3 0
4 0
D a y p o s t- in o c u la tio n
Ch
an
ge
fro
m b
as
eli
ne
Fe
NO
(%
)
P lac e b o
OC 4 5 9
0
5 0
1 0 0
1 5 0
2 0 0
4 0 0ns
Ma
xim
al
inc
rea
se
in
Fe
NO
(%
)
ba
O C 459P la ce bo
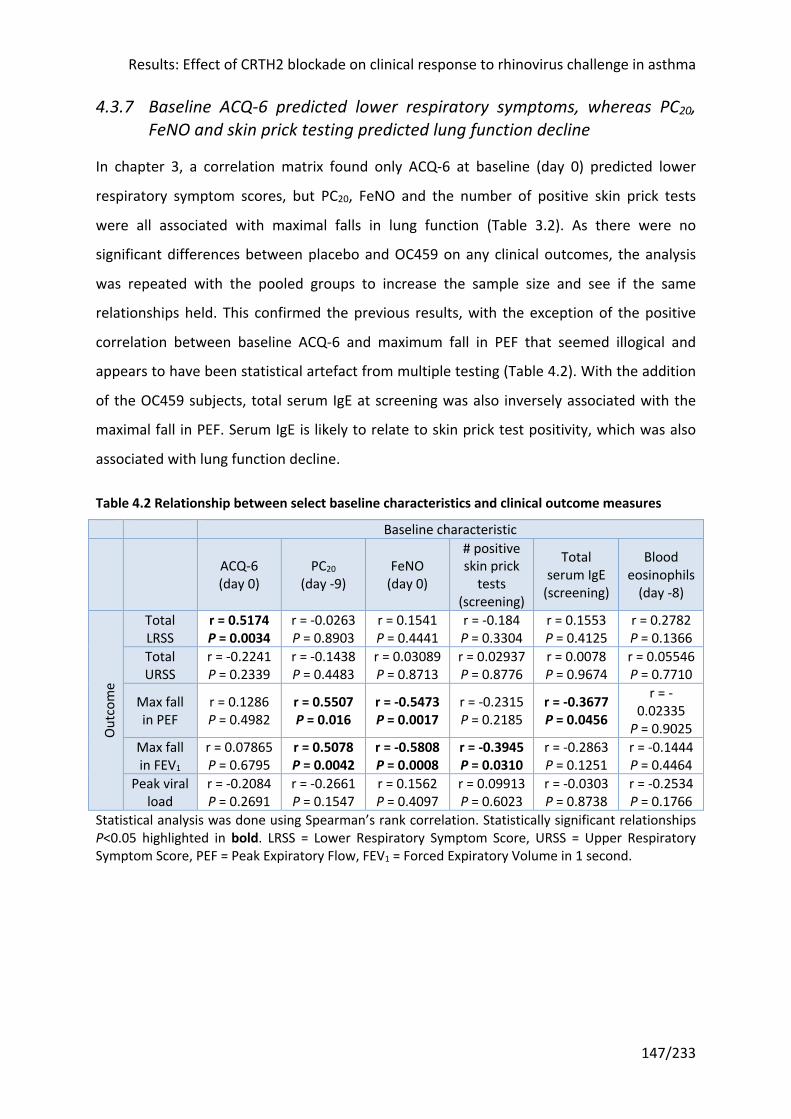
Results: Effect of CRTH2 blockade on clinical response to rhinovirus challenge in asthma
147/233
4.3.7 Baseline ACQ-6 predicted lower respiratory symptoms, whereas PC20, FeNO and skin prick testing predicted lung function decline
In chapter 3, a correlation matrix found only ACQ-6 at baseline (day 0) predicted lower
respiratory symptom scores, but PC20, FeNO and the number of positive skin prick tests
were all associated with maximal falls in lung function (Table 3.2). As there were no
significant differences between placebo and OC459 on any clinical outcomes, the analysis
was repeated with the pooled groups to increase the sample size and see if the same
relationships held. This confirmed the previous results, with the exception of the positive
correlation between baseline ACQ-6 and maximum fall in PEF that seemed illogical and
appears to have been statistical artefact from multiple testing (Table 4.2). With the addition
of the OC459 subjects, total serum IgE at screening was also inversely associated with the
maximal fall in PEF. Serum IgE is likely to relate to skin prick test positivity, which was also
associated with lung function decline.
Table 4.2 Relationship between select baseline characteristics and clinical outcome measures
Baseline characteristic
ACQ-6 (day 0)
PC20 (day -9)
FeNO (day 0)
# positive skin prick
tests (screening)
Total serum IgE
(screening)
Blood eosinophils
(day -8)
Out
com
e
Total LRSS
r = 0.5174 P = 0.0034
r = -0.0263 P = 0.8903
r = 0.1541 P = 0.4441
r = -0.184 P = 0.3304
r = 0.1553 P = 0.4125
r = 0.2782 P = 0.1366
Total URSS
r = -0.2241 P = 0.2339
r = -0.1438 P = 0.4483
r = 0.03089 P = 0.8713
r = 0.02937 P = 0.8776
r = 0.0078 P = 0.9674
r = 0.05546 P = 0.7710
Max fall in PEF
r = 0.1286 P = 0.4982
r = 0.5507 P = 0.016
r = -0.5473 P = 0.0017
r = -0.2315 P = 0.2185
r = -0.3677 P = 0.0456
r = -0.02335
P = 0.9025 Max fall in FEV1
r = 0.07865 P = 0.6795
r = 0.5078 P = 0.0042
r = -0.5808 P = 0.0008
r = -0.3945 P = 0.0310
r = -0.2863 P = 0.1251
r = -0.1444 P = 0.4464
Peak viral load
r = -0.2084 P = 0.2691
r = -0.2661 P = 0.1547
r = 0.1562 P = 0.4097
r = 0.09913 P = 0.6023
r = -0.0303 P = 0.8738
r = -0.2534 P = 0.1766
Statistical analysis was done using Spearman’s rank correlation. Statistically significant relationships P<0.05 highlighted in bold. LRSS = Lower Respiratory Symptom Score, URSS = Upper Respiratory Symptom Score, PEF = Peak Expiratory Flow, FEV1 = Forced Expiratory Volume in 1 second.
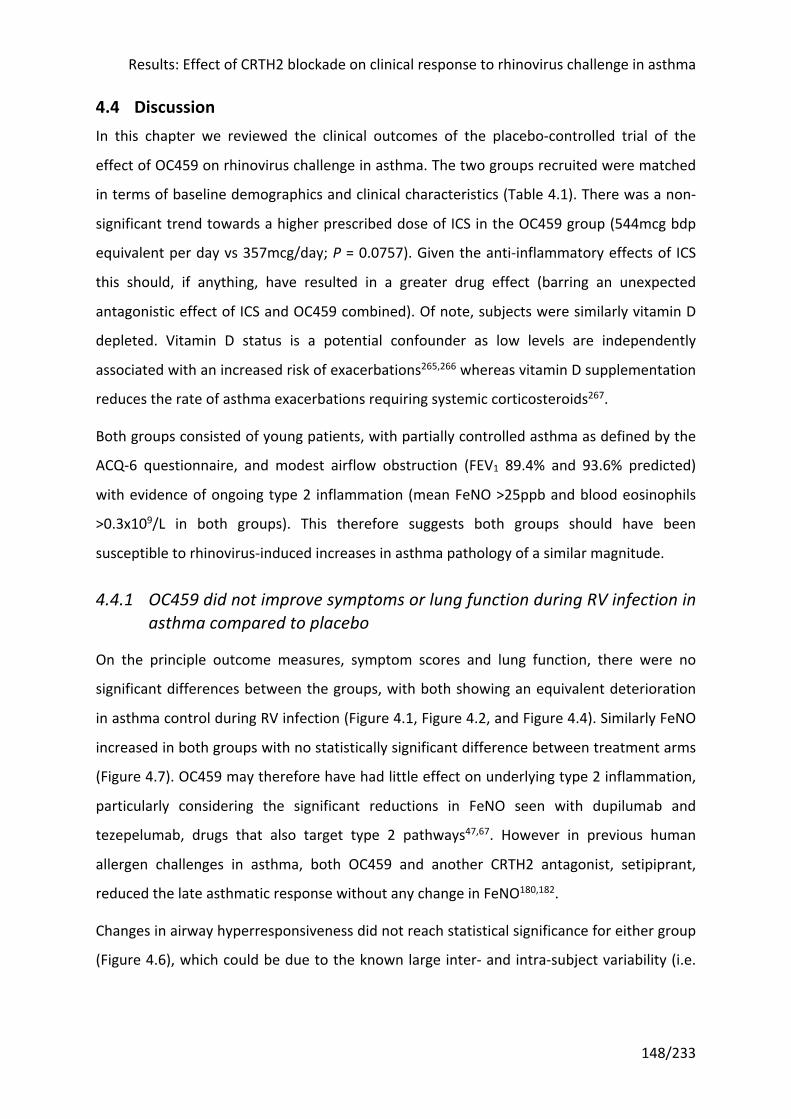
Results: Effect of CRTH2 blockade on clinical response to rhinovirus challenge in asthma
148/233
4.4 Discussion In this chapter we reviewed the clinical outcomes of the placebo-controlled trial of the
effect of OC459 on rhinovirus challenge in asthma. The two groups recruited were matched
in terms of baseline demographics and clinical characteristics (Table 4.1). There was a non-
significant trend towards a higher prescribed dose of ICS in the OC459 group (544mcg bdp
equivalent per day vs 357mcg/day; P = 0.0757). Given the anti-inflammatory effects of ICS
this should, if anything, have resulted in a greater drug effect (barring an unexpected
antagonistic effect of ICS and OC459 combined). Of note, subjects were similarly vitamin D
depleted. Vitamin D status is a potential confounder as low levels are independently
associated with an increased risk of exacerbations265,266 whereas vitamin D supplementation
reduces the rate of asthma exacerbations requiring systemic corticosteroids267.
Both groups consisted of young patients, with partially controlled asthma as defined by the
ACQ-6 questionnaire, and modest airflow obstruction (FEV1 89.4% and 93.6% predicted)
with evidence of ongoing type 2 inflammation (mean FeNO >25ppb and blood eosinophils
>0.3x10⁹/L in both groups). This therefore suggests both groups should have been
susceptible to rhinovirus-induced increases in asthma pathology of a similar magnitude.
4.4.1 OC459 did not improve symptoms or lung function during RV infection in asthma compared to placebo
On the principle outcome measures, symptom scores and lung function, there were no
significant differences between the groups, with both showing an equivalent deterioration
in asthma control during RV infection (Figure 4.1, Figure 4.2, and Figure 4.4). Similarly FeNO
increased in both groups with no statistically significant difference between treatment arms
(Figure 4.7). OC459 may therefore have had little effect on underlying type 2 inflammation,
particularly considering the significant reductions in FeNO seen with dupilumab and
tezepelumab, drugs that also target type 2 pathways47,67. However in previous human
allergen challenges in asthma, both OC459 and another CRTH2 antagonist, setipiprant,
reduced the late asthmatic response without any change in FeNO180,182.
Changes in airway hyperresponsiveness did not reach statistical significance for either group
(Figure 4.6), which could be due to the known large inter- and intra-subject variability (i.e.
Results: Effect of CRTH2 blockade on clinical response to rhinovirus challenge in asthma
149/233
across repeat tests for the same individual)268 and the relatively small subject numbers in
this study.
Changes in symptoms and lung function during the three week run-in period after
randomization (day -21) prior to inoculation were reviewed to try to gauge whether the
results might have been confounded by a large placebo effect (although without a control
group of asthma subjects not given placebo, it is impossible to know definitively). Greater
adherence with regular ICS maintenance treatment is hinted at by the non-significantly
decreased mean airway hyperresponsiveness in both groups between day -21 and day -9, as
ICS are known to reduce hyperresponsiveness269. However there was no significant change
in either the placebo or OC459 group between randomization (day -21) and RV inoculation
(day 0), with a high degree of individual variability within groups, consistent with the
variable nature of asthma (Figure 4.3 and Figure 4.5). Ultimately the study may have
benefited from objective measurement of adherence to prescribed maintenance therapy
(ICS or ICS-LABA) with a smart inhaler, to be able to exclude this as a potential confounder.
Finally, although drug levels were not measured in this study for reasons previously stated
(see section 2.2.5), it seems unlikely that OC459 did not reach the pulmonary system as a
previous allergen study demonstrated pharmacological activity in the lungs. Specifically,
OC459 significantly attenuated the increase in eosinophils in the sputum, a lower airways
sample, after allergen challenge compared to placebo180.
To exclude a significant confounding placebo effect, the three weeks between
randomization and inoculation with RV were analysed, and showed no difference between
the groups either. It is perhaps unsurprising that the drug had little effect in the three weeks
prior to RV inoculation. Previous trials of CRTH2 antagonists, including OC459, in stable
mild-to-moderate asthma have reported no or only small significant differences in lung
function and symptoms, of a magnitude likely below the minimum clinically important
difference that patients could detect192 (also see section 1.8.3). However as discussed
earlier, these subjects likely had little or no ongoing inflammation or PGD2. Patients with
severe asthma have previously been shown to have the highest levels of BAL PGD2125, so a
trial of another CRTH2 antagonist in a similar population is of particular interest189. These
investigators recruited subjects with uncontrolled asthma despite ICS treatment, defined as
either an ACQ-7 ≥1.5 or ≥1 exacerbation requiring systemic corticosteroids in the last year,
Results: Effect of CRTH2 blockade on clinical response to rhinovirus challenge in asthma
150/233
and sputum eosinophilia (≥2%) as evidence of type 2 inflammation. The results were
underwhelming despite considerable media fanfare: fevipiprant did not significantly
improve ACQ-7 overall whilst AQLQ was 0.59 higher versus placebo, just exceeding the
minimum clinically important difference of 0.5, and post- (but not pre-) bronchodilator FEV1
0.16L higher, a small improvement. There is no universally accepted minimum clinically
important difference in FEV1 in asthma but for context, variability within a single testing
session can be up to 0.12L (data from a mixed pool of 18,000 respiratory patients270). The
subjects in the current trial had milder disease (e.g. mean ACQ-6 = 1.27) than in the
fevipiprant study and therefore less potential to improve from their baseline.
OC459 is now the fifth drug to show no effect on the changes in symptoms and lung
function following RV challenge in asthma, after studies of the ICS budesonide149,
montelukast158, a TLR3 antagonist166, and anti-IgE with omalizumab (ClinicalTrials.gov
identifier NCT02388997)171; there has yet to be a positive drug trial in this model. ICS,
montelukast and omalizumab all form the standard of care in asthma with good evidence
they reduce exacerbations271-274. Yet despite this, none of these had much effect on
symptoms or lung function, except for attenuation of the maximal RV infection-induced fall
in PEF with montelukast.
Examining the changes in the placebo groups in these studies suggests there may have been
little RV-induced asthma pathology for the various drugs to impact. Most do not publish an
analysis of the effect of RV infection on the placebo group, although the budesonide study
states that there was no change in FEV1 measured at clinic visits or PC20149. There were
increases in upper and lower airways symptom scores and decreases in lung function (PEF or
FEV1) in trials of montelukast158 and anti-TLR3166, but no comment on whether these were
statistically significantly different from baseline at inoculation. These changes appear
modest, particularly with regard to lung function – in the montelukast study, the maximal
decrease in PEF compared to randomization was 16L/min158, and in the anti-TLR3 study the
authors comment that “the decrease in FEV1 was approximately 50% of expected”166.
Two additional caveats. All of these studies are small, limiting the power to see an effect:
n=21 (budesonide), n=19 (montelukast), n=46 (anti-TLR3), n=20 (omalizumab), and n=30
(OC459). There was also a mismatch between the interventions and the populations
recruited in which to study them. The evidence for montelukast in asthma is as an additional
Results: Effect of CRTH2 blockade on clinical response to rhinovirus challenge in asthma
151/233
controller with ICS; it is inferior to ICS as monotherapy275, which is how it was given in the
study cited. Similarly budesonide was given to ICS-naïve subjects in whom it was not
otherwise prescribed and therefore presumably not indicated owing to the lack of disease
severity149, whereas the evidence for omalizumab comes from studies in severe asthma yet
the RV challenge trial was conducted in mild disease171.
The changes induced by experimental infection with RV differ, at least in severity, from
those seen in most naturally occurring exacerbations that present to healthcare services
(where RV is also usually present). There is no standard definition for an asthma
exacerbation, with differing statements from the ATS/ERS276 and WHO277. According to the
ATS/ERS statement, developed for clinical research, the use of systemic corticosteroids or
presentation at hospital would be classed as severe. Just 4/317 subjects with asthma
experimentally infected with RV across 24 studies have needed oral corticosteroids (6/367
including subjects who were additionally on a study drug) (see section 1.7.3). One group
defined an exacerbation following experimental RV challenge as a rise of ≥0.5 in ACQ and
“measurable reductions” in PEF, finding only 4/11 infected asthma subjects had an
exacerbation278. It is not clear what day the ACQ was measured in this study, which is
particularly relevant as it captures symptoms over the previous week and therefore may not
be suitable in this model. More generally though, the broader applicability of findings in RV
challenge studies to real-world ‘severe’ asthma exacerbations is unclear.
Given the relatively mild changes in asthma following RV challenge, it is possible that this
and previous clinical trials have been underpowered. There is no positive study on which to
base a more robust power calculation. Meanwhile predictors of asthma pathology following
RV challenge, which would be of utility in increasing the power of a challenge study, have
been variably identified across different studies. Jackson and colleagues found both severity,
defined by ICS use, and disease control, defined by ACQ, at baseline were associated with
greater deteriorations in symptoms and lung function, but not virus load139. A subsequent
study in our group led by Dhariwal found a relationship between baseline ACQ and virus
load, but not symptoms or lung function167,168. A more systematic search for predictors of
asthma decompensation following RV challenge found baseline nasosorption IL-5, blood
eosinophil and lymphocyte counts correlated with various symptom measures (lower
respiratory symptom scores and ACQ), whilst baseline nasosorption IP-10 and TNF
Results: Effect of CRTH2 blockade on clinical response to rhinovirus challenge in asthma
152/233
correlated with lung function (max fall in FEV1 and PEF respectively)262. These authors also
showed that FeNO and blood and nasal IgE at baseline were not predictive of outcomes.
Taking these findings together, it is unclear which subjects are most suitable to recruit into
these studies. Moreover this implies that basing recruitment criteria or power calculations
on post-hoc analyses of previous studies may be flawed; the subjects in the subsequent trial
may well differ in important ways that we do not yet understand. Indeed previous
researchers have warned of the risks of post-hoc analyses; the International Study of Infarct
Survival (ISIS)-2 trial found a hugely significant (P<0.00001) benefit of aspirin versus placebo
in suspect acute myocardial infarction, but a post hoc analysis by astrological star sign found
this didn’t hold if you were a Gemini or Libra279.
4.4.2 OC459 was safe and well tolerated
Consistent with previous clinical trials of OC459175,178-181,203, and other CRTH2 antagonists,
the drug was safe and well tolerated. There were no withdrawals related to the drug and no
serious adverse effects, with a greater proportion of subjects in the placebo group reporting
adverse effects, although none in either group were thought to be related to the drug.
4.4.3 ACQ-6 was the only predictor of lower respiratory symptoms during infection; several other measures at baseline predicted lung function decline
As was the case in section 3.3.12, ACQ-6 remained the only predictor of lower respiratory
symptoms during infection, whilst several measures at baseline (PC20, FeNO, number of
positive skin prick tests, total serum IgE), were associated with maximal lung function
declines following RV challenge (Table 4.2).
Results: Effect of CRTH2 blockade on clinical response to rhinovirus challenge in asthma
153/233
4.5 Summary of key points • A randomized clinical trial of OC459 versus placebo showed no statistically significant
difference in the response to RV challenge in subjects with asthma in terms of
symptoms, lung function, FeNO and airway hyperresponsiveness (PC20)
• There was no change in these measures during the three weeks after randomization but
prior to RV inoculation either, arguing against a confounding placebo effect (e.g. due to
increased compliance with maintenance therapy)
• This could be due to a lack of drug efficacy, a lack of power, or reflect shortcomings of
the RV challenge model in asthma
• OC459 was safe and well-tolerated
• Pooling the groups, given the lack of effect of the intervention on clinical outcomes,
confirmed that baseline ACQ-6 predicted lower respiratory symptoms, whilst the
number of positive skin prick tests, airway hyperresponsiveness, FeNO and total serum
IgE at baseline predicted maximal falls in lung function
Results: Effect of CRTH2 blockade on type 2 inflammation in asthma
154/233
5 Results: Effect of CRTH2 blockade on type 2 inflammation in asthma
5.1 Introduction The present study was designed from the outset to incorporate a mechanistic analysis of the
drug, including proof of target engagement. If there were a significant effect on clinical
outcomes, this would confirm or refute whether the hypothesized mechanism was at work.
In the event of no effect on clinical endpoints, assessing mechanistic outcomes would
determine whether the drug worked as intended without translating into clinical effect or
simply did not work in vivo for some unforeseen reason. Either way, this would provide
important insights into our understanding of the pathophysiology of asthma exacerbations.
Chapter 3 confirmed previous reports that type 2 cytokines are increased following RV
challenge in asthma, meaning there is indeed a substrate on which the study drug could act.
As a novel extension to the RV challenge model, cells positively staining for CRTH2 were also
enumerated, but there was no increase in their numbers in the airway lumen although there
was a modest increase in the bronchial epithelium and subepithelium. There could
therefore be relatively little scope for the study drug, which is known to affect chemotaxis
of CRTH2+ cells in vitro, to reduce CRTH2+ cell numbers during RV infection.
Whether CRTH2 antagonism might affect PGD2 production via a positive or negative
feedback loop has never been investigated, in vitro or in vivo. It is unlikely that there is a
direct mechanism as mast cells, the primary cellular source of PGD2, only express the CRTH2
receptor intracellularly and so PGD2 does not induce CRTH2-dependent changes in
intracellular calcium in mast cells280. However other potential cellular sources of PGD2 do
express CRTH2 (e.g. eosinophils, Th2 cells and AECs). AECs in particular might be responsible
for the elevated PGD2 levels seen in RSV infection in children51, and are also the primary site
of infection and replication in RV-related lower respiratory illnesses. Indeed in a mouse
model of RSV bronchiolitis, CRTH2 antagonism was associated with a decrease in PGD2
concentration51, suggesting a positive feedback loop.
Whilst PGD2 has been demonstrated to promote cell migration and activation in vitro,
efforts to validate this in vivo have been hampered by differential expression of the CRTH2
Results: Effect of CRTH2 blockade on type 2 inflammation in asthma
155/233
receptor in animal models compared to humans. This explanation has been used to
reconcile contradictory findings, for example why CRTH2 knockout mice sensitized and
challenged with OVA display enhanced lung eosinophilia compared to wild type controls133.
By measuring CRTH2+ cell counts and type 2 cytokine levels in subjects treated with a CRTH2
antagonist, this study will be able to assess this in vivo and in humans for the first time. In
addition, intracellular IL-5 staining was undertaken as a functional marker of ILC2 activation,
as ILC2s are known to be a major source of IL-5281,282.
Multiple other compounds are known to elicit type 2 cytokine release from Th2 cells and
ILC2s, in particular the epithelial-derived cytokines IL-25, IL-33 and TSLP as well as others
including leukotrienes (LT) B4, LTC4, LTD4 and LTE4, and the pro-inflammatory cytokines IL-1α
and IL-1β283. Which, if any, of these is dominant is not clear. Nor is it known if there is
redundancy in these pathways if, for example, one were to be interrupted. An in vitro study
of ILC2s suggests that PGD2 has a greater effect than IL-25 or IL-33 on chemotaxis and
cytokine release, and that the effect of any of these is abrogated by CRTH2 blockade56. This
study is uniquely placed to validate, or refute, this in vivo.
5.2 Hypothesis and aims The aim of these mechanistic analyses was to assess whether the CRTH2 antagonist OC459
was effective in preventing the recruitment and activation of CRTH2+ cells in response to
PGD2 release following RV infection in asthma.
Specific hypotheses:
i. RV infection induced release of PGD2, the ligand for CRTH2, in the airways of OC459-
treated subjects to the same extent as the placebo-treated group
ii. CRTH2 antagonism reduced numbers of CRTH2+ cells in the airways relative to
placebo
iii. CRTH2 antagonism prevented PGD2-mediated activation of CRTH2+ ILC2 and Th2
cells and the subsequent release of IL-4, IL-5 and IL-13, with lower levels of those
cytokines in airway samples relative to placebo-treated subjects
iv. CRTH2+ cell counts and levels of IL-4, IL-5 and IL-13 correlated to levels of PGD2 and
not IL-25, IL-33, or TSLP
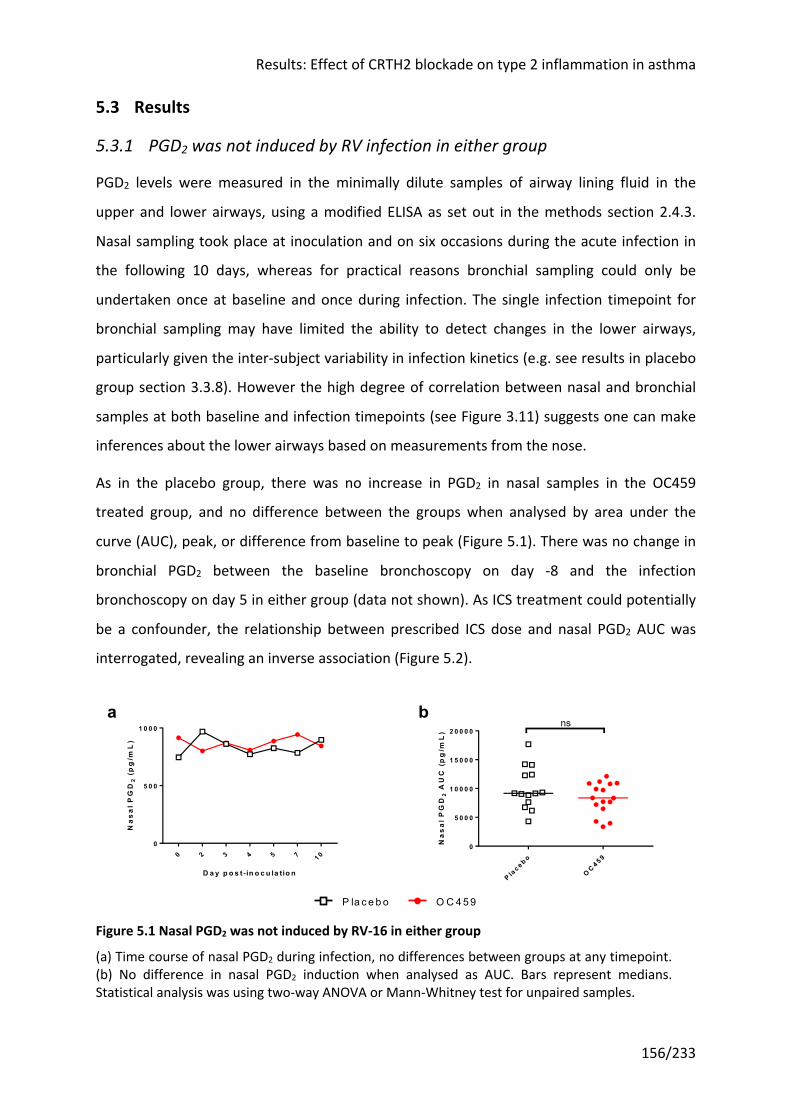
Results: Effect of CRTH2 blockade on type 2 inflammation in asthma
156/233
5.3 Results
5.3.1 PGD2 was not induced by RV infection in either group
PGD2 levels were measured in the minimally dilute samples of airway lining fluid in the
upper and lower airways, using a modified ELISA as set out in the methods section 2.4.3.
Nasal sampling took place at inoculation and on six occasions during the acute infection in
the following 10 days, whereas for practical reasons bronchial sampling could only be
undertaken once at baseline and once during infection. The single infection timepoint for
bronchial sampling may have limited the ability to detect changes in the lower airways,
particularly given the inter-subject variability in infection kinetics (e.g. see results in placebo
group section 3.3.8). However the high degree of correlation between nasal and bronchial
samples at both baseline and infection timepoints (see Figure 3.11) suggests one can make
inferences about the lower airways based on measurements from the nose.
As in the placebo group, there was no increase in PGD2 in nasal samples in the OC459
treated group, and no difference between the groups when analysed by area under the
curve (AUC), peak, or difference from baseline to peak (Figure 5.1). There was no change in
bronchial PGD2 between the baseline bronchoscopy on day -8 and the infection
bronchoscopy on day 5 in either group (data not shown). As ICS treatment could potentially
be a confounder, the relationship between prescribed ICS dose and nasal PGD2 AUC was
interrogated, revealing an inverse association (Figure 5.2).
Figure 5.1 Nasal PGD2 was not induced by RV-16 in either group
(a) Time course of nasal PGD2 during infection, no differences between groups at any timepoint. (b) No difference in nasal PGD2 induction when analysed as AUC. Bars represent medians. Statistical analysis was using two-way ANOVA or Mann-Whitney test for unpaired samples.
0 2 3 4 5 7 1 00
5 0 0
1 0 0 0
D a y p o s t- in o c u la tio n
Na
sa
l PG
D2
(p
g/m
L)
P lac e b o
OC 4 5 9
0
5 0 0 0
1 0 0 0 0
1 5 0 0 0
2 0 0 0 0
Na
sa
l PG
D2
AU
C (
pg
/mL
)
nsba
OC 459P la ce bo
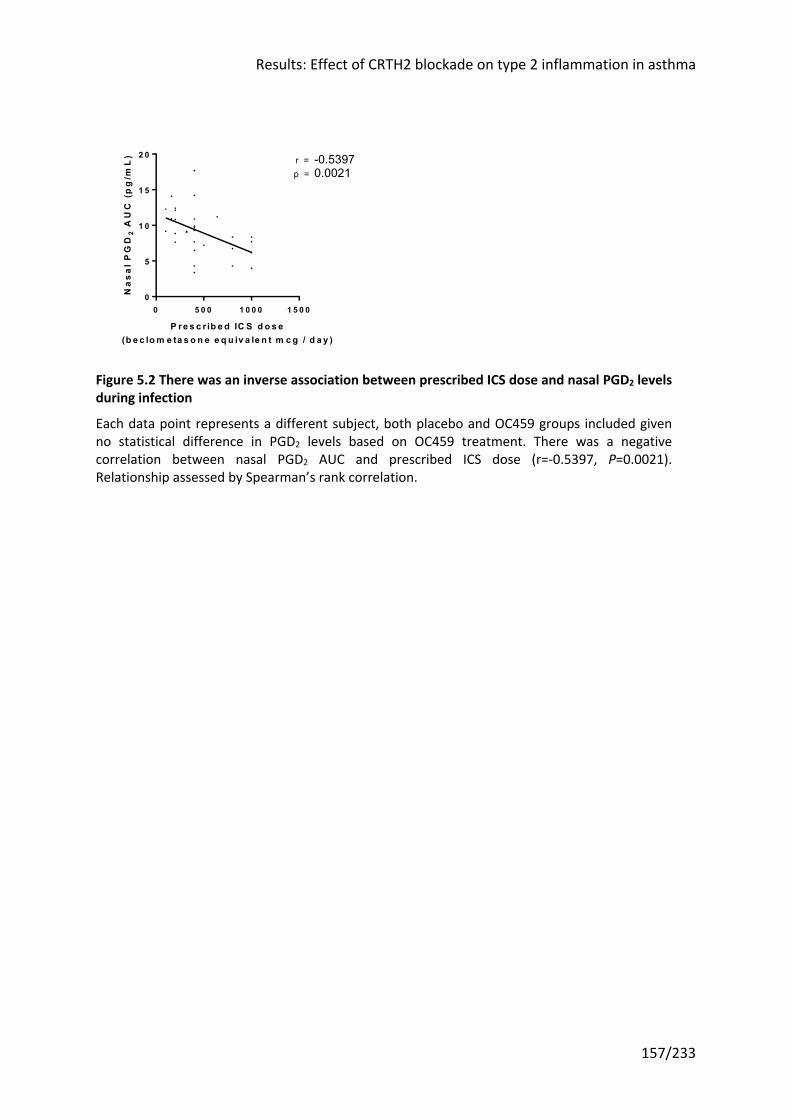
Results: Effect of CRTH2 blockade on type 2 inflammation in asthma
157/233
Figure 5.2 There was an inverse association between prescribed ICS dose and nasal PGD2 levels during infection
Each data point represents a different subject, both placebo and OC459 groups included given no statistical difference in PGD2 levels based on OC459 treatment. There was a negative correlation between nasal PGD2 AUC and prescribed ICS dose (r=-0.5397, P=0.0021). Relationship assessed by Spearman’s rank correlation.
0 5 0 0 1 0 0 0 1 5 0 00
5
1 0
1 5
2 0
P re s c r ib e d IC S d o s e(b e c lo m e ta s o n e e q u iv a le n t m c g / d a y )
Na
sa
l P
GD
2 A
UC
(p
g/m
L) r = -0.5397
0.0021p =
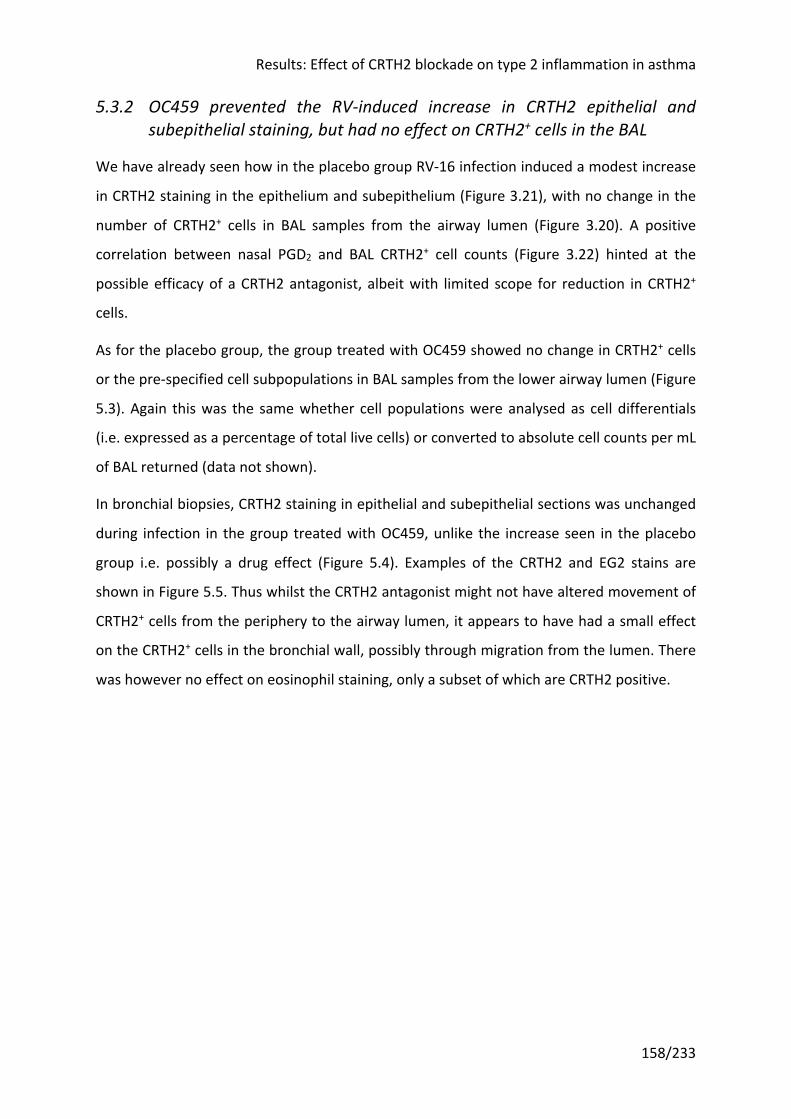
Results: Effect of CRTH2 blockade on type 2 inflammation in asthma
158/233
5.3.2 OC459 prevented the RV-induced increase in CRTH2 epithelial and subepithelial staining, but had no effect on CRTH2+ cells in the BAL
We have already seen how in the placebo group RV-16 infection induced a modest increase
in CRTH2 staining in the epithelium and subepithelium (Figure 3.21), with no change in the
number of CRTH2+ cells in BAL samples from the airway lumen (Figure 3.20). A positive
correlation between nasal PGD2 and BAL CRTH2+ cell counts (Figure 3.22) hinted at the
possible efficacy of a CRTH2 antagonist, albeit with limited scope for reduction in CRTH2+
cells.
As for the placebo group, the group treated with OC459 showed no change in CRTH2+ cells
or the pre-specified cell subpopulations in BAL samples from the lower airway lumen (Figure
5.3). Again this was the same whether cell populations were analysed as cell differentials
(i.e. expressed as a percentage of total live cells) or converted to absolute cell counts per mL
of BAL returned (data not shown).
In bronchial biopsies, CRTH2 staining in epithelial and subepithelial sections was unchanged
during infection in the group treated with OC459, unlike the increase seen in the placebo
group i.e. possibly a drug effect (Figure 5.4). Examples of the CRTH2 and EG2 stains are
shown in Figure 5.5. Thus whilst the CRTH2 antagonist might not have altered movement of
CRTH2+ cells from the periphery to the airway lumen, it appears to have had a small effect
on the CRTH2+ cells in the bronchial wall, possibly through migration from the lumen. There
was however no effect on eosinophil staining, only a subset of which are CRTH2 positive.
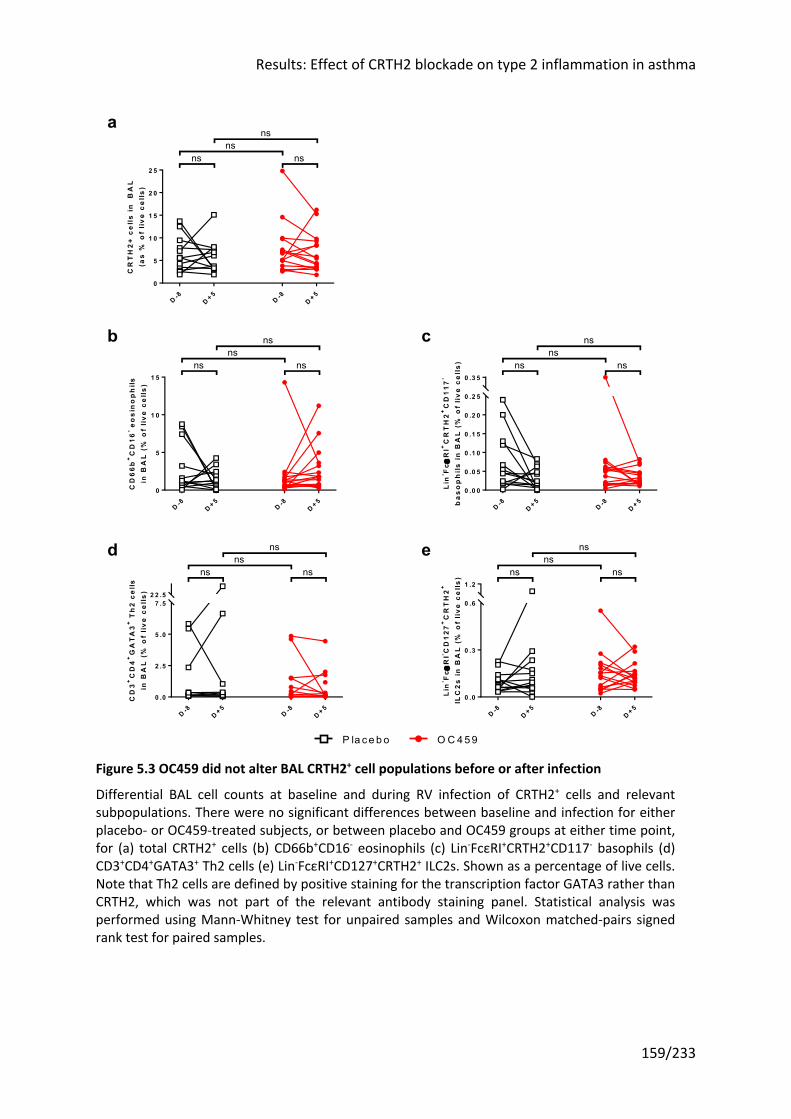
Results: Effect of CRTH2 blockade on type 2 inflammation in asthma
159/233
Figure 5.3 OC459 did not alter BAL CRTH2+ cell populations before or after infection
Differential BAL cell counts at baseline and during RV infection of CRTH2+ cells and relevant subpopulations. There were no significant differences between baseline and infection for either placebo- or OC459-treated subjects, or between placebo and OC459 groups at either time point, for (a) total CRTH2+ cells (b) CD66b+CD16- eosinophils (c) Lin-FcεRI+CRTH2+CD117- basophils (d) CD3+CD4+GATA3+ Th2 cells (e) Lin-FcεRI+CD127+CRTH2+ ILC2s. Shown as a percentage of live cells. Note that Th2 cells are defined by positive staining for the transcription factor GATA3 rather than CRTH2, which was not part of the relevant antibody staining panel. Statistical analysis was performed using Mann-Whitney test for unpaired samples and Wilcoxon matched-pairs signed rank test for paired samples.
D -8D + 5
D -8D + 5
0
5
1 0
1 5
2 0
2 5
CR
TH
2+
ce
lls
in
B
AL
(as
% o
f li
ve
ce
lls
)ns
ns
ns ns
D -8D + 5
D -8D + 5
0
5
1 0
1 5
CD
66b
+C
D16
- eo
sin
op
hils
in B
AL
(%
of
liv
e c
ell
s)
nsns
ns ns
D -8D + 5
D -8D + 5
0 .0 0
0 .0 5
0 .1 0
0 .1 5
0 .2 0
0 .2 5
0 .3 5
nsns
ns ns
Lin
- Fce
RI+
CR
TH
2+
CD
117
-
ba
so
ph
ils
in
BA
L (
% o
f li
ve
cell
s)
D -8D + 5
D -8D + 5
0 .0
2 .5
5 .0
7 .52 2 .5
nsns
ns ns
CD
3+
CD
4+
GA
TA
3+
Th
2 ce
llsin
BA
L (
% o
f li
ve
ce
lls)
OC 459P la ce bo
D -8D + 5
D -8D + 5
0 .0
0 .3
0 .6
1 .2
nsns
ns ns
Lin
- Fce
RI- C
D1
27+
CR
TH
2+
ILC
2s
in
BA
L (
% o
f li
ve c
ell
s)
ed
b
a
c
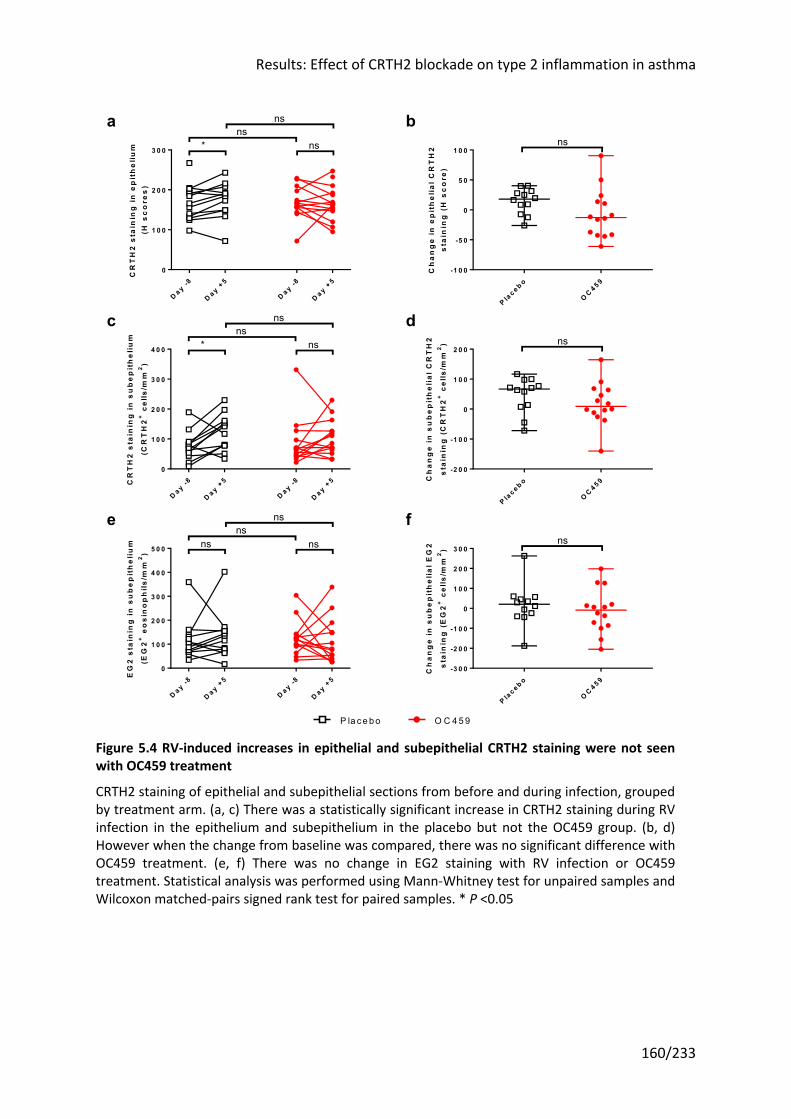
Results: Effect of CRTH2 blockade on type 2 inflammation in asthma
160/233
Figure 5.4 RV-induced increases in epithelial and subepithelial CRTH2 staining were not seen with OC459 treatment
CRTH2 staining of epithelial and subepithelial sections from before and during infection, grouped by treatment arm. (a, c) There was a statistically significant increase in CRTH2 staining during RV infection in the epithelium and subepithelium in the placebo but not the OC459 group. (b, d) However when the change from baseline was compared, there was no significant difference with OC459 treatment. (e, f) There was no change in EG2 staining with RV infection or OC459 treatment. Statistical analysis was performed using Mann-Whitney test for unpaired samples and Wilcoxon matched-pairs signed rank test for paired samples. * P <0.05
D a y -8
D a y +5
D a y -8
D a y +5
0
1 0 0
2 0 0
3 0 0
CR
TH
2 s
tain
ing
in
ep
ith
eli
um
(H s
co
res
)ns
ns
* ns
P lac e b o
OC 4 5 9
-1 0 0
-5 0
0
5 0
1 0 0
Ch
an
ge
in
ep
ith
eli
al
CR
TH
2s
tain
ing
(H
sc
ore
)
ns
D a y -8
D a y +5
D a y -8
D a y +5
0
1 0 0
2 0 0
3 0 0
4 0 0
CR
TH
2 s
tain
ing
in
su
be
pit
he
liu
m
(CR
TH
2+
cel
ls/m
m2
)
nsns
* ns
P lac e b o
OC 4 5 9
-2 0 0
-1 0 0
0
1 0 0
2 0 0
Ch
an
ge
in
su
be
pit
he
lia
l C
RT
H2
sta
inin
g (
CR
TH
2+
cel
ls/m
m2
) ns
D a y -8
D a y +5
D a y -8
D a y +5
0
1 0 0
2 0 0
3 0 0
4 0 0
5 0 0
EG
2 s
tain
ing
in
su
be
pit
he
liu
m
(EG
2+
eo
sin
op
hil
s/m
m2
)
nsns
nsns
P lac e b o
OC 4 5 9
-3 0 0
-2 0 0
-1 0 0
0
1 0 0
2 0 0
3 0 0
Ch
an
ge
in
su
be
pit
he
lia
l E
G2
sta
inin
g (
EG
2+
cel
ls/m
m2
)
ns
O C 459P la ce bo
fe
a b
c d
Results: Effect of CRTH2 blockade on type 2 inflammation in asthma
161/233
a b c
Figure 5.5 Examples of CRTH2 and EG2 staining in bronchial biopsy sections
Photos showing examples of staining for (a) CRTH2+ in brown; arrows show samples of subepithelial CRTH2+ cells (b) EG2+ in red (c) negative control. Internal scale bar = 20μm for all.
To assess whether the immune response had been skewed in the absence of an overall
increase in inflammatory cell numbers, ratios of granulocytes, Th cells and ILCs in the BAL
were analysed. The ratio of eosinophils to neutrophils in the BAL was unchanged with RV
infection in either group, as was the ratio of CD3+CD4+ T cells that were positive for the Th1
transcription factor T-bet compared to those positive for the Th2 transcription factor GATA3
(Figure 5.6). However viewed as a ratio, there was a decrease of CRTH2+ ILC2 cells relative to
CRTH2- CD117- ILC1s in the group treated with the CRTH2 receptor antagonist.
Prior to infection (on day -8), the proportion of CRTH2+ cells in the BAL was related to FeNO
(r=0.39, P=0.0379), blood eosinophils (r=0.39, P=0.0406) and PC20 (r=-0.38, P=0.0480) at
randomization (day -21). The proportion of CRTH2+ cells in the BAL during infection (on day
5) was related to clinical measures including peak upper respiratory symptom score,
maximal fall in PEF and FEV1, RV-16 AUC and FeNO AUC, suggesting that CRTH2+ cells might
be clinically relevant despite the lack of influx of these cells (Figure 5.7).
There was no correlation between CRTH2 staining in biopsies and clinical outcomes.
Subepithelial EG2 staining from biopsies taken on day 5 during infection correlated with
maximal fall in PEF (r=-0.38, P=0.049) and peak FeNO (r=0.40, P=0.0328).
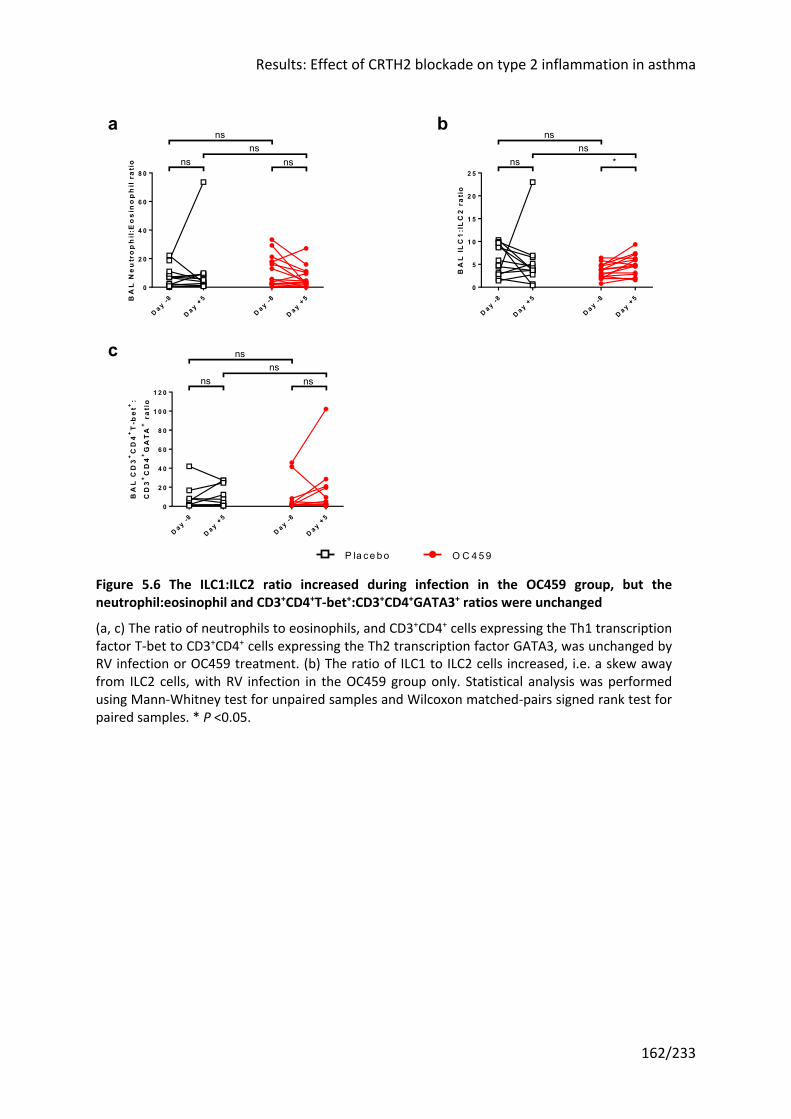
Results: Effect of CRTH2 blockade on type 2 inflammation in asthma
162/233
Figure 5.6 The ILC1:ILC2 ratio increased during infection in the OC459 group, but the neutrophil:eosinophil and CD3+CD4+T-bet+:CD3+CD4+GATA3+ ratios were unchanged
(a, c) The ratio of neutrophils to eosinophils, and CD3+CD4+ cells expressing the Th1 transcription factor T-bet to CD3+CD4+ cells expressing the Th2 transcription factor GATA3, was unchanged by RV infection or OC459 treatment. (b) The ratio of ILC1 to ILC2 cells increased, i.e. a skew away from ILC2 cells, with RV infection in the OC459 group only. Statistical analysis was performed using Mann-Whitney test for unpaired samples and Wilcoxon matched-pairs signed rank test for paired samples. * P <0.05.
D a y -8
D a y +5
D a y -8
D a y +5
0
2 0
4 0
6 0
8 0ns ns
nsns
BA
L N
eu
tro
ph
il:E
os
ino
ph
il r
ati
o
D a y -8
D a y +5
D a y -8
D a y +5
0
5
1 0
1 5
2 0
2 5ns *
nsns
BA
L I
LC
1:I
LC
2 r
ati
o
D a y -8
D a y +5
D a y -8
D a y +5
0
2 0
4 0
6 0
8 0
1 0 0
1 2 0ns ns
nsns
BA
L C
D3
+C
D4
+T
-be
t+:
CD
3+
CD
4+
GA
TA
+ r
ati
o
O C 459P la ce bo
c
ba
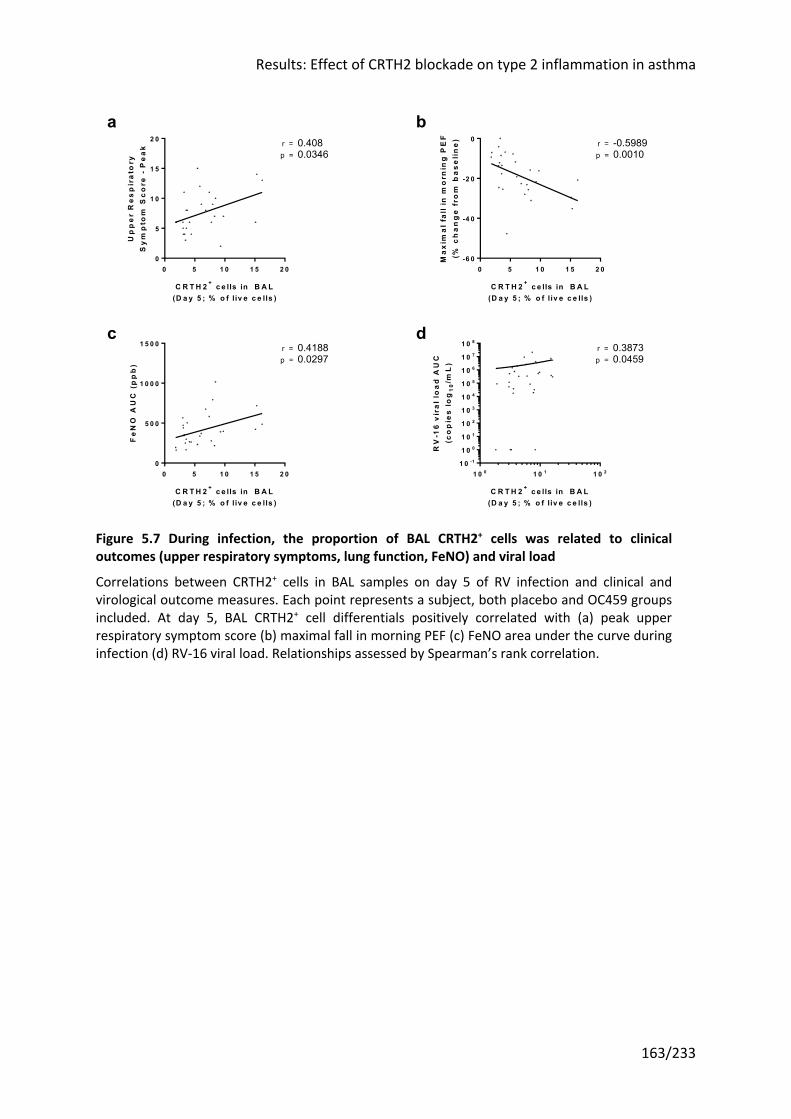
Results: Effect of CRTH2 blockade on type 2 inflammation in asthma
163/233
Figure 5.7 During infection, the proportion of BAL CRTH2+ cells was related to clinical outcomes (upper respiratory symptoms, lung function, FeNO) and viral load
Correlations between CRTH2+ cells in BAL samples on day 5 of RV infection and clinical and virological outcome measures. Each point represents a subject, both placebo and OC459 groups included. At day 5, BAL CRTH2+ cell differentials positively correlated with (a) peak upper respiratory symptom score (b) maximal fall in morning PEF (c) FeNO area under the curve during infection (d) RV-16 viral load. Relationships assessed by Spearman’s rank correlation.
0 5 1 0 1 5 2 00
5
1 0
1 5
2 0
C R T H 2 + c e lls in B A L(D a y 5 ; % o f liv e c e lls )
Up
pe
r R
es
pir
ato
ryS
ym
pto
m S
co
re -
Pe
ak r = 0.408
0.0346p =
0 5 1 0 1 5 2 0-6 0
-4 0
-2 0
0
C R T H 2 + c e lls in B A L(D a y 5 ; % o f liv e c e lls )
Ma
xim
al
fall
in m
orn
ing
PE
F(%
ch
an
ge
fro
m b
as
eli
ne
) r = -0.59890.0010p =
0 5 1 0 1 5 2 00
5 0 0
1 0 0 0
1 5 0 0
C R T H 2 + c e lls in B A L(D a y 5 ; % o f liv e c e lls )
Fe
NO
AU
C (
pp
b)
r = 0.41880.0297p =
1 0 0 1 0 1 1 0 21 0 -1
1 0 0
1 0 1
1 0 2
1 0 3
1 0 4
1 0 5
1 0 6
1 0 7
1 0 8
C R T H 2 + c e lls in B A L(D a y 5 ; % o f liv e c e lls )
RV
-16
vir
al
loa
d A
UC
(co
pie
s l
og
10
/mL
)
r = 0.38730.0459p =
c
ba
d
Results: Effect of CRTH2 blockade on type 2 inflammation in asthma
164/233
5.3.3 Neither RV challenge or OC459 treatment altered the proportion of activated ILC2s
There were insufficient cells in the BAL to stain for intracellular IL-5 (and an additional FMO
control without IL-5). However as OC459 is oral and therefore has systemic effects, it should
block the activation of cells via the CRTH2 receptor, and this mechanism should apply to
cells in the blood.
Blood samples were taken at randomization, after two weeks of drug treatment
(immediately prior to the baseline bronchoscopy), five days after inoculation (again
immediately prior to bronchoscopy), and at the end of the study, six weeks after RV
inoculation and four weeks after discontinuing drug treatment. Samples were stained with
the full antibody panel to identify ILC2s before permeabilization and intracellular staining
with anti-IL-5. A separate control was prepared which was treated identically with the
exception of the anti-IL-5 stain, in order to identify the correct position of the gate.
A large proportion of ILC2 cells stained positively for intracellular IL-5 in most samples
(Figure 5.8). However there were no significant differences between groups at any
timepoint or between timepoints, except for a reduction in the placebo group over the first
two weeks after randomization at day -21 (median 85.5% to 59%) that was not seen in the
OC459 group, but with no differences between placebo and OC459 at either randomization
(day -21) or two weeks later (day -8).
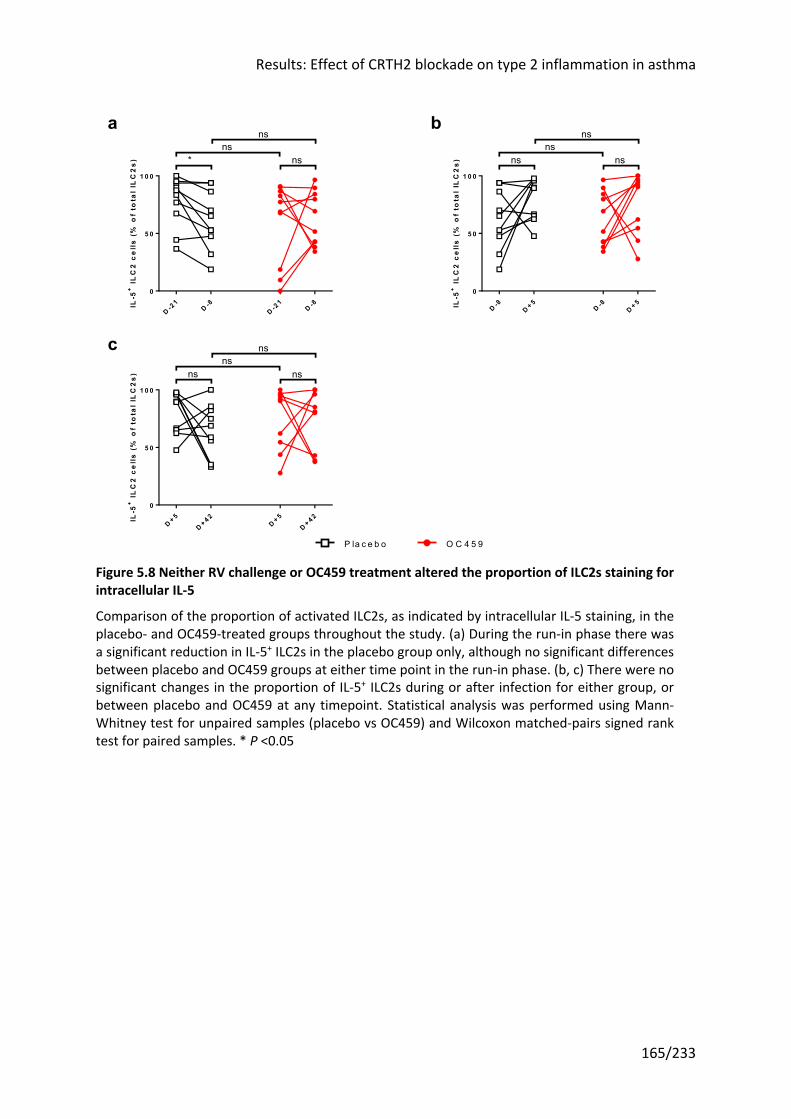
Results: Effect of CRTH2 blockade on type 2 inflammation in asthma
165/233
Figure 5.8 Neither RV challenge or OC459 treatment altered the proportion of ILC2s staining for intracellular IL-5
Comparison of the proportion of activated ILC2s, as indicated by intracellular IL-5 staining, in the placebo- and OC459-treated groups throughout the study. (a) During the run-in phase there was a significant reduction in IL-5+ ILC2s in the placebo group only, although no significant differences between placebo and OC459 groups at either time point in the run-in phase. (b, c) There were no significant changes in the proportion of IL-5+ ILC2s during or after infection for either group, or between placebo and OC459 at any timepoint. Statistical analysis was performed using Mann-Whitney test for unpaired samples (placebo vs OC459) and Wilcoxon matched-pairs signed rank test for paired samples. * P <0.05
D -21
D -8D -2
1D -8
0
5 0
1 0 0
IL-5
+ I
LC
2 c
ell
s (
% o
f to
tal
ILC
2s
)
nsns
* ns
D -8D + 5
D -8D + 5
0
5 0
1 0 0
IL-5
+ I
LC
2 c
ell
s (
% o
f to
tal
ILC
2s
)
nsns
ns ns
D + 5D + 4 2
D + 5D + 4 2
0
5 0
1 0 0
IL-5
+ I
LC
2 c
ell
s (
% o
f to
tal
ILC
2s
)
nsns
nsns
O C 4 5 9P la c e b o
c
ba
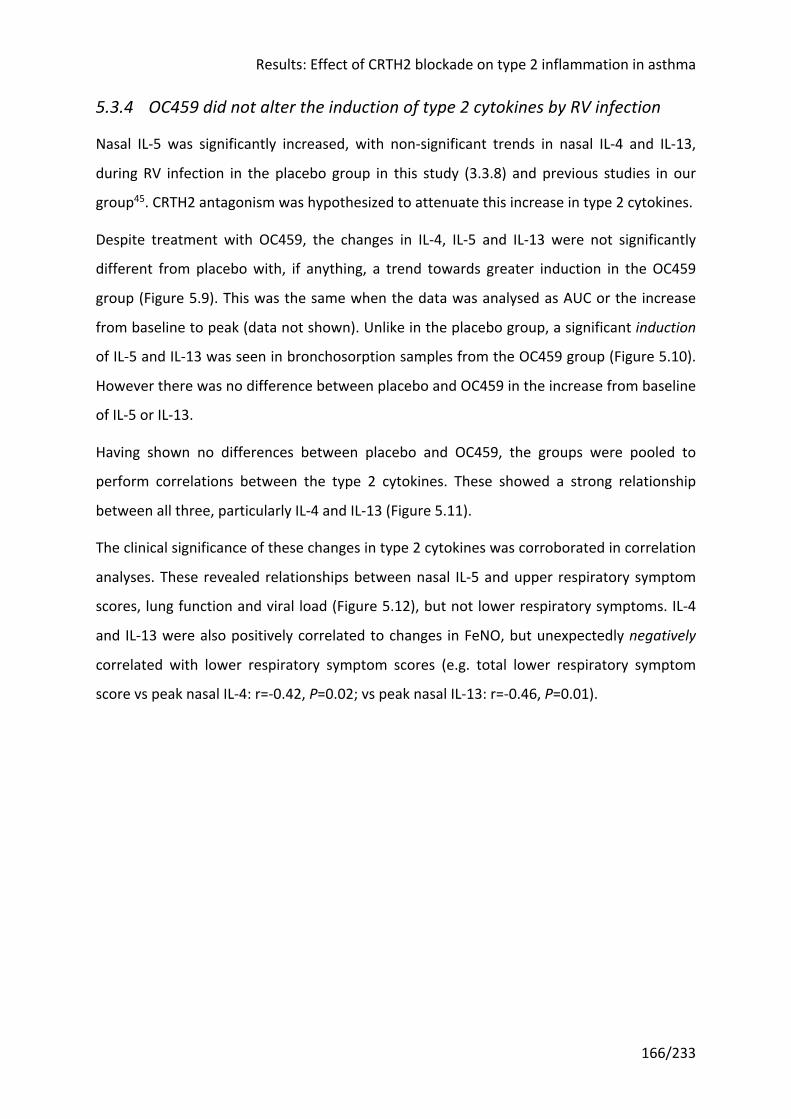
Results: Effect of CRTH2 blockade on type 2 inflammation in asthma
166/233
5.3.4 OC459 did not alter the induction of type 2 cytokines by RV infection
Nasal IL-5 was significantly increased, with non-significant trends in nasal IL-4 and IL-13,
during RV infection in the placebo group in this study (3.3.8) and previous studies in our
group45. CRTH2 antagonism was hypothesized to attenuate this increase in type 2 cytokines.
Despite treatment with OC459, the changes in IL-4, IL-5 and IL-13 were not significantly
different from placebo with, if anything, a trend towards greater induction in the OC459
group (Figure 5.9). This was the same when the data was analysed as AUC or the increase
from baseline to peak (data not shown). Unlike in the placebo group, a significant induction
of IL-5 and IL-13 was seen in bronchosorption samples from the OC459 group (Figure 5.10).
However there was no difference between placebo and OC459 in the increase from baseline
of IL-5 or IL-13.
Having shown no differences between placebo and OC459, the groups were pooled to
perform correlations between the type 2 cytokines. These showed a strong relationship
between all three, particularly IL-4 and IL-13 (Figure 5.11).
The clinical significance of these changes in type 2 cytokines was corroborated in correlation
analyses. These revealed relationships between nasal IL-5 and upper respiratory symptom
scores, lung function and viral load (Figure 5.12), but not lower respiratory symptoms. IL-4
and IL-13 were also positively correlated to changes in FeNO, but unexpectedly negatively
correlated with lower respiratory symptom scores (e.g. total lower respiratory symptom
score vs peak nasal IL-4: r=-0.42, P=0.02; vs peak nasal IL-13: r=-0.46, P=0.01).
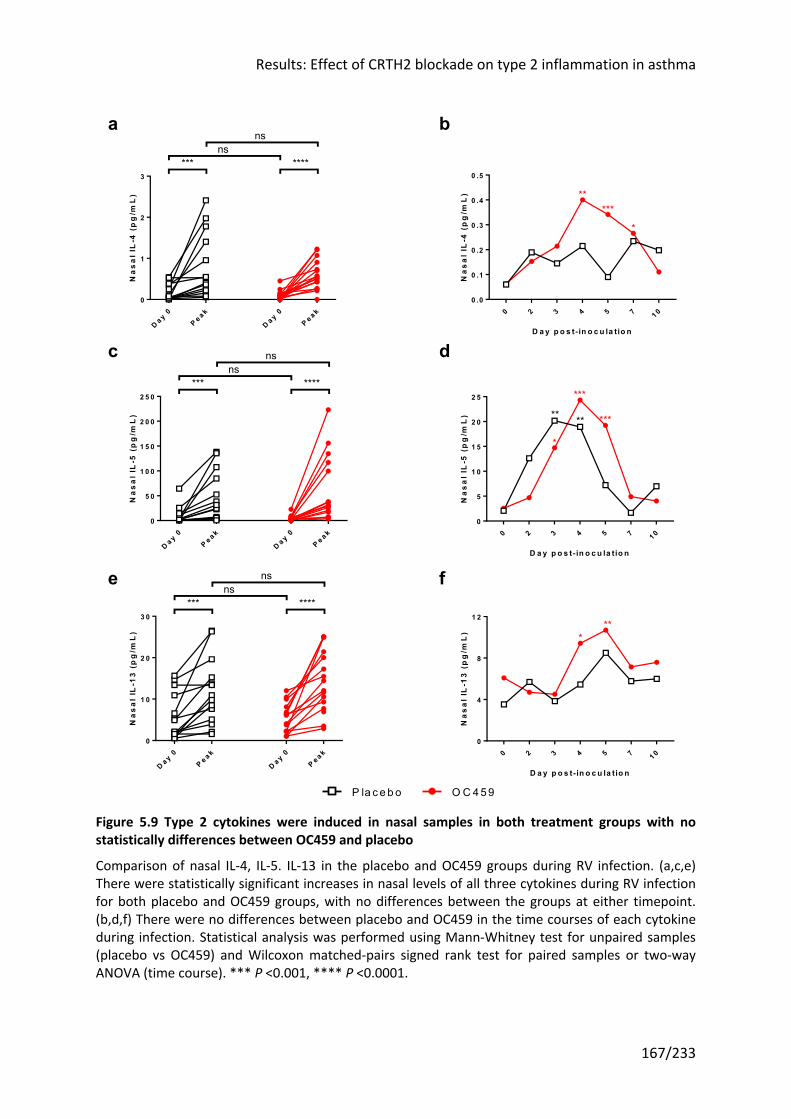
Results: Effect of CRTH2 blockade on type 2 inflammation in asthma
167/233
Figure 5.9 Type 2 cytokines were induced in nasal samples in both treatment groups with no statistically differences between OC459 and placebo
Comparison of nasal IL-4, IL-5. IL-13 in the placebo and OC459 groups during RV infection. (a,c,e) There were statistically significant increases in nasal levels of all three cytokines during RV infection for both placebo and OC459 groups, with no differences between the groups at either timepoint. (b,d,f) There were no differences between placebo and OC459 in the time courses of each cytokine during infection. Statistical analysis was performed using Mann-Whitney test for unpaired samples (placebo vs OC459) and Wilcoxon matched-pairs signed rank test for paired samples or two-way ANOVA (time course). *** P <0.001, **** P <0.0001.
D a y 0P e a k
D a y 0P e a k
0
1
2
3
Na
sa
l IL
-4 (
pg
/mL
)ns
ns*** ****
0 2 3 4 5 7 1 00 .0
0 .1
0 .2
0 .3
0 .4
0 .5
D a y p o s t- in o c u la tio n
Na
sa
l IL
-4 (
pg
/mL
) *****
*
D a y 0P e a k
D a y 0P e a k
0
5 0
1 0 0
1 5 0
2 0 0
2 5 0
Na
sa
l IL
-5 (
pg
/mL
)
nsns
*** ****
0 2 3 4 5 7 1 00
5
1 0
1 5
2 0
2 5
D a y p o s t- in o c u la tio n
Na
sa
l IL
-5 (
pg
/mL
) ** **
*
***
***
D a y 0P e a k
D a y 0P e a k
0
1 0
2 0
3 0
Na
sa
l IL
-13
(p
g/m
L)
nsns
*** ****
0 2 3 4 5 7 1 00
4
8
1 2
D a y p o s t- in o c u la tio n
Na
sa
l IL
-13
(p
g/m
L) *
**
fe
c
ba
d
OC 459P la ce bo
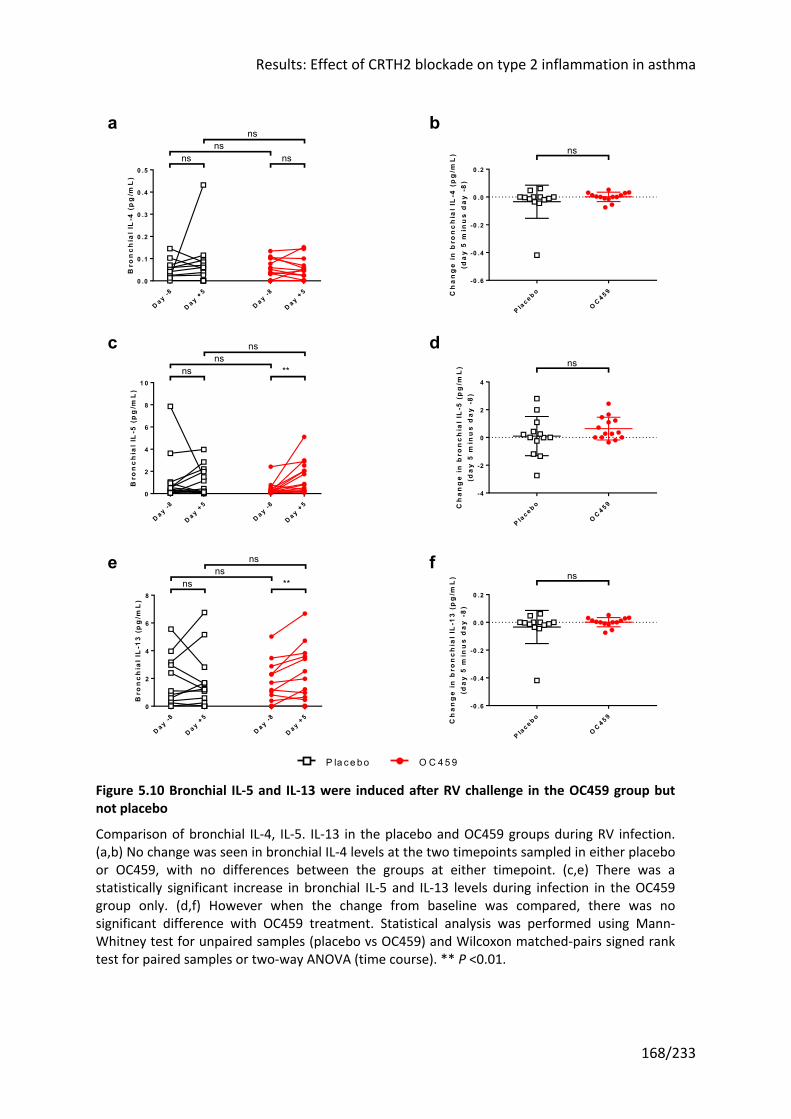
Results: Effect of CRTH2 blockade on type 2 inflammation in asthma
168/233
Figure 5.10 Bronchial IL-5 and IL-13 were induced after RV challenge in the OC459 group but not placebo
Comparison of bronchial IL-4, IL-5. IL-13 in the placebo and OC459 groups during RV infection. (a,b) No change was seen in bronchial IL-4 levels at the two timepoints sampled in either placebo or OC459, with no differences between the groups at either timepoint. (c,e) There was a statistically significant increase in bronchial IL-5 and IL-13 levels during infection in the OC459 group only. (d,f) However when the change from baseline was compared, there was no significant difference with OC459 treatment. Statistical analysis was performed using Mann-Whitney test for unpaired samples (placebo vs OC459) and Wilcoxon matched-pairs signed rank test for paired samples or two-way ANOVA (time course). ** P <0.01.
D a y -8
D a y +5
D a y -8
D a y +5
0 .0
0 .1
0 .2
0 .3
0 .4
0 .5
Bro
nc
hia
l IL
-4 (
pg
/mL
)ns
nsns ns
P lac e b o
OC 4 5 9
-0 .6
-0 .4
-0 .2
0 .0
0 .2
Ch
an
ge
in
bro
nc
hia
l IL
-4 (
pg
/mL
)(d
ay
5 m
inu
s d
ay
-8
)
ns
D a y -8
D a y +5
D a y -8
D a y +5
0
2
4
6
8
1 0
Bro
nc
hia
l IL
-5 (
pg
/mL
)
nsns
ns **
P lac e b o
OC 4 5 9
-4
-2
0
2
4
Ch
an
ge
in
bro
nc
hia
l IL
-5 (
pg
/mL
)(d
ay
5 m
inu
s d
ay
-8
)
ns
D a y -8
D a y +5
D a y -8
D a y +5
0
2
4
6
8
Bro
nc
hia
l IL
-13
(p
g/m
L)
nsns
ns **
P lac e b o
OC 4 5 9
-0 .6
-0 .4
-0 .2
0 .0
0 .2
Ch
an
ge
in
bro
nc
hia
l IL
-13
(p
g/m
L)
(da
y 5
min
us
da
y -
8)
nsfe
c
ba
d
O C 459P la ce bo
Results: Effect of CRTH2 blockade on type 2 inflammation in asthma
169/233
Figure 5.11 There was a strong association between nasal levels of IL-4, IL-5 and IL-13
Variables plotted against each other for each timepoint measured (including day -21 and day 0), both placebo- and OC459-treated subjects included. There were strong positive correlations between (a) nasal IL-4 and IL-5 (b) nasal IL-4 and IL-13 (c) nasal IL-5 and IL-13. Relationship between each pair of variables assessed by Spearman’s rank correlation.
1 0 -3 1 0 -2 1 0 -1 1 0 0 1 0 11 0 -2
1 0 -1
1 0 0
1 0 1
1 0 2
1 0 3
N a s a l IL -4 (p g /m L )
Na
sa
l IL
-5 (
pg
/mL
) p =
r = 0.4677<0.0001
1 0 -3 1 0 -2 1 0 -1 1 0 0 1 0 11 0 -1
1 0 0
1 0 1
1 0 2
N a s a l IL -4 (p g /m L )
Na
sa
l IL
-13
(p
g/m
L)
p =
r = 0.744<0.0001
1 0 -2 1 0 -1 1 0 0 1 0 1 1 0 2 1 0 31 0 -1
1 0 0
1 0 1
1 0 2
N a s a l IL -5 (p g /m L )
Na
sa
l IL
-13
(p
g/m
L)
p =
r = 0.3019<0.0001
a b
c
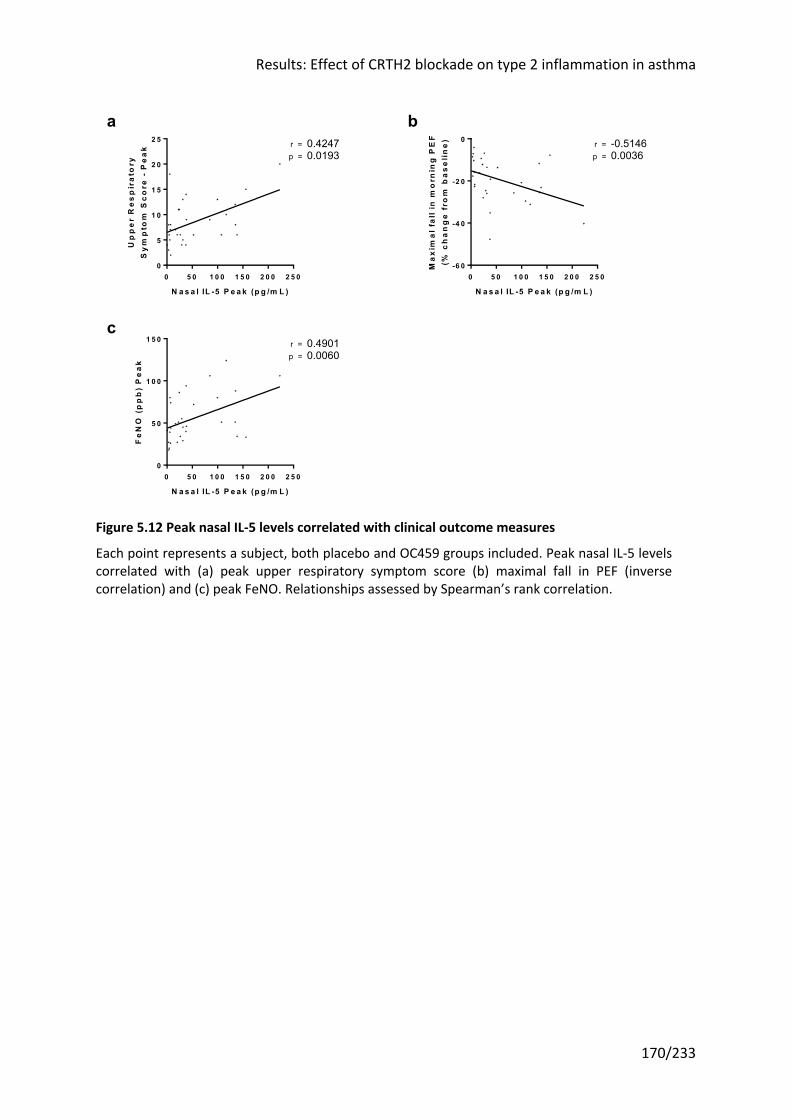
Results: Effect of CRTH2 blockade on type 2 inflammation in asthma
170/233
Figure 5.12 Peak nasal IL-5 levels correlated with clinical outcome measures
Each point represents a subject, both placebo and OC459 groups included. Peak nasal IL-5 levels correlated with (a) peak upper respiratory symptom score (b) maximal fall in PEF (inverse correlation) and (c) peak FeNO. Relationships assessed by Spearman’s rank correlation.
0 5 0 1 0 0 1 5 0 2 0 0 2 5 00
5
1 0
1 5
2 0
2 5
N a s a l IL -5 P e a k (p g /m L )
Up
pe
r R
es
pir
ato
ryS
ym
pto
m S
co
re -
Pe
ak r = 0.4247
0.0193p =
0 5 0 1 0 0 1 5 0 2 0 0 2 5 0-6 0
-4 0
-2 0
0
N a s a l IL -5 P e a k (p g /m L )
Ma
xim
al
fall
in m
orn
ing
PE
F(%
ch
an
ge
fro
m b
as
eli
ne
) r = -0.51460.0036p =
0 5 0 1 0 0 1 5 0 2 0 0 2 5 00
5 0
1 0 0
1 5 0
N a s a l IL -5 P e a k (p g /m L )
Fe
NO
(p
pb
) P
ea
k
r = 0.49010.0060p =
c
ba
Results: Effect of CRTH2 blockade on type 2 inflammation in asthma
171/233
5.3.5 Relationships between PGD2, type 2 inflammatory mediators and CRTH2+ cells
PGD2 signalling via the CRTH2 receptor is hypothesized to promote chemotaxis and
recruitment of CRTH2+ cells, and the activation of CRTH2+ ILC2s and Th2 cells to release type
2 cytokines. Thus these variables should be positively correlated, with this correlation
attenuated or abolished in the presence of a CRTH2 antagonist. To test these hypotheses,
the relationships between PGD2 concentrations (in the upper or lower airways) and CRTH2+
cells in the airways (in the lumen or biopsy sections) or type 2 cytokine levels (in the upper
or lower airways) were examined.
Nasal, but not bronchial, PGD2 correlated with cells staining for the CRTH2 receptor in the
BAL in the placebo group (r=0.4277, P=0.0330; Figure 3.22). By comparison, in the OC459
group where CRTH2 receptor signalling was blocked, this relationship was further from
statistical significance (r=0.29, P=0.1288).
There was a positive correlation between nasal PGD2 and type 2 cytokine levels despite
blockade of PGD2-CRTH2 signalling, reaching statistical significance for IL-5 and IL-13 in the
OC459 group, and IL-4 and IL-13 for those on placebo (Figure 2.3 and Table 5.1). Further
correlations were performed with virus load, a potential confounder driving both PGD2 and
type 2 cytokine release by separate mechanisms, which was found to correlate with IL-5 (for
OC459 group, r=0.45, P<0.0001; for placebo r=0.33, P=0.0005) but not IL-4 or IL-13.
As the epithelial-derived cytokines IL-25, IL-33 and TSLP can also trigger type 2 cytokine
release in vitro and in animal models, particularly following viral infections, they were also
analysed. RV infection induced rises in all three epithelial cytokines in nasal samples (data
not shown) and nasal levels of IL-25, IL-33 and TSLP each positively correlated with nasal
levels of type 2 cytokine in both the placebo and OC459 groups (Table 2.2). This was
particularly true of TSLP and its relationship with IL-4 and IL-13.
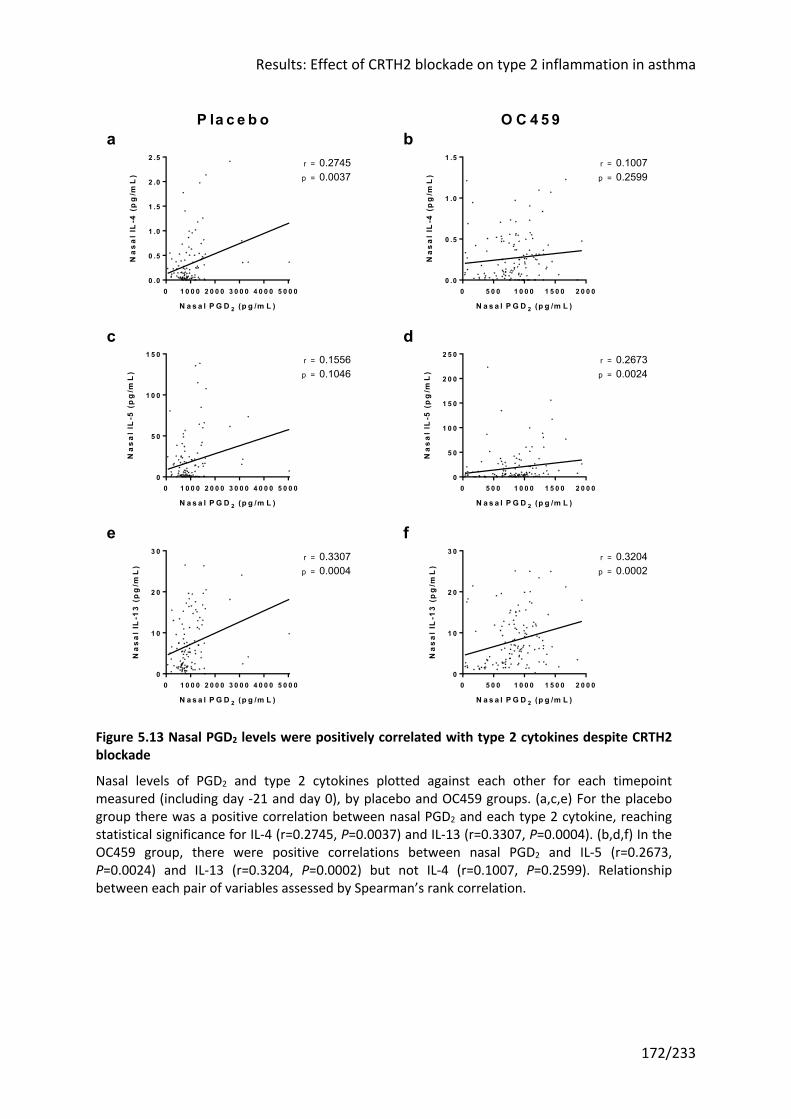
Results: Effect of CRTH2 blockade on type 2 inflammation in asthma
172/233
Figure 5.13 Nasal PGD2 levels were positively correlated with type 2 cytokines despite CRTH2 blockade
Nasal levels of PGD2 and type 2 cytokines plotted against each other for each timepoint measured (including day -21 and day 0), by placebo and OC459 groups. (a,c,e) For the placebo group there was a positive correlation between nasal PGD2 and each type 2 cytokine, reaching statistical significance for IL-4 (r=0.2745, P=0.0037) and IL-13 (r=0.3307, P=0.0004). (b,d,f) In the OC459 group, there were positive correlations between nasal PGD2 and IL-5 (r=0.2673, P=0.0024) and IL-13 (r=0.3204, P=0.0002) but not IL-4 (r=0.1007, P=0.2599). Relationship between each pair of variables assessed by Spearman’s rank correlation.
0 1 0 0 0 2 0 0 0 3 0 0 0 4 0 0 0 5 0 0 00 .0
0 .5
1 .0
1 .5
2 .0
2 .5
N a s a l P G D 2 (p g /m L )
Na
sa
l IL
-4 (
pg
/mL
) p =
r = 0.27450.0037
0 5 0 0 1 0 0 0 1 5 0 0 2 0 0 00 .0
0 .5
1 .0
1 .5
N a s a l P G D 2 (p g /m L )
Na
sa
l IL
-4 (
pg
/mL
) p =
r = 0.10070.2599
0 1 0 0 0 2 0 0 0 3 0 0 0 4 0 0 0 5 0 0 00
5 0
1 0 0
1 5 0
N a s a l P G D 2 (p g /m L )
Na
sa
l IL
-5 (
pg
/mL
) p =
r = 0.15560.1046
0 5 0 0 1 0 0 0 1 5 0 0 2 0 0 00
5 0
1 0 0
1 5 0
2 0 0
2 5 0
N a s a l P G D 2 (p g /m L )
Na
sa
l IL
-5 (
pg
/mL
) p =
r = 0.26730.0024
0 1 0 0 0 2 0 0 0 3 0 0 0 4 0 0 0 5 0 0 00
1 0
2 0
3 0
N a s a l P G D 2 (p g /m L )
Na
sa
l IL
-13
(p
g/m
L)
p =
r = 0.33070.0004
0 5 0 0 1 0 0 0 1 5 0 0 2 0 0 00
1 0
2 0
3 0
N a s a l P G D 2 (p g /m L )
Na
sa
l IL
-13
(p
g/m
L)
p =
r = 0.32040.0002
O C 4 5 9P la c e b o
fe
a b
c d
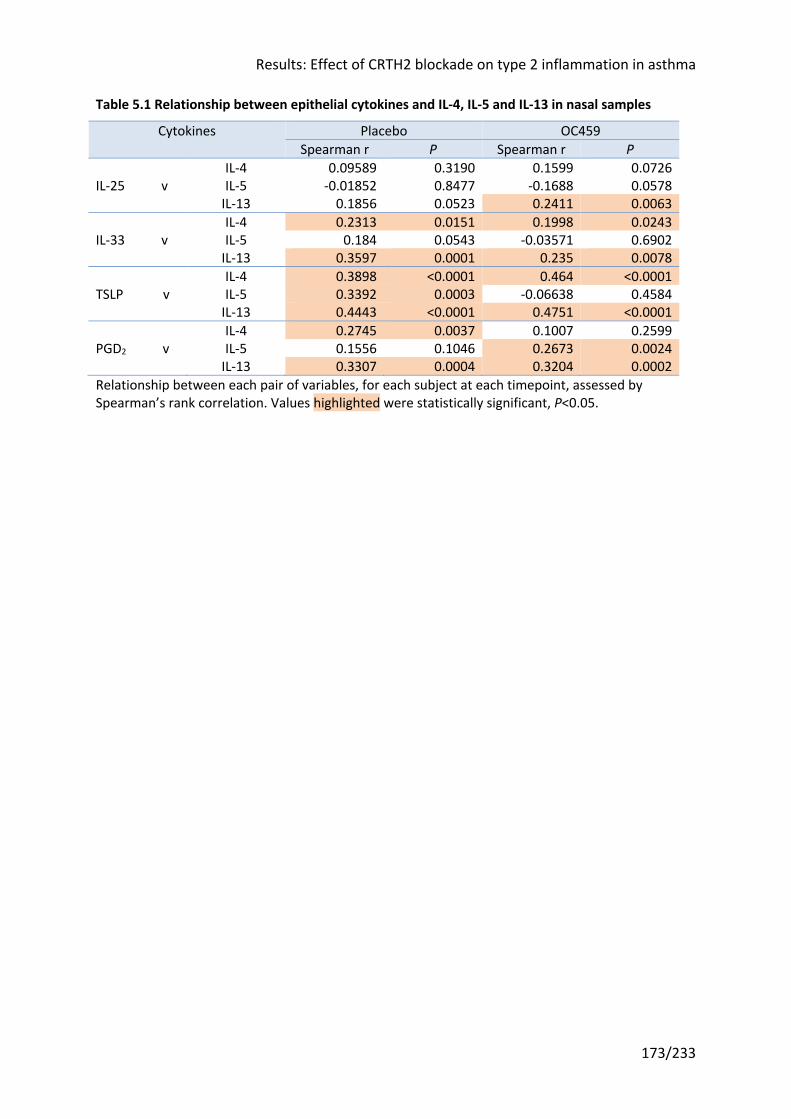
Results: Effect of CRTH2 blockade on type 2 inflammation in asthma
173/233
Table 5.1 Relationship between epithelial cytokines and IL-4, IL-5 and IL-13 in nasal samples
Cytokines Placebo OC459 Spearman r P Spearman r P
IL-4 0.09589 0.3190 0.1599 0.0726 IL-25 v IL-5 -0.01852 0.8477 -0.1688 0.0578 IL-13 0.1856 0.0523 0.2411 0.0063 IL-4 0.2313 0.0151 0.1998 0.0243 IL-33 v IL-5 0.184 0.0543 -0.03571 0.6902 IL-13 0.3597 0.0001 0.235 0.0078 IL-4 0.3898 <0.0001 0.464 <0.0001 TSLP v IL-5 0.3392 0.0003 -0.06638 0.4584 IL-13 0.4443 <0.0001 0.4751 <0.0001 IL-4 0.2745 0.0037 0.1007 0.2599 PGD2 v IL-5 0.1556 0.1046 0.2673 0.0024 IL-13 0.3307 0.0004 0.3204 0.0002 Relationship between each pair of variables, for each subject at each timepoint, assessed by Spearman’s rank correlation. Values highlighted were statistically significant, P<0.05.
Results: Effect of CRTH2 blockade on type 2 inflammation in asthma
174/233
5.4 Discussion This chapter examined the results from the mechanistic analyses contained within the trial
design. Specifically it considered the effect of the CRTH2 antagonist OC459 on numbers of
CRTH2+ cells and levels of type 2 cytokines in the airways, both hypothesized to be driven at
least in part by PGD2 binding to the CRTH2 receptor. It furthermore considered whether
there were relationships between these parameters and PGD2 levels, as well as examining
whether there were relationships between levels of type 2 cytokines in the airways and
alternative regulators of type 2 inflammation, IL-25, IL-33 and TSLP.
5.4.1 OC459 did not affect PGD2 levels, which were not induced by RV infection
As in the placebo group (Figure 3.13), there was no induction of PGD2 in nasal or bronchial
samples during infection with RV-16 (Figure 5.1). Whilst this could be due to the sampling
and sample processing methods, particularly given the propensity for PGD2 to
spontaneously degrade, an earlier RV challenge study using similar techniques observed a
rise in PGD2 in nasal lavage61. The subjects in this study were all on ICS which may have
suppressed PGD2, whereas in the earlier study there were a mix of ICS-naïve and ICS-treated
participants. Thus we saw that the prescribed dose of ICS was negatively correlated with
nasal PGD2 (Figure 5.2). This may be particularly salient given the trend towards a higher ICS
dose in the OC459 group that neared significance (544 ±292mcg beclometasone equivalent
per day vs 357 ±258, P=0.0757; Table 3.1). Regardless of the underlying reason, the lack of
PGD2 induction means there was less substrate for the drug to block, although levels were
still readily recorded in both the upper and lower airways, both pre- and post-infection.
The effect, or rather lack thereof, of CRTH2 antagonism on PGD2 levels in vivo has not been
previously reported. This is contrary to the outcome of CRTH2 blockade in a mouse model of
RSV bronchiolitis51. These mice were co-exposed to pneumovirus of mice (PVM) and
cockroach allergen extract (CRE), whereas subjects in this study were not explicitly
challenged with allergen, although almost three quarters were sensitized to the perennial
allergen HDM (Table 3.1). It may be that differences in the species studied, virus and
allergen challenge used, and/or severity of disease induced account for the discrepant
findings. It is also possible that PGD2 is more important in driving type 2 inflammation in
allergen than virus challenge. In support of this, a human allergen challenge study using
Results: Effect of CRTH2 blockade on type 2 inflammation in asthma
175/233
OC459 found significant inhibition of the late asthmatic response (lung function post-
challenge) and allergen-induced sputum eosinophilia180; a similar result was reported in an
allergen study of the CRTH2 antagonist setipiprant182.
5.4.2 OC459 prevented the increase in CRTH2+ cells in the bronchial wall, but had no effect on numbers in the airway lumen
CRTH2 antagonism had a modest effect on the number of CRTH2+ cells in the lungs, with an
increase in CRTH2 staining in the bronchial wall observed following RV infection in the
placebo group which was not seen in the OC459 group (Figure 5.4). This apparent difference
in response to infection could be artefact owing to the single timepoint sampled, the low
numbers of subjects studied, or limitation in the increase in CRTH2 staining due to ICS
suppression of CRTH2+ cell populations as previously discussed. There was no change in
CRTH2+ cell numbers in the airway lumen with placebo or OC459 treatment (Figure 5.3).
However OC459 promoted a shift in favour of ILC1 over ILC2 (Figure 5.6), a ratio which was
associated with exacerbation severity in a recent RV challenge study in our group168.
An effect of OC459 on trafficking of CRTH2+ cells to the bronchial epithelium and
subepithelium could be important, although it must be interpreted with caution given the
lack of clinical correlation. The only previous report relating CRTH2+ cell numbers to clinical
measures found associations between CRTH2+ BAL cells and asthma severity as defined by
treatment intensity, a history of a recent asthma exacerbation, and asthma control125.
Eosinophils make up the largest proportion of CRTH2+ cells (at least in the blood)129 and are
better researched. A review of biopsy studies in asthma concluded that ICS treatment
reduces eosinophil counts in biopsies whilst noting the beneficial clinical effects of ICS,
without reporting on any relationships between the two253. More recently two studies of
anti-IL-5 biologicals have reported eosinophil counts in airway mucosa, as a mechanistic
measure284,285. In the first, mepolizumab did not reduce eosinophils in bronchial biopsies
and did not improve clinical outcomes, notwithstanding reductions of 55% and 100% in BAL
and blood eosinophils284. The other investigators found three months benralizumab
treatment produced a 96% reduction in airway mucosal eosinophils, although they did not
measure clinical benefit285. Both mepolizumab and benralizumab have since been shown to
be highly effective in severe uncontrolled eosinophilic asthma46, although no one has
correlated this with bronchial mucosal eosinophil counts.
Results: Effect of CRTH2 blockade on type 2 inflammation in asthma
176/233
In this study there was a relationship between subepithelial eosinophils during infection and
lung function. However OC459 treatment did not alter eosinophil numbers in the BAL or
bronchial biopsies at baseline or after infection (Figure 5.3 and Figure 5.4). The only
previous study of a CRTH2 antagonist (fevipiprant) to examine eosinophil counts in samples
from the lower airways, sputum and bronchial biopsies, found statistically significant
reductions in sputum eosinophilia and in bronchial submucosal eosinophils after 12 weeks
compared to baseline, but not in epithelial eosinophils189. This is at odds with the findings of
the current trial. The subjects in the fevipiprant study had more severe disease, with a
sputum eosinophilia of ≥2% and either an ACQ ≥1.5 or ≥1 severe exacerbation in the last
year, and therefore may have had a higher eosinophil count at baseline, although the
absolute number of submucosal eosinophils was not reported. Potentially offsetting the
effect of greater disease severity was a higher dose of ICS (range of 800-1600mcg
beclometasone equivalent per day), although biopsies from ICS-naïve subjects with mild
asthma have low eosinophil counts, suggesting mucosal eosinophils are unaffected by ICS
dose284.
5.4.3 OC459 did not impact the RV-induced increase in type 2 cytokines
Intracellular IL-5 staining confirmed nearly all the samples contained IL-5+ ILC2s, and that
these usually formed a high proportion of total ILC2s (Figure 5.8). This is unsurprising given
ILC2s appear to constitutively express IL-558. There was a small decrease in the proportion of
IL-5+ ILC2s in the placebo group only in the first two weeks after enrolment, which may
reflect improved adherence with ICS treatment. However the proportion of IL-5+ ILC2s
otherwise did not change with RV infection or OC459 treatment. This may have been limited
by the high numbers at baseline. Nonetheless CRTH2 antagonism may block the release of
this pre-formed IL-5, rather than reducing the number of ILC2s containing IL-5, and levels of
IL-5 in the airway provide a proxy for this. Measures of nasal and bronchial cytokines
showed this not to be the case (Figure 5.9 and Figure 5.10); indeed there was a suggestion
of greater type 2 cytokine induction in the lower airways of OC459-treated subjects,
although there were no statistical differences when comparing the treatment groups. The
changes in nasal type 2 cytokine levels were modest compared to those seen following nasal
allergen challenge in subjects with allergic rhinitis173,174.
Results: Effect of CRTH2 blockade on type 2 inflammation in asthma
177/233
5.4.4 Type 2 cytokine levels were closely related; the role of IL-4 and IL-13 may slightly diverge from IL-5
The cytokine data presented confirms the close relationship between IL-4, IL-5 and IL-13 in
the upper airways at least (Figure 5.11). These are conventionally grouped under the single
bracket of ‘type 2’ cytokines, as they can all be produced by Th2 cells and ILC2s, although
ILC2s are thought to preferentially produce IL-5 and IL-13286,287. Comparing paired
measurements of these cytokines in samples from individual timepoints for each subject
hint at the possibility that IL-4 and IL-13 are more closely linked than IL-5.
Th2 cells express both IL-4 and IL-5 mRNA but little protein, possibly due to rapid release of
cytokine. This makes it difficult to ascertain their relative contribution to IL-4 and IL-5
protein levels, and to determine whether the same Th2 cells produce both cytokines or
whether subsets of Th2 cells produce each (mast cells and eosinophils also stain positively
for IL-4 and IL-5 protein)288. In vitro studies of Th2 cells show that knocking down GATA3
expression with an anti-sense RNA has a far greater effect on IL-4 and IL-13 mRNA than IL-5
mRNA289. Thus the respective cytokine gene promoters may have different affinities for
GATA3 binding, with a lower threshold level of GATA3 required to promote IL-5 than IL-4/-
13. Alternatively mRNA stability may explain these differences.
IL-4 and IL-13 have overlapping functions arising from a shared receptor (the ‘type 2’
receptor complex made of the IL-4 receptor α and IL-13 receptor α1 subunits), and even
though both also bind other receptors, a close relationship makes biological sense290. This is
evident in the biological redundancy between the two: disrupting either IL-4 or IL-13
signalling alone in asthma is either clinically ineffective (IL-4)291 or of limited benefit (IL-
13)292-294, whereas targeting both via the IL-4 receptor α subunit, that forms part of the
shared receptor complex for IL-4 and IL-13, is highly efficacious47.
Cluster analyses of asthma cohorts have furthermore shown that groups with high
eosinophil counts and groups with high IgE levels (and other markers of allergy) only
partially overlap295. Perhaps unsurprisingly, anti-IL-5 is ineffective in atopic diseases (e.g.
atopic dermatitis296), disease phenotypes or models (e.g. the late asthmatic response
following allergen challenge297), unlike compounds targeting IL-4/-13298-300.
Results: Effect of CRTH2 blockade on type 2 inflammation in asthma
178/233
5.4.5 Strong correlations between type 2 cytokines and IL-33 and TSLP persisted in the presence of CRTH2 antagonism
The drug in this clinical trial targeted PGD2-CRTH2 signalling hypothesized to sit upstream of
IL-4, IL-5 and IL-13 release. There are other mediators that have also been put forward as
regulators of type 2 cytokine release, in particular the epithelial cytokines IL-25, IL-33, and
TSLP, all of which the author was able to quantify in this study. In the absence of PGD2-
CRTH2 blockade, all except IL-25 were correlated with IL-4/-13, further reinforcing the
suggestion that IL-4/-13 are distinct from IL-5 (Table 5.1). By contrast, IL-5 was only related
to TSLP levels. Moreover IL-33 and TSLP had statistically significant correlations with IL-4 and
IL-13 even in the presence of CRTH2 antagonism (this was also true of PGD2 for IL-13 and IL-
5, likely due to a confounding variable independent of CRTH2 that co-varied with both PGD2
and IL-13/-5 given that CRTh2 receptor signalling was blocked). This may explain why CRTH2
antagonism alone was ineffective.
The stronger relationships of the type 2 cytokines, including IL-5, with TSLP are consistent
with the results of a recent clinical trial of an anti-TSLP monoclonal which reported larger
reductions in exacerbations than seen with the anti-IL-5 agents and found anti-TSLP was
effective independent of the presence of (IL-5-driven) eosinophilia67.
Results: Effect of CRTH2 blockade on type 2 inflammation in asthma
179/233
5.5 Summary of key points • There was little change in CRTH2+ inflammatory cells in the airways following RV
challenge alone and, perhaps as a consequence, little difference with CRTH2 antagonist
treatment
• There were small improvements with OC459 treatment in the ILC1:ILC2 ratio in the BAL
and CRTH2+ cells in bronchial biopsies, which may or may not be clinically relevant
• A high proportion of ILC2s stained positively for intracellular IL-5, that was unchanged by
RV infection or OC459
• OC459 did not suppress RV-induced type 2 cytokine release; in fact levels of IL-5 and IL-
13 in bronchial samples were significantly higher during RV infection compared with
before infection in the OC459 group, although statistically there was no difference from
the placebo group
• Cytokine data reaffirmed the strong relationship between type 2 cytokines and
additionally hinted at separate pathways for IL-4/-13 and IL-5
• Type 2 cytokines were positively correlated with the ‘master’ cytokines IL-33 and TSLP
even in the presence of CRTH2 antagonism, implying redundancy with the PGD2-CRTH2
pathway
• TSLP had the strongest relationship with type 2 cytokines, corroborating a recent clinical
trial result with anti-TSLP therapy
Results: Effect of CRTH2 blockade on antiviral immunity in asthma
180/233
6 Results: Effect of CRTH2 blockade on antiviral immunity in asthma
6.1 Introduction Chapter 1 set out the evidence for deficient type I and III IFN responses (IFN-α, -β, and –λ) in
asthma95-103. One of the proposed mechanisms for this is an inhibitory effect of excess type
2 cytokines. The hypothesis followed that knocking down type 2 inflammation in vivo, for
example with a CRTH2 antagonist, had the potential to restore IFN responses to viral
infection. Recently investigators have indeed observed an increase in IFN in vivo following
CRTH2 blockade in an allergic mouse model subsequently infected with a respiratory virus51.
A plan was therefore made to both measure virus load, IFN and type 2 cytokine levels in
vivo, and to repeat the ex vivo infection studies on BEC cultures from subjects treated with
OC459 and placebo. Specifically, IFN-α and IFN-λ1 (IL-29) were quantified in samples of
airway lining fluid (nasosorption and bronchosorption), but not IFN-β owing to the limited
volume of sample available. In the ex vivo BEC infection studies, IFN-β, IFN-λ1 (IL-29) and
IFN-λ2/3 (IL-28) were measured, but not IFN-α which is produced by leukocytes but not
BECs.
The previous results chapter has shown that type 2 inflammation was not affected by CRTH2
antagonism with OC459 in this study. Yet gene array analysis of lungs from allergen-
challenged mice reveals that CRTH2 antagonist treatment affects a wide range of genes
beyond those encoding type 2 cytokines301. Moreover in the study referenced above
utilizing combined respiratory virus and allergen challenge in mice51, the mechanism for the
restoration of IFN responses appeared to be independent of type 2 cytokines as IL-13
blockade had no impact on IFN or virus levels (admittedly without IL-4 or IL-5 blockade).
Thus it remains possible that CRTH2 antagonism might have had antiviral effects following
RV challenge in the absence of an effect on type 2 cytokines (or in the mouse study, by
lessening all three of IL-4, IL-5 and IL-13, not IL-13 alone).
The data gathered in the course of this exercise sheds further light on the relationships
between IFNs and type 2 inflammation in vivo. Previous work has suggested type 2
cytokines and IFN can exert negative effects on the expression of each other (110-112,302-306),
Results: Effect of CRTH2 blockade on antiviral immunity in asthma
181/233
therefore should be negatively correlated with type I and III IFNs. Equally RV infection in
asthma is known to provoke both release of both IFNs62 and type 2 cytokines45, which would
lead to a positive correlation between the two.
6.2 Hypothesis and aims CRTH2 blockade (with OC459) improves antiviral immunity in asthma, as evidenced
following rhinovirus challenge by (relative to placebo)
i. reduced viral load
ii. increased antiviral interferons in the airways
iii. increased expression of antiviral interferons in bronchial epithelial cells cultured
from subjects treated with OC459, correlated with clinical outcomes
In addition that
iv. type 2 cytokines suppress the production of, and are therefore negatively correlated
with, antiviral interferons
6.3 Results
6.3.1 CRTH2 antagonism did not reduce virus load
Virus was detected by qPCR in at least one nasal sample for 26/30 subjects with confirmed
infection (in the others infection was confirmed by seroconversion (3/30) or standard PCR).
Two subjects in each group did not have quantifiable virus copies.
In vitro, RV-16 infection of primary BECs results in significantly increased virus production
when the BECs are from subjects with asthma than those without96,97. Experimental
infection with RV-16 in vivo, where the dose and timing of the inoculum is known, has
resulted in both similar virus loads regardless of asthma status in some studies28,164, and
greater virus copies in asthma in others45,168. In the current study, there were no differences
between the groups in virus load peaks, AUC, or at individual time points (Figure 6.1).
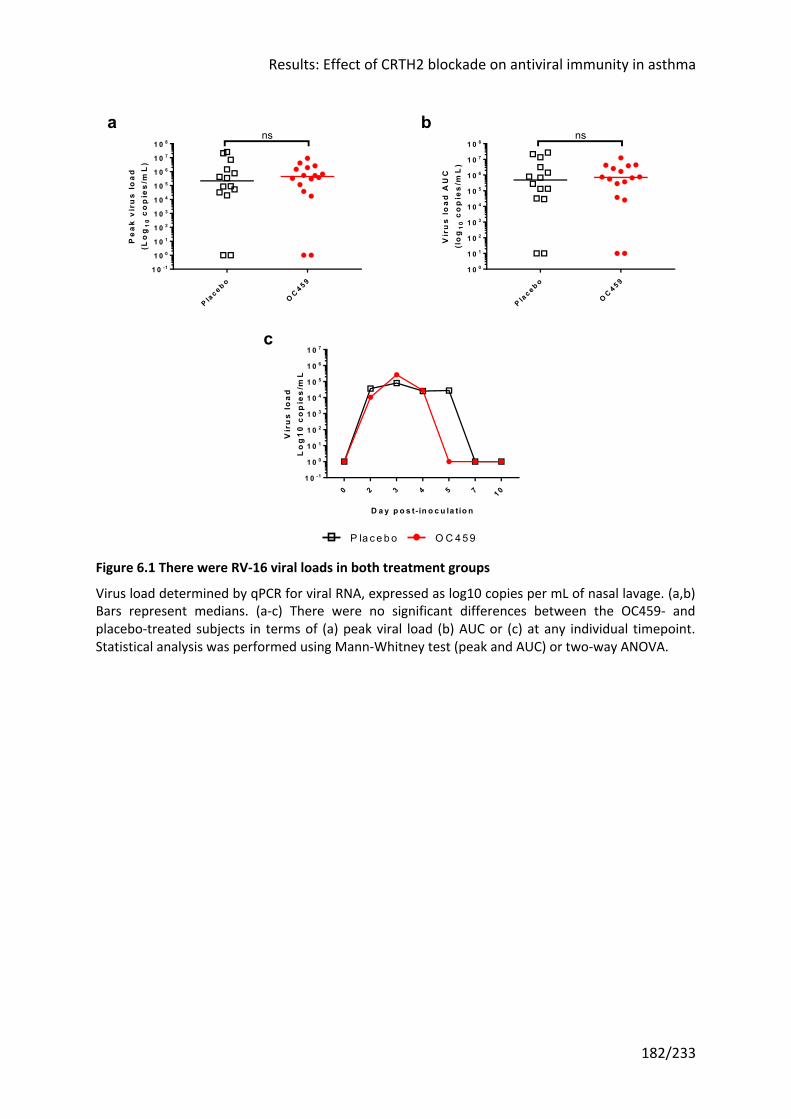
Results: Effect of CRTH2 blockade on antiviral immunity in asthma
182/233
Figure 6.1 There were RV-16 viral loads in both treatment groups
Virus load determined by qPCR for viral RNA, expressed as log10 copies per mL of nasal lavage. (a,b) Bars represent medians. (a-c) There were no significant differences between the OC459- and placebo-treated subjects in terms of (a) peak viral load (b) AUC or (c) at any individual timepoint. Statistical analysis was performed using Mann-Whitney test (peak and AUC) or two-way ANOVA.
P lac e b o
OC 4 5 9
1 0 -1
1 0 0
1 0 1
1 0 2
1 0 3
1 0 4
1 0 5
1 0 6
1 0 7
1 0 8
Pe
ak
vir
us
lo
ad
(Lo
g1
0c
op
ies
/mL
)ns
P lac e b o
OC 4 5 9
1 0 0
1 0 1
1 0 2
1 0 3
1 0 4
1 0 5
1 0 6
1 0 7
1 0 8
Vir
us
lo
ad
AU
C(l
og
10
co
pie
s/m
L)
ns
0 2 3 4 5 7 1 01 0 -1
1 0 0
1 0 1
1 0 2
1 0 3
1 0 4
1 0 5
1 0 6
1 0 7
D a y p o s t- in o c u la tio n
Vir
us
lo
ad
Lo
g1
0 c
op
ies
/mL
P la ce bo O C 459
a b
c
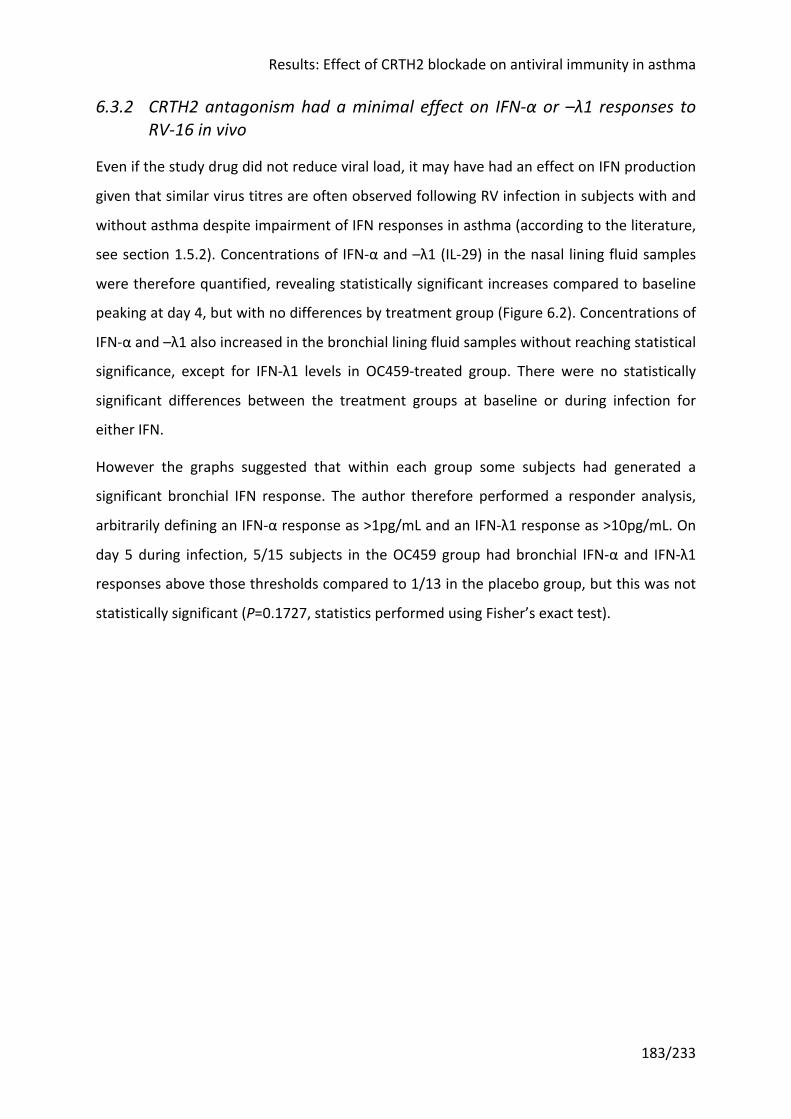
Results: Effect of CRTH2 blockade on antiviral immunity in asthma
183/233
6.3.2 CRTH2 antagonism had a minimal effect on IFN-α or –λ1 responses to RV-16 in vivo
Even if the study drug did not reduce viral load, it may have had an effect on IFN production
given that similar virus titres are often observed following RV infection in subjects with and
without asthma despite impairment of IFN responses in asthma (according to the literature,
see section 1.5.2). Concentrations of IFN-α and –λ1 (IL-29) in the nasal lining fluid samples
were therefore quantified, revealing statistically significant increases compared to baseline
peaking at day 4, but with no differences by treatment group (Figure 6.2). Concentrations of
IFN-α and –λ1 also increased in the bronchial lining fluid samples without reaching statistical
significance, except for IFN-λ1 levels in OC459-treated group. There were no statistically
significant differences between the treatment groups at baseline or during infection for
either IFN.
However the graphs suggested that within each group some subjects had generated a
significant bronchial IFN response. The author therefore performed a responder analysis,
arbitrarily defining an IFN-α response as >1pg/mL and an IFN-λ1 response as >10pg/mL. On
day 5 during infection, 5/15 subjects in the OC459 group had bronchial IFN-α and IFN-λ1
responses above those thresholds compared to 1/13 in the placebo group, but this was not
statistically significant (P=0.1727, statistics performed using Fisher’s exact test).
Results: Effect of CRTH2 blockade on antiviral immunity in asthma
184/233
Figure 6.2 IFN-α and –λ1 were equally induced in both groups in nasal and bronchial samples
0 2 3 4 5 7 1 01 0 -2
1 0 -1
1 0 0
1 0 1
1 0 2
D a y p o s t- in o c u la tio n
Na
sa
l IF
N-a
(p
g/m
L)
*** **
**
0 2 3 4 5 7 1 01 0 -1
1 0 0
1 0 1
1 0 2
1 0 3
D a y p o s t- in o c u la tio n
Na
sa
l IF
N-l
1 (
pg
/mL
)
** ****
***
*******
*
P lac e b o
OC 4 5 9
1 0 -1
1 0 0
1 0 1
1 0 2
1 0 3
Na
sa
l IF
N-a
AU
C (
pg
/mL
)
ns
P lac e b o
OC 4 5 9
1 0 1
1 0 2
1 0 3
1 0 4
Na
sa
l IF
N-l
1 A
UC
(p
g/m
L)
ns
D 0P e a k D 0
P e a k0
1 0
2 0
3 0
4 0
Na
sa
l IF
N-a
(p
g/m
L)
*** ****ns
ns
D 0P e a k D 0
P e a k0
2 0 0
4 0 0
6 0 0
1 4 0 0
Na
sa
l IF
N-l
1 (
pg
/mL
)
*** ****ns
ns
D a y -8
D a y +5
D a y -8
D a y +5
0
2
4
6
8
3 6
Bro
nc
hia
l IF
N-a
(p
g/m
L)
ns nsns
ns
D a y -8
D a y +5
D a y -8
D a y +5
0
2 0
4 0
6 0
1 2 0
ns **ns
ns
Bro
nc
hia
l IF
N-l
1 (
pg
/mL
)
P la ce bo O C 459
hg
b
dc
a
fe
Results: Effect of CRTH2 blockade on antiviral immunity in asthma
185/233
(overleaf)
(a,c,e) IFN-α and (b,d,f) IFN-λ1 were induced in nasal samples in both placebo- and OC459-treated subjects with no differences between groups. Bronchial levels of (g) IFN-α and (h) IFN-λ1 were not statistically increased at day 5 during infection except IFN-λ1 in the OC459 group; however there were no statistically significant differences between groups. Bars represent medians. Only values greater than zero were plotted on logarithmic axes. Statistical analysis was performed using Mann-Whitney test for unpaired samples and Wilcoxon matched-pairs signed rank test for paired samples. ** P <0.01, *** P <0.001, **** P <0.0001
In healthy individuals RV-16 infection induces IFN production. IFNs subsequently coordinate
an array of antiviral responses to suppress RV-16 replication. Thus one might initially expect
a positive correlation between higher virus loads inducing higher IFN production, and a
negative correlation later as higher IFN levels lead to reduced virus copies. In an in vitro
experiment, primary BECs from subjects with asthma infected with RV-16 produced less IFN-
λ than BECs from healthy controls and had higher viral loads with a negative correlation
between the two at the time the cells were harvested (8h after infection for mRNA, 48h
after for protein levels)96. The same finding was observed when comparing to RV-16 virus
loads in the BAL of the same subjects after in vivo experimental RV-16 infection.
Comparing RV-16 copies and IFN-α/-λ1 concentrations for every timepoint revealed a strong
positive correlation (Figure 6.3). This may be because virus and IFN levels rise and fall in
tandem within subjects over the time course of infection. The study cited96 compared a
single timepoint per experiment/subject and may be more indicative of differences between
subjects, so a further analysis was undertaken using a single timepoint (peak) for each
subject. The positive correlation persisted in this analysis (Figure 6.4).
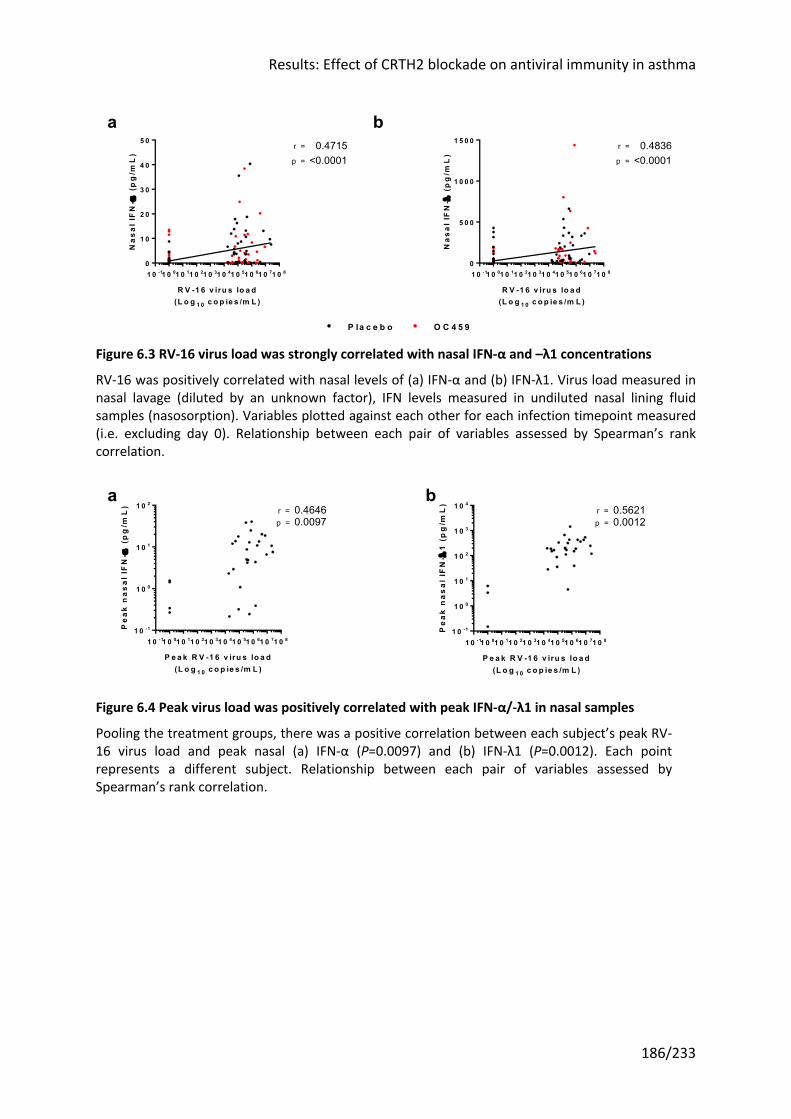
Results: Effect of CRTH2 blockade on antiviral immunity in asthma
186/233
Figure 6.3 RV-16 virus load was strongly correlated with nasal IFN-α and –λ1 concentrations
RV-16 was positively correlated with nasal levels of (a) IFN-α and (b) IFN-λ1. Virus load measured in nasal lavage (diluted by an unknown factor), IFN levels measured in undiluted nasal lining fluid samples (nasosorption). Variables plotted against each other for each infection timepoint measured (i.e. excluding day 0). Relationship between each pair of variables assessed by Spearman’s rank correlation.
Figure 6.4 Peak virus load was positively correlated with peak IFN-α/-λ1 in nasal samples
Pooling the treatment groups, there was a positive correlation between each subject’s peak RV-16 virus load and peak nasal (a) IFN-α (P=0.0097) and (b) IFN-λ1 (P=0.0012). Each point represents a different subject. Relationship between each pair of variables assessed by Spearman’s rank correlation.
1 0 -11 0 01 0 11 0 21 0 31 0 41 0 51 0 61 0 71 0 80
1 0
2 0
3 0
4 0
5 0
R V -1 6 v iru s lo a d(L o g 1 0 c o p ie s /m L )
Na
sal
IFN
-a (
pg
/mL
)
p =
r = 0.4715<0.0001
1 0 -11 0 01 0 11 0 21 0 31 0 41 0 51 0 61 0 71 0 80
5 0 0
1 0 0 0
1 5 0 0
R V -1 6 v iru s lo a d(L o g 1 0 c o p ie s /m L )
Na
sal
IFN
-l (
pg
/mL
)
p =
r = 0.4836<0.0001
P la c e b o O C 4 5 9
ba
1 0 -11 0 01 0 11 0 21 0 31 0 41 0 51 0 61 0 71 0 81 0 -1
1 0 0
1 0 1
1 0 2
P e a k R V -1 6 v iru s lo a d(L o g 1 0 c o p ie s /m L )
Pe
ak
na
sa
l IF
N-a
(p
g/m
L) r = 0.4646
0.0097p =
1 0 -11 0 01 0 11 0 21 0 31 0 41 0 51 0 61 0 71 0 81 0 -1
1 0 0
1 0 1
1 0 2
1 0 3
1 0 4
P e a k R V -1 6 v iru s lo a d(L o g 1 0 c o p ie s /m L )
Pe
ak
na
sa
l IF
N-l
1 (
pg
/mL
)
r = 0.56210.0012p =
ba
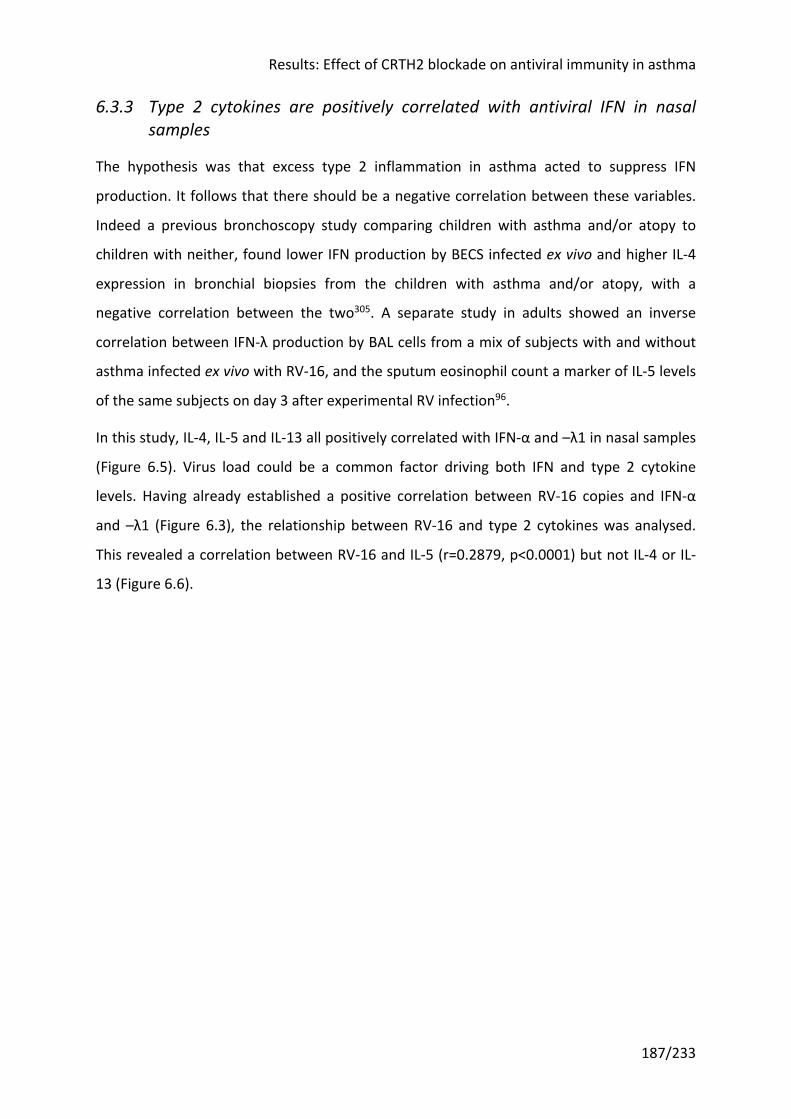
Results: Effect of CRTH2 blockade on antiviral immunity in asthma
187/233
6.3.3 Type 2 cytokines are positively correlated with antiviral IFN in nasal samples
The hypothesis was that excess type 2 inflammation in asthma acted to suppress IFN
production. It follows that there should be a negative correlation between these variables.
Indeed a previous bronchoscopy study comparing children with asthma and/or atopy to
children with neither, found lower IFN production by BECS infected ex vivo and higher IL-4
expression in bronchial biopsies from the children with asthma and/or atopy, with a
negative correlation between the two305. A separate study in adults showed an inverse
correlation between IFN-λ production by BAL cells from a mix of subjects with and without
asthma infected ex vivo with RV-16, and the sputum eosinophil count a marker of IL-5 levels
of the same subjects on day 3 after experimental RV infection96.
In this study, IL-4, IL-5 and IL-13 all positively correlated with IFN-α and –λ1 in nasal samples
(Figure 6.5). Virus load could be a common factor driving both IFN and type 2 cytokine
levels. Having already established a positive correlation between RV-16 copies and IFN-α
and –λ1 (Figure 6.3), the relationship between RV-16 and type 2 cytokines was analysed.
This revealed a correlation between RV-16 and IL-5 (r=0.2879, p<0.0001) but not IL-4 or IL-
13 (Figure 6.6).
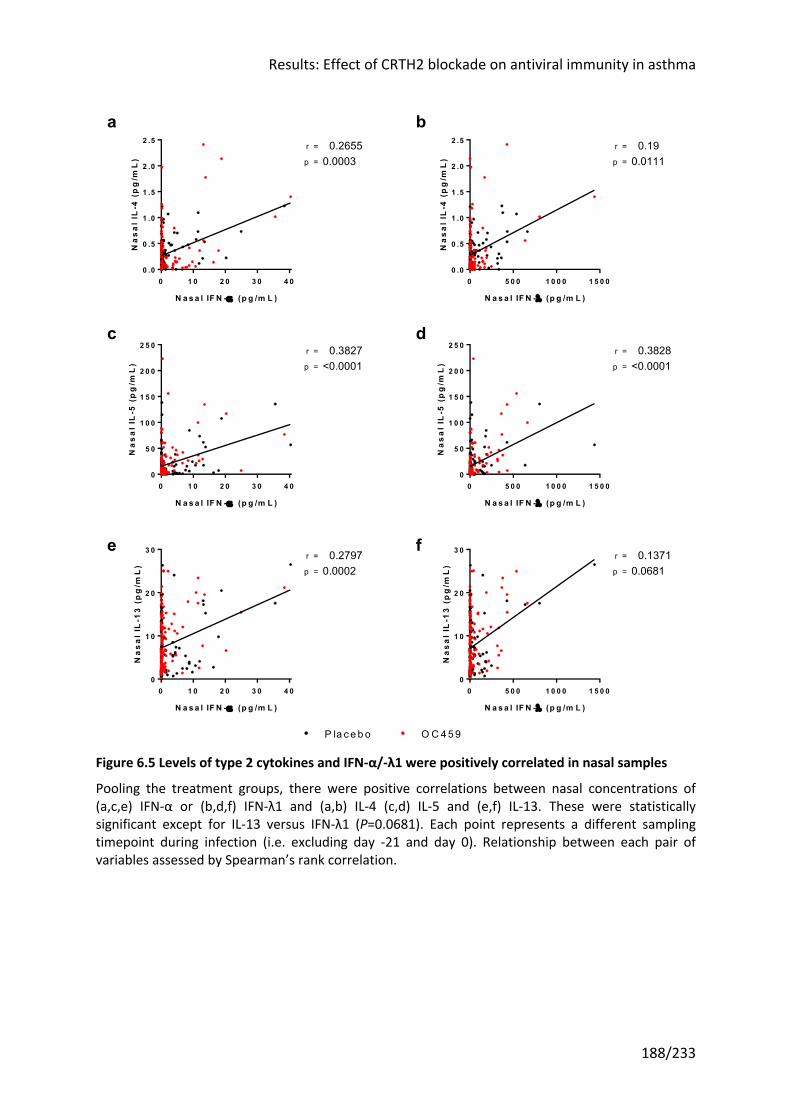
Results: Effect of CRTH2 blockade on antiviral immunity in asthma
188/233
Figure 6.5 Levels of type 2 cytokines and IFN-α/-λ1 were positively correlated in nasal samples
Pooling the treatment groups, there were positive correlations between nasal concentrations of (a,c,e) IFN-α or (b,d,f) IFN-λ1 and (a,b) IL-4 (c,d) IL-5 and (e,f) IL-13. These were statistically significant except for IL-13 versus IFN-λ1 (P=0.0681). Each point represents a different sampling timepoint during infection (i.e. excluding day -21 and day 0). Relationship between each pair of variables assessed by Spearman’s rank correlation.
0 1 0 2 0 3 0 4 00 .0
0 .5
1 .0
1 .5
2 .0
2 .5
N a s a l IF N -a (p g /m L )
Na
sa
l IL
-4 (
pg
/mL
) p =
r = 0.26550.0003
0 5 0 0 1 0 0 0 1 5 0 00 .0
0 .5
1 .0
1 .5
2 .0
2 .5
N a s a l IF N -l (p g /m L )
Na
sa
l IL
-4 (
pg
/mL
) p =
r = 0.190.0111
0 1 0 2 0 3 0 4 00
5 0
1 0 0
1 5 0
2 0 0
2 5 0
N a s a l IF N -a (p g /m L )
Na
sa
l IL
-5 (
pg
/mL
) p =
r = 0.3827<0.0001
0 5 0 0 1 0 0 0 1 5 0 00
5 0
1 0 0
1 5 0
2 0 0
2 5 0
N a s a l IF N -l (p g /m L )
Na
sa
l IL
-5 (
pg
/mL
) p =
r = 0.3828<0.0001
0 1 0 2 0 3 0 4 00
1 0
2 0
3 0
N a s a l IF N -a (p g /m L )
Na
sa
l IL
-13
(p
g/m
L)
p =
r = 0.27970.0002
0 5 0 0 1 0 0 0 1 5 0 00
1 0
2 0
3 0
N a s a l IF N -l (p g /m L )
Na
sa
l IL
-13
(p
g/m
L)
p =
r = 0.13710.0681
ba
fe
dc
P la c e b o O C 4 5 9
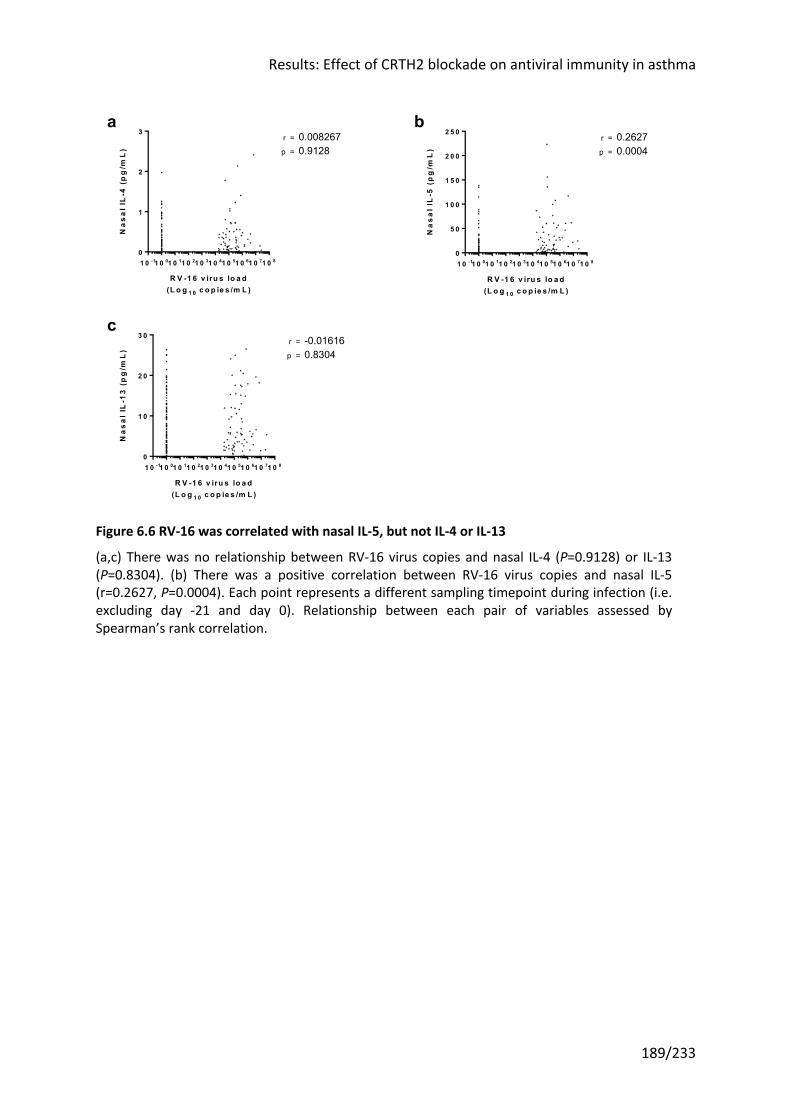
Results: Effect of CRTH2 blockade on antiviral immunity in asthma
189/233
Figure 6.6 RV-16 was correlated with nasal IL-5, but not IL-4 or IL-13
(a,c) There was no relationship between RV-16 virus copies and nasal IL-4 (P=0.9128) or IL-13 (P=0.8304). (b) There was a positive correlation between RV-16 virus copies and nasal IL-5 (r=0.2627, P=0.0004). Each point represents a different sampling timepoint during infection (i.e. excluding day -21 and day 0). Relationship between each pair of variables assessed by Spearman’s rank correlation.
1 0 -11 0 01 0 11 0 21 0 31 0 41 0 51 0 61 0 71 0 80
1
2
3
R V -1 6 v iru s lo a d(L o g 1 0 c o p ie s /m L )
Na
sa
l IL
-4 (
pg
/mL
) p =
r = 0.0082670.9128
1 0 -11 0 01 0 11 0 21 0 31 0 41 0 51 0 61 0 71 0 80
5 0
1 0 0
1 5 0
2 0 0
2 5 0
R V -1 6 v iru s lo a d(L o g 1 0 c o p ie s /m L )
Na
sa
l IL
-5 (
pg
/mL
) p =
r = 0.26270.0004
1 0 -11 0 01 0 11 0 21 0 31 0 41 0 51 0 61 0 71 0 80
1 0
2 0
3 0
R V -1 6 v iru s lo a d(L o g 1 0 c o p ie s /m L )
Na
sa
l IL
-13
(p
g/m
L)
p =
r = -0.016160.8304
b
c
a
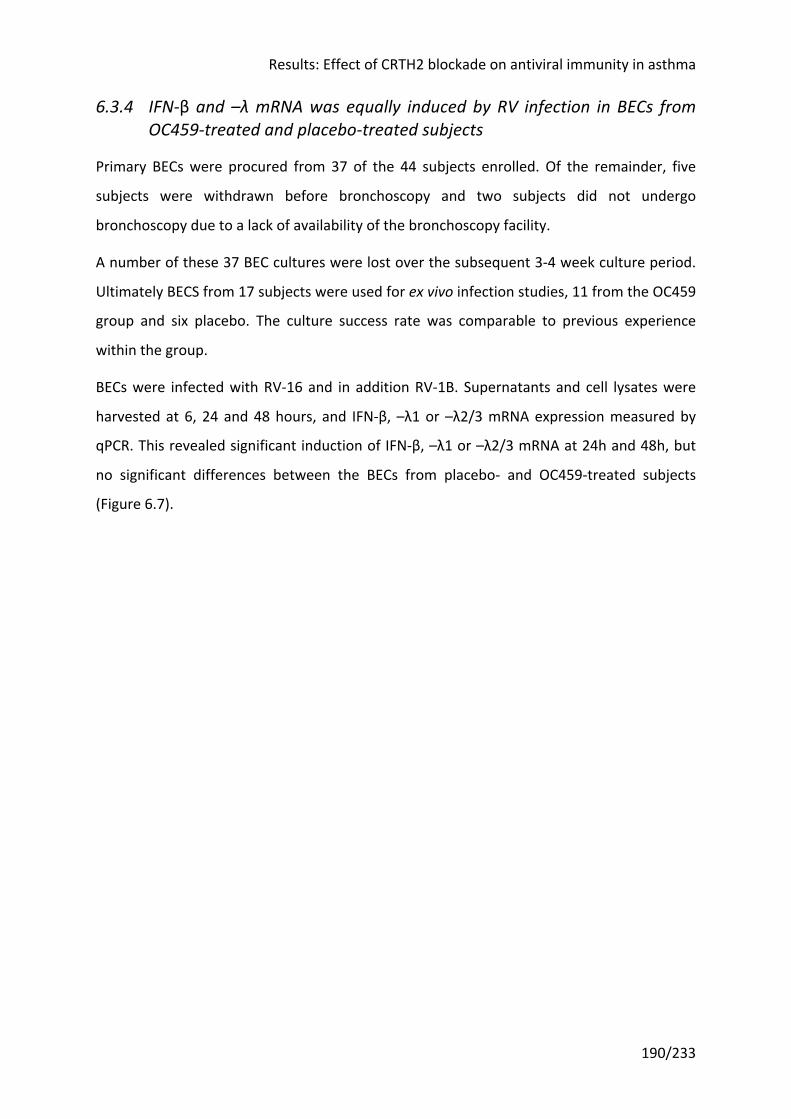
Results: Effect of CRTH2 blockade on antiviral immunity in asthma
190/233
6.3.4 IFN-β and –λ mRNA was equally induced by RV infection in BECs from OC459-treated and placebo-treated subjects
Primary BECs were procured from 37 of the 44 subjects enrolled. Of the remainder, five
subjects were withdrawn before bronchoscopy and two subjects did not undergo
bronchoscopy due to a lack of availability of the bronchoscopy facility.
A number of these 37 BEC cultures were lost over the subsequent 3-4 week culture period.
Ultimately BECS from 17 subjects were used for ex vivo infection studies, 11 from the OC459
group and six placebo. The culture success rate was comparable to previous experience
within the group.
BECs were infected with RV-16 and in addition RV-1B. Supernatants and cell lysates were
harvested at 6, 24 and 48 hours, and IFN-β, –λ1 or –λ2/3 mRNA expression measured by
qPCR. This revealed significant induction of IFN-β, –λ1 or –λ2/3 mRNA at 24h and 48h, but
no significant differences between the BECs from placebo- and OC459-treated subjects
(Figure 6.7).
Results: Effect of CRTH2 blockade on antiviral immunity in asthma
191/233
Figure 6.7 Antiviral IFNs were equally induced by RV infection in BECs from placebo or OC459-treated subjects
(a,c,e) RV-16 and (b,d,f) RV-1B significantly induced (a,b) IFN-λ1 (c,d) IFN-λ2/3 and (e,f) IFN-β expression in BECs compared to medium control. There was no difference between BECs from subjects who had been treated with placebo (black) or OC459 (red) for 2 weeks. mRNA expression of IFN-β, -λ1 and –λ2/3 in cell lysates of BECS infected with RV-16 or RV-1B or treated with medium ex vivo. BECs harvested at 6h (not shown), 24h and 48h. Statistical analysis was performed using Mann-Whitney test for unpaired samples and Wilcoxon matched-pairs signed rank test for paired samples.
R V 1 6 24 h -
P lac e b o
R V 1 6 24 h -
OC 4 5 9
Me d iu
m 2
4 h - P la
c e b o
Med iu
m 2
4 h - O
C 4 5 9
B lan k
R V 1 6 48 h -
P lac e b o
R V 1 6 48 h -
OC 4 5 9
Med iu
m 4
8 h - P la
c e b o
Med iu
m 4
8 h - O
C 4 5 9
1 0 -1
1 0 0
1 0 1
1 0 2
1 0 3
1 0 4
1 0 5IF
N-l
1 (
IL-2
9)
ex
pre
ss
ion
(lo
g1
0 c
op
ies
/µl)
M e d iu mM e d u im R V -16R V -16
4 8h2 4h
R V 1B 24 h -
P lac e b o
R V 1B 24 h -
OC 4 5 9
Me d iu
m 2
4 h - P la
c e b o
Med iu
m 2
4 h - O
C 4 5 9
B lan k
R V 1B 48 h -
P lac e b o
R V 1B 48 h -
OC 4 5 9
Med iu
m 4
8 h - P la
c e b o
Med iu
m 4
8 h - O
C 4 5 9
1 0 -1
1 0 0
1 0 1
1 0 2
1 0 3
1 0 4
1 0 5
IFN
-l1
(IL
-29
) e
xp
res
sio
n(l
og
10
co
pie
s/µ
l)
R V -1 BR V -1 B
4 8h2 4h
M e d iu mM e d u im
R V 1 6 24 h -
P lac e b o
R V 1 6 24 h -
OC 4 5 9
Me d iu
m 2
4 h - P la
c e b o
Med iu
m 2
4 h - O
C 4 5 9
B lan k
R V 1 6 48 h -
P lac e b o
R V 1 6 48 h -
OC 4 5 9
Med iu
m 4
8 h - P la
c e b o
Med iu
m 4
8 h - O
C 4 5 9
1 0 -1
1 0 0
1 0 1
1 0 2
1 0 3
1 0 4
1 0 5
IFN
-l2
/3 (
IL-2
8)
ex
pre
ss
ion
(lo
g1
0 c
op
ies
/µl)
R V -16R V -16
4 8h2 4h
M e d iu mM e d u im
R V 1B 24 h -
P lac e b o
R V 1B 24 h -
OC 4 5 9
Me d iu
m 2
4 h - P la
c e b o
Med iu
m 2
4 h - O
C 4 5 9
B lan k
R V 1B 48 h -
P lac e b o
R V 1B 48 h -
OC 4 5 9
Med iu
m 4
8 h - P la
c e b o
Med iu
m 4
8 h - O
C 4 5 9
1 0 -1
1 0 0
1 0 1
1 0 2
1 0 3
1 0 4
1 0 5
IFN
-l2
/3 (
IL-2
8)
ex
pre
ss
ion
(lo
g1
0 c
op
ies
/µl)
R V -1 BR V -1 B
4 8h2 4h
M e d iu mM e d u im
R V 1 6 24 h -
P lac e b o
R V 1 6 24 h -
OC 4 5 9
Me d iu
m 2
4 h - P la
c e b o
Med iu
m 2
4 h - O
C 4 5 9
B lan k
R V 1 6 48 h -
P lac e b o
R V 1 6 48 h -
OC 4 5 9
Med iu
m 4
8 h - P la
c e b o
Med iu
m 4
8 h - O
C 4 5 9
1 0 -1
1 0 0
1 0 1
1 0 2
1 0 3
1 0 4
1 0 5
IFN
-b e
xp
res
sio
n(l
og
10
co
pie
s/µ
l)
R V -16R V -16
4 8h2 4h
M e d iu mM e d u im
R V 1B 24 h -
P lac e b o
R V 1B 24 h -
OC 4 5 9
Me d iu
m 2
4 h - P la
c e b o
Med iu
m 2
4 h - O
C 4 5 9
B lan k
R V 1B 48 h -
P lac e b o
R V 1B 48 h -
OC 4 5 9
Med iu
m 4
8 h - P la
c e b o
Med iu
m 4
8 h - O
C 4 5 9
1 0 -1
1 0 0
1 0 1
1 0 2
1 0 3
1 0 4
1 0 5
IFN
-b e
xp
res
sio
n(l
og
10
co
pie
s/µ
l)
R V -1 BR V -1 B
4 8h2 4h
M e d iu mM e d u im
O C 4 5 9 (v iru s )P la c e b o (v iru s )
O C 4 59 (m e d ium )P la ce bo (m e d iu m )
ba
fe
dc
Results: Effect of CRTH2 blockade on antiviral immunity in asthma
192/233
6.3.5 IFN responses to RV-16 infection ex vivo did not correlate with virus load or IFN levels after RV-16 infection in vivo
To seek clinical corroboration of the ex vivo findings, the results of the ex vivo experiments
were compared with the outcome of the in vivo experimental infection study.
Of the 17 BECs cultured, 14 came from subjects who had in vivo infection with RV-16
confirmed (6/14 from the placebo group, 8/14 from the OC459 group). There was no
relationship between IFN production following ex vivo infection (at 24h or 48h) and RV-16
levels following in vivo experimental infection (peak or AUC) (data not shown). Nor was
there a relationship between IFN production following ex vivo infection (at 24h or 48h) and
IFN-α or IFN-λ levels in vivo (nasal peak or AUC during infection, or bronchial levels during
infection at day 5) (data not shown).
Results: Effect of CRTH2 blockade on antiviral immunity in asthma
193/233
6.4 Discussion This chapter compared the antiviral responses of the OC459- and placebo-treated groups, in
terms of both virus load and IFN-α and –λ1 production in vivo. In addition, primary BECs
were isolated and cultured from subjects treated with OC459 (n=11) and placebo (n=6) and
infected ex vivo with two strains of rhinovirus, RV-16 and RV-1B. IFN mRNA expression was
quantified in these infected BECs by qPCR and compared between groups and to in vivo
responses. This is the only study to have evaluated the effect of a CRTH2 antagonist on
antiviral immunity, and follows the recent demonstration of augmented antiviral responses
with CRTH2 antagonism in a mouse model and in primary human airway epithelial cells51.
6.4.1 CRTH2 antagonism did not alter IFN responses to RV-16 infection in vivo or in ex vivo experiments with primary BECs
Given the limited effect of the CRTH2 antagonist OC459 on type 2 inflammation (chapter 5),
it is unsurprising that there was no difference in antiviral immunity between placebo and
OC459 either in vivo or in ex vivo infection studies. The ex vivo infection studies may have
additionally been confounded by the effect of repeated passage over four weeks. That said,
primary BECs from asthma subjects are known to retain an ‘asthmatic’ phenotype in culture
over several passages307, and several studies have shown differences in virus-induced IFN
levels between BECs from healthy controls and subjects with asthma despite identical
culture conditions95-101.
OC459 was not added to the culture media as the hypothesized effect on the IFN responses
of infected BECs was via dampening of the prevailing type 2 cytokine milieu produced by
CRTH2+ ILC2s and Th2 cells in vivo, rather than a direct effect on BECs. However the medium
did not contain type 2 cytokines and thus the effect of the environment four weeks earlier,
when the bronchial brushings with the BECs were taken, may have been diluted or lost over
the subsequent passage. This is ultimately an inherent limitation in a single cell culture
system.
Moreover BECs are known to express the CRTH2 receptor, as well as the PGD2 receptor DP1,
and have recently been shown to respond to PGD251, which they can also produce. Any
direct effects of OC459 on the primary BECs may have diminished during the course of
Results: Effect of CRTH2 blockade on antiviral immunity in asthma
194/233
passage in OC459-free media. With the benefit of hindsight, additional conditions where
OC459 was added to the culture medium would have been of interest.
It is worth remembering that not all previous studies infecting primary cells from subjects
with asthma ex vivo have demonstrated deficient IFN responses103,308-311. The experimental
conditions differ in every study, including the viruses used, as do the subjects from whom
the cells are harvested, varying in severity, asthma control and atopic status. Any
combination of these may account for the divergent findings. For example it may be that
only a subset of those with asthma have deficient IFN responses; these may be the
individuals who responded in a trial of exogenous IFN-β in virus-induced asthma
exacerbations107. If this is the case, it is plausible that some or all of the subjects in this study
lacked impaired IFN responses. In such a scenario it is difficult to conceive how a CRTH2
antagonist might have an effect on IFN release.
6.4.2 Higher RV-16 virus loads were associated with higher nasal IFN-α and –λ1 concentrations
RV-16 levels have previously been shown to be inversely related to IFN-λ protein and mRNA
expression after RV-16 infection in asthma96. More recently, nasal RV-16 virus load after
experimental RV infection was found to be negatively correlated with epithelial IFN-α/-β
staining in bronchial biopsies taken at day 4 post inoculation156. The same study however
identified a positive correlation between BAL RV-16 virus load and subepithelial IFN-α+ cells.
The opposite was observed here, albeit only in nasal samples. This is consistent with an
earlier RV challenge study in asthma where increased nasal viral loads were accompanied by
rises in IFN-β and –λ1, although in contrast to the findings here there was no correlation
between virus copies and IFN-λ1, only IFN-β62. These investigators did not measure IFN-α
thus the finding of increased nasal IFN-α, that correlates with RV-16 copies, is novel. Unlike
IFN-β and –λ, IFN-α is not produced by BECs, which are the primary site of replication for
rhinoviruses, but primarily by pDCs312. The findings presented here relate to IFN
concentrations in nasal samples, which might not accurately reflect the lower airways,
whereas very little of the literature on IFN deficiency in asthma comes from studies of nasal
responses313,314.
Results: Effect of CRTH2 blockade on antiviral immunity in asthma
195/233
It is difficult to disentangle the effect of virus load on IFN production, particularly in vivo. Yet
experiments in a single cell culture system may not model events in vivo, where there is
interplay between multiple cell types, accurately enough. Moreover the results of recent
clinical trials manipulating antiviral IFN responses imply that there is heterogeneity in IFN
impairment in asthma. Only a subset of those enrolled in a clinical trial of exogeneous IFN-β
responded107, albeit within the limitations of the trial (principally that IFN-β was started at
symptom onset, by which stage the proverbial horse may well have bolted). Separately a
trial of anti-IgE found variable increases in IFN-α following ex vivo rhinovirus infection of
PBMCs taken from treated participants, with the degree of improvement correlating with
asthma exacerbation reduction109.
6.4.3 Type 2 cytokines were positively correlated with IFNs in nasal samples
It is well established that atopic asthma is characterized by excess type 2 inflammation.
Additionally most of the evidence points towards impaired innate immune responses,
specifically IFN production. It has therefore been hypothesized that the two are linked, with
the former leading to the latter. In support of this, pre-treating BECs with type 2 cytokines
reduces IFN induction by RV-16111. An inverse relationship between type 2 cytokine and IFN
concentrations was therefore expected in vivo following RV-16 infection.
The results ran contrary to this, and although not previously reported, another RV challenge
study did find increased type 2 cytokines45 and IFN-λ162 (levels of IFN-β were mostly
undetectable), although regression analysis may not have been performed on these
variables. The findings could be interpreted as going against an inhibitory effect of type 2
cytokines on IFN induction in vivo. Certainly there are in vitro experiments that would
support this. For example, AECs co-cultured with IL-4 and IL-13 demonstrated an increase in
IFN-λ mRNA after stimulation with a synthetic viral mimic, poly(I:C)315.
Alternatively the greater number of variables in vivo may be confounding the effect
observed ex vivo, analogous to the relationship between virus load and IFN concentrations
from in vitro experiments versus in vivo challenge studies. Certainly the correlation between
virus load and both IL-5 and IFN-α/-λ1 implies the concentrations of all three cytokines
could be a function of virus load (perhaps via virus-induced release of epithelial cytokines).
Whilst the same was not true of IL-4/-13, there may be another common co-varying factor
Results: Effect of CRTH2 blockade on antiviral immunity in asthma
196/233
confounding the results (e.g. TSLP, IL-33). There was no relationship between any type 2
mediator and virus load in a previous experimental infection study in our group241.
6.4.4 Ex vivo IFN responses did not predict virological outcomes in vivo
Multiple previous investigators have observed an inverse association between (lower) IFN
responses to RV infection and (higher) RV viral loads in primary cells taken from subjects
with asthma and healthy controls95,96,305,316. One of these went on to show that viral loads in
subjects who were experimentally infected in vivo also corresponded to the IFN responses
of cells from those same subjects when infected ex vivo, although both data from subjects
with asthma and healthy controls were combined in the analysis96. In the present study, the
ex vivo and in vivo responses to RV infection in a group of subjects with asthma were not
related, but there was no control group of healthy subjects. It may be that within a
population of subjects with asthma the same relationship does not hold. The lack of a group
of healthy subjects also means that it is impossible to know how IFN responses ex vivo or
viral loads in vivo relate to controls.
Not all ex vivo infection studies have found diminished IFN production in asthma308-311.
Whether preserved IFN responses translate to unimpaired antiviral immunity and viral loads
equal to those in healthy controls in vivo is not known as these studies were not
accompanied by a challenge study in the population sampled.
20/37 (54%) of the BEC cultures were lost during the multiple passages. It is impossible to
know whether this resulted in selection bias, but the starting assumption must be that loss
was random and the surviving BECs are representative of the cohort as a whole.
Results: Effect of CRTH2 blockade on antiviral immunity in asthma
197/233
6.5 Summary of key points • There were no statistically significant differences in the virus loads or IFN-α and –λ1
concentrations in nasal or bronchial samples between OC459- and placebo-treated
subjects, although a (non-statistically significantly) higher proportion of the OC459
group had sizeable bronchial IFN responses. Given the hypothesized mechanism was via
reduction of type 2 cytokines, which as we saw in chapter 5 were unaltered by
treatment, this result was to be expected.
• This was mirrored by equal induction of IFN-β, -λ1 and -λ2/3 in primary BECs from
placebo- and OC459-treated subjects and infected with RV-16 and RV-1B ex vivo;
moreover the degree of IFN induction after ex vivo infection was not associated with
outcomes following in vivo experimental infection
• Nasal antiviral IFN concentrations were positively correlated with viral loads, highlighting
the difficulty of demonstrating presumed IFN deficiency in vivo
• Contrary to a previous study in our group, there was a positive relationship between
nasal type 2 cytokines and IFN levels following experimental RV infection in vivo,
particularly for IL-5 which may reflect co-variation with viral load
Discussion
198/233
7 Discussion
7.1 Introduction The current study is the first randomized clinical trial utilizing the rhinovirus challenge
model of human asthma exacerbations in subjects with moderate asthma, requiring
maintenance therapy including ICS. It is also the only clinical trial in this model with
extensive sampling and assessment conducted in parallel to enable a mechanistic
analysis of the drug. This chapter summarizes the key findings, their significance in the
wider context, limitations, and future directions.
7.2 Key findings
7.2.1 RV challenge largely reproduced the features of previous studies in asthma
Multiple clinical trials have already shown that CRTH2 antagonists have only a limited
impact on stable, mild-to-moderate asthma192. However asthma is a characteristically
variable condition and PGD2 might only be elevated and therefore relevant when the
lungs are actively inflamed, in severe asthma or during an asthma exacerbation. A
CRTH2 antagonist would only be expected to be effective in such scenarios.
The current trial was designed to test this by utilizing RV challenge to provoke an
increase in asthma pathophysiology, including an increase in PGD2 (as has previously
been seen, at least in nasal secretions61). Moreover it sought to overcome perceived
failings of previous clinical trials in asthma using experimental RV challenge149,158 by
recruiting subjects with partially uncontrolled and moderate asthma, both features
associated with a greater increase in asthma pathology in a previous RV challenge
study139.
As a precursor to testing this hypothesis, it was first necessary to show that RV challenge
had indeed produced a deterioration of asthma control with increased asthma-related
symptoms, not least because only a handful of RV challenge studies had been conducted
in moderate, ICS-treated asthma.
Discussion
199/233
We saw that RV infection reliably produced a significant increase in upper respiratory
symptoms, with trends in lower respiratory symptoms (difficult to disentangle from the
effects of bronchoscopy) and reduced lung function. In previous RV challenge studies,
the magnitude of these changes has been highly variable, particularly with regard to
lung function. Some of this variation might be due to differences in disease severity and
ICS treatment, but even considering only studies in moderate, ICS-treated participants
some have shown more marked lung function declines45,167 than others138,166,247. The
changes in lung function observed in this study (and to a lesser extent, symptoms) were
modest, which is important given the power calculation was based on a study at the
other end of the spectrum45, with the consequent risk that the present study was
underpowered.
Particularly remarkable was the high degree of inter-subject variability along most
measures. This was despite recruitment criteria (treatment, asthma control, atopy)
designed to make this a relatively homogeneous population, which indeed it was in
other regards such as age, age of onset, baseline ACQ-6, FEV1, FeNO, blood eosinophils,
and measures of atopy (total IgE and number of positive skin prick tests). Clearly our
understanding and ability to accurately phenotype asthma with the current biomarkers
is limited, raising the possibility that the different findings reported in the various RV
challenge studies in asthma arise from important differences in the enrolled
participants. Indeed correlation analyses of this dataset to identify the best predictors of
outcome were only partly able to replicate the findings of comparable trials45,167,262,
again hinting at differences in the populations studied. This poses problems for future
RV challenge studies.
Neither nasal nor bronchial PGD2 were increased during infection and, although they
positively correlated with type 2 cytokine levels, there was no correlation with clinical
outcomes following RV infection. Both the lack of induction and correlation with clinical
outcomes is at odds with the only previous report of PGD2 levels in a virally-induced
exacerbation61. Although basal levels of PGD2 were recorded, the lack of induction may
have made a CRTH2 antagonist ineffective. RV infection was associated with modest
increases in epithelial and subepithelial CRTH2 staining in the bronchial biopsies, but no
Discussion
200/233
change in CRTH2+ BAL cell differentials, suggesting a small but limited cellular
inflammation on which a CRTH2 antagonist might exert an effect.
7.2.2 CRTH2 antagonism had no effect on clinical outcomes after RV challenge
In the event, there were no statistically significant differences between OC459 and
placebo on symptoms, lung function, FeNO, or airway hyperresponsiveness (PC20). To
exclude a confounding placebo effect (e.g. from increased compliance with maintenance
treatment), these measures were analysed during the three-week run-in between
randomization (day -21) and RV inoculation (day 0), with no significant change in either
treatment group. It should be noted that, despite the lack of efficacy, OC459 was well
tolerated and safe.
It is certainly possible that this trial represents a false negative, owing to the limited
pathology induced by RV infection in this cohort or to shortcomings of RV challenge
more generally as a model for drug studies; there have been no previous positive results
even with compounds known to be effective, albeit not in the populations their effect
has been demonstrated in (e.g. omalizumab in mild, ICS-naïve asthma).
Alternatively, PGD2-CRTH2 signalling may not be as important as asserted. Elevations of
IL-4, IL-5 and IL-13 in asthma exacerbations have been followed by development of anti-
IL-5 compounds that are clinically effective46 and anti-IL-13 ones that are less so293,294.
Only one study has previously investigated PGD2 levels during an exacerbation61 and
none have investigated CRTH2+ cells, thus the case for CRTH2 antagonism as a
therapeutic approach is weaker.
7.2.3 Overall the mechanistic analyses suggest PGD2-CRTH2 signalling is not central to virus-induced pathology in asthma
Broadly speaking, two sets of mechanistic analysis were undertaken. These sought to
assess the hypothesized effect of CRTH2 antagonism on (a) preventing recruitment of
CRTH2+ cells to the airways and (b) their activation to release type 2 cytokines.
Notwithstanding the relatively small increase in CRTH2+ cells, which was limited to the
bronchial wall, OC459 appeared to prevent this. The lack of impact on the proportion of
CRTH2+ cells in the airway lumen could be attributed to the absence of RV-induced
Discussion
201/233
CRTH2+ cell recruitment to that compartment, although there was a shift in the ratio of
ILC1:ILC2 cells in favour of ILC1s with OC459 treatment.
However there was no evidence that OC459 reduced activation of CRTH2+ cells, with no
change in the proportion of ILC2s staining for intracellular IL-5 (again perhaps limited by
the lack of any difference following RV infection) or airway levels of IL-4, IL-5 and IL-13
compared to placebo. Indeed bronchial levels of IL-5 and IL-13 were elevated compared
to baseline in the OC459 but not placebo group, although there were no significant
differences between the groups at either timepoint.
It had been hypothesized that, by reducing type 2 inflammation, OC459 would restore
IFN responses to viral infection. With no effect on type 2 inflammation, it was perhaps
predictable that OC459 did not alter IFN responses to RV infection in vivo or ex vivo; an
alternative finding would have been inconsistent with the hypothesis. As no healthy
control group were included, we also cannot be certain that the subjects or cells used in
this study exhibited impaired anti-viral immunity. The literature reports inconsistency in
IFN levels in cultured cells from subjects with asthma103, which may be due at least in
part to inter-subject variation. It is possible that anti-viral immunity was not
compromised in this cohort, in which case a CRTH2 antagonist would not affect an
otherwise normal IFN response.
IL-33 and IL-25 have been previously shown to be induced by RV challenge in vivo45,49.
This study builds on that finding by demonstrating a correlation between IL-33 (but not
IL-25) and type 2 cytokine levels (see Table 5.1). In addition, TSLP levels after RV
challenge have been quantified for the first time, and were found to be induced and
highly correlated with type 2 cytokine levels. Relationships between IL-4 and IL-13 and
the ‘master’ epithelial cytokines IL-33 and TSLP persisted despite CRTH2 antagonism
with OC459. This implies redundancy of PGD2-CRTH2 signalling in the recruitment and
activation of CRTH2+, type 2 cytokine-producing Th2 and ILC2 cells.
OC459 may have failed to have an effect during RV challenge if CRTH2 expressing cells
are activated in different ways during stable asthma compared to a virally-induced
asthma exacerbation. PGD2 is likely produced by mast cell activation following allergen
exposure, and in this scenario there may be ample PGD2 to activate Th2 and ILC2 cells.
This one could argue, is a scenario were OC459 is most effective. In viral infection, and in
Discussion
202/233
the absence of a defined allergen exposure, Th2 and ILC2 cells might be activated not via
PGD2 but by IL-33, TSLP and/or IL-25, directly produced by viral infection of the airway
epithelium. Viral infection can produce PGD2 in vitro51 and in vivo61; however this study
did not observe induction in the airways. Therefore in a virally-induced asthma
exacerbation, IL-33 and TSLP would perhaps be better targets, as the role of PGD2
appears to be redundant, or at best, minimal.
Correlation analysis cannot demonstrate causation, and the relative importance of TSLP
and IL-33 in the pathophysiology of asthma exacerbations can only be assessed by
blocking them in vivo. Recently this has been put to the test with an anti-TSLP antibody
with impressive results indicating a more central role. In a phase 2 clinical trial,
tezepelumab reduced exacerbation rates by 61-71%, more than the ~50% seen with
anti-IL-5 monoclonals, and in a broader group of patients not selected for eosinophilia67.
One of the interesting features of biologicals targeting IL-5 signalling is that they result in
depletion of eosinophils. This is through a combination of neutralizing IL-5, which is an
eosinophil maturation and survival factor, but also in the case of benralizumab a direct
cytotoxic effect on both eosinophils and basophils via binding of the IL-5 receptor317.
Using the CRTH2 receptor as a marker of cells that are contributing to asthma pathology,
a compound that targeted CRTH2 in order to deplete CRTH2+ cells, rather than disrupt
signalling, might prove effective – possibly more so than benralizumab. In a proof of
concept study, treatment with an anti-CRTH2 antibody in human CRTH2-transgenic
mice, mimicking the pattern of CRTH2 expression in humans, eliminated human CRTH2+
eosinophils, basophils and ILC2s in allergic mouse models of asthma and helminth
infections, with potent reductions of IL-4 and IL-13318. Th2 cells in the transgenic mice
did not express human CRTH2 and so CD4+ T cells were not diminished, which may
explain the persistence of IL-5. There is no suggestion in the literature that dupilumab
has antibody-mediated cytotoxic effects on cells bearing the IL-4 receptor α chain,
whereas tezepelumab binds TSLP rather than the TSLP receptor on cells.
7.3 Limitations There are a number of possible and certain limitations of this study. Firstly, subject
selection may have been inadequate. Experience with early clinical trials of anti-IL-5
Discussion
203/233
agents, which had negative results319, reinforce the importance of subject selection. The
comments above regarding the inconsistent results across RV challenge studies in
asthma, and the high degree of inter-subject variability on most measures assessed,
mean it is possible not only that the subjects in each study differ significantly from each
other but that we also do not know how they differ.
Atopy has been a selection criteria for most previous RV challenge studies, as it is
generally thought to coincide with type 2 inflammation, confirmed in more recent
molecular phenotyping studies32. But both atopy and asthma are common conditions –
so prevalent in the general population that one would expect at least 30% of asthma
patients to coincidentally be atopic, rather than have atopic asthma320. The lack of
sensitive and specific, readily accessible biomarkers for type 2 asthma is a major
hindrance to asthma research and management.
It may also be that in recruiting ICS-treated subjects, the trial selected a group in whom
the type 2 inflammation that would otherwise have been amenable to CRTH2
antagonism was suppressed by ICS, whereas the residual symptoms arose from non-type
2 inflammation that was resistant to both ICS and OC459. Whether this is the case is
academic, as CRTH2 antagonists are not sufficiently efficacious to supplant ICS and
should therefore be assessed as an add-on therapy.
Secondly, the more modest changes in asthma pathology and symptoms may have
resulted from an inadequate sample size. A power calculation was based on the most
recently completed study in our group45, but a subsequent study showed less substantial
changes in symptoms and lung function168. The literature on RV challenge in asthma
reports a range of virally-induced changes in the underlying asthma, with the study on
which the power calculation for this trial was based sitting near the upper end of the
spectrum.
Third, it is not clear that the RV challenge model of asthma exacerbations is sufficiently
sensitive to identify effective treatments. Out of five clinical trials in this
model149,158,166,171, none has had a positive clinical outcome despite three employing
compounds known to be effective in asthma (budesonide149, montelukast158 and
omalizumab171). Moreover the deterioration in asthma control is some distance from
that used to define a severe exacerbation in clinical practice. It may be that RV challenge
Discussion
204/233
alone is insufficient and co-stimulation with allergen is necessary. Observational studies
support this assertion71,72, although a single dual challenge study found no synergy
between allergen and RV infection137.
Fourth, inhaler use was not monitored. Capturing self-reported inhaler use might have
revealed varying patterns of bronchodilator (or ICS) use that could have confounded the
other outcomes, e.g. lung function and even symptoms. Participants were asked to
maintain their prescribed ICS dose throughout infection, but some had reported
adjusting their own dosing in the past and may have done so unintentionally. It would
also have been useful to objectively assess adherence with a smart inhaler. Although
there is little evidence that these improve adherence321, it would at least have allowed
exclusion of non-adherent subjects from entry into the study and/or sensitivity analyses
for those enrolled who subsequently demonstrated suboptimal adherence.
On a number of occasions, particularly in chapter 3, the author compared baseline to
peak values (Figure 3.4, Figure 3.9, Figure 3.11, Figure 4.4, Figure 4.7, Figure 5.9, Figure
6.2). These have been shown alongside the time course data, but there was not always a
statistically significant difference between any individual time point and baseline. Use of
area under the curve (AUC) data would have been preferable, but in the absence of a
healthy control group there was no data against which to compare the AUC values for
the placebo group. The analysis of the placebo group is further limited by the relatively
small numbers (n=14) and consequent reduced statistical power. Nonetheless the use of
peak values, regardless of time point, risks finding an artefactual statistically significant
result.
Regarding the correlation analyses, a number of these were performed on repeated
measures from multiple subjects (Figure 3.3, Figure 3.5, Figure 3.8, Figure 3.11, Figure
3.12, Figure 3.14, Figure 3.15, Figure 5.13, Figure 6.2). The Pearson and Spearman’s
methods employed assume each pair of measures is independent. However measures
taken from the same subject are likely to be more similar than those from different
subjects. This can increase the likelihood of a spurious significant result as the statistical
calculation is performed as if each measure is independent (i.e. as if it were from a
distinct subject), erroneously inflating the number of degrees of freedom322. The
magnitude of this error depends on the difference in the variability in measures from
Discussion
205/233
different subjects compared to the variability in repeated measures from one subject. To
take an extreme example, there is no difference between ten people throwing a die
once or one individual throwing a die ten times; in this example the number of measures
is indeed the sample size.
A common solution is to aggregate the data to leave a single measure per subject, e.g.
the average of the repeated measures, and then perform the correlation. However this
can also produce misleading results: a strong relationship between two variables at an
intra-subject level will be missed by using subject averages323,324. More sophisticated
methods for investigating relationships between variables using repeated measures data
are available325 and, with the benefit of hindsight, would have been more informative.
7.4 Future directions With respect to CRTH2 antagonists, the results of ongoing trials are likely to determine
the future of this as an avenue for drug development in asthma. The first is studying the
effects of OC459 on subjects with severe asthma and sputum eosinophilia of ≥3%, which
had an estimated completion date of June 2018 (ClinicalTrials.gov identifier
NCT02560610193). The other are the phase III clinical trials of fevipiprant, most due to
complete in June 2019.
The use of RV challenge in asthma as a tool for clinical trials requires a more robust
evidence base. Given the advantages of increased statistical power requiring fewer
subjects (making recruitment quicker and easier), reduced length of exposure to an
unlicensed compound for each individual subject, and ability to conduct mechanistic
analyses in parallel, it is too early to write the model off. However to assist future
studies, it would be invaluable to have a trial with a positive result on which to base
selection criteria and power calculations. The next logical step is therefore to conduct a
placebo-controlled trial with prednisolone.
The current study has once again demonstrated the value of nasosorption as a sampling
technique, particularly in view of the close correlation with bronchosorption samples.
Conversely the disadvantages of bronchoscopic sampling may outweigh benefits.
Bronchoscopy confounds upper and lower respiratory symptom scores and lung
function34, is a potential risk to patient safety, incurs significant expense, and requires
Discussion
206/233
volunteers to be able to take a weekday off work or study, a significant deterrent to
participation for many. Bronchosorption seemingly offers little additional information
over-and-above nasosorption. BAL and biopsy results have been interesting but are
inconsistent and highly resource intensive. Experiments performed on primary BECs
cultured from bronchial brushes are of principle value when correlation is sought with in
vivo clinical outcomes. Otherwise human primary cells are available commercially. These
samples are not without value, but a study without bronchoscopy would be easier to
recruit to and require significantly fewer resources.
As alluded to earlier, the study diaries would benefit from modification to rationalize the
number of entries (in the hope of improving compliance and data quality) and include
information about inhaler use (frequency of use of reliever, and adherence with
maintenance inhaler use). A smart inhaler would provide objective data, but these are
not available for every inhaler device available and so a pragmatic approach may be
required. An electronic study diary, ideally with reminders, would likely be acceptable to
asthma volunteers who tend to be young and IT literate, and would enable remote data
checking and minimization of data transfer errors.
A future RV challenge study might also benefit from modification of inclusion criteria.
Correlation analyses of this dataset again suggest that ACQ-6 is the only reliable
predictor of lower respiratory symptoms following RV challenge; a higher cut-off of ≥1.5
may be justified. PC20, FeNO and the degree of atopy (number of positive skin prick tests
and total IgE) predicted lung function decline in this study, although the falls in lung
function were modest. The addition of thresholds for FeNO and/or PC20 to the inclusion
criteria might select for subjects who experience more profound spirometry changes.
Logistically each of these changes would make recruitment more challenging and so
balance needs to be struck.
Separately, there would be merit in pooling the RV challenge studies conducted in
asthma in our group, to improve the statistical power of the analyses. There are
bronchial brushings in RNA preservative at -80°C and bronchial biopsies that have yet to
be analysed.
As part of the current study, a total of 32 cytokines were measured and other non-
CRTH2+ cell populations enumerated in the BAL (e.g. mast cells, neutrophils, ILC1s and
Discussion
207/233
ILC3s). There is thus an opportunity to explore other pathways. These could include the
IL-17 family of cytokines and neutrophils, which are implicated in steroid refractory
asthma326; basophils, which produce IL-4, bear the IL-33 receptor ST2 and may be the
principle target of IL-33327; and mast cells, which also bear the ST2 receptor, are
promoted by IL-6, IL-9, IL-10, IL-13 and IL-15 (all of which have been measured), and in
turn produce various soluble mediators including the type 2 cytokines328. Any findings
from this RV challenge study will ultimately need validation in a natural infection study.
Finally there is an exciting opportunity to add mechanistic analyses as a bolt on to
existing clinical trials and practice. Nasosorption samples may be a useful technique for
better identifying subjects with a type 2 signature, who are therefore suitable for
treatment with expensive biologics, and for whom biomarkers are sorely needed. They
may also separately be useful for phenotyping other subsets, e.g. IL-17-predominant, for
research purposes and, perhaps in future, to guide more personalized management.
Several biological treatments have now been shown to substantially reduce asthma
exacerbations but the mechanisms by which they do so are, on the whole, poorly
understood. A recent clinical trial of anti-IgE showed how parallel blood sampling and ex
vivo infection studies could be used to identify clinically relevant differences in IFN
production109. The application of a similar approach to patients starting treatment with
biologicals, either within or outside of a clinical trial, could prove as insightful.
Appendices
208/233
8 Appendices
8.1 Inclusion and exclusion criteria Inclusion criteria:
1. Age 18-55 years
2. Male or female
3. Clinical diagnosis of asthma for at least 6 months prior to screening
4. An Asthma Control Questionnaire (ACQ) Score >0.75
5. Positive histamine challenge test (PC20 <8 µg/ml, or <12 µg/ml and bronchodilator response ≥ 12%)
6. Worsening asthma symptoms with infection since last change in asthma therapy
7. Positive skin prick test to common aeroallergens (e.g. animal epithelia, dust mite)
8. Treatment comprising inhaled corticosteroids (ICS) or combination inhaler (Long-Acting Beta Agonist with ICS), with a daily ICS dose of at least 100mcg fluticasone or equivalent.
9. Participant is willing for their GP to be informed of their participation.
10. English speaker
Exclusion criteria:
11. Presence of clinically significant diseases other than asthma (cardiovascular, renal, hepatic, gastrointestinal, haematological, pulmonary, neurological, genitourinary, autoimmune, endocrine, metabolic, neoplasia etc.), which, in the opinion of the investigator, may either put the patient at risk because of participation in the trial, or diseases which may influence the results of the study or the patient’s ability to take part in it
12. Smoking history over past 12 months.
13. Seasonal allergic rhinitis symptoms at screening or during the 3 week run-in (prior to rhinovirus inoculation).
14. Asthma exacerbation or viral illness within the previous 6 weeks or during the 3 week run-in (prior to rhinovirus inoculation).
15. Current or concomitant use of oral steroids, anti-leukotrienes or monoclonal antibodies.
Appendices
209/233
16. Pregnant or breast-feeding women. Patients should not be enrolled if they plan to become pregnant during the time of study participation (see note regarding contraception).
17. Contact with infants <6 months or immunocompromised persons, elderly and infirm at home or at work.
18. Subjects who have known evidence of lack of adherence to medications and/or ability to follow physician’s recommendations.
References
210/233
9 References
1. Asthma GIf. Global Strategy for Asthma Management and Prevention, 2018.
2. Global, regional, and national incidence, prevalence, and years lived with disability for 328 diseases and injuries for 195 countries, 1990-2016: a systematic analysis for the Global Burden of Disease Study 2016. Lancet (London, England) 2017; 390(10100): 1211-59.
3. Mukherjee M, Stoddart A, Gupta RP, et al. The epidemiology, healthcare and societal burden and costs of asthma in the UK and its member nations: analyses of standalone and linked national databases. BMC medicine 2016; 14(1): 113.
4. Sullivan PW, Smith KL, Ghushchyan VH, Globe DR, Lin SL, Globe G. Asthma in USA: its impact on health-related quality of life. The Journal of asthma : official journal of the Association for the Care of Asthma 2013; 50(8): 891-9.
5. Ivanova JI, Bergman R, Birnbaum HG, Colice GL, Silverman RA, McLaurin K. Effect of asthma exacerbations on health care costs among asthmatic patients with moderate and severe persistent asthma. The Journal of allergy and clinical immunology 2012; 129(5): 1229-35.
6. Bahadori K, Doyle-Waters MM, Marra C, et al. Economic burden of asthma: a systematic review. BMC pulmonary medicine 2009; 9: 24.
7. Bai TR, Vonk JM, Postma DS, Boezen HM. Severe exacerbations predict excess lung function decline in asthma. The European respiratory journal 2007; 30(3): 452-6.
8. Price D, Fletcher M, van der Molen T. Asthma control and management in 8,000 European patients: the REcognise Asthma and LInk to Symptoms and Experience (REALISE) survey. NPJ primary care respiratory medicine 2014; 24: 14009.
9. Haselkorn T, Fish JE, Zeiger RS, et al. Consistently very poorly controlled asthma, as defined by the impairment domain of the Expert Panel Report 3 guidelines, increases risk for future severe asthma exacerbations in The Epidemiology and Natural History of Asthma: Outcomes and Treatment Regimens (TENOR) study. The Journal of allergy and clinical immunology 2009; 124(5): 895-902.e1-4.
10. Patel M, Pilcher J, Reddel HK, et al. Metrics of salbutamol use as predictors of future adverse outcomes in asthma. Clinical and experimental allergy : journal of the British Society for Allergy and Clinical Immunology 2013; 43(10): 1144-51.
11. Ernst P, Spitzer WO, Suissa S, et al. Risk of fatal and near-fatal asthma in relation to inhaled corticosteroid use. Jama 1992; 268(24): 3462-4.
12. Melani AS, Bonavia M, Cilenti V, et al. Inhaler mishandling remains common in real life and is associated with reduced disease control. Respiratory medicine 2011; 105(6): 930-8.
13. Osborne ML, Pedula KL, O'Hollaren M, et al. Assessing future need for acute care in adult asthmatics: the Profile of Asthma Risk Study: a prospective health maintenance organization-based study. Chest 2007; 132(4): 1151-61.
References
211/233
14. Sturdy PM, Victor CR, Anderson HR, et al. Psychological, social and health behaviour risk factors for deaths certified as asthma: a national case-control study. Thorax 2002; 57(12): 1034-9.
15. Fitzpatrick S, Joks R, Silverberg JI. Obesity is associated with increased asthma severity and exacerbations, and increased serum immunoglobulin E in inner-city adults. Clinical and experimental allergy : journal of the British Society for Allergy and Clinical Immunology 2012; 42(5): 747-59.
16. Bousquet J, Khaltaev N, Cruz AA, et al. Allergic Rhinitis and its Impact on Asthma (ARIA) 2008 update (in collaboration with the World Health Organization, GA(2)LEN and AllerGen). Allergy 2008; 63 Suppl 86: 8-160.
17. Burks AW, Tang M, Sicherer S, et al. ICON: food allergy. The Journal of allergy and clinical immunology 2012; 129(4): 906-20.
18. Belda J, Giner J, Casan P, Sanchis J. Mild exacerbations and eosinophilic inflammation in patients with stable, well-controlled asthma after 1 year of follow-up. Chest 2001; 119(4): 1011-7.
19. Ulrik CS. Peripheral eosinophil counts as a marker of disease activity in intrinsic and extrinsic asthma. Clinical and experimental allergy : journal of the British Society for Allergy and Clinical Immunology 1995; 25(9): 820-7.
20. Zeiger RS, Schatz M, Zhang F, et al. Elevated exhaled nitric oxide is a clinical indicator of future uncontrolled asthma in asthmatic patients on inhaled corticosteroids. The Journal of allergy and clinical immunology 2011; 128(2): 412-4.
21. Murphy VE, Clifton VL, Gibson PG. Asthma exacerbations during pregnancy: incidence and association with adverse pregnancy outcomes. Thorax 2006; 61(2): 169-76.
22. Miller MK, Lee JH, Miller DP, Wenzel SE. Recent asthma exacerbations: a key predictor of future exacerbations. Respiratory medicine 2007; 101(3): 481-9.
23. Turner MO, Noertjojo K, Vedal S, Bai T, Crump S, Fitzgerald JM. Risk factors for near-fatal asthma. A case-control study in hospitalized patients with asthma. American journal of respiratory and critical care medicine 1998; 157(6 Pt 1): 1804-9.
24. Juniper EF, O'Byrne PM, Guyatt GH, Ferrie PJ, King DR. Development and validation of a questionnaire to measure asthma control. The European respiratory journal 1999; 14(4): 902-7.
25. Papadopoulos NG, Christodoulou I, Rohde G, et al. Viruses and bacteria in acute asthma exacerbations--a GA(2) LEN-DARE systematic review. Allergy 2011; 66(4): 458-68.
26. Sears MR, Johnston NW. Understanding the September asthma epidemic. The Journal of allergy and clinical immunology 2007; 120(3): 526-9.
27. Saglani S, Bush A. Asthma Attacks in Children: Does Blocking IgE Reduce Rhinovirus Infections? American journal of respiratory and critical care medicine 2017; 196(8): 941-2.
28. Message SD, Laza-Stanca V, Mallia P, et al. Rhinovirus-induced lower respiratory illness is increased in asthma and related to virus load and Th1/2 cytokine and IL-10 production. Proceedings of the National Academy of Sciences of the United States of America 2008; 105(36): 13562-7.
References
212/233
29. Papi A, Contoli M. Rhinovirus vaccination: the case against. The European respiratory journal 2011; 37(1): 5-7.
30. Rackemann FM. A working classification of asthma. The American journal of medicine 1947; 3(5): 601-6.
31. Wenzel S, Ford L, Pearlman D, et al. Dupilumab in persistent asthma with elevated eosinophil levels. The New England journal of medicine 2013; 368(26): 2455-66.
32. Woodruff PG, Modrek B, Choy DF, et al. T-helper type 2-driven inflammation defines major subphenotypes of asthma. American journal of respiratory and critical care medicine 2009; 180(5): 388-95.
33. Robinson DS, Hamid Q, Ying S, et al. Predominant TH2-like bronchoalveolar T-lymphocyte population in atopic asthma. The New England journal of medicine 1992; 326(5): 298-304.
34. Humbert M, Durham SR, Ying S, et al. IL-4 and IL-5 mRNA and protein in bronchial biopsies from patients with atopic and nonatopic asthma: evidence against "intrinsic" asthma being a distinct immunopathologic entity. American journal of respiratory and critical care medicine 1996; 154(5): 1497-504.
35. Gour N, Wills-Karp M. IL-4 and IL-13 signaling in allergic airway disease. Cytokine 2015; 75(1): 68-78.
36. Sanderson CJ. Interleukin-5, eosinophils, and disease. Blood 1992; 79(12): 3101-9.
37. Wills-Karp M, Luyimbazi J, Xu X, et al. Interleukin-13: central mediator of allergic asthma. Science (New York, NY) 1998; 282(5397): 2258-61.
38. Dougherty RH, Sidhu SS, Raman K, et al. Accumulation of intraepithelial mast cells with a unique protease phenotype in T(H)2-high asthma. The Journal of allergy and clinical immunology 2010; 125(5): 1046-53.e8.
39. Brusselle GG, Maes T, Bracke KR. Eosinophils in the spotlight: Eosinophilic airway inflammation in nonallergic asthma. Nature medicine 2013; 19(8): 977-9.
40. Baigelman W, Chodosh S, Pizzuto D, Cupples LA. Sputum and blood eosinophils during corticosteroid treatment of acute exacerbations of asthma. The American journal of medicine 1983; 75(6): 929-36.
41. Fahy JV, Kim KW, Liu J, Boushey HA. Prominent neutrophilic inflammation in sputum from subjects with asthma exacerbation. The Journal of allergy and clinical immunology 1995; 95(4): 843-52.
42. Teran LM, Johnston SL, Schroder JM, Church MK, Holgate ST. Role of nasal interleukin-8 in neutrophil recruitment and activation in children with virus-induced asthma. American journal of respiratory and critical care medicine 1997; 155(4): 1362-6.
43. Bartlett NW, Walton RP, Edwards MR, et al. Mouse models of rhinovirus-induced disease and exacerbation of allergic airway inflammation. Nature medicine 2008; 14(2): 199-204.
44. Gern JE, Vrtis R, Grindle KA, Swenson C, Busse WW. Relationship of upper and lower airway cytokines to outcome of experimental rhinovirus infection. American journal of respiratory and critical care medicine 2000; 162(6): 2226-31.
References
213/233
45. Jackson DJ, Makrinioti H, Rana BM, et al. IL-33-dependent type 2 inflammation during rhinovirus-induced asthma exacerbations in vivo. American journal of respiratory and critical care medicine 2014; 190(12): 1373-82.
46. Farne HA, Wilson A, Powell C, Bax L, Milan SJ. Anti-IL5 therapies for asthma. The Cochrane database of systematic reviews 2017; 9: Cd010834.
47. Wenzel S, Castro M, Corren J, et al. Dupilumab efficacy and safety in adults with uncontrolled persistent asthma despite use of medium-to-high-dose inhaled corticosteroids plus a long-acting beta2 agonist: a randomised double-blind placebo-controlled pivotal phase 2b dose-ranging trial. Lancet (London, England) 2016; 388(10039): 31-44.
48. Vareille M, Kieninger E, Edwards MR, Regamey N. The airway epithelium: soldier in the fight against respiratory viruses. Clinical microbiology reviews 2011; 24(1): 210-29.
49. Beale J, Jayaraman A, Jackson DJ, et al. Rhinovirus-induced IL-25 in asthma exacerbation drives type 2 immunity and allergic pulmonary inflammation. Science translational medicine 2014; 6(256): 256ra134.
50. Kato A, Favoreto S, Jr., Avila PC, Schleimer RP. TLR3- and Th2 cytokine-dependent production of thymic stromal lymphopoietin in human airway epithelial cells. Journal of immunology (Baltimore, Md : 1950) 2007; 179(2): 1080-7.
51. Werder RB, Lynch JP, Simpson JC, et al. PGD2/DP2 receptor activation promotes severe viral bronchiolitis by suppressing IFN-lambda production. Science translational medicine 2018; 10(440).
52. Schmitz J, Owyang A, Oldham E, et al. IL-33, an interleukin-1-like cytokine that signals via the IL-1 receptor-related protein ST2 and induces T helper type 2-associated cytokines. Immunity 2005; 23(5): 479-90.
53. Fort MM, Cheung J, Yen D, et al. IL-25 induces IL-4, IL-5, and IL-13 and Th2-associated pathologies in vivo. Immunity 2001; 15(6): 985-95.
54. Xue L, Gyles SL, Wettey FR, et al. Prostaglandin D2 causes preferential induction of proinflammatory Th2 cytokine production through an action on chemoattractant receptor-like molecule expressed on Th2 cells. Journal of immunology (Baltimore, Md : 1950) 2005; 175(10): 6531-6.
55. Soumelis V, Reche PA, Kanzler H, et al. Human epithelial cells trigger dendritic cell mediated allergic inflammation by producing TSLP. Nature immunology 2002; 3(7): 673-80.
56. Xue L, Salimi M, Panse I, et al. Prostaglandin D2 activates group 2 innate lymphoid cells through chemoattractant receptor-homologous molecule expressed on TH2 cells. The Journal of allergy and clinical immunology 2014; 133(4): 1184-94.
57. Mjosberg J, Bernink J, Golebski K, et al. The transcription factor GATA3 is essential for the function of human type 2 innate lymphoid cells. Immunity 2012; 37(4): 649-59.
58. Smith SG, Chen R, Kjarsgaard M, et al. Increased numbers of activated group 2 innate lymphoid cells in the airways of patients with severe asthma and persistent airway eosinophilia. The Journal of allergy and clinical immunology 2016; 137(1): 75-86.e8.
References
214/233
59. Allakhverdi Z, Smith DE, Comeau MR, Delespesse G. Cutting edge: The ST2 ligand IL-33 potently activates and drives maturation of human mast cells. Journal of immunology (Baltimore, Md : 1950) 2007; 179(4): 2051-4.
60. Siracusa MC, Saenz SA, Hill DA, et al. TSLP promotes interleukin-3-independent basophil haematopoiesis and type 2 inflammation. Nature 2011; 477(7363): 229-33.
61. Jackson DJ, Shamji B, Trujillo-Torralbo MB, et al. Prostaglandin D2 Is Induced During Rhinovirus-Induced Asthma Exacerbations And Related To Exacerbation Severity In Vivo. D12 EXACERBATION OF LUNG DISEASE: SHARED MECHANISMS; 2014: A5351-A.
62. Hansel TT, Tunstall T, Trujillo-Torralbo MB, et al. A Comprehensive Evaluation of Nasal and Bronchial Cytokines and Chemokines Following Experimental Rhinovirus Infection in Allergic Asthma: Increased Interferons (IFN-gamma and IFN-lambda) and Type 2 Inflammation (IL-5 and IL-13). EBioMedicine 2017; 19: 128-38.
63. Nino G, Huseni S, Perez GF, et al. Directional secretory response of double stranded RNA-induced thymic stromal lymphopoetin (TSLP) and CCL11/eotaxin-1 in human asthmatic airways. PloS one 2014; 9(12): e115398.
64. Perez GF, Pancham K, Huseni S, et al. Rhinovirus infection in young children is associated with elevated airway TSLP levels. The European respiratory journal 2014; 44(4): 1075-8.
65. Efficacy and Safety Study of GSK3772847 in Subjects With Moderately Severe Asthma. NCT03207243: https://ClinicalTrials.gov/show/NCT03207243.
66. Gauvreau GM, O'Byrne PM, Boulet LP, et al. Effects of an anti-TSLP antibody on allergen-induced asthmatic responses. The New England journal of medicine 2014; 370(22): 2102-10.
67. Corren J, Parnes JR, Wang L, et al. Tezepelumab in Adults with Uncontrolled Asthma. The New England journal of medicine 2017; 377(10): 936-46.
68. Kicic A, Sutanto EN, Stevens PT, Knight DA, Stick SM. Intrinsic biochemical and functional differences in bronchial epithelial cells of children with asthma. American journal of respiratory and critical care medicine 2006; 174(10): 1110-8.
69. Steelant B, Farre R, Wawrzyniak P, et al. Impaired barrier function in patients with house dust mite-induced allergic rhinitis is accompanied by decreased occludin and zonula occludens-1 expression. The Journal of allergy and clinical immunology 2016; 137(4): 1043-53.e5.
70. Gangl K, Waltl EE, Vetr H, et al. Infection with Rhinovirus Facilitates Allergen Penetration Across a Respiratory Epithelial Cell Layer. International archives of allergy and immunology 2015; 166(4): 291-6.
71. Green RM, Custovic A, Sanderson G, Hunter J, Johnston SL, Woodcock A. Synergism between allergens and viruses and risk of hospital admission with asthma: case-control study. BMJ (Clinical research ed) 2002; 324(7340): 763.
72. Murray CS, Poletti G, Kebadze T, et al. Study of modifiable risk factors for asthma exacerbations: virus infection and allergen exposure increase the risk of asthma hospital admissions in children. Thorax 2006; 61(5): 376-82.
References
215/233
73. Kantor DB, Stenquist N, McDonald MC, et al. Rhinovirus and serum IgE are associated with acute asthma exacerbation severity in children. The Journal of allergy and clinical immunology 2016; 138(5): 1467-71.e9.
74. Iwasaki A, Foxman EF, Molony RD. Early local immune defences in the respiratory tract. Nature reviews Immunology 2017; 17(1): 7-20.
75. Hussell T, Bell TJ. Alveolar macrophages: plasticity in a tissue-specific context. Nature reviews Immunology 2014; 14(2): 81-93.
76. Orinska Z, Bulanova E, Budagian V, Metz M, Maurer M, Bulfone-Paus S. TLR3-induced activation of mast cells modulates CD8+ T-cell recruitment. Blood 2005; 106(3): 978-87.
77. Shimokawa C, Kanaya T, Hachisuka M, et al. Mast Cells Are Crucial for Induction of Group 2 Innate Lymphoid Cells and Clearance of Helminth Infections. Immunity 2017; 46(5): 863-74.e4.
78. Voehringer D. Protective and pathological roles of mast cells and basophils. Nature reviews Immunology 2013; 13(5): 362-75.
79. Moon PD, Kim HM. Thymic stromal lymphopoietin is expressed and produced by caspase-1/NF-kappaB pathway in mast cells. Cytokine 2011; 54(3): 239-43.
80. Heymann PW, Nguyen HT, Steinke JW, et al. Rhinovirus infection results in stronger and more persistent genomic dysregulation: Evidence for altered innate immune response in asthmatics at baseline, early in infection, and during convalescence. PloS one 2017; 12(5): e0178096.
81. Papadopoulos NG, Xepapadaki P, Mallia P, et al. Mechanisms of virus-induced asthma exacerbations: state-of-the-art. A GA2LEN and InterAirways document. Allergy 2007; 62(5): 457-70.
82. de Kluijver J, Grunberg K, Pons D, et al. Interleukin-1beta and interleukin-1ra levels in nasal lavages during experimental rhinovirus infection in asthmatic and non-asthmatic subjects. Clinical and experimental allergy : journal of the British Society for Allergy and Clinical Immunology 2003; 33(10): 1415-8.
83. Fleming HE, Little FF, Schnurr D, et al. Rhinovirus-16 colds in healthy and in asthmatic subjects: similar changes in upper and lower airways. American journal of respiratory and critical care medicine 1999; 160(1): 100-8.
84. Jackson DJ, Glanville N, Trujillo-Torralbo MB, et al. Interleukin-18 is associated with protection against rhinovirus-induced colds and asthma exacerbations. Clinical infectious diseases : an official publication of the Infectious Diseases Society of America 2015; 60(10): 1528-31.
85. Miller EK, Hernandez JZ, Wimmenauer V, et al. A mechanistic role for type III IFN-lambda1 in asthma exacerbations mediated by human rhinoviruses. American journal of respiratory and critical care medicine 2012; 185(5): 508-16.
86. Cosmi L, Liotta F, Maggi E, Romagnani S, Annunziato F. Th17 cells: new players in asthma pathogenesis. Allergy 2011; 66(8): 989-98.
References
216/233
87. Al-Ramli W, Prefontaine D, Chouiali F, et al. T(H)17-associated cytokines (IL-17A and IL-17F) in severe asthma. The Journal of allergy and clinical immunology 2009; 123(5): 1185-7.
88. Perez GF, Pancham K, Huseni S, et al. Rhinovirus-induced airway cytokines and respiratory morbidity in severely premature children. Pediatric allergy and immunology : official publication of the European Society of Pediatric Allergy and Immunology 2015; 26(2): 145-52.
89. Nicholson EG, Schlegel C, Garofalo RP, et al. Robust Cytokine and Chemokine Response in Nasopharyngeal Secretions: Association With Decreased Severity in Children With Physician Diagnosed Bronchiolitis. The Journal of infectious diseases 2016; 214(4): 649-55.
90. Graser A, Ekici AB, Sopel N, et al. Rhinovirus inhibits IL-17A and the downstream immune responses in allergic asthma. Mucosal immunology 2016; 9(5): 1183-92.
91. Verbist KC, Klonowski KD. Functions of IL-15 in anti-viral immunity: multiplicity and variety. Cytokine 2012; 59(3): 467-78.
92. Laza-Stanca V, Message SD, Edwards MR, et al. The role of IL-15 deficiency in the pathogenesis of virus-induced asthma exacerbations. PLoS pathogens 2011; 7(7): e1002114.
93. Hamming OJ, Terczynska-Dyla E, Vieyres G, et al. Interferon lambda 4 signals via the IFNlambda receptor to regulate antiviral activity against HCV and coronaviruses. The EMBO journal 2013; 32(23): 3055-65.
94. Fensterl V, Sen GC. Interferons and viral infections. BioFactors (Oxford, England) 2009; 35(1): 14-20.
95. Edwards MR, Regamey N, Vareille M, et al. Impaired innate interferon induction in severe therapy resistant atopic asthmatic children. Mucosal immunology 2013; 6(4): 797-806.
96. Contoli M, Message SD, Laza-Stanca V, et al. Role of deficient type III interferon-lambda production in asthma exacerbations. Nature medicine 2006; 12(9): 1023-6.
97. Wark PA, Johnston SL, Bucchieri F, et al. Asthmatic bronchial epithelial cells have a deficient innate immune response to infection with rhinovirus. The Journal of experimental medicine 2005; 201(6): 937-47.
98. Gill MA, Bajwa G, George TA, et al. Counterregulation between the FcepsilonRI pathway and antiviral responses in human plasmacytoid dendritic cells. Journal of immunology (Baltimore, Md : 1950) 2010; 184(11): 5999-6006.
99. Gehlhar K, Bilitewski C, Reinitz-Rademacher K, Rohde G, Bufe A. Impaired virus-induced interferon-alpha2 release in adult asthmatic patients. Clinical and experimental allergy : journal of the British Society for Allergy and Clinical Immunology 2006; 36(3): 331-7.
100. Sykes A, Edwards MR, Macintyre J, et al. Rhinovirus 16-induced IFN-alpha and IFN-beta are deficient in bronchoalveolar lavage cells in asthmatic patients. The Journal of allergy and clinical immunology 2012; 129(6): 1506-14.e6.
References
217/233
101. Rupani H, Martinez-Nunez RT, Dennison P, et al. Toll-like Receptor 7 Is Reduced in Severe Asthma and Linked to an Altered MicroRNA Profile. American journal of respiratory and critical care medicine 2016; 194(1): 26-37.
102. Ritchie AI, Jackson DJ, Edwards MR, Johnston SL. Airway Epithelial Orchestration of Innate Immune Function in Response to Virus Infection. A Focus on Asthma. Annals of the American Thoracic Society 2016; 13 Suppl 1: S55-63.
103. Edwards MR, Strong K, Cameron A, Walton RP, Jackson DJ, Johnston SL. Viral infections in allergy and immunology: How allergic inflammation influences viral infections and illness. The Journal of allergy and clinical immunology 2017; 140(4): 909-20.
104. Rubner FJ, Jackson DJ, Evans MD, et al. Early life rhinovirus wheezing, allergic sensitization, and asthma risk at adolescence. The Journal of allergy and clinical immunology 2017; 139(2): 501-7.
105. Lynch JP, Werder RB, Simpson J, et al. Aeroallergen-induced IL-33 predisposes to respiratory virus-induced asthma by dampening antiviral immunity. The Journal of allergy and clinical immunology 2016; 138(5): 1326-37.
106. Phipps S, Werder R, Zhang V, Lynch J, Spann K. Persistent IL-33 in a Preclinical Chronic Asthma Model Underpins Rhinovirus-Induced Exacerbation by Dampening Antiviral Immunity. D12 MECHANISMS OF ALLERGIC AIRWAY INFLAMMATION; 2017. p. A6994-A.
107. Djukanovic R, Harrison T, Johnston SL, et al. The effect of inhaled IFN-beta on worsening of asthma symptoms caused by viral infections. A randomized trial. American journal of respiratory and critical care medicine 2014; 190(2): 145-54.
108. Menzies D, Jackson C, Mistry C, Houston R, Lipworth BJ. Symptoms, spirometry, exhaled nitric oxide, and asthma exacerbations in clinical practice. Annals of allergy, asthma & immunology : official publication of the American College of Allergy, Asthma, & Immunology 2008; 101(3): 248-55.
109. Teach SJ, Gill MA, Togias A, et al. Preseasonal treatment with either omalizumab or an inhaled corticosteroid boost to prevent fall asthma exacerbations. The Journal of allergy and clinical immunology 2015; 136(6): 1476-85.
110. Gielen V, Sykes A, Zhu J, et al. Increased nuclear suppressor of cytokine signaling 1 in asthmatic bronchial epithelium suppresses rhinovirus induction of innate interferons. The Journal of allergy and clinical immunology 2015; 136(1): 177-88.e11.
111. Contoli M, Ito K, Padovani A, et al. Th2 cytokines impair innate immune responses to rhinovirus in respiratory epithelial cells. Allergy 2015; 70(8): 910-20.
112. Moriwaki A, Matsumoto K, Matsunaga Y, et al. IL-13 suppresses double-stranded RNA-induced IFN-lambda production in lung cells. Biochemical and biophysical research communications 2011; 404(4): 922-7.
113. Hatchwell L, Collison A, Girkin J, et al. Toll-like receptor 7 governs interferon and inflammatory responses to rhinovirus and is suppressed by IL-5-induced lung eosinophilia. Thorax 2015; 70(9): 854-61.
114. Chen G, Korfhagen TR, Karp CL, et al. Foxa3 induces goblet cell metaplasia and inhibits innate antiviral immunity. American journal of respiratory and critical care medicine 2014; 189(3): 301-13.
References
218/233
115. Lewis RA, Soter NA, Diamond PT, Austen KF, Oates JA, Roberts LJ, 2nd. Prostaglandin D2 generation after activation of rat and human mast cells with anti-IgE. Journal of immunology (Baltimore, Md : 1950) 1982; 129(4): 1627-31.
116. Joo M, Kwon M, Sadikot RT, et al. Induction and function of lipocalin prostaglandin D synthase in host immunity. Journal of immunology (Baltimore, Md : 1950) 2007; 179(4): 2565-75.
117. Tanaka K, Ogawa K, Sugamura K, Nakamura M, Takano S, Nagata K. Cutting edge: differential production of prostaglandin D2 by human helper T cell subsets. Journal of immunology (Baltimore, Md : 1950) 2000; 164(5): 2277-80.
118. Shimura C, Satoh T, Igawa K, et al. Dendritic cells express hematopoietic prostaglandin D synthase and function as a source of prostaglandin D2 in the skin. The American journal of pathology 2010; 176(1): 227-37.
119. Ugajin T, Satoh T, Kanamori T, Aritake K, Urade Y, Yokozeki H. FcepsilonRI, but not FcgammaR, signals induce prostaglandin D2 and E2 production from basophils. The American journal of pathology 2011; 179(2): 775-82.
120. Luna-Gomes T, Magalhaes KG, Mesquita-Santos FP, et al. Eosinophils as a novel cell source of prostaglandin D2: autocrine role in allergic inflammation. Journal of immunology (Baltimore, Md : 1950) 2011; 187(12): 6518-26.
121. Gervais FG, Cruz RP, Chateauneuf A, et al. Selective modulation of chemokinesis, degranulation, and apoptosis in eosinophils through the PGD2 receptors CRTH2 and DP. The Journal of allergy and clinical immunology 2001; 108(6): 982-8.
122. Yoshimura-Uchiyama C, Iikura M, Yamaguchi M, et al. Differential modulation of human basophil functions through prostaglandin D2 receptors DP and chemoattractant receptor-homologous molecule expressed on Th2 cells/DP2. Clinical and experimental allergy : journal of the British Society for Allergy and Clinical Immunology 2004; 34(8): 1283-90.
123. Liu MC, Bleecker ER, Lichtenstein LM, et al. Evidence for elevated levels of histamine, prostaglandin D2, and other bronchoconstricting prostaglandins in the airways of subjects with mild asthma. The American review of respiratory disease 1990; 142(1): 126-32.
124. Redington AE, Meng QH, Springall DR, et al. Increased expression of inducible nitric oxide synthase and cyclo-oxygenase-2 in the airway epithelium of asthmatic subjects and regulation by corticosteroid treatment. Thorax 2001; 56(5): 351-7.
125. Fajt ML, Gelhaus SL, Freeman B, et al. Prostaglandin D(2) pathway upregulation: relation to asthma severity, control, and TH2 inflammation. The Journal of allergy and clinical immunology 2013; 131(6): 1504-12.
126. Djukanovic R, Roche WR, Wilson JW, et al. Mucosal inflammation in asthma. The American review of respiratory disease 1990; 142(2): 434-57.
127. Mutalithas K, Guillen C, Day C, Brightling CE, Pavord ID, Wardlaw AJ. CRTH2 expression on T cells in asthma. Clinical and experimental immunology 2010; 161(1): 34-40.
128. Stinson SE, Amrani Y, Brightling CE. D prostanoid receptor 2 (chemoattractant receptor-homologous molecule expressed on TH2 cells) protein expression in asthmatic
References
219/233
patients and its effects on bronchial epithelial cells. The Journal of allergy and clinical immunology 2015; 135(2): 395-406.
129. Xue L, Hilvering B, Shrimanker R, et al. Peripheral Blood CRTH2 Positive Cells in Patients with Severe Asthma. B101 PHENOTYPING OF ASTHMA IN THE ERA OF BIOMARKERS AND OMICS; 2016. p. A4334-A.
130. Huang JL, Gao PS, Mathias RA, et al. Sequence variants of the gene encoding chemoattractant receptor expressed on Th2 cells (CRTH2) are associated with asthma and differentially influence mRNA stability. Human molecular genetics 2004; 13(21): 2691-7.
131. Campos Alberto E, Maclean E, Davidson C, et al. The single nucleotide polymorphism CRTh2 rs533116 is associated with allergic asthma and increased expression of CRTh2. Allergy 2012; 67(11): 1357-64.
132. Stebbins KJ, Broadhead AR, Correa LD, et al. Therapeutic efficacy of AM156, a novel prostanoid DP2 receptor antagonist, in murine models of allergic rhinitis and house dust mite-induced pulmonary inflammation. European journal of pharmacology 2010; 638(1-3): 142-9.
133. Chevalier E, Stock J, Fisher T, et al. Cutting edge: chemoattractant receptor-homologous molecule expressed on Th2 cells plays a restricting role on IL-5 production and eosinophil recruitment. Journal of immunology (Baltimore, Md : 1950) 2005; 175(4): 2056-60.
134. Rosenbaum JR, Sepkowitz KA. Infectious disease experimentation involving human volunteers. Clinical infectious diseases : an official publication of the Infectious Diseases Society of America 2002; 34(7): 963-71.
135. Halperin SA, Eggleston PA, Beasley P, et al. Exacerbations of asthma in adults during experimental rhinovirus infection. The American review of respiratory disease 1985; 132(5): 976-80.
136. Grunberg K, Timmers MC, Smits HH, et al. Effect of experimental rhinovirus 16 colds on airway hyperresponsiveness to histamine and interleukin-8 in nasal lavage in asthmatic subjects in vivo. Clinical and experimental allergy : journal of the British Society for Allergy and Clinical Immunology 1997; 27(1): 36-45.
137. de Kluijver J, Evertse CE, Sont JK, et al. Are rhinovirus-induced airway responses in asthma aggravated by chronic allergen exposure? American journal of respiratory and critical care medicine 2003; 168(10): 1174-80.
138. Adura PT, Reed E, Macintyre J, et al. Experimental rhinovirus 16 infection in moderate asthmatics on inhaled corticosteroids. The European respiratory journal 2014; 43(4): 1186-9.
139. Jackson DJ, Trujillo-Torralbo MB, del-Rosario J, et al. The influence of asthma control on the severity of virus-induced asthma exacerbations. The Journal of allergy and clinical immunology 2015; 136(2): 497-500.e3.
140. Bardin PG, Fraenkel DJ, Sanderson G, et al. Amplified rhinovirus colds in atopic subjects. Clinical and experimental allergy : journal of the British Society for Allergy and Clinical Immunology 1994; 24(5): 457-64.
References
220/233
141. Fraenkel DJ, Bardin PG, Sanderson G, Lampe F, Johnston SL, Holgate ST. Lower airways inflammation during rhinovirus colds in normal and in asthmatic subjects. American journal of respiratory and critical care medicine 1995; 151(3 Pt 1): 879-86.
142. Cheung D, Dick EC, Timmers MC, de Klerk EP, Spaan WJ, Sterk PJ. Rhinovirus inhalation causes long-lasting excessive airway narrowing in response to methacholine in asthmatic subjects in vivo. American journal of respiratory and critical care medicine 1995; 152(5 Pt 1): 1490-6.
143. Grunberg K, Smits HH, Timmers MC, et al. Experimental rhinovirus 16 infection. Effects on cell differentials and soluble markers in sputum in asthmatic subjects. American journal of respiratory and critical care medicine 1997; 156(2 Pt 1): 609-16.
144. Grunberg K, Timmers MC, de Klerk EP, Dick EC, Sterk PJ. Experimental rhinovirus 16 infection causes variable airway obstruction in subjects with atopic asthma. American journal of respiratory and critical care medicine 1999; 160(4): 1375-80.
145. de Gouw HW, Grunberg K, Schot R, Kroes AC, Dick EC, Sterk PJ. Relationship between exhaled nitric oxide and airway hyperresponsiveness following experimental rhinovirus infection in asthmatic subjects. The European respiratory journal 1998; 11(1): 126-32.
146. Bardin PG, Fraenkel DJ, Sanderson G, van Schalkwyk EM, Holgate ST, Johnston SL. Peak expiratory flow changes during experimental rhinovirus infection. The European respiratory journal 2000; 16(5): 980-5.
147. Jarjour NN, Gern JE, Kelly EA, Swenson CA, Dick CR, Busse WW. The effect of an experimental rhinovirus 16 infection on bronchial lavage neutrophils. The Journal of allergy and clinical immunology 2000; 105(6 Pt 1): 1169-77.
148. Grunberg K, Sharon RF, Hiltermann TJ, et al. Experimental rhinovirus 16 infection increases intercellular adhesion molecule-1 expression in bronchial epithelium of asthmatics regardless of inhaled steroid treatment. Clinical and experimental allergy : journal of the British Society for Allergy and Clinical Immunology 2000; 30(7): 1015-23.
149. Grunberg K, Sharon RF, Sont JK, et al. Rhinovirus-induced airway inflammation in asthma: effect of treatment with inhaled corticosteroids before and during experimental infection. American journal of respiratory and critical care medicine 2001; 164(10 Pt 1): 1816-22.
150. Zambrano JC, Carper HT, Rakes GP, et al. Experimental rhinovirus challenges in adults with mild asthma: response to infection in relation to IgE. The Journal of allergy and clinical immunology 2003; 111(5): 1008-16.
151. Christiansen SC, Eddleston J, Bengtson SH, et al. Experimental rhinovirus infection increases human tissue kallikrein activation in allergic subjects. International archives of allergy and immunology 2008; 147(4): 299-304.
152. Glanville N, Message SD, Walton RP, et al. gammadeltaT cells suppress inflammation and disease during rhinovirus-induced asthma exacerbations. Mucosal immunology 2013; 6(6): 1091-100.
153. Jayaraman A, Jackson DJ, Message SD, et al. IL-15 complexes induce NK- and T-cell responses independent of type I IFN signaling during rhinovirus infection. Mucosal immunology 2014; 7(5): 1151-64.
References
221/233
154. Rohde G, Message SD, Haas JJ, et al. CXC chemokines and antimicrobial peptides in rhinovirus-induced experimental asthma exacerbations. Clinical and experimental allergy : journal of the British Society for Allergy and Clinical Immunology 2014; 44(7): 930-9.
155. Zhu J, Message SD, Qiu Y, et al. Airway inflammation and illness severity in response to experimental rhinovirus infection in asthma. Chest 2014; 145(6): 1219-29.
156. Zhu J, Message SD, Mallia P, et al. Bronchial mucosal IFN-alpha/beta and pattern recognition receptor expression in patients with experimental rhinovirus-induced asthma exacerbations. The Journal of allergy and clinical immunology 2018.
157. DeMore JP, Weisshaar EH, Vrtis RF, et al. Similar colds in subjects with allergic asthma and nonatopic subjects after inoculation with rhinovirus-16. The Journal of allergy and clinical immunology 2009; 124(2): 245-52, 52.e1-3.
158. Kloepfer KM, DeMore JP, Vrtis RF, et al. Effects of montelukast on patients with asthma after experimental inoculation with human rhinovirus 16. Annals of allergy, asthma & immunology : official publication of the American College of Allergy, Asthma, & Immunology 2011; 106(3): 252-7.
159. van der Sluijs KF, van de Pol MA, Kulik W, et al. Systemic tryptophan and kynurenine catabolite levels relate to severity of rhinovirus-induced asthma exacerbation: a prospective study with a parallel-group design. Thorax 2013; 68(12): 1122-30.
160. Majoor CJ, van de Pol MA, Kamphuisen PW, et al. Evaluation of coagulation activation after rhinovirus infection in patients with asthma and healthy control subjects: an observational study. Respiratory research 2014; 15: 14.
161. Agrawal R, Wisniewski J, Yu MD, et al. Infection with human rhinovirus 16 promotes enhanced IgE responsiveness in basophils of atopic asthmatics. Clinical and experimental allergy : journal of the British Society for Allergy and Clinical Immunology 2014; 44(10): 1266-73.
162. Niespodziana K, Cabauatan CR, Jackson DJ, et al. Rhinovirus-induced VP1-specific Antibodies are Group-specific and Associated With Severity of Respiratory Symptoms. EBioMedicine 2015; 2(1): 64-70.
163. Toussaint M, Jackson DJ, Swieboda D, et al. Host DNA released by NETosis promotes rhinovirus-induced type-2 allergic asthma exacerbation. Nature medicine 2017; 23(6): 681-91.
164. Kennedy JL, Shaker M, McMeen V, et al. Comparison of viral load in individuals with and without asthma during infections with rhinovirus. American journal of respiratory and critical care medicine 2014; 189(5): 532-9.
165. Muehling L, Agrawal R, Wright P, Kwok W, Heymann P, Woodfolk JA. Experimental infection with human rhinovirus-A16 reveals an amplified Th1 response in allergic asthmatics. The Journal of Immunology 2017; 198(1 Supplement): 53.3-.3.
166. Silkoff PE, Flavin S, Gordon R, et al. Toll-like receptor 3 blockade in rhinovirus-induced experimental asthma exacerbations: A randomized controlled study. The Journal of allergy and clinical immunology 2018; 141(4): 1220-30.
References
222/233
167. Dhariwal J, Wong E, Trujillo-Torralbo B, Jackson DJ, Johnston SL. Poor Baseline Asthma Control Is Associated with Greater Virus Load Following Rhinovirus Infection. D21 INFECTIONS AND IMMUNITY; 2018: A6224-A.
168. Dhariwal J. Understanding innate lymphoid cells in allergic inflammation and respiratory viral infection. London: Imperial College; 2016.
169. Del Vecchio AM, Branigan PJ, Barnathan ES, Flavin SK, Silkoff PE, Turner RB. Utility of animal and in vivo experimental infection of humans with rhinoviruses in the development of therapeutic agents for viral exacerbations of asthma and chronic obstructive pulmonary disease. Pulmonary pharmacology & therapeutics 2015; 30: 32-43.
170. Diamant Z, Gauvreau GM, Cockcroft DW, et al. Inhaled allergen bronchoprovocation tests. The Journal of allergy and clinical immunology 2013; 132(5): 1045-55.e6.
171. Treatment With Omalizumab to Improve the Asthmatic Response to Rhinovirus Experimental Infection With Rhinovirus. NCT02388997: https://ClinicalTrials.gov/show/NCT02388997.
172. Mepolizumab Treatment for Rhinovirus-induced Asthma Exacerbations. NCT01520051: https://ClinicalTrials.gov/show/NCT01520051.
173. Scadding GW, Eifan A, Penagos M, et al. Local and systemic effects of cat allergen nasal provocation. Clinical and experimental allergy : journal of the British Society for Allergy and Clinical Immunology 2015; 45(3): 613-23.
174. Scadding GW, Eifan AO, Lao-Araya M, et al. Effect of grass pollen immunotherapy on clinical and local immune response to nasal allergen challenge. Allergy 2015; 70(6): 689-96.
175. Horak F, Zieglmayer P, Zieglmayer R, et al. The CRTH2 antagonist OC000459 reduces nasal and ocular symptoms in allergic subjects exposed to grass pollen, a randomised, placebo-controlled, double-blind trial. Allergy 2012; 67(12): 1572-9.
176. Pettipher R, Vinall SL, Xue L, et al. Pharmacologic profile of OC000459, a potent, selective, and orally active D prostanoid receptor 2 antagonist that inhibits mast cell-dependent activation of T helper 2 lymphocytes and eosinophils. The Journal of pharmacology and experimental therapeutics 2012; 340(2): 473-82.
177. Wojno ED, Monticelli LA, Tran SV, et al. The prostaglandin D(2) receptor CRTH2 regulates accumulation of group 2 innate lymphoid cells in the inflamed lung. Mucosal immunology 2015; 8(6): 1313-23.
178. Barnes N, Pavord I, Chuchalin A, et al. A randomized, double-blind, placebo-controlled study of the CRTH2 antagonist OC000459 in moderate persistent asthma. Clinical and experimental allergy : journal of the British Society for Allergy and Clinical Immunology 2012; 42(1): 38-48.
179. Pettipher R, Hunter MG, Perkins CM, et al. Heightened response of eosinophilic asthmatic patients to the CRTH2 antagonist OC000459. Allergy 2014; 69(9): 1223-32.
180. Singh D, Cadden P, Hunter M, et al. Inhibition of the asthmatic allergen challenge response by the CRTH2 antagonist OC000459. The European respiratory journal 2013; 41(1): 46-52.
References
223/233
181. Straumann A, Hoesli S, Bussmann C, et al. Anti-eosinophil activity and clinical efficacy of the CRTH2 antagonist OC000459 in eosinophilic esophagitis. Allergy 2013; 68(3): 375-85.
182. Diamant Z, Sidharta PN, Singh D, et al. Setipiprant, a selective CRTH2 antagonist, reduces allergen-induced airway responses in allergic asthmatics. Clinical and experimental allergy : journal of the British Society for Allergy and Clinical Immunology 2014; 44(8): 1044-52.
183. Juniper EF, Svensson K, Mork AC, Stahl E. Measurement properties and interpretation of three shortened versions of the asthma control questionnaire. Respiratory medicine 2005; 99(5): 553-8.
184. Juniper EF, Guyatt GH, Willan A, Griffith LE. Determining a minimal important change in a disease-specific Quality of Life Questionnaire. Journal of clinical epidemiology 1994; 47(1): 81-7.
185. Jones PW. St. George's Respiratory Questionnaire: MCID. Copd 2005; 2(1): 75-9.
186. Santanello NC, Zhang J, Seidenberg B, Reiss TF, Barber BL. What are minimal important changes for asthma measures in a clinical trial? The European respiratory journal 1999; 14(1): 23-7.
187. Kuna P, Bjermer L, Tornling G. Two Phase II randomized trials on the CRTh2 antagonist AZD1981 in adults with asthma. Drug design, development and therapy 2016; 10: 2759-70.
188. Erpenbeck VJ, Popov TA, Miller D, et al. The oral CRTh2 antagonist QAW039 (fevipiprant): A phase II study in uncontrolled allergic asthma. Pulmonary pharmacology & therapeutics 2016; 39: 54-63.
189. Gonem S, Berair R, Singapuri A, et al. Fevipiprant, a prostaglandin D2 receptor 2 antagonist, in patients with persistent eosinophilic asthma: a single-centre, randomised, double-blind, parallel-group, placebo-controlled trial. The Lancet Respiratory medicine 2016; 4(9): 699-707.
190. Hall IP, Fowler AV, Gupta A, et al. Efficacy of BI 671800, an oral CRTH2 antagonist, in poorly controlled asthma as sole controller and in the presence of inhaled corticosteroid treatment. Pulmonary pharmacology & therapeutics 2015; 32: 37-44.
191. Wenzel S, Chantry D, Eberhardt C, et al. ARRY-502, a potent, selective, oral CRTh2 antagonist reduces Th2 mediators in patients with mild to moderate Th2-driven asthma. European Respiratory Journal 2014; 44(Suppl 58).
192. Farne H, Jackson DJ, Johnston SL. Are emerging PGD2 antagonists a promising therapy class for treating asthma? Expert opinion on emerging drugs 2016; 21(4): 359-64.
193. Effect of OC000459 on Eosinophilic Airway Inflammation in Severe Asthma. NCT02560610: https://ClinicalTrials.gov/show/NCT02560610.
194. Study of Efficacy and Safety of QAW039 in Patients With Severe Asthma Inadequately Controlled With Standard of Care Asthma Treatment. NCT02563067: https://ClinicalTrials.gov/show/NCT02563067.
References
224/233
195. Bateman ED, Guerreros AG, Brockhaus F, et al. Fevipiprant, an oral prostaglandin DP2 receptor (CRTh2) antagonist, in allergic asthma uncontrolled on low-dose inhaled corticosteroids. The European respiratory journal 2017; 50(2).
196. A Study to Assess the Effect of QAW039 in Non-atopic Asthmatic Patients. NCT01836471: https://ClinicalTrials.gov/show/NCT01836471.
197. Miller D, Wood C, Bateman E, et al. A randomized study of BI 671800, a CRTH2 antagonist, as add-on therapy in poorly controlled asthma. Allergy and asthma proceedings 2017; 38(2): 157-64.
198. Study to Evaluate the Effectiveness and Safety of MK-1029 in the Treatment of Persistent Asthma That is Not Controlled With Montelukast (ML) in Adults (MK-1029-011 AM2). NCT01624974: https://ClinicalTrials.gov/show/NCT01624974.
199. A Study to Evaluate Efficacy and Safety of ADC3680 in Subjects With Inadequately-Controlled Asthma. NCT01730027: https://ClinicalTrials.gov/show/NCT01730027.
200. Clinical Study to Explore the Efficacy of ACT-129968 in Patients With Partly Controlled Asthma. NCT01225315: https://ClinicalTrials.gov/show/NCT01225315.
201. Bateman ED, O'Brien C, Rugman P, Luke S, Ivanov S, Uddin M. Efficacy and safety of the CRTh2 antagonist AZD1981 as add-on therapy to inhaled corticosteroids and long-acting beta2-agonists in patients with atopic asthma. Drug design, development and therapy 2018; 12: 1093-106.
202. Busse WW, Wenzel SE, Meltzer EO, et al. Safety and efficacy of the prostaglandin D2 receptor antagonist AMG 853 in asthmatic patients. The Journal of allergy and clinical immunology 2013; 131(2): 339-45.
203. Effect of OC000459 on Moderate to Severe Atopic Dermatitis. NCT02002208: https://ClinicalTrials.gov/show/NCT02002208.
204. Gwaltney JM, Jr., Hendley O, Hayden FG, et al. Updated recommendations for safety-testing of viral inocula used in volunteer experiments on rhinovirus colds. Progress in medical virology Fortschritte der medizinischen Virusforschung Progres en virologie medicale 1992; 39: 256-63.
205. Bardin PG, Sanderson G, Robinson BS, Holgate ST, Tyrrell DA. Experimental rhinovirus infection in volunteers. The European respiratory journal 1996; 9(11): 2250-5.
206. Mallia P, Message SD, Kebadze T, Parker HL, Kon OM, Johnston SL. An experimental model of rhinovirus induced chronic obstructive pulmonary disease exacerbations: a pilot study. Respiratory research 2006; 7: 116.
207. Mallia P, Message SD, Gielen V, et al. Experimental rhinovirus infection as a human model of chronic obstructive pulmonary disease exacerbation. American journal of respiratory and critical care medicine 2011; 183(6): 734-42.
208. Widegren H, Andersson M, Borgeat P, Flamand L, Johnston S, Greiff L. LTB4 increases nasal neutrophil activity and conditions neutrophils to exert antiviral effects. Respiratory medicine 2011; 105(7): 997-1006.
209. Footitt J, Mallia P, Durham AL, et al. Oxidative and Nitrosative Stress and Histone Deacetylase-2 Activity in Exacerbations of COPD. Chest 2016; 149(1): 62-73.
References
225/233
210. Clarsund M, Fornbacke M, Uller L, Johnston SL, Emanuelsson CA. A Randomized, Double-Blind, Placebo-Controlled Pilot Clinical Study on ColdZyme<sup>&reg;</sup> Mouth Spray against Rhinovirus-Induced Common Cold. Open Journal of Respiratory Diseases 2017; Vol.07No.04: 11.
211. Coleman CI, Limone B, Sobieraj DM, et al. Dosing frequency and medication adherence in chronic disease. Journal of managed care pharmacy : JMCP 2012; 18(7): 527-39.
212. Hansen RA, Kim MM, Song L, Tu W, Wu J, Murray MD. Comparison of methods to assess medication adherence and classify nonadherence. The Annals of pharmacotherapy 2009; 43(3): 413-22.
213. Miller MR, Hankinson J, Brusasco V, et al. Standardisation of spirometry. The European respiratory journal 2005; 26(2): 319-38.
214. Kerwin EM, Yiu G, Hickey L, Small CJ. Analysis of the Relationship Between Handheld and Clinic-Based Spirometry Measurements in a Randomized, Double-Blind, Placebo-Controlled Study of Beclomethasone Dipropionate Via Breath-Actuated Inhaler for Persistent Asthma. B32 THERAPEUTIC TRIALS IN ASTHMA; 2017: A3205-A.
215. Gilbert R, Auchincloss JH, Jr. Post-test probability of asthma following methacholine challenge. Chest 1990; 97(3): 562-5.
216. Rosi E, Ronchi MC, Grazzini M, Duranti R, Scano G. Sputum analysis, bronchial hyperresponsiveness, and airway function in asthma: results of a factor analysis. The Journal of allergy and clinical immunology 1999; 103(2 Pt 1): 232-7.
217. Sterk PJ, Fabbri LM, Quanjer PH, et al. Airway responsiveness. Standardized challenge testing with pharmacological, physical and sensitizing stimuli in adults. Report Working Party Standardization of Lung Function Tests, European Community for Steel and Coal. Official Statement of the European Respiratory Society. The European respiratory journal Supplement 1993; 16: 53-83.
218. Manoharan A, Lipworth BJ, Craig E, Jackson C. The potential role of direct and indirect bronchial challenge testing to identify overtreatment of community managed asthma. Clinical and experimental allergy : journal of the British Society for Allergy and Clinical Immunology 2014; 44(10): 1240-5.
219. Jones SL, Kittelson J, Cowan JO, et al. The predictive value of exhaled nitric oxide measurements in assessing changes in asthma control. American journal of respiratory and critical care medicine 2001; 164(5): 738-43.
220. Gelb AF, Flynn Taylor C, Shinar CM, Gutierrez C, Zamel N. Role of spirometry and exhaled nitric oxide to predict exacerbations in treated asthmatics. Chest 2006; 129(6): 1492-9.
221. Nanda CR, Singapuri A, Soares M, Monteiro W, Siddiqui S, Gonem S. Domiciliary exhaled nitric oxide and eosinophilic airway inflammation in adults with asthma. The European respiratory journal 2016; 48(1): 242-4.
222. Suresh V, Mih JD, George SC. Measurement of IL-13-induced iNOS-derived gas phase nitric oxide in human bronchial epithelial cells. American journal of respiratory cell and molecular biology 2007; 37(1): 97-104.
References
226/233
223. ATS/ERS recommendations for standardized procedures for the online and offline measurement of exhaled lower respiratory nitric oxide and nasal nitric oxide, 2005. American journal of respiratory and critical care medicine 2005; 171(8): 912-30.
224. Reznik M, Sharif I, Ozuah PO. Classifying asthma severity: prospective symptom diary or retrospective symptom recall? The Journal of adolescent health : official publication of the Society for Adolescent Medicine 2005; 36(6): 537-8.
225. Gwaltney CJ, Shields AL, Shiffman S. Equivalence of electronic and paper-and-pencil administration of patient-reported outcome measures: a meta-analytic review. Value in health : the journal of the International Society for Pharmacoeconomics and Outcomes Research 2008; 11(2): 322-33.
226. Du Rand IA, Blaikley J, Booton R, et al. British Thoracic Society guideline for diagnostic flexible bronchoscopy in adults: accredited by NICE. Thorax 2013; 68 Suppl 1: i1-i44.
227. Paggiaro PL, Chanez P, Holz O, et al. Sputum induction. The European respiratory journal Supplement 2002; 37: 3s-8s.
228. Papi A, Johnston SL. Rhinovirus infection induces expression of its own receptor intercellular adhesion molecule 1 (ICAM-1) via increased NF-kappaB-mediated transcription. The Journal of biological chemistry 1999; 274(14): 9707-20.
229. Mason DY, Sammons R. Alkaline phosphatase and peroxidase for double immunoenzymatic labelling of cellular constituents. Journal of clinical pathology 1978; 31(5): 454-60.
230. Dziadziuszko R, Wynes MW, Singh S, et al. Correlation between MET gene copy number by silver in situ hybridization and protein expression by immunohistochemistry in non-small cell lung cancer. Journal of thoracic oncology : official publication of the International Association for the Study of Lung Cancer 2012; 7(2): 340-7.
231. Cappuzzo F, Hirsch FR, Rossi E, et al. Epidermal growth factor receptor gene and protein and gefitinib sensitivity in non-small-cell lung cancer. Journal of the National Cancer Institute 2005; 97(9): 643-55.
232. Massaro AF, Mehta S, Lilly CM, Kobzik L, Reilly JJ, Drazen JM. Elevated nitric oxide concentrations in isolated lower airway gas of asthmatic subjects. American journal of respiratory and critical care medicine 1996; 153(5): 1510-4.
233. Guo FH, De Raeve HR, Rice TW, Stuehr DJ, Thunnissen FB, Erzurum SC. Continuous nitric oxide synthesis by inducible nitric oxide synthase in normal human airway epithelium in vivo. Proceedings of the National Academy of Sciences of the United States of America 1995; 92(17): 7809-13.
234. Radomski MW, Palmer RM, Moncada S. Glucocorticoids inhibit the expression of an inducible, but not the constitutive, nitric oxide synthase in vascular endothelial cells. Proceedings of the National Academy of Sciences of the United States of America 1990; 87(24): 10043-7.
235. Panettieri RA, Jr., Sjobring U, Peterffy A, et al. Tralokinumab for severe, uncontrolled asthma (STRATOS 1 and STRATOS 2): two randomised, double-blind, placebo-controlled, phase 3 clinical trials. The Lancet Respiratory medicine 2018.
References
227/233
236. Alving K, Weitzberg E, Lundberg JM. Increased amount of nitric oxide in exhaled air of asthmatics. The European respiratory journal 1993; 6(9): 1368-70.
237. Stirling RG, Kharitonov SA, Campbell D, et al. Increase in exhaled nitric oxide levels in patients with difficult asthma and correlation with symptoms and disease severity despite treatment with oral and inhaled corticosteroids. Asthma and Allergy Group. Thorax 1998; 53(12): 1030-4.
238. Kharitonov SA, Yates DH, Chung KF, Barnes PJ. Changes in the dose of inhaled steroid affect exhaled nitric oxide levels in asthmatic patients. The European respiratory journal 1996; 9(2): 196-201.
239. Hanania NA, Wenzel S, Rosen K, et al. Exploring the effects of omalizumab in allergic asthma: an analysis of biomarkers in the EXTRA study. American journal of respiratory and critical care medicine 2013; 187(8): 804-11.
240. Jackson GG, Dowling HF, Spiesman IG, Boand AV. Transmission of the common cold to volunteers under controlled conditions. I. The common cold as a clinical entity. AMA archives of internal medicine 1958; 101(2): 267-78.
241. Jackson DJ. The pathophysiology of rhinovirus induced exacerbations in mild and moderate asthma. London: Imperial College; 2013.
242. Scadding GW. Nasal allergen provocation: validation of clinical and immunologic markers and response to grass pollen immunotherapy. London: Imperial College, London; 2016.
243. Barry SM, Condez A, Johnson MA, Janossy G. Determination of bronchoalveolar lavage leukocyte populations by flow cytometry in patients investigated for respiratory disease. Cytometry 2002; 50(6): 291-7.
244. Dhariwal J, Cameron A, Trujillo-Torralbo MB, et al. Mucosal Type 2 Innate Lymphoid Cells Are a Key Component of the Allergic Response to Aeroallergens. American journal of respiratory and critical care medicine 2017; 195(12): 1586-96.
245. Papadopoulos NG, Bates PJ, Bardin PG, et al. Rhinoviruses infect the lower airways. The Journal of infectious diseases 2000; 181(6): 1875-84.
246. Mosser AG, Vrtis R, Burchell L, et al. Quantitative and qualitative analysis of rhinovirus infection in bronchial tissues. American journal of respiratory and critical care medicine 2005; 171(6): 645-51.
247. A Study to Evaluate the Safety and Use of Human Rhinovirus in Healthy and Asthmatic Participants (MK-0000-218). NCT01866306: https://ClinicalTrials.gov/show/NCT01866306.
248. Ducharme FM, Ni Chroinin M, Greenstone I, Lasserson TJ. Addition of long-acting beta2-agonists to inhaled corticosteroids versus same dose inhaled corticosteroids for chronic asthma in adults and children. The Cochrane database of systematic reviews 2010; (5): Cd005535.
249. Cote J, Cartier A, Malo JL, Rouleau M, Boulet LP. Compliance with peak expiratory flow monitoring in home management of asthma. Chest 1998; 113(4): 968-72.
References
228/233
250. Bailey WC, Higgins DM, Richards BM, Richards JM, Jr. Asthma severity: a factor analytic investigation. The American journal of medicine 1992; 93(3): 263-9.
251. Kerstjens HA, Brand PL, de Jong PM, Koeter GH, Postma DS. Influence of treatment on peak expiratory flow and its relation to airway hyperresponsiveness and symptoms. The Dutch CNSLD Study Group. Thorax 1994; 49(11): 1109-15.
252. Reddel HK, Salome CM, Peat JK, Woolcock AJ. Which index of peak expiratory flow is most useful in the management of stable asthma? American journal of respiratory and critical care medicine 1995; 151(5): 1320-5.
253. Barnes NC, Burke CM, Poulter LW, Schleimer RP. The anti-inflammatory profile of inhaled corticosteroids: biopsy studies in asthmatic patients. Respiratory medicine 2000; 94 Suppl F: S16-21.
254. Duddridge M, Ward C, Hendrick DJ, Walters EH. Changes in bronchoalveolar lavage inflammatory cells in asthmatic patients treated with high dose inhaled beclomethasone dipropionate. The European respiratory journal 1993; 6(4): 489-97.
255. Kelly EA, Busse WW, Jarjour NN. Inhaled budesonide decreases airway inflammatory response to allergen. American journal of respiratory and critical care medicine 2000; 162(3 Pt 1): 883-90.
256. Walford HH, Lund SJ, Baum RE, et al. Increased ILC2s in the eosinophilic nasal polyp endotype are associated with corticosteroid responsiveness. Clinical immunology (Orlando, Fla) 2014; 155(1): 126-35.
257. Dijkstra D, Hennig C, Hansen G, Biller H, Krug N, Hohlfeld JM. Identification and quantification of basophils in the airways of asthmatics following segmental allergen challenge. Cytometry Part A : the journal of the International Society for Analytical Cytology 2014; 85(7): 580-7.
258. Nagakumar P, Denney L, Fleming L, Bush A, Lloyd CM, Saglani S. Type 2 innate lymphoid cells in induced sputum from children with severe asthma. The Journal of allergy and clinical immunology 2016; 137(2): 624-6.e6.
259. Brightling CE, Symon FA, Birring SS, Bradding P, Pavord ID, Wardlaw AJ. TH2 cytokine expression in bronchoalveolar lavage fluid T lymphocytes and bronchial submucosa is a feature of asthma and eosinophilic bronchitis. The Journal of allergy and clinical immunology 2002; 110(6): 899-905.
260. Cosmi L, Annunziato F, Galli MIG, Maggi RME, Nagata K, Romagnani S. CRTH2 is the most reliable marker for the detection of circulating human type 2 Th and type 2 T cytotoxic cells in health and disease. European journal of immunology 2000; 30(10): 2972-9.
261. Hilvering B, Hinks TSC, Stoger L, et al. Synergistic activation of pro-inflammatory type-2 CD8(+) T lymphocytes by lipid mediators in severe eosinophilic asthma. Mucosal immunology 2018.
262. Mann A, Ghebre MA, Poll CT, Efthimiou J. Predictors of Human Rhinovirus (HRV) Induced Asthma Disease: Clinical, Cellular and Biomarker Predictors at Baseline and Change Post Infection in the Human Challenge Model. D54 INTERPLAY OF DIVERSE CELLULAR AND MOLECULAR PATHWAYS IN ASTHMA AND AIRWAY DISEASE; 2018. p. A7170-A.
References
229/233
263. Nadif R, Siroux V, Boudier A, et al. Blood granulocyte patterns as predictors of asthma phenotypes in adults from the EGEA study. The European respiratory journal 2016; 48(4): 1040-51.
264. Jabbal S, Lipworth BJ. Blood eosinophils: The forgotten man of inhaled steroid dose titration. Clinical and experimental allergy : journal of the British Society for Allergy and Clinical Immunology 2018; 48(1): 93-5.
265. Brehm JM, Acosta-Perez E, Klei L, et al. Vitamin D insufficiency and severe asthma exacerbations in Puerto Rican children. American journal of respiratory and critical care medicine 2012; 186(2): 140-6.
266. Confino-Cohen R, Brufman I, Goldberg A, Feldman BS. Vitamin D, asthma prevalence and asthma exacerbations: a large adult population-based study. Allergy 2014; 69(12): 1673-80.
267. Martineau AR, Cates CJ, Urashima M, et al. Vitamin D for the management of asthma. The Cochrane database of systematic reviews 2016; 9: Cd011511.
268. Sumino K, Sugar EA, Irvin CG, et al. Variability of methacholine bronchoprovocation and the effect of inhaled corticosteroids in mild asthma. Annals of allergy, asthma & immunology : official publication of the American College of Allergy, Asthma, & Immunology 2014; 112(4): 354-60.e1.
269. van Grunsven PM, van Schayck CP, Molema J, Akkermans RP, van Weel C. Effect of inhaled corticosteroids on bronchial responsiveness in patients with "corticosteroid naive" mild asthma: a meta-analysis. Thorax 1999; 54(4): 316-22.
270. Enright PL, Beck KC, Sherrill DL. Repeatability of spirometry in 18,000 adult patients. American journal of respiratory and critical care medicine 2004; 169(2): 235-8.
271. Adams N, Bestall J, Jones PW. Budesonide for chronic asthma in children and adults. The Cochrane database of systematic reviews 2001; (4): Cd003274.
272. Adams N, Bestall J, Jones PW. Budesonide at different doses for chronic asthma. The Cochrane database of systematic reviews 2001; (4): Cd003271.
273. Chauhan BF, Jeyaraman MM, Singh Mann A, et al. Addition of anti-leukotriene agents to inhaled corticosteroids for adults and adolescents with persistent asthma. The Cochrane database of systematic reviews 2017; 3: Cd010347.
274. Normansell R, Walker S, Milan SJ, Walters EH, Nair P. Omalizumab for asthma in adults and children. The Cochrane database of systematic reviews 2014; (1): Cd003559.
275. Chauhan BF, Ducharme FM. Anti-leukotriene agents compared to inhaled corticosteroids in the management of recurrent and/or chronic asthma in adults and children. The Cochrane database of systematic reviews 2012; (5): Cd002314.
276. Reddel HK, Taylor DR, Bateman ED, et al. An official American Thoracic Society/European Respiratory Society statement: asthma control and exacerbations: standardizing endpoints for clinical asthma trials and clinical practice. American journal of respiratory and critical care medicine 2009; 180(1): 59-99.
277. Bousquet J, Mantzouranis E, Cruz AA, et al. Uniform definition of asthma severity, control, and exacerbations: document presented for the World Health Organization
References
230/233
Consultation on Severe Asthma. The Journal of allergy and clinical immunology 2010; 126(5): 926-38.
278. Efthimiou J, Mann A, Balaratnam G, et al. Airway Inflammation and Clinical Manifestations in Patients with Mild Asthma: Time Course of Human Rhinovirus (HRV) Induced Changes. A38 DIAGNOSTIC MARKERS OF ASTHMA AND COPD; 2016. p. A1429-A.
279. Sleight P. Debate: Subgroup analyses in clinical trials: fun to look at - but don't believe them! Current controlled trials in cardiovascular medicine 2000; 1(1): 25-7.
280. Moon TC, Campos-Alberto E, Yoshimura T, et al. Expression of DP2 (CRTh2), a prostaglandin D(2) receptor, in human mast cells. PloS one 2014; 9(9): e108595.
281. Bartemes KR, Iijima K, Kobayashi T, Kephart GM, McKenzie AN, Kita H. IL-33-responsive lineage- CD25+ CD44(hi) lymphoid cells mediate innate type 2 immunity and allergic inflammation in the lungs. Journal of immunology (Baltimore, Md : 1950) 2012; 188(3): 1503-13.
282. Halim TY, Krauss RH, Sun AC, Takei F. Lung natural helper cells are a critical source of Th2 cell-type cytokines in protease allergen-induced airway inflammation. Immunity 2012; 36(3): 451-63.
283. Cavagnero K, Doherty TA. Cytokine and Lipid Mediator Regulation of Group 2 Innate Lymphoid Cells (ILC2s) in Human Allergic Airway Disease. Journal of cytokine biology 2017; 2(2).
284. Flood-Page PT, Menzies-Gow AN, Kay AB, Robinson DS. Eosinophil's role remains uncertain as anti-interleukin-5 only partially depletes numbers in asthmatic airway. American journal of respiratory and critical care medicine 2003; 167(2): 199-204.
285. Laviolette M, Gossage DL, Gauvreau G, et al. Effects of benralizumab on airway eosinophils in asthmatic patients with sputum eosinophilia. The Journal of allergy and clinical immunology 2013; 132(5): 1086-96.e5.
286. Klein Wolterink RG, Kleinjan A, van Nimwegen M, et al. Pulmonary innate lymphoid cells are major producers of IL-5 and IL-13 in murine models of allergic asthma. European journal of immunology 2012; 42(5): 1106-16.
287. Noval Rivas M, Burton OT, Oettgen HC, Chatila T. IL-4 production by group 2 innate lymphoid cells promotes food allergy by blocking regulatory T-cell function. The Journal of allergy and clinical immunology 2016; 138(3): 801-11.e9.
288. Ying S, Humbert M, Barkans J, et al. Expression of IL-4 and IL-5 mRNA and protein product by CD4+ and CD8+ T cells, eosinophils, and mast cells in bronchial biopsies obtained from atopic and nonatopic (intrinsic) asthmatics. Journal of immunology (Baltimore, Md : 1950) 1997; 158(7): 3539-44.
289. Zheng W, Flavell RA. The transcription factor GATA-3 is necessary and sufficient for Th2 cytokine gene expression in CD4 T cells. Cell 1997; 89(4): 587-96.
290. LaPorte SL, Juo ZS, Vaclavikova J, et al. Molecular and structural basis of cytokine receptor pleiotropy in the interleukin-4/13 system. Cell 2008; 132(2): 259-72.
291. Maes T, Joos GF, Brusselle GG. Targeting interleukin-4 in asthma: lost in translation? American journal of respiratory cell and molecular biology 2012; 47(3): 261-70.
References
231/233
292. Corren J, Lemanske RF, Hanania NA, et al. Lebrikizumab treatment in adults with asthma. The New England journal of medicine 2011; 365(12): 1088-98.
293. Hanania NA, Korenblat P, Chapman KR, et al. Efficacy and safety of lebrikizumab in patients with uncontrolled asthma (LAVOLTA I and LAVOLTA II): replicate, phase 3, randomised, double-blind, placebo-controlled trials. The Lancet Respiratory medicine 2016; 4(10): 781-96.
294. Brightling CE, Chanez P, Leigh R, et al. Efficacy and safety of tralokinumab in patients with severe uncontrolled asthma: a randomised, double-blind, placebo-controlled, phase 2b trial. The Lancet Respiratory medicine 2015; 3(9): 692-701.
295. Moore WC, Meyers DA, Wenzel SE, et al. Identification of asthma phenotypes using cluster analysis in the Severe Asthma Research Program. American journal of respiratory and critical care medicine 2010; 181(4): 315-23.
296. Oldhoff JM, Darsow U, Werfel T, et al. Anti-IL-5 recombinant humanized monoclonal antibody (mepolizumab) for the treatment of atopic dermatitis. Allergy 2005; 60(5): 693-6.
297. Leckie MJ, ten Brinke A, Khan J, et al. Effects of an interleukin-5 blocking monoclonal antibody on eosinophils, airway hyper-responsiveness, and the late asthmatic response. Lancet (London, England) 2000; 356(9248): 2144-8.
298. Simpson EL, Bieber T, Guttman-Yassky E, et al. Two Phase 3 Trials of Dupilumab versus Placebo in Atopic Dermatitis. The New England journal of medicine 2016; 375(24): 2335-48.
299. Wenzel S, Wilbraham D, Fuller R, Getz EB, Longphre M. Effect of an interleukin-4 variant on late phase asthmatic response to allergen challenge in asthmatic patients: results of two phase 2a studies. Lancet (London, England) 2007; 370(9596): 1422-31.
300. Scheerens H, Arron JR, Zheng Y, et al. The effects of lebrikizumab in patients with mild asthma following whole lung allergen challenge. Clinical and experimental allergy : journal of the British Society for Allergy and Clinical Immunology 2014; 44(1): 38-46.
301. Lukacs NW, Berlin AA, Franz-Bacon K, et al. CRTH2 antagonism significantly ameliorates airway hyperreactivity and downregulates inflammation-induced genes in a mouse model of airway inflammation. American journal of physiology Lung cellular and molecular physiology 2008; 295(5): L767-79.
302. Koltsida O, Hausding M, Stavropoulos A, et al. IL-28A (IFN-lambda2) modulates lung DC function to promote Th1 immune skewing and suppress allergic airway disease. EMBO molecular medicine 2011; 3(6): 348-61.
303. Pritchard AL, Carroll ML, Burel JG, White OJ, Phipps S, Upham JW. Innate IFNs and plasmacytoid dendritic cells constrain Th2 cytokine responses to rhinovirus: a regulatory mechanism with relevance to asthma. Journal of immunology (Baltimore, Md : 1950) 2012; 188(12): 5898-905.
304. Kaiko GE, Loh Z, Spann K, et al. Toll-like receptor 7 gene deficiency and early-life Pneumovirus infection interact to predispose toward the development of asthma-like pathology in mice. The Journal of allergy and clinical immunology 2013; 131(5): 1331-9.e10.
References
232/233
305. Baraldo S, Contoli M, Bazzan E, et al. Deficient antiviral immune responses in childhood: distinct roles of atopy and asthma. The Journal of allergy and clinical immunology 2012; 130(6): 1307-14.
306. Huber JP, Ramos HJ, Gill MA, Farrar JD. Cutting edge: Type I IFN reverses human Th2 commitment and stability by suppressing GATA3. Journal of immunology (Baltimore, Md : 1950) 2010; 185(2): 813-7.
307. Devalia JL, Bayram H, Abdelaziz MM, Sapsford RJ, Davies RJ. Differences between cytokine release from bronchial epithelial cells of asthmatic patients and non-asthmatic subjects: effect of exposure to diesel exhaust particles. International archives of allergy and immunology 1999; 118(2-4): 437-9.
308. Lopez-Souza N, Favoreto S, Wong H, et al. In vitro susceptibility to rhinovirus infection is greater for bronchial than for nasal airway epithelial cells in human subjects. The Journal of allergy and clinical immunology 2009; 123(6): 1384-90.e2.
309. Bochkov YA, Hanson KM, Keles S, Brockman-Schneider RA, Jarjour NN, Gern JE. Rhinovirus-induced modulation of gene expression in bronchial epithelial cells from subjects with asthma. Mucosal immunology 2010; 3(1): 69-80.
310. Sykes A, Macintyre J, Edwards MR, et al. Rhinovirus-induced interferon production is not deficient in well controlled asthma. Thorax 2014; 69(3): 240-6.
311. Patel DA, You Y, Huang G, et al. Interferon response and respiratory virus control are preserved in bronchial epithelial cells in asthma. The Journal of allergy and clinical immunology 2014; 134(6): 1402-12.e7.
312. Cella M, Jarrossay D, Facchetti F, et al. Plasmacytoid monocytes migrate to inflamed lymph nodes and produce large amounts of type I interferon. Nature medicine 1999; 5(8): 919-23.
313. Spann KM, Baturcam E, Schagen J, et al. Viral and host factors determine innate immune responses in airway epithelial cells from children with wheeze and atopy. Thorax 2014; 69(10): 918-25.
314. Baturcam E, Snape N, Yeo TH, et al. Human Metapneumovirus Impairs Apoptosis of Nasal Epithelial Cells in Asthma via HSP70. Journal of innate immunity 2017; 9(1): 52-64.
315. Herbert C, Zeng QX, Shanmugasundaram R, Garthwaite L, Oliver BG, Kumar RK. Response of airway epithelial cells to double-stranded RNA in an allergic environment. Translational respiratory medicine 2014; 2(1): 11.
316. Kicic A, Stevens PT, Sutanto EN, et al. Impaired airway epithelial cell responses from children with asthma to rhinoviral infection. Clinical and experimental allergy : journal of the British Society for Allergy and Clinical Immunology 2016; 46(11): 1441-55.
317. Kolbeck R, Kozhich A, Koike M, et al. MEDI-563, a humanized anti-IL-5 receptor alpha mAb with enhanced antibody-dependent cell-mediated cytotoxicity function. The Journal of allergy and clinical immunology 2010; 125(6): 1344-53.e2.
318. Huang T, Hazen M, Shang Y, et al. Depletion of major pathogenic cells in asthma by targeting CRTh2. JCI insight 2016; 1(7): e86689.
References
233/233
319. Flood-Page P, Swenson C, Faiferman I, et al. A study to evaluate safety and efficacy of mepolizumab in patients with moderate persistent asthma. American journal of respiratory and critical care medicine 2007; 176(11): 1062-71.
320. Arbes SJ, Jr. Do all asthmatics with atopy have atopic asthma? The Journal of allergy and clinical immunology 2012; 130(5): 1202-4.
321. Sulaiman I, Greene G, MacHale E, et al. A randomised clinical trial of feedback on inhaler adherence and technique in patients with severe uncontrolled asthma. The European respiratory journal 2018; 51(1).
322. Bland JM, Altman DG. Correlation, regression, and repeated data. BMJ (Clinical research ed) 1994; 308(6933): 896.
323. Bland JM, Altman DG. Calculating correlation coefficients with repeated observations: Part 1--Correlation within subjects. BMJ (Clinical research ed) 1995; 310(6977): 446.
324. Bland JM, Altman DG. Calculating correlation coefficients with repeated observations: Part 2--Correlation between subjects. BMJ (Clinical research ed) 1995; 310(6980): 633.
325. Bakdash JZ, Marusich LR. Repeated Measures Correlation. Frontiers in psychology 2017; 8: 456.
326. McAlees JW, Baker T, Zhang X, Biagini Myers J, Butsch Kovacic M, Lewkowich IP. Associations Between Asthma Severity and Production of, or Responsiveness to, Th17-Associated Cytokines in Pediatric Asthmatics. A32 ASTHMA AND ALLERGY CLINICAL STUDIES; 2017: A1332-A.
327. Gordon ED, Simpson LJ, Rios CL, et al. Alternative splicing of interleukin-33 and type 2 inflammation in asthma. Proceedings of the National Academy of Sciences of the United States of America 2016; 113(31): 8765-70.
328. da Silva EZ, Jamur MC, Oliver C. Mast cell function: a new vision of an old cell. The journal of histochemistry and cytochemistry : official journal of the Histochemistry Society 2014; 62(10): 698-738.
Related Documents