The Promises and Pitfalls of Genoeconomics Daniel J. Benjamin, 1 David Cesarini, 2 Christopher F. Chabris, 3 Edward L. Glaeser, 4 and David I. Laibson 4 Age, Gene/Environment Susceptibility-Reykjavik Study Vilmundur Guðnason, 5 Tamara B. Harris, 6 Lenore J. Launer, 6 Shaun Purcell, 7 and Albert Vernon Smith 5 Swedish Twin Registry Magnus Johannesson 8 and Patrik K.E. Magnusson 9 Framingham Heart Study Jonathan P. Beauchamp 10 and Nicholas A. Christakis 11 Wisconsin Longitudinal Study Craig S. Atwood, 12 Benjamin Hebert, 13 Jeremy Freese, 14 Robert M. Hauser, 15 and Taissa S. Hauser 15 Swedish Large Schizophrenia Study Alexander Grankvist, 9 Christina M. Hultman, 9 and Paul Lichtenstein 9 Annu. Rev. Econ. 2012. 4:627–62 First published online as a Review in Advance on June 18, 2012 The Annual Review of Economics is online at economics.annualreviews.org This article’s doi: 10.1146/annurev-economics-080511-110939 Copyright © 2012 by Annual Reviews. All rights reserved JEL codes: A12, D03, Z00 1941-1383/12/0904-0627$20.00 Please see the Acknowledgments section for author affiliations. Keywords genetics, heritability, GWAS Abstract This article reviews existing research at the intersection of genetics and economics, presents some new findings that illustrate the state of genoeconomics research, and surveys the prospects of this emerging field. Twin studies suggest that economic outcomes and preferences, once corrected for measurement error, appear to be about as herita- ble as many medical conditions and personality traits. Consistent with this pattern, we present new evidence on the heritability of permanent income and wealth. Turning to genetic association stud- ies, we survey the main ways that the direct measurement of genetic variation across individuals is likely to contribute to economics, and we outline the challenges that have slowed progress in making these contributions. The most urgent problem facing researchers in this field is that most existing efforts to find associations between genetic variation and economic behavior are based on samples that are too small to ensure adequate statistical power. This has led to many false positives in the literature. We suggest a number of possible strategies to improve and remedy this problem: (a) pooling data sets, (b) using statistical techniques that exploit the greater information content of many genes considered jointly, and (c) focusing on economically rele- vant traits that are most proximate to known biological mechanisms. 627 Annu. Rev. Econ. 2012.4:627-662. Downloaded from www.annualreviews.org by Cornell University on 09/07/12. For personal use only.

Welcome message from author
This document is posted to help you gain knowledge. Please leave a comment to let me know what you think about it! Share it to your friends and learn new things together.
Transcript

The Promises and Pitfalls ofGenoeconomics�Daniel J. Benjamin,1 David Cesarini,2 Christopher F. Chabris,3
Edward L. Glaeser,4 and David I. Laibson4
Age, Gene/Environment Susceptibility-Reykjavik Study
VilmundurGuðnason,5Tamara B. Harris,6 Lenore J. Launer,6
Shaun Purcell,7 and Albert Vernon Smith5
Swedish Twin Registry
Magnus Johannesson8 and Patrik K.E. Magnusson9
Framingham Heart Study
Jonathan P. Beauchamp10 and Nicholas A. Christakis11
Wisconsin Longitudinal Study
Craig S. Atwood,12 Benjamin Hebert,13 Jeremy Freese,14
Robert M. Hauser,15 and Taissa S. Hauser15
Swedish Large Schizophrenia Study
Alexander Grankvist,9 Christina M. Hultman,9 andPaul Lichtenstein9
Annu. Rev. Econ. 2012. 4:627–62
First published online as a Review in Advance on
June 18, 2012
The Annual Review of Economics is online at
economics.annualreviews.org
This article’s doi:
10.1146/annurev-economics-080511-110939
Copyright © 2012 by Annual Reviews.
All rights reserved
JEL codes: A12, D03, Z00
1941-1383/12/0904-0627$20.00
�Please see the Acknowledgments section
for author affiliations.
Keywords
genetics, heritability, GWAS
Abstract
This article reviews existing research at the intersection of genetics
and economics, presents some new findings that illustrate the state of
genoeconomics research, and surveys the prospects of this emerging
field. Twin studies suggest that economic outcomes and preferences,
once corrected for measurement error, appear to be about as herita-
ble as many medical conditions and personality traits. Consistent
with this pattern, we present new evidence on the heritability of
permanent income and wealth. Turning to genetic association stud-
ies, we survey the main ways that the direct measurement of genetic
variation across individuals is likely to contribute to economics, and
we outline the challenges that have slowed progress in making these
contributions. The most urgent problem facing researchers in this
field is that most existing efforts to find associations between genetic
variation and economic behavior are based on samples that are too
small to ensure adequate statistical power. This has led to many false
positives in the literature. We suggest a number of possible strategies
to improve and remedy this problem: (a) pooling data sets, (b) using
statistical techniques that exploit the greater information content of
many genes considered jointly, and (c) focusing on economically rele-
vant traits that are most proximate to known biological mechanisms.
627
Ann
u. R
ev. E
con.
201
2.4:
627-
662.
Dow
nloa
ded
from
ww
w.a
nnua
lrev
iew
s.or
gby
Cor
nell
Uni
vers
ity o
n 09
/07/
12. F
or p
erso
nal u
se o
nly.

1. INTRODUCTION
With the sequencing of the human genome in 2001 (Lander et al. 2001, Venter et al. 2001),
and the rapid, ongoing development of new technologies for measuring and analyzing the
genome, the study of genetics has been transformed. Until recently, almost no information
was available about genetic variation across individuals. Now most common genetic
variation can be inexpensively measured.
These advances in genetics are in turn transforming medical research. Some diseases
have been linked to single genetic mutations in specific genes (e.g., Huntington’s disease
and Fragile X syndrome), which can be assayed to diagnose the disease, predict the age of
onset and/or severity, and better understand how treatment response varies as a function of
genetic characteristics. In the case of complex diseases or conditions, such as macular
degeneration and obesity, new methods are beginning to identify the ensembles of genes
that, along with environmental forces, account for individual differences. Unfortunately,
each genetic variant identified in these studies of complex traits typically explains only a
small amount of variation in the trait; therefore, the genetic risk factors identified so far are
insufficient for the purpose of accurate medical diagnosis. Instead, the main benefit comes
from the identification of new biological pathways and targets for therapeutic interven-
tion. In short, genetics research has identified “new biology” for many major diseases,
including diabetes, cancer, and schizophrenia.
Social scientists—including psychologists, anthropologists, political scientists, and, increas-
ingly, sociologists and economists—have begun to measure genetic variation and study how
it relates to individual behaviors and outcomes. Early work involved measuring just a few
candidate genes in small samples of laboratory participants. The costs of genotyping have
now fallen to the point at which comprehensive information on a person’s genetic constitu-
tion can be obtained at a moderate cost. Consequently, some large-scale social science sur-
veys, such as the Health and Retirement Study, are gathering such data, and others will
likely do so soon. With these new data sources, the scale of research at the intersection of
social science and genetics will surely explode.
The purpose of this article is to review research at the intersection of genetics and
economics, or genoeconomics (Benjamin et al. 2007); to present some new findings that
illustrate the current state of the field; and to survey the field’s prospects.
In Section 2, we begin by developing a simple conceptual framework that defines some
key terms and makes explicit some critical assumptions. In Section 3, we review the
economic research conducted in the tradition of classical behavior genetics—primarily
involving comparisons between identical and fraternal twins—that seeks to estimate heri-
tability for economic measures: the fraction of the variance that can be explained by
genetic factors. A remarkable implication from this work is that in modern Western
societies, for most outcomes in life, over half the resemblance of two biological siblings
reared in the same family stems from their genetic similarity. Another main implication is
that, despite arguably being more complex and “downstream” from biochemical variation
than psychological traits such as cognitive ability and personality that are the traditional
realm of behavior genetics, economic outcomes and preferences appear to be as heritable as
those traits, once adjustment is made for measurement error (Beauchamp et al. 2011a,b).
In Section 4, we present an overview of what we see as the four ways that the inter-
section of molecular genetics and economics promises ultimately to contribute to economics:
(a) identifying and measuring latent traits, (b) identifying biological mechanisms that
Candidate gene:
agenetic polymorphism
hypothesized to havea causal effect on some
trait (or disease); the
hypothesis is based
either on what isbelieved about the
biological function of
the gene where the
genetic polymorphismis located or on
previously reported
associations between
that geneticpolymorphism and a
related outcome
628 Benjamin et al.
Ann
u. R
ev. E
con.
201
2.4:
627-
662.
Dow
nloa
ded
from
ww
w.a
nnua
lrev
iew
s.or
gby
Cor
nell
Uni
vers
ity o
n 09
/07/
12. F
or p
erso
nal u
se o
nly.
influence economic behavior, (c) providing exogenous proxies for preferences and abilities
that may be used as control variables or—more problematically—as instrumental vari-
ables, and (d) predicting the differential effects of policies across individuals with different
genetic constitutions. We review the small, but growing body of work that reports associ-
ations between specific genes and economic traits. We end the section by outlining the main
challenges obstructing progress in genoeconomics and discuss different ways of confronting
these challenges.
In Section 5, we illustrate some of these themes with examples from our own work.
Using an Icelandic sample, the Age, Gene/Environment Susceptibility-Reykjavik Study
(AGES-RS), we searched for associations between a set of outcomes of interest to econ-
omists and a set of candidate genes previously associated with cognitive functions or
known to be involved in the brain’s decision-making circuitry. We found a promising
association between a particular genetic variant and educational attainment. The associ-
ation was biologically plausible, associated with cognitive function, and replicated in a
nonoverlapping sample from the same respondent population. The association then
failed to replicate in three other samples. We further illustrate the widespread non-
replicability of candidate gene associations by reviewing a systematic study we con-
ducted of previously published associations between cognitive ability and 12 candidate
genes. Across three new, large samples, we are unable to replicate these associations. We
close Section 5 by proposing a number of strategies for surmounting the challenges that
face genoeconomic research. If the genoeconomics enterprise is to bear fruit, it is impor-
tant that social scientists recognize the many methodological lessons that have been
learned in medical genetics over the past decade regarding the frequency of false positives
in genetic associations.
This review extends the analysis of Benjamin et al. (2007) and Beauchamp et al.
(2011b). Benjamin et al. (2007) provide an initial definition of genoeconomics and survey
the potential contributions of genetic studies in economics at a time when no such studies
had yet been performed. Beauchamp et al. (2011b) report results from a large-scale genetic
association study of educational attainment, which failed to identify any replicable associ-
ations. Using those results as a case study, Beauchamp et al. (2011b) reach similar con-
clusions as those presented here regarding the inferential challenges in genoeconomic
research. Although here we primarily review published research at the intersection of
genetics and economics and offer our perspective on the emerging field, we also present
several new findings. Supplemental Appendix 1 provides details regarding our new behav-
ior genetic results (in Section 3), which use Swedish Twin Registry data to estimate the
heritabilities of permanent income and wealth. Supplemental Appendix 2 provides details
regarding our molecular genetic analysis (in Section 5) from the Icelandic sample (follow
the Supplemental Material link from the Annual Reviews home page at http://www.
annualreviews.org).
2. CONCEPTUAL FRAMEWORK
We adopt a conceptual framework that serves three purposes: It defines genetics terms that
we use throughout the article, it makes explicit the assumptions typically made in empirical
work, and it helps clarify the link between behavior genetics and molecular genetics. We
omit many biological nuances to focus on the concepts that are critical to understanding
the field.
www.annualreviews.org � The Promises and Pitfalls of Genoeconomics 629
Supplemental Material
Ann
u. R
ev. E
con.
201
2.4:
627-
662.
Dow
nloa
ded
from
ww
w.a
nnua
lrev
iew
s.or
gby
Cor
nell
Uni
vers
ity o
n 09
/07/
12. F
or p
erso
nal u
se o
nly.

Human DNA is composed of a sequence of approximately 3 billion pairs of nucleotide
molecules, each of which can be indexed by its location in the sequence.1 This long
sequence—the human genome—has subsequences called genes. Humans are believed to
have 20,000–25,000 genes. Each gene provides the instructions that are used for building
proteins. These proteins affect the structure and function of all cells in the body.
At the overwhelming majority of locations, there is virtually no variation in the nucle-
otides across individuals. The segments of DNA in which individuals do differ are called
genetic polymorphisms (from the Greek poly, meaning “many,” and morphisms, meaning
“forms”). For simplicity, our discussion here focuses on the most common kind of genetic
polymorphism, called a single-nucleotide polymorphism (SNP). SNPs are locations in the
DNA sequence in which individuals differ from each other in terms of a single nucleotide.
A single gene may contain hundreds of SNPs, and SNPs are also found in DNA regions that
are not part of genes. We index SNPs by j, and we let J denote the total number of SNPs in
the genome [currently it is believed that J � 52 million (see the build statistics for Homo
sapiens in Natl. Cent. Biotechnol. Inf. 2012)]. Conceptually, we can think of other kinds of
genetic polymorphisms in the same way as SNPs, so focusing on SNPs is not misleading
given our purposes.2
At the vast majority of SNP locations, there are only two possible nucleotides that
occur. The nucleotide of a SNP that is more common in a population is called the major
allele, and the nucleotide that is less common is called the minor allele. At conception, each
individual inherits half of her DNA from her mother and half from her father. For a given
SNP, one allele is transmitted from each parent. The gene, and hence the protein it pro-
duces, is affected by the genetic material received from both parents, but it does not matter
which material came from which parent. Therefore, for each SNP, there are three possibil-
ities: An individual has zero minor alleles, one minor allele, or two minor alleles. This
number is called the individual’s genotype, and for individual i for SNP j, we denote its
value by xij.
Fix some outcome of interest, e.g., educational attainment, income, risk preferences, or
body mass index. Let yi denote the value of this outcome for individual i. The simplest
model of genetic effects posits that yi is determined according to
yi ¼ mþXJ
j¼1
bjxij þ Ei, ð1Þ
where m is the mean value of yi in the population; bj is the effect of SNP j; and Ei is the effectof exogenous residual factors. Equation 1 embeds a variety of assumptions. For example,
the restriction that the genotype’s effect is linear in the number of minor alleles is a sim-
plifying assumption that can be, and often is, relaxed. Below we discuss some other impor-
tant extensions of Equation 1.
bj should be understood as the treatment effect from an experiment in which one SNP
(and nothing else in Equation 1) is changed at conception. Although such experiments
are conducted on nonhumans, in humans this treatment effect is a hypothetical construct.
1The human genome is divided into 23 chromosomes. Each cell (aside from egg and sperm cells) includes two copies
of each chromosome, one inherited from the mother and one from the father (except in the case of the Y chromo-
some, which is inherited by males only and comes entirely from the father).
2Other kinds of genetic polymorphisms include insertions or deletions from the DNA sequence and variable numbers
of repetitions of a series of nucleotides.
Gene: a sequence
of nucleotides in
DNA that providesinstructions for
building a particular
protein or proteins
Genetic
polymorphism:
a segment of DNAthat differs between
individuals
Single-nucleotide
polymorphism (SNP):
a single nucleotidelocation in the DNA
that varies between
individuals
Major allele: the
nucleotide of a SNPthat is more common
in the population;
for non-SNP genetic
polymorphisms withtwo alleles, the major
allele is the term for
the more common
variant in thepopulation
Minor allele: the
nucleotide of a SNP
that is less common
in the population;for non-SNP genetic
polymorphisms with
two alleles, the minor
allele is the term forthe less common
variant in the
population
Genotype: for a given
SNP, an individual’snumber of minor
alleles
630 Benjamin et al.
Ann
u. R
ev. E
con.
201
2.4:
627-
662.
Dow
nloa
ded
from
ww
w.a
nnua
lrev
iew
s.or
gby
Cor
nell
Uni
vers
ity o
n 09
/07/
12. F
or p
erso
nal u
se o
nly.
If bj 6¼ 0 for some j, then SNP j is a called a causal SNP. As an example, it is now believed
that there is a causal SNP in a gene called FTO on body weight (Frayling et al. 2007).3 There
are many ways in which FTO could affect body weight, e.g., by coding for a protein involved
in metabolism or by affecting food preferences. Identifying the correct mechanism(s) is an
active area of research.
The residual term, Ei, is often called the environmental effect, but this terminology is
imprecise and potentially misleading. Because the genotypic effects may operate through
environmental channels, Ei should be interpreted as the component of environmental fac-
tors that are not endogenous to genetic endowment (Jencks 1980). For example, if the
mechanism through which the FTO SNP affects body weight is a preference for energy-rich
foods that leads to increased caloric intake (as suggested in Cecil et al. 2008), then the
component of caloric intake that is genetically induced is not part of Ei.Two important assumptions implicit in Equation 1 are quite strong and are therefore
relaxed in richer models. First, the genotypes, xij and xij0, for two different SNPs, j and j0,may interact in affecting the outcome. Second, a genotype xij may interact with factors in Eiin affecting the outcome. It is often claimed that such gene-gene interaction and gene-
environment interaction effects matter for many outcomes. Indeed, because the treatment
effect of a genotype is not a structural parameter, it will vary with some environmental
conditions. For example, Rosenquist et al. (2012) report that the effect of the FTO SNP
depends strongly on birth cohort.
Most of this article is concerned with potential contributions that the field of genetics
could make to the field of economics. We note here, however, a potential contribution that
economics could make to genetics. The modeling tradition in economics could help move
beyond the crude statistical framework outlined here toward more structural models. For
example, a structural model of FTO might allow it to affect the marginal utilities of
different foods, and possibly also the (production) function that maps caloric intake to
body weight. Such a model would make predictions regarding how the treatment effect of
the SNP would vary as a function of the prices and income of an individual, and it might
predict compensatory behaviors, such as more exercise to try to reduce elevated body weight.
The estimated model could be used to make predictions about the effects of changes in the
economic environment. More generally, insights from economics about how environments
can amplify or dampen genetic effects (e.g., depending on the degree of substitutability or
complementarity) may help geneticists more accurately model, identify, and understand
genetic mechanisms.
3. BEHAVIOR GENETICS AND ECONOMICS
Behavior genetics is a field of research concerned with understanding how genetic endowments
taken as a whole explain individual-level differences in outcomes. In terms of Equation 1,
individual i’s genetic endowment is defined as gi �PJj¼1
bjxij. The field of behavior genetics
predates the availability of genotypic data, and its methods treat genetic endowments
as latent variables whose effects are inferred indirectly by contrasting the similarity in
3In a study of nearly 40,000 Caucasians, Frayling et al. (2007) find that individuals with two minor alleles of a
particular SNP weigh 3 kg more than individuals with two major alleles. This SNP may or may not be causal, as
other unmeasured, correlated SNPs in or near FTO could be the causal SNPs.
www.annualreviews.org � The Promises and Pitfalls of Genoeconomics 631
Ann
u. R
ev. E
con.
201
2.4:
627-
662.
Dow
nloa
ded
from
ww
w.a
nnua
lrev
iew
s.or
gby
Cor
nell
Uni
vers
ity o
n 09
/07/
12. F
or p
erso
nal u
se o
nly.

outcomes of different pairs of relatives. Much research in behavior genetics focuses on
estimating heritability, defined for a given outcome as the ratio of the population variance
in genetic endowment to the population variance in the outcome,VarðgiÞ
VarðyiÞ.4 If genetic
endowment gi is independent of residual factors Ei, then heritability can be equivalently
expressed as the population R2 for the regression in Equation 1.
Over the years, there have been a number of misguided attempts to draw policy conclu-
sions from heritability estimates. Goldberger (1979) clarifies the key issues by pointing out
that high heritability of an outcome does not imply that policy is impotent in affecting the
outcome (see Manski 2011 for a more recent discussion of these issues). High heritability
means that existing, naturally occurring variation in Ei does not explain much of the varia-
tion in yi. It does not rule out the possibility that a policy could cause a large change in the
outcome. In Goldberger’s (1979) famous example, even if the heritability of eyesight were
100%, prescribing eyeglasses would still be a policy that passes the cost-benefit test. Con-
versely, the fact that an outcome has low heritability does not imply that it is especially
susceptible to influence by policy.
Despite these important interpretational caveats, we believe there are several reasons
why economists may be interested in knowing the heritability of economic outcomes.5
First, heritabilities of income, educational attainment, etc., are descriptive facts that con-
strain the set of theories regarding heterogeneity in preferences and abilities that can be
considered plausible. For example, high heritability estimates are challenging for “blank-
slate theories” of human nature, which have featured prominently in much social science
work (Pinker 2002).
Second, the pervasive finding of nonnegligible heritabilities for economic outcomes con-
firms the common concern that unobserved genetic endowments may confound attempts
to estimate the effect of environmental variables on outcomes of interest, e.g., the effect of
parental income on children’s outcomes. In the language of econometrics, parental geno-
types are omitted variables that correlate with the child’s genotype (which influence the
child’s behavior) as well as influence the child’s environmental exposures (through the
pathway of parental behavior).
Finally, because heritability can be interpreted as the population R2 for the regression in
Equation 1, it quantifies the degree to which an individual i’s outcome could be predicted if
the bj’s were known and the xij’s were observed (Visscher et al. 2008). This will become an
increasingly relevant upper bound as DNA information becomes more widely available
and better estimates of bj’s become possible. More immediately, a more heritable outcome
may be a better target for efforts to discover particular SNPs that affect it because, all else
equal, a more heritable outcome is likely to have more SNPs of larger effect.
The most common method for estimating heritability is the twin study. Twin studies
exploit the fact that there are two types of twins: monozygotic (MZ) twins, who are
4If Equation 1 is generalized to allow for a nonlinear effect of genotype and /or gene-gene interactions, then it becomes
necessary to distinguish narrow-sense heritability (essentially the R2 from the most predictive linear combination of
the genotypes) from broad-sense heritability (the R2 of the genetic effects from the population regression, which
includes their nonlinear effects). In the simple framework of Equation 1, these two concepts coincide.
5In plant and animal breeding, heritability is a key quantity because it measures the effect a breeder can have on the
mean outcome in the next generation by selecting which animals to breed. In humans, using heritability to predict the
next generation’s outcomes based on the current generation’s outcomes is far more tenuous because the reduced-form
relationships described in Equation 1 are likely to have changed from one generation to the next.
632 Benjamin et al.
Ann
u. R
ev. E
con.
201
2.4:
627-
662.
Dow
nloa
ded
from
ww
w.a
nnua
lrev
iew
s.or
gby
Cor
nell
Uni
vers
ity o
n 09
/07/
12. F
or p
erso
nal u
se o
nly.
essentially identical genetically,6 and dizygotic (DZ) twins, whose genetic endowments are
as correlated as those of ordinary siblings. The markedly higher resemblance that is often
observed for MZ twins when compared to DZ twins on an outcome is therefore often
interpreted as evidence that genetic endowment explains some of the variation in the trait.
Under some strong assumptions, data on the outcome for MZ and DZ twin pairs can be
used to obtain a quantitative estimate of heritability. In terms of the conceptual framework
described above, begin by assuming that an individual’s genetic endowment gi is indepen-
dent of residual factors Ei. Because the two members of an MZ twin pair, m and m0, havevirtually identical genetic endowments, the covariance of their outcomes is given by
Cov ym, ym0ð Þ ¼ Var gmð Þ þ Cov Em, Em0ð Þ. ð2ÞDenoting the two members of a DZ twin pair by d and d 0, the covariance of their out-
comes is given by
Cov(yd, yd 0 ) ¼ 1
2Var(gd)þ Cov(Ed, Ed 0 ). ð3Þ
The claim that Cov(gd, gd 0 ) equals1
2Var(gd) is not an immediate consequence of the fact
that DZ twins share half their DNA on average (see Falconer & Mackay 1996, chapter 9,
for the proof of the claim). The argument relies on the restriction in Equation 1 that
the genotypes affect the outcome linearly and additively, and it requires the additional
assumption that parents mate randomly (i.e., assortative mating on genetic endowments
is ruled out).
If the distribution of genetic endowments and residual factors is the same both among
MZ twins and among DZ twins as among the general population, then all three groups
have the same population variance of genetic endowments, Var(gm) ¼ Var(gd) ¼ Var(gi), as
well as the same population variance of outcomes, Var(ym) ¼ Var(yd) ¼ Var(yi).
The final key assumption is that
Cov Em, Em0ð Þ ¼ Cov Ed, Ed 0ð Þ � CovE. ð4ÞFollowing Jencks (1980), this is how we interpret what is informally called the equal-
environment assumption. It requires that the residual factors covary equally for MZ twins
as for DZ twins. Of the several strong assumptions in twin studies, this one has generated
the most controversy, in part because it is rarely defined precisely, and it is easy to misin-
terpret. Clearly, MZ twins experience a more similar environment than DZ twins do: For
example, they are more similar in college completion and career interests, and because they
look the same, they may evoke more similar reactions from others. The terminology
“equal-environment assumption” misleadingly suggests that this greater similarity of MZ
twins’ environments violates the assumption in Equation 4. However, to the extent that
this similarity in environment is caused by the similarity in genetic endowment, it is not
a violation. Instead, the assumption in Equation 4 would be violated if, e.g., social inter-
actions with an MZ twin generate higher covariance in residual shocks. For example,
because he is genetically identical, an MZ twin may learn more about his own preferences
6Even MZ twins are not 100% genetically identical because of mutations. Moreover, there are ways in which even
individuals who have identical genomes at conception biochemically diverge over time. For example, the genome
develops a set of external instructions—the epigenome—that regulates protein production. As a result of heteroge-
neous environmental exposures, identical twins will have different epigenomes.
www.annualreviews.org � The Promises and Pitfalls of Genoeconomics 633
Ann
u. R
ev. E
con.
201
2.4:
627-
662.
Dow
nloa
ded
from
ww
w.a
nnua
lrev
iew
s.or
gby
Cor
nell
Uni
vers
ity o
n 09
/07/
12. F
or p
erso
nal u
se o
nly.
from his cotwin’s experiences than a DZ twin does. Stenberg (2011) discusses the concep-
tual issues in interpreting the equal-environment assumption and surveys some attempts to
interrogate it empirically.
Now, dividing through Equations 2 and 3 by the respective population variances,
we obtain
Cov ym, ym0ð ÞVar ymð Þ ¼ Var gmð Þ
Var ymð Þ þCov Em, Em0ð ÞVar ymð Þ , ð5Þ
Cov yd, yd 0ð ÞVar ydð Þ ¼ 1
2
Var gdð ÞVar ydð Þ þ
Cov Ed, Ed 0ð ÞVar ydð Þ . ð6Þ
BecauseCovðym, ym0 ÞVarðymÞ
andCovðyd, yd 0 ÞVarðydÞ
, the correlation in outcomes across MZ pairs and
DZ pairs, can be estimated from a sample of twins, Equations 2 and 3 define two moment
conditions that jointly identify heritability. Although more sophisticated estimation
methods are available, the simplest heritability estimator is just to “double the difference”
between the correlations,
Var(gi)
Var(yi)¼ 2
Cov(ym, ym0 )
Var(ym)� Cov(yd, yd 0 )
Var(yd)
� �. ð7Þ
Additional moments can be computed from data sets with more sibling types, thereby
allowing the identification of more realistic models that relax the equal-environment
assumption, the assumption that the effects of genotypes are purely additive, that mating
is random, and that genetic endowments do not interact with the environment.7 For an
illustration of some of these ideas in the context of income heritability, we refer readers to
Bjorklund et al. (2005).
The moment conditions in Equations 5 and 6 also identifyCovE
VarðyiÞ, which is typically
called the common environmental component. This is the proportion of population vari-
ance in the outcome explained by residual factors shared among twins. It is often inter-
preted as the proportion of population variance in the outcome explained by residual
factors shared among siblings in general, an interpretation that requires the additional
assumption that CovE is also the covariance in residual factors among nontwin siblings.
Although viewed by geneticists as a by-product of the twin method of estimating heritabil-
ity, this common environmental component is of interest to economists: It is a descriptive
statistic measuring how much existing variation in family-rearing environments accounts
for variation in outcomes.
A simple example helps build some intuition for why this variance partitioning will
often imply nonnegligible heritabilities for outcomes such as income that are many steps
removed in the chain of causation from genes and protein production (Jencks 1980).
Consider a large sample of identical twins who are separated at birth and then randomly
assigned to families. Under these conditions, and if nongenetic shared experiences in the
7If Equation 7 is used as the estimator, then positive assortative mating on genetic endowments will generate a down-
ward bias in the estimate of heritability because such mating increases the covariance of the genetic endowments of
DZ twins. By the same token, the presence of nonlinear or nonadditive effects of the genotypes on the outcome will
cause an upward bias in the estimate of heritability because these effects decrease the covariance.
d d d
634 Benjamin et al.
Ann
u. R
ev. E
con.
201
2.4:
627-
662.
Dow
nloa
ded
from
ww
w.a
nnua
lrev
iew
s.or
gby
Cor
nell
Uni
vers
ity o
n 09
/07/
12. F
or p
erso
nal u
se o
nly.
uterine environment are not a source of greater MZ similarity, then any resemblance
between the two twins must ultimately result from similarity in genetic endowment. In this
case, Cov(Em, Em0 ) ¼ 0, so heritability could be estimated merely by computing the corre-
lation in outcomes. This example illustrates that heritability estimates capture not only
“direct” genetic effects, but also “indirect” effects that operate through environmental
exposures that are endogenous to genetic endowments. For example, a genotype may be a
source of selection into environments that in turn affect outcomes; e.g., genetic variation in
cognitive ability may be mediated by self-initiated exposure to books (Lee 2010), which is
ultimately caused by genetic influences on preferences. As another example, an individual’s
genotype may evoke environmental responses, such as parental investments (Becker &
Tomes 1976, Becker 1993, Lizzeri & Siniscalchi 2008).
Taubman (1976) introduced twin studies into economics. In a sample of approximately
2,500 white male twins who were all army veterans, he estimated the heritability of income
to be between 18% and 41%. The basic finding that income is moderately heritable has
now been repeatedly replicated in a variety of samples, including nontwin samples (Rowe
et al. 1999, Bjorklund et al. 2005). Sacerdote (2010) provides a recent review of behavior
genetic work in economics, including research on adoptees.
A string of recent papers has shown that measures of economic preferences, usually
elicited from either incentivized experiments or surveys, have heritabilities in the 20%–
30% range (Wallace et al. 2007; Cesarini et al. 2008, 2009, 2010, 2012; Barnea et al.
2010), although two papers report a considerably higher estimate (Zhong et al. 2009a,
Zyphur et al. 2009). Differences in common environment explain little of the variation in
these outcomes.
These estimates of heritability (and also those of common environment effects) are
likely biased toward zero, however, because of measurement error. Evidence for this view
comes from Beauchamp et al. (2011a), who analyze a data set of responses from over
11,000 twins to a battery of survey questions on risk attitudes. A subset of the respondents
answered the survey twice. Beauchamp et al. (2011a) find that after adjustment for mea-
surement error (assessed through the subset of repeat respondents), heritability for various
survey-based measures of risk taking is estimated to lie in the neighborhood of 40%–50%,
quite similar to the consensus estimates for personality and intelligence (Jang et al. 1996,
Bouchard & McGue 2003). Just as the original estimates of parent-child correlations in
income (Becker & Tomes 1986) were later shown to be greatly attenuated by measurement
error (Solon 1992, Zimmerman 1992, Mazumder 2005), so it would appear that twin-
based estimates of heritability that fail to adjust for measurement error are quite severely
downward biased.
3.1. Heritability of Permanent Income
We now turn to an illustration of the use of twin-study methods by reporting some new
estimates of two variables that are of central interest in economics: permanent income and
net wealth. Past work has tended to focus on the heritability of current income, but for the
purpose of describing inequality in the standard of living, economists are typically more
interested in consumption, or permanent income, than in transitory income. Largely because
of data limitations, existing studies have focused on the heritability of income measured
during a single year (Taubman 1976) or up to three years (Bjorklund et al. 2005). Here we
present heritability estimates of income averaged up to 20 years. For expositional convenience,
www.annualreviews.org � The Promises and Pitfalls of Genoeconomics 635
Ann
u. R
ev. E
con.
201
2.4:
627-
662.
Dow
nloa
ded
from
ww
w.a
nnua
lrev
iew
s.or
gby
Cor
nell
Uni
vers
ity o
n 09
/07/
12. F
or p
erso
nal u
se o
nly.
we relegate a detailed variable and sample description to Supplemental Appendix 1 and
only sketch the details here.
We use a Swedish sample of twins from the Screening Across the Lifespan Twin (SALT)
study, augmented with a small number of individuals who answered a survey administered
by the registry in 1973 (Q73). The SALT sample is described in Lichtenstein et al. (2002)
and is composed of twins born between 1926 and 1958. We use panel data on income from
1968 to 2005, drawn from administrative records. We restrict attention to individuals for
whom we have complete income data for the 20-year period and whose average yearly
income exceeded SEK 1,000 (approximately USD 150).8 Such individuals constitute 94%
of the original sample (for further information about the sample and summary statistics,
see Supplemental Appendix 1). We use the natural logarithm of income, and we residualize
on a second-order age polynomial to account for income differences across birth cohorts.
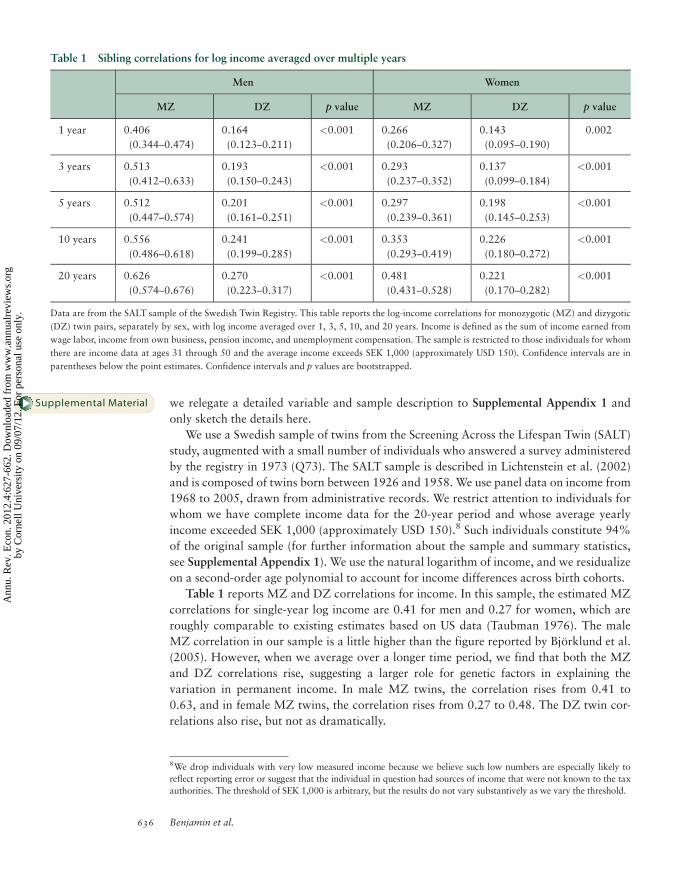
Table 1 reports MZ and DZ correlations for income. In this sample, the estimated MZ
correlations for single-year log income are 0.41 for men and 0.27 for women, which are
roughly comparable to existing estimates based on US data (Taubman 1976). The male
MZ correlation in our sample is a little higher than the figure reported by Bjorklund et al.
(2005). However, when we average over a longer time period, we find that both the MZ
and DZ correlations rise, suggesting a larger role for genetic factors in explaining the
variation in permanent income. In male MZ twins, the correlation rises from 0.41 to
0.63, and in female MZ twins, the correlation rises from 0.27 to 0.48. The DZ twin cor-
relations also rise, but not as dramatically.
8We drop individuals with very low measured income because we believe such low numbers are especially likely to
reflect reporting error or suggest that the individual in question had sources of income that were not known to the tax
authorities. The threshold of SEK 1,000 is arbitrary, but the results do not vary substantively as we vary the threshold.
Table 1 Sibling correlations for log income averaged over multiple years
Men Women
MZ DZ p value MZ DZ p value
1 year 0.406
(0.344–0.474)
0.164
(0.123–0.211)
<0.001 0.266
(0.206–0.327)
0.143
(0.095–0.190)
0.002
3 years 0.513
(0.412–0.633)
0.193
(0.150–0.243)
<0.001 0.293
(0.237–0.352)
0.137
(0.099–0.184)
<0.001
5 years 0.512
(0.447–0.574)
0.201
(0.161–0.251)
<0.001 0.297
(0.239–0.361)
0.198
(0.145–0.253)
<0.001
10 years 0.556
(0.486–0.618)
0.241
(0.199–0.285)
<0.001 0.353
(0.293–0.419)
0.226
(0.180–0.272)
<0.001
20 years 0.626
(0.574–0.676)
0.270
(0.223–0.317)
<0.001 0.481
(0.431–0.528)
0.221
(0.170–0.282)
<0.001
Data are from the SALT sample of the Swedish Twin Registry. This table reports the log-income correlations for monozygotic (MZ) and dizygotic
(DZ) twin pairs, separately by sex, with log income averaged over 1, 3, 5, 10, and 20 years. Income is defined as the sum of income earned from
wage labor, income from own business, pension income, and unemployment compensation. The sample is restricted to those individuals for whom
there are income data at ages 31 through 50 and the average income exceeds SEK 1,000 (approximately USD 150). Confidence intervals are in
parentheses below the point estimates. Confidence intervals and p values are bootstrapped.
636 Benjamin et al.
Supplemental Material
Ann
u. R
ev. E
con.
201
2.4:
627-
662.
Dow
nloa
ded
from
ww
w.a
nnua
lrev
iew
s.or
gby
Cor
nell
Uni
vers
ity o
n 09
/07/
12. F
or p
erso
nal u
se o
nly.
In these data, applying the simple double-the-difference estimator (Equation 7) typically
produces a negative estimate of the family environment.9 We therefore instead proceed by
imposing the restriction that the family environment component is zero and obtain a rough
estimate of heritability by taking the average of the MZ correlation and twice the DZ
correlation. This estimator suggests that heritability increases from 0.37 to 0.58 in men as
we move from single-year income to a 20-year average. The corresponding figures for
women are 0.28 and 0.46. These findings suggest that permanent income is more heritable
than single-year income. This conclusion partly seems to reflect the fact that measurement
error and transitory shocks generate a downward bias in estimates of heritability (Solon
1992, Zimmerman 1992, Mazumder 2005), consistent with our earlier conjecture that the
heritability estimates of many other economic outcomes are downward biased.
These patterns of correlations illustrate Turkheimer’s (2000) three “laws” of behavior
genetics, which are not theoretical necessities, but rather stylized facts that summarize the
broad pattern of empirical findings in several decades of behavior genetics studies. The first
law states that all behavioral outcomes are heritable. For comparison with our estimates of
around 0.50 for permanent income, the heritability of personality traits and cognitive
abilities is about 0.40 to 0.60 (Plomin et al. 1994), and the heritability of height is about
0.80 (e.g., Silventoinen et al. 2003). Indeed, although Turkheimer’s first law is stated
qualitatively, it could be made quantitative: Of the hundreds of outcomes analyzed to date,
almost all have heritabilities estimated between 0.20 and 0.80 (see Plomin et al. 2008 for a
review). The second law states that common family environment explains less variance
than genes do, and the third law states that a substantial part of the variance in the
outcome is left unexplained by the sum of genetic and common environment effects. Our
results are consistent with the second and third laws, as well.
3.2. Heritability of Wealth
To study wealth, we use data from the SALTY (Screening Across the Lifespan Twin Study:
Younger Cohort) survey, which was recently administered by the Swedish Twin Registry.
There are a total of 11,418 usable responses, but the wealth questions we study here were
only administered to approximately 40% of the survey respondents (for further informa-
tion and summary statistics, see Supplemental Appendix 1). Because this sample size is far
smaller, and because wealth data are generally noisier than income data, our results on
wealth are much less precise. Nonetheless, we report these results because, as far as we are
aware, this is the first estimate of the heritability of wealth.
We use responses to a series of questions in which survey respondents are asked to indi-
cate their assets in various categories, as well as their total debt. Because wealth results tend to
be very sensitive to a few outliers with extreme values, we apply two transformations to the
data. The first, which is frequently recommended for wealth data (see, e.g., Pence 2006), is the
hyperbolic sine transformation, sinh�1(x) ¼ ln xþffiffiffiffiffiffiffiffiffiffiffiffiffiffiffiffiffi(x2 þ 1)
p� �. This transformation is used
9Even if the assumptions underlying the variance decomposition (described above) hold exactly, a negative estimate
could occur in a particular sample because of sampling variation and in that case should be interpreted as essentially
an estimate of zero. In this case, because the number of twin pairs is rather large, a more likely explanation is that the
assumptions are violated. For example, a negative common environment–component estimate could be generated by
a failure of the assumption of purely additive genetic effects, which would depress the genetic covariance between
DZ twins, or by a failure of the equal-environment assumption. It is also possible that the measurement errors are
more highly correlated in MZ twins.
www.annualreviews.org � The Promises and Pitfalls of Genoeconomics 637
Ann
u. R
ev. E
con.
201
2.4:
627-
662.
Dow
nloa
ded
from
ww
w.a
nnua
lrev
iew
s.or
gby
Cor
nell
Uni
vers
ity o
n 09
/07/
12. F
or p
erso
nal u
se o
nly.

to reduce the influence of extreme observations while—unlike the log transformation commonly
used for other kinds of data—still allowing for negative values. As a robustness check, we also
report results with the variable transformed to have a normal distribution. Formally, we first
percentile-rank transform the net wealth variable and then take the inverse of the standard
normal distribution of the ranking. This ensures that the resulting variable is standard normal.
Table 2 reports MZ and DZ correlations for wealth. The sibling correlations in wealth
are quite low and are estimated with less precision than the income correlations because
only a subset of the SALTY respondents were asked about their assets and debt. Indeed, in
the analyses separately by sex, there is even an instance of the male DZ correlation being
higher than the MZ correlation, which we believe is likely to reflect sampling variation.
When we pool for males and females, however, we find that the correlations in MZ twins
are significantly higher than the DZ correlations, implying heritability levels that range
from about 0.20 to 0.40. Nonetheless, given the small sample and the imperfect measure-
ment, we interpret these findings cautiously.
4. MOLECULAR GENETICS AND ECONOMICS
Molecular genetics is the field of research that studies the structure and function of DNA.
Unlike behavior genetics, which draws indirect inferences regarding the effect of genetic
endowments as a whole, molecular genetics involves directly measuring the genotypes for
particular SNPs. Genoeconomics is an emerging field that incorporates such molecular
genetic data into economic research.
4.1. The Promises of Genoeconomics
In our view, genoeconomics will ultimately make significant contributions to economics.
We emphasize the word “ultimately” because—as is clear below in our discussion of the
pitfalls of genoeconomics—there are many challenges to be overcome before these contri-
butions can be realized. Nonetheless, it is the transformative promise of genoeconomics
that makes us believe that, despite the challenges, the enterprise is worth pursuing. We
anticipate that the eventual contributions will fall into four main categories.
Table 2 Sibling correlations for wealth
Men Women Pooled
MZ DZ p value MZ DZ p value MZ DZ p value
Hyperbolic
sine
0.088
(�0.015–
0.249)
0.162
(�0.007–
0.375)
0.692 0.446
(0.181–
0.573)
0.301
(0.079–
0.280)
0.019 0.282
(0.144–
0.434)
0.109
(0.013–
0.256)
0.054
Standard
normal
0.411
(0.277–
0.533)
0.378
(0.220–
0.524)
0.381 0.380
(0.309–
0.569)
0.072
(0.152–
0.460)
0.096 0.432
(0.331–
0.529)
0.336
(0.219–
0.440)
0.084
Data are from the first wave of the SALTY sample of the Swedish Twin Registry. Net wealth is defined as the difference between the total self-
reported value of assets and total self-reported debt. The asset classes considered are property (including summer house), stocks, bonds, transpor-
tation vehicles, and other. Respondents are asked to prorate in cases of joint ownership of an asset or joint debt. The exact question wording is in
Supplemental Appendix 1. Net wealth is transformed as described in the text. The results do not change appreciably if we remove outliers by
restricting the sample to individuals with an absolute net wealth lower than SEK 10,000,000 (approximately USD 1,500,000). Confidence intervals
are in parentheses below the point estimates. Confidence intervals and p values are bootstrapped.
638 Benjamin et al.
Ann
u. R
ev. E
con.
201
2.4:
627-
662.
Dow
nloa
ded
from
ww
w.a
nnua
lrev
iew
s.or
gby
Cor
nell
Uni
vers
ity o
n 09
/07/
12. F
or p
erso
nal u
se o
nly.
4.1.1. Direct measures of previously latent parameters. First, measuring genotypes will
advance empirical analysis by providing direct and exogenous measures of preferences and
abilities. For example, as discussed above, an individual’s FTO genotype may be a measure
of preference for fatty foods. Preferences and abilities are key parameters in many models
but currently must usually be treated as latent, unobserved variables. In principle (although
not yet in practice), genetic methods could be used to identify such key parameters and
thereby enable estimation of richer structural models.
4.1.2. Biological mechanisms. Second, social scientists will use genotypic data to learn
about the biological mechanisms that underlie behaviors of interest. One possibility is that
the genetic data can be used for tests of existing hypotheses. For example, experiments in
which humans are exposed to the neuropeptide oxytocin suggest that oxytocin causes
trusting behavior (Kosfeld et al. 2005). This leads naturally to the hypothesis that variation
in the geneOXTR, which encodes the receptor for oxytocin, may be related to variation in
trust-related behaviors. Unfortunately, the reported association between genetic polymor-
phisms in OXTR and trusting behavior (Israel et al. 2009) has not been replicated
(Apicella et al. 2010). Nonetheless, the use of genetic data to explore existing hypotheses
may bear fruit, and we review a number of efforts along these lines below in the context of
candidate gene studies.
Even more intriguingly, analysis of the genetic data might suggest new hypotheses. In
medicine, unexpected genetic associations with age-related macular degeneration and
Crohn’s disease have led to discoveries of new biological pathways for these diseases
(Hirschhorn 2009). Although it is difficult to anticipate new hypotheses, we suspect they
will arise in economics. We speculate that likely discoveries will involve the nature of
preferences. Whereas economists often study individual differences in terms of heterogene-
ity in “fundamental” preference parameters such as relative risk aversion, the (exponen-
tial) discount rate, and a weighting parameter for altruism, these primitive preferences do
not (yet) rest on biological foundations—these categories were proposed by economic
theorists before the modern age of empiricism. Identifying genetic differences that predict
heterogeneity in behavior may provide an empirical basis for decomposing (or even
rearranging) crude concepts such as risk aversion and discounting into more primitive
attributes with biological microfoundations.
4.1.3. Genes as control variables and/or instrumental variables. Third, social scientists
may use genetic markers as control variables, thereby improving the power of standard
economic analysis. By controlling for variation that would otherwise be absorbed in resid-
uals, economists will be able to lower the standard errors associated with estimates of
nongenetic parameters.
It is also possible that economists will be able to use genes as instrumental variables
(IVs) to infer the causal effect of (nongenetic) factor X on (nongenetic) factor Y using
observational data. For example, this approach has been used in epidemiology to argue
that greater alcohol consumption causes higher blood pressure, using as IVs genetic poly-
morphisms in genes that code for proteins involved in alcohol metabolism (Chen et al.
2008; for reviews of the genetic IVs in epidemiology, see Davey Smith & Ebrahim 2003
and Lawlor et al. 2008).
There are already a number of economics papers that use genes as IVs (Norton & Han
2008, Ding et al. 2009, Fletcher & Lehrer 2009, von Hinke Kessler Scholder et al. 2010).
www.annualreviews.org � The Promises and Pitfalls of Genoeconomics 639
Ann
u. R
ev. E
con.
201
2.4:
627-
662.
Dow
nloa
ded
from
ww
w.a
nnua
lrev
iew
s.or
gby
Cor
nell
Uni
vers
ity o
n 09
/07/
12. F
or p
erso
nal u
se o
nly.
For example, Fletcher & Lehrer (2009) study the effect of mental health (X) on academic
achievement (Y). In effect, the idea is to use the fact that genotypes for polymorphisms
affecting mental health are randomly assigned among siblings within a family as a natural
experiment. As usual with IVs, the credibility of the analysis depends on whether the
assumptions underlying IV estimation are satisfied; the fact that genetic effect sizes are very
small, as discussed below in Section 4.6.4, raises the concern of weak instruments, and
the fact that most genetic polymorphisms have many effects, as discussed below in Sec-
tion 4.6.2, suggests that the exclusion restriction will often be violated (Conley 2009,
Cawley et al. 2011).
4.1.4. Targeting interventions. Finally, genetic information could eventually be useful for
targeting social-scientific interventions, much like it is beginning to be useful for targeting
medical interventions. For example, if dyslexia can eventually be predicted sufficiently well
by genetic screening, parents with children who have dyslexia-susceptibility genes could be
given the option of enrolling their children in supplementary reading programs, years
before a formal diagnosis of dyslexia (see Schumacher et al. 2007 for a review of the
genetic predictors of dyslexia). For adults, it is generally feasible and more accurate to
measure realized preferences and abilities directly rather than relying on genetic predispo-
sitions, at least when there is no incentive to misrepresent one’s type. For this reason, in the
realm of economics, targeting interventions is most likely to take the form of parents
obtaining genomic information about their children and then creating a developmental
environment that is most likely to cultivate the children’s preferences and abilities.
4.2. Estimating Genetic Effects
All these potential payoffs involve knowing the effect on an outcome of one or more
particular SNPs. Therefore, most work in genoeconomics to date has been focused on
estimating genetic effects, and that is likely to remain true for the foreseeable future. We
discuss how genetic effects are estimated, and then we turn to the pitfalls of genoeconomics,
most of which involve challenges of estimation and causal inference.
A naıve approach would be simply to estimate Equation 1, yi ¼ mþPJj¼1
bjxij þ Ei. Even if
one could measure all J SNPs in the genome, however, this regression would fail the rank
condition (unless one had more than 52 million subjects!). For that reason, it is standard
instead to run K � J separate regressions,
yi ¼ mþ bjxij þ Ei, ð8Þone regression for each of K SNPs that have been measured in the sample.
If the genotypes xi1, xi2 , . . . , xiJ were mutually uncorrelated and uncorrelated with Ei,then estimating Equation 8 rather than the population regression in Equation 1 would
nonetheless yield unbiased estimates of the genetic effect bj. In fact, however, because of
how DNA is transmitted from parents to child, the genotypes of SNPs physically close to
each other on the genome are correlated, often highly so. Consequently, a robustly nonzero
bj estimated from Equation 8 does not necessarily imply that the true bj from Equation 1 is
nonzero. SNP j could be proxying for a nearby, correlated SNP—possibly a SNP that is not
included among the K SNPs that have been measured in the sample. For this reason,
finding a robust association is the first step in a longer process (not discussed here) of
640 Benjamin et al.
Ann
u. R
ev. E
con.
201
2.4:
627-
662.
Dow
nloa
ded
from
ww
w.a
nnua
lrev
iew
s.or
gby
Cor
nell
Uni
vers
ity o
n 09
/07/
12. F
or p
erso
nal u
se o
nly.
obtaining high-resolution data on the associated SNP and adjacent SNPs to identify which
is the causal SNP.
The estimated coefficient on SNP j could also be biased if genotype xij is correlated with
residual factors Ei. Dealing with this possible confound is an important practical issue that
we discuss below in Section 4.6.1 under the rubric of “population stratification.”
The two main research strategies when testing for genetic association, the candidate
gene approach and the genome-wide association study (GWAS), correspond to the twoways
that researchers choose whichK SNPs to study.
4.3. The Candidate Gene Approach
In a candidate gene study, a researcher specifies ex ante hypotheses about a small set of
K SNPs (with K typically in the 1–30 range), runs the regression in Equation 8 for each,
and tests each of the null hypotheses that bj ¼ 0, usually at the conventional a ¼ 0.05
significance level. Ideally, these hypotheses are derived from the known biological function
of the SNP. In practice, the hypotheses are often based on previously reported associations
with the same outcome or a related outcome, or the choice of SNPs is a result of their
availability in the data set the researchers are using.
The candidate gene approach, or hypothesis-based approach, was the main research
strategy in medical genetics prior to the availability of dense SNP chips that made it
possible and relatively inexpensive to measure hundreds of thousands, or millions, of
SNPs. Candidate gene studies still predominate in the social science literature. Most of the
major early successes in medical genetics were candidate gene studies. For example,
because the plaques found in the brain of Alzheimer’s disease patients contain apolipopro-
teins, researchers examined whether genotypes in the APOE gene, which codes for an
apolipoprotein, are associated with Alzheimer’s disease. These genotypes, based on combi-
nations of two SNPs, are now the strongest known genetic predictors of Alzheimer’s
disease that are common polymorphisms, as opposed to rare mutations (Strittmatter et al.
1993, St. George-Hyslop 2000).
Although the hypothesis-based approach seems intuitively reasonable, aside from the
minority of cases in which the hypotheses are direct (such as APOE), it has a poor track
record in medical genetics. It is now widely accepted that findings from candidate gene
studies typically fail to replicate. In an example that seems typical of the general pattern, a
recent study used a sample with more than 20,000 individuals to examine previously
reported genetic associations with lung function. Of the over 100 genes examined, only
one published association was shown to be robust (Obeidat et al. 2011).
At least three factors seem to account for the apparently high rate of false positives
produced by these studies. First, the sample sizes were often relatively small, and thus the
statistical power is low, in the studies that initially reported positive findings, as discussed
further below. Second, when the hypothesis-based approach is applied to complex diseases
(or human behaviors), the basis for the hypothesis is almost always less precise than
a direct link between a disease- or trait-relevant protein and the gene that codes for it.
Ten years ago, those hypotheses often seemed convincing nonetheless, but today they seem
much less so with the benefit of hindsight. That is partly because there are now many more
known SNPs that could be hypothesized ex ante to be relevant and partly because it has
become clear that—ex post, once an association has been found—it is possible to come up
with seemingly plausible hypotheses about why almost any gene should be associated with
www.annualreviews.org � The Promises and Pitfalls of Genoeconomics 641
Ann
u. R
ev. E
con.
201
2.4:
627-
662.
Dow
nloa
ded
from
ww
w.a
nnua
lrev
iew
s.or
gby
Cor
nell
Uni
vers
ity o
n 09
/07/
12. F
or p
erso
nal u
se o
nly.
the outcome of interest. And even if a plausible mechanism linking a gene to an outcome is
identified, there is no guarantee that a particular SNP in the gene selected as a candidate
will affect the gene’s function in the necessary way. Third, publication bias—the tendency
for positive findings, as opposed to nonfindings, to be selectively reported by researchers
and selectively published by journals—is magnified in genetic association research because
the typical data set has data on many outcomes and many SNPs. Hence false positives arise
because of multiple hypothesis testing that is not adequately corrected for. The investiga-
tion of gene-gene and gene-environment interaction effects, although in theory well moti-
vated, in practice exacerbates the multiple hypothesis–testing problem (see, e.g., Duncan &
Keller 2011).
Recognizing these concerns, a leading field journal, Behavior Genetics, has recently
adopted strict standards for publication of candidate gene studies (Hewitt 2012). To be
considered for publication, candidate gene studies must be well powered and must account
for all sources of multiple hypothesis testing, and any new finding must be accompanied by
a replication. Today, the consensus view among genetics researchers is that the results from
candidate gene studies are intriguing but should be interpreted with great caution.
4.4. Genome-Wide Association Studies
A GWAS is an atheoretical exercise that consists of looking for associations between the
outcome and all the SNPs measured on a dense SNP chip (usually K > 500,000, and now
typically K� 2,500,000), without any prior hypotheses. The researcher runs the regression
in Equation 8 for each of the K SNPs and tests each of the null hypotheses that bj ¼ 0 at the
genome-wide significance level, which is a ¼ 5 � 10�8.
The correlation structure of SNPs in the human genome is now well understood, and
the GWAS approach exploits this understanding in two ways. First, the SNPs that are
measured on a dense SNP chip are selected such that jointly they cover, or “tag,” much of
the nonrare genotypic variation across SNPs in the genome. Second, although the human
genome contains approximately 52 million SNPs, because of the correlation structure,
there are only effectively approximately 1 million independent SNPs. The genome-wide
significance threshold of 5 � 10�8 therefore approximates the appropriate Bonferroni-
corrected significance threshold of 0.05/1,000,000 (Panagiotou & Ioannidis 2012).
GWASs have produced many of the recent major discoveries in medical genetics. For
example, the FTO gene mentioned above had not been hypothesized to be linked to body
weight, but it repeatedly turned up in GWAS results. As nothing was previously known
about this gene, its codename was assigned to represent “fat mass and obesity associated,”
and intensive work has begun on discovering its biological functions (Tung & Yeo 2011).
In another example, in type 2 diabetes, GWAS-derived genetic discoveries have implicated
new biological mechanisms and have linked the disease to other processes, such as circa-
dian rhythms (see Billings & Florez 2010).
4.5. Molecular Genetics and Economics: A Review
To date, most published genoeconomics papers are candidate gene studies of some eco-
nomic preference parameter or economic behavior measured in the laboratory. All but one
(Apicella et al. 2010) of the studies focused on laboratory measures reviewed below are
based on samples smaller than 500 subjects, and in some cases smaller than 100 subjects.
Genome-wide
association study
(GWAS): a study inwhich hundreds of
thousands of genetic
polymorphisms are
individually tested forassociation with some
outcome, without any
prior hypotheses
Genome-wide
significance: 5 � 10�8;the conventional
level at which an
association is
considered to bestatistically significant
in a genome-wide
association study
642 Benjamin et al.
Ann
u. R
ev. E
con.
201
2.4:
627-
662.
Dow
nloa
ded
from
ww
w.a
nnua
lrev
iew
s.or
gby
Cor
nell
Uni
vers
ity o
n 09
/07/
12. F
or p
erso
nal u
se o
nly.
Ebstein et al. (2010) and Beauchamp et al. (2011b) also provide reviews of the work in
genoeconomics to date.
The first genoeconomic association was reported by Eisenberg et al. (2007), who tests
whether two genetic polymorphisms near dopamine receptor genes (DRD2 and DRD4)
are associated with performance on a hypothetical delay discounting task measuring time
preferences. The polymorphism near DRD2 had a significant association with estimated
discount rates, and there was an interaction between the DRD2 and DRD4 polymor-
phisms (but no main effect of the DRD4 polymorphism). Another early paper was
by Knafo et al. (2008), who were inspired by findings that genetic variation near the
AVPR1a gene causes differences in the social behavior of voles (Hammock & Young
2002, Hammock et al. 2005). In a sample of 203 university students, Knafo et al. find
that dictator-game giving was associated with variation in this gene. A number of
genoeconomic papers quickly followed suit. These papers tend to study outcomes that
can be classified into one of two broad categories: decision making under uncertainty or
social preferences.
Several papers inspired by neuroimaging studies of decision making under risk looked
for associations between genes involved in the regulation of the dopaminergic system and
various measures of risk taking. Kuhnen & Chiao (2009) and Dreber et al. (2009) inde-
pendently report an association between a particular polymorphism of theDRD4 gene and
behavior in incentivized laboratory measures of risk taking. Neither Carpenter et al. (2011)
nor Dreber et al. (2011) replicate this reported association. Other papers, also motivated
by neuroeconomic theories, have reported statistically significant associations between
measures of risk taking and candidate genes (Crisan et al. 2009; Zhong et al. 2009b,c;
Roe et al. 2010; Frydman et al. 2011).
There have also been some reported associations with various measures of social pref-
erences. Israel et al. (2009) report an association between a SNP in the gene OXTR and
dictator-game giving. Apicella et al. (2010) fail to replicate this result in a larger sample
and discuss possible explanations for the failed replication. McDermott et al. (2009)
designed an experiment in which 78 genotyped subjects were told that their earnings from
a vocabulary task had been reduced by an anonymous third party. Subjects were then offered
the opportunity to punish the third party. The subjects were told that either 80% or 20%
of their earnings had been taken by the third party. The MAOA genotype predicted the
behavioral response only following the more aggressive provocation. Finally, Zhong et al.
(2010) report that an interaction between a DRD4 polymorphism and season of birth
affects responder behavior in the ultimatum game.
A handful of papers have examined associations between candidate genes and behaviors
and outcomes outside the laboratory, such as credit card debt (De Neve & Fowler 2010,
De Neve 2011), portfolio risk (Kuhnen et al. 2011), happiness (De Neve et al. 2011), and
self-employment (Nicolaou et al. 2011). In a large sample, van der Loos et al. (2011) fail to
replicate the reported association with self-employment.
Beauchamp et al. (2011b) is the only example of a GWAS published in an economics
journal to date, although van der Loos et al. (2010) describe an ongoing study. In a GWAS
of educational attainment with a sample of 7,574 Framingham Heart Study participants,
Beauchamp et al. (2011b) report 20 associations that fell short of genome-wide signifi-
cance. They also report a replication attempt with a sample of 9,535 individuals from a
Dutch sample. None of the 20 SNP associations replicated at the 0.05 significance level,
and only 9 of 20 even had the same sign. Martin et al. (2011) report on the results for a
www.annualreviews.org � The Promises and Pitfalls of Genoeconomics 643
Ann
u. R
ev. E
con.
201
2.4:
627-
662.
Dow
nloa
ded
from
ww
w.a
nnua
lrev
iew
s.or
gby
Cor
nell
Uni
vers
ity o
n 09
/07/
12. F
or p
erso
nal u
se o
nly.

GWAS of educational attainment in a sample of 9,538 Australians and also fail to find any
genome-wide significant associations.
4.6. The Pitfalls of Genoeconomics
Despite the recent explosion in the number of papers reporting genotype-behavior associ-
ations, we are pessimistic about the replicability of most findings to date. The most urgent
problem—discussed in detail below—is that the most persuasive evidence suggests that
true genotype-behavior associations have tiny effect sizes, so current research designs in the
social sciences are woefully underpowered. However, even once this problem has been
solved, there are a number of further obstacles that must be overcome before the promises
of genoeconomics mentioned above—providing direct measures of latent parameters, eluci-
dating biological mechanisms, using genes as controls or IVs, and targeting interventions—
can be realized.
4.6.1. Causal inference. The promises of biological mechanisms and genes as IVs require
uncovering the causal effect of particular SNPs on behavior, but most existing research
designs focus on detecting correlations. There are myriad confounds to a causal interpre-
tation. As discussed above, because of the way DNA is transmitted from parents to
children, the genotype of a SNP is often highly correlated with the genotypes of nearby
SNPs, necessitating follow-up work to any robustly detected association to identify which
SNP is actually responsible. Another common confound is that an individual’s genotype is
correlated with her parents’ genotypes, which in turn are correlated with the individual’s
family environment. For example, a SNP may be associated with cognitive ability even
though it actually causes nurturing behavior; an individual with the nurturing genotype is
likely to have parents with that genotype, whose bias toward nurturing behavior may lead
them to create a family environment that potentiates the development of higher cogni-
tive ability.
In practice, the most common concern is confounding from population stratification:
Different groups within the sample differ in allele frequencies and also differ in their
outcome for nongenetic reasons. A famous pedagogical example is the “chopsticks effect”
(Lander & Schork 1994): A study concerned with finding the genetic causes of chopstick
use would find a significant association for any SNP whose allele frequencies differ appre-
ciably between Asians and non-Asians, even though most variation in chopstick use is
explained by cultural factors. This example might seem to suggest that a simple fix would
be to control for race or ethnicity. Indeed, it is standard practice to restrict a genetic
association study to subjects of a common ethnic background. It has been found, however,
that allele frequencies can differ even within ethnically homogeneous populations, such as
different regions within Iceland (Price et al. 2009). For this reason, it is a common practice
in GWASs to include as control variables the first four or more principal components of all
the genotypes measured in the dense SNP chip. These principal components seem to pick
up much of the subtle genetic structure within a population (Price et al. 2006). A disadvan-
tage of candidate gene studies relative to GWAS designs is that they are rarely based on
samples with dense SNP data and hence cannot control for subtle genetic differentiation
using principal components.
In our view, building the case that a robustly identified association is causal will take
time and will require convergent evidence from various research strategies. To rule out a
644 Benjamin et al.
Ann
u. R
ev. E
con.
201
2.4:
627-
662.
Dow
nloa
ded
from
ww
w.a
nnua
lrev
iew
s.or
gby
Cor
nell
Uni
vers
ity o
n 09
/07/
12. F
or p
erso
nal u
se o
nly.

number of potential confounds, it would be useful to have evidence for a genetic association
in a data set that includes siblings, using the regression in Equation 8 but with family fixed
effects. When identifying off of within-family variation, population stratification ceases to be
a concern. Moreover, genotypes are randomly assigned to siblings who share the same
biological parents. Complementary with such empirical evidence would be experimental
evidence from animal models, in which genotypes can be experimentally modified at
conception, as well as biological evidence on the function of protein products of the gene.
4.6.2. Pleiotropy. There is a further obstacle to credibly using genes as IVs. For the exclu-
sion restriction to be satisfied, the causal effects of the genes must be understood well
enough to rule out alternative pathways (besides X) by which the genes could affect out-
come Y. Because many genes code for proteins that have multiple functions and effects—
a phenomenon called pleiotropy that in most cases biologists have barely begun to
understand—it seems unlikely that we can be confident about all the consequences of
any particular genotype in the foreseeable future (Conley 2009).
4.6.3. Missing heritability. Targeting interventions is one of the potential contributions
closest at hand because the genetic markers can be merely predictive, rather than causal,
and because an index composed of many SNPs can be used, which may in the aggregate
have substantial predictive power even if any constituent SNP in the index has little or
none.10 However, although we expect eventual successes, it will likely be slow and chal-
lenging to find sufficient predictive power even from an index.
In medical genetics, with the exception of a few, rare, single-gene disorders, there has
been a general failure to find sizeable aggregate predictive power from the associated
genetic markers identified to date—a problem now called the missing heritability puzzle
(see, e.g., Int. Schizophr. Consort. et al. 2009). Consider height, a highly studied physical
trait that both is measured with much less error than behavioral traits and is more herita-
ble. Behavior genetics studies on twins and other relatives indicate that about 80% of the
variability in height results from genetic factors. Furthermore, recent estimates suggest
that, even just using the SNPs measured with current dense SNP genotyping technologies
(which leave non-SNP genetic polymorphisms unmeasured), it should be possible to pre-
dict 45% of the variance in human height (Yang et al. 2010). Yet the aggregate predictive
power from known genotypes is only about 10%, with 0.3% being the largest R2 of any
one of the SNPs in 180 separate locations in the genome so far found to be associated with
height (Lango Allen et al. 2010). This state of affairs for height, and similar states of affairs
for a variety of intensively studied medical outcomes, suggests that for these outcomes, the
bulk of the genetic variance is carried by many SNPs of miniscule effects that are spread
diffusely throughout the genome. If so, unrealistically large sample sizes may be required to
identify all these SNPs. Given the failure to find sizeable predictable power in physical
10The standard method of constructing a predictive index (Int. Schizophr. Consort. et al. 2009) is to take the
coefficients, b1, . . . , bK, estimated from running the regression in Equation 8 for each of the K SNPs; keep only a
subset ofQ< K of the coefficients such that the genotypes of theseQ SNPs are approximately uncorrelated; and then
form a predictor yi for each individual i using an analog of Equation 2, yi ¼ mþPQj¼1
bq jð ÞXi, q jð Þ,where q(j) is the j-th SNP
in the subset of Q SNPs. In addition to restricting the subset to SNPs that are approximately uncorrelated, the subset
is often limited further by including only SNPs whose p value from the regression in Equation 8 is below some
threshold. Predictive power is assessed as the R2 from a regression of yi on yi in a new sample.
Pleiotropy: multiple
effects of a single gene
www.annualreviews.org � The Promises and Pitfalls of Genoeconomics 645
Ann
u. R
ev. E
con.
201
2.4:
627-
662.
Dow
nloa
ded
from
ww
w.a
nnua
lrev
iew
s.or
gby
Cor
nell
Uni
vers
ity o
n 09
/07/
12. F
or p
erso
nal u
se o
nly.
traits, the challenge is likely to be at least as large for behavioral traits where the causal
mechanisms are probably more complex.
4.6.4. Low power. The most urgent problem, however, is that most efforts in the social
sciences to discover genetic associations are underpowered. The fundamental reason is that
almost every true genotype-behavior correlation is probably very small. For example,
cognitive ability is among the most reliably measured and widely studied outcomes in
social science genetics, yet it is unclear whether any purported genetic associations with
cognitive ability are robust. In a meta-analysis of 67 independent samples, variation in the
COMT gene was found to explain 0.1% of the variance in cognitive ability, although even
this estimate is likely to be biased upward because the meta-analysis found evidence of
publication bias (Barnett et al. 2008). Even if this effect size were correct, as the strongest
associations are more likely to be discovered first, most of the SNPs truly associated with
cognitive ability probably have smaller effects. As another example, a recent GWAS of the
classic Big Five personality traits (neuroticism, extraversion, openness, agreeableness, and
conscientiousness) with a sample size of approximately 20,000 individuals failed to find
any genome-wide significant associations (de Moor et al. 2012).
To get a sense of the magnitude of the problem, consider a candidate gene study of a
particular SNP. To simplify, suppose there are only two genotypes for the SNP, with
carriers of the high variant, as opposed to carriers of the low variant, hypothesized to have
a higher value for the outcome. To further simplify, suppose there are only two possibili-
ties: Either there is a true association, or there is not. Imagine the outcome is distributed
normally. Suppose it is known that, if there is an association, then the SNP explains
R2 ¼ 0.1%—a rather large effect size for a single SNP (the same size as the COMT associa-
tion with cognitive ability). A first question is, what sample size is required for the standard
benchmark of 80% power to detect the effect using the regression in Equation 8 at the
conventional, two-tailed 0.05 significance level? The answer is 7,845. This is far larger
than typical samples to date in genoeconomics, which have numbered from less than a
hundred to several hundred in studies using laboratory measures and a few thousand in
studies using nonlaboratory data.
Now suppose that in a sample of size N, a researcher observes a statistically significant
association at the 0.05 significance level. How large does N have to be for this result to
constitute substantial evidence about whether there is an association? The upper half of
Table 3 shows how a researcher’s posterior belief (after having seen the data) that there is a
true association should depend on the researcher’s prior belief and on N. Of course, it is
difficult to know what an appropriate prior belief is, but for a typical candidate SNP, it is
probably much less than 10%. In a GWAS in which millions of SNPs are tested, the prior
probability that a typical given SNP has a true relationship is less than 0.01%.
A proper Bayesian thinker would barely update his posteriors when faced with a
statistically significant association in a sample of 100 individuals. Because the effect size is
so small, the statistical power—the probability of finding a statistically significant associ-
ation under the alternative hypothesis that there is truly a relationship—is only 6%. At a
significance level of 0.05, there is a 5% probability of finding a statistically significant
association under the null hypothesis. Hence finding a statistically significant association
at the 0.05 level is almost equally likely under the null hypothesis as under the alternative
hypothesis and hence is essentially uninformative regarding which hypothesis is more
likely to be correct.
646 Benjamin et al.
Ann
u. R
ev. E
con.
201
2.4:
627-
662.
Dow
nloa
ded
from
ww
w.a
nnua
lrev
iew
s.or
gby
Cor
nell
Uni
vers
ity o
n 09
/07/
12. F
or p
erso
nal u
se o
nly.

In a sample of 30,000 individuals, where statistical power is 99%, the likelihood of
finding a statistically significant association under the alternative hypothesis is about
20 times the likelihood of finding a statistically significant association under the null hypoth-
esis. When the prior probability of a true association is 0.01%, the posterior probability
after observing a statistically significant association is 0.20%, which is unfortunately still
extremely low. Even if the prior probability of a true association were as high as 10%, the
posterior probability after observing a statistically significant association would be 69%,
leaving a 31% chance that the reported association is a false positive.
Because the effect sizes are so small, these calculations defy our usual expectations about
the robustness of statistically significant findings and suggest that, when evaluating candidate
gene studies, it is valuable to conduct such calculations rather than rely on our faulty intui-
tions. One can see from the upper part of Table 3 that a researcher should conclude almost
nothing about a genotype-behavior relationship from a sample size in the hundreds, and
sample sizes must be in the many thousands before nontrivial inferences are appropriate.11
5. CAUTIONARY TALES AND CONSTRUCTIVE RESPONSES
In this section, we illustrate some of the challenges of genoeconomics research with
two cautionary tales that trace out the trajectory of our research projects in this area, and
outline three constructive responses.
Table 3 Posterior probability of a true association of R2 ¼ 0.1% as a function of prior probability and sample size
Sample size
For an association that is statistically significant at p ¼¼¼¼¼¼ 0.05
N ¼ 100
(power¼ 0.06)
N ¼ 1,000
(power¼ 0.17)
N ¼ 5,000
(power ¼ 0.61)
N ¼ 10,000
(power ¼ 0.89)
N ¼ 30,000
(power ¼ 0.99)
Prior
probability
of true
association
0.01% 0.01% 0.03% 0.12% 0.18% 0.20%
1% 1% 3% 11% 15% 17%
10% 12% 27% 58% 66% 69%
For an association that is statistically significant at p ¼¼¼¼¼¼ 5 ������ 10�8
N ¼ 100
(power¼ 0.00)
N ¼ 1,000
(power ¼ 0.00)
N ¼ 5,000
(power ¼ 0.00)
N ¼ 10,000
(power ¼ 0.01)
N ¼ 30,000
(power ¼ 0.51)
Prior
probability
of true
association
0.01% 0.03% 3% 57% 96% 100%
1% 3% 47% 99% 100% 100%
10% 25% 91% 100% 100% 100%
The assumptions underlying these calculations are provided in the text. Power is calculated using Purcell et al.’s (2003) online tool: http://pngu.
mgh.harvard.edu/~purcell/gpc/qtlassoc.html. Posterior probabilities are then calculated by Bayes’ rule:
Pr(truejsignificant) ¼ (power � prior)={(power � prior) þ [0.05 � (1 � prior)]}.
11The power challenge is probably less daunting for functional magnetic resonance imaging (fMRI) data, for which
the effects of individual SNPs are probably larger, but reasonable power still requires sample sizes much larger than is
currently typical. For instance, suppose it is known that, if there is an association, then the SNP explains R2 ¼ 3%.
Under the same assumptions as above, a sample size of N ¼ 258 is required for 80% power.
www.annualreviews.org � The Promises and Pitfalls of Genoeconomics 647
Ann
u. R
ev. E
con.
201
2.4:
627-
662.
Dow
nloa
ded
from
ww
w.a
nnua
lrev
iew
s.or
gby
Cor
nell
Uni
vers
ity o
n 09
/07/
12. F
or p
erso
nal u
se o
nly.
5.1. An Icelandic Saga
When we began our work on genoeconomics approximately 10 years ago, before dense
SNP chips became relatively inexpensive, the standard empirical strategy in the medical
genetics literature was the candidate gene approach, so we followed the same methodol-
ogy. At the time, there were extremely few data sets that contained both economic and
genotypic data. No economic data sets had collected genotypic data, but we were fortunate
to team up with the AGES-RS, an Icelandic medical study (described in Harris et al. 2007)
that happened to have collected several survey measures of interest to economists. Here we
sketch our analysis of this data; full details are available in Supplemental Appendix 2.
Constrained by what was available in the data, we constructed the following eight
“economic outcomes” that serve as dependent variables in the analysis: (a) time preference
index (an index of present-oriented behaviors, combining measures of alcohol use,
cigarette use, and body mass index at age 25), (b) happiness, (c) self-reported health,
(d) housing wealth, (e) human capital index (an index of human capital, combining years
of education with number of foreign languages learned), (f ) income (predicted by occupa-
tion held at midlife), (g) labor supply, and (e) social capital index (an index of social
capital, combining the amount of regular contact with relatives and friends, attendance at
religious services, and participation in social activities).
We then created a list of candidate genes that we believed were most likely to be related
to economic decision making, given what was known at the time our study was initiated.
We obtained enough funding to have blood samples from 2,349 AGES-RS participants run
through a custom-designed microarray that could measure 384 SNPs. We chose which
genes to study based on two criteria: published associations with cognition-related out-
comes or disorders (e.g., cognitive ability, long-term memory, Alzheimer’s disease, schizo-
phrenia, attention deficit hyperactivity disorder) and/or membership in the dopamine or
serotonin neurotransmitter systems. If the gene was small enough, we included enough
SNPs to capture most of the possible variation in that gene. If the gene was too large, we
included only the SNPs on the gene that had been specifically mentioned in published
association studies. We supplemented the 384 SNPs we specified with several additional
SNPs that had been previously genotyped in AGES-RS for other purposes (e.g., the two
SNPs in APOE that define the genotypes associated with late-onset Alzheimer’s disease).
Adding these additional SNPs, and subtracting the few SNPs that failed to genotype
correctly, our total number of SNPs was 415 in a total of 68 genes.
We ran the regression in Equation 8 3,320 times, one for each of the 8 outcome �415 candidate SNP combinations. The three most statistically significant associations are
the social capital index with a SNP called rs17529477 in the geneDRD2 (p < 0.0005), the
time preference index with rs908867 in BDNF (p < 0.0001), and the human capital index
with rs2267539 in SSADH (p < 0.001). The results are virtually identical when linear
controls for age and sex, the standard control variables in medical genetics, are included in
the regressions.
Naturally the standard p values (reported above) from such regressions are easily
misinterpreted because of multiple hypothesis testing. In 2008, we were able to attempt to
replicate these three “top hits” in a nonoverlapping sample of 1,759 AGES-RS participants
who had been genotyped using a dense SNP chip (the Illumina Hu370CNV) for a different
research project. Although that chip did not directly measure any of the three SNPs that
exhibited a promising association, it is standard in genetics to impute data on missing SNPs
648 Benjamin et al.
Supplemental Material
Ann
u. R
ev. E
con.
201
2.4:
627-
662.
Dow
nloa
ded
from
ww
w.a
nnua
lrev
iew
s.or
gby
Cor
nell
Uni
vers
ity o
n 09
/07/
12. F
or p
erso
nal u
se o
nly.
using observed data on surrounding SNPs, which is usually highly accurate because of the
high correlation among nearby SNPs. Although the imputation quality forDRD2 rs17529477
was relatively low, we were able to impute the other two SNPs with high accuracy.12
The association between the time preference index and BDNF rs908867 did not repli-
cate (p¼ 0.531). The association between the human capital index and SSADH rs2267539
not only replicated (p ¼ 0.02), but had similar effect sizes in the two samples: a coefficient
of 0.23 with a standard error of 0.07 in the first sample and a coefficient of 0.19 with a
standard error of 0.08 in the second sample. Combining the first and second samples, this
association has an R2 of 0.47%, which is quite large for an individual SNP.
Figure 1a (see color insert) shows, for the first and second samples combined, the
average level of the human capital index by genotype. In this case, it turns out that the rela-
tionship between the level of the index and the number of A alleles is monotonic. To give a
sense of the magnitude of the relationship in natural units, the figure also presents the mean
years of education—the main constituent of the index: The years of education for G/G
participants were 8.3, and this increased to 8.8 for A/G participants and 8.9 for A/A par-
ticipants. Table 4 shows, for the combined sample, the regression specification in Equa-
tion 8 with controls for population stratification (the first two principal components of the
dense SNP data) and regional variation in education.
An association is less likely to be a false positive if there is a plausible biological mech-
anism for the relationship. The gene SSADH (also known as ALDH5A1) codes for an
enzyme that metabolizes GABA, the principal inhibitory neurotransmitter in the brain.
This gene matters for cognition: It has been associated with general cognitive ability
(IQ; Plomin et al. 2004), it is related to the preservation of cognitive function in the elderly
(De Rango et al. 2008), and it may be undergoing recent natural selection (Leone et al. 2006),
as might be expected for a gene that has a large effect on a trait that could assist in survival
and reproduction. Furthermore, rare mutations of SSADH are associated with mental
retardation, and animals in which the gene is experimentally knocked out (i.e., rendered
inoperative) are cognitively impaired and develop epileptic seizures (Buzzi et al. 2006,
Knerr et al. 2008).
If the gene is related to our human capital index via its effect on cognitive ability, then
we should observe that cognitive ability mediates the relationship between the SNP and
human capital. To directly test this mechanism, we constructed a measure of cognitive
ability using a variety of cognitive tests that had been administered to AGES-RS partici-
pants (see Supplemental Appendix 2 for details).
Figure 1b shows that, as expected, this index of cognitive ability is associated with the
SNP of interest, SSADH rs2267539. In a regression (Equation 8) with standardized cogni-
tive ability as the outcome, the coefficient is 0.11 with a standard error of 0.03, indicating
that a switch of one G allele to an A allele is associated with one-ninth of a standard
12One commonly used metric for imputation quality is the variance ratio: the ratio of the variance across individuals
in the imputed genotype to the expected binomial variance based on the frequency of the minor allele. In a large sample,
an accurate imputation will have a variance ratio of 1, whereas an imputation based on no information will have a
variance ratio of zero. In standard GWAS sample sizes of several thousand individuals, most imputed SNPs have
variance ratios above 0.9 because of the generally high degree of correlation with nearby SNPs. The variance ratios for
DRD2 rs17529477, BDNF rs908867, and SSADH rs2267539 were 0.657, 0.999, and 0.956, respectively. Although a
variance ratio is not generally considered unacceptably low unless it is below 0.3, we were suspicious about the
DRD2 SNP imputation because the concordance rate—the fraction of matches between imputed genotype and
known genotype in the part of the GWAS sample that overlapped with the candidate gene sample—was only 81%.
www.annualreviews.org � The Promises and Pitfalls of Genoeconomics 649
Ann
u. R
ev. E
con.
201
2.4:
627-
662.
Dow
nloa
ded
from
ww
w.a
nnua
lrev
iew
s.or
gby
Cor
nell
Uni
vers
ity o
n 09
/07/
12. F
or p
erso
nal u
se o
nly.
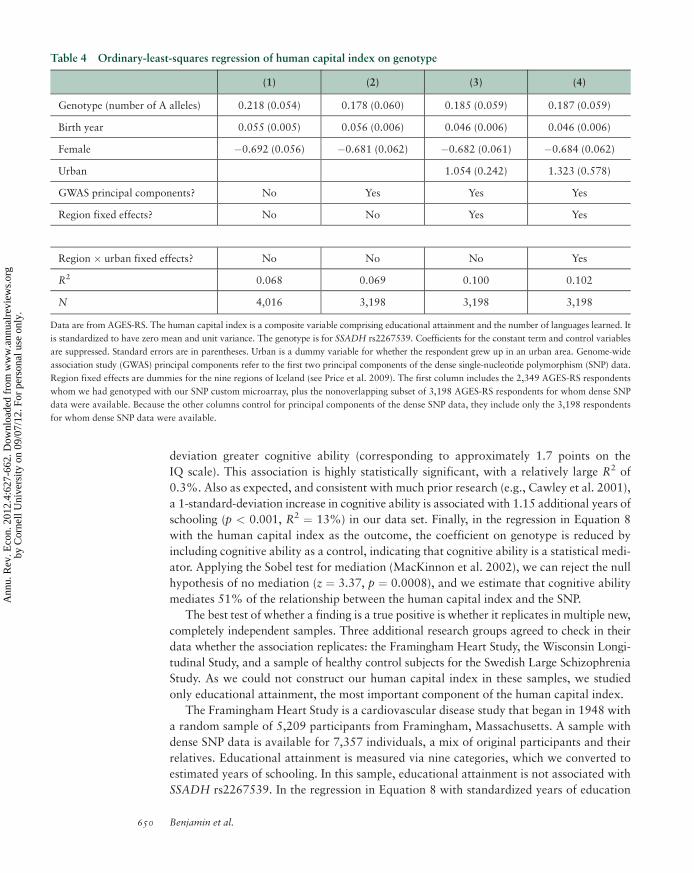
deviation greater cognitive ability (corresponding to approximately 1.7 points on the
IQ scale). This association is highly statistically significant, with a relatively large R2 of
0.3%. Also as expected, and consistent with much prior research (e.g., Cawley et al. 2001),
a 1-standard-deviation increase in cognitive ability is associated with 1.15 additional years of
schooling (p < 0.001, R2 ¼ 13%) in our data set. Finally, in the regression in Equation 8
with the human capital index as the outcome, the coefficient on genotype is reduced by
including cognitive ability as a control, indicating that cognitive ability is a statistical medi-
ator. Applying the Sobel test for mediation (MacKinnon et al. 2002), we can reject the null
hypothesis of no mediation (z ¼ 3.37, p ¼ 0.0008), and we estimate that cognitive ability
mediates 51% of the relationship between the human capital index and the SNP.
The best test of whether a finding is a true positive is whether it replicates in multiple new,
completely independent samples. Three additional research groups agreed to check in their
data whether the association replicates: the Framingham Heart Study, the Wisconsin Longi-
tudinal Study, and a sample of healthy control subjects for the Swedish Large Schizophrenia
Study. As we could not construct our human capital index in these samples, we studied
only educational attainment, the most important component of the human capital index.
The Framingham Heart Study is a cardiovascular disease study that began in 1948 with
a random sample of 5,209 participants from Framingham, Massachusetts. A sample with
dense SNP data is available for 7,357 individuals, a mix of original participants and their
relatives. Educational attainment is measured via nine categories, which we converted to
estimated years of schooling. In this sample, educational attainment is not associated with
SSADH rs2267539. In the regression in Equation 8 with standardized years of education
Table 4 Ordinary-least-squares regression of human capital index on genotype
(1) (2) (3) (4)
Genotype (number of A alleles) 0.218 (0.054) 0.178 (0.060) 0.185 (0.059) 0.187 (0.059)
Birth year 0.055 (0.005) 0.056 (0.006) 0.046 (0.006) 0.046 (0.006)
Female �0.692 (0.056) �0.681 (0.062) �0.682 (0.061) �0.684 (0.062)
Urban 1.054 (0.242) 1.323 (0.578)
GWAS principal components? No Yes Yes Yes
Region fixed effects? No No Yes Yes
Region � urban fixed effects? No No No Yes
R2 0.068 0.069 0.100 0.102
N 4,016 3,198 3,198 3,198
Data are from AGES-RS. The human capital index is a composite variable comprising educational attainment and the number of languages learned. It
is standardized to have zero mean and unit variance. The genotype is for SSADH rs2267539. Coefficients for the constant term and control variables
are suppressed. Standard errors are in parentheses. Urban is a dummy variable for whether the respondent grew up in an urban area. Genome-wide
association study (GWAS) principal components refer to the first two principal components of the dense single-nucleotide polymorphism (SNP) data.
Region fixed effects are dummies for the nine regions of Iceland (see Price et al. 2009). The first column includes the 2,349 AGES-RS respondents
whom we had genotyped with our SNP custom microarray, plus the nonoverlapping subset of 3,198 AGES-RS respondents for whom dense SNP
data were available. Because the other columns control for principal components of the dense SNP data, they include only the 3,198 respondents
for whom dense SNP data were available.
650 Benjamin et al.
Ann
u. R
ev. E
con.
201
2.4:
627-
662.
Dow
nloa
ded
from
ww
w.a
nnua
lrev
iew
s.or
gby
Cor
nell
Uni
vers
ity o
n 09
/07/
12. F
or p
erso
nal u
se o
nly.
as the outcome, the coefficient on the number of A alleles is 0.06 with a standard error of
0.06 (p ¼ 0.30). As the SSADH SNP with the second-strongest association in the AGES-RS
sample was not available in the Framingham Heart Study, we examined the SNP in the
gene with the third-strongest association. The regression coefficient is 0.02 with a standard
error of 0.06 (p ¼ 0.70). (In both cases, the standard errors are adjusted to correct for the
presence of relatives.)
The Wisconsin Longitudinal Study is a random sample of 10,317 Wisconsin residents
who graduated from high school in 1957, as well as 5,219 siblings who were enrolled later.
We obtained genotypes for the three most significant SNPs in AGES-RS from a subsample
of 3,408 individuals. Educational attainment is measured as years of schooling. Here it is
not associated with any of our three most statistically significant SNPs from AGES-RS, and
in fact the point estimates have the wrong sign in all three cases: b ¼ �0.02 (standard error ¼0.07) for the most strongly associated SNP, b ¼ �0.00 (standard error ¼ 0.09) for the second
SNP, and b ¼ �0.05 (standard error ¼ 0.06) for the third SNP.
Our third non-Icelandic replication sample included 1,235 individuals from the healthy
control group for the Swedish Large Schizophrenia Study. These are individuals who were
identified from national population registers to match the schizophrenia group (which we
do not analyze) along the characteristics of age, gender, and county of residence. Educa-
tional attainment is measured on a scale of one to six, ranging from less than nine years to
postgraduate education, which we convert to a standardized variable for the purposes of
the regression analysis. It is not associated with either our most statistically significant SNP
from AGES-RS (b¼ 0.06, standard error¼ 0.07, p¼ 0.45) or our second-most statistically
significant SNP from AGES-RS (b ¼ �0.00, standard error ¼ 0.08, p ¼ 0.98).
What explains our puzzling pattern of results—the finding of an association that repli-
cates with a sample similar to the original sample, passes various plausibility and robust-
ness tests, and then fails to replicate in three other samples? We can think of four leading
possibilities. First, the association in the AGES-RS data may be spurious due to con-
founding factors. For example, we attempted to deal with population stratification by
controlling for the first two principal components of the whole-genome data, in addition to
region dummies, an urban dummy, and region � urban dummies. Even within an ethni-
cally homogeneous population such as Iceland, however, there may be ethnic stratification
on a finer scale than would be picked up by these controls. As a purely speculative example
(meant just to illustrate the many possibilities), descendants of former nobility/leadership
lineages could happen to have more A alleles and also be more educated. Second, the
association may be a true positive, but local to the Icelandic environment. This could occur
if, for example, cognitive skills that are taught in schools outside of Iceland are instead self-
taught within Iceland only by individuals with more A alleles. Third, the association may
be a true positive, but local to the Icelandic genome, if the gene in question primarily has
effects via its interaction with other genes and those genes differ between Icelanders and
other populations. Fourth, our multiple hypothesis tests could have generated a false
positive. Only because of chance did we happen to replicate the finding in a smaller sample
from the AGES-RS data.
Patterns of results like ours are difficult to interpret. There are reasons to emphasize our
replication within AGES-RS—which had exactly the same variable definitions and held
constant the environmental and genotypic background—and discount our subsequent
replication attempts: The ethnic makeups in the Framingham Heart Study and Wisconsin
Longitudinal Study differ substantially from the ethnic makeup in AGES-RS, and the
www.annualreviews.org � The Promises and Pitfalls of Genoeconomics 651
Ann
u. R
ev. E
con.
201
2.4:
627-
662.
Dow
nloa
ded
from
ww
w.a
nnua
lrev
iew
s.or
gby
Cor
nell
Uni
vers
ity o
n 09
/07/
12. F
or p
erso
nal u
se o
nly.

Swedish sample (although ethnically more similar to the Icelandic one) is the smallest study
that we had. Yet there are also reasons to discount our plausibility and robustness checks.
We chose our set of candidate genes because we thought they were most likely be involved
in decision making, so it is not surprising that the association we happened to find “makes
sense” biologically. Cognitive ability is correlated with educational attainment, so it is not
surprising that a SNP that happened to correlate within AGES-RS with educational attain-
ment also correlates in that sample with cognitive function. Similarly, any confound that
might explain the association between the human capital index and our most significant
SNP on SSADH would equally well explain the association with other SNPs on SSADH,
which are correlated with it.
Our failure to replicate a seemingly robust association illustrates one of the major
challenges for integrating genetics and social sciences. But our experience is not unique;
indeed, it closely recapitulated a common story line in medical genetics research.
5.2. Wisconsin Tale
When we began our candidate gene study in AGES-RS, we believed—as did most medical
genetic researchers at the time—that the candidate gene approach was a reasonable
approach. Our experience helped us to appreciate what had become, by the time our
failure to replicate was complete, the new consensus view among the medical genetics
community: The candidate gene approach is a path strewn with false positives.
These realizations made us skeptical of many published candidate gene associations. Yet
social scientists, both authors and referees, seemed much less conscious of the fact that
reported candidate gene associations are unlikely to be true. Consequently, we set out to
systematically test existing candidate genes for general cognitive ability, also known as
“intelligence,” or IQ, which is among the most highly studied psychological traits in
molecular genetic work because it is among the most heritable of behavioral traits [esti-
mates range from 0.50 to 0.80 for IQ measured in adulthood (Bouchard &McGue 2003)].
There is a large literature of studies showing associations between many SNPs in various
genes and general cognitive ability (see Payton 2009 for a comprehensive review). As is
typical of candidate gene studies in the social sciences, many of these results are based on
small samples and had not seen any published replications.
As we report in Chabris et al. (2012), we sought to replicate published associations
between 12 genetic polymorphisms and general cognitive ability using three independent
data sets: the previously described Swedish Twin Registry, Wisconsin Longitudinal Study,
and Framingham Heart Study, with a total sample size of 9,755 participants. Of 32 inde-
pendent tests across all three data sets, only one was nominally significant at the p < 0.05
level.13 In the data from the Wisconsin Longitudinal Study, in which we tested all 12 genetic
polymorphisms and had the most statistical power, we cannot reject the null hypothesis
that the combined effect of those SNPs is zero—even though given our sample size of
5,571 individuals, we had 99% power to detect a combined effect of just R2 ¼ 0.52%.
Further power calculations suggested that, if the previously reported associations were not
false positives, we should have expected between 11 and 15 replicated significant associations
13Intriguingly, the one nominally significant association was with SSADH rs2760118, a SNP in the same gene that
was implicated in our analysis of human capital in AGES-RS. The evidence is once again muddy, however, due to
multiple hypothesis testing and the fact that it is a different SNP.
652 Benjamin et al.
Ann
u. R
ev. E
con.
201
2.4:
627-
662.
Dow
nloa
ded
from
ww
w.a
nnua
lrev
iew
s.or
gby
Cor
nell
Uni
vers
ity o
n 09
/07/
12. F
or p
erso
nal u
se o
nly.

in our 32 tests, rather than the one that we found. Our analysis led us to conclude that
most published SNP associations with general cognitive ability are probably false
positives, most likely because the investigators in those studies inadvertently used samples
that were much too small.14
5.3. Responding to the Inferential Challenges
We believe there are several constructive responses to the inferential challenges posed by
the small explanatory power of individual SNPs.
5.3.1. Pooling data to increase power. When it became widely recognized in the medical
literature that candidate gene studies were generating a high rate of false positives, and when
dense SNP genotyping became sufficiently inexpensive, the standard research design became
GWASs. Obviously, relative to a candidate gene study, a GWAS magnifies the multiple-
testing problem, but the stringent genome-wide significance threshold of p < 5 � 10�8,
combined with implementing the GWAS in a large sample, has generated findings that
have proven much more replicable.
The lower half of Table 3 shows the results of the same Bayesian calculation as the
upper half, except for an association that is statistically significant at the p ¼ 5 � 10�8
level (rather than p ¼ 0.05). Because of the stringent significance threshold, statistical
power is much lower at any given sample size N. Indeed, a true association with effect size
R2 ¼ 0.1% will probably not replicate at a genome-wide significance level for a sample
smaller than 10,000 individuals, and there is only a 50% chance that an association known
to be true will be detected in a sample of 30,000 individuals. Nonetheless, an association
that reaches statistical significance at the genome-wide significance level in a sample of
10,000 or more individuals is almost certain to be a true positive.
Recognizing this, the medical literature has been moving in the direction of forming
consortia of data providers. In such a consortium, a GWAS is conducted in each data set,
and the “discovery phase” is carried out as a meta-analysis of these GWAS results, a so-called
meta-GWAS. In the “replication phase” that follows, the associations implicated in the
discovery phase are investigated in independent samples.
On the one hand, the hurdle that genotype-outcome associations must hold in differ-
ent samples that are typically drawn from populations with different ethnicities and
environments—a requirement that is implicit in a meta-GWAS and explicit in the require-
ment that associations replicate in independent samples—means that GWAS researchers
are unlikely to identify genetic associations that exist only in particular environments. The
set of associations that are reported will tend to be ones that are among the strongest and the
most universal—indeed, the fact that many true associations will not be discovered by a
meta-GWAS perhaps helps account for the missing heritability puzzle discussed in Section 4.
On the other hand, the samples used in meta-GWASs have proven to be sufficiently large to
detect SNP associations with modest effect sizes, and the findings that have emerged from
these cooperative studies appear to be more likely to survive the challenges of replication.
14In other work using the Wisconsin Longitudinal Study on which we are collaborators, Freese et al. (2010) attempt
to replicate associations reported in the literature between SNPs in the candidate gene DRD2 and educational
attainment, voting, partisanship, organization memberships, socializing, tobacco use, and alcohol use, and conclude
that none of the associations replicate.
Meta-GWAS:
a meta-analysis of
results from multiplegenome-wide
association studies
www.annualreviews.org � The Promises and Pitfalls of Genoeconomics 653
Ann
u. R
ev. E
con.
201
2.4:
627-
662.
Dow
nloa
ded
from
ww
w.a
nnua
lrev
iew
s.or
gby
Cor
nell
Uni
vers
ity o
n 09
/07/
12. F
or p
erso
nal u
se o
nly.

Following the lead of the medical genetics community, we, together with Philipp
Koellinger, have organized the Social Science Genetic Association Consortium (SSGAC),
attempting to include all relevant major data providers that have dense SNP data and social
science outcome measures. The SSGAC has had three meetings since its formation in
February 2011, under the auspices and guidance of the Cohorts for Heart and Aging
Research in Genomic Epidemiology Consortium (Psaty et al. 2009), a successful medical
genetic consortium. In forming the SSGAC, we are following in the footsteps of, and
proceeding in close coordination with, the “Gentrepreneurship Consortium” that was formed
for the purpose of studying genetic associations with self-employment (van der Loos
et al. 2010).
5.3.2. Exploiting the cumulative effect of many single-nucleotide polymorphisms. Even in
those cases in which sample sizes are too small to discover robust associations, the data
may still contain valuable information about the distribution of effect sizes of the SNPs on
a dense SNP chip. Yang et al. (2010) developed a method, genomic-relatedness-matrix
restricted maximum likelihood (GREML), for estimating the proportion of variance
explained jointly by all the SNPs measured on a dense SNP chip. The key assumption is
that among individuals who are unrelated—i.e., distantly related, as all humans are related to
some extent—residual factors are uncorrelated with differences in the degree of genetic
relatedness. Under that assumption, an estimate of heritability can be obtained by examin-
ing how the correlation in an outcome between pairs of individuals relates to the genetic
distance between those individuals. Unlike in twin studies where relatedness is known, here
the relatedness is estimated from the SNP data.
Unlike GWASs, for moderately heritable traits, GREML is well powered for samples
of only several thousand unrelated individuals because it aggregates the information
contained in the genetic data. The GREML procedure estimates the fraction of variance
of an outcome that could be predicted if a researcher had GWAS data and a look-up table
that contained the true effect of all SNPs. Under the assumption that large individual-SNP
effects are more likely for outcomes where the joint predictive power of all SNPs is larger,
GREML can be used to assess which outcomes are the most promising to pursue for
GWASs. Applying this method in a sample of 3,925 individuals, Yang et al. (2010) find
that the measured SNPs could account for 45% of the variance in human height; Davies
et al. (2011) apply the method to cognitive ability and obtain point estimates of 40% for
crystallized intelligence (N ¼ 3,254) and 51% for fluid intelligence (N ¼ 3,181); and
Chabris et al. (2012) similarly estimate 47% for general cognitive ability. Vinkhuyzen et al.
(2012) estimate 6% for the personality trait of neuroticism and 12% for extraversion
(N� 12,000, varying somewhat with the outcome variable). Using a sample of 5,727 individ-
uals from the previouslymentioned SALTstudy, Benjamin et al. (2012) estimate 16% for educa-
tional attainment. With a smaller sample from SALTY (N � 2,400), Benjamin et al. (2012)
also apply GREML to survey measures of risk preference, time preference, fairness concerns,
trust, and political attitudes. Although the estimates are noisy, taken as a whole they suggest
that themeasured SNPs account for a positive share of the variance in these traits.
As with GREML, the basic insight behind polygenic risk prediction (e.g., Int. Schizophr.
Consort. et al. 2009) is that even when it is not possible to robustly identify the individual
SNPs associated with an outcome, it may still be possible to make statistically efficient use
of the joint predictive power of a large number of SNPs. Whereas GREML estimates the
amount of predictive power theoretically attainable from the SNP data (but does not
654 Benjamin et al.
Ann
u. R
ev. E
con.
201
2.4:
627-
662.
Dow
nloa
ded
from
ww
w.a
nnua
lrev
iew
s.or
gby
Cor
nell
Uni
vers
ity o
n 09
/07/
12. F
or p
erso
nal u
se o
nly.
enable one to actually predict the outcome), a polygenic risk score is an attempt to use the
SNP data in a given sample to actually construct a predictive equation for an outcome in
that sample (see footnote 10). Estimating a prediction equation that can predict well out of
sample requires precise estimates of the effects of individual SNPs. Because these individual
SNP effects are estimated in a finite sample, polygenic risk prediction will achieve much
less predictive power than the theoretical bound estimated by GREML. Unfortunately, the
out-of-sample predictive power that can be obtained from considering the SNP data simul-
taneously is presently too small to be of practical use for most outcomes. For example, the
International Schizophrenia Consortium reported an out-of-sample predictability of up
to 3% from a predictive risk equation estimated in a total sample of 6,907 individuals
(Int. Schizophr. Consort. et al. 2009). Benjamin et al. (2012) estimate predictive risk
equations for educational attainment (N � 8,300) and for a range of economic preferences
and political attitudes (N � 2,900). In all cases, the out-of-sample R2 is less than 0.1%.
The greatest success to date has been for height, for which the out-of-sample R2 is approx-
imately 13%when the predictive risk equation is generated from SNP effects estimated in a
meta-GWAS of more than 180,000 individuals (Lango Allen et al. 2010).
5.3.3. Focusing on biologically proximal traits. Regardless of the analytic approach, a
major question going forward is which outcomes are the most promising to study. In our
view, in the short run this decision will be dictated by which variables are consistently
measured across a large-enough number of data sets that the joint sample size will yield
reliable results. For this reason, SSGAC’s first outcome to study is educational attainment,
which is widely measured not only in social science surveys, but also in most medical
surveys as a key measure of socioeconomic background.
In the long run, however, we suspect that the most promising economic outcomes will
be those that are most closely related to the underlying biology. Distal outcomes, such as
educational attainment and self-employment, are likely influenced by an enormous num-
ber of genes, each with a tiny effect that will be difficult to detect even in a huge data set. If
these distal genetic effects work through different pathways in different local environ-
ments, then even true relationships will not robustly replicate across data sets. Proximal
outcomes, such as aggressiveness and perhaps impulsivity, are likely to have larger and
more direct genetic influences from fewer genes. Outcomes that are also measurable in
animals have the additional advantage that the genes can be experimentally manipulated in
animal models to directly study their causal effects. Unfortunately, as of now, none of these
proximal outcomes is widely measured across many data sets that have dense SNP data.
One function we envision for the SSGAC will be to coordinate the collection of harmo-
nized measures of proximal outcomes.
6. CONCLUSION: GENOMICS RESEARCH IN ECONOMICS
Above we discuss a number of ways in which the use of molecular genetic data could
benefit economics. For example, genetic data will serve as a powerful lens to identify and
study biological mechanisms that generate important, and potentially overlooked (by
economists), sources of individual differences (e.g., aggression, ambition, and myopia).
Genotypic data will also (eventually) be used as control variables that serve to increase
power. Genetic data may also be of interest in and of itself: Economists have used geno-
typic data to study the effect of intellectual property rights on innovation (Williams 2010)
www.annualreviews.org � The Promises and Pitfalls of Genoeconomics 655
Ann
u. R
ev. E
con.
201
2.4:
627-
662.
Dow
nloa
ded
from
ww
w.a
nnua
lrev
iew
s.or
gby
Cor
nell
Uni
vers
ity o
n 09
/07/
12. F
or p
erso
nal u
se o
nly.

and adverse selection in health insurance markets (Oster et al. 2010). Looking ahead a
decade or two, the availability of inexpensive genotypic data is likely to help parents
predict learning disabilities such as dyslexia earlier in childhood, facilitating earlier inter-
ventions. Potential vulnerabilities to substance abuse, or other kinds of self-destructive
behavior, may also one day be predictable from genetic data.
We also predict that methodological challenges—such as multiple testing—will generate
many more false positives in the literature, especially in the short run. The press is likely to
distort findings and exaggerate the degree to which specific genes “determine” outcomes.
In most cases there is no “gene for [insert behavior here],” despite frequent newspaper
headlines suggesting that there is. Indeed, for most behaviors, researchers are struggling to
find a SNP with an R2 that is greater than one-tenth of 1%. Researchers in this field hold a
special responsibility to try to accurately inform the media and the public about the
limitations of the science.
The inevitable, inexpensive, broad-based availability of genotypic information will
raise myriad social, ethical, and legal questions to which economic analysis will provide a
valuable perspective. Many geneticists rightly worry that genetic research will prove to be
socially harmful by generating discrimination against genetically disadvantaged groups.
Genetic information will generate a rich set of new policy problems (in addition to the
benefits that we review above). Governments will need to formulate new policies that
maximize social welfare in a world where people with genetic advantages will wish to
share them with potential employers and insurers, and people with genetic disadvantages
will want to shroud them. In some cases, the provision of genetic information can be
beneficial (e.g., alerting couples who both possess disease-causing recessive mutations),
whereas in other cases, it would be deeply problematic (e.g., sharing genetic data with
health insurance companies, which effectively creates an unraveling of some of the social
benefit of health insurance). Problems abound in any analysis of optimal access to genetic
information, even when the individual herself is the only one who is going to have access to
the data. Under what conditions will the benefits to an individual from knowing her own
genetic risk factors, such as the ability to prepare well in advance for a likely illness,
outweigh the costs of increased anxiety and distress (see Oster et al. 2012)? We predict
that research on these different types of questions will soon occupy a much larger fraction
of economists’ energy as these issues quickly become of immediate practical relevance.
DISCLOSURE STATEMENT
The authors are not aware of any affiliations, memberships, funding, or financial holdings
that might be perceived as affecting the objectivity of this review.
ACKNOWLEDGMENTS
For helpful comments, we are grateful to Peter Visscher and attendees at the 2007 NIA
Workshop on Refining Economic Phenotypes for Genetic Analyses; 2009 AEA Meetings;
2009 MRRC Conference; 2009 Behavior Genetics Association Annual Meeting; IZA/
Volkswagen Foundation Workshop: Genes, Brains, and the Labor Market; NSF Workshop
on Genes, Cognition, and Social Behavior; Using GWAS to Explore Fundamental Ques-
tions about Aging in the HRS Sample: An Expert Meeting; Workshop to Explore a Social
Science Genetic Association Consortium; 2010 and 2011 Integrating Genetics and Social
656 Benjamin et al.
Ann
u. R
ev. E
con.
201
2.4:
627-
662.
Dow
nloa
ded
from
ww
w.a
nnua
lrev
iew
s.or
gby
Cor
nell
Uni
vers
ity o
n 09
/07/
12. F
or p
erso
nal u
se o
nly.
Science Workshops; Disciplinary Perspectives on Gene-Environment Interactions Confer-
ence; and seminar audiences at Caltech, UCSD, Wharton, National University of Singapore,
NYU, and the University of Chicago. We are grateful to Jon Steinsson for advice in early stages
of this work and Jon Torfi Jonasson, Loftur Guttormsson, and Helgi Skuli Kjartansson for
advice in coding the Icelandic education variable. We thank Melissa Bickerman, Yeon Sik
Cho, Cara Costich, Geoffrey Fisher, Julia Goorin, Olafur Garðar Halldorsson, Sarina
Kumar, Alice Lee, Logan Pritchard, Nathaniel Schorr, Abhishek Shah, and Kristina Tobio
for excellent research assistance. We thank the NIA/NIH through grants P01AG005842-
20S2 and T32-AG000186-23 to NBER. The Swedish Twin Registry is supported by the
Swedish Department of Higher Education, the European Commission (grant QLG2-CT-2002-
01254), the Swedish Research Council, and the Swedish Foundation for Strategic Research.
Author affiliations are listed below:1Department of Economics, Cornell University, Ithaca, New York 14853; National
Bureau of Economic Research, Cambridge, Massachusetts 02138; email: [email protected] for Experimental Social Science and Department of Economics, New York
University, New York, NY 100123Department of Psychology, Union College, Schenectady, New York 123084Department of Economics, Harvard University, and National Bureau of Economic
Research, Cambridge, Massachusetts 021385Icelandic Heart Association, OS-201 Kopavogur, Iceland6Laboratory of Epidemiology, Demography, and Biometry, National Institute on Aging,
Bethesda, Maryland 280927Center for Human Genetics Research, Massachusetts General Hospital, Boston,
Massachusetts 021148Department of Economics, Stockholm School of Economics, SE-113 83 Stockholm,
Sweden9Department of Medical Epidemiology and Biostatistics, Karolinska Institutet, SE-171
77 Stockholm, Sweden10McKinsey Consulting, Montreal, H3B 4W8 Quebec, Canada11Department of Sociology, Harvard University, Cambridge, Massachusetts 02138;
Department of Health Care Policy, HarvardMedical School, Boston, Massachusetts 0211512Department of Medicine, University of Wisconsin-Madison, Madison, Wisconsin 5370513Department of Economics, Harvard University, Cambridge, Massachusetts 0213814Department of Sociology, Northwestern University, Evanston, Illinois 6020815Department of Sociology, University of Wisconsin-Madison, Madison, Wisconsin 53706
LITERATURE CITED
Apicella CL, Cesarini D, Johanneson M, Dawes CT, Lichtenstein P, et al. 2010. No association
between oxytocin receptor (OXTR) gene polymorphisms and experimentally elicited social pref-
erences. PLoS One 5:e11143
Barnea A, Cronqvist H, Siegel S. 2010. Nature or nurture: What determines investor behavior?
J. Financ. Econ. 98:583–604
Barnett JH, Scoriels L, Munafo MR. 2008. Meta-analysis of the cognitive effects of the catechol-O-
methyltransferase gene Val158/108Met polymorphism. Biol. Psychiatry 64:137–44
Beauchamp JP, Cesarini D, Johannesson M. 2011a. The psychometric properties of measures of
economic preferences. Unpublished manuscript, Harvard Univ.
www.annualreviews.org � The Promises and Pitfalls of Genoeconomics 657
Ann
u. R
ev. E
con.
201
2.4:
627-
662.
Dow
nloa
ded
from
ww
w.a
nnua
lrev
iew
s.or
gby
Cor
nell
Uni
vers
ity o
n 09
/07/
12. F
or p
erso
nal u
se o
nly.

Beauchamp JP, Cesarini D, Johannesson M, der Loos M, Koellinger P, et al. 2011b. Molecular
genetics and economics. J. Econ. Perspect. 25(4):1–27
Becker GS. 1993. Nobel lecture: the economic way of looking at behavior. J. Polit. Econ. 101:385–409
Becker GS, Tomes N. 1976. Child endowments and the quantity and quality of children. J. Polit.
Econ. 84:S143–62
Becker GS, Tomes N. 1986. Human capital and the rise and fall of families. J. Labor Econ. 4:S1–39
Benjamin DJ, Chabris CF, Glaeser EL, Gudnason V, Harris T, et al. 2007. Genoeconomics. In Biosocial
Surveys, ed. M Weinstein, JW Vaupel, KW Watcher, pp. 304–35. Washington, DC: Natl. Acad.
Benjamin DJ, Cesarini D, van der Loos MJHM, Dawes CT, Koellinger PD, et al. 2012.
The genetic architecture of economic and political preferences. Proc. Natl. Acad. Sci. USA
109:8026–31
Billings LK, Florez JC. 2010. The genetics of type 2 diabetes: What have we learned from GWAS?
Ann. N. Y. Acad. Sci. 1212:59–77
Bjorklund A, Jantti M, Solon G. 2005. Influences of nature and nurture on earnings variation: a report on
a study of various sibling types in Sweden. In Unequal Chances: Family Background and Economic
Success, ed. S Bowles, HGintis,MOsborneGroves, pp. 145–64. Princeton,NJ: PrincetonUniv. Press
Bouchard TJ, McGue M. 2003. Genetic and environmental influences on human psychological differ-
ences. J. Neurobiol. 54:4–45
Buzzi A, Wu Y, Frantseva MV, Perez Velazquez JL, Cortez MA, et al. 2006. Succinic semialdehyde
dehydrogenase deficiency: GABAB receptor-mediated function. Brain Res. 1090:15–22
Carpenter JP, Garcia JR, Lum JK. 2011. Dopamine receptor genes predict risk preferences, time
preferences, and related economic outcomes. J. Risk Uncertain. 42:233–61
Cawley J, Han E, Norton EC. 2011. The validity of genes related to neurotransmitters as instrumental
variables. Health Econ. 20:884–88
Cawley J, Heckman J, Vytlacil E. 2001. Three observations on wages and measured cognitive ability.
Labour Econ. 8:419–42
Cecil JE, Tavendale R, Watt P, Hetherington MM, Palmer CAN. 2008. An obesity-associated FTO
gene variant and increased energy intake in children. N. Engl. J. Med. 359:2558–66
Cesarini D, Dawes CT, Fowler J, Johannesson M, Lichtenstein P, Wallace B. 2008. Heritability of
cooperative behavior in the trust game. Proc. Natl. Acad. Sci. USA 105:3271–76
Cesarini D, Dawes CT, Johannesson M, Lichtenstein P, Wallace B. 2009. Genetic variation in prefer-
ences for giving and risk-taking. Q. J. Econ. 124:809–42
Cesarini D, Johannesson M, Lichtenstein P, Sandewall O, Wallace B. 2010. Genetic variation in
financial decision making. J. Finance 65:1725–54
Cesarini D, Johannesson M, Magnusson PKE, Wallace B. 2012. The behavioral genetics of behavioral
anomalies. Manag. Sci. 58:21–34
Chabris CF, Hebert BM, Benjamin DJ, Beauchamp J, Cesarini D, et al. 2012. Most published genetic
associations with general cognitive ability are false positives. Psychol. Sci. In press
Chen L, Davey Smith G, Harbord R, Lewis S. 2008. Alcohol intake and blood pressure: a systematic
review implementing Mendelian randomization approach. PLoS Med. 5:461–71
Conley D. 2009. The promise and challenges of incorporating genetic data into longitudinal social
science surveys and research. Biodemogr. Social Biol. 55:238–51
Crisan LG, Pana S, Vulturar R, Heilman RM, Szekely R, et al. 2009. Genetic contributions of the
serotonin transporter to social learning of fear and economic decision making. Soc. Cogn. Affect.
Neurosci. 4:399–408
Davey Smith G, Ebrahim S. 2003. ‘Mendelian randomization’: Can genetic epidemiology contribute
to understanding environmental determinants of disease? Int. J. Epidemiol. 32:1–22
Davies G, Tenesa A, Payton A, Yang J, Harris SE, et al. 2011. Genome-wide association studies
establish that human intelligence is highly heritable and polygenic. Mol. Psychiatry 16:996–1005
de Moor MHM, Costa PT, Terracciano A, Krueger RF, de Geus EJ, et al. 2012. Meta-analysis of
genome-wide association studies for personality. Mol. Psychiatry 17:337–49
658 Benjamin et al.
Ann
u. R
ev. E
con.
201
2.4:
627-
662.
Dow
nloa
ded
from
ww
w.a
nnua
lrev
iew
s.or
gby
Cor
nell
Uni
vers
ity o
n 09
/07/
12. F
or p
erso
nal u
se o
nly.
De Neve J-E. 2011. Functional polymorphism (5-HTTLPR) in the serotonin transporter gene is
associated with subjective well-being: evidence from a U.S. nationally representative sample.
J. Hum. Genet. 56:456–59
De Neve J-E, Fowler JH. 2010. The MAOA gene predicts credit card debt. Unpublished manuscript,
Univ. Coll. London
De Neve J-E, Fowler JH, Frey BS, Christakis NA. 2011. Genes, economics, and happiness.
Unpublished manuscript, Univ. Coll. London
De Rango F, Leone O, Dato S, Novelletto A, Bruni AC, et al. 2008. Cognitive functioning and survival
in the elderly: the SSADH C538T polymorphism. Ann. Hum. Genet. 72:630–35
Ding W, Lehrer S, Rosenquist N, Audrain-McGovern J. 2009. The impact of poor health on academic
performance: new evidence using genetic markers. J. Health Econ. 28:578–97
Dreber A, Apicella CL, Eisenberg DTA, Garcia JR, Zamore R, et al. 2009. The 7R polymorphism
in the dopamine receptor D4 gene (DRD4) is associated with financial risk-taking in men.
Evol. Hum. Behav. 30(2):85–92
Dreber A, Rand DG, Wernerfelt N, Garcia JR, Vilar MG, et al. 2011. Dopamine and risk choices in
different domains: findings among serious tournament bridge players. J. Risk Uncertain. 43:19–38
Duncan LE, Keller MC. 2011. A critical review of the first 10 years of candidate gene-by-environment
interaction research in psychiatry. Am. J. Psychiatry 168:1041–49
Ebstein RP, Israel S, Chew SH, Zhong S, Knafo A. 2010. Genetics of human social behavior. Neuron
65:831–44
Eisenberg DT, MacKillop J, Modi M, Beauchemin J, Dang D, et al. 2007. Examining impulsivity
as an endophenotype using a behavioral approach: a DRD2 TaqI A and DRD4 48-bp VNTR
association study. Behav. Brain Funct. 3:2
Falconer DS, MacKay TFC. 1996. Introduction to Quantitative Genetics. London: Benjamin Cummings
Fletcher J, Lehrer S. 2009. The effects of adolescent health on educational outcomes: causal evidence
using genetic lotteries between siblings. Forum Health Econ. Policy 12(2):8
Frayling TM, Timpson NJ, Weedon MN, Zeggini E, Freathy RM, et al. 2007. A common variant in
the FTO gene is associated with body mass index and predisposes to childhood and adult obesity.
Science 316:889–94
Freese J, Branigan AR, Atwood CS, Hauser TS, Benjamin DJ, et al. 2010. Taq1a and college atten-
dance, partisanship, voting, and other outcomes: replication attempts using the Wisconsin
Longitudinal Study. Unpublished manuscript, Northwestern Univ.
Frydman C, Camerer C, Bossaerts P, Rangel A. 2011. MAOA-L carriers are better at making optimal
financial decisions under risk. Proc. R. Soc. 278:2053–59
Goldberger A. 1979. Heritability. Economica 46:327–47
Hammock EA, Lim NM, Nair HP, Young LJ. 2005. Association of vasopressin 1a receptor levels with
a regulatory microsatellite and behavior. Genes Brain Behav. 4:289–301
Hammock EAD, Young LJ. 2002. Variation in the vasopressin V1a receptor promoter and
expression: implications for inter- and intra-specific variation in social behaviour. Eur. J. Neurosci.
16:399–402
Harris TB, Launer LJ, Eiriksdottir G, Kjartansson O, Jonsson PV, et al. 2007. Age, Gene/Environment
Susceptibility-Reykjavik Study: multidisciplinary applied phenomics. Am. J. Epidemiol. 165:1076–87
Hewitt JK. 2012. Editorial policy on candidate gene association and candidate gene-by-environment
interaction studies of complex traits. Behav. Genet. 42:1–2
Hirschhorn JN. 2009. Genomewide association studies: illuminating biologic pathways. N. Engl.
J. Med. 360:1699–701
Int. Schizophr. Consort., Purcell SM, Wray NR, Stone JL, Visscher PM, et al. 2009. Common poly-
genic variation contributes to risk of schizophrenia and bipolar disorder. Nature 460:748–52
Israel S, Lerer E, Shalev I, Uzefovsky F, Riebold M, et al. 2009. The oxytocin receptor (OXTR)
contributes to prosocial fund allocations in the dictator game and the social value orientations
task. PLoS One 4:e5535
www.annualreviews.org � The Promises and Pitfalls of Genoeconomics 659
Ann
u. R
ev. E
con.
201
2.4:
627-
662.
Dow
nloa
ded
from
ww
w.a
nnua
lrev
iew
s.or
gby
Cor
nell
Uni
vers
ity o
n 09
/07/
12. F
or p
erso
nal u
se o
nly.
Jang KL, Livesley WJ, Vernon PA. 1996. Heritability of the big five personality dimensions and their
facets: a twin study. J. Personal. 64:577–91
Jencks CS. 1980. Heredity, environment, and public policy reconsidered. Am. Sociol. Rev. 45:723–36
Knafo A, Israel S, Darvasi A, Bachner-Melman R, Uzefovsky F, et al. 2008. Individual differences in
allocation of funds in the dictator game associated with length of the arginine vasopressin 1a
receptor RS3 promoter region and correlation between RS3 length and hippocampal mRNA.
Genes Brain Behav. 7:266–75
Knerr I, Gibson KM, Jakobs C, Pearl PL. 2008. Neuropsychiatric morbidity in adolescent and adult
succinic semialdehyde dehydrogenase deficiency patients. CNS Spectr. 13:598–605
Kosfeld M, Heinrichs M, Zak PJ, Fischbacher U, Fehr E. 2005. Oxytocin increases trust in humans.
Nature 435:673–76
Kuhnen CM, Chiao JY. 2009. Genetic determinants of financial risk taking. PLoS One 4:e4362
Kuhnen CM, Samanez-Larkin GR, Knutson B. 2011. Serotonin and risk taking: How do genes change
financial choices? Unpublished manuscript, Kellogg Sch. Manag., Northwestern Univ.
Lander ES, Linton LM, Birren B, Nusbaum C, Zody MC, et al. 2001. Initial sequencing and analysis
of the human genome. Nature 409:860–921
Lander ES, Schork NJ. 1994. Genetic dissection of complex traits. Science 265:2037–48
Lango Allen H, Estrada K, Lettre G, Berndt SI, Weedon MN, et al. 2010. Hundreds of variants
clustered in genomic loci and biological pathways affect human height. Nature 467:832–38
Lawlor DA, Harbord RM, Sterne JAC, Timpson N, Smith GD. 2008. Mendelian randomization:
using genes as instruments for making causal inferences in epidemiology. Stat. Med. 27:1133–63
Lee JJ. 2010. Review of Intelligence and How to Get It: Why Schools and Cultures Count,
R.E. Nisbett, Norton, New York, NY (2009). Personal. Individ. Differ. 48:247–55
Leone O, Blasi P, Palmerio F, Kozlov AI, Malaspina P, Novelletto A. 2006. A human derived SSADH
coding variant is replacing the ancestral allele shared with primates. Ann. Hum. Biol. 33:593–603
Lichtenstein P, De Faire U, Floderus B, Svartengren M, Svedberg P, Pedersen NL. 2002. The Swedish
Twin Registry: a unique resource for clinical, epidemiological and genetic studies. J. Intern. Med.
252:184–205
Lizzeri A, Siniscalchi M. 2008. Parental guidance and supervised learning. Q. J. Econ. 123:1161–95
MacKinnon DP, Lockwood CM, Hoffman JM, West SG, Sheets V. 2002. A comparison of methods to
test mediation and other intervening variable effects. Psychol. Methods 7:83–104
Manski C. 2011. Genes, eyeglasses, and social policy. J. Econ. Perspect. 25(4):83–94
Martin NW, Medland SE, Verweij KJH, Lee SH, Nyholt DR, et al. 2011. Educational attainment: a
genome wide association study in 9538 Australians. PLoS One 6:e20128
Mazumder B. 2005. The apple falls even closer to the tree than we thought: new and revised estimates
of the intergenerational transmission of earnings. In Unequal Chances: Family Background and
Economic Success, ed. S Bowles, H Gintis, MOsborne Groves, pp. 80–89. Princeton, NJ: Princeton
Univ. Press
McDermottR, TingleyD,Cowden J, FrazzettoG, JohnsonD. 2009.MonoamineoxidaseA gene (MAOA)
predicts behavioral aggression following provocation.Proc.Natl. Acad. Sci. USA 106:2118–23
Natl. Cent. Biotechnol. Inf. 2012. dbSNP short genetic variations. http://www.ncbi.nlm.nih.gov/
SNP/snp_summary.cgi
Nicolaou N, Shane S, Adi G, Mangino M, Harris J. 2011. A polymorphism associated with entrepre-
neurship: evidence from dopamine receptor candidate genes. Small Bus. Econ. 36:151–55
Norton EC, Han E. 2008. Genetic information, obesity, and labor market outcomes. Health Econ.
17:1089–104
Obeidat M, Wain VL, Shrine N, Kalsheker N, Soler Artigas M, et al. 2011. A comprehensive evalua-
tion of potential lung function associated genes in the SpiroMeta general population sample.
PLoS One 6:e19382
Oster E, Shoulson I, Dorsey ER. 2012. Optimal expectations and limited medical testing: evidence
from Huntington disease. Am. Econ. Rev. In press
660 Benjamin et al.
Ann
u. R
ev. E
con.
201
2.4:
627-
662.
Dow
nloa
ded
from
ww
w.a
nnua
lrev
iew
s.or
gby
Cor
nell
Uni
vers
ity o
n 09
/07/
12. F
or p
erso
nal u
se o
nly.
Oster E, Shoulson I, Quaid KA, Dorsey ER. 2010. Genetic adverse selection: evidence from long-term
care insurance and Huntington disease. J. Public Econ. 94:1041–50
Panagiotou OA, Ioannidis JPA. 2012. What should the genome-wide significance threshold be?
Empirical replication of borderline genetic associations. Int. J. Epidemiol. 41:273–86
Payton A. 2009. The impact of genetic research on our understanding of normal cognitive ageing:
1995 to 2009. Neuropsychol. Rev. 19:451–77
Pence KM. 2006. The role of wealth transformations: an application to estimating the effect of tax
incentives on saving. Contrib. Econ. Anal. Policy 5(1):20
Pinker S. 2002. The Blank Slate: The Modern Denial of Human Nature. New York: Viking
Plomin R, DeFries JC, McClearn GE, McGuffin P. 2008. Behavioral Genetics. New York: Worth
Plomin R, Owen MJ, McGuffin P. 1994. The genetic basis of complex human behaviors. Science
264:1733–39
Plomin R, Turic DM, Hill L, Turic DE, Stephens M, et al. 2004. A functional polymorphism in the
succinate-semialdehyde dehydrogenase (aldehyde dehydrogenase 5 family, member A1) gene is
associated with cognitive ability. Mol. Psychiatry 9:582–86
Price AL, Helgason A, Palsson S, Stefansson H, St. Clair D, et al. 2009. The impact of divergence time
on the nature of population structure: an example from Iceland. PLoS Genet. 5(6):1–10
Price AL, Patterson NJ, Plenge RM, Weinblatt ME, Shadick NA, et al. 2006. Principal components
analysis corrects for stratification in genome-wide association studies. Nat. Genet. 38:904–9
Psaty B, O’Donnell CJ, Gudnason V, Lunetta KL, Folsom AR, et al. 2009. Cohorts for Heart and
Aging Research in Genomic Epidemiology (CHARGE) Consortium: design of prospective meta-
analysis of genome-wide association studies from 5 cohorts. Circ. Cardiovasc. Genet. 2:73–80
Purcell S, Cherny SS, Sham PC. 2003. Genetic Power Calculator: design of linkage and association
genetic mapping studies of complex traits. Bioinformatics 19:149–50
Roe BE, Tilley MR, Gu HH, Beversdorf DQ, Sadee W, et al. 2010. Financial and psychological risk
attitudes associated with two single nucleotide polymorphisms in the nicotine receptor (CHRNA4)
gene. PLoS One 4:e6704
Rosenquist JN, O’Malley AJ, Lehrer SF, Zaslavsky A, Smoller JW, Christakis NA. 2012. Genotype-
phenotype association of FTO with body mass index is modified by birth era. Unpublished
manuscript, Harvard Univ.
Rowe DC, Vesterdal WJ, Rodgers JL. 1999. Herrnstein’s syllogism: genetic and shared environmental
influences on IQ, education and income. Intelligence 26:405–23
Sacerdote B. 2010. Nature and nurture effects on children’s outcomes: What have we learned from
studies of twins and adoptees? In Handbook of Social Economics, Vol. 1A, ed. J Benhabib,
M Jackson, A Bisin, pp. 1–30. Amsterdam: North Holland
Schumacher J, Hoffman P, Schmal C, Schulte-Korne G, Nothen M. 2007. Genetics of dyslexia: the
evolving landscape. J. Med. Genet. 44:289–97
Silventoinen K, Sammalisto S, Perola M, Boomsma DI, Cornes BK, et al. 2003. Heritability of adult body
height: a comparative study of twin cohorts in eight countries. Twin Res. Hum. Genet. 6:399–408
Solon GR. 1992. Intergenerational income mobility in the United States. Am. Econ. Rev. 82:393–408
Stenberg A. 2011. Nature or nurture? A note on the misinterpreted twin decomposition. Work. Pap.
4 /2011, Swed. Inst. Soc. Res. (SOFI), Stockholm
St. George-Hyslop PH. 2000. Molecular genetics of Alzheimer’s disease. Biol. Psychiatry 47:183–99
Strittmatter WJ, Saunders AM, Schmechel D, Pericak-Vance M, Enghild J, et al. 1993. Apolipoprotein
E: high avidity binding to b-amyloid and increased frequency of type 4 allele in late-onset familial
Alzheimer disease. Proc. Natl. Acad. Sci. USA 90:1977–81
Taubman P. 1976. The determinants of earnings: genetics, family, and other environments; a study of
white male twins. Am. Econ. Rev. 66:858–70
Tung YC, Yeo GS. 2011. From GWAS to biology: lessons from FTO. Ann. N. Y. Acad. Sci. 1220:162–71
Turkheimer E. 2000. Three laws of behavior genetics and what they mean. Curr. Dir. Psychol. Sci.
9:160–64
www.annualreviews.org � The Promises and Pitfalls of Genoeconomics 661
Ann
u. R
ev. E
con.
201
2.4:
627-
662.
Dow
nloa
ded
from
ww
w.a
nnua
lrev
iew
s.or
gby
Cor
nell
Uni
vers
ity o
n 09
/07/
12. F
or p
erso
nal u
se o
nly.
van der Loos MJHM, Koellinger PD, Groenen PJF, Thurik AR. 2010. Genome-wide association
studies and the genetics of entrepreneurship. Eur. J. Epidemiol. 25:1–3
van der Loos MJHM, Koellinger PD, Groenen PJF, Rietveld CA, Rivadeneira F, et al. 2011. Candidate
gene studies and the quest for the entrepreneurial gene. Small Bus. Econ. 37:269–75
Venter CJ, Adams MD, Myers EW, Li PW, Mural RJ, et al. 2001. The sequence of the human genome.
Science 291:1304–51
Vinkhuyzen AAE, Pedersen NL, Yang J, Lee SH, Magnusson PKE, et al. 2012. Common SNPs
explain some of the variation in the personality dimensions of neuroticism and extraversion.
Transl. Psychiatry 2:e102
Visscher PM, Hill WG, Wray NR. 2008. Heritability in the genomics era: concepts and misconcep-
tions. Nat. Rev. Genet. 9:255–66
von Hinke Kessler Scholder S, Davey Smith G, Lawlor DA, Propper C, Windmeijer F. 2010. Genetic
markers as instrumental variables: an application to child fat mass and academic achievement.
Work. Pap. 10/229, Univ. Bristol
Wallace B, Cesarini D, Lichtenstein P, Johannesson M. 2007. Heritability of ultimatum game
responder behavior. Proc. Natl. Acad. Sci. USA 104:15631–64
Williams H. 2010. Intellectual property rights and innovation: evidence from the human genome.
NBERWork. Pap. 16213
Yang J, Benyamin B, McEvoy BP, Gordon S, Henders AK, et al. 2010. Common SNPs explain a large
proportion of the heritability for human height. Nat. Genet. 42:565–69
Zhong S, Chew SH, Set E, Zhang J, Xue H, et al. 2009a. The heritability of attitude toward economic
risk. Twin Res. Hum. Genet. 12(1):103–7
Zhong S, Israel S, Xue H, Ebstein RP, Chew SH. 2009b. Monoamine oxidase A gene (MAOA)
associated with attitude towards longshot risks. PLoS One 4:e8516
Zhong S, Israel S, Xue H, Ebstein RP, Chew SH. 2010. Dopamine D4 receptor gene associated with
fairness preference in ultimatum game. PLoS One 5:e13765
Zhong S, Israel S, Xue H, Sham PC, Ebstein RP, Chew SH. 2009c. A neurochemical approach to
valuation sensitivity over gains and losses. Proc. Biol. Sci. 276:4181–88
Zimmerman D. 1992. Regression toward mediocrity in economic stature. Am. Econ. Rev. 82:409–29
Zyphur M, Narayanan J, Arvey R, Alexander G. 2009. The genetics of economic risk preferences.
J. Behav. Decis. Making 22:367–77
662 Benjamin et al.
Ann
u. R
ev. E
con.
201
2.4:
627-
662.
Dow
nloa
ded
from
ww
w.a
nnua
lrev
iew
s.or
gby
Cor
nell
Uni
vers
ity o
n 09
/07/
12. F
or p
erso
nal u
se o
nly.
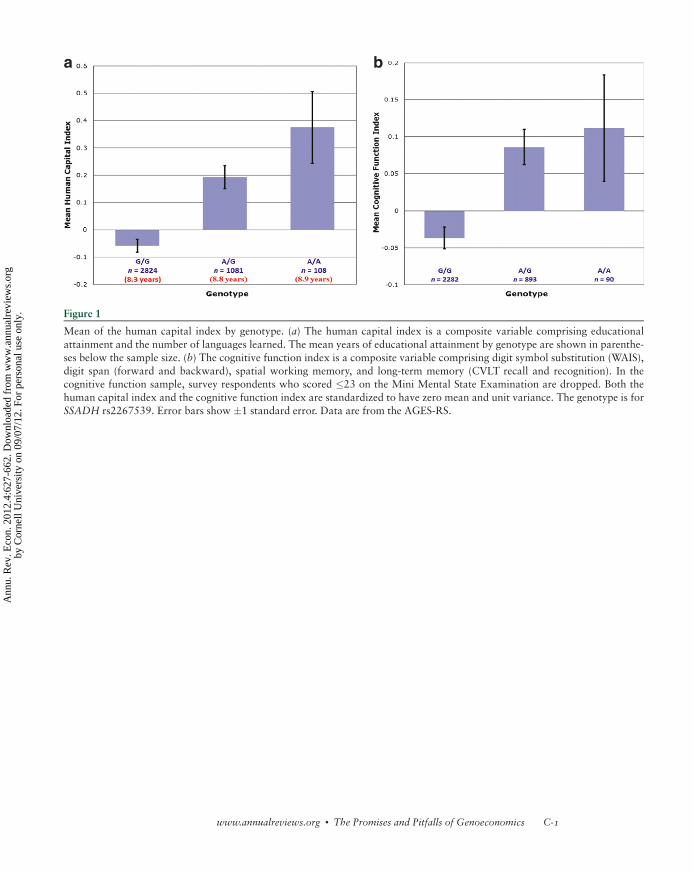
a b
Figure 1
Mean of the human capital index by genotype. (a) The human capital index is a composite variable comprising educational
attainment and the number of languages learned. The mean years of educational attainment by genotype are shown in parenthe-
ses below the sample size. (b) The cognitive function index is a composite variable comprising digit symbol substitution (WAIS),
digit span (forward and backward), spatial working memory, and long-term memory (CVLT recall and recognition). In thecognitive function sample, survey respondents who scored 23 on the Mini Mental State Examination are dropped. Both the
human capital index and the cognitive function index are standardized to have zero mean and unit variance. The genotype is for
SSADH rs2267539. Error bars show 1 standard error. Data are from the AGES-RS.
www.annualreviews.org � The Promises and Pitfalls of Genoeconomics C-1
Ann
u. R
ev. E
con.
201
2.4:
627-
662.
Dow
nloa
ded
from
ww
w.a
nnua
lrev
iew
s.or
gby
Cor
nell
Uni
vers
ity o
n 09
/07/
12. F
or p
erso
nal u
se o
nly.
v
Annual Review of
Economics
Volume 4, 2012Contents
Paul Samuelson’s LegacyAvinash Dixit . . . . . . . . . . . . . . . . . . . . . . . . . . . . . . . . . . . . . . . . . . . . . . 1
Saving Money or Just Saving Lives? Improving the Productivity of US Health Care SpendingKatherine Baicker, Amitabh Chandra, and Jonathan S. Skinner . . . . . . . . 33
International Comparisons in Health Economics: Evidence from Aging StudiesJames Banks and James P. Smith . . . . . . . . . . . . . . . . . . . . . . . . . . . . . . . 57
Rare Macroeconomic DisastersRobert J. Barro and José F. Ursúa . . . . . . . . . . . . . . . . . . . . . . . . . . . . . . 83
Endogenous Extreme Events and the Dual Role of PricesJon Danielsson, Hyun Song Shin, and Jean-Pierre Zigrand . . . . . . . . . . 111
The Distribution of Teacher Quality and Implications for PolicyEric A. Hanushek and Steven G. Rivkin . . . . . . . . . . . . . . . . . . . . . . . . 131
Economic Modeling and Analysis of Educational VouchersDennis Epple and Richard Romano . . . . . . . . . . . . . . . . . . . . . . . . . . . 159
Heterogeneity in Human Capital Investments: High School Curriculum, College Major, and CareersJoseph G. Altonji, Erica Blom, and Costas Meghir . . . . . . . . . . . . . . . . 185
Credit Constraints in EducationLance Lochner and Alexander Monge-Naranjo . . . . . . . . . . . . . . . . . . . 225
New Perspectives on Statistical Decisions Under AmbiguityJörg Stoye . . . . . . . . . . . . . . . . . . . . . . . . . . . . . . . . . . . . . . . . . . . . . . . 257
The Empirics of Firm Heterogeneity and International Trade Andrew B. Bernard, J. Bradford Jensen, Stephen J. Redding, and Peter K. Schott . . . . . . . . . . . . . . . . . . . . . . . . . . . . . . . . . . . . . . . . 283
Natural Resource Wealth: The Challenge of Managing a WindfallFrederick van der Ploeg and Anthony J. Venables . . . . . . . . . . . . . . . . . 315
Ann
u. R
ev. E
con.
201
2.4:
627-
662.
Dow
nloa
ded
from
ww
w.a
nnua
lrev
iew
s.or
gby
Cor
nell
Uni
vers
ity o
n 09
/07/
12. F
or p
erso
nal u
se o
nly.
The Economics and Politics of Women’s RightsMatthias Doepke, Michèle Tertilt, and Alessandra Voena . . . . . . . . . . . 339
Recent Developments in the Economics of Time UseMark Aguiar, Erik Hurst, and Loukas Karabarbounis . . . . . . . . . . . . . . 373
Life-Cycle Wage Growth and Heterogeneous Human CapitalCarl Sanders and Christopher Taber . . . . . . . . . . . . . . . . . . . . . . . . . . . 399
Behavioral Economics and Psychology of IncentivesEmir Kamenica . . . . . . . . . . . . . . . . . . . . . . . . . . . . . . . . . . . . . . . . . . . 427
The Relationship Between Economic Preferences and Psychological Personality Measures Anke Becker, Thomas Deckers, Thomas Dohmen, Armin Falk, and Fabian Kosse . . . . . . . . . . . . . . . . . . . . . . . . . . . . . . . . . . . . . . . . . 453
Corruption in Developing CountriesBenjamin A. Olken and Rohini Pande . . . . . . . . . . . . . . . . . . . . . . . . . . 479
A Reduced-Form Approach to Behavioral Public FinanceSendhil Mullainathan, Joshua Schwartzstein, and William J. Congdon . . . . . 511
Recent Research on the Economics of PatentsBronwyn H. Hall and Dietmar Harhoff . . . . . . . . . . . . . . . . . . . . . . . . 541
Probability and Risk: Foundations and Economic Implications of Probability-Dependent Risk PreferencesHelga Fehr-Duda and Thomas Epper . . . . . . . . . . . . . . . . . . . . . . . . . . 567
The Theory of Clubs and Competitive CoalitionsMyrna Wooders . . . . . . . . . . . . . . . . . . . . . . . . . . . . . . . . . . . . . . . . . . . 595
The Promises and Pitfalls of Genoeconomics Daniel J. Benjamin, David Cesarini, Christopher F. Chabris, Edward L. Glaeser, David I. Laibson, Vilmundur Guðnason, Tamara B. Harris, Lenore J. Launer, Shaun Purcell, Albert Vernon Smith, Magnus Johannesson, Patrik K.E. Magnusson, Jonathan P. Beauchamp, Nicholas A. Christakis, Craig S. Atwood, Benjamin Hebert, Jeremy Freese, Robert M. Hauser, Taissa S. Hauser, Alexander Grankvist, Christina M. Hultman, and Paul Lichtenstein . . . . . . . . . . . . . . . . . . . . 627
Indexes
Cumulative Index of Contributing Authors, Volumes 1–4 . . . . . . . . . . . . . 663Cumulative Index of Chapter Titles, Volumes 1–4 . . . . . . . . . . . . . . . . . . . 665
Errata
An online log of corrections to Annual Review of Economicsarticles may be found at http://econ.annualreviews.org
vi Contents
Ann
u. R
ev. E
con.
201
2.4:
627-
662.
Dow
nloa
ded
from
ww
w.a
nnua
lrev
iew
s.or
gby
Cor
nell
Uni
vers
ity o
n 09
/07/
12. F
or p
erso
nal u
se o
nly.
Related Documents