EI JR 12 - 114 THE PROJECT FOR RURAL ROAD NETWORK DEVELOPMENT IN ACHOLI SUB-REGION IN NORTHERN UGANDA FINAL REPORT VOLUME 2: MAIN REPORT APRIL 2012 JAPAN INTERNATIONAL COOPERATION AGENCY ORIENTAL CONSULTANTS CO., LTD. EIGHT-JAPAN ENGINEERING CONSULTANTS INC. INTERNATIONAL DEVELOPMENT CENTER OF JAPAN MINISTRY OF WORKS AND TRANSPORT (MOWT) THE REPUBLIC OF UGANDA

Welcome message from author
This document is posted to help you gain knowledge. Please leave a comment to let me know what you think about it! Share it to your friends and learn new things together.
Transcript
E IJ R
12-114
THE PROJECT FOR
RURAL ROAD NETWORK DEVELOPMENT IN ACHOLI SUB-REGION
IN NORTHERN UGANDA
FINAL REPORT
VOLUME 2: MAIN REPORT
APRIL 2012
JAPAN INTERNATIONAL COOPERATION AGENCY
ORIENTAL CONSULTANTS CO., LTD. EIGHT-JAPAN ENGINEERING CONSULTANTS INC.
INTERNATIONAL DEVELOPMENT CENTER OF JAPAN
MINISTRY OF WORKS AND TRANSPORT (MOWT)THE REPUBLIC OF UGANDA

The exchange rate applied in this Study is:
1.00 USD = 2,522.7 Ushs.* (Ugandan Shillings)
(*The average exchange rate in 2011)

SOUTH
Nwoya
Gulu
Lamwo
Kitgum
Pader Agago
AcholiSub-region
Amuru
REPUBLIC OF UGANDA
UGANDA
Kampala
■Area 241 thousand km2■GNI per capita US$ 460 (2009, WB)
■Population 32.7 million (2009,WB) ■Economic Growth
7.0% (2009, WB)
■Capital Kampala (with a population of 1.2 million in 2002)
■Ethnic Groups
Buganda, Langi, Acholi etc.
■MajorEconomicSectors
[Agriculture] Fish, Coffee, Tea, Cotton [Mining] Copper, Mineral Phosphate, Tungsten [Industry] Textiles, Tobacco, Cement
■Language English, Swahili, Luganda, etc ■Religion Christian (60%), Traditional Belief (30%),
Muslim (10%)
■Currency Ugandan Shillings (Ushs.)
Location Map of Study Area

The Project for Rural Road Network Development in Acholi Sub-region in Northern Uganda Final Report Vol.2: Main Report
Outline of the Project 1. Country: Republic of Uganda
2. Project Name: The Project for Rural Road Network Development in Acholi Sub-region in Northern Uganda
3. Execution Agency: Ministry of Works and Transport (MoWT)
4. Study Objective: The overall goal of the Study is to accelerate the IDP’s resettlement process and to improve the livelihood of people who have returned to their original place through establishing a Master Plan for the rural road network and enhancing regional development in Northern Uganda.
5. Study Contents:
1) Establishing a Regional Development Plan
To establish mid term (2018) and long term (2030) regional development plans for Acholi Sub-region through SWOT analysis based on a social situation survey.
2) Current Road Condition Survey
To comprehend road operation and maintenance issues and future traffic demands in Acholi Sub-region through traffic and road inventory surveys.
3) Establishing Rural Road Network Master Plan
To propose a Rural Road Network Plan which will have positive effects on the regional development plan for Acholi sub-region. To select priority projects which are to be realized within the target years of mid term (2018) and long term (2030).
4) Implementation of Pilot Projects
To study an appropriate organizational structure for Community Access Road (CAR) maintenance work adopting Labour Based Technology (LBT) involving MELTC and the District engineer as well as the sub-county officers.
5) Selecting High Priority projects
To select high priority projects to be realized immediately and to prepare preliminary design, cost estimation and “IEE level” environmental studies on those high priority projects in order to support the Ugandan side in attempting to obtain financing for the projects.
6) Technical Transfer
To implement technical transfer regarding Road Network Master Planning to district engineers. To implement technical transfer of GIS to district and MoWT engineers.
6. Study Results and Recommendations
(1) Study Results
1) Based on the existing development plans and relationship between South Sudan and Acholi Sub-region, a spatial structure for future Acholi Sub-region with a “Double Corridor” was proposed. The double corridor consists of two international roads, namely the “Kampala- Gulu- Juba” route and the “Lira- Kitgum- Torit” route.
2) One of the goals of mid-term (2018) regional development is “to improve accessibility to social services”. Community Access Roads (CARs) have an important role in achieving that goal, therefore, the best maintenance method to maintain CARs in good condition through daily and periodic maintenance was studied by implementing pilot projects. As a result, it was found that involving MELTC is important, especially to adopt LBT, which is expected to benefit IDP returnees. As for LBT, it was also confirmed that the “Donou Method” is quite useful for the maintenance work.
3) The other goals of mid-term (2018) regional development are “to increase production of commercial agriculture and to encourage inter and intra regional trade and commerce” and “to promote small and medium scale industry”. In order to achieve these goals, three alternatives for the road network were studied and evaluated by a “Strategic Environmental Assessment”. As a result, it was found that the alternative that considered a balance of economically focused and environmentally focused criteria is the most appropriate for the road network in Acholi Sub-region. The priority projects have been derived from this study and the result of reviews of reports regarding such projects as the “Municipal road improvement” and “public transportation improvement”.
4) Regarding the action plan for high priority projects, it is recommended that two national road projects (IR1 and IR2) are to be listed in the next phase of the Road Sector Development Plan (RSDP). One of the national road projects, IT1, has high feasibility; therefore, it is recommended to apply foreign loan assistance. Gulu Municipal Roads Improvement project is recommended to apply for a Japanese Grant Aid Program, and MoWT has prepared the application.
(2) Recommendations
1) In order to expand economic activities in Acholi Sub-region, It is recommended to start the High Priority Projects as soon as possible, expecting the synergic effects with the loan projects currently in progress between Gulu and Nimule.
2) In the rural area of Acholi Sub-region where almost all IDP had already resettled, it is expected to activate the regional economy through exploiting the close market of South Sudan and providing technical assistance which will lead the current dominant subsistence agriculture into commercial agriculture.
3) For two major service centres, Gulu city and Kitgum city, it is recommended to promote small and medium scale industries such as food and processing, through providing software measures such as the “borderless framework” and “deregulation of taxation” as well as hardware measures such as developing infrastructure and future land use plans.
4) It is viewed that “capacity development” for each district will be required considering the new government policy of using a “force account” to maintain district roads. Regarding maintenance of CARs, improvement of management ability of contractors and awareness-rising for residents regarding LBT will also be required. To respond to these requirements, it is recommended to request “technical assistance programs” provided by donor countries including Japan.
5) It is recommended to utilize GIS maps for appealing the priority of specific projects among the road sector development plan, with cooperation of MoWT in the field of graphic processing.

The Project for Rural Road Network Development in Acholi Sub-region in Northern Uganda Final Report Vol.2: Executive Summary
1. INTRODUCTION
Northern Uganda currently has the largest proportion of people living in poverty in the country, estimated to account for 61 % of the region's population, or almost twice the national level. This high level of poverty can be attributed to the Lord's Resistance Army (LRA) insurgency. In particular, 90 % of the population were displaced (IDP: Internally Displaced Person) from their original villages in the Acholi Sub-region. Basic infrastructure, especially road infrastructure, deteriorated in Northern Uganda due to the 20 year-conflict.
In 2009, the Government of Uganda submitted an application to Japan for “The Project for Rural Road Network Planning in Northern Uganda (hereinafter called the Previous Survey)” in order to support the lagging two districts; Amuru and Nwoya. The Previous Survey has been conducted by JICA since August 2009 and the Master Plan for Rural Road Network was proposed.
Although the Previous Survey targeted only Amuru and Nwoya Districts, the methods and techniques for master planning explored in the Previous Survey were applicable to the wider Acholi Sub-region in Northern Uganda. The overall goal of this Survey is to accelerate IDPs' resettlement process in the whole Acholi Sub-region and to improve the livelihood of people who have returned to their original place of residence through establishing a Master Plan for the rural road network and enhancing regional development in Northern Uganda.
2. REGIONAL CONTEXT: NORTHERN UGANDA AND ACHOLI SUB-REGION
In the 1970s, the former Acholi Province was divided into Gulu and Kitgum Districts. In 2001, two counties of Kitgum District were broken off and a new district, Pader District, was made out of them. In July 2006, Kilak and Nwoya Counties of Gulu District were carved out and became Amuru District. Furthermore, Lamwo County of Kitgum District was upgraded to a new district in early 2010. Nwoya County of Amuru District and Agago County of Pader District were also upgraded to new districts in July 2010. As a result, at present, Acholi Sub-region is composed of seven districts.
The area of Acholi Sub-region is 28,279 square km, which accounts for 12% of the total area of Uganda. In August 2009, the population of Acholi Sub-region was about 1,227,000 which accounted for 4% of the total population of Uganda.
Table 2-1 shows population of IDP camps, transit sites and home villages in seven districts in Acholi Sub-region in 2011. In Acholi Sub-region, 0.2% of the population still lives in the camps, 4.2% in transit sites and 95.7% in home villages. Among the districts, 8.2% of the population still lives in transit sites in Pader and Agago Districts, while 0.8% of the population lives in transit sites in Gulu District. On the other hand, 99% of the population lives in home villages in Gulu District, while 91.8% of the population lives in home villages in Pader and Agago Districts.
ES-1

Table 2-1 Population of IDP Camps, Transit Sites, and Home Villages, July 2011
District
Total Population in District (counted)
Number of IDP
Camps
Population in IDP Camps
(% in IDP Camps)
Number of Transit
Sites
Population in Transit Sites
(% in Transit Sites)
Population in Home Village
(% in Home Villages)
Amuru Nwoya
275,439 0 0 (0.0%) 50 11,268 (4.1%) 264,171 (95.9%)
Gulu 234,762 1 366 (0.2%) 13 1,963 (0.8%) 232,433 (99.0%) Kitgum Lamwo
328,819 6 2669 (0.8%) 65 6,582 (2.0%) 319,568 (97.2%)
Pader Agago
397,416 1 27 (0.0%) 154 32,546 (8.2%) 364,843 (91.8%)
Total 1,236,436 8 3062 (0.2%) 282 52,359 (4.2%) 1,181,015 (95.5%)
Source: UNHCR
3. PRESENT STATUS OF STUDY AREA
Acholi Sub-region enjoys dry and rainy seasons same as the rest of Uganda. The rainy season runs from late March to the end of November and hits two peaks in a year. The average rainfall was approximately 1,450mm per annum during 2006 to 2010. Compared to the southern part of Uganda, such as Kampala, the rainy and dry seasons in Acholi Sub-region are clearly distinct in terms of rainfall.
0
50
100
150
200
250
Jan Feb Mar Apr May Jun Jul Aug Sep Oct Nov Dec
mm
month
Gulu
Kampala
Source: Statistical Abstract 2011, UBOS
Figure 3-1 Average Rainfall in Gulu and Kampala 2006 - 2010
In Uganda, the local government is made up of five levels of hierarchy, i.e. from LC5 to LC1. LC5 is District, LC4 is County, LC3 is Sub-county, LC2 is Parish and LC1 is Village. The District Council is the highest decision-making body with fully-fledged legislative and executive powers. The District Chairperson, who is elected through universal adult suffrage, is the political head of the District. The Chief Administrative Officer (CAO), who is appointed by the District Service Commission (DSC), is the administrative head of the District, and is the chief accounting officer for the district.
Agriculture is the backbone of the regional economy in Acholi Sub-region. The major source of household incomes is sale of crops. More than 80% of the population is estimated to engage in agriculture based upon the interviews with district offices in Acholi Sub-region. Maize, sorghum and millet are principal foods for the people living in the study area. Upland rice is recently in fashion to be grown up as a cash crop. Cotton once came down in price however it has tended to recover recently. Estimated production in Acholi Sub-region per year is 90,000ton of Cassava, 46,000ton of Sorghum and 34,000ton of Ground nuts. Sweet potato and cassava can be harvested over a relatively long period and as a result, it is planted for food security as well.
ES-2
The Project for Rural Road Network Development in Acholi Sub-region in Northern Uganda Final Report Vol.2: Executive Summary
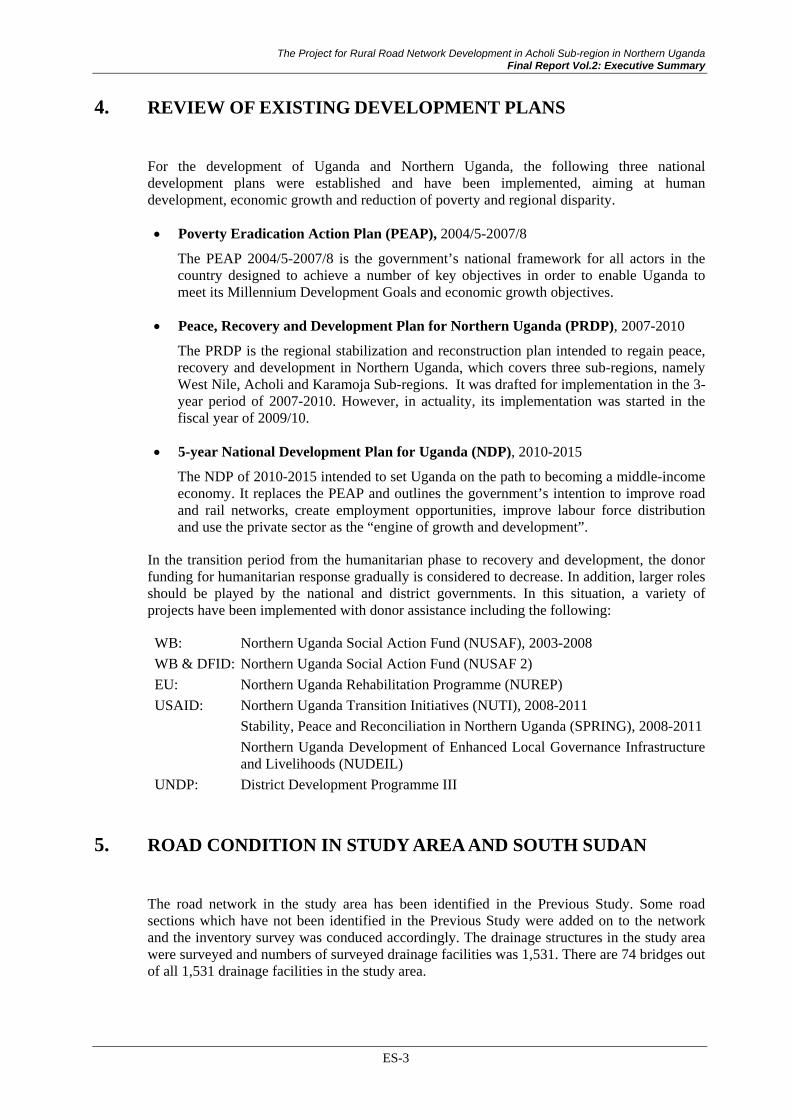
4. REVIEW OF EXISTING DEVELOPMENT PLANS
For the development of Uganda and Northern Uganda, the following three national development plans were established and have been implemented, aiming at human development, economic growth and reduction of poverty and regional disparity.
Poverty Eradication Action Plan (PEAP), 2004/5-2007/8
The PEAP 2004/5-2007/8 is the government’s national framework for all actors in the country designed to achieve a number of key objectives in order to enable Uganda to meet its Millennium Development Goals and economic growth objectives.
Peace, Recovery and Development Plan for Northern Uganda (PRDP), 2007-2010
The PRDP is the regional stabilization and reconstruction plan intended to regain peace, recovery and development in Northern Uganda, which covers three sub-regions, namely West Nile, Acholi and Karamoja Sub-regions. It was drafted for implementation in the 3-year period of 2007-2010. However, in actuality, its implementation was started in the fiscal year of 2009/10.
5-year National Development Plan for Uganda (NDP), 2010-2015
The NDP of 2010-2015 intended to set Uganda on the path to becoming a middle-income economy. It replaces the PEAP and outlines the government’s intention to improve road and rail networks, create employment opportunities, improve labour force distribution and use the private sector as the “engine of growth and development”.
In the transition period from the humanitarian phase to recovery and development, the donor funding for humanitarian response gradually is considered to decrease. In addition, larger roles should be played by the national and district governments. In this situation, a variety of projects have been implemented with donor assistance including the following:
WB: Northern Uganda Social Action Fund (NUSAF), 2003-2008
WB & DFID: Northern Uganda Social Action Fund (NUSAF 2)
EU: Northern Uganda Rehabilitation Programme (NUREP)
USAID: Northern Uganda Transition Initiatives (NUTI), 2008-2011
Stability, Peace and Reconciliation in Northern Uganda (SPRING), 2008-2011
Northern Uganda Development of Enhanced Local Governance Infrastructure and Livelihoods (NUDEIL)
UNDP: District Development Programme III
5. ROAD CONDITION IN STUDY AREA AND SOUTH SUDAN
The road network in the study area has been identified in the Previous Study. Some road sections which have not been identified in the Previous Study were added on to the network and the inventory survey was conduced accordingly. The drainage structures in the study area were surveyed and numbers of surveyed drainage facilities was 1,531. There are 74 bridges out of all 1,531 drainage facilities in the study area.
ES-3

Source: JICA Study Team Source: JICA Study Team Figure 5-1 Location of Existing Bridges Figure 5-2 Location of Existing Culverts
South Sudan and Uganda have had strong ties, even before the independence, because of their common historical and ethnic background. Recently, many Sudanese tourists are observed in Gulu town and it was realized that their purpose of travelling to Gulu was to purchase daily necessities. Cross-border trade, especially exports from Uganda to Sudan, have remarkably increased since 2007.
Despite the fact that the road had been identified as an international corridor connecting South Sudan, Uganda and Kenya, the existing road had not been tarmacked and no proper drainage system had been provided either. As the importance of the road was recognized in terms of providing good transport to South Sudan, the rehabilitation project to upgrade it to a bituminous standard (DBST) road was formulated by the development partners. The road is divided into 3 sections in terms of financial resources in its implementation. The first section (Gulu –Atiak, 67km) is financed by WB, the second section (Atiak- Nimule, 34.9km) is financed by JICA and the third section (Nimule-Juba, 192km) is financed by USAID.
The priority sections of Community Access Roads (CARs) which are required to be motorized roads was selected based on the social impact point of view by each sub-county in Acholi Sub-region as shown in Figure 5-3.
Figure 5-3 Acholi Road Network includes Priority Sections of CARs Source: JICA Study Team
ES-4

The Project for Rural Road Network Development in Acholi Sub-region in Northern Uganda Final Report Vol.2: Executive Summary
6. TRAFFIC SURVEY
A Cordon-line Traffic Survey was conducted at 14 locations mainly located along the national roads at district boundaries. The following map shows the survey locations.
Source: JICA Study Team
Figure 6-1 Cordon-line (Traffic Count) Survey Locations
The survey was performed for two consecutive days on working days. Time of the survey was 12 hours (from 7:00 a.m. to 7:00 p.m.) for each survey location. Average daily traffic count results at the survey stations are shown in Table 6-1.
Table 6-1 Traffic Count Results Category/Stations C1 C2 C3 C4 C5 C6 C7 C8 C9 C10 C11 C12
Vehicle 52 18 281 168 39 120 37 172 35 952 1,047 106
Motor-Bike 34 21 84 155 140 82 58 60 170 510 2,418 115
Bicycle/Cart 99 122 414 488 475 157 242 189 376 532 604 140
Pedestrian 234 192 1,108 906 1,181 445 443 837 796 389 784 187
Source: JICA Study Team
7. SOCIO ECONOMIC FRAMEWORK IN THE STUDY AREA
The following table tabulates the population projections in Acholi Sub-region.
Table 7-1 Summary of Results of Population Projection in the Study Area
District / Sub-county 2010 2018 2030 Growth Rate
(2010/18) Growth Rate
(2018/30)
Gulu District 374,900 462,700 619,900 2.7% 2.5%
Kitgum District 228,900 309,600 475,300 3.8% 3.6%
Lamwo District 158,100 213,500 328,000 3.8% 3.6%
Pader District 210,100 306,900 529,900 4.9% 4.7%
Agago District 271,700 396,900 685,300 4.9% 4.7%
Study Area 1,243,700 1,689,600 2,638,400 3.9% 3.8%
Source: JICA Study Team
ES-5
8. REGIONAL DEVELOPMENT ISSUES IN THE STUDY AREA
(1) Land Development Issues
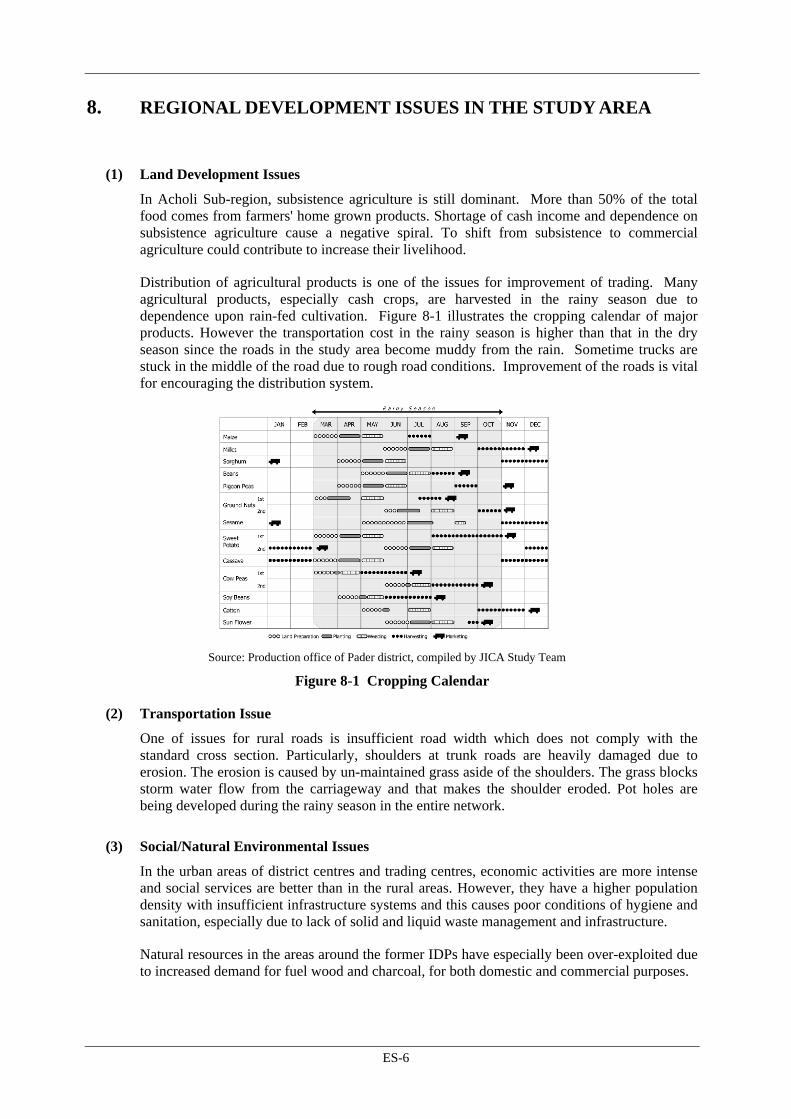
In Acholi Sub-region, subsistence agriculture is still dominant. More than 50% of the total food comes from farmers' home grown products. Shortage of cash income and dependence on subsistence agriculture cause a negative spiral. To shift from subsistence to commercial agriculture could contribute to increase their livelihood.
Distribution of agricultural products is one of the issues for improvement of trading. Many agricultural products, especially cash crops, are harvested in the rainy season due to dependence upon rain-fed cultivation. Figure 8-1 illustrates the cropping calendar of major products. However the transportation cost in the rainy season is higher than that in the dry season since the roads in the study area become muddy from the rain. Sometime trucks are stuck in the middle of the road due to rough road conditions. Improvement of the roads is vital for encouraging the distribution system.
Source: Production office of Pader district, compiled by JICA Study Team
Figure 8-1 Cropping Calendar
(2) Transportation Issue
One of issues for rural roads is insufficient road width which does not comply with the standard cross section. Particularly, shoulders at trunk roads are heavily damaged due to erosion. The erosion is caused by un-maintained grass aside of the shoulders. The grass blocks storm water flow from the carriageway and that makes the shoulder eroded. Pot holes are being developed during the rainy season in the entire network.
(3) Social/Natural Environmental Issues
In the urban areas of district centres and trading centres, economic activities are more intense and social services are better than in the rural areas. However, they have a higher population density with insufficient infrastructure systems and this causes poor conditions of hygiene and sanitation, especially due to lack of solid and liquid waste management and infrastructure.
Natural resources in the areas around the former IDPs have especially been over-exploited due to increased demand for fuel wood and charcoal, for both domestic and commercial purposes.
ES-6
The Project for Rural Road Network Development in Acholi Sub-region in Northern Uganda Final Report Vol.2: Executive Summary
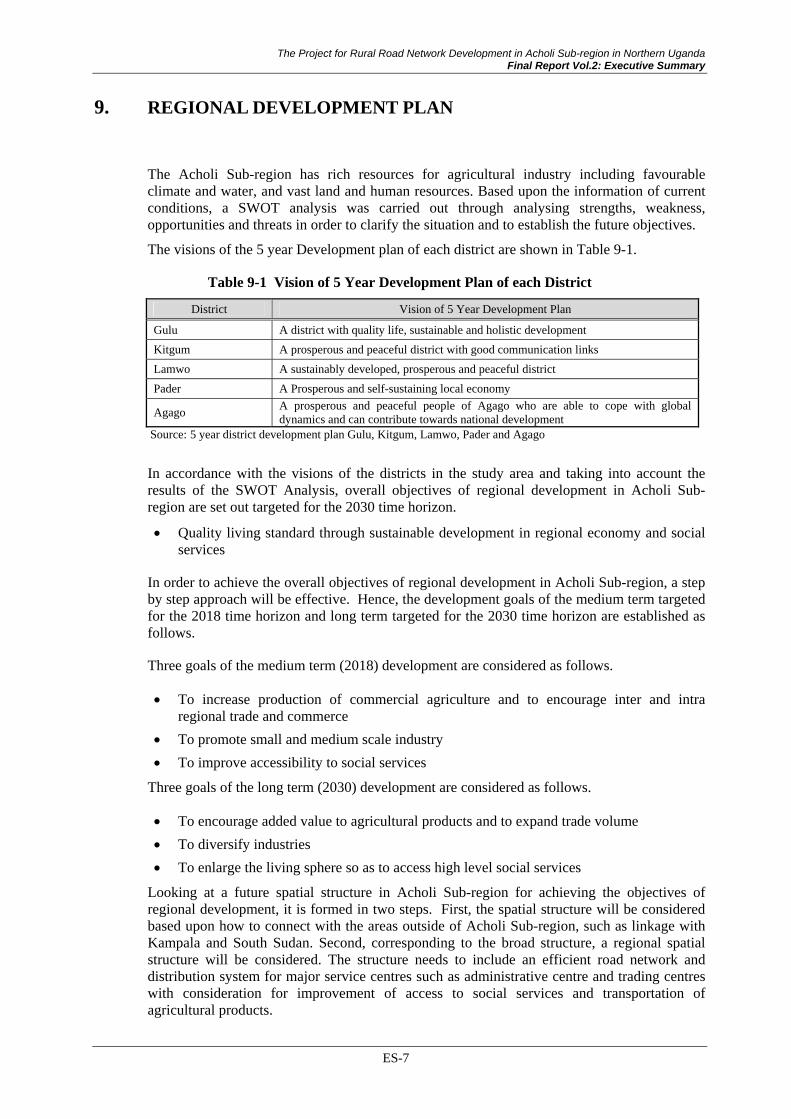
9. REGIONAL DEVELOPMENT PLAN
The Acholi Sub-region has rich resources for agricultural industry including favourable climate and water, and vast land and human resources. Based upon the information of current conditions, a SWOT analysis was carried out through analysing strengths, weakness, opportunities and threats in order to clarify the situation and to establish the future objectives.
The visions of the 5 year Development plan of each district are shown in Table 9-1.
Table 9-1 Vision of 5 Year Development Plan of each District
District Vision of 5 Year Development Plan
Gulu A district with quality life, sustainable and holistic development
Kitgum A prosperous and peaceful district with good communication links
Lamwo A sustainably developed, prosperous and peaceful district
Pader A Prosperous and self-sustaining local economy
Agago A prosperous and peaceful people of Agago who are able to cope with global dynamics and can contribute towards national development
Source: 5 year district development plan Gulu, Kitgum, Lamwo, Pader and Agago
In accordance with the visions of the districts in the study area and taking into account the results of the SWOT Analysis, overall objectives of regional development in Acholi Sub-region are set out targeted for the 2030 time horizon.
Quality living standard through sustainable development in regional economy and social services
In order to achieve the overall objectives of regional development in Acholi Sub-region, a step by step approach will be effective. Hence, the development goals of the medium term targeted for the 2018 time horizon and long term targeted for the 2030 time horizon are established as follows.
Three goals of the medium term (2018) development are considered as follows.
To increase production of commercial agriculture and to encourage inter and intra regional trade and commerce
To promote small and medium scale industry
To improve accessibility to social services
Three goals of the long term (2030) development are considered as follows.
To encourage added value to agricultural products and to expand trade volume
To diversify industries
To enlarge the living sphere so as to access high level social services
Looking at a future spatial structure in Acholi Sub-region for achieving the objectives of regional development, it is formed in two steps. First, the spatial structure will be considered based upon how to connect with the areas outside of Acholi Sub-region, such as linkage with Kampala and South Sudan. Second, corresponding to the broad structure, a regional spatial structure will be considered. The structure needs to include an efficient road network and distribution system for major service centres such as administrative centre and trading centres with consideration for improvement of access to social services and transportation of agricultural products.
ES-7

To take account of future spatial structure for connection with areas outside of Acholi Sub-region, two alternatives are considered. One is a single corridor structure the other is a double corridor structure as shown in Figure 9-1.
1st Alternative: Single Corridor Structure 2nd Alternative: Double Corridor Structure Source: JICA Study Team
Figure 9-1 Schematic Image of Alternatives for the Spatial Structure
As a result of evaluation of those two alternatives, the 2nd Alternative, the double corridor structure, is appropriate for regional development in Acholi Sub-region. Two main corridors connected to other regions are pillars of this spatial structure in Acholi Sub-region. To take account of the potentials in Acholi Sub-region, these corridors contribute to enhance the trading and commerce of agricultural products. Figure 9-2 illustrates the relationship between the spatial structure and the scenario for regional development.
Source: JICA Study Team
Figure 9-2 Spatial Structure and Development Scenario in Broad Context
ES-8

The Project for Rural Road Network Development in Acholi Sub-region in Northern Uganda Final Report Vol.2: Executive Summary
A Concept Plan of proposed urban land uses is illustrated in the following figures.
(Kitgum) (Gulu)
Source: JICA Study Team Figure 9-3 Concept Plan of Proposed Urban Land Use
10. TRAFFIC DEMAND FORECAST
(1) Basic Approach for Forecast
One of the objectives of the traffic forecast is to evaluate the projects to be proposed in the Master Plan. In particular, national road improvements in the study area are considered as the most possible and feasible projects. The following table summarizes the traffic assignment cases.
Table 10-1 Traffic Assignment Cases Case Description Road Network Traffic Demand
- Existing 2011 Network
0 Without Project Do Nothing 2011 Network 2018
1 With Lira-Kitgum Rd. Improvement of Lira-Kitgum Rd. 2011Network + Lira-Kitgum 2018
2 With Gulu- Kitgum Rd. Improvement of Gulu-Kitgum Rd. 2011Netwok + Gulu-Kitgum Rd. 2018
3 All Projects Improvement of above Roads in the Area 2018 Network 2018
Source: JICA Study Team
Traffic assignments by above cases are illustrated in the following figures.
(Case 0: Do nothing) (Case 1: With Lira-Kitgum Road Project)
ES-9

(Case 2: With Gulu Kitgum Road Project) (Case 3: With Both Projects)
Source: JICA Study Team Figure 10-1 Traffic Assignment Result in 2018
11. ROAD NETWORK DEVELOPMENT PLAN
The approach of the Previous Study is generally applicable to this study as well. Since this study is expected to establish regional-wide road network development plans; the proposal of improvement/development of international, inter-region and inter-district traffic/transport is the primary objective, therefore more overview/wider viewpoint are required as compared to the Previous Study. Hence, the following functional road classification, without regard for the current road system (National/District), is proposed for planning purposes. This classification system makes it possible to identify road functions, simply and also makes it possible to relate to those of both Ugandan manuals.
Table 11-1 Proposed Functional Road Classification Coincidence
Functional Road Classification General Functional Assignment
National Road System District Road System
1 International Trunk Road
Road that links major international cities and caters to international cargo and passengers
[A] International Trunk Road
N/A
2 Inter-Region Trunk Road
Road that links major regional centres and caters to domestic cargo and passengers.
[B] National Trunk Road N/A
3 Inter-District Road Road that links district centres and caters to regional cargo and passengers
[C] Primary Road, [D] Secondary Road
District Class I Road
4 City Road Roads that are developed in city centres and connect to upper class roads
N/A Urban Road
5 Feeder Road Road that links villages and district centres and
[E] Minor Road District Class II Road District Class III Road
Source: JICA Study Team
Development goals for mid-term (2018) are set as follows.
To improve accessibility to high agricultural potential areas and between trading centres,
To improve accessibility for men and materials that move to food processing industries near the agricultural production area; and,
To improve accessibility to health care facilities, educational facilities and water sources.
Development goals for the long term (2030) are set as follows.
ES-10

The Project for Rural Road Network Development in Acholi Sub-region in Northern Uganda Final Report Vol.2: Executive Summary
To realize high mobility conditions for International Trunk Roads such as to provide bypasses at trading centres,
To increase the amount of paved roads in the trunk road network, and,
To improve the quality of CARs and public transportation.
Road network development concepts in 2018 and 2030 are shown in Figure 11-1.
(2030) (2018)
Source: JICA Study Team Figure 11-1 Road Network Development Concept
The main structure of the proposed network is shown in Figure 11-2 and Table 11-1.
1-1
2-12-2
3-2
3-3
3-1
3-4
3-5
3-8
3-7 3-6
Source: JICA Study Team
Figure 11-2 Proposed Road Network in 2018
ES-11
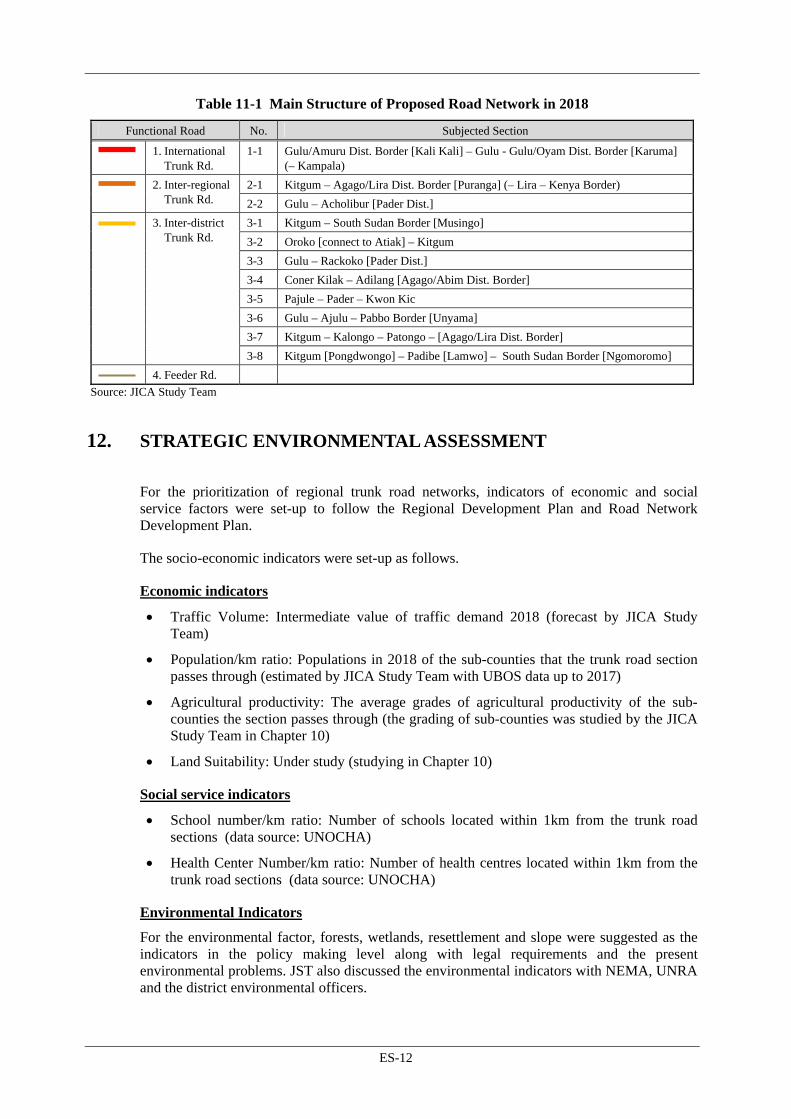
Table 11-1 Main Structure of Proposed Road Network in 2018
Functional Road No. Subjected Section
1. International Trunk Rd.
1-1 Gulu/Amuru Dist. Border [Kali Kali] – Gulu - Gulu/Oyam Dist. Border [Karuma] (– Kampala)
2-1 Kitgum – Agago/Lira Dist. Border [Puranga] (– Lira – Kenya Border) 2. Inter-regional Trunk Rd. 2-2 Gulu – Acholibur [Pader Dist.]
3-1 Kitgum – South Sudan Border [Musingo]
3-2 Oroko [connect to Atiak] – Kitgum
3-3 Gulu – Rackoko [Pader Dist.]
3-4 Coner Kilak – Adilang [Agago/Abim Dist. Border]
3-5 Pajule – Pader – Kwon Kic
3-6 Gulu – Ajulu – Pabbo Border [Unyama]
3-7 Kitgum – Kalongo – Patongo – [Agago/Lira Dist. Border]
3. Inter-district Trunk Rd.
3-8 Kitgum [Pongdwongo] – Padibe [Lamwo] – South Sudan Border [Ngomoromo]
4. Feeder Rd.
Source: JICA Study Team
12. STRATEGIC ENVIRONMENTAL ASSESSMENT
For the prioritization of regional trunk road networks, indicators of economic and social service factors were set-up to follow the Regional Development Plan and Road Network Development Plan.
The socio-economic indicators were set-up as follows.
Economic indicators
Traffic Volume: Intermediate value of traffic demand 2018 (forecast by JICA Study Team)
Population/km ratio: Populations in 2018 of the sub-counties that the trunk road section passes through (estimated by JICA Study Team with UBOS data up to 2017)
Agricultural productivity: The average grades of agricultural productivity of the sub-counties the section passes through (the grading of sub-counties was studied by the JICA Study Team in Chapter 10)
Land Suitability: Under study (studying in Chapter 10)
Social service indicators
School number/km ratio: Number of schools located within 1km from the trunk road sections (data source: UNOCHA)
Health Center Number/km ratio: Number of health centres located within 1km from the trunk road sections (data source: UNOCHA)
Environmental Indicators
For the environmental factor, forests, wetlands, resettlement and slope were suggested as the indicators in the policy making level along with legal requirements and the present environmental problems. JST also discussed the environmental indicators with NEMA, UNRA and the district environmental officers.
ES-12

The Project for Rural Road Network Development in Acholi Sub-region in Northern Uganda Final Report Vol.2: Executive Summary
As a result of the SEA, the priority roads selected by the “Balance Focused” alternatives (Alternative-2) gives the highest score as shown in Figure 12-1 and Table 12-1. This pattern of priority road groups matches the proposed spatial structure as shown in Figure 9-2.
Source: JICA Study Team
Figure 12-1 Alternative-2 of Priority Trunk Road Network: Balance Focused
4th Priority Group
3rd Priority Group
2nd Priority Group
1st Priority Group
3-8
3-7 3-6
3-5
3-4
3-1
3-3
2-2
3-2
2-1
1-1
Table 12-1 Rating of Alternative-2
Traffic Volume
(PCU/day)
Population 2018
Agricultural Productivity
SchoolHealth Centre
Wetland/River/ Stream
ForestTrading Centre
Slope Total Score
Functional Road No.
4.50 1.00 1.50 0.50 1.00 0.50 0.50 0.25 0.25 10.00
Priority Group
International Trunk Rd. 1-1 10 10 1 4 9 1 5 3 10 74 1st
2-1 4 4 7 2 8 7 10 10 10 55 Inter-regional Trunk Rd.
2-2 7 2 6 7 2 4 6 6 10 57 2nd
3-1 1 2 7 1 1 6 10 4 10 30
3-2 1 1 6 3 1 9 9 6 1 28 4th
3-3 2 2 6 6 1 10 1 4 10 33
3-4 1 2 10 8 2 5 10 3 10 38
3-5 2 3 6 3 1 2 10 1 10 32
3-6 2 3 3 10 10 10 10 9 10 46
3-7 2 2 9 1 2 4 10 9 10 39
Inter-district Trunk Rd.
3-8 1 3 7 3 1 10 10 2 10 34
3rd
Source: JICA Study Team
ES-13

13. PRESENT ROAD MAINTENANCE AND OPERATION SYSTEM IN STUDY AREA
At present, in Uganda, roads are administratively classified as follows:
National roads District roads Urban roads Community access roads
National roads are administered by MoWT and UNRA. District roads are the jurisdiction of district local governments under technical guidance of MoWT. Urban roads are also the jurisdiction of local governments of urban councils under technical guidance of MoWT. Community access roads are supposed to be managed by sub-county local governments, while the development and maintenance are largely influenced by district local governments.
The funding for the Transport Sector is done by (1) Ministry of Finance, Planning and Economic Development (MoFPED) and (2) Uganda Road Fund. Table 13-1 shows the budget and actual expenditure of DUCAR (District, Urban and Community Access Road).
Table 13-1 Budget and Actual Expenditure of DUCAR for 2003/04 -2006/07 Unit=Billion Ushs.
2003/04 2004/05 2005/06 2006/07 Total Category
Budget Actual Budget Actual Budget Actual Budget Actual Budget Actual
District Roads Maintenance
17.957 17.339 18.310 17.295 19.869 16.702 18.380 17.096 74.516 68.43
District Roads Development
18.315 19.121 13.460 16.193 13.870 14.909 10.400 9.256 56.045 59.48
Sub Total 36.272 36.460 31.770 33.488 33.739 31.611 28.780 26.352 130.561 127.91
Urban Roads Maintenance
4.078 3.862 3.992 4.057 3.946 3.745 4.100 3.901 16.116 15.57
Urban Roads Development
3.394 3.828 3.120 2.341 1.500 0.876 1.850 1.702 9.864 8.75
Sub Total 7.472 7.690 7.112 6.398 5.446 3.829 5.950 5.603 25.980 23.52
Community Access Roads
1.869 4.847 2.960 3.238 5.658 3.504 5.240 3.254 15.727 14.84
Total 45.613 48.997 41.842 43.124 44.843 38.944 39.97 35.209 172.268 166.27
*Includes 15 billion Ushs for Kampala Source: MoFPED
To respond to the increasingly deteriorating condition of the DUCAR, the government has decided to change the effective maintenance system as following.
1) The district will directly manage routine maintenance (force account) by utilizing LBT.
2) The government will establish private regional equipment centres to support the maintenance
The maintenance of the district and community access roads is done by the district and the sub-counties, which is the substructure of the Ministry of Local Government (MoLG). The district used to have their original income source which was called the G-TAX (Generation tax) until 2006. In 2006, the government abolished the G-tax and the ratio of independent revenue has declined from 30% to 7% and even that 7% is spent for the running cost of the
ES-14

The Project for Rural Road Network Development in Acholi Sub-region in Northern Uganda Final Report Vol.2: Executive Summary
district itself. From this circumstance, for investment in the infrastructure, the district has become to depend on grants from the central government. Currently, the budget for the road maintenance is provided by the URF, PRDP and Grants from donors (mainly from DANIDA). However, there is almost no fund from the original source.
Further, road maintenance works are also done by CAIIP (Community, Agriculture, Infrastructure Improvement Program), NUDEIL (Northern Uganda Development of Enhanced Local Governance Infrastructure and Livelihoods), which is the 4 year plan of MOLG. However these are implemented on a project basis and not included in the annual plan.
The road maintenance of UNRA is basically implemented by contracting out the work except for a few activities such as emergency maintenance. Also most of the works are equipment based and in some fields of routine maintenance, such as grass cutting (vegetation control) and de-silting of the drainage, LTB is applied.
14. ROAD MAINTENANCE AND OPERATION IMPROVEMENT PLAN
The following table indicates the issues in road maintenance in Uganda.
Table 14-1 Issues at the National and District/Regional level in Road Maintenance
Causes 1) National Level 2) District/Regional Level A) Institutional A-1-1: Government force account policy
delays A-2-1: Low income compared with private sector
B) Technical /Engineering
B-1-1: Inadequate technical capability regarding LBT and its related technologies such as GIS. B-1-2: Lack of training opportunity
B-2-1: No manual/Guideline to prepare Force Account
C) Facilities C-1-1 No plant to provide adequate quantities of proper material.
C-2-1: Lack of equipment to operate force account in LBT (relate to A-1-1)
Source: JICA Study Team
Proposed solutions for those issues are shown in Table 14-2.
Table 14-2 Countermeasures at the National and District/Regional level in Road Maintenance Terms 1) National Level 2) District/Regional Level
A) Short Term A-1-1: Facilitate Force Account Policy A-2-1: Obtain training opportunities in LBT and structure planning & design A-2-2: Prepare Manual/Guideline to operate force account including equipment maintenance
B) Mid Term B-1-1: Establish aggregate and gravel plant to provide qualified material B-1-2: Strengthening the training capability of the training centre including operation of RAMPS
B-2-1: Obtain PC literacy to create persuasive and effective reports including GIS which relates to RAMPS
C) Long Term C-1-1: Establish practical structural planning and design course in the University.
C-2-1: Provide benefits the same as the private sector.
Source: JICA Study Team
According to the result of the capacity assessment, it is necessary to conduct the following kinds of training.
ES-15

Table 14-3 Training Options for Capacity Development
CD Plan-1 CD Plan-2 CD Plan-3 CD Plan-4 Training Organization
MELTC JICA KTC UDSM or DIT
Major Target
District Engineers, Technicians, Private contractors, Foremen
District engineer, engineer who is responsible for the section, Managers
District Engineers, Technicians, Private contractors, Foremen and mechanics.
District Engineers, Technicians, Private contractors, Foremen, Private consultants
Major Contents Refer to the following Table
Refer to the following table
Tailor made courses.
(Not Known)
Source: JICA Study Team
These training shall be managed under the technical transfer project supported by the Japanese Government. This Project shall be comprehensive to cover the provision of hardware such as construction of a mechanical workshop and mechanical tools which are necessary for the sustainable operation as well as the capacity development.
In Uganda, the district road maintenance plans are made using RAMPS. This is the standard software for the district in road maintenance. However, it can be found that the district is not using all the functions of RAMPS. The parts related to planning such as input of the data from the road inventory and using GIS & GPS is almost abandoned due to lack of literacy. Therefore, it is necessary to have adequate training opportunities for district officers on presentation, which is mostly documentation skills using a PC, including operation of RAMPS. For the training, MELTC will be the proper organization to carry out the training, however, since MELTC doesn’t have a training curriculum related to RAMPS or reporting, strengthening the institution of MELTC shall be considered also.
Pilot Projects (PP) were implemented in both Gulu and Kitgum districts. The objective of the PP is to gain knowledge regarding applying LBT to CARs maintenance through actual construction works. Following are the lessons we learned from the PP. The following positive impacts were observed and expected during and after the pilot project.
Income generation for residents by introduction of labor based technology, and
Increased convenience for pedestrians and bicycle users
Improvement in transport and walking during the rainy season.
Supporting economic activities along the roads.
No negative impacts caused by the pilot project were observed.
15. TECHNICAL TRANSFER
The aim of technical transfer activities is to impart necessary skills to counterparts on how to develop and maintain road inventory information. To achieve this aim, the counterparts were trained in the following main topics:
Road Survey Data Collection Techniques and
Road Information GIS Processing Techniques
Two training workshops were conducted. The first workshop focused on GPS skills necessary to collect road information effectively. This was held last May, 24-25, 2011 and was attended by district engineers from the districts covered by the study. The second workshop focused on GIS skills necessary to process road information and produce thematic maps and analyses. This consisted of three training sessions conducted in November, 2011 at three locations in
ES-16

The Project for Rural Road Network Development in Acholi Sub-region in Northern Uganda Final Report Vol.2: Executive Summary
Gulu and Kitgum for Acholi district engineers and at the Ministry of Works and Transport in Entebbe in November, 2011.
In order to avoid duplication of training topics with other donor agencies active in Acholi region, coordination meetings were held with USAID. USAID is also providing equipment, software and training on GPS in the Acholi area.
16. SELECTION OF PRIORITY PROJECTS
The primary objective of the priority projects is to improve living standards and accommodate industrial potential by 2018. There are development ideas by the functional road classes as follows.
International Trunk Roads: to meet international road standards by laying tarmac and widening
Inter –Regional Trunk Roads: to meet national trunk standards by laying tarmac and widening
Inter District Roads: to secure passability throughout the year by bottleneck improvements such as drainage systems
City Roads: to regulate and increase efficiency of traffic movement by improvement of road structure and pavement
Feeder Roads: to remove bottle necks allow the road to provide access to the distinct roads
In addition to the above, a proposal for improvement of public transport systems is made because of the following.
To implement the above ideas, the priority projects by 2018 are proposed as follows.
Table 16-1 List of Priority Projects ID Program Name Scope Remarks
International Trunk Road Improvements
IT1 Kamdini-Gulu Road Section Improvement
L=58km, W(9.5):1.5-3.25-3.25-1.5 Bituminous Standard
IT2 Gulu-Atiak Road Section Improvement
L=67km, W(9.5):1.5-3.25-3.25-1.5 Bituminous Standard
IT3 Atiak-Nimule Road Section Improvement
L=35km, W(9.5):1.5-3.25-3.25-1.5 Bituminous Standard
Inter-Region Trunk Road Improvements
IR1 Kitgum-Lira Road Section Improvement
L=120km, W(8.6):1.5-2.80-2.80-1.5 (Paved III), Bituminous Standard
IR2 Gulu-Acholibur Road Section Improvement
L=85km, W(8.6):1.5-2.80-2.80-1.5 (Paved III), Bituminous Standard
Inter-District Road Improvements
ID 1 Kitgum-Musingo (South Sudan Border) Road Section Improvement
L=70km, W(10.0)=2.0-3.0-3.0-2.0 Gravel A, Gravel Standard
ID 2 Kitgum-Atiak Road Section Improvement
L=96km, W(10.0)=2.0-3.0-3.0-2.0 Gravel A, Gravel Standard
ID 3 Gulu-Rackoko Road Section Improvement
L=70km, W(10.0)=2.0-3.0-3.0-2.0 Gravel A, Gravel Standard
ID 4 Kilak-Adilang Road Section Improvement
L=48km, W(10.0)=2.0-3.0-3.0-2.0 Gravel A, Gravel Standard
ID 5 Pajule-Pader-Kwonkic Road Section Improvement
L=26km, W(10.0)=2.0-3.0-3.0-2.0 Gravel A, Gravel Standard
ID 6 Gulu-Ajulu-Pabbo Road Section Improvement
L=40km, W(10.0)=2.0-3.0-3.0-2.0 Gravel A, Gravel Standard
ES-17

ES-18
ID Program Name Scope Remarks
ID 7 Kitgum- Kalongo –Patongo Road Section Improvement
L=125km, W(10.0)=2.0-3.0-3.0-2.0 Gravel A, Gravel Standard
ID 8 Kitgum- Padibe-Ngomoromo Road Section Improvement
L=65km, W(10.0)=2.0-3.0-3.0-2.0 Gravel A, Gravel Standard
CR1 Gulu City Roads Improvement L=14.3km, W(14.0):2.5-1.5-3.0-3.0-1.5-2.5 Bituminous Standard
CR 2 Kitgum City Roads Improvement L=to be Studied, W(14.0):2.5-1.5-3.0-3.0-1.5-2.5 Bituminous Standard
CR 3 Pader City Road Improvement L=to be Studied, W(14.0):2.5-1.5-3.0-3.0-1.5-2.5 Bituminous Standard
FR 1 Gulu Feeder Road Drainage System Improvements Program Pipe Culvert D900, N=170
FR 2 Kitgum Feeder Road Drainage System Improvement Program Pipe Culvert D900, N=30
FR 3 Pader Feeder Road Drainage System Improvements Program Pipe Culvert D900, N=40
FR 4 Lamwo Feeder Road Drainage System Improvements Program Pipe Culvert D900, N=30
FR 5 Agago Feeder Road Drainage System Improvements Program Pipe Culvert D900, N=20
Public Transport Improvements
PT1 Gulu Community Bus Service Program
Provision of community buses which will also be available to cater to small scale cargos. TA for O&M should be part of the program.
PT2 Kitgum Community Bus Service Program
Provision of community buses which also will be available to cater to small scale cargos. TA for O&M should be part of the program.
PT 3 Pader Community Bus Service Program
Provision of community buses which also will be available to cater to small scale cargos. TA for O&M should be part of the program.
PT 4 Bus Terminal Integration Program in Gulu City Bus Terminal and Parking Space Construction
Source: JICA Study Team
The Project for Rural Road Network Development in Acholi Sub-region in Northern Uganda Final Report Vol.2: Executive Summary
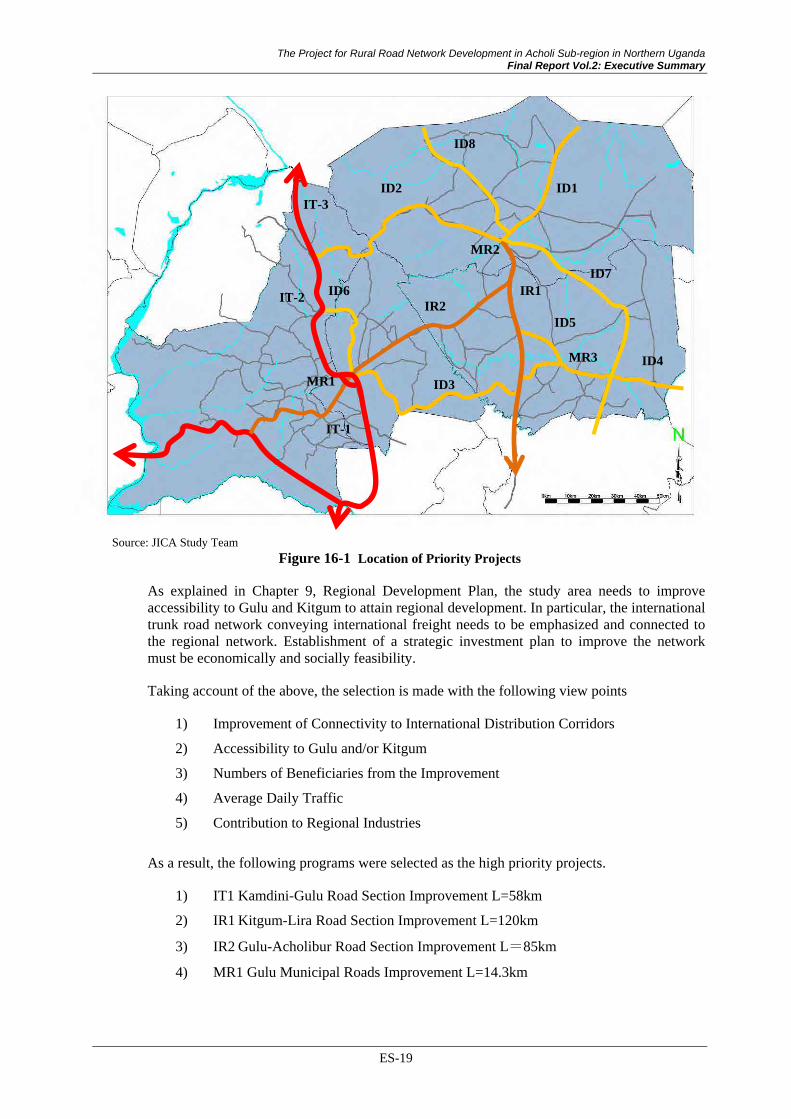
Source: JICA Study Team
Figure 16-1 Location of Priority Projects
As explained in Chapter 9, Regional Development Plan, the study area needs to improve accessibility to Gulu and Kitgum to attain regional development. In particular, the international trunk road network conveying international freight needs to be emphasized and connected to the regional network. Establishment of a strategic investment plan to improve the network must be economically and socially feasibility.
Taking account of the above, the selection is made with the following view points
1) Improvement of Connectivity to International Distribution Corridors
2) Accessibility to Gulu and/or Kitgum
3) Numbers of Beneficiaries from the Improvement
4) Average Daily Traffic
5) Contribution to Regional Industries
As a result, the following programs were selected as the high priority projects.
1) IT1 Kamdini-Gulu Road Section Improvement L=58km
2) IR1 Kitgum-Lira Road Section Improvement L=120km
3) IR2 Gulu-Acholibur Road Section Improvement L=85km
4) MR1 Gulu Municipal Roads Improvement L=14.3km
IT-1
IR1
ID2
IR2
ID3
ID1
ID4
ID5
ID8
ID6
IT-3
MR2
ID7
IT-2
MR3
MR1
ES-19
ES-20
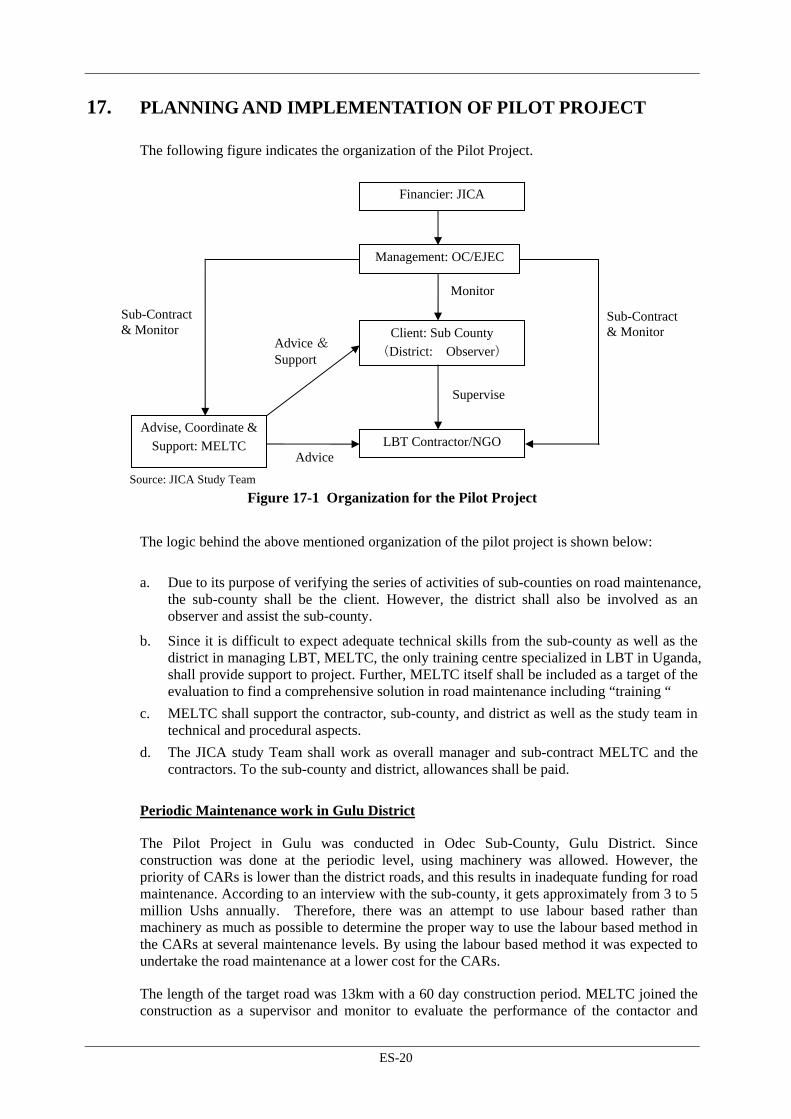
17. PLANNING AND IMPLEMENTATION OF PILOT PROJECT
The following figure indicates the organization of the Pilot Project.
Source: JICA Study Team
Figure 17-1 Organization for the Pilot Project
The logic behind the above mentioned organization of the pilot project is shown below:
a. Due to its purpose of verifying the series of activities of sub-counties on road maintenance, the sub-county shall be the client. However, the district shall also be involved as an observer and assist the sub-county.
b. Since it is difficult to expect adequate technical skills from the sub-county as well as the district in managing LBT, MELTC, the only training centre specialized in LBT in Uganda, shall provide support to project. Further, MELTC itself shall be included as a target of the evaluation to find a comprehensive solution in road maintenance including “training “
c. MELTC shall support the contractor, sub-county, and district as well as the study team in technical and procedural aspects.
d. The JICA study Team shall work as overall manager and sub-contract MELTC and the contractors. To the sub-county and district, allowances shall be paid.
Periodic Maintenance work in Gulu District
The Pilot Project in Gulu was conducted in Odec Sub-County, Gulu District. Since construction was done at the periodic level, using machinery was allowed. However, the priority of CARs is lower than the district roads, and this results in inadequate funding for road maintenance. According to an interview with the sub-county, it gets approximately from 3 to 5 million Ushs annually. Therefore, there was an attempt to use labour based rather than machinery as much as possible to determine the proper way to use the labour based method in the CARs at several maintenance levels. By using the labour based method it was expected to undertake the road maintenance at a lower cost for the CARs.
The length of the target road was 13km with a 60 day construction period. MELTC joined the construction as a supervisor and monitor to evaluate the performance of the contactor and
Sub-Contract & Monitor
Sub-Contract & Monitor
Advice &Sup
port
Advice
Financier: JICA
Management: OC/EJEC
Client: Sub County
(District: Observer)
Advise, Coordinate &
Support: MELTC LBT Contractor/NGO
Supervise
Monitor

The Project for Rural Road Network Development in Acholi Sub-region in Northern Uganda Final Report Vol.2: Executive Summary
authorities and the casual labourers where hired from the communities along the targeted road. The construction started from 19th November and ended on 17th January, 2012.
Routine Maintenance work in Kitgum District
Contrary to the Pilot Project in Gulu, the Pilot Project in Kitgum attempted to undertake the construction by applying a purely labour based method as much as possible. One of the objectives in applying the labour based method was to determine the applicability of the labour based method to community road maintenance by hiring community people. The maintenance level was planned to be routine. Also, the clearance of the bottlenecks is one of the greatest difficulties which the sub-county has, and this mostly comes from the inadequate budget. To solve this issue, the donou method was attempted where cross culverts were needed and it was used instead of concrete. “Donou” is a Japanese word which means sand bag or gunny bag.
The length of the target road was approx. 8km with 3 crossing culverts. The construction period was 30 days. MELTC joined the construction as supervisor and monitor to evaluate the performance of the contactor and authorities and the casual labourers where hired from the communities along the targeted road.
The following positive impacts were observed and expected during and after the pilot project.
Income generation for residents by introduction of labor based technology, and
Increased convenience for pedestrians and bicycle users
Improvement in transport and walking during the rainy season.
Supporting economic activities along the roads.
18. PRELIMINARY DESIGN FOR THE HIGH PRIORITY PROJECTS
Typical Cross Sections for National Road and Municipal Road are as shown in the following figures.
a. IT1 Kamdini-Gulu Road Section Improvement L=58km
Source: Gulu –Atiak –Nimule Road Detailed Engineering Design Report
Figure 18-1 Typical Cross Section (IT 1: Kamdini-Gulu Road)
ES-21

b. IR 1 Kitgum-Lira Road Section Improvement L=119.6km, IR 2 Gulu-Acholibur Road Section Improvement L=81.2km
Source: Lot A, Rwenkuuye-Apac-Lira-Kitgum-Musingo Detailed Engineering Design Report
Figure 18-2 Typical Cross Section (IR 1: Kitgum-Lira Road, IR2: Gulu-Acholibur Road)
Source: JICA Study Team Figure 18-3 Typical Cross Section for Municipal Road
The scope of the Gulu Municipal Road Project is concluded as shown in the following figure.
Source: JICA Study Team Figure 18-3 Project Road Sections for MR1
ES-22

The Project for Rural Road Network Development in Acholi Sub-region in Northern Uganda Final Report Vol.2: Executive Summary
19. COST ESTIMATION FOR THE HIGH PRIORITY PROJECTS
(1) International Trunk Road Improvement
In order to estimate construction, compensation and project administration costs, price investigations were also conducted. Construction cost data was obtained from past projects, namely the Pilot Projects for Amuru Bridges and the Project for Social Infrastructure Development for Promoting Return and Resettlement of Internally Displaced Persons (IDP). The following table shows the project cost summary.
Table 19-1 Project Cost Summary (USD)
Project ID Project Name Civil Work Cost Other Cost Total Cost
IT1 Kamdini- Gulu Road Section Improvement
27,459,000 6,597,900 34,056,900
Source: JICA Study Team
(2) Inter-Region Trunk Roads Improvement
This program contains two national roads namely Kitgum-Lira Road and Gulu-Acholibur Road and these road sections have been studied and designed by UNRA as explained in Chapter 18.
The cost estimations have also been made in the UNRA study, but they, however, were estimated based on market prices in 2010. As discussed, there is a trend of escalation of construction cost such that the cost in 2011 is approximately 30% more than the cost in 2010. In consideration of the cost escalation, the project costs were re-estimated as shown in the following table.
Table 19-2 Project Costs Summary (USD)
Project ID Project Name Cost in 2010 Re-Estimation in 2011
IR1 Kitgum-Lira Road Section Improvement
82,783,160 96,856,200
IR2 Gulu-Acholibur Road Section Improvement
80,171,455 93,800,700
Total 162,954,615 190,656,900Source: JICA Study Team
(3) Municipal Road Improvement
Project cost is estimated with the same approach as that of the IT1 and the result is shown in the following table.
Table 19-3 Project Cost Summary (USD)
Project ID Project Name Civil Work Cost Other Cost Total Cost
MR1 Gulu Municipal Roads Improvement
23,600,000 2,785,000 26,385,000
Source: JICA Study Team
ES-23
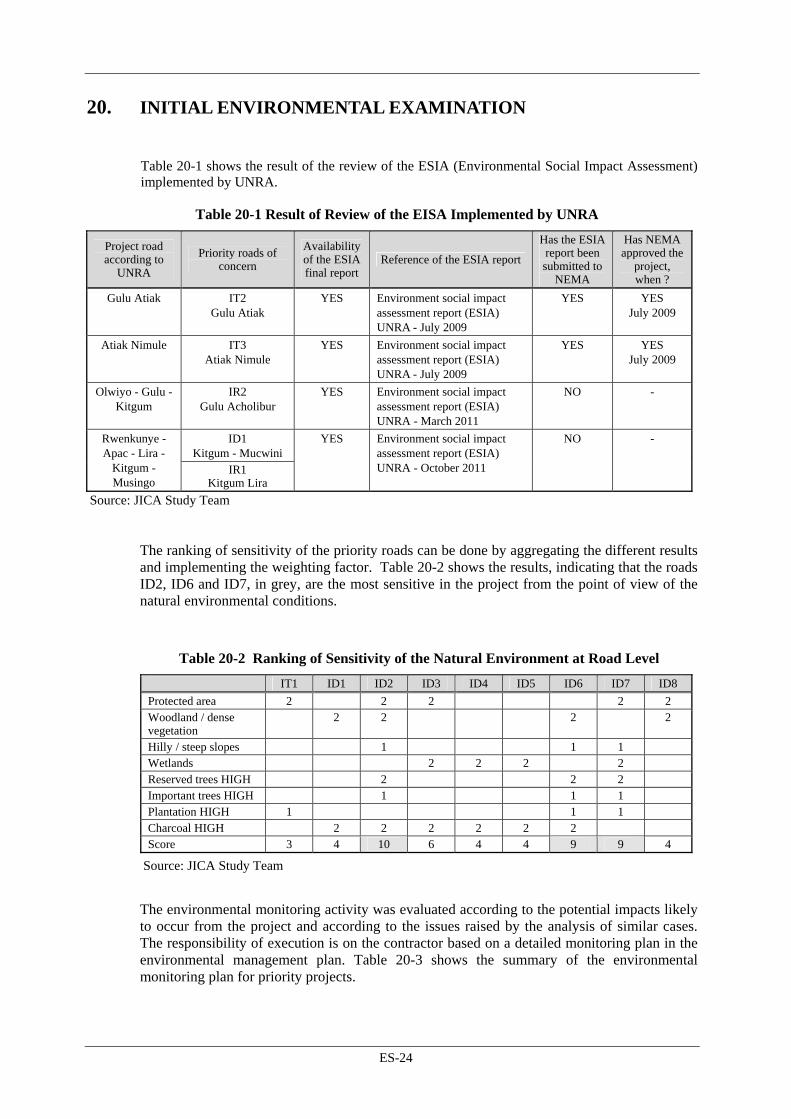
20. INITIAL ENVIRONMENTAL EXAMINATION
Table 20-1 shows the result of the review of the ESIA (Environmental Social Impact Assessment) implemented by UNRA.
Table 20-1 Result of Review of the EISA Implemented by UNRA
Project road according to
UNRA
Priority roads of concern
Availability of the ESIA final report
Reference of the ESIA report
Has the ESIA report been submitted to
NEMA
Has NEMA approved the
project, when ?
Gulu Atiak IT2 Gulu Atiak
YES Environment social impact assessment report (ESIA) UNRA - July 2009
YES YES July 2009
Atiak Nimule IT3 Atiak Nimule
YES Environment social impact assessment report (ESIA) UNRA - July 2009
YES YES July 2009
Olwiyo - Gulu -Kitgum
IR2 Gulu Acholibur
YES
Environment social impact assessment report (ESIA) UNRA - March 2011
NO -
ID1 Kitgum - Mucwini
Rwenkunye - Apac - Lira -
Kitgum - Musingo
IR1 Kitgum Lira
YES Environment social impact assessment report (ESIA) UNRA - October 2011
NO -
Source: JICA Study Team
The ranking of sensitivity of the priority roads can be done by aggregating the different results and implementing the weighting factor. Table 20-2 shows the results, indicating that the roads ID2, ID6 and ID7, in grey, are the most sensitive in the project from the point of view of the natural environmental conditions.
Table 20-2 Ranking of Sensitivity of the Natural Environment at Road Level
IT1 ID1 ID2 ID3 ID4 ID5 ID6 ID7 ID8
Protected area 2 2 2 2 2 Woodland / dense vegetation
2 2 2 2
Hilly / steep slopes 1 1 1 Wetlands 2 2 2 2 Reserved trees HIGH 2 2 2 Important trees HIGH 1 1 1 Plantation HIGH 1 1 1 Charcoal HIGH 2 2 2 2 2 2 Score 3 4 10 6 4 4 9 9 4
Source: JICA Study Team
The environmental monitoring activity was evaluated according to the potential impacts likely to occur from the project and according to the issues raised by the analysis of similar cases. The responsibility of execution is on the contractor based on a detailed monitoring plan in the environmental management plan. Table 20-3 shows the summary of the environmental monitoring plan for priority projects.
ES-24

The Project for Rural Road Network Development in Acholi Sub-region in Northern Uganda Final Report Vol.2: Executive Summary
Table 20-3 Summary of Environmental Monitoring Plan for Priority Projects
Impact Criteria Monitoring Site Frequency
1 Air pollution, dust The most exposed inhabited sites like the
trading centres along the road 1 / month for visual observation 1 / month for interviews of
roadside inhabitants and LC1
2 Water
Pollution, Soil contamination
Streams and wetlands concerned near bridges or box culvert construction works
For water quality sampling sites, one upstream site and one downstream site
For the management of oil substances, the work site
1 / month except the visual observation of oil products storage, to be done daily
3 Top soil
Camp work site Bridge and box culvert construction sites Road work sites
Daily records
4 Solid waste
Camp work site Bridge and box culvert construction sites Road work sites
Daily records
5 Noise The most exposed inhabited sites like the
trading centres, along the road or residences near the camp work sites or construction sites
1 / week for visual observation 1 / month for interviews of
roadside inhabitants and LC1
6 Water resources,
water supply, water use
Streams and wetlands concerned near bridge or box culvert construction works
River water use sites
Daily records 1 / month for interviews of
concerned people and LC1
7 Morphology, Soil stability, erosion
Borrow pits River banks at bridge construction sites Roadside slopes
Records 1 / week Reports 1 / month Final report at end of the works
8
Natural habitats, Protected natural
areas
River banks at bridge or box culvert construction sites
Wetlands at bridge or box culvert construction sites
Records 1 / week Reports 1 / month Final report at end of the works
9 Biological diversity
and protected species (plants)
Road reserve Daily records during the clearance works
Weekly records during the planting works
Final report at end of the works
Source: JICA Study Team
21. PROJECT EVALUATION
The primary objective of the economic analysis is to examine the effects of the project investment. The following discussion will reveal the economic validity of the necessary projects and high priority projects proposed in Chapter 16, by conventional economic analysis – Net Present Value (NPV) and Economic Internal Rate of Return (EIRR).
Table 21-1 shows NPV and EIRR of the High Priority Projects. The discount rate to calculate Net Present Value (NPV) is set at 12%, which is the opportunity cost of capital and a criterion for whether a project is feasible or not, from the point of national economic development. NPV is positive and EIRR exceeds 12% in regard to IT1: Kamdini – Gulu Road Improvement project, however, NPV is negative and EIRR is lower than 12% regarding the other two projects.
Table 21-1 NPV and EIRR of Trunk Road Improvement Projects
Name of Project NPV (million USD) EIRR (%)
IT1: Kamdini – Gulu Road Improvement 2.5 12.6 IR1: Kitgum – Lira Road Improvement -40.7 4.5 IR2: Gulu – Acholibur Road Improvement -28.1 6.0
Source: JICA Study Team
ES-25

Out of the three trunk road projects, IT1: Kamdini – Gulu Road Improvement project, is feasible from the point of national economic development. The project shows robust performance in the sensitivity analysis, too.
The other trunk road projects (IR1: Kitgum – Lira Road Improvement Project and IR2: Gulu – Acholibur Road Improvement Project) are not feasible due to limited traffic; however, it is necessary to consider not only the direct effects but also indirect effects on regional economic development and social aspects. Currently, the main target of the road improvement in the Acholi Sub-region is community access roads; however, improvement of the trunk road network would also be important considering regional economic development in the middle and long perspectives.
Quantitative benefits of the Municipal Road Improvement Project (MR1) were not analyzed in this report. However, the project benefits both inter-city traffic and traffic in the downtown area of Gulu Municipality. The project is also a basis of urban infrastructure improvement such as drainage, water supply and sewerage, and urban development.
22. NECESSARY ACTIONS FOR PROJECT IMPLEMENTATION
The following actions are necessary for the Ugandan side in order to realize the Priority Projects.
(1) IT 1: Kamdini-Gulu Road Section Improvement L=58km
To apply for foreign Assistance (Loan) because it is an economically feasible project.
(2) IR 1 Kitgum-Lira Road Section Improvement L=119.6km, IR 2 Gulu-Acholibur Road Section Improvement L=81.2km
To be selected as the priority project in the next Road Sector Development Program (RSDP) for applying donors' funds.
(3) MR1 Gulu Municipal Roads Improvement
To apply for a Japanese Grant Aid Program by the Ugandan side.
(4) Actions for Other Priority Projects
Other Priority roads must maintain the required service level of each road. The traffic volume on the roads in other priority projects are quite small and it is expected that it will not increase sharply up to the target year, the best way to maintain the service level will be to apply proper routine and periodic maintenance for the roads. Although the local governments can expect Uganda Road Fund (URF) for those maintenance works, the assistance from foreign donors, as shown in table 22-1, will be necessary to improve the bottlenecks on the roads.
ES-26

The Project for Rural Road Network Development in Acholi Sub-region in Northern Uganda Final Report Vol.2: Executive Summary
Table 22-1 On-going Programs and Selection Criteria for Road Projects
Name of Program NUDEIL CAIIP2 NUSAF2 RALNUC2
Financer/Donor USAID ADB World Bank DANIDA
Budget 30 million USD 82.5 million USD 100 million USD 20 million USD(Sum of RALNUC2 and DAR2)
Target District Gulu, Kitgum, Lamwo, Amuru, Oyam, Nwoya districts
Amuru, Nwoya Gulu Kitgum Pader Lamwo Agago districts from Acholi Sub-region; Total 40 districts
Amuru, Gulu Kitgum Pader districts from Acholi Sub-region; Total 40 districts
Amuru and Nwoya districts
Program period 3 years from 2009 in the initial stage; expanding one year due to delay of road projects
From 2009 to 2014 From 2009 to 2014 From 2009 to 2013
Target road Community access road District road and community access road
Community access road
Community access road
Criteria for selection of projects
12 criteria such as no land dispute, and not new construction but improvement, etc.
Decided by district engineer based on district plan
Decided from district plan and local needs; limited budget allocation for road projects
Decided from district plan and local needs; Distribution of Ushs2.4 million per kilometre for road project
Source: JICA Study Team
23. CONCLUSIONS AND RECOMMENDATIONS
(1) Conclusions
1) Based on the existing development plans and relationship between South Sudan and Acholi Sub-region, a spatial structure for future Acholi Sub-region with a “Double Corridor” was proposed. The double corridor consists of two international roads, namely the “Kampala- Gulu- Juba” route and the “Lira- Kitgum- Torit” route.
2) One of the goals of mid-term (2018) regional development is “to improve accessibility to social services”. Community Access Roads (CARs) have an important role to achieve that goal. The best maintenance method to keep CARs in good condition through daily and periodic maintenance was studied with the pilot projects. As a result, it was found that involving MELTC is important, especially to adopt LBT, which will benefit the IDP returnees. As for LBT, it was also confirmed that the “Donou Method” is quite useful for good quality maintenance work.
3) The other goals of mid-term (2018) regional development are “to increase production of commercial agriculture and to encourage inter and intra regional trade and commerce” and “to promote small and medium scale industry”. In order to achieve these goals, three alternatives for the road network were studied and evaluated by “Strategic Environmental Assessment”. As a result, it was found that the alternative that considered a balance of economically focused and environmentally focused criteria is the most appropriate for the road network in Acholi Sub-region. The priority projects are derived from this study and the result of interviews regarding projects such as “Municipal road improvement” and “public transportation improvement”.
4) As the action plan for high priority projects, it is recommended that two national road projects (IR1 and IR2) are to be listed in the next phase of the Road Sector Development Plan
ES-27

ES-28
(RSDP). One of the national road projects, IT1, has high feasibility; therefore it is recommended to apply foreign loan assistance. Gulu Municipal Roads Improvement project is recommended to apply for a Japanese Grant Aid Program, and MoWT has prepared the application.
(2) Recommendations
1) In order to expand economic activities in Acholi Sub-region, It is recommended to start the High Priority Projects as soon as possible, expecting the synergic effects with the loan projects currently in progress between Gulu and Nimule.
2) In the rural area of Acholi Sub-region where almost all IDP had already resettled, it is expected to activate the regional economy through exploiting the close market of South Sudan and providing technical assistance which will lead the current dominant subsistence agriculture into commercial agriculture.
3) For two major service centres, Gulu city and Kitgum city, it is recommended to promote small and medium scale industries such as food and processing, through providing software measures such as the “borderless framework” and “deregulation of taxation” as well as hardware measures such as developing infrastructure and future land use plans.
4) It is viewed that “capacity development” for each district will be required considering the new government policy of using a “force account” to maintain district roads. Regarding maintenance of CARs, improvement of management ability of contractors and awareness-rising for residents regarding LBT will also be required. To respond to these requirements, it is recommended to request “technical assistance programs” provided by donor countries including Japan.
5) It is recommended to utilize GIS maps for appealing the priority of specific projects among the road sector development plan, with cooperation of MoWT in the field of graphic processing.
The Project for Rural Road Network Development in Acholi Sub-region in Northern Uganda Final Report Vol.2: Main Report
THE PROJECT FOR
RURAL ROAD NETWORK DEVELOPMENT IN ACHOLI SUB-REGION IN NORTHERN UGANDA
FINAL REPORT VOL.2: MAIN REPORT
LOCATION MAP OF STUDY AREA
OUTLINE OF THE PROJECT
EXECUTIVE SUMMARY
TABLE OF CONTENTS
LIST OF FIGURES AND TABLES
ABBREVIATIONS
- TABLE OF CONTENTS -
Page
1. INTRODUCTION 1.1 Background of the Survey ..................................................................................................... 1-1
1.2 Rationale and Objectives of the Survey................................................................................. 1-1
1.2.1 Study Rationale............................................................................................................... 1-1
1.2.2 Objectives of the Survey................................................................................................. 1-2
1.2.3 Output of the Study......................................................................................................... 1-3
1.3 Structure of the Report........................................................................................................... 1-3
2. REGIONAL CONTEXT: NORTHERN UGANDA AND ACHOLI SUB-REGION 2.1 Northern Region of Uganda................................................................................................... 2-1
2.2 Acholi Sub-region.................................................................................................................. 2-5
3. PRESENT STATUS OF STUDY AREA 3.1 Natural Conditions ................................................................................................................. 3-1
3.2 Local Government Administration......................................................................................... 3-4
3.3 Return of IDPs ....................................................................................................................... 3-5
3.4 Population .............................................................................................................................. 3-6
3.4.1 Population and Population Growth................................................................................. 3-6
3.4.2 Urban Population ............................................................................................................ 3-7
i
3.4.3 Population Density.......................................................................................................... 3-7
3.5 Agricultural Sector................................................................................................................. 3-8
3.6 Commercial Sector............................................................................................................... 3-11
3.6.1 Private Sectors .............................................................................................................. 3-11
3.6.2 Middlemen Dealing in Agricultural Produce in Acholi Sub-region ............................. 3-12
3.6.3 Tourism Sector.............................................................................................................. 3-13
3.7 Social Infrastructure............................................................................................................. 3-14
3.7.1 Water ............................................................................................................................. 3-14
3.7.2 Health............................................................................................................................ 3-15
3.7.3 Education ...................................................................................................................... 3-17
4. REVIEW OF EXISTING DEVELOPMENT PLANS 4.1 Government Development Plans and Programmes................................................................ 4-1
4.1.1 Review of Government Development Plans and Programmes....................................... 4-1
4.2 National Road Development Plans ........................................................................................ 4-9
4.2.1 National Transport Master Plan (NTMP) 2008-2023 ..................................................... 4-9
4.2.2 The Ten Year District, Urban and Community Access Roads Investment Plan
(DUCARIP) .................................................................................................................. 4-16
4.3 Five Year Development Plans of the Study Area ................................................................. 4-17
4.3.1 Gulu District ................................................................................................................. 4-17
4.3.2 Kitgum District ............................................................................................................. 4-22
4.3.3 Pader District ................................................................................................................ 4-29
4.3.4 Lamwo District ............................................................................................................. 4-39
4.3.5 Agago District............................................................................................................... 4-49
4.3.6 Gulu Municipality......................................................................................................... 4-53
4.4 Review of Assistance Situation and Policies of International Donors ................................. 4-59
4.4.1 Northern Uganda Social Action Fund Phase 2 (NUSAF 2).......................................... 4-59
4.4.2 Agricultural Livelihood Recovery Project for Northern Uganda (ALREP) ................. 4-60
4.4.3 Northern Uganda Development of Enhanced Local Governance Infrastructure and
Livelihood (NUDEIL) .................................................................................................. 4-60
4.4.4 Restoration of Agricultural Livelihoods in Northern Uganda Phase 2 (RALNUC2)
and Development Assistance to Refugee-hosting areas Phase 2 (DAR2) .................... 4-60
4.4.5 Livelihoods and Enterprises for Agricultural Development (LEAD)........................... 4-61
4.4.6 UNHCR SO Gulu ......................................................................................................... 4-61
4.4.7 UNICEF Gulu Office.................................................................................................... 4-61
4.4.8 Community Agricultural Infrastructure Improvement program (CAIIP) ..................... 4-62
5. ROAD CONDITION IN STUDY AREA AND SOUTH SUDAN 5.1 Introduction............................................................................................................................ 5-1
ii
The Project for Rural Road Network Development in Acholi Sub-region in Northern Uganda Final Report Vol.2: Main Report
5.1.1 Objective of Road Survey ( Inventory Survey) .............................................................. 5-1
5.1.2 Data Collection Methodology......................................................................................... 5-1
5.1.3 Survey Period.................................................................................................................. 5-1
5.1.4 Survey Roads .................................................................................................................. 5-2
5.1.5 Survey Items ................................................................................................................... 5-2
5.2 Survey Results ....................................................................................................................... 5-2
5.2.1 Road Network Survey..................................................................................................... 5-2
5.2.2 Drainage Structure Survey.............................................................................................. 5-8
5.3 Present Status in South Sudan.............................................................................................. 5-11
5.3.1 Introduction................................................................................................................... 5-11
5.3.2 Present Situation in South Sudan.................................................................................. 5-12
5.3.3 Field Survey.................................................................................................................. 5-16
5.3.4 Development Scenario for South Sudan....................................................................... 5-24
5.3.5 List of Interviewees ...................................................................................................... 5-30
5.3.6 Survey Schedule ........................................................................................................... 5-32
5.3.7 Discussion Memo ......................................................................................................... 5-33
5.4 Community Access Road Survey......................................................................................... 5-36
6. TRAFFIC SURVEY 6.1 Objective of Survey ............................................................................................................... 6-1
6.2 Scope of Surveys.................................................................................................................... 6-1
6.2.1 Cordon-line Traffic Survey............................................................................................. 6-1
6.2.2 Traffic Count Survey and Roadside OD Interview Survey in Gulu Township............... 6-2
6.2.3 Home Interview Survey.................................................................................................. 6-3
6.2.4 Bus/Boda Boda Users Interview Survey ........................................................................ 6-3
6.3 Survey Consultant.................................................................................................................. 6-3
6.4 Survey Results ....................................................................................................................... 6-3
6.4.1 Cordon-line Traffic Survey............................................................................................. 6-3
6.4.2 Traffic Count Survey and Roadside OD Interview Survey in Gulu City........................ 6-5
6.4.3 Home Interview Survey.................................................................................................. 6-9
7. SOCIO ECONOMIC FRAMEWORK IN THE STUDY AREA 7.1 Introduction............................................................................................................................ 7-1
7.2 Literature Review................................................................................................................... 7-1
7.3 Population Projection in Acholi Sub-region .......................................................................... 7-3
7.3.1 Preconditions .................................................................................................................. 7-3
7.3.2 Summary of Results of Population Projection................................................................ 7-3
8. REGIONAL DEVELOPMENT ISSUES IN THE STUDY AREA 8.1 Land Development Issues ...................................................................................................... 8-1
iii

8.1.1 Introduction..................................................................................................................... 8-1
8.1.2 Perspective of Regional Economy.................................................................................. 8-1
8.1.3 Perspective of Living Environment ................................................................................ 8-5
8.2 Transportation Issue ............................................................................................................... 8-8
8.2.1 Road Network................................................................................................................. 8-8
8.2.2 Road Structures............................................................................................................... 8-8
8.2.3 City Road Network ......................................................................................................... 8-9
8.2.4 Public Transport.............................................................................................................. 8-9
8.2.5 Other Public Transport Modes........................................................................................ 8-9
8.3 Social/Natural Environmental Issues ................................................................................... 8-10
8.3.1 Urban Areas and Human Settlements ........................................................................... 8-10
8.3.2 Socio-economics........................................................................................................... 8-10
8.3.3 Natural Environment..................................................................................................... 8-11
9. REGIONAL DEVELOPMENT PLAN 9.1 Introduction............................................................................................................................ 9-1
9.2 Spatial Structure..................................................................................................................... 9-1
9.3 Potential of Acholi Sub-region............................................................................................... 9-2
9.3.1 Potential of Agricultural Development ........................................................................... 9-2
9.3.2 Potential of Trading ........................................................................................................ 9-4
9.3.3 Potential of Other Industries ........................................................................................... 9-6
9.4 SWOT Analyses..................................................................................................................... 9-9
9.4.1 SWOT Analyses.............................................................................................................. 9-9
9.4.2 Strategies for the Result of the SWOT Analysis........................................................... 9-10
9.5 Objective and Strategies of Regional Development ............................................................ 9-12
9.5.1 Objective....................................................................................................................... 9-12
9.5.2 Goals and Strategies of Medium and Long Term Development................................... 9-13
9.6 Proposed Spatial Structure ................................................................................................... 9-15
9.6.1 Alternatives of the Spatial Structure ............................................................................. 9-15
9.6.2 Development Scenario.................................................................................................. 9-17
9.6.3 Proposed Regional Spatial Structure ............................................................................ 9-19
9.6.4 Proposed Development Plan of Major Service Centres................................................ 9-29
10. TRAFFIC DEMAND FORECAST 10.1 Basic Approach for Forecast ................................................................................................ 10-1
10.2 Traffic Demand Methodology.............................................................................................. 10-1
10.2.1 Four Steps Approach..................................................................................................... 10-1
10.3 Zoning System ..................................................................................................................... 10-2
10.4 Road Network ...................................................................................................................... 10-4
iv

The Project for Rural Road Network Development in Acholi Sub-region in Northern Uganda Final Report Vol.2: Main Report
10.4.1 Existing Road Network................................................................................................. 10-4
10.4.2 Existing Road Network Condition................................................................................ 10-4
10.5 Current Traffic Demand Estimation..................................................................................... 10-6
10.5.1 Basic Approach............................................................................................................. 10-6
10.5.2 Trip Production Rate..................................................................................................... 10-6
10.5.3 Trip Production by Mode.............................................................................................. 10-6
10.5.4 Internal Trip Ratio......................................................................................................... 10-7
10.5.5 Trip Distribution Model................................................................................................ 10-7
10.5.6 Vehicle Occupancy Rate and PCU................................................................................ 10-7
10.5.7 Traffic Demand............................................................................................................. 10-8
10.6 Future Traffic Demand Forecast .......................................................................................... 10-8
10.6.1 Future Trip Production by Mode .................................................................................. 10-8
10.6.2 Future External Trips .................................................................................................... 10-9
10.6.3 Future Traffic Demand................................................................................................ 10-10
10.6.4 Future Traffic Assignment Results.............................................................................. 10-11
11. ROAD NETWORK DEVELOPMENT PLAN 11.1 Planning Approach............................................................................................................... 11-1
11.1.1 Overview of the Study Area.......................................................................................... 11-1
11.1.2 Functional Assignment ................................................................................................. 11-1
11.1.3 Level of Service (LOS)................................................................................................. 11-5
11.2 Development Goal ............................................................................................................... 11-6
11.2.1 Mid Term ...................................................................................................................... 11-6
11.2.2 Long Term..................................................................................................................... 11-8
11.3 Proposed Road Network in Study Area ............................................................................... 11-9
11.3.1 Mid Term ...................................................................................................................... 11-9
11.3.2 Long Term................................................................................................................... 11-11
12. STRATEGIC ENVIRONMENTAL ASSESSMENT 12.1 Outline of Strategic Environmental Assessment.................................................................. 12-1
12.2 Institutions and Legislation.................................................................................................. 12-1
12.2.1 Institutional Framework................................................................................................ 12-1
12.2.2 Legal Framework.......................................................................................................... 12-3
12.3 Current Social and Environmental Conditions .................................................................... 12-7
12.3.1 Natural Environment .................................................................................................... 12-7
12.3.2 Social Environment .................................................................................................... 12-10
12.3.3 Major Environmental Problems and Issues ................................................................ 12-14
12.4 Strategic Environmental Assessment (SEA)...................................................................... 12-18
12.4.1 Target Policy for SEA................................................................................................. 12-18
v

12.4.2 Regional Trunk Road Network Policy Set-up ............................................................ 12-18
12.4.3 Priority of the Regional Trunk Road Networks 2018 ................................................. 12-21
12.4.4 Comparison and Evaluation of Alternatives of Priority Trunk Road Network........... 12-30
12.4.5 Involvement of Stakeholders in Working Group Meetings ........................................ 12-36
13. PRESENT ROAD MAINTENANCE AND OPERATION SYSTEM IN STUDY AREA 13.1 Present System of Road Administration .............................................................................. 13-1
13.1.1 Roads in Uganda........................................................................................................... 13-1
13.1.2 Institutional Structure of Road Administration............................................................. 13-6
13.2 Road Funding....................................................................................................................... 13-8
13.2.1 General.......................................................................................................................... 13-8
13.2.2 Government Budgets for Road Improvement and Maintenance .................................. 13-8
13.3 Present Road Maintenance Operation and Organization of Districts................................. 13-14
13.3.1 Road Maintenance Operation of Districts................................................................... 13-14
13.3.2 Budget, Organization and Management Plan of the District ...................................... 13-19
13.3.3 Capacity Assessment and Cause Analysis on Road Maintenance .............................. 13-34
13.4 Present Road Maintenance Operation and Organization of UNRA................................... 13-38
13.4.1 Road Maintenance Operation of UNRA..................................................................... 13-38
13.4.2 Budget, Organization and Management Plan of UNRA............................................. 13-38
14. ROAD MAINTENANCE AND OPERATION IMPROVEMENT PLAN 14.1 Issues and Considerable Countermeasures .......................................................................... 14-1
14.1.1 Issues............................................................................................................................. 14-1
14.1.2 Countermeasures........................................................................................................... 14-4
14.2 Improvement Plan at the District/Regional Level (Short Term) .......................................... 14-6
14.2.1 Provide LBT and Structural Planning & Design Training Opportunities ..................... 14-6
14.2.2 Preparation of Manuals/Guidelines............................................................................... 14-7
14.3 Improvement Plan at the District/Regional Level (Mid Term) ............................................ 14-8
14.3.1 Obtain PC Literacy to Create Persuasive Reports Including RAMPS.......................... 14-8
14.4 Improvement Plan at the District/Regional Level (Long Term) .......................................... 14-8
14.4.1 Provide Benefits at the Same Level as the Private Sector ......................................... 14-8
14.5 Improvement plan at the National Level (Short Term) ........................................................ 14-8
14.5.1 Facilitate Force Account Policy .................................................................................... 14-8
14.6 Improvement plan at the National Level (Mid Term) .......................................................... 14-9
14.6.1 Establish Aggregate and Gravel Plant........................................................................... 14-9
14.6.2 Capacity Strengthening of the Training Centre (MELTC).......................................... 14-10
14.7 Improvement Plan at the National Level (Long Term) ...................................................... 14-11
14.7.1 Establish Practical Planning and Design Course in the University ............................ 14-11
14.8 Maintenance of Community Access Roads........................................................................ 14-12
vi

The Project for Rural Road Network Development in Acholi Sub-region in Northern Uganda Final Report Vol.2: Main Report
14.8.1 PRDP2 ........................................................................................................................ 14-12
14.8.2 Lessons from the Pilot Project .................................................................................... 14-12
14.8.3 Recommendations for maintenance of CARs............................................................. 14-14
15. TECHNICAL TRANSFER 15.1 Workshop 1: Training on Road Survey Techniques Using GPS .......................................... 15-2
15.1.1 Workshop Objectives .................................................................................................... 15-2
15.1.2 Contents of the Workshop............................................................................................. 15-2
15.1.3 Highlights of the Workshop .......................................................................................... 15-2
15.2 Workshop 2: Training on Road Inventory GIS Processing Techniques ............................... 15-4
15.2.1 Workshop Objectives .................................................................................................... 15-4
15.2.2 Contents of the Workshop............................................................................................. 15-4
15.2.3 Highlights of the Workshop .......................................................................................... 15-5
16. SELECTION OF PRIORITY PROJECTS 16.1 Mid Term (2018).................................................................................................................. 16-1
16.2 Selection of Prioritized Sections in CARs ........................................................................... 16-5
16.3 Selection of High Priority Projects ...................................................................................... 16-5
17. PLANNING AND IMPLEMENTATION OF PILOT PROJECT 17.1 Objective and Scope of the Pilot Project ............................................................................. 17-1
17.1.1 Outline of Road Maintenance in Uganda ..................................................................... 17-1
17.1.2 Objective of the Pilot Project........................................................................................ 17-1
17.1.3 Scope of the Pilot Project ............................................................................................. 17-2
17.2 Organization, Schedule and Location of the Targeted Road................................................ 17-3
17.2.1 Organization ................................................................................................................. 17-3
17.2.2 Schedule........................................................................................................................ 17-3
17.2.3 Location ........................................................................................................................ 17-4
17.3 Considerable Risks and Mitigation Measures...................................................................... 17-6
17.3.1 Delay by Unseasonable Weather, Contractors’ Capability, etc. .................................... 17-6
17.3.2 Procurement of Gravel.................................................................................................. 17-7
17.4 Pilot Project in Odec Sub-County, Gulu District ................................................................. 17-7
17.4.1 Outline of the Construction........................................................................................... 17-7
17.4.2 Tendering Procudure and the Results ........................................................................... 17-8
17.4.3 Constuction Supervision............................................................................................... 17-8
17.5 Pilot Project in Matindi Sub-County, Kitgum Distrrict ..................................................... 17-12
17.5.1 Outline of the construction ......................................................................................... 17-12
17.5.2 Tendering Procedure and the results ........................................................................... 17-12
17.5.3 Construction Supervision............................................................................................ 17-13
17.6 Evaluation of the Pilot Project ........................................................................................... 17-17
vii

17.6.1 Impact ......................................................................................................................... 17-17
17.6.2 Findings ...................................................................................................................... 17-20
17.6.3 Recommendation ........................................................................................................ 17-21
18. PRELIMINARY DESIGN FOR THE HIGH PRIORITY PROJECTS 18.1 Road Design in Uganda ....................................................................................................... 18-1
18.1.1 National Roads.............................................................................................................. 18-1
18.1.2 District and Urban Roads.............................................................................................. 18-3
18.2 Preliminary Road Design ..................................................................................................... 18-5
18.2.1 International Trunk Road Improvements ...................................................................... 18-5
18.2.2 Inter-Region Trunk Road Improvements ...................................................................... 18-8
18.2.3 Municipal Road Improvement .................................................................................... 18-12
18.2.4 Other Considerable Road Sections ............................................................................. 18-17
19. COST ESTIMATION FOR THE HIGH PRIORITY PROJECTS 19.1 Construction Industry in Uganda ......................................................................................... 19-1
19.1.1 Overview of Construction Industry .............................................................................. 19-1
19.1.2 Construction Cost Trends.............................................................................................. 19-1
19.2 Preliminary Project Cost Estimation for High Priority Projects .......................................... 19-3
19.2.1 International Trunk Road Improvement........................................................................ 19-3
19.2.2 Inter-Region Trunk Roads Improvement ...................................................................... 19-3
19.2.3 Municipal Road Improvement ...................................................................................... 19-4
20. INITIAL ENVIRONMENTAL EXAMINATION 20.1 Summary of the Priority Project Components within the Scope of the Environmental
and Social Considerations Study.......................................................................................... 20-1
20.1.1 Main Components of the National Priority Roads Project ........................................... 20-1
20.1.2 Main Components of the City Roads Project ............................................................... 20-2
20.1.3 Main Components of the Feeder Roads Project ........................................................... 20-4
20.1.4 Main Components of the Public Transport Improvement............................................. 20-4
20.2 Present Conditions of the Natural Environment in the Project Area.................................... 20-4
20.2.1 Road Stretches Defined for the Field Counting Survey................................................ 20-4
20.2.2 Protected Areas ............................................................................................................. 20-6
20.2.3 Natural Habitats ............................................................................................................ 20-7
20.2.4 Wetlands........................................................................................................................ 20-8
20.2.5 Forestry and Forest Products ........................................................................................ 20-9
20.2.6 Reserved Trees and Important Trees in the Road Reserve.......................................... 20-11
20.3 Present Conditions of the Human and Social Environment in the Project Area ................ 20-12
20.3.1 Population ................................................................................................................... 20-12
20.3.2 Drinking Water Sources .............................................................................................. 20-17
viii
The Project for Rural Road Network Development in Acholi Sub-region in Northern Uganda Final Report Vol.2: Main Report
20.3.3 Sites of Cultural Value ................................................................................................ 20-21
20.3.4 Health Centres and Schools in Villages ...................................................................... 20-22
20.3.5 Borrow Pits and Selected Settlements ........................................................................ 20-23
20.3.6 Housing and Commercial Settlements in the Road Reserve ...................................... 20-23
20.4 Present Conditions of the Natural and Social Environment in the Gulu City Roads
Project Area........................................................................................................................ 20-25
20.4.1 Population ................................................................................................................... 20-25
20.4.2 Environmental Conditions .......................................................................................... 20-26
20.4.3 Results of the Gulu City Road Counting Survey ........................................................ 20-28
20.4.4 Results of the Gulu City Roads Questionnaire Survey............................................... 20-30
20.4.5 Results of Interviews .................................................................................................. 20-31
20.5 Land Ownership along the National Priority Roads .......................................................... 20-33
20.6 Institutional System regarding the Environment, Land Acquisition and Compensation
in Projects in Uganda ......................................................................................................... 20-40
20.6.1 Summary of the Regulatory Environmental Impact Assessment Requirements ........ 20-40
20.6.2 Land Acquisition and Compensation for National Priority Roads ............................. 20-43
20.6.3 Land Acquisition and Compensation for the City Roads............................................ 20-44
20.7 Scoping .............................................................................................................................. 20-45
20.7.1 Potential Sources of Impacts....................................................................................... 20-45
20.7.2 Scoping Study............................................................................................................. 20-45
20.8 Terms of Reference of the Environmental and Social Considerations Study .................... 20-49
20.8.1 Summary of the Methods of Investigation ................................................................. 20-49
20.8.2 Checklist Table of Identification of the Evaluation Methods for the National
Priority Roads Investigation ....................................................................................... 20-50
20.8.3 Field Counting Survey and Method for Analysis of Data........................................... 20-53
20.8.4 Villages LC1 Survey................................................................................................... 20-54
20.8.5 Survey of the Gulu City Roads Project....................................................................... 20-56
20.8.6 Survey and Analysis of Similar Projects..................................................................... 20-57
20.8.7 Review of the UNRA ESIA Reports for IR1 and IR2 Priority Roads ........................ 20-57
20.8.8 Mapping of the GPS and GIS Data............................................................................. 20-60
20.9 Results of the Study and Impacts of the Project on the Environment................................ 20-60
20.9.1 Categorization of the Project as a Result of the IEE Study ........................................ 20-60
20.9.2 Sensitivity of the Natural Environment along the National Priority Roads Project ... 20-61
20.9.3 Main Results of the Field Surveys for the Human and Social Environmental
Conditions along the Priority Roads........................................................................... 20-64
20.9.4 Potential Impacts of the Project on the Environment ................................................. 20-64
20.9.5 Results of Study for the Gulu City Roads Project ...................................................... 20-68
20.10 Survey and Analysis of Similar Project Cases ................................................................... 20-72
20.11 Environmental Monitoring................................................................................................. 20-78
ix

x
20.11.1 Environmental Monitoring of Impacts on the Physical and Natural Environment..... 20-78
20.11.2 Environmental Monitoring of Impacts on the Human and Social Environment ........ 20-81
20.12 Stakeholders ....................................................................................................................... 20-82
21. PROJECT EVALUATION 21.1 Introduction.......................................................................................................................... 21-1
21.2 Economic Analysis............................................................................................................... 21-1
21.2.1 General.......................................................................................................................... 21-1
21.2.2 Basic Assumptions........................................................................................................ 21-1
21.2.3 Economic Cost.............................................................................................................. 21-4
21.2.4 Economic Benefit ......................................................................................................... 21-5
21.2.5 Annual Cash Flow ........................................................................................................ 21-6
21.2.6 Calculation of NPV and EIRR...................................................................................... 21-8
21.2.7 Sensitivity Analysis....................................................................................................... 21-8
21.3 Other Benefits from the Priority Projects............................................................................. 21-9
21.3.1 Benefits from Trunk Road Improvement Projects ........................................................ 21-9
21.3.2 Benefits from Municipal Road Improvement Project................................................. 21-11
21.4 Conclusions........................................................................................................................ 21-11
22. NECESSARY ACTIONS FOR PROJECT IMPLEMENTATION 22.1 Introduction.......................................................................................................................... 22-1
22.1.1 High Priority Road Programs ....................................................................................... 22-1
22.2 Road improvement Projects in On-going Programs ............................................................ 22-3
22.2.1 Other Road Maintenance Programs .............................................................................. 22-3
23. CONCLUSIONS AND RECOMMENDATIONS 23.1 Conclusions.......................................................................................................................... 23-1
23.2 Recommendations................................................................................................................ 23-3
APPENDIX: Initial Environmental Examination (IEE) Referenced Location Maps
The Project for Rural Road Network Development in Acholi Sub-region in Northern Uganda Final Report Vol.2: Main Report
LIST OF TABLE & FIGURE
< LIST OF TABLE >
Page
Table 2.1-1 Area and Population by Region.................................................................................. 2-3
Table 2.1-2 Population Density by Region in Uganda .................................................................. 2-3
Table 2.1-3 Annual Population Growth Rates by Region in Uganda............................................ 2-3
Table 2.1-4 Areas, Populations and Population Densities of Sub-regions in Northern Uganda ...... 2-3
Table 2.1-5 Annual Population Growth Rates of Sub-regions in Northern Uganda ..................... 2-4
Table 2.1-6 Urban Centres and Populations in Northern Uganda ................................................. 2-5
Table 2.2-1 Number of Lower Local Governments by District..................................................... 2-6
Table 2.2-2 Average Annual Population Growth Rates of Acholi Sub-region, Northern
Region and Uganda .................................................................................................... 2-6
Table 2.2-3 Area, Population and Population Density by District in Acholi Sub-region.............. 2-7
Table 2.2-4 Population Movement in IDP Camps in Acholi Sub-region ...................................... 2-7
Table 2.2-5 Population of IDP Camps, Transit Sites, and Home Villages, July 2011 .................. 2-8
Table 2.2-6 Crop Production by District in Acholi Sub-region................................................... 2-10
Table 2.2-7 Selected Social Indicators of Four Districts in Acholi Sub-region........................... 2-12
Table 2.2-8 Human Development Index (HDI) and Human Poverty Index (HPI) for Four
Districts in Acholi Sub-region (2005) ...................................................................... 2-12
Table 3.1-1 Land Use of Acholi Sub-region in 2005..................................................................... 3-1
Table 3.2-1 Number of Parishes and Villages by District in Acholi Sub-region........................... 3-4
Table 3.3-1 Population Changes in IDP Camps in Acholi Sub-region.......................................... 3-5
Table 3.3-2 Number of IDP Population in Acholi Sub-region ...................................................... 3-6
Table 3.4-1 Population and Growth Rate of Acholi Sub-region.................................................... 3-6
Table 3.4-2 Population Densities in Regions of Uganda............................................................... 3-7
Table 3.4-3 Population and Population Density in Acholi Sub-region in 2002 and 2010............. 3-7
Table 3.5-1 Major Crops in the Study Area................................................................................... 3-8
Table 3.5-2 Estimated Production of Major Crops in Acholi Sub-region in 2008 (ton) ............. 3-10
Table 3.5-3 Estimated Average Production of Crops per Household in Amuru and Lamwo
District (Second Season 2008) ................................................................................. 3-10
Table 3.6-1 Major Tourism Attractions ....................................................................................... 3-13
Table 3.7-1 Number of Water Points and Status by District in 2010 .......................................... 3-14
Table 3.7-2 Number of Health Units by District (May/June 2010) ............................................. 3-16
Table 3.7-3 Number of Schools by District (June 2010) ............................................................. 3-18
Table 3.7-4 Primary Education Accessibility Indicators in 2009 ................................................ 3-18
Table 3.7-5 Basic Requirements for Schools............................................................................... 3-19
- i -

Table 4.1-1 Required Finances for Road Maintenance and Rehabilitation for PRDP................... 4-7
Table 4.1-2 Budget for Road Maintenance and Rehabilitation in the PRDP................................. 4-7
Table 4.2-1 Summary of Transport Investment Expenditure (2008-2023).................................... 4-9
Table 4.2-2 Activities for Roads and Road Sub-sector................................................................ 4-10
Table 4.2-3 National Roads Planned for Upgrading (2008-2023)............................................... 4-10
Table 4.2-4 National Road Network Investment Plan (2008-2023) ............................................ 4-11
Table 4.2-5 Projected Outputs over the 10 years 2008-2018....................................................... 4-11
Table 4.2-6 District, Urban and Community Road Network Investment Plan (2008-2023) ....... 4-12
Table 4.2-7 Activities for Rail Transport Sub-sector................................................................... 4-13
Table 4.2-8 Rail Transport Investment Plan (2008-2023) ........................................................... 4-13
Table 4.2-9 Activities for Air Transport Sub-sector .................................................................... 4-13
Table 4.2-10 Air Transport Investment Plan (2008-2023) ............................................................ 4-14
Table 4.2-11 Activities for Inland Water Transport Sub-sector .................................................... 4-14
Table 4.2-12 Inland Water Transport Investment Plan (2008-2023)............................................. 4-15
Table 4.2-13 DUCARIP Expenditure (Proposed in Final Draft)................................................... 4-17
Table 4.2-14 District Roads Projected Expenditure (Proposed in Final Draft of DUCARIP)....... 4-17
Table 4.3-1 Vision, Mission, Goal and objective of Gulu District .............................................. 4-18
Table 4.3-2 Goal and Strategic Objectives of sectors .................................................................. 4-18
Table 4.3-3 Priority Projects of FY2011/12 ................................................................................ 4-20
Table 4.3-4 Vision, Mission, Goal and objectives of Kitgum District ........................................ 4-23
Table 4.3-5 Goal and Strategic Objectives of sectors .................................................................. 4-23
Table 4.3-6 Details of Priority Projects for FY2011/12 in DDP ................................................. 4-26
Table 4.3-7 Development Goal and Objectives of the DDP and Strategies for Pader District ...... 4-30
Table 4.3-8 Development Programmes in Education Sector ....................................................... 4-34
Table 4.3-9 Development Programmes in Public Works Sector ................................................. 4-35
Table 4.3-10 Development Programmes in Water Sector (1)........................................................ 4-36
Table 4.3-11 Development Programmes in Water Sector (2)........................................................ 4-37
Table 4.3-12 Development Programmes in Health Sector ............................................................ 4-38
Table 4.3-13 Development Programmes in Production Sector...................................................... 4-39
Table 4.3-14 Vision, Mission, Goals and Objectives of Lamwo District ...................................... 4-40
Table 4.3-15 Strategic Objectives.................................................................................................. 4-41
Table 4.3-16 Priority Projects for FY 2009/2010 in DDP ............................................................. 4-41
Table 4.3-17 Priority Projects for Sub-counties of FY 2009/2010 in DDP ................................... 4-45
Table 4.3-18 Vision, Mission, Goals and Objectives of Agago District........................................ 4-49
Table 4.3-19 Priority Projects for FY2011/2012 ........................................................................... 4-51
Table 4.3-20 Priority Programmes for Mid-Term Development ................................................... 4-53
Table 4.3-21 Vision, Mission, Goals and Objectives of Gulu Municipality.................................. 4-54
Table 4.3-22 Priority Projects for FY2011- (1) ............................................................................. 4-55
Table 4.3-23 Priority Projects for FY2011- (2) ............................................................................. 4-56
- ii -

The Project for Rural Road Network Development in Acholi Sub-region in Northern Uganda Final Report Vol.2: Main Report
Table 4.3-24 Priority Projects for FY2011- (Unfunded Priorities)................................................ 4-57
Table 4.4-1 CAIIP Projects in Acholi Sub-region ....................................................................... 4-62
Table 5.2-1 Road Length by Sub-county and Road Categories..................................................... 5-4
Table 5.2-2 Road Development Status .......................................................................................... 5-5
Table 5.2-3 Road Widths in Road Network................................................................................... 5-6
Table 5.2-4 Road Surface Type in Road Network......................................................................... 5-7
Table 5.2-5 Description of Level of Roughness ............................................................................ 5-7
Table 5.2-6 Road Maintenance Condition in Road Network......................................................... 5-8
Table 5.3-1 Territorial Structure .................................................................................................. 5-12
Table 5.3-2 Population by State in 2008...................................................................................... 5-12
Table 5.3-3 Major Ethnic Groups in South Sudan....................................................................... 5-13
Table 5.3-4 Estimated GDP and GDP per capita in South Sudan ............................................... 5-14
Table 5.3-5 Estimated GNI and GNI per capita in South Sudan ................................................. 5-14
Table 5.3-6 Project Status for Gulu-Nimule Section ................................................................... 5-16
Table 5.3-7 Road Projects in Juba City ....................................................................................... 5-23
Table 5.3-8 Core Targets and Development Outcome Objectives of SSDP Priorities ................ 5-25
Table 5.3-9 Comparison of 3 Corridors....................................................................................... 5-27
Table 5.3-10 List of Interviewees .................................................................................................. 5-31
Table 5.3-11 Survey Schedule ....................................................................................................... 5-32
Table 5.3-12 Discussion Memo ..................................................................................................... 5-33
Table 5.4-1 Priority Sections of CARs in Gulu District .............................................................. 5-36
Table 5.4-2 Priority Sections of CARs in Agago District ........................................................... 5-38
Table 5.4-3 Priority Sections of CARs in Pader District ............................................................. 5-40
Table 5.4-4 Priority Sections of CARs in Kitgum District .......................................................... 5-42
Table 5.4-5 Priority Sections of CARs in Lamwo District .......................................................... 5-43
Table 6.4-1 Traffic Count Results ................................................................................................. 6-4
Table 6.4-2 Traffic Count Results in Gulu Township ................................................................... 6-6
Table 6.4-3 Number of Residents in a Household......................................................................... 6-9
Table 7.2-1 2002-2017 Population Projection by UBOS .............................................................. 7-1
Table 7.2-2 2002-2017 Population Projection in the Study Area by UBOS ................................. 7-2
Table 7.2-3 1990-2030 Population Projection by UN ................................................................... 7-2
Table 7.2-4 Populations by District in Acholi Sub-region............................................................. 7-3
Table 7.3-1 Summary of Results of Population Projection in the Study Area .............................. 7-3
Table 8.1-1 Land Development Issues in the Study Area.............................................................. 8-1
Table 8.1-2 Required and Current Numbers of Water Points in the Study Area........................... 8-5
- iii -
Table 8.1-3 Required and Current Numbers of Health Facilities in the Study Area ..................... 8-6
Table 8.1-4 Comparative Mortality Figure in 2006....................................................................... 8-6
Table 8.1-5 Primary School Enrolment Ratio in 2009................................................................... 8-7
Table 8.3-1 Environmental Problems in Urban Areas................................................................. 8-10
Table 8.3-2 Environmental Socio-economic Issues..................................................................... 8-11
Table 8.3-3 Environmental Issues in Nature................................................................................ 8-12
Table 9.3-1 Major Agricultural Products in Acholi Sub-region .................................................... 9-2
Table 9.3-2 Score for the Agricultural Potential Analysis............................................................. 9-3
Table 9.3-3 Area of Farm Land, Grass Land and Bush by District 2005 ...................................... 9-4
Table 9.3-4 Number of Visitors to National Parks in Uganda 2006 - 2009................................... 9-7
Table 9.3-5 Grading for the Land Development Analysis............................................................. 9-8
Table 9.4-1 Results of SWOT Analysis and Strategies ............................................................... 9-10
Table 9.5-1 Vision of 5 Year Development Plan of each District ............................................... 9-12
Table 9.6-1 Comparison between Single and Double Corridor Development ............................ 9-16
Table 9.6-2 Major Function of Proposed Service Centres........................................................... 9-23
Table 9.6-3 Major Functions of Proposed Road Network ........................................................... 9-26
Table 9.6-4 Area by Land Use Category in Gulu Municipality................................................... 9-30
Table 9.6-5 Area by Land Use Category in Kitgum Town.......................................................... 9-33
Table 10.3-1 Amendment of Zoning System................................................................................. 10-3
Table 10.4-1 Definition of Free Flow Speed in Road Network..................................................... 10-4
Table 10.4-2 Definition of Capacity (PCU/day)............................................................................ 10-5
Table 10.5-1 Estimated Gross Person Trip Production Rate (Trip/ Person/Day) .......................... 10-6
Table 10.5-2 Estimated Population by Employment Status in 2011 ............................................. 10-6
Table 10.5-3 Estimated Person Trip Production in 2011............................................................... 10-7
Table 10.5-4 Internal Trip Ratio .................................................................................................... 10-7
Table 10.5-5 Average Vehicle Occupancy Rate and PCU ............................................................ 10-7
Table 10.6-1 Estimated Population by Employment Status in 2018 ............................................. 10-8
Table 10.6-2 Estimated Population by Employment Status in 2030 ............................................. 10-8
Table 10.6-3 Estimated Person Trip Production in 2018............................................................... 10-9
Table 10.6-4 Estimated Person Trip Production in 2030............................................................... 10-9
Table 10.6-5 Number of Registered Vehicles by Type ................................................................. 10-9
Table 10.6-6 Gross Domestic Products (GDP).............................................................................. 10-9
Table 10.6-7 Elasticity of Vehicle Registration and GDP Growth by Mode............................... 10-10
Table 10.6-8 Projected Annual GDP Growth Rate...................................................................... 10-10
Table 10.6-9 Expansion Factor .................................................................................................... 10-10
Table 10.6-10 Traffic Assignment Cases....................................................................................... 10-11
- iv -
The Project for Rural Road Network Development in Acholi Sub-region in Northern Uganda Final Report Vol.2: Main Report
Table 11.1-1 Functional Road Classification System in Japan...................................................... 11-2
Table 11.1-2 Functional Road Classification System for National Roads in Uganda ................... 11-2
Table 11.1-3 Functional Road Classification System for District Roads in Uganda..................... 11-3
Table 11.1-4 Proposed Method of Using Existing Two Systems of Functional Road
Classification in an Integrated Manner..................................................................... 11-3
Table 11.1-5 Major Functions of Functional Road Classes in Integrated Method of Using
Existing Two Systems of Functional Road Classification ....................................... 11-4
Table 11.1-6 Proposed Functional Road Classification................................................................. 11-4
Table 11.1-7 Level of Service Characteristics by Road Type ....................................................... 11-5
Table 11.3-1 Main Structure of Proposed Road Network in 2018 .............................................. 11-10
Table 11.3-2 Main Structure of Proposed Road Network in 2030 .............................................. 11-11
Table 12.2-1 Legal Framework for Environmental and Social Considerations in Uganda ........... 12-4
Table 12.2-2 Conditions of EIA requirements............................................................................... 12-5
Table 12.3-1 Forest Reserves in the Study Area.......................................................................... 12-10
Table 12.3-2 Average Household Size ........................................................................................ 12-12
Table 12.3-3 Average Monthly Household Income .................................................................... 12-12
Table 12.3-4 Household Income Classes 2009/10 (%)................................................................ 12-12
Table 12.3-5 Consumption Expenditures per Household (2005/06 prices)................................. 12-13
Table 12.3-6 Household Cooking Fuel (%)................................................................................. 12-13
Table 12.3-7 Type of Toilet Facilities of Households (%) .......................................................... 12-14
Table 12.3-8 Environmental Problems in Urban Areas............................................................... 12-15
Table 12.3-9 Environmental Issues from the Socio-economy perspective.................................. 12-16
Table 12.3-10 Environmental Issues in Nature.............................................................................. 12-17
Table 12.4-1 List of Regional Trunk Road Network 2018.......................................................... 12-19
Table 12.4-2 List of Regional Trunk Road Network 2030.......................................................... 12-20
Table 12.4-3 Indicators for Priority Evaluation-1........................................................................ 12-24
Table 12.4-4 Indicators for Priority Evaluation-2........................................................................ 12-25
Table 12.4-5 Rating of Alternative-1........................................................................................... 12-27
Table 12.4-6 Rating of Alternative-2........................................................................................... 12-28
Table 12.4-7 Rating of Alternative-3........................................................................................... 12-29
Table 12.4-8 Comparison and Evaluation of the Alternatives..................................................... 12-31
Table 13.1-1 Road Length in Uganda............................................................................................ 13-2
Table 13.1-2 Road Ratio by Region in Uganda............................................................................. 13-2
Table 13.1-3 Length of National Roads by UNRA’s Administrative Area................................... 13-3
Table 13.1-4 Length of District Roads by District and by Region ................................................ 13-4
Table 13.2-1 Road Sector Investment and Recurrent Expenditure, 2000/2001-2005/2006 and
2009/2010 & 2010/2011........................................................................................... 13-9
- v -
Table 13.2-2 Budget and Actual Expenditure of DUCAR for 2003/04 -2006/07 ....................... 13-10
Table 13.2-3 Planned and Actual Physical Performance of DUCAR for 2003/04-2006/07........ 13-10
Table 13.2-4 Ceiling Budget of the Uganda Road Fund (URF) .................................................. 13-11
Table 13.2-5 PRDP funding by Priority Programme (FY2009/10-FY2010/11).......................... 13-11
Table 13.2-6 Acholi Sub-region PRDP Expenditure FY2009/10................................................ 13-12
Table 13.2-7 Budget Allocation Plan of U-Growth..................................................................... 13-13
Table 13.2-8 Investment Plan for the Road Sub-sector, 2008-2023 ............................................ 13-14
Table 13.3-1 Equipment Plan to be Provided to District and its Operation Cost ........................ 13-15
Table 13.3-2 Human Resources and its Salary Scale for Operation to District ........................... 13-15
Table 13.3-3 Maintenance Cost for the Equipment to District .................................................... 13-15
Table 13.3-4 Sample Form of Annual Work Plan for Road Maintenance................................... 13-19
Table 13.3-5 Budget Expenditure and Planning of Road Maintenance in Gulu.......................... 13-20
Table 13.3-6 Periodic Maintenance and Rehabilitation Roads in the Annual Work Plan
FY2011/12.............................................................................................................. 13-21
Table 13.3-7 Important CARs of Gulu District (Needs further funds for maintenance) ............. 13-21
Table 13.3-8 The Roads that Need Additional Funds to be Rehabilitated................................... 13-22
Table 13.3-9 CARs Which Need to be Rehabilitated with Additional Funding.......................... 13-22
Table 13.3-10 Bottle Neck Sections of Gulu District .................................................................... 13-23
Table 13.3-11 Inventory of Machinery and its Condition ............................................................. 13-23
Table 13.3-12 Budget Expenditure and Planning of Road Maintenance in Kitgum ..................... 13-24
Table 13.3-13 Work Plan for Periodic and Rehabilitation Maintenance in FY 2011/12............... 13-25
Table 13.3-14 CARs Maintenance Included in Work Plan FY 2011/12 ....................................... 13-25
Table 13.3-15 Roads Planned to be Upgraded from CARs to District Roads in FY 2011/12....... 13-26
Table 13.3-16 Inventory of Equipment and its Condition (Kitgum) ............................................. 13-26
Table 13.3-17 Budget Expenditure and Planning for Road Maintenance in Lamwo .................... 13-27
Table 13.3-18 Work Plan of Periodic and Rehabilitation Maintenance in FY 2011/12 ................ 13-28
Table 13.3-19 Community Access Roads Included in the Work Plan of FY 2011/12 .................. 13-28
Table 13.3-20 Unfunded Prioritized District Roads/Sections........................................................ 13-29
Table 13.3-21 Unfunded Community Access Roads..................................................................... 13-29
Table 13.3-22 Budget Expenditure and Planning for Road Maintenance in Pader ....................... 13-30
Table 13.3-23 Work plan of Periodic and Rehabilitation Maintenance in FY 2011/12 in Pader .. 13-31
Table 13.3-24 Bottle Neck Sections of the District ....................................................................... 13-32
Table 13.3-25 Inventory of Equipment and its Condition (Pader)................................................. 13-32
Table 13.3-26 Budget Expenditure and Planning for Road Maintenance in Agago...................... 13-33
Table 13.3-27 Rough lengths of the Roads in Agago District. ...................................................... 13-33
Table 13.3-28 Capacity Assessment (Individual Level) of District............................................... 13-34
Table 13.3-29 Capacity Assessment (Organization Level) ........................................................... 13-36
Table 13.3-30 Capacity Assessment (Society Level) .................................................................... 13-38
Table 13.4-1 Allocation of Road Sector Budget.......................................................................... 13-39
- vi -

The Project for Rural Road Network Development in Acholi Sub-region in Northern Uganda Final Report Vol.2: Main Report
Table 13.4-2 Allocation of URF to UNRA.................................................................................. 13-39
Table 14.1-1 Issues at the National and District/Regional levels in Road Maintenance ............... 14-2
Table 14.1-2 Countermeasures at the National and District/Regional levels in Road
Maintenance ............................................................................................................. 14-4
Table 14.2-1 Capacity Required of District Officer ...................................................................... 14-6
Table 14.2-2 Training Options for Capacity Development ........................................................... 14-6
Table 14.2-3 Necessary Manuals/Guidelines ................................................................................ 14-7
Table 14.5-1 Equipment Provided to District and its Operation Cost ........................................... 14-9
Table 14.5-2 Human Resources and Salary Scale for Operation to District.................................. 14-9
Table 14.5-3 Maintenance Cost for the Equipment to District ...................................................... 14-9
Table 14.6-1 Current Training Courses of MELTC .................................................................... 14-10
Table 14.6-2 New Curriculum and Research Subjects for MELTC............................................ 14-11
Table 14.7-1 New Curriculum Courses for the University.......................................................... 14-11
Table 14.8-1 Road and Bridge Projects of PRDP2...................................................................... 14-12
Table 15.1-1 Road Survey Forms .................................................................................................. 15-3
Table 16.1-1 List of Priority Projects ............................................................................................ 16-2
Table 16.3-1 Program Evaluations ................................................................................................ 16-7
Table 17.2-1 General Schedule of the Pilot Project....................................................................... 17-4
Table 17.2-2 Criteria of the Targeted Route for the Pilot Project.................................................. 17-5
Table 17.4-1 Major Works (Gulu) ................................................................................................. 17-7
Table 17.4-2 Results of the Tendering (Gulu) ............................................................................... 17-8
Table 17.4-3 Summary of Financial Statement (Gulu).................................................................. 17-9
Table 17.5-1 Major Works (Kitgum)........................................................................................... 17-12
Table 17.5-2 Results of the Tendering (Kitgum)......................................................................... 17-13
Table 17.5-3 Summary of Financial Statement (Kitgum)............................................................ 17-14
Table 17.6-1 Population and No of Households along Awari–Anget Road................................ 17-17
Table 17.6-2 No of Students along Awari–Anget Road .............................................................. 17-17
Table 17.6-3 Population and No of Households along Jangyat Road ......................................... 17-18
Table 18.1-1 Functional Road Class.............................................................................................. 18-2
Table 18.1-2 Design Class ............................................................................................................. 18-2
Table 18.1-3 Design Classes for District Roads ............................................................................ 18-4
Table 18.2-1 Geometrical Design Outlines for Gulu- Atiak-Nimule ............................................ 18-7
Table 18.2-2 Geometrical Design Parameters for Lira- Kitgum Road .......................................... 18-9
- vii -

Table 19.1-1 Basic Construction Material Price Indices ............................................................... 19-2
Table 19.2-1 Project Cost Summary for IT1 (USD)...................................................................... 19-3
Table 19.2-2 Project Costs Summary for IR1 and IR2 (USD) ...................................................... 19-4
Table 19.2-3 Project Cost Summary for MR1 (USD) ................................................................... 19-4
Table 20.1-1 Specifications of the Priority Roads According to the Adopted Roads
Classification ............................................................................................................ 20-1
Table 20.1-2 Classification System of the IT, IR and ID Roads ................................................... 20-2
Table 20.1-3 Length Specifications of the Priority Roads and Bridges......................................... 20-2
Table 20.1-4 Recorded Length of the Investigated Priority Roads According to Districts (km) .. 20-2
Table 20.1-5 Main Components of the City Roads Project in Gulu .............................................. 20-3
Table 20.1-6 Name and Geographical Distribution of the Priority City Roads According to
the Municipal Divisions ........................................................................................... 20-3
Table 20.1-7 Geographical Distribution of the Priority City Roads According to the
Sub-wards ................................................................................................................. 20-4
Table 20.2-1 Road stretches Defined along the Priority Roads for the Field Counting Survey .... 20-5
Table 20.2-2 Checklist of the Protected Areas in the Priority Roads Project Area ....................... 20-6
Table 20.2-3 Central and Local Forest Reserves along the Priority Roads ................................... 20-6
Table 20.2-4 Specifications of the Central Forest Reserves Roadside and at less than 5km......... 20-7
Table 20.2-5 Specifications of the Local Forest Reserves Roadside ............................................. 20-7
Table 20.2-6 Categories of Natural Habitats Observed along the Investigated Priority Roads..... 20-8
Table 20.2-7 List of the Wetlands Crossed by the Investigated Priority Roads ............................ 20-9
Table 20.2-8 Forest and Forest Products along the Priority Roads.............................................. 20-10
Table 20.2-9 Number of Reserved Trees and Important Trees in the Road Reserve of the
Investigated Priority Roads .................................................................................... 20-11
Table 20.3-1 Population of Sub-Counties and Parishes Crossed by the Priority Roads.............. 20-12
Table 20.3-2 Population of Villages LC1 Crossed by the Priority Roads ................................... 20-14
Table 20.3-3 Summary of Population and Social Environment Data.......................................... 20-17
Table 20.3-4 Functional Drinking Water Sources Roadside (Number)....................................... 20-17
Table 20.3-5 Sites of Cultural Value for the Local Community (Number) ................................. 20-21
Table 20.3-6 Number of Borrow Pits and Selected Roadside Settlements along the
Investigated Priority Roads .................................................................................... 20-23
Table 20.3-7 Number of Houses or Housing Compounds in the Road Reserve.......................... 20-23
Table 20.3-8 Number of Shops and Workshops in the Road Reserve......................................... 20-24
Table 20.4-1 Population according to the Municipal Divisions .................................................. 20-25
Table 20.4-2 Population according to the Municipal Wards of Concern .................................... 20-26
Table 20.4-3 Main Environmental Issues Raised by the Municipal Division Development
Plans and Relationship with the City Roads Project and the City Approach
Roads ...................................................................................................................... 20-26
- viii -

The Project for Rural Road Network Development in Acholi Sub-region in Northern Uganda Final Report Vol.2: Main Report
Table 20.4-4 Main Environmental Issues Raised by the Municipal Divisions Development
Plans and Relationship with the City Roads Project and the Inner City Roads ..... 20-27
Table 20.4-5 Checklist of Bad Spots Roads in Terms of Traffic Accidents................................ 20-27
Table 20.4-6 Checklist of Categories of Complaints of Gulu Citizens about the Living
Environment ........................................................................................................... 20-27
Table 20.4-7 Number of the Human Settlements along the Approach City Roads Sections....... 20-28
Table 20.4-8 Number of the Human Settlements along the Inner City Roads Sections.............. 20-29
Table 20.4-9 Number of Trees along the Approach City Roads Roadside.................................. 20-29
Table 20.4-10 Number of Trees along the Inner City Roads and all Located in the Road
Reserve ................................................................................................................... 20-29
Table 20.4-11 Background Information of the Targets of Interview Survey ................................ 20-30
Table 20.4-12 Opinions about the Project ..................................................................................... 20-30
Table 20.4-13 Shop Activities ....................................................................................................... 20-31
Table 20.4-14 Living Conditions................................................................................................... 20-31
Table 20.4-15 Results of Interviews with the Concerned Associations ........................................ 20-32
Table 20.4-16 Estimated Number of Members in the Motorcycle Rider's Associations............... 20-33
Table 20.5-1 Land Tenure System along the Priority Roads....................................................... 20-34
Table 20.6-1 Summary of Legislative and Regulatory Requirements for Environmental
Assessment of Projects ........................................................................................... 20-42
Table 20.7-1 Potential Impacts Sources of the Priority Road Projects ........................................ 20-45
Table 20.7-2 Scoping of the Physical and Natural Environmental Considerations the Study..... 20-45
Table 20.7-3 Scoping of the Human and Social Environmental Considerations Study .............. 20-47
Table 20.8-1 Summary of the Methods for the Execution of the IEE Study ............................... 20-49
Table 20.8-2 Identification of the Evaluation Methods for the Physical and Natural
Environmental Considerations Study of the National Priority Road Projects........ 20-50
Table 20.8-3 Identification of the Evaluation Methods for the Social and Human
Environmental Considerations Study of the National Priority Roads Project........ 20-52
Table 20.8-4 Environmental Impact Indicators Used for the Field Counting Survey ................. 20-53
Table 20.8-5 Sensitivity Criteria Used at Step 2 of the Analysis of the Data and Weighting
Factor Used for Each Criteria................................................................................. 20-54
Table 20.8-6 Number of Sub-Counties, Parishes, and Villages Concerned by the Villages
LC1 Survey............................................................................................................. 20-55
Table 20.8-7 Environmental Impact Criteria and Indicators Used for the Villages LC1 Survey 20-55
Table 20.8-8 Questions of the Interview Survey for the Gulu City Roads Project...................... 20-56
Table 20.8-9 Impact Assessment Procedure of the UNRA Projects in Relationship with the
Priority Roads Project ............................................................................................ 20-58
Table 20.8-10 Coverage Ratio of Priority Projects within the Scope of the Olwiyo - Gulu -
Kitgum Road Project .............................................................................................. 20-58
- ix -

Table 20.8-11 Coverage Ratio of Priority Projects within the Scope of the Rwenkunye - Apac
- Lira - Kitgum - Musingo Road Project ................................................................ 20-58
Table 20.8-12 Delimitation of the IEE Study according to the Available ESIA Studies .............. 20-58
Table 20.8-13 Summary of the Methods of Evaluation in the ESIA Studies ................................ 20-59
Table 20.8-14 List of Maps Attached in Appendix of the IEE Study............................................ 20-60
Table 20.9-1 Reference values used for the ranking of sensitivity of the road stretches............. 20-61
Table 20.9-2 Sensitivity Level of Road Stretches according to the Reserved Trees Indicator.... 20-62
Table 20.9-3 Sensitivity Level of Road Stretches according to the Important Trees Indicator ... 20-62
Table 20.9-4 Sensitivity Level of Road Stretches according to the Tree Plantations Indicator .. 20-62
Table 20.9-5 High Sensitivity Road Stretches according to the Charcoal Products Indicator..... 20-63
Table 20.9-6 Summary of Sensitivity of Roads according to Indicators of the Natural and
Physical Conditions ................................................................................................ 20-63
Table 20.9-7 Ranking of Sensitivity of the Natural Environment at Road Level........................ 20-63
Table 20.9-8 Population in the Project Area of Priority Roads ................................................... 20-64
Table 20.9-9 Main Issues Raised by the Results of the Villages LC1 Survey............................. 20-64
Table 20.9-10 Potential Impacts on the Physical and Natural Environment ................................. 20-64
Table 20.9-11 Potential Impacts on the Human and Social Environment ..................................... 20-67
Table 20.9-12 Potential Impacts on the Environment and Conditions of Improvement ............... 20-69
Table 20.9-13 Areas Most Affected by the City Roads Project..................................................... 20-71
Table 20.10-1 Specifications of the Similar Projects and Field Visits .......................................... 20-73
Table 20.10-2 Main Results of Analysis of Similar Projects......................................................... 20-73
Table 20.10-3 Detailed Review of Main Issues Raised by the Similar Projects............................ 20-75
Table 20.10-4 Environmental Management and Monitoring in Similar Project Cases ................. 20-78
Table 20.11-1 Environmental Monitoring of Impacts on the Physical and Natural Environment 20-79
Table 20.12-1 Field Observation with the District Officers and NFA in November 2011............ 20-82
Table 20.12-2 List of Participants to the Meeting Organized on 6th December 2011 in Kitgum .20-83
Table 20.12-3 List of the Main Administrative Stakeholders Met by the JICA Study Team for
the Gulu City Roads Project ................................................................................... 20-83
Table 20.12-4 List of the Main Associations Met by the JICA Study Team for the Gulu City
Roads Project.......................................................................................................... 20-84
Table 21.2-1 Vehicle Operating Cost by Vehicle Type (at Economic Prices, as of 2009)............ 21-2
Table 21.2-2 Changing rates of Core CPI and Exchange rates from 2009 to 2011....................... 21-2
Table 21.2-3 Vehicle Operating Cost by Vehicle Type (at Economic Prices, as of 2011)............ 21-3
Table 21.2-4 Passenger Travel Time Cost by Vehicle Type (as of 2009) ..................................... 21-3
Table 21.2-5 Passenger Travel Time Cost by Vehicle Type (as of 2011) ..................................... 21-3
Table 21.2-6 Annual Growth Rate of GDP per Capita in Uganda from 2001 to 2010.................. 21-3
Table 21.2-7 Investment Cost for Trunk Road Improvement Projects (IT1, IR1 and IR2,
economic cost).......................................................................................................... 21-4
- x -

The Project for Rural Road Network Development in Acholi Sub-region in Northern Uganda Final Report Vol.2: Main Report
Table 21.2-8 Maintenance Cost for Trunk Road Improvement Projects (IT1, IR1 and IR2,
economic cost).......................................................................................................... 21-4
Table 21.2-9 Estimated VOC and Travel Time Cost (IT1) ........................................................... 21-5
Table 21.2-10 Estimated VOC and Travel Time Cost (IR1) ........................................................... 21-5
Table 21.2-11 Estimated VOC and Travel Time Cost (IR2) ........................................................... 21-5
Table 21.2-12 Annual Cash Flow of IT1......................................................................................... 21-6
Table 21.2-13 Annual Cash Flow of IR1......................................................................................... 21-7
Table 21.2-14 Annual Cash Flow of IR2......................................................................................... 21-7
Table 21.2-15 NPV and EIRR of Trunk Road Improvement Projects ............................................ 21-8
Table 21.2-16 Results of Sensitivity Analysis................................................................................. 21-9
Table 21.3-1 Results of Traffic Count Survey in Gulu (as of June 2011) ................................... 21-11
Table 22.2-1 On-going Programs and Selection Criteria of Road Projects ................................... 22-3
- xi -

< LIST OF FIGURE >
Page
Figure 2.1-1 Acholi Sub-region in Northern Uganda...................................................................... 2-2
Figure 2.1-2 Major Urban Centres in Acholi Sub-region and Northern Uganda ............................ 2-4
Figure 2.2-1 Distribution of IDP Camps and Transit Sites in Acholi Sub-region .......................... 2-9
Figure 3.1-1 Land Cover Map of Acholi Sub-region in 2005......................................................... 3-2
Figure 3.1-2 Topography of Acholi Sub-region.............................................................................. 3-3
Figure 3.1-3 Average Rainfall in Gulu and Kampala 2006 - 2010 ................................................. 3-3
Figure 3.2-1 Local Government Hierarchy ..................................................................................... 3-4
Figure 3.2-2 Administrative Boundary of Study Area .................................................................... 3-5
Figure 3.4-1 Population Density by Sub-county in Acholi Sub-region in 2010 ............................. 3-8
Figure 3.5-1 Estimated Production of Major Crops in Acholi Sub-region in 2008 (ton)................ 3-9
Figure 3.5-2 Cropping Schedule ................................................................................................... 3-11
Figure 3.6-1 Locations of Major Trading Centres in Acholi Sub-region...................................... 3-12
Figure 3.6-2 Different Types of Middlemen Active in relation to Acholi Sub-region ................. 3-13
Figure 3.6-3 National Parks in Uganda......................................................................................... 3-14
Figure 3.7-1 Location of Water Points.......................................................................................... 3-15
Figure 3.7-2 Uganda Health Structure .......................................................................................... 3-16
Figure 3.7-3 Location of Health Units in Acholi Sub-region in 2011........................................... 3-17
Figure 3.7-4 Locations of Educational Facilities in Acholi Sub-region in 2011........................... 3-18
Figure 3.7-5 School Management Structure.................................................................................. 3-20
Figure 4.1-1 Relationship between PRDP and PEAP ..................................................................... 4-5
Figure 4.2-1 National Road and Inland Water Networks (2023) .................................................. 4-15
Figure 5.1-1 Average Rainfall Variation by Month ........................................................................ 5-1
Figure 5.2-1 Road Network in Study Area ..................................................................................... 5-3
Figure 5.2-2 Road Network with Population Density in Study Area.............................................. 5-3
Figure 5.2-3 Road Widths in Road Network................................................................................... 5-5
Figure 5.2-4 Road Surface Type in Road Network......................................................................... 5-6
Figure 5.2-5 Road Maintenance Condition in Road Network......................................................... 5-8
Figure 5.2-6 Location of Existing Bridges...................................................................................... 5-9
Figure 5.2-7 Location of Existing Culverts..................................................................................... 5-9
Figure 5.2-8 Maintenance Conditions........................................................................................... 5-11
Figure 5.3-1 Population Distribution in 2008 ............................................................................... 5-13
Figure 5.3-2 Trade between Sudan and Uganda (million USD) ................................................... 5-15
Figure 5.3-3 Prices of Agricultural Products in South Sudan and Uganda (Ushs. per kg) ........... 5-16
- xii -
The Project for Rural Road Network Development in Acholi Sub-region in Northern Uganda Final Report Vol.2: Main Report
Figure 5.3-4 Juba City Map .......................................................................................................... 5-21
Figure 5.3-5 Road Projects in Juba City ....................................................................................... 5-22
Figure 5.3-6 Public Transport Coverage Area in Juba.................................................................. 5-23
Figure 5.3-7 International Road Corridors.................................................................................... 5-26
Figure 5.3-8 White Nile River Transport in Sudan....................................................................... 5-28
Figure 5.3-9 Green Belt in South Sudan ....................................................................................... 5-29
Figure 5.3-10 Prioritized Feeder Roads .......................................................................................... 5-30
Figure 5.4-1 Acholi Road Network includes Priority Sections of CARs...................................... 5-36
Figure 6.2-1 Cordon-line (Traffic Count) Survey Locations .......................................................... 6-1
Figure 6.2-2 Survey Locations in Gulu Township.......................................................................... 6-2
Figure 6.4-1 Traffic Count Results ................................................................................................. 6-4
Figure 6.4-2 Zoning Map of Gulu Township.................................................................................. 6-5
Figure 6.4-3 Traffic Count Results in Gulu Township ................................................................... 6-6
Figure 6.4-4 Hourly Traffic Variation at C13 ................................................................................. 6-7
Figure 6.4-5 Hourly Traffic Variation at C14 ................................................................................. 6-7
Figure 6.4-6 Traffic Composition at C13........................................................................................ 6-8
Figure 6.4-7 Desire Lines................................................................................................................ 6-8
Figure 6.4-8 Travel Purposes by Vehicle Category ........................................................................ 6-9
Figure 6.4-9 Employment Status................................................................................................... 6-10
Figure 6.4-10 Monthly Income ....................................................................................................... 6-12
Figure 6.4-11 Vehicle Ownership (Vehicle) ................................................................................... 6-13
Figure 6.4-12 Vehicle Ownership (Motor-Bike)............................................................................. 6-14
Figure 6.4-13 Vehicle Ownership (Bicycle) ................................................................................... 6-15
Figure 8.1-1 Monthly Consumption Expenditure per Household 2009/10 (2005/06 price) ........... 8-2
Figure 8.1-2 Household Main Food Source .................................................................................... 8-2
Figure 8.1-3 Cropping Calendar ..................................................................................................... 8-3
Figure 8.1-4 Number of Pupils per Teacher and Classroom, 2006 to 2009.................................... 8-7
Figure 9.2-1 Map of Acholi Sub-region.......................................................................................... 9-2
Figure 9.3-1 Grade of Integrated Agricultural Productivity by Sub-county 2008 .......................... 9-3
Figure 9.3-2 Area of Area of Farm Land, Grass Land and Bush in Acholi Sub-region 2005 ........ 9-4
Figure 9.3-3 Destination for Exports of Uganda 2005 - 2009......................................................... 9-5
Figure 9.3-4 Urban Population of Uganda and Juba in 2011.......................................................... 9-6
Figure 9.3-5 Future Land Use Plan of Gulu Municipality .............................................................. 9-7
Figure 9.3-6 Land Development Suitability Map ........................................................................... 9-9
Figure 9.4-1 Relation between the Result of the SWOT Analysis and Strategies ........................ 9-12
Figure 9.6-1 Schematic Image of Spatial Structure Alternatives.................................................. 9-16
- xiii -

Figure 9.6-2 Spatial Structure and Development Scenario in Broad Context............................... 9-18
Figure 9.6-3 Rough Idea of Proposed Spatial Structure................................................................ 9-18
Figure 9.6-4 Population Density in 2010 and 2030....................................................................... 9-20
Figure 9.6-5 Administrative Centres in Acholi Sub-region .......................................................... 9-20
Figure 9.6-6 Major Trading Centres ............................................................................................. 9-21
Figure 9.6-7 Major Service Centres in the Study Area ................................................................. 9-22
Figure 9.6-8 Proposed Service Centres for Strategic Development.............................................. 9-22
Figure 9.6-9 Population Density with Road Network in 2010 and 2030 ...................................... 9-24
Figure 9.6-10 Agricultural Area with Road Network ..................................................................... 9-24
Figure 9.6-11 Distribution of Schools, Health Facilities and Water Points .................................... 9-25
Figure 9.6-12 Preferable Network for Regional Development ....................................................... 9-26
Figure 9.6-13 Proposed Future Spatial Structure ............................................................................ 9-29
Figure 9.6-14 Existing Land Use in Gulu Municipality.................................................................. 9-30
Figure 9.6-15 3D Image of Gulu Municipality based upon Existing Land Use.............................. 9-31
Figure 9.6-16 Concept Plan of Proposed Urban Land Use in Gulu ................................................ 9-32
Figure 9.6-17 Existing Land Use in Kitgum Town......................................................................... 9-33
Figure 9.6-18 3D Image of Kitgum Town Council based on Existing Land Use ........................... 9-34
Figure 9.6-19 Concept Plan of Proposed Urban Land Use in Kitgum............................................ 9-35
Figure 10.2-1 Flow of Traffic Demand Forecast ............................................................................ 10-2
Figure 10.4-1 Existing Road Network in Study Area ..................................................................... 10-4
Figure 10.4-2 Defined Road Capacity in Study Area ..................................................................... 10-5
Figure 10.6-1 Desire Lines in 2018 (All Vehicles) ....................................................................... 10-10
Figure 10.6-2 Desire Lines in 2030 (All Vehicles) ....................................................................... 10-11
Figure 10.6-3 Traffic Assignment Result in Case 0 (Do Nothing, 2018) ..................................... 10-12
Figure 10.6-4 Traffic Assignment Result in Case 1 (with Kitgum-Lira Improvement, 2018)...... 10-12
Figure 10.6-5 Traffic Assignment Result in Case 2 (with Gulu-Kitgum, 2018)........................... 10-13
Figure 10.6-6 Traffic Assignment Result in Case 3 (with All NR, 2018)..................................... 10-13
Figure 10.6-7 Traffic Assignment Result in Case 0 (Do Nothing, 2030) ..................................... 10-14
Figure 10.6-8 Traffic Assignment Result in Case 1 (with Kitgum-Lira Improvement, 2030)...... 10-14
Figure 10.6-9 Traffic Assignment Result in Case 2 (with Gulu-Kitgum, 2030)........................... 10-15
Figure 10.6-10 Traffic Assignment Result in Case 3 (with All NR, 2030)..................................... 10-15
Figure 11.1-1 General Flow of Road Network Planning ................................................................ 11-5
Figure 11.2-1 Road Network Development Concept in 2018......................................................... 11-7
Figure 11.2-2 Road Network Development Concept in 2030......................................................... 11-9
Figure 11.3-1 Proposed Road Network in 2018............................................................................ 11-10
Figure 11.3-2 Proposed Road Network in 2030............................................................................ 11-11
- xiv -

The Project for Rural Road Network Development in Acholi Sub-region in Northern Uganda Final Report Vol.2: Main Report
Figure 12.2-1 EIA Process Flow for Road Projects ........................................................................ 12-6
Figure 12.3-1 Slope Condition in the Study Area........................................................................... 12-7
Figure 12.3-2 River System in the Study Area ............................................................................... 12-8
Figure 12.3-3 Locations of Protected Areas in the Study Area....................................................... 12-9
Figure 12.4-1 Regional Trunk Road Network 2018 ..................................................................... 12-19
Figure 12.4-2 Regional Trunk Road Network 2030 ..................................................................... 12-20
Figure 12.4-3 Alternative-1 of Priority Trunk Road Network: Economy Focused ...................... 12-26
Figure 12.4-4 Alternative-2 of Priority Trunk Road Network: Balance Focused......................... 12-28
Figure 12.4-5 Alternative-3 of Priority Trunk Road Network: Environmentally Focused........... 12-29
Figure 13.1-1 National Road Network, as of 2007 ......................................................................... 13-5
Figure 13.1-2 Present Structure of MoWT...................................................................................... 13-7
Figure 13.1-3 Present Organization of UNRA (HQ).................................................................... 13-7
Figure 13.3-1 Typical Model of Labour-based Construction by Force Account .......................... 13-16
Figure 13.3-2 Typical Model of Labour-based Construction by Contract with Private
Contractor............................................................................................................... 13-16
Figure 13.3-3 Periodic Maintenance by Labour-base and Machinery Construction..................... 13-17
Figure 13.3-4 Basic Flow Chart of RAMPS & QPRS .................................................................. 13-18
Figure 13.3-5 Organization of Gulu District (Works Department)............................................... 13-20
Figure 13.3-6 Organization of Kitgum District (Technical and Works Department) ................... 13-24
Figure 13.3-7 Organization of Lamwo District (Technical and Works Department) ................... 13-27
Figure 13.3-8 Organization of Pader District (Technical and Works Department) ...................... 13-31
Figure 13.3-9 Organization of Agago District (Technical and Works Department)..................... 13-33
Figure 14.1-1 Cause Analysis Tree ................................................................................................. 14-3
Figure 14.1-2 Objective Analysis Tree ........................................................................................... 14-5
Figure 15.1-1 Basic Sequence of Road Survey............................................................................... 15-3
Figure 15.1-2 Classroom Training Sessions ................................................................................... 15-4
Figure 15.1-3 Field Training Sessions ............................................................................................ 15-4
Figure 15.2-1 Gulu Training for Amuru/Gulu/Pader District Engineers (2011/11/15 to 18) ......... 15-5
Figure 15.2-2 Kitgum Training for Kitgum/Lamwo/Agago District Engineers (2011/11/22 to
25)............................................................................................................................. 15-6
Figure 15.2-3 MoWT Training for MoWT Engineers (2011/11/28 to Dec 1)................................ 15-6
Figure 16.1-1 Location of Priority Projects .................................................................................... 16-5
Figure 17.2-1 Organization of the Pilot Project .............................................................................. 17-3
Figure 17.2-2 Maps Showing Location of the Pilot Project............................................................ 17-6
- xv -
- xvi -
Figure 17.4-1 Construction Progress (Gulu) ................................................................................... 17-9
Figure 17.5-1 Construction Progress (Kitgum)............................................................................. 17-13
Figure 18.1-1 Typical Normal Cross Section and Value of Cross Section Elements for Ia Road..... 18-2
Figure 18.1-2 Typical Normal Cross Section and Value of Cross Section Elements for the
Other Roads .............................................................................................................. 18-3
Figure 18.1-3 Typical Cross Sections for District Roads................................................................ 18-5
Figure 18.2-1 Profile of Kamdini-Gulu Road Section .................................................................... 18-6
Figure 18.2-2 Location of TOCI Bridge and its Photographs......................................................... 18-6
Figure 18.2-3 Typical Cross Section for Road Section from Gulu to Nimule ................................ 18-7
Figure 18.2-4 Typical Cross Section Options ............................................................................... 18-10
Figure 18.2-5 Bridge Designs on Kitgum-Lira Road Section....................................................... 18-11
Figure 18.2-6 Gulu Land Use and Road Name Map..................................................................... 18-13
Figure 18.2-7 Project Road Sections for MR1.............................................................................. 18-14
Figure 18.2-8 Proposed Drainage Network in Town Area ........................................................... 18-15
Figure 18.2-9 Project Road Typical Cross Sections for MR1....................................................... 18-16
Figure 18.2-10 Road Network in Kitgum Town Centre ................................................................. 18-17
Figure 18.2-11 Diversion Plan for Kitgum Town ........................................................................... 18-18
Figure 19.1-1 Change of Construction Cost in 2011....................................................................... 19-2
Figure 19.1-2 Change of Construction Material Prices in 2011...................................................... 19-3
Figure 20.4-1 Article in the Rupiny Weekly Local Newspaper, about the Gulu Motorcyclers'
Protest, Dated 24 August 2011............................................................................... 20-33
Figure 21.3-1 Farm Land and Road Network ................................................................................. 21-9

The Project for Rural Road Network Development in Acholi Sub-region in Northern Uganda Final Report Vol.2: Main Report
- ABBREVIATIONS -
A AASHTO American Association of State Highway and Transportation Official ACF Action Centre la Faim (Action against Hunger) ACTED Agency for Technical Cooperation and Development ADB African Development Bank ADRICS Annual District Road Inventory and Conditions Survey AIDS Acquired Immune Deficiency Syndrome ALREP Agricultural Livelihood Recovery Project for Northern Uganda AMREF African Medical and Research Foundation ARC America Refugee Committee ARF Areal Reduction Factor B B/C Cost Benefit Ratio BH Borehole BOQ Bill of Quantities BS British Standards C CAA Civil Aviation Authority CAD Computer Aided Design CAO Chief Administrative Officer CAP Community Action Plan CAR Community Access Road CBMS Community Based Maintenance System CCT Coordinating Centre Tutor CDI Community Driven Initiatives CFR Central Forest Reserve CIF Cost, Insurance and Freight CPAR Canadian Physicians for Aid and Relief CPI Consumer Price Index CRCM Community Reconciliation and Conflict Management D DANIDA Danish International Development Agency DBST Double Bituminous Surface Treatment DDMC District Disaster Management Committee DDP District Development Plan DEA Directorate of Environmental Affairs DED German Development Service DFID Department for International Development DIT Dar es Salaam Institute of Technology DLGE District Local Government Engineer DR District Road DRC Democratic Republic of Congo DSC District Service Commission DUCAR District, Urban and Community Access Roads DUCARIP The 10-year District, Urban and Community Access Roads Investment Plan DWRM Directorate of Water Resources Management
i

E EAC East Africa Community EC European Commission ECD Early Childhood Development EIA Environmental Impact Assessment EIR Environmental Impact Review EIRR Economic Internal Rate of Return EIS Environmental Impact Study EL Elevation E/N Exchange of Notes ESSAPR Education and Sports Sector Annual Performance Report EU Europe Union EVI Extremely Vulnerable Individual F FAO Food and Agriculture Organization FOB Free on Board F.W.L Flood Water Level FY Financial Year G GDP Gross Domestic Product GIS Geographic Information System GKMA Greater Kampala Metropolitan Area GNI Gross National Income GOSS Government of South Sudan GOU Government of Uganda GPS Global Positioning System H HC Health Centre HDI Human Development Index HIV Human Immunodeficiency Virus HMIS Health Management Information System HPI Human Poverty Index H.W.L High Water Level I IATC Inter-Agency Technical Committee IC Importance Classification ICRC International Committee of the Red Cross ID Institutional Development IDP Internally Displaced Person IEE Initial Environmental Examination IOM International Organization of Migration J JCT Junction JICA Japan International Cooperation Agency JICS Japan International Cooperation System JST JICA Study Team K KEL Knife Edge Load KTC Kisii Training Centre L LAMS Land Acquisition Management System LBT Labour Based Technology LCS Low Cost Sealing LEAD Livelihoods and Enterprises for Agricultural Development
ii

The Project for Rural Road Network Development in Acholi Sub-region in Northern Uganda Final Report Vol.2: Main Report
LGBFP Local Government Budget Frame Work Paper LOS Level of Service LRA Lord’s Resistance Army LRFD Load and Resistance Factor Design M MAAIF Ministry of Agriculture, Animal Industry and Fisheries MELTC Mt. Elgon Labour-based Training Centre MTDF Multi-Donor Fund MoFPED Ministry of Finance, Planning and Economic Development MoH Ministry of Health MoLG Ministry of Local Government MoWE Ministry of Water and Environment MoWHC Ministry of Works, Housing and Communications MoWT Ministry of Works and Transport MPa Mega Pascal N NAADS National Agricultural Advisory Services Programme NDP 5-year National Development Plan for Uganda NEMA National Environment Management Authority NFA National Forest Authority NGO Non-Governmental Organizations NPV Net Present Value NR National Road NTMP National Transport Master Plan NUDC Northern Uganda Data Centre NUDEIL Northern Uganda Development of Enhanced Local Governance Infrastructure
and Livelihoods NUMAT Northern Uganda Malaria AIDS Tuberculosis Programme NUREP Northern Uganda Rehabilitation Programme NUSAF Northern Uganda Social Action Fund NUTI Northern Uganda Transition Initiative O OD Origin and Destination OPD Out-Patient Department OPM Office of Prime Minister O&M Operation and Maintenance P p.a. per annum PAX Number of Passengers PCE Policy Committee on the Environment PCU Passenger Car Unit PEAP Poverty Eradication Action Plan PP Pilot Project PPDA Public Procurement and Disposal Act PRDP Peace, Recovery and Development Plan for Northern Uganda PTA Parent-Teacher Association Q QPRS Quarterly Progress Reporting System R RAFU Road Authority Formulation Unit RALNUC Restoration of Agricultural Livelihood in Northern Uganda Component RAMPS Rehabilitation and Maintenance Planning System
iii

iv
RC Reinforced Concrete ROW Right of Way RSDP Road Sector Development Programme RVR Rift Valley Railways S SACCOS Saving and Credit Cooperative Societies SADC Southern Africa Development Community SATCC Southern Africa Transport and Communications Commission SBD Standard Bid Documents SCF Standard Conversion Factor SDG Sudanese Pound SPC Seismic Performance Category SPRING Stability, Peace and Reconciliation in Northern Uganda SPT Standard Penetration Test SSDP South Sudan Development Plan STRADA System for Traffic Demand Analysis SWOT Strengths, Weaknesses, Opportunities and Threats T TC Trading Centre TDMS Teacher Development and Management System TOR Terms of Reference TRRL Transport and Road Research Laboratory TTC Travel Time Cost U UBOS Uganda Bureau of Statistics UDL Uniformly Distributed Load UDSM University of Dar es Salaam UGX Uganda Shillings UN United Nations UNDP United Nations Development Programme UNHCR United Nations High Commissioner for Refugees UNICEF United Nations Children's Fund UNOCHA United Nations, Office for the Coordination of Humanitarian Affairs UNRA Uganda National Road Authority UNOPS United Nations Office for Project Services UPE Universal Primary Education URF Uganda Road Fund USAID United States Agency for International Development USD United States Dollar USE Universal Secondary Education Ushs. Uganda Shillings UWA Uganda Wildlife Authority UXO Unexploded Ordnance V VGS Vulnerable Groups Support VOC Vehicle Operating Costs W WB World Bank WFP United Nations World Food Programme WHO World Health Organization

The Project for Rural Road Network Development in Acholi Sub-region in Northern Uganda Final Report Vol.2: Main Report
1. INTRODUCTION
1.1 Background of the Survey
Northern Uganda had been a self-sustained area showing a steady economic growth, underpinned by its arable land suitable for rice, beans, millet, maize, and cotton production. In addition, the country’s villagers had the additional means to gain cash by exporting to Sudan their surplus crop products. However, Northern Uganda currently has the largest proportion of people living in poverty in the country, estimated to account for 61 % of the region's population, or almost twice the national level. This high level of poverty can be attributed to the Lord's Resistance Army (LRA) insurgency. During the 20 year conflict beginning in the 1980s, much of the basic social infrastructure was destroyed or abandoned, and the local government became non-functional in the region. In particular, 90 % of the population were displaced (IDP: Internally Displaced Person) from their original villages in the Acholi Sub-region. Since the cease-fire agreement concluded between LRA and the Government of Uganda in August 2006, the Government of Uganda has emphasized and facilitated the return process of IDPs. However, many challenges still remain in the process since houses and social infrastructures such as roads, water wells, and health centres had been destroyed during the conflict.
The National Peace, Recovery and Development Plan (PRDP) was established in October, 2007 in order to guide the IDPs return, resettlement and rehabilitation. PRDP and the District Development Plans (DDPs) in Northern Uganda recognize the importance of, and give priority to, road improvement. However, the priority projects suggested in PRDP and DDPs lack due regard to the budget constraints. Although some of the road and bridge projects in Acholi Sub-region have been implemented by donors such as the World Bank and the EU, the road conditions of Amuru and Nwoya Districts were still worse than those of the other districts because of lack of funds from donors and the central government.
In 2009, the Government of Uganda submitted an application to Japan for “The Project for Rural Road Network Planning in Northern Uganda (hereinafter called the Previous Survey)” in order to support the lagging two districts; Amuru and Nwoya. The Previous Survey has been conducted by JICA since August 2009 and the Master Plan for Rural Road Network was proposed.
1.2 Rationale and Objectives of the Survey
1.2.1 Study Rationale
As mentioned above, basic infrastructure, especially road infrastructure, deteriorated in Northern Uganda due to the 20 year-conflict. Improvement of the road network and condition is expected to greatly contribute to IDPs return process and by extension, the post-war
1-1

1-2
rehabilitation in Northern Uganda. However, the following constraints have hampered the effective improvement of road infrastructure.
PRDP (Peace Recovery and Development Plan for Northern Uganda), prepared in 2007, is the sole comprehensive development plan for Northern Uganda. It is a three-year rolling development plan. The District Development Plans, prepared by the district local councils, are also three-year rolling development plans, composed of wish-lists from the sub-counties. The mid or long-term development plan is not attainable at the local government level in Northern Uganda.
DDPs (The District Development Plans) tend to propose a long list of projects without adequate consideration of their validity and priority based on a numerical analysis. Some development projects listed in the DDPs are not implemented because of the budgetary constraints. The budget actually disbursed to the local government is limited and used mostly for recurrent purposes and not for development purpose.
Although some district roads are to be upgraded to national roads, the rehabilitation and construction of which comes under jurisdiction of the Uganda Road Authority (UNRA), more than 200 km of roads in Amuru and Nwoya District still remain as district roads. However, the capacity of the local government in terms of financial resources and man-power and their technical skills in Northern Uganda is still limited. Also, the President disclosed the policy to manage the local roads by force account implemented by the local government. However, it is still too early to judge the effectiveness of this approach. Capacity issues arise on how the local governments, which are not well equipped for road maintenance and rehabilitation works, will manage their roads.
In this regard, the Master Plan for the rural road network was required to effectively address these constraints, providing mid or long-term development guidance in a numerical manner.
The Previous Survey, accordingly, formulated the Master Plan for the rural road network and targets Amuru and Nwoya Districts as the focus area due to the following reasons.
IDPs' return process in former Amuru District (current Amuru and Nwoya District)1 lags behind that in other districts in Acholi Sub-region. One of the reasons identified during the preliminary study is that former Amuru District cannot be regionally integrated since this area is divided into two areas by the Aswa River.
Former Amuru District, once being part of Gulu District, was newly established in July 2006. Furthermore, Nwoya District was separated from the Amuru District in July 2010. As mentioned, management of district roads may be transferred from a contract-out basis to force account implementation by the local government. Apparently, the administrative capacity of Amuru and Nwoya Districts is lacking in terms of finance and human resources.
Although the focus of the Previous Survey was limited to Amuru and Nwoya Districts, the methods and techniques for master planning explored in the Previous Survey were applicable to the wider Acholi Sub-region in Northern Uganda.
1.2.2 Objectives of the Survey
The overall goal of the Survey is to accelerate IDPs' return process and to improve the livelihood of people who will/have return(ed) to the original place and hence enhance regional development in Northern Uganda. In order to achieve this, the following three pillars of the
1 Amuru District was divided into two districts in July 2010. The other districts in Acholi Sub-region, Kitgum
and Pader, were also divided into two districts in January and July 2010 respectively.

The Project for Rural Road Network Development in Acholi Sub-region in Northern Uganda Final Report Vol.2: Main Report
1-3
Survey shall be accomplished in accordance with the Previous Survey: Master Plan for the rural road network, Capacity development, and a Pilot project in Acholi Sub-region.
The Master Plan of the rural road network in Acholi Sub-region, with the target years of 2018 and 2030, shall be established, in full consideration of the socio-economic conditions, regional development potential and traffic demand in the Sub-region. This Master Plan is expected to provide the mid-term and long term guidance for the road maintenance, rehabilitation and upgrading plan in the Sub-region.
In line with the Master Plan of the rural road network in Acholi Sub-region, capacity of road operation and maintenance in the districts shall be developed in order to ensure the proposed Master Plan is implemented as planned. This capacity development will be achieved through assessment of the “Capacity Gap”, formulation of a “Capacity Development Plan” and provision of “Counterpart Training” throughout the study period.2
In the Previous Survey, the rural road improvement and maintenance plan was proposed, however, the structure for implementing road improvement and maintenance was not clearly stated because the policy of the central government is still uncertain. As for the Community Access Roads (CARs), it will be preferable to adapt Labour Based Technology (LBT) for giving opportunity of employment to local people. Thus, the pilot projects for periodic and routine maintenance of CARs by LBT are proposed to assure the most effective implementation structure for sub-counties and districts.
1.2.3 Output of the Study
Situational analysis and GIS mapping of public utilities, social services and existing social infrastructures (such as schools, health centres and water resources);
Situational analysis and GIS mapping of present road network;
Formulation of master plan for rural road development and maintenance;
Preparation and implementation of pilot projects for CARs maintenance with LBT;
Preparation of road inventory for the national highway and district roads;
GIS Mapping of road-related information
1.3 Structure of the Report
This Draft Final Report for “the Project for Rural Road Network Planning in Acholi Sub-region in Northern Uganda” is composed of the following twenty three chapters.
In Chapter 1 “Introduction”, the background and objectives of this survey were overviewed.
Chapter 2 “Regional Context: Northern Uganda and Acholi Sub-region” and Chapter 3 “Present Status of the Study Area” include the current situation of Achol Sub-region and the surrounding area. The result of the review on related national and district development plans and assistance situation of international donors are stated in Chapter 4 “Review of Existing Development Plans”.
Chapter 5 and Chapter 6 include road conditions and transport situation of Acholi Sub-region and the result of additional survey for South Sudan. In Chapter 7 and Chapter 8, social
2 “Capacity Gap” assessment for rural road maintenance was done targeting former Amuru District and stated in
Chapter 11. After segmentation of Amuru district, the “Capacity Gap” for new Amuru and Nwoya Districts must be worse.

1-4
economic framework and regional development issues are analyzed to introduce Chapter 9 “Regional Development Plans”.
Chapter 10 “Traffic Demand Forecast” was implemented for preparing data of Chapter 11 “Road Network Development Plan”. Chapter 12 “Strategic Environmental Assessment” shows the result of evaluation of alternatives of priority trunk road networks and working group meetings on it.
Chapter 13 and Chapter 14 include preset situation and plans for road maintenance and operation system in Acholi Sub-region.
Technical transfers on road surveys using GPS and GIS Processing techniques are stated in Chapter 15.
Chapter 16 includes objectives, scope and implementation plan of pilot projects on road maintenance works of CARs by LBT method.
Chapter 17 shows the result of selection for high priority road projects in mid-term and long term periods. The preliminary design, cost estimate and environmental considerations for the high priority projects are stated in Chapter 18, Chapter 19 and Chapter 20 respectively.
In Chapter 21, the high priority projects are evaluated. The methods of realization of those high priority projects are proposed in Chapter 22, and finally “Conclusions and Recommendations” are stated in Chapter 23.

The Project for Rural Road Network Development in Acholi Sub-region in Northern Uganda Final Report Vol.2: Main Report
2. REGIONAL CONTEXT: NORTHERN UGANDA AND ACHOLI SUB-REGION
2.1 Northern Region of Uganda
(1) Four Sub-regions in Northern Region of Uganda
The Northern Region occupies the northern part of Uganda. Its area accounts for 35% of the total area of Uganda. The Northern Region is composed of four sub-regions, namely Acholi, West Nile, Karamoja and Lango.
Acholi Sub-region is bordered by Sudan and located in the central part of northern Uganda. To the west of it, the West Nile Sub-region is located across the Albert Nile. To the east lies Karamoja Sub-region. Lango Sub-region is located to the south of Acholi Sub-region.
Acholi Sub-region is traditionally called Acholiland, because it has been inhabited by the ethnic Acholi and many chiefdoms have been formed by the Acholi. Acholi people also live north of the Sudan border (Magwe County of South Sudan).
Karamoja Sub-region is mostly semi-arid land with low annual rainfall. The Karimojong ethnic group lives there. Their main livelihood is livestock.
On the other hand, the people in West Nile Sub-region live on similar types of agriculture to Acholi Sub-region. Tobacco used to be a leading cash crop in the West Nile; however, honey has steadily replaced it in prominence. In the Lango Sub-region lives the Lango ethnic group of people.
(2) Populations and Population Densities in Northern Uganda
The population of Northern Uganda was estimated to be 6.8 million in 2009. It accounts for about 22% of the total population of Uganda.
West Nile Sub-region had a population of 2.7 million as of 2009. Lango Sub-region had a population of 1.8 million in 2009. Acholi and Karamoja Sub-regions had populations of 1.2 million and 1.1 million respectively in 2009.
West Nile is among those sub-regions with relatively high population densities in Uganda. The population density of Lango Sub-region, as well as West Nile Sub-region, is much higher than that of Acholi and Karamoja Sub-regions.
2-1

SOUTH
Source: JICA Study Team
Figure 2.1-1 Acholi Sub-region in Northern Uganda
Acholi Sub-region Karamoja Sub-region
Lango Sub-region
West Nile Sub-region
2-2

The Project for Rural Road Network Development in Acholi Sub-region in Northern Uganda Final Report Vol.2: Main Report
Table 2.1-1 Area and Population by Region
Population Area (km2)
1980 1991 2002 2008
Central Region, including Kampala 61,403 3,582,434 4,843,594 6,575,425 7,750,600
Eastern Region 39,479 3,237,436 4,128,469 6,204,915 7,692,500 Northern Region 85,392 2,424,242 3,151,955 5,363,669 6,652,300 Western Region 55,277 3,392,067 4,547,687 6,298,075 7,497,300 Uganda 241,551 12,638,159 16,673,696 24,444,086 29,594,708
Source: Population Census 1980, 1991 and 2002 Population Estimate 2008 by UBOS
Table 2.1-2 Population Density by Region in Uganda
Population Densities Region/Uganda
1980 1991 2002 2008*
Central Region 58 79 107 126 Eastern Region 82 105 157 195 Northern Region 28 37 63 78 Western Region 61 82 114 136
Uganda 52 69 101 123 Source: Population Census 1980, 1991, 2002 The populations in 2008 are UBOS’s projections.
Table 2.1-3 Annual Population Growth Rates by Region in Uganda
Region/Uganda 1980-1991 1991-2002
Central Region, including Kampala 2.8% 2.7%
Kampala 4.9% 3.7%
Eastern Region 2.2% 3.6%
Northern Region 2.4% 4.7%
Western Region 2.7% 2.8%
Uganda 2.6% 3.3% Source: Population Census 1980, 1991, 2002
Table 2.1-4 Areas, Populations and Population Densities of Sub-regions in Northern Uganda
Population Population
Density (persons/km2)Sub-region Area
(km2)
1991* 2002** 2009** 2009
West Nile Sub-region 15,774.1 1,130,452 1,918,140 2,691,700 171 Acholi Sub-region 28,279.2 695,611 1,083,973 1,226,967 43 Karamoja Sub-region 27,596.6 370,423 721,536 1,087,200 39 Lango Sub-region 13,741.9 955,469 1,425,233 1,807,200 132
Northern Region Total 85,391.8 3,151,955 5,148,882 6,813,067 80 Source: * : Population Census 1991 ** : Population Census 2002 *** : The populations of Acholi Sub-region are from UNHCR monitoring data as of August 2009. Other
district populations are populations projected by UBOS for mid-year 2009.
2-3

Table 2.1-5 Annual Population Growth Rates of Sub-regions in Northern Uganda
1980-1991 1991-2002
West Nile Sub-region 3.1% 4.6% Acholi Sub-region 1.7% 3.9% Karamoja Sub-region 0.5% 5.9% Lango Sub-region 3.1% 3.5%
Northern Region 2.4% 4.3%
Uganda 2.6% 3.3% Source: Population Census 1980, 1991, 2002
(3) Urban Centres and Urban Economy in Northern Uganda
In 2009, there were 24 urban centres (municipalities and town councils) in northern Uganda. The total urban population in northern Uganda was about 720,000 in 2009. West Nile Sub-region has 9 urban centres, whose urban populations totalled 264,000 in 2009. Acholi Sub-region has 5 urban centres, whose urban populations totalled about 230,000 in 2009. There are 5 urban centres in Lango Sub-region. Their total urban population was 160,000 in 2009. In Karamoja, urban centres and the economy have not developed much yet. Their total urban population was only 70,000 in 2009.
In northern Uganda, Gulu Municipality is the largest urban centre: it had a population of 146,000 in 2009. Lira Municipality is the next largest urban centre. Lira had an urban population of about 100,000 in 2009.
Arua Municipality (West Nile), Kitgum (Acholi), and Koboko (West Nile) follow Gulu and Lira in terms of size of urban population.
Juba
Gulu
Arua
Lira
Soroti
Kitgum
Koboko
Kaabong
Kotido
PaidhaNebbi Pakwach
Yumbe
Adjumani
Moyo
SOUTH
Source: JICA Study Team
Figure 2.1-2 Major Urban Centres in Acholi Sub-region and Northern Uganda
2-4
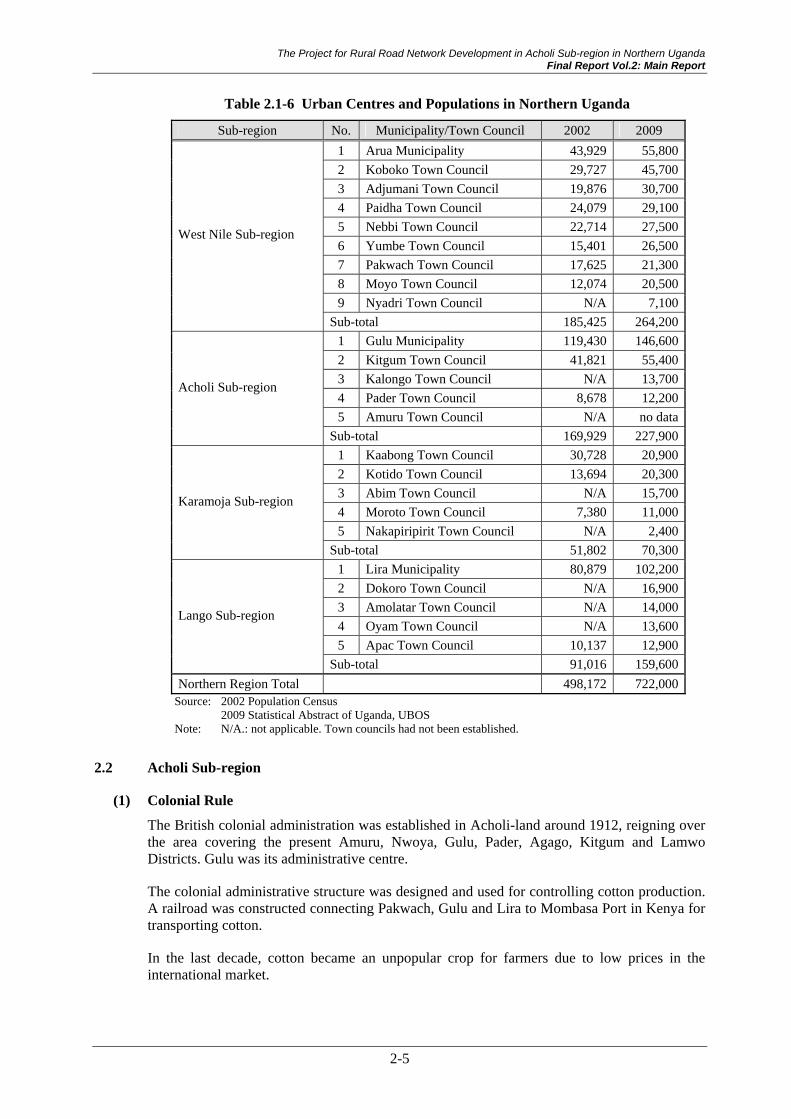
The Project for Rural Road Network Development in Acholi Sub-region in Northern Uganda Final Report Vol.2: Main Report
Table 2.1-6 Urban Centres and Populations in Northern Uganda
Sub-region No. Municipality/Town Council 2002 2009
1 Arua Municipality 43,929 55,800
2 Koboko Town Council 29,727 45,700
3 Adjumani Town Council 19,876 30,700
4 Paidha Town Council 24,079 29,100
5 Nebbi Town Council 22,714 27,500
6 Yumbe Town Council 15,401 26,500
7 Pakwach Town Council 17,625 21,300
8 Moyo Town Council 12,074 20,500
9 Nyadri Town Council N/A 7,100
West Nile Sub-region
Sub-total 185,425 264,200
1 Gulu Municipality 119,430 146,600
2 Kitgum Town Council 41,821 55,400
3 Kalongo Town Council N/A 13,700
4 Pader Town Council 8,678 12,200
5 Amuru Town Council N/A no data
Acholi Sub-region
Sub-total 169,929 227,900
1 Kaabong Town Council 30,728 20,900
2 Kotido Town Council 13,694 20,300
3 Abim Town Council N/A 15,700
4 Moroto Town Council 7,380 11,000
5 Nakapiripirit Town Council N/A 2,400
Karamoja Sub-region
Sub-total 51,802 70,300
1 Lira Municipality 80,879 102,200
2 Dokoro Town Council N/A 16,900
3 Amolatar Town Council N/A 14,000
4 Oyam Town Council N/A 13,600
5 Apac Town Council 10,137 12,900
Lango Sub-region
Sub-total 91,016 159,600
Northern Region Total 498,172 722,000 Source: 2002 Population Census 2009 Statistical Abstract of Uganda, UBOS Note: N/A.: not applicable. Town councils had not been established.
2.2 Acholi Sub-region
(1) Colonial Rule
The British colonial administration was established in Acholi-land around 1912, reigning over the area covering the present Amuru, Nwoya, Gulu, Pader, Agago, Kitgum and Lamwo Districts. Gulu was its administrative centre.
The colonial administrative structure was designed and used for controlling cotton production. A railroad was constructed connecting Pakwach, Gulu and Lira to Mombasa Port in Kenya for transporting cotton.
In the last decade, cotton became an unpopular crop for farmers due to low prices in the international market.
2-5
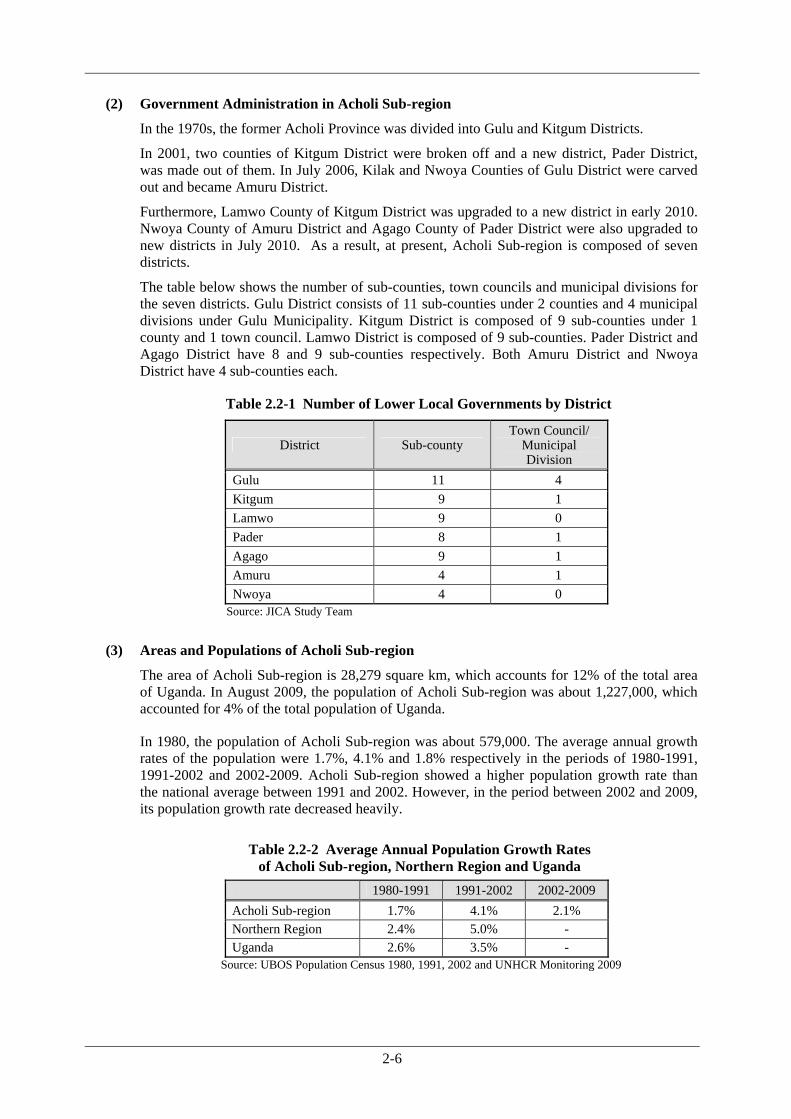
(2) Government Administration in Acholi Sub-region
In the 1970s, the former Acholi Province was divided into Gulu and Kitgum Districts.
In 2001, two counties of Kitgum District were broken off and a new district, Pader District, was made out of them. In July 2006, Kilak and Nwoya Counties of Gulu District were carved out and became Amuru District.
Furthermore, Lamwo County of Kitgum District was upgraded to a new district in early 2010. Nwoya County of Amuru District and Agago County of Pader District were also upgraded to new districts in July 2010. As a result, at present, Acholi Sub-region is composed of seven districts.
The table below shows the number of sub-counties, town councils and municipal divisions for the seven districts. Gulu District consists of 11 sub-counties under 2 counties and 4 municipal divisions under Gulu Municipality. Kitgum District is composed of 9 sub-counties under 1 county and 1 town council. Lamwo District is composed of 9 sub-counties. Pader District and Agago District have 8 and 9 sub-counties respectively. Both Amuru District and Nwoya District have 4 sub-counties each.
Table 2.2-1 Number of Lower Local Governments by District
District Sub-county Town Council/
Municipal Division
Gulu 11 4
Kitgum 9 1
Lamwo 9 0
Pader 8 1
Agago 9 1
Amuru 4 1
Nwoya 4 0 Source: JICA Study Team
(3) Areas and Populations of Acholi Sub-region
The area of Acholi Sub-region is 28,279 square km, which accounts for 12% of the total area of Uganda. In August 2009, the population of Acholi Sub-region was about 1,227,000, which accounted for 4% of the total population of Uganda.
In 1980, the population of Acholi Sub-region was about 579,000. The average annual growth rates of the population were 1.7%, 4.1% and 1.8% respectively in the periods of 1980-1991, 1991-2002 and 2002-2009. Acholi Sub-region showed a higher population growth rate than the national average between 1991 and 2002. However, in the period between 2002 and 2009, its population growth rate decreased heavily.
Table 2.2-2 Average Annual Population Growth Rates of Acholi Sub-region, Northern Region and Uganda
1980-1991 1991-2002 2002-2009
Acholi Sub-region 1.7% 4.1% 2.1% Northern Region 2.4% 5.0% - Uganda 2.6% 3.5% -
Source: UBOS Population Census 1980, 1991, 2002 and UNHCR Monitoring 2009
2-6

The Project for Rural Road Network Development in Acholi Sub-region in Northern Uganda Final Report Vol.2: Main Report
Table 2.2-3 Area, Population and Population Density by District in Acholi Sub-region
District Area (km2)
% of Total Area of Acholi Sub-
region
Population Sep. 2002
Population Aug. 2009
% of Total Population of Acholi
Sub-region Aug.2009
Average Annual
Population Growth Rate,
2002-2009
Population Density
Aug. 2009(persons/
km2)
Gulu District 2,694 9.5% 298,527 236,762 19.3% -3.8% 88
Kitgum District
Lamwo District 9,635 34.1% 282,375 327,086 26.7% 2.5% 34
Pader District
Agago District 6,929 24.5% 326,338 387,680 31.6% 2.9% 56
Amuru District
Nwoya District 9,022 31.9% 176,733 275,439 22.4% 6.5% 31
Acholi Sub-region 28,279 100.0% 1,083,973 1,226,967 100.0% 2.1% 43 Source: UBOS and UNHCR
(4) IDPs and Returnees
Acholi Sub-region developed 120 IDP camps in Gulu, Kitgum, Lamwo, Pader, Agago, Amuru and Nwoya Districts and accommodated over 1.3 million IDPs in those camps. The distribution of IDP camps in Acholi Sub-region is shown in Figure 2.2-1.
About 184,000 people still lived in 120 IDP camps in Acholi Sub-region in August, 2009. However, compared to the original population of IDP camps in 2005, 86% of the people who used to live in IDP camps had already moved out of the IDP camps to return to their home villages or move to transit sites. Examining the IDP return rates in the districts, it is apparent that Gulu District has the highest percentage of people who have moved out of the camps already. On the other hand, 80% of the people who lived in the camps moved out of them in Amuru and Nwoya Districts.
In accordance with the monitoring done by UNHCR, the population of IDPs who still remained in the IDP camps were about 76,800 in May 2010. This means that 94% of 2006 registered population of IDPs moved out from the IDP camps in Acholi Sub-region by May, 2010.
Table 2.2-4 Population Movement in IDP Camps in Acholi Sub-region
District
Number of
IDP Camps Aug. 2009
Population in IDP Camps Dec. 2005
Registered Population in IDP Camps
2006
Population in IDP Camps Aug. 2009 (% of 2006 Registered
Population in IDP Camps)
Population in IDP Camps
May 2010 (% of 2006 Registered
Population in IDP Camps)
Amuru
Nwoya 33 204,000 368,228 73,494 (20%) 36,404 (10%)
Gulu 31 257,000 320,232 22,699 (7%) 14,029 (4%)
Kitgum
Lamwo 25 310,000 319.936 48,534 (15%) 15,509 (5%)
Pader
Agago 31 339,000 339,000 39,472 (12%) 10,894 (3%)
Total 120 1,110,000 1,347,396 184,199 (14%) 76,836 (6%)
Source: UNHCR
2-7

Table 2.2-5 shows population of IDP camps, transit sites and home villages in seven districts in Acholi Sub-region. In 2011, 0.2% of the population still lived in the camps, 4.2% in transit sites and 95.7% in home villages. Among the districts, 8.2% of the population still lives in transit sites in Pader and Agago Districts, while 0.8% of the population lives in transit sites in Gulu District. On the other hand, 99% of the population lives in home villages in Gulu District, while 91.8% of the population lives in home villages in Pader and Agago Districts.
Table 2.2-5 Population of IDP Camps, Transit Sites, and Home Villages, July 2011
District
Total Population in District (counted)
Number of IDP Camps
Population in IDP Camps
(% in IDP Camps)
Number of
Transit Sites
Population in Transit Sites
(% in Transit Sites)
Population in Home Village
(% in Home Villages)
Amuru
Nwoya 275,439 0 0 (0.0%) 50 11,268 (4.1%) 264,171 (95.9%)
Gulu 234,762 1 366 (0.2%) 13 1,963 (0.8%) 232,433 (99.0%)
Kitgum
Lamwo 328,819 6 2669 (0.8%) 65 6,582 (2.0%) 319,568 (97.2%)
Pader
Agago 397,416 1 27 (0.0%) 154 32,546 (8.2%) 364,843 (91.8%)
Total 1,236,436 8 3062 (0.2%) 282 52,359 (4.2%) 1,181,015 (95.5%)
Source: UNHCR
2-8

The Project for Rural Road Network Development in Acholi Sub-region in Northern Uganda Final Report Vol.2: Main Report
2-9
!P
!P
!P!P
!P!P
!P!P
!P
!P!P
!P!P!P
!P!P
!P!P
!P
!P!P!P
!P
!P!P
!P
!P
!P
!P
!P
!P
!P!P
!P!P
!P
!P
!P!P
!P!P!P
!P
!P
!P
!P
!P
!P!P!P
!P
!P
!P
!P
!P
!P
!P
!P!P
!P
!P
!P!P!P
!P!P
!P
!P
! (
!P
!P
!P
! ( ! (
! (
! (
! (
! (! (
! (
! (
! (
! (
! (
! (
! (
! (
! (
! (
! (
! (! (
! (
! ( ! (
! (
!P!P
!P
!P
!P!P
!P
!P! (
!P
!P
!P
! (
!P
! (
! (
! (
! (
!P
!P
! (
! (! (
! (
! (
! (
! (
! (
!P
!P
!P!P
!P!P
!P
!P!P
!P
!P!P
!P
!P
!P
!P!P
!P
!P
!P!P
!P
!P
!P! (
! (
! (
! (
! ( ! (
! (! (
! (! (
! (
! (
! (
! (
! (
! (
! (
! (
! (
! (
! (
! (
! (
! (
! (
! (
! (
! (
! (
! ( ! (
! (
!P
!P!P
!P
! (!P
!P!P
!P
!P
!P
!P
!P
!P
!P
!P!P
! (
! (
! (
! (
! (
! (
! (
! (
! (
! (
! (
! (
! (
! (
! (
! (
! (
! (
! (
! (
! (
! (
! (! (
! (
! (
! (
! (
! ( ! (
! ( ! (
! (
! (
! (
! (
! (
! (
! (
! (
! (
! (
! (
! (
! (
! (
! (
! (
! (
! (
! (
! (
! (
! (
! (
! (
! (
! (
! (
! (
! (! (
! (
! (! (
! (! (
! (
! (
! (
! (
! (
! (
! (
! (
! (
! (
! (! (
! (
! (
! (
! (
! (
! (
! (
! (
! (
! (
! (
! (
! (
! (
! (
! (
! (
! (
! (
! (
! (
! (
! (
! (
! (
! (
! (! ( ! (
! (
! (
! (
! (! (! (
! (
! (
! (
! (
! (
! (
! (
! (
! (
! (
! (
! (
! (! (
! (
! (
! (
! (
! (
! (
! (
! (! (
! (
! (
! (
! (! (
! (
! (
! (
! (
! (
! (
! (
! (
! (
! (! (
! (
! (
! (
! (
! (! (
! (
! (
! (
! ( ! (
! (! (
! (
! (
! (
! (
! (
! (! (
! (
!P
!#
!#
!#
!#
!#
!#
! (
! (
! (! (
! (
! (
! (
! (
! (
! (
! (
! (
! (
! (
! (
! (
! (
! (
! (
! (
! (
! (
! (
! (
! (
! (
! (
! (
! (
! (
! (
! (
! (
! (
! (
! (
! (
! (
! (
! (
! (
! (
! (
! (
! (
! (
! (
! (
! (! (
! (! (
! (
! (
! (
! (
! (! (
! (
! (
! (
! (
! (
! (
! (
! (
! (
! (
! (
! (
! (
! (
! (
! (! (
! (
! (! (
! (
!P
! (
! (
! (
! (
! (
! (
! (
! (
! (
! (
! (
! (
! (
! (
! (
! (
! (
! (
! (
! (
! (
!P
! (
! (
! (
! (
! (
! (
! (
! (
! (
! (! (
! (
! (! (
! (! (
! (
! (
! (
! (
! (
! (! (
! ( ! (
! (
! ( ! (
! (
! (
! (
! (
! (
! (
! (
! (
! (
! (! (
! (
! (
! (
! (
! (
! (
! (
! (! (
! (
! (
! (
! (
! (
! (
! (
! (
! (! (
! ( ! (
! (
! (
! (
! (! (
! (! (
! (
! (! (
! (
! (
! (
! (
! (
! (
! (
! (! (
! (
! (
! (
! (
! (! (
! (
! (
! (
! (
! (! (
! (
! (
! (
! (
! (! (
! (
! (! (
! (
! (! (
! (! (
! (
! (
! (
! (
! (
! (
! (
! (
! (
! (
! (
! (
! (
! (
! (
! (
! (
! (
! (
! (
! (
! (
! (
! (
! ( ! (
! (
! (
! (
! ( ! (
! (
! (
! (
! ( ! (
! (
!P
! (
! (
! (
! (
! (
! (
! (
! (! (
! (
! (
! (
! ( ! (
! (
! (
! (
! (! (
! (
! (
! (
! (
! (
! (
! (
! (
! (
! (
! (
! (! (
! ( ! (
! (
! (
! (
! (
! (
! (
! (
! (
! (
! (
! (
! (
! (
! (
! (
! (
! (
! (
! (
! (! (
! (
! (
! (
! (! (
! (
! (
! (
! (
! (
! (
! (
! (! (
! (
! (! (
! (
! (
! (
! (
! (
! (
! (
! (! (
! (
! (! (
! (
! (
! (
! (
! (
! (
! (! (
! (
! (
! (
! (
! (
! (
! (
! ( ! (
! (! (
! (
! (
! (! (
! (
! (
! (
! (
! (
! (
! (
! (
! (
SU
DA
N
KO
CH
GO
MA
PU
RO
NG
O
AN
AK
A
AL
ER
O
PA
BB
O LAM
OG
I
AT
IAK
AM
UR
U
PA
TO
NG
O
PA
RA
BO
NG
O
PA
IMO
L
OM
OT
LUK
OLE
LIR
AP
ALW
O
LAP
ON
O
AD
ILA
NG
WO
L
PU
RA
NG
A
PA
JULE
PA
DE
RT
C
LAP
UL
LAG
UT
I
KIL
AK
AW
ER
ATA
NG
A
AC
HO
LIB
UR
PA
LOG
A
PA
LA
BE
KK
AL
PA
LA
BE
KG
EM
PA
DIB
EW
ES
T
PA
DIB
EE
AS
T
PA
LA
BE
KO
GIL
I
MA
DI
OP
EI
LOK
UN
G
AG
OR
O
OR
OM
OM
IYA
AN
YIM
ANA
MO
KO
RA
MU
CW
INI
LAG
OR
O
LAB
ON
GO
LAY
AM
O
LAB
ON
GO
AM
IDA
LAB
ON
GO
AK
WA
NG
KIT
IGU
MM
AT
IDI
KIT
GU
MT
C
ON
GA
KO
OD
EK
LALO
GI
LAK
WA
NA
KO
RO
BO
BI
PE
CE
LAY
IBILA
RO
OB
AR
-D
EG
E
PA
TIK
O
PA
LA
RO
PA
ICH
O
BU
NG
AT
IRA
AW
AC
H
BU
LIIS
A
MA
SIN
DI
OYA
M
MA
RA
CH
A(N
YAD
RI)
KA
AB
ON
G
AM
UR
UA
BIM
YUM
BE
PAD
ER
NEB
BI
MO
YO
MO
RO
TOLI
RA
KO
TID
O
KIT
GU
M
GU
LU
AR
UA
APA
C
AD
JUM
AN
I
AM
UR
IA
Aki
lok
Okw
ir
Aya
mi
Pak
elle
Ofu
a
Dza
ipi
Cifo
ro
Ad
rop
i
Adj
um
ani
Otu
ngu
l
Od
itel
Oba
lan
ga
ma
in
Mo
run
ga
tun
ym
ain
Ang
ica
Ang
eda
kite
ng
Am
oo
tom
Orig
ina
l
Ad
epa
r
Olil
imTc
Pa
lab
ek
Ge
m
Pa
lab
ekK
al
Mu
cwin
iO
rom
Na
mo
kora
Om
iya
-A
nyi
ma
Kitg
um
Ma
tidi
Ory
ang
Ale
ro
Ko
chG
om
aAlo
kolu
m
On
gak
oA
cet
Din
o
Ode
k
La
log
i
Op
it
Aw
oo
Bo
bi
Pa
leng
a
Te-t
ug
uK
oro
-a
biliU
nya
ma
Cw
ero
(Te
yap
ado
la)
Pai
cho
Aw
ach
Oro
ko
Pa
laro
Lug
ore
Pa
tiko
-A
julu
Luk
od
i
Coo
pe
Aw
en
oO
lwiy
o
Pa
ngi
ra
Aw
ere
(Gul
u)
Om
elA
pe
m
Olin
ga
Mo
nR
oc
Min
aku
lu
Lan
gol
Co
rne
rN
wo
ya
Co
rne
rA
gu
la
Ce
tK
ana
Bir
a
Ato
oH
ill
Ad
ak
Ng
om
oro
mo
Ma
di
Kilo
c
Pa
dib
eW
est
Odo
kom
it
Pat
ong
o
Lir
aka
to
Ad
ilan
g
Om
ia-
Pa
chw
a
Pa
imo
lM
utt
oW
ol
Ka
lon
go
Kw
on
kic
Ge
reg
ere
Lir
aP
alw
o
Lu
kole
Aru
m
Om
ot
Lag
uti
Co
rne
r-K
ilak
Pad
er
TC
La
tany
a
Ach
olib
ur
Po
rog
ali
Lap
ul
Pa
jule Alim
An
gag
ura
La
ceko
cot
(Ata
nga
)
Aw
ere
(Pa
der
)
Lagi
le
Ra
cko
ko
Pu
rang
a
Po
tika
BP
otik
aA
Ago
ro
Pal
oga
La
yam
oA
kwa
ng
Ma
di
Ope
iLo
kung
Pa
dib
e
Og
ili
Am
ida
Bib
ia
Atia
k
Pa
luke
re
Pa
we
l
Oto
ng
Pa
bb
o
Jen
g-
Ga
ri
Om
eeU
ppe
r
Om
ee
Low
er
Am
uru
La
bon
go
-O
gali
Olw
al
Ka
ladi
maP
ara
bong
o
Pa
gak
Aw
er Key
o
Lac
or
Teg
ot
Lo
lim
Wii
An
aka
Wii
An
on
o
Pu
ron
go
Olw
iyo
Ap
ara
nga
Ag
ungA
na
ka
Lege
nd!P
IDP
Cam
p
! (ID
PR
etur
nee
Site
Ref
ugee
Cam
p!#
Nat
ion
alB
ound
ary
Dis
tric
tBou
nda
ry
Su
b-C
oun
tyB
oun
dar
y
IDPs
bySu
b-C
ount
y,M
ay09
101
-3,
000
3,0
01-
6,0
00
6,0
01-
10
,00
0
10,
001
-2
1,60
4
Land
use
Type
For
est
Re
serv
e
Ga
me
Re
serv
e
Nat
ion
alP
ark
Ran
gel
and
Wa
ter
Bod
y/La
kes
AC
HO
LI S
UB
-REG
ION
: I
DP
Cam
psan
dR
etu
rnS
ites
(As
of3
0Ju
ne
20
09
)IM
U,
UN
OC
HA
Ug
an
daht
tp:/
/ww
w.u
gand
acl
uste
rs.u
ght
tp:/
/och
aon
line.
un.o
rg
Ken
ya
Tanz
ania
Con
goD
em.R
ep)
Rw
anda
Sud
an
Ugan
daO
verv
iew
Ma
pP
repa
reD
ate
:06
July
2009
(IM
U/U
NO
CH
A)
File
:UG
-ID
P-1
1_A
3_0
6Ju
ly09
_Ach
oliS
ub-R
egio
nID
PC
amps
&R
etur
n S
ites
010
205
Kilo
met
ers
KMap
Dis
clai
mer
:
The
bou
nd
arie
s an
dn
ames
sho
wn
and
the
de
sign
atio
nsus
ed o
n t
his
map
do
not
impl
y of
fici
al
endo
rsem
ent
or
acce
pta
nce
by
the
Uni
ted
Nat
ions
.
Da
taS
ourc
es
:
A
dm
in B
ou
nda
rie
s -
UB
OS
200
6
R
oa
d N
etw
ork
- F
AO
ID
PC
amp
/Re
turn
Site
s-
Hu
ma
nita
ria
nA
gen
cie
s/C
amp
ph
ase
ou
tc
omm
itte
e(v
eri
fied
aso
fJ
une
200
9)
P
op
ula
tion
mo
ve
men
t d
ata
-
UN
HC
RP
op
ula
tion
Mov
em
en
t
Mat
rix
,L
C1
sub
mit
ted
be
twe
en
Mar
-Ma
y 2
009
Labe
l
Thi
s m
ap
isa
wo
rkin
pro
gre
ss.
Ple
ase
co
nta
ctth
eIM
U/O
cha
ass
oo
na
sp
ossi
ble
with
any
corr
ectio
ns. Draft
Labe
l
AC
HO
LISU
B-R
EGIO
N:P
OPU
LATI
ON
MO
VEM
ENT
INFO
RM
ATI
ON
:
Vill
ages
Tran
sit
site
sID
PC
amps
AM
UR
U8
51
114
33
99
15
0,3
06
44
,13
17
5,9
90
17
8,8
91
GU
LU
15
70
290
32
13
01
50
,55
81
9,5
63
45
,01
31
70
,13
1
KIT
GU
M1
97
564
32
61
54
14
2,7
64
68
,97
09
8,4
95
21
1,7
34
PA
DE
R1
88
81
,18
23
12
09
23
5,9
47
89
,32
84
2,2
24
32
5,2
75
TOTA
L60
284
2,22
912
259
267
9,57
522
1,99
226
1,72
288
6,03
1S
ou
rce
:P
op
ula
tion
calc
ula
ted
fro
mU
NH
CR
Pop
ula
tion
Mo
vem
en
t M
atr
ix,
Ma
y2
009
Dis
tric
tN
o.o
fID
PC
amps
No.
of
Ret
urn
Site
s
Tota
lR
etur
nPo
pula
tion
Popu
latio
nin
No
.of
Sub-
coun
ties
No.
ofP
aris
hes
No.
ofV
illag
es
Sou
rce:
UN
HC
R
Figu
re 2
.2-1
Dis
trib
utio
n of
IDP
Cam
ps a
nd T
rans
it Si
tes i
n A
chol
i Sub
-reg
ion

(5) Economy in Acholi Sub-Region
The dominant economic activity in Acholi Sub-region is agriculture. Most of the people living in the sub-region are engaged in agriculture. Small scale subsistence farming is widespread and animal husbandry follows it in prominence. Fisheries, which are located along small rivers and streams, are not so prominent in Acholi Sub-region. Apiculture was recently introduced in some areas. Basically, lands in the sub-region are fertile. However, most of them are not utilised as a consequence of the prolonged conflict. People have started to go back to their home villages and restart farming.
The districts have basically the same characteristics of crop farming but with some characteristics unique to each district. In Gulu District, cassava, groundnuts, simsim, sweet potatoes, maize, millet and beans are produced. Production of rice, groundnuts, simsim and millet has increased recently. There are only a few grinding mills and rice hullers which form the agro-processing industry of the sub-region.
Table 2.2-6 Crop Production by District in Acholi Sub-region Unit: ton
Crops Gulu District
Kitgum and Lamwo
Districts
Pader and Agago
Districts
Amuru and Nwoya
Districts
Total of Acholi
Sub-region
Cassava 18,502 27,562 24,712 18,989 89,765 Sorghum 5,902 10,449 22,302 7,728 46,381 Groundnuts 7,745 3,720 13,430 9,037 33,448 Simsim (Sesame) 5,438 7,329 10,834 5,011 28,612 Maize 4,537 1,468 2,316 4,549 12,870 Millet 2,682 1,617 2,291 2,794 9,384 Sweet Potato 5,065 1,430 700 881 8,076 Beans 1,336 735 2,727 2,596 7,394 Pigeon Peas 532 1,756 2,935 1,477 6,700 Sunflower 29 2,677 2,765 80 5,551 Greengrams 139 3,236 1,953 0 5,328 Rice 301 84 491 3,064 3,940 Cotton 0 1,373 1,936 0 3,309 Soybeans 54 199 150 293 696 Cowpeas 41 9 0 4 54 Tobacco 0 0 0 0 0
Total of Crop Production 52,303 63,160 89,542 56,503 261,508 Source: DED-Refugee/IDP Programme (February 2009), Second Season 2008 Land Use and Crop Yield
Assessment Report
Farmers in Kitgum and Lamwo Districts produce mainly cassava, sorghum, simsim, greengrams, sunflower, pigeon peas, millet, maize, sweat potato, and cotton. There are only small scale maize, rice and cassava mills. In addition, there is a cotton ginnery in Kitgum Town.
In Pader and Agago Districts, major food crops are cassava, sorghum, groundnuts, simsim, pigeon peas, sunflower, beans, maize, millet, greengrams and cotton. Major cash crops from the district are groundnuts, simsim, pigeon peas and sunflowers. Recently, there has been an expansion into production of other new crops such as vanilla, coffee, bananas, pineapples and citrus fruits.
2-10

The Project for Rural Road Network Development in Acholi Sub-region in Northern Uganda Final Report Vol.2: Main Report
2-11
In Amuru and Nwoya Districts, major crops grown are cassava, groundnuts, sorghum, simsim, maize, rice, millet, beans and pigeon peas. These crops are produced both as food and cash crops. Some fruits such as citrus, mangoes, pineapples and bananas are also grown there. There aren’t any large factories but only a few grinding mills and rice hullers.
Some of the people live on employment income. In particular, a significant portion of the population in Gulu lives on employment income. Most of them are government employees or work for parastatal bodies. Some of them work for NGOs.
With the exception of Gulu Town, electricity is very limited, which affects development of various industries in Acholi Sub-region. People use diesel and petrol generators. Alternative sources of power such as solar power are also utilised. Telephone networks are widely spread across the sub-region and major telephone companies are very active in business.
Due to the long war, tourism was unable to develop for a long time. However, since the security situation in Acholi Sub-region has improved significantly, tourism could be vitalised in the near future.
(6) Social Profile
Selected social indicators for seven districts in Acholi Sub-region are shown in Table 2.2-7. Since the years of each figure are different, it is difficult to compare the figures in an exact sense. Yet, these figures indicate situations of these districts approximately. Compared to the Ugandan average, the figures for the districts are not so bad. Among them, pit latrine coverages are far below the national average. Also, pupil-teacher ratios and pupil-classroom ratios are not as good as the Ugandan average, which means that the number of teachers and classrooms is inadequate. Gross intake rates and gross enrolment rates for secondary education are also worse, which indicates that only a small portion of children enjoy schooling at secondary level. On the other hand, most of the immunization rates are better than the national average. Gross intake rates and gross enrolment rates for primary education are also better than the national average, which indicates that most school-age children have great opportunities to go to primary schools.
Human Development Index (HDI) and Human Poverty Index (HPI) of each district for the year 2005 are shown in Table 2.2-8. HDI measures overall human progress in a more holistic manner with special emphasis on living a decent life and HPI measures deprivations in the three basic dimensions of the HDI, which are “a long and healthy life”, “knowledge”, and “a decent standard of living”1. HDIs and HPIs are the same for Gulu District and Amuru District (including Nwoya District) because they were the same district in 2005. Considering the situations of these three districts, both HDI and HPI for Gulu District would be much better if calculations were done singly for each of the 3 districts.
Looking at these indices, HDIs for Acholi's four districts are worse than the national averages. Comparing ranks of HDIs and HPIs among all available districts, it can be said that HPIs are relatively better than HDIs. The big difference between HDI and HPI is whether the indices have indicators on GDP per capita. Overall however, both HDIs and HPIs for the four districts are not appropriate and there is need for improvement.
1 HDI is better if it is close to 1 and HPI is better if it is close to 0.
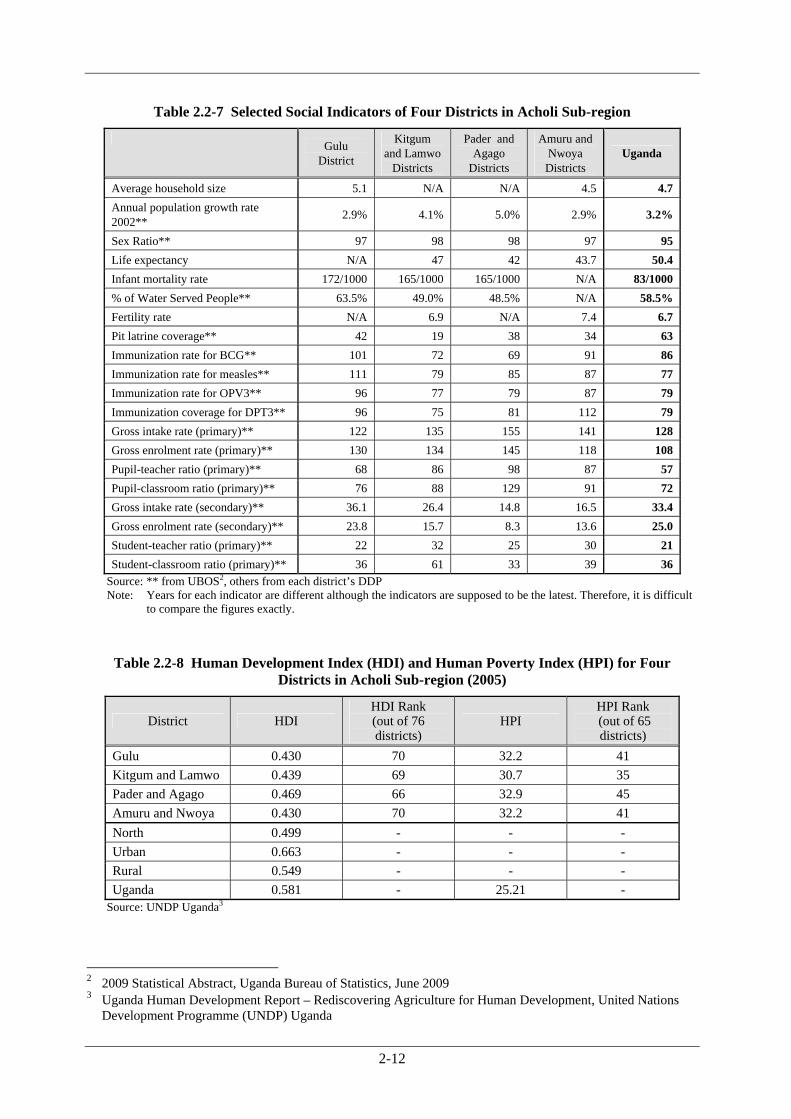
2-12
Table 2.2-7 Selected Social Indicators of Four Districts in Acholi Sub-region
Gulu
District
Kitgum and Lamwo
Districts
Pader and Agago
Districts
Amuru and Nwoya Districts
Uganda
Average household size 5.1 N/A N/A 4.5 4.7Annual population growth rate 2002**
2.9% 4.1% 5.0% 2.9% 3.2%
Sex Ratio** 97 98 98 97 95Life expectancy N/A 47 42 43.7 50.4Infant mortality rate 172/1000 165/1000 165/1000 N/A 83/1000% of Water Served People** 63.5% 49.0% 48.5% N/A 58.5%Fertility rate N/A 6.9 N/A 7.4 6.7Pit latrine coverage** 42 19 38 34 63Immunization rate for BCG** 101 72 69 91 86Immunization rate for measles** 111 79 85 87 77Immunization rate for OPV3** 96 77 79 87 79Immunization coverage for DPT3** 96 75 81 112 79Gross intake rate (primary)** 122 135 155 141 128Gross enrolment rate (primary)** 130 134 145 118 108Pupil-teacher ratio (primary)** 68 86 98 87 57Pupil-classroom ratio (primary)** 76 88 129 91 72Gross intake rate (secondary)** 36.1 26.4 14.8 16.5 33.4Gross enrolment rate (secondary)** 23.8 15.7 8.3 13.6 25.0Student-teacher ratio (primary)** 22 32 25 30 21Student-classroom ratio (primary)** 36 61 33 39 36
Source: ** from UBOS2, others from each district’s DDP Note: Years for each indicator are different although the indicators are supposed to be the latest. Therefore, it is difficult
to compare the figures exactly.
Table 2.2-8 Human Development Index (HDI) and Human Poverty Index (HPI) for Four Districts in Acholi Sub-region (2005)
District HDI HDI Rank (out of 76 districts)
HPI HPI Rank (out of 65 districts)
Gulu 0.430 70 32.2 41
Kitgum and Lamwo 0.439 69 30.7 35
Pader and Agago 0.469 66 32.9 45
Amuru and Nwoya 0.430 70 32.2 41
North 0.499 - - -
Urban 0.663 - - -
Rural 0.549 - - -
Uganda 0.581 - 25.21 - Source: UNDP Uganda3
2 2009 Statistical Abstract, Uganda Bureau of Statistics, June 2009 3 Uganda Human Development Report – Rediscovering Agriculture for Human Development, United Nations
Development Programme (UNDP) Uganda
Related Documents