OECD DEVELOPMENT CENTRE THE PRODUCT SPACE AND THE MIDDLE-INCOME TRAP: COMPARING ASIAN AND LATIN AMERICAN EXPERIENCES by Anna Jankowska, Arne Nagengast and José Ramón Perea Research area: Latin American Economic Outlook April 2012 Working Paper No. 311

Welcome message from author
This document is posted to help you gain knowledge. Please leave a comment to let me know what you think about it! Share it to your friends and learn new things together.
Transcript

OECD DEVELOPMENT CENTRE
ThE PRODuCT sPaCE aND ThE MiDDLE-iNCOME TRaP: COMPaRiNg asiaN aND LaTiN aMERiCaN ExPERiENCEs
by
anna Jankowska, arne Nagengast and José Ramón Perea
Research area:Latin american Economic Outlook
april 2012
Working Paper No. 311

2 © OECD 2012
DEVELOPMENT CENTRE
WORKING PAPERS
This series of working papers is intended to disseminate the Development Centre’s
research findings rapidly among specialists in the field concerned. These papers are generally
available in the original English or French, with a summary in the other language.
Comments on this paper would be welcome and should be sent to the OECD
Development Centre, 2 rue André Pascal, 75775 PARIS CEDEX 16, France; or to
[email protected]. Documents may be downloaded from: http://www.oecd.org/dev/wp or
obtained via e-mail ([email protected]).
THE OPINIONS EXPRESSED AND ARGUMENTS EMPLOYED IN THIS DOCUMENT ARE THE SOLE RESPONSIBILITY OF THE AUTHORS AND
DO NOT NECESSARILY REFLECT THOSE OF THE OECD OR OF THE GOVERNMENTS OF ITS MEMBER COUNTRIES
©OECD (2012)
Applications for permission to reproduce or translate all or part of this document should be sent to
CENTRE DE DÉVELOPPEMENT
DOCUMENTS DE TRAVAIL
Cette série de documents de travail a pour but de diffuser rapidement auprès des
spécialistes dans les domaines concernés les résultats des travaux de recherche du Centre de
développement. Ces documents ne sont disponibles que dans leur langue originale, anglais ou
français ; un résumé du document est rédigé dans l’autre langue.
Tout commentaire relatif à ce document peut être adressé au Centre de développement
de l’OCDE, 2 rue André Pascal, 75775 PARIS CEDEX 16, France; ou à [email protected]. Les
documents peuvent être téléchargés à partir de: http://www.oecd.org/dev/wp ou obtenus via le
mél ([email protected]).
LES IDÉES EXPRIMÉES ET LES ARGUMENTS AVANCÉS DANS CE DOCUMENT SONT CEUX DES AUTEURS ET NE REFLÈTENT PAS
NÉCESSAIREMENT CEUX DE L’OCDE OU DES GOUVERNEMENTS DE SES PAYS MEMBRES
©OCDE (2012)
Les demandes d'autorisation de reproduction ou de traduction de tout ou partie de ce document devront
être envoyées à [email protected].
© OECD 2011 3
TABLE OF CONTENTS
ACKNOWLEDGEMENTS .......................................................................................................................... 4
PREFACE ....................................................................................................................................................... 5
RÉSUMÉ ........................................................................................................................................................ 7
ABSTRACT .................................................................................................................................................... 8
I. INTRODUCTION ..................................................................................................................................... 9
II. ESCAPING FROM THE MIDDLE-INCOME TRAP: PRODUCTIVITY AND STRUCTURAL
TRANSFORMATION ................................................................................................................................ 11
III. THE PRODUCT SPACE: A TOOL FOR EVALUATING STRUCTURAL
TRANSFORMATION ................................................................................................................................ 15
IV. THE DATA ............................................................................................................................................ 17
V. NAVIGATING THROUGH THE PRODUCT SPACE ..................................................................... 18
VI. PRODUCT SPACE AND PRODUCTIVE DEVELOPMENT POLICIES ....................................... 28
VII. GENERAL FRAMEWORK CONDITIONS ..................................................................................... 36
VIII. CHINA ................................................................................................................................................ 42
IX. CONCLUSION ..................................................................................................................................... 43
ANNEX ........................................................................................................................................................ 44
REFERENCES ............................................................................................................................................. 58
OTHER TITLES IN THE SERIES/ AUTRES TITRES DANS LA SÉRIE .............................................. 61
4 © OECD 2012
ACKNOWLEDGEMENTS
The paper was prepared as a contribution to a publication on the middle-income trap by
the Chinese Academy of Social Sciences.
The authors would first like to thank Christian Daude for initiating this project and for
valuable comments and feedback.
Several people devoted their time to reviewing earlier versions of this paper and
providing helpful comments: Kiichiro Fukasaku, Annalisa Primi and Helmut Reisen. The authors
are grateful to their colleagues at the OECD Development Centre for insightful comments and
feedback during an informal seminar at the Development Centre. The authors would also like to
thank Rolando Avendaño and Montserrat Botey for help with the French abstract, and Daniel
Adshead for proofreading the final draft.
Errors, shortcomings and the views expressed remain the responsibility of the authors.

© OECD 2011 5
PREFACE
Overcoming the middle-income trap, tackling poverty and inequality and creating equal
opportunities remain major policy challenges for policy makers in Latin American countries and
beyond. In this paper, we put the focus on Latin America in particular because, contrary to other
regions, Latin America hosts very limited cases of effective transitions from middle to high
income levels. This is particularly noteworthy given that several Latin American countries were
middle-income long before many others in Asia or Europe. While these countries subsequently
moved to the high income level in recent decades, Latin America persists in middle-income
status suggesting they might be in a ‚middle-income trap‛. Robust economic growth and
resilience to the international financial crisis observed in Latin America over the last decade has
slightly reduced the distance with advanced economies, nonetheless, income convergence with
the latter remains far on the horizon.
The difficulty for Latin American countries to break out of the middle-income trap has
been explained from several angles. One of the most frequent explanations points to the low
levels of productivity found in the region. This in turn can be traced back to a myriad of
institutional and socio-economic deficiencies (education and vocational training, monopolistic
structures on product markets, regulatory environment, etc.).
This paper adds to the discussion by looking at the issue from another perspective;
namely tracing the evolution of structure of the economy over time, and its influence in
facilitating income convergence through export-led growth. The focus on the economic structure
of a country does not imply a deterministic view of the development path. On the contrary,
productive transitions reflect the particular policies and institutions and history of a country and
how these elements influence the economic specialisation of a country.
This analysis underscores that successful structural change is driven by proximity
considerations – with expansion into related industries, making use of existing productive skills
– while concomitantly accumulating more advanced capabilities. Policy co-ordination,
particularly in the areas of education, infrastructure, innovation and financing, plays a strong
role in promoting the simultaneous evolution in economic structure and framework conditions.
A comparative analysis of Korea and Latin America underscores the importance of sound policy
design and implementation.

6 © OECD 2012
This type of cross-country analysis facilitates the process of peer-learning and promotes
policy dialogue in order to help middle-income countries build on one another’s experiences and
adapt policies and growth strategies to the new global economic context. The OECD
Development Centre is committed to helping developing and emerging countries find new and
innovative sources of growth, and ensuring that this growth is inclusive and sustainable. This
paper is meant to feed the corresponding policy dialogue amongst the Centre’s member
countries.
Mario PEZZINI
Director
OECD Development Centre
April 2012

© OECD 2011 7
RÉSUMÉ
La croissance rapide et soutenue dans les économies émergentes a fait rentrer des
nouveaux membres, dont la Chine, dans le groupe des pays à revenu intermédiaire. Cependant,
atteindre ce niveau de revenu, a historiquement supposé pour ces pays de faire face à de
nouveaux défis pour le développement, entraînant un ralentissement de la croissance et une
situation de stagnation connue sous le nom de piège des revenus intermédiaires. La convergence
toutefois limitée de l’Amérique latine est en partie expliquée par sa capacité réduite à s’engager
dans des transformations structurelles vers une productivité plus élevée. En revanche, l’Asie
émergente nous présente des exemples de ces vertueuses transformations productives. Tenant
compte de ces deux différences, nous élaborons une analyse comparative basée sur les
dimensions suivantes : D’abord, nous illustrons des différences dans le processus de
transformation structurelle, à la fois par rapport à la productivité sectorielle et la relocalisation
d’emplois. Par la suite, nous adoptons la méthodologie de Product Space pour comparer la
transformation structurelle qui a eu lieu dans les deux régions. Finalement, nous considérons le
rôle des politiques de développement productives (PDP) pour déterminer le processus de
transformation structurel, à travers une révision comparative de ces politiques en Corée, au
Brésil et au Mexique. En somme, l’analyse permet d’évaluer le rôle que la spécialisation
économique d’un pays peut jouer pour faciliter la transition vers des phases de développement
économique plus avancées.
JEL Classification: F10, F40, L5, O4.
Keywords: Exportations, piège du revenu intermédiaire, espace produit.

8 © OECD 2012
ABSTRACT
Rapid and sustained economic growth in the emerging world has brought new members,
notably China, into the group of middle-income countries. Reaching this level of income,
however, has historically presented countries with a new set of challenges to
development, resulting in slowing growth and an entrapment in what is known as the
middle-income trap. Limited income convergence in Latin America has at least partly been due
to its reduced capacity to engage in a structural transformation conducive to higher productivity.
In contrast, emerging Asia offers a few examples of these ‚virtuous‛ productive transformations.
With these two references in mind, we build a comparative analysis based on the following
points: First, we illustrate differences in the process of structural transformation, both with
regard to sector productivity and employment absorption. Second, we adopt the Product Space
methodology to compare the structural transformation that took place in both regions. Finally,
we consider the role played by Productive Development Policies (PDP) in shaping the process of
structural transformation, through a comparative review of these policies in Korea, Brazil and
Mexico. In short, the analysis allows us to gauge the role that the economic specialisation of a
country plays in facilitating transitions to more advanced stages of economic development.
JEL Classification: F10, F40, L5, O4.
Keywords: Exports, middle-income trap, product space.

© OECD 2011 9
I. INTRODUCTION
The first decade of the 21st century has been one of the most favourable for the economic
prospects of developing countries. Much of the developing world enjoyed its first decade of
strong growth in many years; contributing to a trend of increasing convergence in per capita
incomes with high-income countries and the shift of the economic centre of gravity towards the
south and east (OECD Development Centre, 2010). These trends also bring new economic
challenges to the forefront. This is particularly true for countries entering the middle zone of the
per capita income distribution.
Historically, few middle-income countries have been able to enter the group of
high-income economies. This suggests that, at middle levels of income, economic growth
becomes more arduous: on the one hand, these countries have reached a level of development
high enough to prevent them from competing on the same grounds with low-income countries
(e.g. labour costs); but at the same time, they still lack the fine-tuned institutional and factor
endowment mix that would allow them to compete in knowledge intensive products, typical of
high-income economies.
If we take the second half of the 20th century as the period of reference, most of the
countries that joined the group of high-income economies are located in Europe. Asia provides a
more reduced set of countries, including Japan and the Asian Newly Industrialised Countries
(NICs: Chinese Taipei; Korea; Hong Kong, China; Singapore). In contrast to these examples, the
middle-income trap firmly established itself in Latin America; not only because this region hosts
very limited cases of effective transitions from middle to high income levels, but especially given
relatively high income levels in the earlier part of the 20th century.
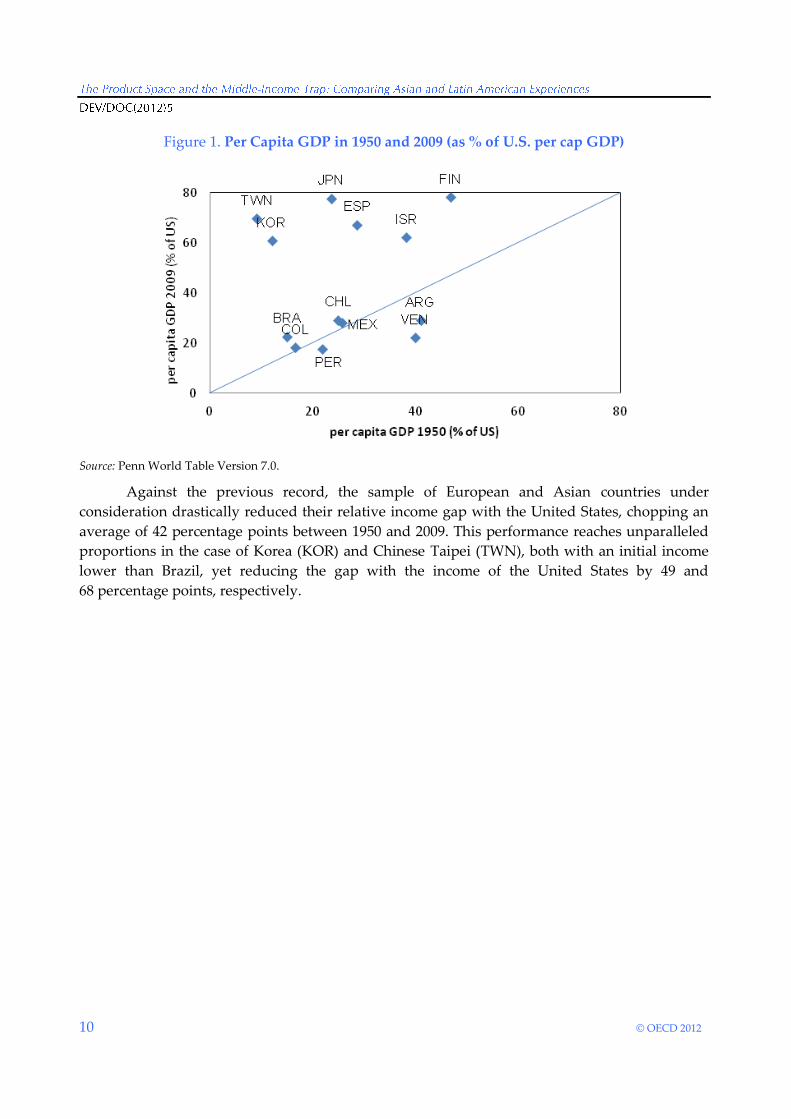
To illustrate this point, Figure 1 plots the per capita income levels in 1950 and 2009 for the
seven largest Latin American economies, as well as a sample of European and Asian countries
that have recently reached high income levels. Instead of choosing a monetary threshold for both
years, we include per capita income as the percentage of that in the United States, to proxy for a
representative high-income economy. This relative income framework highlights Latin
America’s difficulties in achieving income convergence. The main economies in the region varied
between marginal improvements in the cases of Chile, Colombia or Mexico, and cases such as
Argentina or Venezuela, which were both the richest middle-income countries in 1950 and then
lost the most ground relative to US income during the period (12 and 17 percentage points,
respectively). Against these trends, only Brazil made some progress (moving from 15% to 24% of
US income levels), largely because of a much lower initial income and a later entry into middle-
income status.
10 © OECD 2012
Figure 1. Per Capita GDP in 1950 and 2009 (as % of U.S. per cap GDP)
Source: Penn World Table Version 7.0.
Against the previous record, the sample of European and Asian countries under
consideration drastically reduced their relative income gap with the United States, chopping an
average of 42 percentage points between 1950 and 2009. This performance reaches unparalleled
proportions in the case of Korea (KOR) and Chinese Taipei (TWN), both with an initial income
lower than Brazil, yet reducing the gap with the income of the United States by 49 and
68 percentage points, respectively.

© OECD 2011 11
II. ESCAPING FROM THE MIDDLE-INCOME TRAP: PRODUCTIVITY
AND STRUCTURAL TRANSFORMATION
Our introduction has placed Latin America and the Asian NICs at opposite extremes of
the experience with the middle-income trap. While Asian NICs achieved convergence with
high-income economies rapidly, the main Latin American economies have remained at middle-
income levels for decades. In general, productivity considerations top the list of causal factors
advanced to explain the failure of the region to achieve a sustained growth in per capita income.
Daude and Fernandez-Arias (2010), for instance, trace the per capita income gap of Latin
America on average to one in Total Factor Productivity (TFP) growth, while differences in factor
accumulation are shown to be less important. This finding has been seconded by Solimano and
Soto (2005), who show that productivity trends in the region followed a secular decline during
the second half of the 20th century, reaching an all-time low with the debt crisis in the 1980s.
During the years following this episode, productivity growth either collapsed or even turned
negative. In contrast, factor accumulation provided a relatively stable contribution to growth,
both during expansion and recession years.
More recent studies have drawn attention to additional causal factors. Daude (2010)
considers an extended development-accounting framework that includes distortions in physical
capital, the level of human capital, and participation rates in the labour market. TFP performance
among Latin American countries is far from homogeneous, with countries like Chile and Costa
Rica having a level of TFP around 75% of that of the United States, whereas in Honduras and
Peru the proportion is between 30-40%. Furthermore, other factors play an important role: for
example, human capital is found to explain 24% of the income gap between Latin America and
the United States. 1
The critical role played by human capital has also been suggested by studies that take a
look at differences in labour productivity. Cole et al. (2004), for instance, find that the labour
productivity gap between Latin America and the United States was not reduced during the
second half of the 20th century (moving from 33% in 1950 to 32% in 1998). In contrast, Asian
labour productivity jumped from 15% to 54% of the US level over the same period. Along the
same lines, Restuccia (2008) finds that neither working hours nor employment rates can account
for the per capita GDP differences between Latin America and the United States. The typical day
shift in the region tends to be longer than in most advanced economies. As a consequence
1. Physical capital distortion and labour force participation rates account for 11% and 8%, respectively. In all,
TFP explains around 56% of the gap, lower than what was found in previous analyses. A later study
(Daude, 2011) confirms that production factors tend to explain an even larger fraction of the development
gap when one accounts for the differences in the quality of education.

12 © OECD 2012
employment rates fall behind those of advanced economies, but not enough to explain the bulk
of the difference in income per capita.2 This contrasts with the prevailing evidence in Asian
countries, where labour productivity growth improved tremendously during the second half of
the century.
A more subtle aspect of labour productivity is the existence of large differences in
productivity across industries. The theoretical grounds of these sector gaps go back to the work
of Kuznets (1955), who sees them as a catalyst for structural transformation, as they foster the
reallocation of production factors towards the most productive sectors. According to Kuznets,
this process takes place in a sequential manner: an initial stage shifts resources from agriculture
into industry and services, while in the second stage both agriculture and industry channel
resources to services (i.e. tertiarisation). Along the same lines, Lewisian models point to the
existence of differences in labour productivity between sectors as the main driving force behind
this reallocation process. Labour rearrangement continues until the disappearance of the
productivity differential between the traditional and modern sector. In this process, two other
developments take place: first, the shift to more productive activities leads to welfare gains.
Second, manufacturing starts to play a bigger role in the economy particularly in the tradeables
sector.
The previous rationale is able to characterise the developmental stage of a country along
three dimensions: in general, advanced economies are characterised by a roughly similar level of
productivity across sectors, higher per capita income levels, and a diversified and sophisticated
export profile. The opposite applies to developing economies, which face substantial labour
productivity differentials between industries, low per capita income levels, and an export base
concentrated in goods with little value added.
How well does the previous framework match the actual experience of developing
economies? McMillan and Rodrik (2011) examine the evolution of productivity differentials
between sectors, and the circumstances that hindered the movement of labour between sectors
from contributing to higher per capita income. One of the main findings is that countries well
endowed with natural resources are more likely to face growth-reducing effects from labour
relocation, given that they usually operate within an enclave economy: while these capital-
intensive sectors reach high levels of labour productivity, they are unable to absorb excess labour
coming from the traditional sector.
We use the same dataset3 as McMillan and Rodrik (2011) to compare Latin America and
Asia.4 Figure A1 (see Annex) shows the evolution of labour productivity in constant prices for
the three tradeable sectors included in the database (agriculture, mining, manufacturing), against
their associated employment shares. The plots show that the two Asian NICs depart from the
2. According to these studies, the employment-to-population ratio in Latin America is about 70% of the one
in Europe and the US.
3. Timmer and de Vries (2009), a dataset on sector productivity that covers countries in Asia, Europe, Latin
America and the United States.
4. Specifically, we take the seven largest economies in Latin America (Argentina, Brazil, Chile, Colombia,
Mexico, Peru and Venezuela), to compare them with the experience of the two largest Asian NICs (South
Korea and Chinese Taipei).

© OECD 2011 13
theoretical models described above as the productivity gap between traditional (agriculture) and
modern (manufacturing) sector persists, and actually increases in more recent years. However,
the key aspect for successful structural transformation is the capacity of the modern sector to
absorb a relevant share of workers from the traditional sector. In Korea and Chinese Taipei,
labour shares in manufacturing increased dramatically until the 1990s, alongside a continuous
decrease in agriculture. Subsequently, labour shares in both agriculture and manufacturing
decreased while labour share in services increased, in line with Kuznets’ sequence of structural
transformation.
Our sample of Latin American countries differs in several respects from the experience of
the Asian NICs. Latin America is characterised by a manufacturing sector unable to compensate
for the decreasing labour share in agriculture. In Brazil, Colombia, Peru and Venezuela the share
in manufacturing remained stable around 10% during most of the period under study. Argentina
and Chile show a staggering decline in manufacturing shares after 1973, much like in agriculture.
Finally, Mexico appears as the case most similar to the Asian experience, insofar as employment
in manufacturing showed a timid but sustained increase until the early 1980s, to later hover
around levels between 15% and 20%. As in Asia, extractive sectors have the highest average
labour productivity, 5 while having a marginal representation in the labour market.
Asian NICs are characterised by a process of structural transformation that is conducive
to per capita income gains, as the modern sector simultaneously satisfies two important
conditions: productivity is higher than in the traditional sector, and it is sufficiently labour-
intensive so as to transmit these productivity gains to a sizeable share of the wage sector. By
contrast, the coexistence of these two elements is nowhere to be found in Latin America’s
tradeable industries, with none of the three sectors surveyed absorbing relevant shares of excess
labour. Under these circumstances, structural transformation in Latin America followed a
different path than the one suggested by theory: the region leapfrogged the first developmental
stage advanced by Kuznets, showing no relevant transfer of labour from agriculture to
manufacturing. Instead, displaced workers tend to move into the services sector. This transition
increases the degree of informality in the economy and limits potential for per capita income
convergence.
In sum, the role of the structure of the economy is key for generating sustained economic
development. Almost without exception,6 the countries that effectively escaped the middle-
income trap during the post-war era underwent a deep transformation of their economic
structure, away from primary activities and into manufacturing. The limited structural
transformation of economies in Latin America can be attributed to an industrial sector that did
not absorb a sizeable share of the workers coming from the shrinking agricultural sector. By and
5. Venezuela shows a dramatic reduction in the labour productivity of extractive industries after 1970, but
the sector remains with a sizeable productivity advantage over manufacturing and services.
6. This is not to say that all middle-income countries that entered the group of advanced economies did so
through industrialisation. The exceptions are mainly from natural resource exporters that had a
disproportionate source of natural wealth compared to their population (i.e., small oil exporters in the
Gulf), or land-abundant countries whose initial income levels were already very close to those of
advanced economies (e.g. Australia, New Zealand).

14 © OECD 2012
large, institutional features (education, investment in innovation, institutional barriers to
entrepreneurial competition, etc.) are at the core of this outcome. 7 In this study we do not aim to
review the myriad of institutional and socio-economic hurdles that have affected the course of
economic development in Latin America. Instead, we aim to provide a systematic portrait of the
type of structural transformation that took place in Latin American countries vis-à-vis other
developing economies. With these objectives in mind, the remainder of the paper is organised as
follows: Section III describes the methodology and analytical approach, the so-called Product
Space; Section IV outlines the data used in our empirical analysis. Section V covers the definition
and description of the Product Space variables, some of them incorporated from previous works
(e.g. the degree of export diversification and upgrading, capabilities), others being an original
contribution of this study (i.e. connectivity of the export profile, step size of transitions to other
industries, degree of export ‚clustering‛). An additional contribution to the Product Space
literature is our focus on individual country experiences, by analysing country trajectories and
identifying different patterns of export structure development. Sections VI and VII investigate
the role played by economic policy in shaping country experiences with the Product Space,
considering the case studies of Korea, Brazil and Mexico. Finally, Section VIII briefly considers
China’s product space profile.
7. For a comparative study on the determinants of labour productivity, see Choudhry (2009).
© OECD 2011 15
III. THE PRODUCT SPACE: A TOOL FOR EVALUATING
STRUCTURAL TRANSFORMATION
Our analysis relies on a novel strand of the trade literature, the Product Space, developed
through contributions by Hausmann and Klinger (2006), Hausmann et al. (2007), and Hidalgo
et al. (2007). In essence, the Product Space is an analytical framework that allows for categorising
relationships between export industries, as well as evaluating the export profile of a country at a
given time. Within this framework, two considerations are critical: the notion of relatedness, or
proximity,8 between industries; and the quality or value embedded in a country’s exports.
Our basic variables on proximity and value are directly taken from earlier contributions
to the Product Space literature. Proximity is defined as the minimum of the pairwise conditional
probabilities that a country exports one good with revealed comparative advantage (RCA) given
that it exports the other with RCA (Hidalgo et al. (2007). Thus, good A will be close to good B, if
the countries that are competitive exporting A tend to be so in B as well.
RCA is calculated following Balassa (1977) as the ratio of the export share of product i in
country c, to the world’s export share of product i. Hence, a country will be competitive in
exporting good i if its RCA with respect to product i is greater than 1, i.e., if the share of good i in
a country’s export basket is greater than the share of the same good globally.
With regards to the concept of export value, we adopt the PRODY variable originally
suggested in Hausmann et al. (2007). For each product, the index is composed of a weighted
average of the per capita GDP of the countries that export it, with the weights being the RCA
associated with that country and good. As stated by the authors, the PRODY variable ‚represents
the income level associated with that product‛. A higher PRODY corresponds to goods that are
exported by high-income countries. Therefore, the variable is an estimate of the level of
sophistication, or value-added embedded in the good.9 Algebraically, the expression is given by
8. In the Product Space, two industries are close if they use the same type of skills or resources.
9. PRODY is only a proxy for the capabilities embedded in a product. In certain cases, high-income
economies are exporters of scarce natural resources such as oil resulting in high PRODY values not
necessarily representative of the capabilities required for production. In a later section we use a more

16 © OECD 2012
We compute PRODY as an average of the annual values for the years 2000-05. This
interval covers the period with the most comprehensive reporting of trade series across
countries, covering around 770 different industries, out of a possible maximum number of 854.10
Hausmann et al. (2007) also use PRODY to construct a variable called EXPY, which is the
weighted average of the PRODY of the goods exported by a country, with the weights being
their relative export shares. Accordingly, EXPY is an estimate of the degree of sophistication of a
country’s export basket, and was shown to be a strong predictor of per capita GDP growth
(Hausmann et al., 2007). We remark that EXPY can either increase through additional new sectors
of high PRODY, or simply by increasing the export share of current high PRODY sectors
(i.e. extensive vs. intensive upgrading11).
Admittedly, there are some limitations resulting from the data available for this type of
analysis. First, we note that trade data is only a proxy for the productive structure of an
economy, and in some cases can substantially deviate from actual sectoral contributions to GDP.
Differences in market structure across countries make export performance a better or worse
estimate of productive capacities depending on trade openness, domestic market size, and other
related factors. In particular, recent studies have drawn attention to the potential importance of
services exports in fostering economic growth (Mishra et al., 2011). Nevertheless, services trade
data has neither the level of disaggregation nor the time coverage to allow for the type of
analysis undertaken in the current study.12 Furthermore, trade data may not reflect actual value
added of final exports due to geographically dispersed assembly industries (e.g. maquila) which
could overstate the actual productive capacities of a country.
direct measure of capabilities proposed by Hidalgo and Hausmann (2009) which corrects for this
discrepancy.
10. Sizeable breaks are found early in the series around 1974 and to a lesser extent 1984 which show
significant increases in the reporting of trade statistics, both in terms of new industries being reported, as
well as in terms of global trade value. Both years correspond to revisions of the SITC classification
(version 2 in 1974, and version 3 in 1984).
11. For an analysis of extensive vs. intensive margins in international trade see Hummels and Klenow (2005).
12. Section VI looks at some of the complementarities between services and goods exports particularly in
transports, logistics and ICT services.

© OECD 2011 17
IV. THE DATA
We built our sample through a combination of two datasets that offer a highly
disaggregated (4-digit SITC) breakdown of trade data across industries. The bulk of the sample,
covering the years 1963-2000, relies on the World Trade Flows database (Feenstra et al., 2005). For
the years after 2000, we make use of the United Nations Commodity Trade Statistics Database
(COMTRADE). In both cases, we take the export values measured in current US dollars. Series
on annual real GDP, measured in PPP terms, are taken from the Penn World Tables version 7. 13
13. We employ a population threshold resulting in a sample of 135 countries.
18 © OECD 2012
V. NAVIGATING THROUGH THE PRODUCT SPACE
V.1. Diversification and upgrading
First we consider the relation between export diversification14 and export upgrading. By
and large, all countries substantially increased the number of industries in which they have a
revealed comparative advantage. This is in line with the dramatic expansion of international
trade, the improved reporting of trade statistics, and the appearance of new product categories
during this period.
Unlike diversification, export upgrading measured by EXPY is far less widespread.
Figure A2 (see Annex) shows scatter plots of EXPY versus diversification for all countries and
years highlighting the trajectories of individual countries in Latin America and Asia. Starting
with Asia, the data suggests three country patterns of diversification and upgrading. The first
group is comprised of Asian giants (China, India), and also smaller countries with sizeable
internal markets (Indonesia and Thailand). These cases are characterised by a very gradual
upgrading of exports with a simultaneous increase in diversification. With the exception of
China, these countries start from very low levels of diversification. However, large internal
markets facilitate a notable degree of diversification over time, which in the case of India and
China results in exports in over 250 SITC categories by 2009.
A different pattern is illustrated in the second graph, which includes three Asian NICs
(South Korea, Chinese Taipei and Singapore), Malaysia and the Philippines. First, South Korea
and Chinese Taipei show an early and at times substantial increase in diversification, without
any relevant upgrading. At a later time, the pattern shifts, characterised by large increases in
EXPY with either few additions of new sectors to the export basket, or actual reductions. In other
words, upgrading seems to be achieved through a concentration on higher quality industries,
which in turn leads to abandoning those that contribute less to EXPY.15 The resulting path
delimits two different export developments over time. The other three countries mimic the same
pattern, albeit with much lower gains in diversification during the first stage. The third graph for
Asia includes some of the least economically developed countries in the region (Bangladesh,
Laos and Nepal). A defining trait of this group is the extremely low initial number of sectors,
which conditions the subsequent course in diversification and upgrading. Neither of these
variables reaches the levels found for the previous subgroups.
14. Export diversification is computed as the number of industries where the country has RCA>1.
15. A later section will detail the evolution of Korea in the Product Space.
© OECD 2011 19
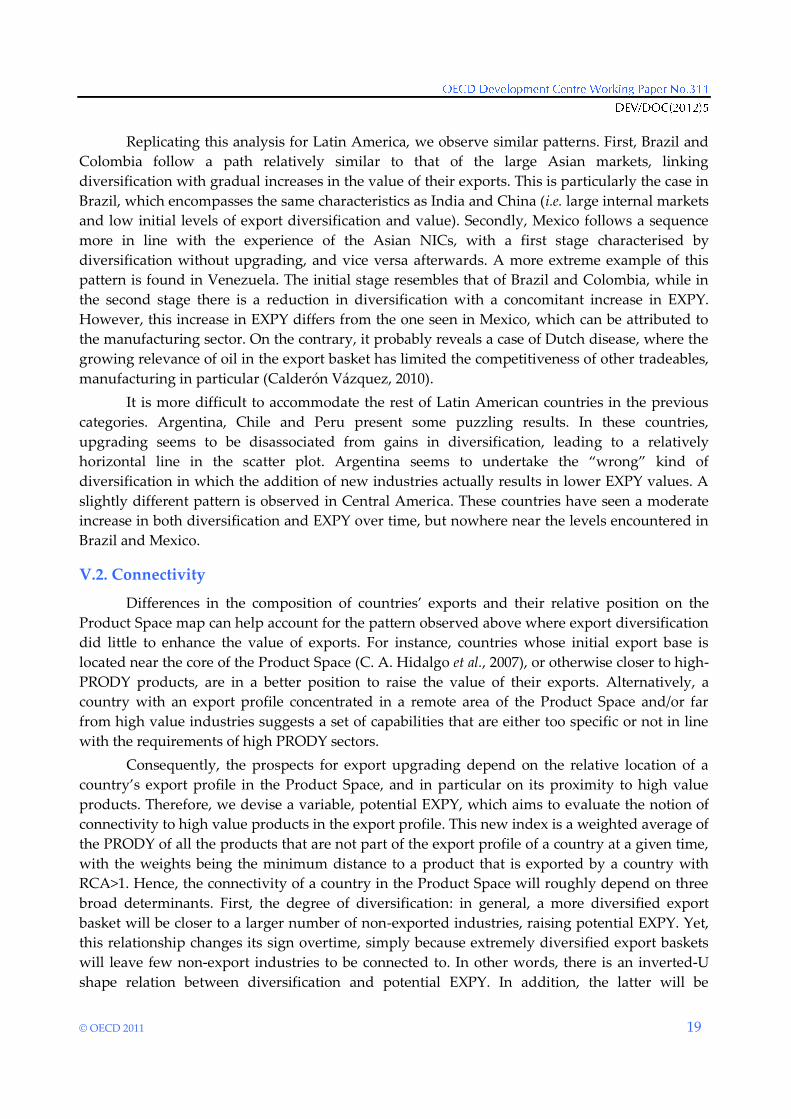
Replicating this analysis for Latin America, we observe similar patterns. First, Brazil and
Colombia follow a path relatively similar to that of the large Asian markets, linking
diversification with gradual increases in the value of their exports. This is particularly the case in
Brazil, which encompasses the same characteristics as India and China (i.e. large internal markets
and low initial levels of export diversification and value). Secondly, Mexico follows a sequence
more in line with the experience of the Asian NICs, with a first stage characterised by
diversification without upgrading, and vice versa afterwards. A more extreme example of this
pattern is found in Venezuela. The initial stage resembles that of Brazil and Colombia, while in
the second stage there is a reduction in diversification with a concomitant increase in EXPY.
However, this increase in EXPY differs from the one seen in Mexico, which can be attributed to
the manufacturing sector. On the contrary, it probably reveals a case of Dutch disease, where the
growing relevance of oil in the export basket has limited the competitiveness of other tradeables,
manufacturing in particular (Calderón Vázquez, 2010).
It is more difficult to accommodate the rest of Latin American countries in the previous
categories. Argentina, Chile and Peru present some puzzling results. In these countries,
upgrading seems to be disassociated from gains in diversification, leading to a relatively
horizontal line in the scatter plot. Argentina seems to undertake the ‚wrong‛ kind of
diversification in which the addition of new industries actually results in lower EXPY values. A
slightly different pattern is observed in Central America. These countries have seen a moderate
increase in both diversification and EXPY over time, but nowhere near the levels encountered in
Brazil and Mexico.
V.2. Connectivity
Differences in the composition of countries’ exports and their relative position on the
Product Space map can help account for the pattern observed above where export diversification
did little to enhance the value of exports. For instance, countries whose initial export base is
located near the core of the Product Space (C. A. Hidalgo et al., 2007), or otherwise closer to high-
PRODY products, are in a better position to raise the value of their exports. Alternatively, a
country with an export profile concentrated in a remote area of the Product Space and/or far
from high value industries suggests a set of capabilities that are either too specific or not in line
with the requirements of high PRODY sectors.
Consequently, the prospects for export upgrading depend on the relative location of a
country’s export profile in the Product Space, and in particular on its proximity to high value
products. Therefore, we devise a variable, potential EXPY, which aims to evaluate the notion of
connectivity to high value products in the export profile. This new index is a weighted average of
the PRODY of all the products that are not part of the export profile of a country at a given time,
with the weights being the minimum distance to a product that is exported by a country with
RCA>1. Hence, the connectivity of a country in the Product Space will roughly depend on three
broad determinants. First, the degree of diversification: in general, a more diversified export
basket will be closer to a larger number of non-exported industries, raising potential EXPY. Yet,
this relationship changes its sign overtime, simply because extremely diversified export baskets
will leave few non-export industries to be connected to. In other words, there is an inverted-U
shape relation between diversification and potential EXPY. In addition, the latter will be

20 © OECD 2012
determined by the location of the Product Space that the country’s export profile occupies, with
export profiles placed in remote areas having lower potential EXPY. Finally, this variable will be
affected by the value of the products that remain outside of a country’s export basket, with
higher-PRODY sectors raising its value.
Figure A3 (see Annex) shows that China and India have among the highest levels of
potential EXPY in the sample, with China fully entering the range of diversification with
diminishing returns to potential EXPY.16 Middle-size economies (Korea, Chinese Taipei, Thailand
and Indonesia) fare well in terms of potential EXPY, reaching values close to the Asian giants.17
Finally, some of the less developed countries in the region are also to reach a relatively high
value for potential EXPY, as they are still at levels of diversification that relate positively with
connectivity. The Philippines and Pakistan fall within this range, with potential EXPYs around
PPP$ 6 100 in 2009.
The high starting number of export sectors for China identified in the previous sub-
section contributes towards a higher initial level of potential EXPY (PPP$ 6 200 as early as 1963).
At a relatively short distance, Chinese Taipei and Korea show initial potential EXPYs around
PPP$ 5 500. Interestingly enough, the two Asian NICs improved rapidly in terms of connectivity,
at times surpassing China, and approaching their maxima around 1976. In short, this evolution is
related to the rapid early increase in diversification that both countries experienced until that
time. As we saw in the previous subsection, this did little to improve the quality of the export
profile, with EXPY values remaining essentially unchanged during that period. However, it went
a long way in raising the potential EXPY of the export profile of these countries, which would be
subsequently exploited in the second stage of their structural transformation.
In Latin America, we find the same positive association between diversification and
connectivity, with Brazil and Mexico reaching the highest levels of potential EXPY in the region
(PPP$ 6 439 and PPP$ 6 268 in 2009). Argentina and Colombia come next, with potential EXPYs
in the low 6 000s. And just as in the previous sub-section, some of the Andean countries show
low values: Chile and Peru, reach a potential EXPY of PPP$ 5 350 and PPP$ 5 715 by 2009. This is
roughly the level of potential EXPY found in Bangladesh, Laos and Nepal, and actually lower
than smaller countries in Central America (e.g. Costa Rica, Dominican Republic, El Salvador,
Guatemala and Honduras).
V.3. Transitions
So far we have only considered annual snapshots of the countries’ export profiles, while
in this section we focus on the characteristics of the new products that countries begin to export.
On average, transitions into new products are more likely the closer the products are to currently
exported goods (see also Annex Figures A7 to A10, which show the Product Space maps of
Korea, Mexico, Brazil and China). Figure 2 shows a plot of the probability that a country
increases the RCA of a product from below one at time t to above one at time t+1 against the
proximity of the product to the country’s export profile at time t. We make the assumption that,
16. In 2009, China reached a potential EXPY of PPP$ 6 650, which falls slightly below other Asian countries at
much lower levels of diversification (e.g. Indonesia, with a potential EXPY of PPP$ 7 000).
17. Korea shows the lowest connectivity within this group, with a potential EXPY of PPP$ 6 200 in 2009.
© OECD 2011 21
when making a transition into a new industry, a country uses the skills and resources that are
employed in the closest export industry (Hidalgo et al., 2007). Hence we take the minimum
distance (maximum proximity ) from the actual export base. There is an almost perfect
monotonic relation between the proximity of goods and the probability of entering into a new
industry.
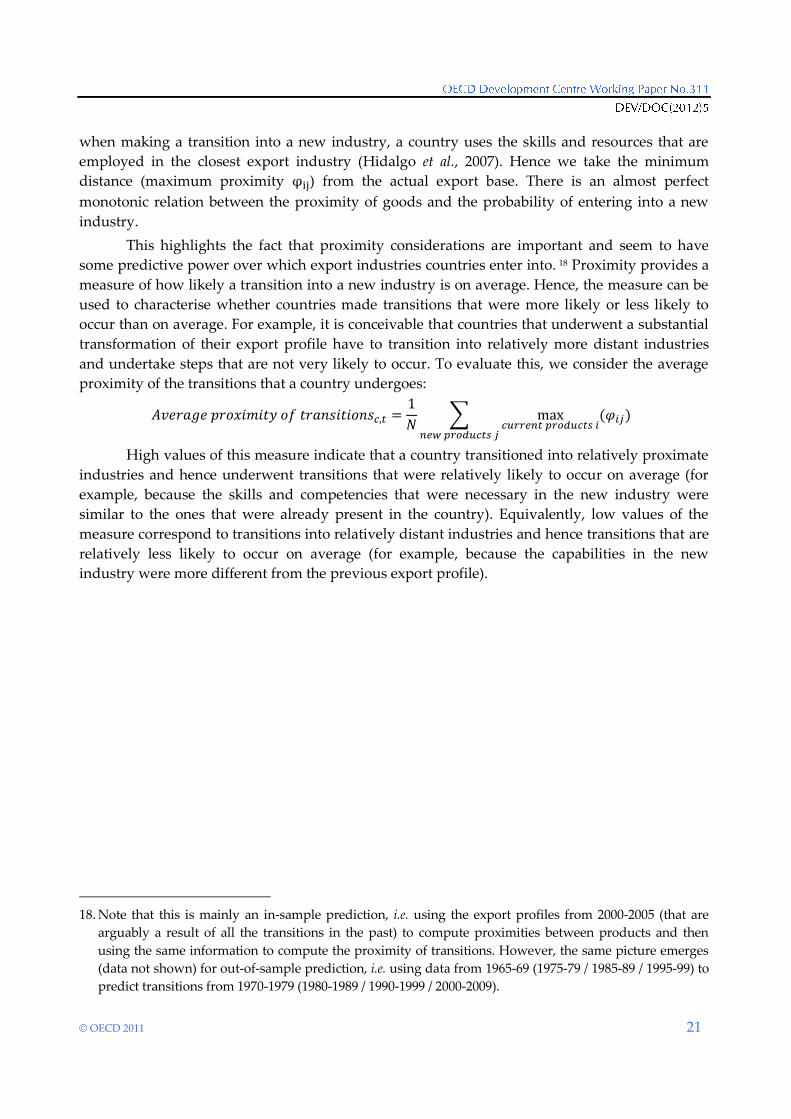
This highlights the fact that proximity considerations are important and seem to have
some predictive power over which export industries countries enter into. 18 Proximity provides a
measure of how likely a transition into a new industry is on average. Hence, the measure can be
used to characterise whether countries made transitions that were more likely or less likely to
occur than on average. For example, it is conceivable that countries that underwent a substantial
transformation of their export profile have to transition into relatively more distant industries
and undertake steps that are not very likely to occur. To evaluate this, we consider the average
proximity of the transitions that a country undergoes:
High values of this measure indicate that a country transitioned into relatively proximate
industries and hence underwent transitions that were relatively likely to occur on average (for
example, because the skills and competencies that were necessary in the new industry were
similar to the ones that were already present in the country). Equivalently, low values of the
measure correspond to transitions into relatively distant industries and hence transitions that are
relatively less likely to occur on average (for example, because the capabilities in the new
industry were more different from the previous export profile).
18. Note that this is mainly an in-sample prediction, i.e. using the export profiles from 2000-2005 (that are
arguably a result of all the transitions in the past) to compute proximities between products and then
using the same information to compute the proximity of transitions. However, the same picture emerges
(data not shown) for out-of-sample prediction, i.e. using data from 1965-69 (1975-79 / 1985-89 / 1995-99) to
predict transitions from 1970-1979 (1980-1989 / 1990-1999 / 2000-2009).

22 © OECD 2012
Figure 2. Conditional probability of transition versus proximity
Source: Authors’ calculations.
Figure A4 (see Annex) shows the 5-year mean of the average proximity of transitions
versus the diversification of a country’s export profile.19 A first general conclusion that can be
drawn from the analysis is that less diversified countries are ‚farther‛ from all products and on
average have to make less probable transitions to change their export structure. Similarly, more
diversified countries are relatively ‚close‛ to everything else and make on average higher
proximity transitions. Due to the relation between the average proximity of transitions and
diversification, one can only meaningfully compare countries that have the same level of
diversification, i.e. one needs to consider the average proximity conditional on the level of
diversification.
The first observation is that countries like Mexico, Korea and Chinese Taipei (which were
identified in the previous sections as having substantially transformed their export structure
towards more sophisticated, higher value products) did not undergo improbable transitions
given their level of diversification. If anything, in the last decades the average proximity of
transitions in these countries was higher than the one of countries with a similar level of
diversification. In contrast, countries that substantially diversified their export profiles, such as
China, India and Brazil, tended to transition into relatively distant products.
19. The mean across the following time intervals was taken: 1964-68, 1969-73, 1975-79, 1980-83, 1985-89, 1990-
94, 1995-99, 2000-04 & 2005-2009. To avoid data issues resulting from SITC revisions, transitions in the
years 1974 and 1984 were not considered.

© OECD 2011 23
A different pattern is observed for a group of countries with a relatively low
diversification in Asia, such as Bangladesh, Laos and Nepal, and Central America and the
Caribbean, such as Costa Rica, Guatemala, Honduras, El Salvador and the Dominican Republic.
Instead of relatively distant transitions that are usually seen at these levels of diversification,
these countries transition into relatively proximate products. By undergoing these relatively
likely transitions, these countries have seen a substantial increase in diversification over time
given their low starting point.
V.4. Clustering coefficient
To understand what differentiates the last group of countries from the rest, one needs to
consider the structure of their exports in the Product Space. Let us take a look at the export
profiles of Bangladesh in 2002 and of Korea in 1968. Both countries have a similar level of
diversification (54 vs. 53 products), EXPY (PPP$ 6 728 vs. PPP$ 7 501) and potential EXPY
(PPP$ 5 168 vs. PPP$ 5 425). However, considering a network representation of their export
profiles (Figure 3) it becomes apparent that the two countries occupy very different parts of the
Product Space. More than half of Bangladesh’s exports are concentrated in a small region, which
corresponds to export industries involved in the production of textiles and apparel. By contrast,
Korea’s export profile in 1968 is much more dispersed and its export products are positioned in
widespread regions of the Product Space. Given that proximity considerations play a crucial role
for changes in the export structure of countries over time, the spatial position that an export
profile of a country occupies in the Product Space influences the ease and the probability by
which transitions into new sectors can be made. For example, in 1968 Korea was already
relatively well positioned in the Product Space. Even though its export structure underwent a
tremendous transformation, it was able to do so by gradually transitioning into relatively
proximate industries.
Figure 3. Product Space representation of Bangladesh in 2002 and Korea in 1968
Source: Authors’ calculations.
24 © OECD 2012
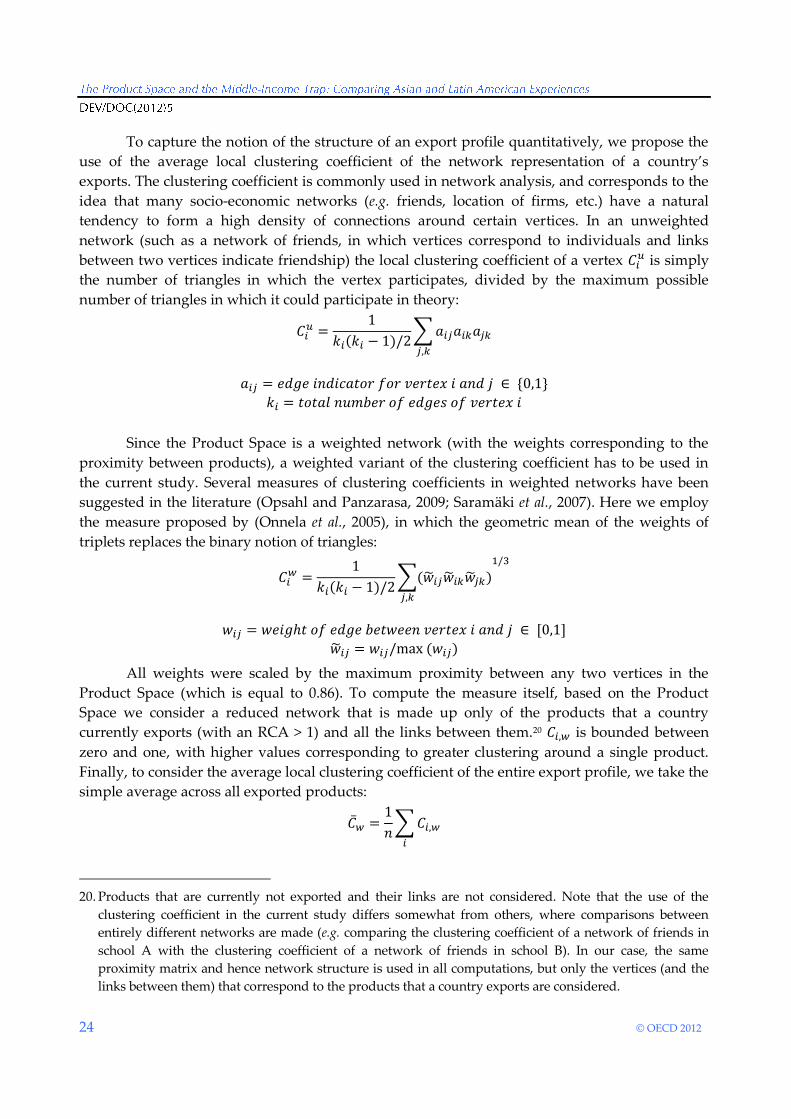
To capture the notion of the structure of an export profile quantitatively, we propose the
use of the average local clustering coefficient of the network representation of a country’s
exports. The clustering coefficient is commonly used in network analysis, and corresponds to the
idea that many socio-economic networks (e.g. friends, location of firms, etc.) have a natural
tendency to form a high density of connections around certain vertices. In an unweighted
network (such as a network of friends, in which vertices correspond to individuals and links
between two vertices indicate friendship) the local clustering coefficient of a vertex is simply
the number of triangles in which the vertex participates, divided by the maximum possible
number of triangles in which it could participate in theory:
Since the Product Space is a weighted network (with the weights corresponding to the
proximity between products), a weighted variant of the clustering coefficient has to be used in
the current study. Several measures of clustering coefficients in weighted networks have been
suggested in the literature (Opsahl and Panzarasa, 2009; Saramäki et al., 2007). Here we employ
the measure proposed by (Onnela et al., 2005), in which the geometric mean of the weights of
triplets replaces the binary notion of triangles:
All weights were scaled by the maximum proximity between any two vertices in the
Product Space (which is equal to 0.86). To compute the measure itself, based on the Product
Space we consider a reduced network that is made up only of the products that a country
currently exports (with an RCA > 1) and all the links between them.20 is bounded between
zero and one, with higher values corresponding to greater clustering around a single product.
Finally, to consider the average local clustering coefficient of the entire export profile, we take the
simple average across all exported products:
20. Products that are currently not exported and their links are not considered. Note that the use of the
clustering coefficient in the current study differs somewhat from others, where comparisons between
entirely different networks are made (e.g. comparing the clustering coefficient of a network of friends in
school A with the clustering coefficient of a network of friends in school B). In our case, the same
proximity matrix and hence network structure is used in all computations, but only the vertices (and the
links between them) that correspond to the products that a country exports are considered.

© OECD 2011 25
The average clustering coefficient provides a network-motivated measure of the
similarity and hence specialisation of an export profile. It gives some indication of how
diversified a country’s exports really are, which is not apparent by looking solely at the number
of products that are effectively exported. For instance, going back to our example from before,
Bangladesh has a value of 0.77 in 2002 and Korea 0.36 in 1968, which accords well with our visual
analysis from above. Note, however, that in general a high clustering coefficient is not
necessarily a reflection of unfavourable future opportunities since a country could also be
specialised in high value industries and as a consequence have other high value sectors in close
proximity.
Figure A5 (see Annex) shows the average clustering coefficient of all countries in the
sample plotted against diversification. There is some dependence between the level of
diversification and the average clustering coefficient. Very low clustering coefficients are only
observed at low levels of diversification. For higher levels of diversification products are
necessarily closer to each other. If a country exported all products under investigation it would
have a clustering coefficient of 0.36, which is substantially below the clustering coefficient in our
sample.
In Asia and Latin America, countries like China, India and Brazil, which strongly
increased the number of exported products and have large internal markets, display a relatively
low clustering coefficient and hence degree of specialisation. Their export structure is quite
spread out with relatively little clustering of export industries in specific parts of the Product
Space. In contrast, countries like Korea, Chinese Taipei and Mexico, which transformed their
export structure towards higher value goods, have recently seen an increase in the clustering
measure. In Korea, for example, this was reflected in particular by increases in the production of
machinery and transportation equipment and the reduction of light manufactured goods in its
export profile. Chile, Peru and Venezuela, with a high share of exports in commodity and
primary resource related industries, also show high levels in the clustering measure.
Particularly noteworthy in this context are the very high clustering coefficients of
Cambodia, Bangladesh, Laos and Pakistan in Asia, and Costa Rica, El Salvador, Guatemala,
Honduras and the Dominican Republic in Latin America. Their exported products tend to be less
diffuse and are relatively close to each other, somewhat overstating the countries’ diversification.
All the aforementioned countries export a range of products related to textile and apparel
industries and some, like Bangladesh in 2002, have more than half of their effectively exported
products in these sectors. Furthermore, in the previous analysis all these countries tended to
transition into relatively proximate products, which is in line with the dense clustering of the
export profiles of these countries. Presumably, the infrastructure and general capabilities that are
required to be competitive in the world market in one garment product are similar to the ones for
other garments, making transitions between industries in the garment sector relatively likely.
V.5. Capabilities
Using the data on exports of countries, it is also possible to directly obtain an estimate for
the capabilities present in a country. Hidalgo and Hausmann (2009) proposed a network inspired
measure of capabilities and showed that past values of this measure were predictive of future
GDP growth. In this context, one should think of capabilities in abstract terms and the particulars
26 © OECD 2012
are not further specified, but could include concepts as diverse as the rule of law, social norms,
but also stable electricity supply, access to ports, etc. As a first approximation, the more products
a given country exports, the more abundant capabilities are in that country. However, as we
have seen above (Korea in 1968 vs. Bangladesh in 2002) it is insufficient to consider
diversification only since it also matters which products a country exports. As a second
approximation, products that are exported by relatively few countries, i.e. are not very
ubiquitous, seem to require many or very particular capabilities.21 Using the ‚method of
reflections‛ (Hidalgo and Hausmann, 2009) these two sources of information can be combined
using a bipartite network representation of countries and products, in which countries and
products are connected if a country has an RCA greater than one in that product category.
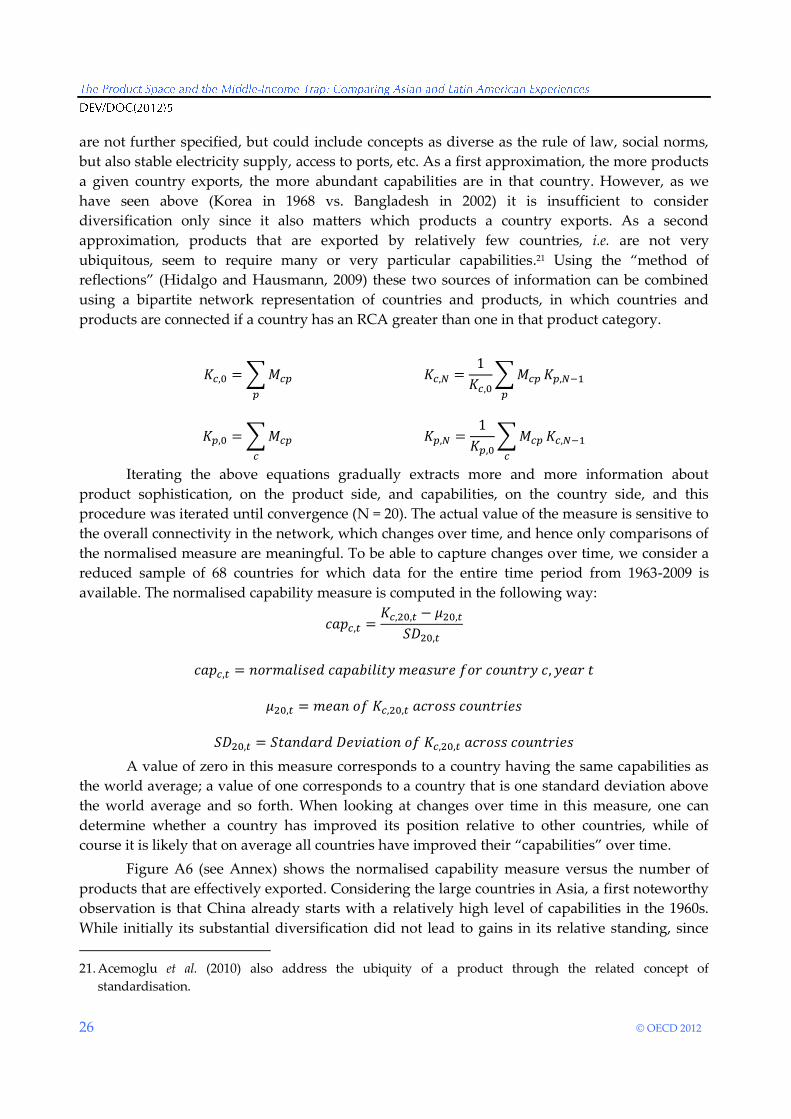
Iterating the above equations gradually extracts more and more information about
product sophistication, on the product side, and capabilities, on the country side, and this
procedure was iterated until convergence (N = 20). The actual value of the measure is sensitive to
the overall connectivity in the network, which changes over time, and hence only comparisons of
the normalised measure are meaningful. To be able to capture changes over time, we consider a
reduced sample of 68 countries for which data for the entire time period from 1963-2009 is
available. The normalised capability measure is computed in the following way:
A value of zero in this measure corresponds to a country having the same capabilities as
the world average; a value of one corresponds to a country that is one standard deviation above
the world average and so forth. When looking at changes over time in this measure, one can
determine whether a country has improved its position relative to other countries, while of
course it is likely that on average all countries have improved their ‚capabilities‛ over time.
Figure A6 (see Annex) shows the normalised capability measure versus the number of
products that are effectively exported. Considering the large countries in Asia, a first noteworthy
observation is that China already starts with a relatively high level of capabilities in the 1960s.
While initially its substantial diversification did not lead to gains in its relative standing, since
21. Acemoglu et al. (2010) also address the ubiquity of a product through the related concept of
standardisation.

© OECD 2011 27
the early 1990s China has progressively improved in the capability measure faster than the world
average. Thailand and Indonesia, which have also substantially increased their diversification
since the 1960s, have seen a gradual concomitant increase in capabilities. While India had a
relatively high starting value, it has gained relatively less from its increase in diversification.
With regards to the countries that have substantially transformed their export structure, the high
starting values in the capability measure for Korea and Singapore stand out. Korea did not
improve its standing until 1995, but since then has reached values substantially above the world
average. Singapore displays a more gradual trajectory and in 2008 reached a value of almost 2
standard deviations above world average.
In general, Latin American countries have capabilities below world average throughout
the sample period with the exception of Central America at the beginning of the 1960s, Brazil
from 1980 onwards and Mexico at all times. Mexico has seen small increments in its relative
performance and now has the highest level of the measure in Latin America with almost one
standard deviation above average, although this is still lower than the value of Korea, for
example. Brazil has a low starting value of one standard deviation below the average and has
seen a gradual increase in the capability measure concomitant with its increase in diversification.
Strikingly, in Argentina, Chile, Colombia and Peru the increases in diversification have not
translated into improvements in the capability measure relative to other countries. The Central
American countries under investigation, Costa Rica, Guatemala and El Salvador, all started off
with relative high values in the 1960s. Thereafter, they substantially lost ground and it is only
since the late 1980s that, simultaneously with increases in diversification, these countries have
somewhat improved relative to the others.

28 © OECD 2012
VI. PRODUCT SPACE AND PRODUCTIVE DEVELOPMENT POLICIES
Aside from differences in institutions and relative factor endowments, the divergent
trajectories that countries’ export profiles followed in the Product Space suggest the instrumental
role of Productive Development Policies (PDPs). To account for these sources of heterogeneity,
the following section reviews the PDPs enacted by Korea, one of the most successful examples of
structural transformation. We compare and contrast the Korean case with the experiences of
Brazil and Mexico.22 These three countries were broadly successful in creating revealed
comparative advantages in the sectors targeted by their PDPs. However, there were notable
differences in the extent to which these trade opportunities were harnessed towards income
convergence. This divergence in outcomes is related to differences in market structure, policy
consistency, mechanisms utilised, and coherence with other general framework conditions
necessary for trade-led growth and productive upgrading. Finally, we briefly examine China’s
position in the Product Space, in light of its recent transition into upper middle-income country
status.
VI.1. Korea
As shown in the previous section (see also Annex Figure A2), Korea’s export structure has
followed the trajectory of what we called a ‘two-stage reformer’, characterised by swift
diversification followed by a sharp increase in EXPY. This pattern is not surprising upon
examination of the PDPs that Korea put in place beginning in the 1960s, and the mechanisms
Korea employed for trade-led growth and structural transformation. Korea’s five-year Economic
Development plans were inspired by the Japanese model of productive development, and began
in 1962 with a strategy towards import substitution industrialisation (ISI). PDP was designed to
co-ordinate the learning-by-doing process of firms. This was accomplished by putting in place
the appropriate incentives for addressing ‘self-discovery costs’ which firms face when expanding
into new industries (Hausmann and Rodrik, 2003). These costs include the risk associated with
taking on new product lines, after which the benefits are non-excludable and can then be
duplicated by other firms. This approach employed measures such as tariff protection, tax
exemptions, and favourable access to foreign exchange and subsidised credit for domestic
businesses, in order to shield domestic firms from international competition while productive
capacities developed. Beginning in 1967, the focus was shifted to export-led growth, with strong
financial incentives supporting export performance. Productive development began with the
22. Mexico and Brazil were chosen as illustrative cases in Latin America due to the relative prominence of
their productive development programs. However, we recognise that their experiences are probably not
representative of other countries in the region (e.g. Chile).

© OECD 2011 29
expansion of production in light manufacturing (wigs, garments, textiles) followed by a big push
into heavy industries and chemicals in the 1970s, movement towards ship building, electronics
and machinery in the early 1980s, and a consistent push towards technology-intensive products
of increasing sophistication, such as Information and Communication Technologies (ICT), bio-
and nanotechnology, in the following decades (ECLAC, 2009). The choice of target sectors and
sequencing of productive development was a function of both availability of factors of
production as well as the forward and backward linkages associated with target industries
(Baik et al., 2011).
Capacity for structural change was augmented by the large firm-dominated market
structure. Entry into new industries was predominantly implemented through state-directed
credit to chaebols, large conglomerates which undertook production in the target industries. The
chaebols’ large size and diversified structure was advantageous in limiting risks in taking on
new industrial activities, as well as increasing capacity for achieving economies of scale. This is
likely to have reduced the magnitude of self-discovery externalities, as firms with market power
were able to internalise them.
Korea’s outward-oriented ISI proved effective in protecting infant industries while
simultaneously invoking market discipline on domestic firms. Through the coupling of tariff
protection and state bank financing contingent on export performance, this strategy rewarded
efficient firms facing productivity enhancing competition from international producers;
effectively forcing mature industries to prosper independently or fail (such as the Kukuje group
in the early 1980s (Fukagawa, 1997)). Substantial tariff barriers and import licensing schemes
were used to protect nascent industries from external competition. Nonetheless, this protection
was temporary and channelled to new industries over time in line with the evolving strategy for
productive development. According to Lall (2003) the effectiveness of this model was bolstered
by the strict selectivity and time limitation of government intervention, the centralisation of
strategic industrial decisions in competent authorities, and a highly selective use of foreign direct
investment (FDI). The policy shifted beginning in the 1990s towards facilitating productive
development in skill intensive industries. Korea began to use government subsidised venture
capital to SMEs in higher technology industries, invested in technology parks to spur research
and development (R&D) activities, and worked to foster the links between firms and universities.
The evolution of the export profile in Korea from 1963 until 2009 (Annex Figure A7) is
visible in the dramatic shifts of RCAs across the Product Space map in target industries. At the
outset in 1963, Korea had a small number of industries with revealed comparative advantages
(RCAs greater than one) in different parts of the Product Space. These were largely agricultural
sectors such as fresh fruit and meat products as well as some minor industrial capacities
particularly in the areas of iron and steel, small electric motors, silver mining, and glass related
industries inherited from the Japanese occupation (Syrquin, 2003). By the early 1970s, the strong
diversification across light manufacturing industries was evident in the increase in the number of
products with competitive RCAs. This shows up in several areas including textiles, such as
woven fabrics, manufactured wood items, bicycles, simple machinery including basic office
machinery, sewing machines and calculators as well as some railway related fixtures and fittings.
In line with its productive development strategy and the push towards heavier industries,
between the 1970s and the 1980s the Korean Product Space map shows a substantial build up in

30 © OECD 2012
export capacity in the garment cluster, the electronics cluster, vehicles, as well as in the iron and
steel related area. This increase in core areas of the Product Space paves the path for developing
export potential across a number of related products in machinery and electronics.
The scope of the structural shift becomes evident with the move into new products and
diminishing production in industries in which Korea is no longer competitive (Ahn and Mah,
2007). Beginning in the 1990s, the RCAs in the garment cluster begin to disappear, accompanied
by a movement out of some areas of electronics, towards new areas of core machinery such as
electro thermal appliances, work trucks, tyres, textile machinery and a variety of iron and alloy
steel products. The pattern of specialisation in more sophisticated machineries and electronics
continued throughout the 2000s. By 2009, Korea had a diversified export structure with RCAs in
various areas related to vehicles, iron and steel, electronics, machinery and chemicals. The
increasing degree of sophistication was evident with an increasing presence of RCAs in areas
such as computers, telephones, optical fibres, photosensitive semi-conductors, civil engineering
equipment, cathode rays and other television and broadcasting related electronics (see also
increased capability measure in Figure A6 (see Annex). Meanwhile, Korea had effectively lost its
export competitiveness in agriculture and light manufacturing areas such as garments, textiles
and wood products and mining related industries. This dynamic process of diversification into
new industries and leaving behind sectors where the economy loses its competitive edge is
clearly reflected in the dynamic and changing patterns of RCAs over time on the Product Space
map.
VI.2. Latin America
In Mexico and Brazil, the experience with PDP began a few decades earlier than in Korea,
and while it employed ISI, it differed somewhat in its mechanisms as well as its evolution.
Initially, Latin American countries used broadly similar strategies for facilitating structural
change by protecting infant industries during capabilities accumulation with tariff and non-tariff
barriers. ISI began in the 1930s, and intensified throughout the 1950s with higher rates of tariff
protection and stricter import licensing regimes. Like Korea, Mexico and Brazil also pursued
industrialisation in the core areas of the Product Space such as steel, iron, heavy chemicals, and
machinery industries during the 1970s.
While the policies for facilitating structural change were generally similar, there were
some notable differences in the mechanisms used to implement PDP, as well as the sequencing of
policies. Firm structure was more varied in Latin America. Whereas in Korea productive
development was primarily entrusted to large diversified conglomerates, in Latin America
government support was spread to a larger number of firms of varying sizes. This decreased the
efficiency of productive development and opened the door for increased lobbying activities on
the part of firms which faced greater difficulties in attaining economies of scale and internalising
the risks associated with moving into new productive areas (Edwards, 1994). Another key
difference in Latin America was the lack of clearly defined performance criteria for financial
support to firms, resulting in widespread inefficiencies (Adams and Davis, 1994). Without the
influence of external competition or measurable performance criteria, Latin American
governments were prone to rent-seeking behaviour from domestic firms with limited incentives
for productivity growth. Export promotion was put in place in Latin America later in the

© OECD 2011 31
productive development process at which point macroeconomic imbalances (negative trade
balance and current account deficit) were already significant. Latin American governments were
also keen to benefit from spillovers from FDI. Foreign firms played a larger role in the Latin
American context, particularly in Mexico through its Border Industrialisation/Maquila program.
In addition, sequencing in Latin America was less aligned with the underlying factor
endowments in the economies. Latin American countries tended to move more quickly toward
capital intensive and skill intensive industries, not entirely in line with their latent comparative
advantage which shifted more gradually.
In addition to differences in the mechanisms employed, there were also disparities in
domestic constraints. Latin American countries faced stronger challenges to the competitiveness
of their manufacturing sectors than those in Korea. The relatively elevated cost of labour,
combined with the often overvalued exchange rates, had a strong dampening effect on
competitiveness (Adams and Davis, 1994). According to Edwards (1994), while productive
development policies were successful in building up the industrial sector in Latin America,
success came at a very high cost. The drain on Latin American economies became unsustainable
as a consequence of uncompetitive exchange rates, distortions in the economy, the volatility of
commodity prices, and numerous firms competing for government support and resources.
Korean and Latin American PDPs also varied in terms of policy continuity. Following the
debt crisis of the early 1980s, there were dramatic shifts in productive policies towards
widespread trade liberalisation, privatisation and deregulation (Khan and Blankenburg, 2009).
According to Peres (2011), since the 1990s, policies have focused more on enhancing the
productivity and efficiency of existing sectors. Building up productive capacities in new activities
appeared sporadically as a policy objective, mainly driven by international trade negotiations
aimed at increasing market access and attracting FDI. These policy initiatives included the
expansion of Mexico’s export platform in NAFTA (automobiles and transport components,
electronics, clothing), the promotion of basic assembly activities (maquiladoras) in a number of
Central American and Caribbean countries (clothing), as well as investments in privatised firms
in the services and commodity sectors in South American countries. The new strategy had
several limitations such as low value added in the assembly activities, weak linkages to the
domestic economy, and the limited generation of endogenous technological capabilities (Peres,
2011). This policy shift was accompanied by a dramatic rupture with previous manufacturing
growth. While manufacturing output in the region had grown 6.8% per annum between 1945
and 1980, in the following two decades this figure was reduced to 1.4% in Latin America and the
Caribbean (Khan and Blankenburg, 2009). While the region has experienced gains in
macroeconomic stabilisation, there has also been an acceleration of the de-industrialisation
process (Khan and Blankenburg, 2009) which had important implications for productivity gaps
within the economy. As highlighted previously in Figure A1 (see Annex), the labour displaced
from the manufacturing sector was generally not absorbed into the high productivity mining
sectors, but instead moved into lower productivity services.
In response, there has been resurgence in sectoral policies in Latin America during the
last decade. This is best exemplified in Brazil which put in place the Guidelines for an Industrial
Technology and Foreign Trade Policy (PITCE) in 2003. These guidelines set out the strategic
sectoral alternatives in four knowledge-intensive activities: semi-conductors, software,

32 © OECD 2012
pharmaceuticals and medicines, and capital goods. This was followed up in 2008 with the
Productive Development Policy: Innovate and Invest to Sustain Growth program. This program
included fiscal measures and strategic technological programs in sectors including aeronautics,
oil, natural gas and petro-chemicals, bio-ethanol, mining, steel, automobiles, capital goods,
textiles and garments, civil construction, services, shipbuilding leather, footwear and leather
goods, agribusiness, and biodiesel (Ferraz et al., 2009; Government of Brazil, 2008).
Figure A8 (see Annex) shows the evolution of the Product Space profile in Mexico from
1963-2009. The 1963 Product Space map reveals RCAs in products including chemical
compounds, lead, mineral metal manufactures, and wood manufactures as well as agricultural
products such as fruits, nuts and coffee. By the late 1970s, following the push into heavier
industries and the start of the Border Industrialisation program, Mexico showed RCAs greater
than one in a diverse spectrum of areas including electronics, machinery, vehicles, chemicals,
garments, and iron and steel. Diversification and movement into new areas of the Product Space
decreased after the 1980s and Mexico displayed a pattern of increasing specialisation in certain
electronics, and vehicle related machinery. Overall, the Mexican Product Space images resemble
those of Korea, demonstrating RCAs in a large number of products and an increasing
specialisation in core machinery over time, but the country appears to begin to lose its
comparative advantage in certain electronics by 2009.
The evolution of Brazil’s export profile during this period differs markedly from the
experiences of Mexico and Korea. As seen in Figure A9 (see Annex), Brazil begins with a more
diffuse pattern of RCAs across the Product Space in 1962 ranging from inorganic chemical
products and railway coaches to coffee and edible nuts. By the late 1970s, Brazil had built up
more capacities in iron and steel, printing machinery, electrical resistors, tractors, broadcasting
devices, and certain chemicals, while maintaining significant RCAs in agricultural products and
mining. Throughout the 1980s, the push towards heavier chemicals and industries is evident in
the increasing number of products with RCAs greater than one in these areas. Similar to the
experience in Mexico, there is a strengthening specialisation and narrowing of the export profile
throughout the 2000s. In Brazil this is particularly visible in machinery, mining related activities,
vehicles, iron and steel related industries and in oil refining. In contrast to Mexico and Korea,
while Brazil managed a gradual diversification into a greater number of products, it did not
manage to develop significant comparative advantages in the garment and electronics clusters.23
Despite the similarities in export potential across numerous industries and products
reflected in the Product Space maps of Brazil, Mexico and Korea, there are significant differences
between export potential (as reflected in RCAs>1) and actual export performance. This gap is
indicative of the degree to which productive development strategies contributed to export-led
growth. Differences in trade openness, as measured by total merchandise trade to the value of
GDP, put the relative trade performance in perspective. Between 1960 and 2010, these values
increased by 78% in Korea, 44% in Mexico, and 1% in Brazil. Mexican and Brazilian export
values24 exceeded those of Korea until 1973; however, due to rapid growth during this period,
23. While Brazil’s garment industry has not been very active in cross-border trade, the sector is growing in
importance as a domestic industry.
24. World Bank World Development Indicators 2011.

© OECD 2011 33
the value of Korean exports rose to a level 1.5 times greater than those of Mexico by 2010. While
the value of total exports increased dramatically in each of the three countries; Korean exports
grew substantially faster at an average annual rate of 21.6%, relative to 12.9% and 10.9% in
Mexico and Brazil, respectively. This impressive export performance helps explain some of the
differences in GDP growth.
Table 1. Top exports by value, 1963-2009
Source: Feenstra et al. (2005) and UN Comtrade.
In addition to export values, there are also discernible differences in the evolution of
sophistication of top exports; reflecting the scale of export upgrading. Table 1 displays the
evolution of top 5 exports for these countries over time. In the 1960s, agricultural and primary
products dominated the top export baskets of all three countries. However, over time distinct
patterns emerge. In the case of Brazil, aside from the entry of iron ore in the 1980s and passenger
cars in the early 2000s, the top 5 exports remain largely agricultural products and natural
resources throughout the decades. Mexico’s top export pattern displays a greater level of
upgrading. By the 1980s, vehicles, televisions and petroleum have become leading exports, and
persist in their dominant positions for the following two decades. By contrast, the Korean
example shows a steady progression of upgrading from agricultural and primary products,
towards light manufacturing, and then into increasingly sophisticated electronics and machinery.
While not necessarily reflected in the EXPY measures which are similar in the cases of Mexico
and Korea, this continued progression marks a clear distinction from the Brazilian and Mexican
cases where structural transformation of main exports was either limited altogether or stunted in
the mid-1980s following the debt crisis. This may be partially attributed to differences in market
structure, and the greater efficiency of large Korean firms in undertaking productive activities in
Brazil
Export share
Mexico
Export Share
Korea
Export Share
1963
1.
Coffee
2.
Cotton 3.
Wood
4.
Agave Textile Fibers 5.
Cocoa beans
58.7% 10.1% 3.9%
3.0% 2.9%
1.
Cotton 2.
Coffee
3.
Silver 4.
Beef
5.
Lead
29.9% 6.8%
5.5% 5.2% 3.5%
1.
Raw silk 2.
Base metal ores
3.
Live swine 4.
Materials of
animal origin
5.
Cotton gauze
13.8% 9.5%
9.3% 8.9% 8.8%
1973
1.
Coffee 2.
Oil Cake
3.
Soybeans 4.
Sugar
5.
Cotton
24.5% 9.3%
8.9% 8.5% 4.5%
1.
Silver 2.
Cotton
3.
Coffee 4.
Tomatoes
5.
Sugar
8.12% 7.78% 7.45% 6.0%
4.9%
1.
Clothing accessories 2.
Light manufactured goods
3.
Iron/steel 4.
Woven fabrics of silk
5.
Raw silk
22.0% 5.8%
5.6% 5.3% 4.5%
1983
1.
Coffee 2.
Oil - Cake
3.
Iron ore 4.
Footwear
5.
Juices
14.2% 11.9% 4.0%
2.5% 2.2%
1.
Par ts for sound recording equip. 2.
Silver
3.
Internal combustion engines 4.
Natural gas
5.
Coffee
7.6% 5.7% 4.4% 4.1% 3.7%
1.
Ships 2.
Footwear
3.
Tugs 4.
Fabrics
5.
Electronic microcircuits
5.0% 4.6% 4.1% 3.9% 3.9%
1993
1.
Oil - Cake 2.
Footwear
3.
Iron ore 4.
Iron/Steel alloy
5.
Coffee
6.7% 5.6% 3.4% 3.2% 3.1%
1.
Petrol oils 2.
Passenger cars
3.
Insulated Electrical wire 4.
Car parts
5.
TVs
7.35% 6.46% 4.52% 3.55% 3.18%
1.
Electronic microcircuits 2.
Passenger cars
3.
Fabrics 4.
Ships
5.
Footwear
8.88% 4.57% 3.43% 2.97% 2.03%
2003
1.
Soybeans 2.
Passenger cars
3.
Oil cake 4.
Iron ore
5.
Petrol oils
6.10% 3.78% 3.70% 3.24% 3.02%
1.
Petrol oils 2.
Passenger cars
3.
Car parts 4.
Trucks
5.
TVs
10.3% 7.7%
4.3% 4.1% 3.9%
1.
Passenger cars 2.
Electronic microcircuits
3.
Electronics (radio, telephone) 4.
Ships
5.
Automatic Data processing machines
9.41% 8.23% 7.47% 5.56% 4.46%
2009
1.
Soy beans 2.
Iron ore
3.
Petrol oils 4.
Sugar
5.
Poultry
7.8% 7.2% 6.4% 4.1% 3.4%
1.
Petrol Oils 2.
TVs
3.
Passenger Cars 4.
Phone and Radio Electronics
5.
Car parts
11.7% 8.2%
6.8% 4.5% 4.2%
1.
Ships 2.
Electronic microcircuits
3.
Optical instruments and apparatus 4.
Passenger cars
5.
Electronics (radio, telephone)
11.1% 7.2%
6.9% 6.7% 5.4%
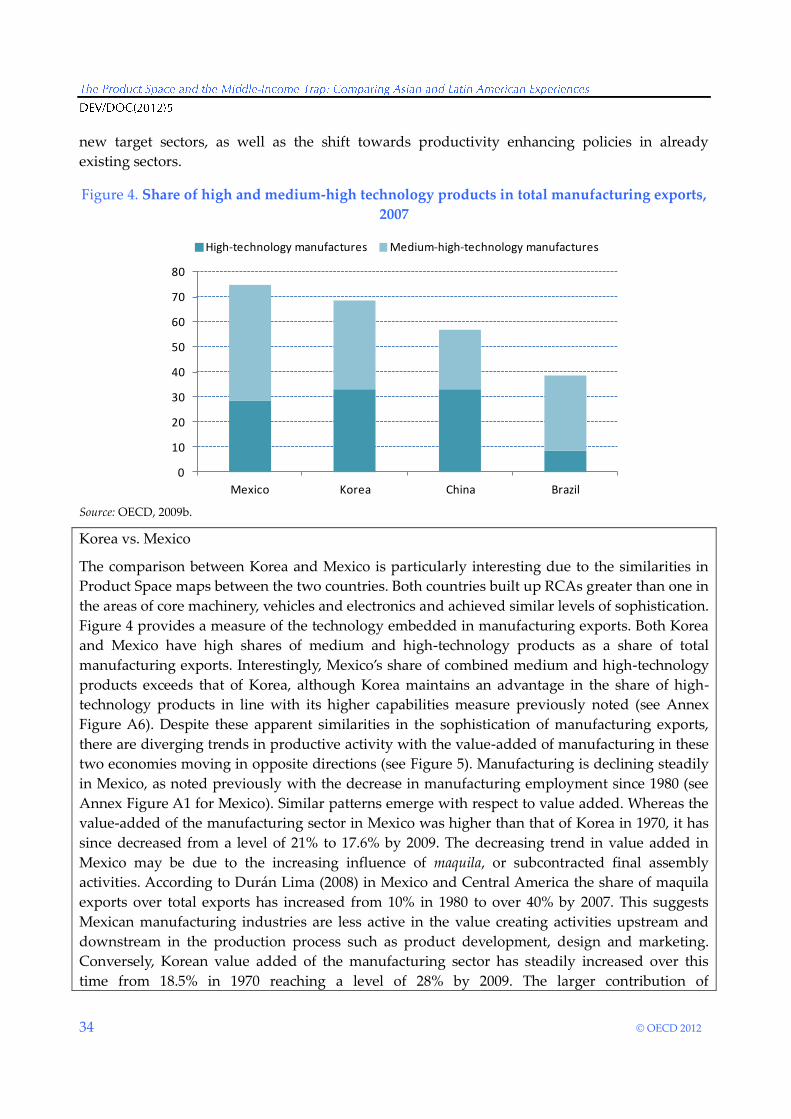
34 © OECD 2012
new target sectors, as well as the shift towards productivity enhancing policies in already
existing sectors.
Figure 4. Share of high and medium-high technology products in total manufacturing exports,
2007
Source: OECD, 2009b.
Korea vs. Mexico
The comparison between Korea and Mexico is particularly interesting due to the similarities in
Product Space maps between the two countries. Both countries built up RCAs greater than one in
the areas of core machinery, vehicles and electronics and achieved similar levels of sophistication.
Figure 4 provides a measure of the technology embedded in manufacturing exports. Both Korea
and Mexico have high shares of medium and high-technology products as a share of total
manufacturing exports. Interestingly, Mexico’s share of combined medium and high-technology
products exceeds that of Korea, although Korea maintains an advantage in the share of high-
technology products in line with its higher capabilities measure previously noted (see Annex
Figure A6). Despite these apparent similarities in the sophistication of manufacturing exports,
there are diverging trends in productive activity with the value-added of manufacturing in these
two economies moving in opposite directions (see Figure 5). Manufacturing is declining steadily
in Mexico, as noted previously with the decrease in manufacturing employment since 1980 (see
Annex Figure A1 for Mexico). Similar patterns emerge with respect to value added. Whereas the
value-added of the manufacturing sector in Mexico was higher than that of Korea in 1970, it has
since decreased from a level of 21% to 17.6% by 2009. The decreasing trend in value added in
Mexico may be due to the increasing influence of maquila, or subcontracted final assembly
activities. According to Durán Lima (2008) in Mexico and Central America the share of maquila
exports over total exports has increased from 10% in 1980 to over 40% by 2007. This suggests
Mexican manufacturing industries are less active in the value creating activities upstream and
downstream in the production process such as product development, design and marketing.
Conversely, Korean value added of the manufacturing sector has steadily increased over this
time from 18.5% in 1970 reaching a level of 28% by 2009. The larger contribution of
0
10
20
30
40
50
60
70
80
Mexico Korea China Brazil
High-technology manufactures Medium-high-technology manufactures
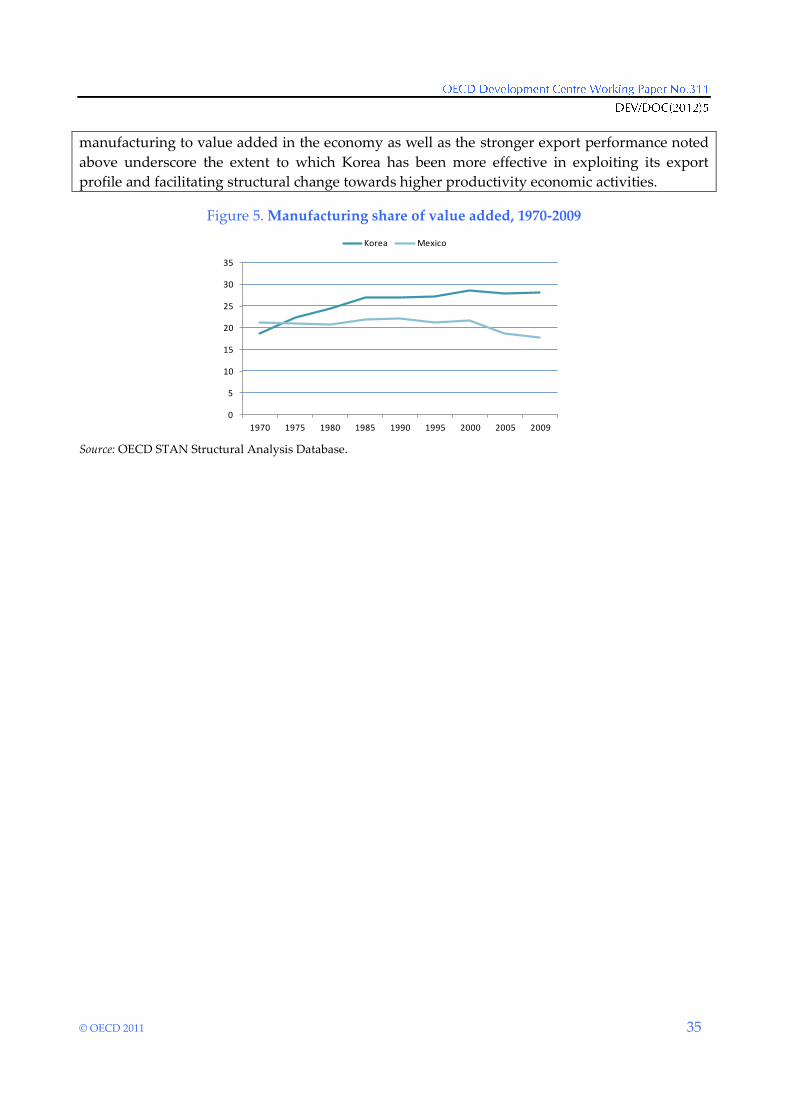
© OECD 2011 35
manufacturing to value added in the economy as well as the stronger export performance noted
above underscore the extent to which Korea has been more effective in exploiting its export
profile and facilitating structural change towards higher productivity economic activities.
Figure 5. Manufacturing share of value added, 1970-2009
Source: OECD STAN Structural Analysis Database.
0
5
10
15
20
25
30
35
1970 1975 1980 1985 1990 1995 2000 2005 2009
Korea Mexico

36 © OECD 2012
VII. GENERAL FRAMEWORK CONDITIONS
As shown above, Brazil and Mexico have not managed to harness their comparative
advantages to the same extent as Korea. This hindered potential is due to their relative weakness
in a number of general framework conditions which enhance connectivity in the economy,
decrease transport and logistics costs faced by firms, and help co-ordinate the supply of factors
of production in line with the productive development aspirations. These general framework
conditions include a number of services, which are of critical importance in light of the
complementarity between trade in goods and services; particularly in the areas of production,
distribution, and marketing of goods (Nordas, 2010).25 Exploiting the benefits of trade-led growth
and structural change is contingent on the availability and quality of infrastructure, policies
supporting innovation, and efficient services providing financing to the private sector and
facilitating human capital accumulation. The following section compares the policies and
outcomes across these areas and sheds light on some of the policy challenges that Brazil and
Mexico continue to confront.
Figure 6. Average years of total schooling, 1960-2010
Source: Barro and Lee, 2010.
25. As noted in Nordas (2010), in OECD countries in 2000, intermediate services accounted for 3-30% of total
manufacturing costs.
0
2
4
6
8
10
12
14
1960 1970 1980 1990 2000 2010
China Korea Mexico
Brazil LAC7 AVG

© OECD 2011 37
VII.1. Education policies
Education policy plays an important role in shaping factor endowments and shifting
latent comparative advantage towards higher productivity and skill-intensive industries. In
particular, the level of education of the labour force has a strong bearing on technology
absorption (Keller, 1996). Human capital formation was a clear strategic priority for the Korean
government to facilitate structural change and productive upgrading. This is evidenced by the
strong coherence between factor endowment and productive structures in Korea. During the
initial diversification into light manufacturing sectors, the government focused strongly on the
universalisation of primary education. With the shift to machinery and more capital intensive
industries, the Korean government facilitated access to secondary education and extensive
vocational schooling relevant to the development of productive capacities in new target
industries. The progression towards more skill intensive industries was accompanied by a
stronger focus on tertiary education with quotas and incentives for study in engineering and
science related fields. Furthermore, the growing demand for labour in new sectors fuelled the
virtuous circle of increasing demand for and the rewards to further education (Lee, 1994). By
contrast, education policy in Latin America was less coherent with productive development, and
fell short in terms of quality of education. Interestingly, while investments in Mexico and Korea
in education were very similar as shares of their respective GDPs, the allocation of public
expenditure on education by level of education was different, with Latin American funding
fluctuating erratically over the years (Kim and Hong, 2010). The coherence between stages of
productive development and focus on education policy strongly differentiated the positive
growth experience in Korea from those of Latin American contexts, such as Mexico. Despite
beginning from similar levels of average education in 1970 (see Figure 6), Latin America and
Korea show a substantial disparity in the length of average schooling over the subsequent four
decades. This is driven primarily by the strong growth in tertiary enrolment rates in Korea. The
difference in the quality of schooling as measured by international PISA test scores also reveals
significant gaps between Latin American and Asian students (see Figure 7). Latin American
students score much lower than their Korean counterparts in reading and below the minimum
proficiency level in the area of mathematics. This gap in performance, when standardising the
quality of education, is equivalent to 3.28 and 3.85 years less of schooling in Latin America in
reading and mathematics respectively (Daude, 2011; OECD, 2010).
Figure 7. PISA 2009 reading and math scores by country
Source: OECD Pisa 2009
0
100
200
300
400
500
600
Minimum Proficiency
M
0
100
200
300
400
500
600
700
Minimum Proficiency

38 © OECD 2012
There is also a notable difference in the linkages between education and the private
sector. In Korea, the government invested substantially in research institutes and industrial
parks, which channelled research into new sectors of the economy and also increased potential
for knowledge transfer into the private sector (OECD, 2009a). This focus on applied research is
evident in the respective research capacities across regions as seen in Figure 8. Korea has nearly
ten times more researchers relative to their population than Brazil or Mexico.
Figure 8. Researchers per million inhabitants
Source: World Bank WDI.
VII.2. Infrastructure policies
Infrastructure plays a central role in the connectivity of the economy, as well as a direct
bearing on transport and logistical costs. Korinek and Sourdin (2011) show that enhancements in
transport infrastructure have strong and positive impacts on trade, with a particularly large
impact in upper middle-income countries. Logistics services, including customs and
administrative procedures, organisation and management of international shipment operations,
tracking and tracing, play an important role in facilitating export performance. For instance, a
10% increase in the Trade Enabling Index, (which proxies trade logistics quality), is associated
with 36% increase in trade with a larger effect on exports than imports (Korinek and Sourdin,
2011).
Korea’s systematic infrastructure development began with its first Five Year Plan from
1962-66 and expanded steadily throughout the decades in response to trade-led needs; moving
into new forms of transport, and then into ‚soft infrastructure‛ such as access to ICT. While both
Korea and Latin America invested in hard infrastructure provision from the 1950s through the
1970s, there has been a growing deviation in infrastructure outcomes. Figure 9 shows the
quantity of roads with respect to country surface, and provides a quality indicator measuring the
share of paved to total roads. This figure displays the growing gap in both of these aspects of
road infrastructure between East Asia and Mexico and Brazil. This sizable gap is partly due to
differences in investment in infrastructure. While in Asia infrastructure spending is between 5-
7% of GDP, in the LAC-6 this share has dropped from 3.6% during the 1980s to 2% during the
last decade and has not been offset by private spending (Carranza et al., 2011). As indicated by
(Guasch, 2004), poor infrastructure and inferior performance in transport and trade services has a
0
1,000
2,000
3,000
4,000
5,000
Korea, Rep. China Brazil Mexico
1996 2000 2004 2007

© OECD 2011 39
significant bearing on logistics costs which account for approximately 25% of product value in
Latin America.
Figure 9. Quality and quantity of roads
Source: Calderon and Serven, 2010.
Note: Road quantity is the log of the length of roads per sq. kilometre of country surface area. The quality index ranges
from 0-1, is the share of paved roads in total roads.
In addition to the transport and energy infrastructure, the Korean government also
prioritised the provision of ‘soft infrastructure’, making broadband access a particular priority.
One prominent feature of the Korean Information Infrastructure (KII) development policy was
the effective inclusion of the private sector. While the government invested over USD 900 million
in backbone infrastructure, this was a relatively small share of the USD 33 billion invested overall
(Kim et al., 2010). By comparison, the gaps between Korea and Brazil and Mexico are even wider
in the areas of soft infrastructure. Figure 10 shows the share of households with access to
internet, computers and telephony. Mexico and Brazil only approach Korean rates of access in
mobile telephony but trail in all other areas.
Figure 10. ITU Core household telecoms indicators
Source: International Telecommunications Union, World Telecommunication/ICT Indicators Database.
Note: Share of total households with access.
These gaps have serious implications for market access, business efficiency, inclusiveness,
and upgrading into more innovative productive sectors. ICT infrastructure eases the movement
of capital, facilitates the logistics and co-ordination of global production and transport, as well as
0
0.1
0.2
0.3
0.4
0.5
0.6
0.7
0.8
0.9
1
0
0.1
0.2
0.3
0.4
0.5
0.6
0.7
0.8
0.9
1
1981-85 1991-95 2001-5
East Asia Quantity East Asia Quality
0
0.2
0.4
0.6
0.8
1
0
0.1
0.2
0.3
0.4
0.5
0.6
0.7
0.8
0.9
1
1981-85 1991-95 2001-5
Brazil Quantity Brazil Quality
0
0.2
0.4
0.6
0.8
1
0
0.1
0.2
0.3
0.4
0.5
0.6
0.7
0.8
0.9
1
1981-85 1991-95 2001-5
Mexico Quantity Mexico Quality
0
20
40
60
80
100
Fixed line telephone
Mobile cellular telephone
Computer
Internet access at home
Brazil
Mexico
Korea

40 © OECD 2012
creating new opportunities for trade in modern services. According to Clarke and Wallsten
(2006), greater internet penetration boosts export performance, particularly in developing
countries. This study, which looked at 27 advanced economies and 66 developing economies,
found that a 1 percentage point increase in the number of internet users is correlated with a boost
of exports of 4.3 percentage points and a stronger impact on exports from developing to
high-income countries. In addition to trade impacts, broadband penetration also contributes to
economic growth. According to a study by Qiang et al. (2009), for each 10 percentage point
increase in broadband penetration, advanced and developing economy GDP per capita grew an
additional 1.21% and 1.38% per annum respectively. With its relatively strong position in
broadband infrastructure with the highest penetration rates in the world, Korea is particularly
well positioned to benefit from these ICT externalities.
VII.3. Innovation policies
Beginning in the 1940s, public firms and research institutes were created in several Latin
American countries to promote capability accumulation in various sectors. During the ISI period
public funding played a paramount role in science and technology expenditure, reaching levels
exceeding 80% of total expenditure (Katz, 2000). These initiatives spanned many different
industries including EMBRAPA in Brazil working on agricultural innovation, the Mexican
Petroleum Institute (IMTA), and the Brazilian Aerospace Technology Center (CTA) (Di Maio,
2009). However, with the debt crises and macroeconomic instability of the 1980s continuing
through the 1990s, public funding in R&D diminished and private funding remains limited
(Figure 11).
Figure 11. R&D as a share of GDP and share finances by private sector
Source: OECD/ECLAC, 2011.
Korean innovation policy developed later than in Latin America but has been
administered with greater consistency. The Technology Development Promotion Law was
implemented in the early 1980s, at which time the government introduced criteria which made
financing and fiscal benefits contingent on the establishment of central R&D laboratories (Ahn
and Mah, 2007). With the K4D (Knowledge for Development) Program which began in the late
1990s, the Korean government sought to put in place an effective innovation system bringing
together firms, universities, and research centres to adapt new knowledge to local needs. Korea
ARGBOL
BRA
CHL
CHN
COLECU
MEX
KOR
0.0
0.5
1.0
1.5
2.0
2.5
3.0
0 20 40 60 80
R&
D a
s %
of
GD
P
Percent of R&D financed by private esctor

© OECD 2011 41
incentivised an increase in innovation activities through venture capital funds and fiscal benefits
for high technology start-ups, government investment in relevant soft infrastructure, and
increasing R&D activities (OECD, 2009a). As noted in the previous section, Korea’s capabilities
indicator, which started relatively high to begin with in 1960, increased notably after 1995
reaching a level substantially above world average, perhaps reflecting the fruits of these
innovation policies. The differences in the level of R&D and the share of R&D financed by the
private sector, clearly demonstrate some of the limitations in upgrading potential in the Latin
American context relative to the Korean experience (Figure 11).
VII.4. Access to finance
The availability and continuity of funding to the private sector has strong implications for
productive development. While Korea, Mexico and Brazil employed a great deal of government
and development bank funding for their PDP, access to finance for private firms appears to have
been relatively limited for Latin American countries, particularly following the debt crisis of the
early 1980s. Figure 12 shows the availability of domestic finance to the private sector over time
and the disparate general trends between the Asian and Latin American economies. Whereas
domestic credit to private enterprises increased steadily over time in Korea, even following the
Asian Financial Crisis of 1997, the trend is more volatile and uneven in Latin America.
Limitations in financing can severely reduce movement into new productive activities, and may
further explain the stronger specialisation in existing products in Latin America following the
debt crisis. These divergences reflect the impact of differences in macroeconomic stability as well
as domestic savings rates which were substantially higher in Korea.
Figure 12. Domestic credit to the private sector (% of GDP), 1960-2010
Source: World Development Indicators.
In sum, the coherence of general framework conditions with PDPs allowed Korea to
benefit to a greater extent from its Product Space positioning by taking greater advantage of
trade-led growth, and developing a highly skilled and integrated economy. By gradually
building up its productive capabilities, Korea managed to align its productive development
trajectory with the factors and resources at its disposal. Furthermore, the sequencing of sectors
and relative proximity in the Product Space map facilitated its substantial diversification and
subsequent upgrading.
0
20
40
60
80
100
120
140
19
60
19
65
19
70
19
75
19
80
19
85
19
90
19
95
20
00
20
05
20
10
Argentina Brazil ChileMexico Peru Venezuela, RB
0
20
40
60
80
100
120
140
19
60
19
65
19
70
19
75
19
80
19
85
19
90
19
95
20
00
20
05
20
10
China Korea, Rep.
42 © OECD 2012
VIII. CHINA
In closing, we turn our attention briefly to a very particular case, but a relevant one, as
China just crossed the World Bank’s threshold of upper middle-income GNI per capita of
USD 4 400 in 2010. Looking at China through the Product Space lens highlights some of its
outstanding features. As noted previously, even in 1960, China began with a relatively
diversified Product Space profile of high connectivity and high capabilities. In addition to these
strong starting conditions, China also benefits from a large internal market allowing for gradual
and deep diversification into a large number of products.
Figure A10 (see Annex) shows the development of China’s Product Space profile over
time. China began with RCAs in a number of agricultural, light manufacturing, chemical and
vehicle-related products including livestock, soybeans, fresh fruits, corn, sugar, railway
locomotives, silk, dyes, ceramics and glass mirrors. By the late 1970s, it expanded its comparative
advantage in textiles, garments and chemicals, and began to enter into electronics. Throughout
the 1980s, it strengthened its RCAs in the electronics cluster, vehicles and related machinery and
continued to diversify in these areas throughout the 1990s. By 2009, China displays widespread
RCAs across the Product Space map, exhibiting greater diversification than found in the Product
Space maps of Korea, Mexico or Brazil. This Product Space profile shows that China has a great
deal of potential for productive development in numerous industries.
China’s trade performance has grown considerably over the last two decades. In 2010,
China accounted for over 10% of global exports, making it the largest merchandise exporter in
the world, and second largest merchandise importer (WTO, 2011). In 2010, China’s top 5 exports
included electrical machinery and equipment, power generation equipment, apparel, iron and
steel, and optics and medical equipment demonstrating a broad range of product sophistication
(US-China Business Council, 2011).
While our snapshots of general framework conditions in China present some encouraging
results in the areas of availability of finance, innovation and quality of urban education, China’s
capacity to evade the middle-income trap will depend on a number of factors outside of the
scope of this paper. Nevertheless, China’s Product Space map highlights a strong foundation for
continued trade-led growth across many sectors.

© OECD 2011 43
IX. CONCLUSION
Contrary to other regions, Latin America hosts very limited cases of effective transitions
from middle to high income levels. To better understand this persistent lack of income
convergence, this study used the Product Space methodology to compare structural
transformation in Asia and Latin America.
The focus on the economic structure of a country does not imply a deterministic view of
the development path. On the contrary, productive transitions are the result of policies,
particularly those that aim to influence the economic specialisation of a country. Successful
structural change is driven by proximity considerations- with expansion into related industries,
making use of existing productive skills- while concomitantly accumulating more advanced
capabilities. This idea is related to the Growth Identification and Facilitation Framework (GIFF)
developed by Lin et al. (2011), which encourages policy makers to sequence structural
transformation, taking gradual steps in line with latent comparative advantage.
Policy co-ordination, particularly in the areas of education, infrastructure, innovation and
financing, plays a strong role in promoting the simultaneous evolution in economic structure and
framework conditions. A comparative analysis of Korea and Latin America underscores the
importance of sound policy design and implementation. For small and medium-sized
developing countries which are dependent on external markets for driving their productive
development, PDPs need to be guided by the appropriate temporary incentive structures, in line
with factor endowments, and be coherent with other relevant complementary policy areas.

44 © OECD 2012
ANNEX
Figure A1. Average Labour Productivity vs. Employment Shares (by sector; 1963-2003)

© OECD 2011 45

46 © OECD 2012

© OECD 2011 47

48 © OECD 2012
Source: Authors’ calculations.
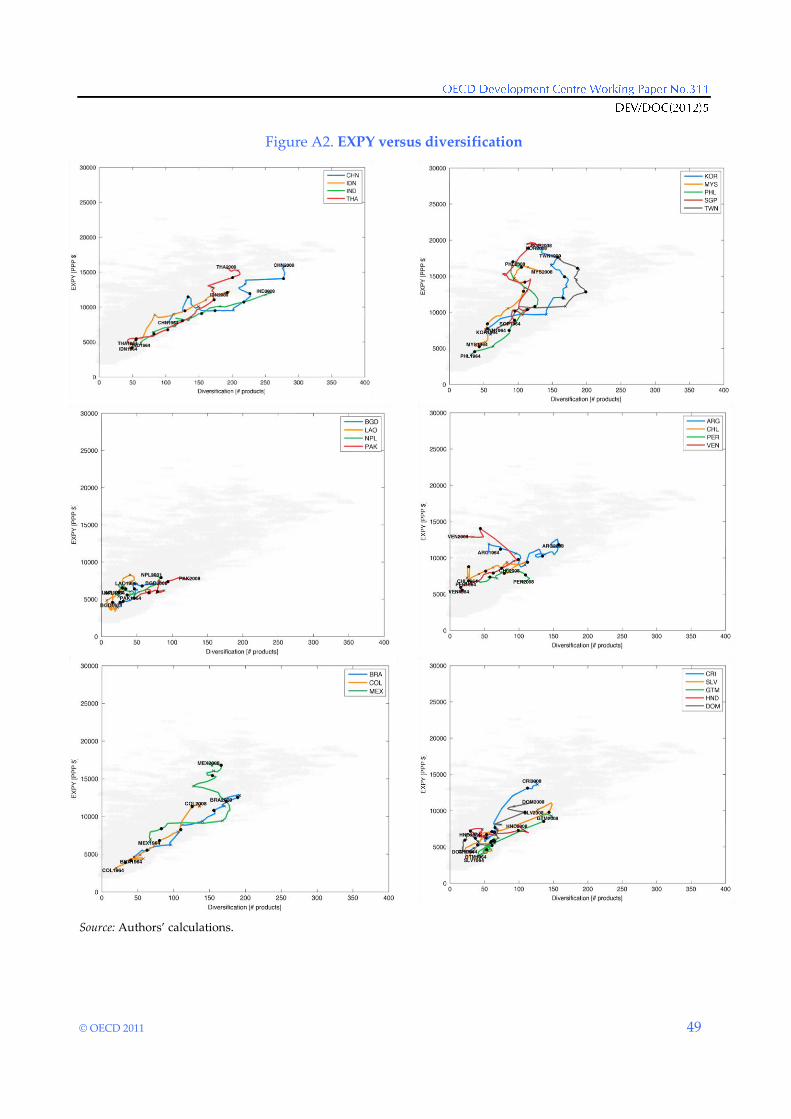
© OECD 2011 49
Figure A2. EXPY versus diversification
Source: Authors’ calculations.

50 © OECD 2012
Figure A3. Potential EXPY versus diversification
Source: Authors’ calculations.

© OECD 2011 51
Figure A4. Average proximity of transitions versus diversification
Source: Authors’ calculations.

52 © OECD 2012
Figure A5. Average clustering coefficient versus diversification
Source: Authors’ calculations.

© OECD 2011 53
Figure A6. Normalised capabilities versus diversification
Source: Authors’ calculations.

54 © OECD 2012
Figure A7. Korea Product Space Maps
Source: Authors’ calculations.

© OECD 2011 55
Figure A8. Mexico Product Space Maps
Source: Authors’ calculations.
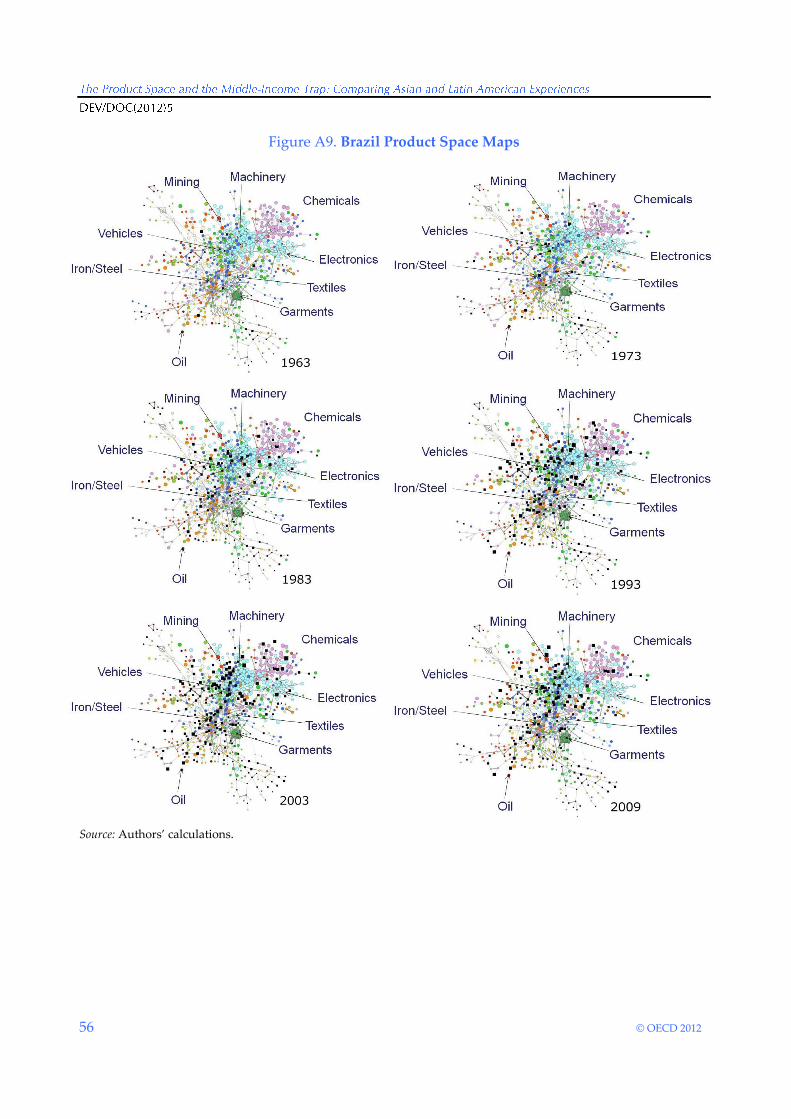
56 © OECD 2012
Figure A9. Brazil Product Space Maps
Source: Authors’ calculations.

© OECD 2011 57
Figure A10. China Product Space Maps
Source: Authors’ calculations.

58 © OECD 2012
REFERENCES
ACEMOGLU, D., G. GANCIA and F. ZILIBOTTI (2010), ‚Competing Engines of Growth: Innovation and
Standardization‛, Journal of Economic Theory.
ADAMS, F. G. and I. DAVIS (1994), ‚The Role of Policy in Economic Development: comparisons of the East
and Southeast Asian and Latin American experience‛, Asian‐Pacific Economic Literature, 8(1), 8-26.
AHN, H.-J. and J.S. MAH (2007), ‚Development of technology-intensive industries in Korea‛, Journal of
Contemporary Asia, 37, 364–379.
BAIK, C.J., B.K. KIM and E.F. VOGEL (2011), The Park Chung Hee Era: The Transformation of South Korea,
Harvard University Press.
BALASSA, B. (1977), ‚'Revealed' Comparative Advantage Revisited: An Analysis of Relative Export Shares
of the Industrial Countries, 1953-1971‛, The Manchester School of Economic and Social Studies, 45(4), 327-
344.
BARRO, R. and J.W. LEE (2010), ‚Educational attainment in the world, 1950–2010‛.
CALDERÓN VÁZQUEZ, F.J. (2010), ‚Círculos y Cuadraturas: Presiones inflacionarias y Enfermedad
Holandesa en la Venezuela Bolivariana‛, Entelequia: revista interdisciplinar, 12.
CALDERON, C. and L. SERVEN (2010), ‚Infrastructure in Latin America‛, The World Bank.
CARRANZA, L., C. DAUDE and M. MELGUIZO (2011), ‚Public Infrastructure Investment and Fiscal
Sustainability in Latin America: Incompatible Goals? ‛.
CHOUDHRY, M. (2009), ‚Determinants of Labor Productivity: an Empirical Investigation of Productivity
Divergence‛, Working paper, University of Groningen.
CLARKE, G. R. G. and S. J. WALLSTEN (2006), ‚Has the Internet Increased Trade? Developed and Developing
Country Evidence‛, Economic Inquiry, 44(3), 465-484.
COLE, H. L., L.E. OHANIAN, A. RIASCOS and J.A. SCHMITZ JR. (2005), ‚Latin America in the Rearview
Mirror‛, Journal of Monetary Economics, 52(1), 69-107.
DAUDE, C. (2010), ‚Innovation, Productivity and Economic Development in Latin America and the
Caribbean‛, OECD Development Centre Working Paper No 288.
DAUDE, C. (2011), ‚On the usefulness and pitfalls of development accounting in Latin America‛, OECD
Development Centre.
DAUDE, C. and E. FERNANDEZ-ARIAS (2010), ‚On the Role of Productivity and Factor Accumulation in
Economic Development in Latin America and the Caribbean‛, Inter-American Development Bank,
Research Department.
DI MAIO, M. (2009), ‚Industrial policies in developing countries: history and perspectives‛, Industrial Policy
and Development (pp. 107–143), Oxford University Press, Oxford.
DURÁN LIMA, J. E. (2008), ‚Indicadores de comercio exterior y política comercial: generalidades
metodológicas e indicadores b{sicos‛, ECLAC.
ECLAC (2009), ‚Theory and Practice of Industrial Policy. Evidence from the Latin American Experience‛.

© OECD 2011 59
EDWARDS, S. (1994), ‚Trade and Industrial Policy Reform in Latin America‛, National Bureau of Economic
Research Working Paper Series, No. 4772.
FEENSTRA, R. C., R. E. LIPSEY, H. DENG, A. C. MA and H. MO (2005), ‚World Trade Flows: 1962-2000‛,
National Bureau of Economic Research Working Paper Series, no. 11040.
FERRAZ, J. C., A. NASSIF and R. OLIVIA (2009), ‚Avancos, desafios e oportunidaded para politica de
desenvolvimiento productivo na. América Latina‛, BNDES.
FUKAGAWA, Y. (1997), ‚'Chaebol'-Led High Growth System in South Korea. East Asian Development
Experience -Economic System Approach and Its Applicability‛, IDE-JETRO.
GOVERNMENT OF BRAZIL (2008), ‚Política de Desenvolvimento Produtivo: Inovar e Investir para Sustentar
o Crescimento‛, BNDES, ABDI, MF, MDIC.
GUASCH, J. L. (2004), ‚Granting and Renegotiating Infrastructure Concessions: Doing It Right‛, World
Bank Institute of Development Studies.
HAUSMANN, R. and B. KLINGER (2006), ‚Structural Transformation and Patterns of Comparative
Advantage in the Product Space‛, CID working paper, no. 128.
HAUSMANN, R., J. HWANG and D. RODRIK (2007), ‚What You Export Matters‛, Journal of Economic Growth,
12(1), 1-25.
HAUSMANN, R. and D. RODRIK (2003), ‚Economic development as self-discovery‛, Journal of Development
Economics, 72, 603-633.
HIDALGO, C. A., B. KLINGER, A.L. BARABÁSI and R. HAUSMANN (2007), ‚The Product Space Conditions the
Development of Nations‛, Science, 317(5837), 482–487.
HIDALGO, A. C. and R. HAUSMANN (2009), ‚The building blocks of economic complexity‛, Proceedings of the
National Academy of Sciences, 106(26), 10570–10575.
HUMMELS, D. and P. KLENOW (2005), ‚The Variety and Quality of a Nation’s Exports‛, American Economic
Review, 95(3), 704-723.
KATZ, J. (2000), ‚Pasado y presente del comportamiento tecnólogico del América Latina‛, ECLAC.
KELLER, W. (1996), ‚Absorptive capacity: On the creation and acquisition of technology in development‛,
Journal of Development Economics, 49(1), 199–227.
KHAN, M. and S. BLANKENBURG (2009), ‚The Political Economy of Industrial Policy in Asia and Latin
America‛, Industrial Policy and Development; The Political Economy of Capabilities Accumulation, Oxford
University Press.
KIM, C. S. and M.-K. HONG (2010), ‚Education Policy and Industrial Development: The Cases of Korea and
Mexico‛, Journal of International and Area Studies.
KIM, Y., T. KELLY and S. RAJA (2010), ‚Building broadband; Strategies and policies for the developing
world‛, World Bank.
KORINEK, J. and P. SOURDIN (2011), ‚To What Extent Are High-Quality Logistics Services Trade
Facilitating?‛, OECD Trade Policy Working Paper.
KUZNETS, S. (1955), ‚Economic Growth and Income Inequality‛, The American Economic Review, 45(1), 1-28.
LALL, S. (2003), ‚Reinventing industrial strategy: The role of government policy in building industrial
competitiveness‛, QEH Working Paper Series.
LEE, J.-W. (1994), ‚Economic Growth and Human Development in the Republic of Korea, 1945-1992‛,
Occasional Paper 24.

60 © OECD 2012
LIN, J., C. MONGA, D.W. TE VELDE, S.D. TENDULKAR, A. AMSDEN, K.Y. AMOAKO and H. PACK (2011),
‚Growth Identification and Facilitation: The Role of the State in the Dynamics of Structural Change‛,
Development Policy Review, 29(3), 259-310.
MCMILLAN, M. S., and D. RODRIK (2011), ‚Globalization, Structural Change and Productivity Growth‛,
National Bureau of Economic Research Working Paper Series, No. 17143.
MISHRA, S., S. LUNDSTROM and R. ANAND (2011), ‚Service Export Sophistication and Economic Growth‛,
World Bank Policy Research Working Paper.
NORDAS, H. (2010), ‚Trade in Goods and Services: Two Sides of the Same Coin?‛, Economic Modelling,
27(2).
OECD (2009a), OECD Science, Technology and Industry Scoreboard 2009, Paris.
OECD (2009b), OECD Reviews of Innovation Policy: Korea, Paris.
OECD (2010), PISA 2009 Results: What Students Know and Can Do, Paris.
OECD (2010), Perspectives on Global Development, Paris.
OECD/ECLAC. (2011), Latin American Economic Outlook 2012 Transforming the state for development, OECD
Publishing, Paris.
ONNELA, J.-P., J. SARAMÄKI, J. KERTÉSZ and K. KASKI (2005), ‚Intensity and coherence of motifs in weighted
complex networks‛, Physical Review E, 71(6), 065103. doi:10.1103/PhysRevE.71.065103
OPSAHL, T. and P. PANZARASA (2009), ‚Clustering in weighted networks‛, Social Networks, 31(2), 155 – 163.
PERES, W. (2011), ‚Industrial Policies in Latin America‛, UNU-WIDER.
QIANG, C. Z.-W., C.M. ROSSOTTO and K. KIMURA (2009), ‚Economic Impacts of Broadband. Information and
Communications for Development 2009: Extending Reach and Increasing Impact‛, World Bank.
RESTUCCIA, D. (2008), ‚The Latin American Development Problem‛, University of Toronto Working Paper,
no. 318.
SARAMÄKI, J., M. KIVELÄ, J.P. ONNELA, K. KASKI, and J. KERTÉSZ, (2007), ‚Generalizations of the clustering
coefficient to weighted complex networks‛, Physical Review E, 75(2), 027105.
SOLIMANO, A. and R. SOTO (2005), ‚Economic growth in Latin America in the late 20th century: Evidence
and interpretation‛, ECLAC.
SYRQUIN, M. (2003), The Rise of the Rest: Challenges to the West from Late-Industrializing Economies: ALICE H.
AMSDEN, ZZZ: Oxford University Press, NY 2001, pp. vi+405. Journal of Development Economics,
71(2), 625–628.
TIMMER, M. and G. DE VRIES (2009), ‚Structural change and growth accelerations in Asia and Latin
America: a new sectoral data set‛, Cliometrica, Journal of Historical Economics and Econometric History,
3(2), 165-190.
U.S.-CHINA BUSINESS COUNCIL (2011), ‚US-China Trade Statistics and China’s World Trade Statistics‛,
WTO (2011), Trade Profiles 2011.

© OECD 2011 61
OTHER TITLES IN THE SERIES/
AUTRES TITRES DANS LA SÉRIE
The former series known as ‚Technical Papers‛ and ‚Webdocs‛ merged in November 2003
into ‚Development Centre Working Papers‛. In the new series, former Webdocs 1-17 follow
former Technical Papers 1-212 as Working Papers 213-229.
All these documents may be downloaded from:
http://www.oecd.org/dev/wp or obtained via e-mail ([email protected]).
Working Paper No.1, Macroeconomic Adjustment and Income Distribution: A Macro-Micro Simulation Model, by François Bourguignon,
William H. Branson and Jaime de Melo, March 1989.
Working Paper No. 2, International Interactions in Food and Agricultural Policies: The Effect of Alternative Policies, by Joachim Zietz and
Alberto Valdés, April, 1989.
Working Paper No. 3, The Impact of Budget Retrenchment on Income Distribution in Indonesia: A Social Accounting Matrix Application, by
Steven Keuning and Erik Thorbecke, June 1989.
Working Paper No. 3a, Statistical Annex: The Impact of Budget Retrenchment, June 1989.
Document de travail No. 4, Le Rééquilibrage entre le secteur public et le secteur privé : le cas du Mexique, par C.-A. Michalet, juin 1989.
Working Paper No. 5, Rebalancing the Public and Private Sectors: The Case of Malaysia, by R. Leeds, July 1989.
Working Paper No. 6, Efficiency, Welfare Effects and Political Feasibility of Alternative Antipoverty and Adjustment Programs, by Alain de
Janvry and Elisabeth Sadoulet, December 1989.
Document de travail No. 7, Ajustement et distribution des revenus : application d’un modèle macro-micro au Maroc, par Christian Morrisson,
avec la collabouration de Sylvie Lambert et Akiko Suwa, décembre 1989.
Working Paper No. 8, Emerging Maize Biotechnologies and their Potential Impact, by W. Burt Sundquist, December 1989.
Document de travail No. 9, Analyse des variables socio-culturelles et de l’ajustement en Côte d’Ivoire, par W. Weekes-Vagliani, janvier 1990.
Working Paper No. 10, A Financial CompuTable General Equilibrium Model for the Analysis of Ecuador’s Stabilization Programs, by André
Fargeix and Elisabeth Sadoulet, February 1990.
Working Paper No. 11, Macroeconomic Aspects, Foreign Flows and Domestic Savings Performance in Developing Countries: A ”State of The
Art” Report, by Anand Chandavarkar, February 1990.
Working Paper No. 12, Tax Revenue Implications of the Real Exchange Rate: Econometric Evidence from Korea and Mexico, by Viriginia
Fierro and Helmut Reisen, February 1990.
Working Paper No. 13, Agricultural Growth and Economic Development: The Case of Pakistan, by Naved Hamid and Wouter Tims,
April 1990.
Working Paper No. 14, Rebalancing the Public and Private Sectors in Developing Countries: The Case of Ghana, by H. Akuoko-Frimpong,
June 1990.
Working Paper No. 15, Agriculture and the Economic Cycle: An Economic and Econometric Analysis with Special Reference to Brazil, by
Florence Contré and Ian Goldin, June 1990.
Working Paper No. 16, Comparative Advantage: Theory and Application to Developing Country Agriculture, by Ian Goldin, June 1990.
Working Paper No. 17, Biotechnology and Developing Country Agriculture: Maize in Brazil, by Bernardo Sorj and John Wilkinson,
June 1990.
Working Paper No. 18, Economic Policies and Sectoral Growth: Argentina 1913-1984, by Yair Mundlak, Domingo Cavallo, Roberto
Domenech, June 1990.
Working Paper No. 19, Biotechnology and Developing Country Agriculture: Maize In Mexico, by Jaime A. Matus Gardea, Arturo Puente
Gonzalez and Cristina Lopez Peralta, June 1990.
Working Paper No. 20, Biotechnology and Developing Country Agriculture: Maize in Thailand, by Suthad Setboonsarng, July 1990.
Working Paper No. 21, International Comparisons of Efficiency in Agricultural Production, by Guillermo Flichmann, July 1990.

62 © OECD 2012
Working Paper No. 22, Unemployment in Developing Countries: New Light on an Old Problem, by David Turnham and Denizhan Eröcal,
July 1990.
Working Paper No. 23, Optimal Currency Composition of Foreign Debt: the Case of Five Developing Countries, by Pier Giorgio Gawronski,
August 1990.
Working Paper No. 24, From Globalization to Regionalization: the Mexican Case, by Wilson Peres Núñez, August 1990.
Working Paper No. 25, Electronics and Development in Venezuela: A User-Oriented Strategy and its Policy Implications, by Carlota Perez,
October 1990.
Working Paper No. 26, The Legal Protection of Software: Implications for Latecomer Strategies in Newly Industrialising Economies (NIEs) and
Middle-Income Economies (MIEs), by Carlos Maria Correa, October 1990.
Working Paper No. 27, Specialization, Technical Change and Competitiveness in the Brazilian Electronics Industry, by Claudio R. Frischtak,
October 1990.
Working Paper No. 28, Internationalization Strategies of Japanese Electronics Companies: Implications for Asian Newly Industrializing
Economies (NIEs), by Bundo Yamada, October 1990.
Working Paper No. 29, The Status and an Evaluation of the Electronics Industry in Taiwan, by Gee San, October 1990.
Working Paper No. 30, The Indian Electronics Industry: Current Status, Perspectives and Policy Options, by Ghayur Alam, October 1990.
Working Paper No. 31, Comparative Advantage in Agriculture in Ghana, by James Pickett and E. Shaeeldin, October 1990.
Working Paper No. 32, Debt Overhang, Liquidity Constraints and Adjustment Incentives, by Bert Hofman and Helmut Reisen,
October 1990.
Working Paper No. 34, Biotechnology and Developing Country Agriculture: Maize in Indonesia, by Hidjat Nataatmadja et al., January 1991.
Working Paper No. 35, Changing Comparative Advantage in Thai Agriculture, by Ammar Siamwalla, Suthad Setboonsarng and Prasong
Werakarnjanapongs, March 1991.
Working Paper No. 36, Capital Flows and the External Financing of Turkey’s Imports, by Ziya Önis and Süleyman Özmucur, July 1991.
Working Paper No. 37, The External Financing of Indonesia’s Imports, by Glenn P. Jenkins and Henry B.F. Lim, July 1991.
Working Paper No. 38, Long-term Capital Reflow under Macroeconomic Stabilization in Latin America, by Beatriz Armendariz de Aghion,
July 1991.
Working Paper No. 39, Buybacks of LDC Debt and the Scope for Forgiveness, by Beatriz Armendariz de Aghion, July 1991.
Working Paper No. 40, Measuring and Modelling Non-Tariff Distortions with Special Reference to Trade in Agricultural Commodities, by
Peter J. Lloyd, July 1991.
Working Paper No. 41, The Changing Nature of IMF Conditionality, by Jacques J. Polak, August 1991.
Working Paper No. 42, Time-Varying Estimates on the Openness of the Capital Account in Korea and Taiwan, by Helmut Reisen and Hélène
Yèches, August 1991.
Working Paper No. 43, Toward a Concept of Development Agreements, by F. Gerard Adams, August 1991.
Document de travail No. 44, Le Partage du fardeau entre les créanciers de pays débiteurs défaillants, par Jean-Claude Berthélemy et Ann
Vourc’h, septembre 1991.
Working Paper No. 45, The External Financing of Thailand’s Imports, by Supote Chunanunthathum, October 1991.
Working Paper No. 46, The External Financing of Brazilian Imports, by Enrico Colombatto, with Elisa Luciano, Luca Gargiulo, Pietro
Garibaldi and Giuseppe Russo, October 1991.
Working Paper No. 47, Scenarios for the World Trading System and their Implications for Developing Countries, by Robert Z. Lawrence,
November 1991.
Working Paper No. 48, Trade Policies in a Global Context: Technical Specifications of the Rural/Urban-North/South (RUNS) Applied General
Equilibrium Model, by Jean-Marc Burniaux and Dominique van der Mensbrugghe, November 1991.
Working Paper No. 49, Macro-Micro Linkages: Structural Adjustment and Fertilizer Policy in Sub-Saharan Africa, by Jean-Marc Fontaine
with the collabouration of Alice Sindzingre, December 1991.
Working Paper No. 50, Aggregation by Industry in General Equilibrium Models with International Trade, by Peter J. Lloyd, December 1991.
Working Paper No. 51, Policy and Entrepreneurial Responses to the Montreal Protocol: Some Evidence from the Dynamic Asian Economies, by
David C. O’Connor, December 1991.
Working Paper No. 52, On the Pricing of LDC Debt: an Analysis Based on Historical Evidence from Latin America, by Beatriz Armendariz
de Aghion, February 1992.
Working Paper No. 53, Economic Regionalisation and Intra-Industry Trade: Pacific-Asian Perspectives, by Kiichiro Fukasaku,
February 1992.
Working Paper No. 54, Debt Conversions in Yugoslavia, by Mojmir Mrak, February 1992.
Working Paper No. 55, Evaluation of Nigeria’s Debt-Relief Experience (1985-1990), by N.E. Ogbe, March 1992.
Document de travail No. 56, L’Expérience de l’allégement de la dette du Mali, par Jean-Claude Berthélemy, février 1992.
Working Paper No. 57, Conflict or Indifference: US Multinationals in a World of Regional Trading Blocs, by Louis T. Wells, Jr., March 1992.
Working Paper No. 58, Japan’s Rapidly Emerging Strategy Toward Asia, by Edward J. Lincoln, April 1992.
Working Paper No. 59, The Political Economy of Stabilization Programmes in Developing Countries, by Bruno S. Frey and Reiner
Eichenberger, April 1992.
Working Paper No. 60, Some Implications of Europe 1992 for Developing Countries, by Sheila Page, April 1992.

© OECD 2011 63
Working Paper No. 61, Taiwanese Corporations in Globalisation and Regionalisation, by Gee San, April 1992.
Working Paper No. 62, Lessons from the Family Planning Experience for Community-Based Environmental Education, by Winifred
Weekes-Vagliani, April 1992.
Working Paper No. 63, Mexican Agriculture in the Free Trade Agreement: Transition Problems in Economic Reform, by Santiago Levy and
Sweder van Wijnbergen, May 1992.
Working Paper No. 64, Offensive and Defensive Responses by European Multinationals to a World of Trade Blocs, by John M. Stopford,
May 1992.
Working Paper No. 65, Economic Integration in the Pacific Region, by Richard Drobnick, May 1992.
Working Paper No. 66, Latin America in a Changing Global Environment, by Winston Fritsch, May 1992.
Working Paper No. 67, An Assessment of the Brady Plan Agreements, by Jean-Claude Berthélemy and Robert Lensink, May 1992.
Working Paper No. 68, The Impact of Economic Reform on the Performance of the Seed Sector in Eastern and Southern Africa, by Elizabeth
Cromwell, June 1992.
Working Paper No. 69, Impact of Structural Adjustment and Adoption of Technology on Competitiveness of Major Cocoa Producing Countries,
by Emily M. Bloomfield and R. Antony Lass, June 1992.
Working Paper No. 70, Structural Adjustment and Moroccan Agriculture: an Assessment of the Reforms in the Sugar and Cereal Sectors, by
Jonathan Kydd and Sophie Thoyer, June 1992.
Document de travail No. 71, L’Allégement de la dette au Club de Paris : les évolutions récentes en perspective, par Ann Vourc’h, juin 1992.
Working Paper No. 72, Biotechnology and the Changing Public/Private Sector Balance: Developments in Rice and Cocoa, by Carliene Brenner,
July 1992.
Working Paper No. 73, Namibian Agriculture: Policies and Prospects, by Walter Elkan, Peter Amutenya, Jochbeth Andima, Robin
Sherbourne and Eline van der Linden, July 1992.
Working Paper No. 74, Agriculture and the Policy Environment: Zambia and Zimbabwe, by Doris J. Jansen and Andrew Rukovo,
July 1992.
Working Paper No. 75, Agricultural Productivity and Economic Policies: Concepts and Measurements, by Yair Mundlak, August 1992.
Working Paper No. 76, Structural Adjustment and the Institutional Dimensions of Agricultural Research and Development in Brazil: Soybeans,
Wheat and Sugar Cane, by John Wilkinson and Bernardo Sorj, August 1992.
Working Paper No. 77, The Impact of Laws and Regulations on Micro and Small Enterprises in Niger and Swaziland, by Isabelle Joumard,
Carl Liedholm and Donald Mead, September 1992.
Working Paper No. 78, Co-Financing Transactions between Multilateral Institutions and International Banks, by Michel Bouchet and Amit
Ghose, October 1992.
Document de travail No. 79, Allégement de la dette et croissance : le cas mexicain, par Jean-Claude Berthélemy et Ann Vourc’h,
octobre 1992.
Document de travail No. 80, Le Secteur informel en Tunisie : cadre réglementaire et pratique courante, par Abderrahman Ben Zakour et
Farouk Kria, novembre 1992.
Working Paper No. 81, Small-Scale Industries and Institutional Framework in Thailand, by Naruemol Bunjongjit and Xavier Oudin,
November 1992.
Working Paper No. 81a, Statistical Annex: Small-Scale Industries and Institutional Framework in Thailand, by Naruemol Bunjongjit and
Xavier Oudin, November 1992.
Document de travail No. 82, L’Expérience de l’allégement de la dette du Niger, par Ann Vourc’h et Maina Boukar Moussa, novembre 1992.
Working Paper No. 83, Stabilization and Structural Adjustment in Indonesia: an Intertemporal General Equilibrium Analysis, by David
Roland-Holst, November 1992.
Working Paper No. 84, Striving for International Competitiveness: Lessons from Electronics for Developing Countries, by Jan Maarten de Vet,
March 1993.
Document de travail No. 85, Micro-entreprises et cadre institutionnel en Algérie, par Hocine Benissad, mars 1993.
Working Paper No. 86, Informal Sector and Regulations in Ecuador and Jamaica, by Emilio Klein and Victor E. Tokman, August 1993.
Working Paper No. 87, Alternative Explanations of the Trade-Output Correlation in the East Asian Economies, by Colin I. Bradford Jr. and
Naomi Chakwin, August 1993.
Document de travail No. 88, La Faisabilité politique de l’ajustement dans les pays africains, par Christian Morrisson, Jean-Dominique Lafay
et Sébastien Dessus, novembre 1993.
Working Paper No. 89, China as a Leading Pacific Economy, by Kiichiro Fukasaku and Mingyuan Wu, November 1993.
Working Paper No. 90, A Detailed Input-Output Table for Morocco, 1990, by Maurizio Bussolo and David Roland-Holst November 1993.
Working Paper No. 91, International Trade and the Transfer of Environmental Costs and Benefits, by Hiro Lee and David Roland-Holst,
December 1993.
Working Paper No. 92, Economic Instruments in Environmental Policy: Lessons from the OECD Experience and their Relevance to Developing
Economies, by Jean-Philippe Barde, January 1994.
Working Paper No. 93, What Can Developing Countries Learn from OECD Labour Market Programmes and Policies?, by Åsa Sohlman with
David Turnham, January 1994.

64 © OECD 2012
Working Paper No. 94, Trade Liberalization and Employment Linkages in the Pacific Basin, by Hiro Lee and David Roland-Holst,
February 1994.
Working Paper No. 95, Participatory Development and Gender: Articulating Concepts and Cases, by Winifred Weekes-Vagliani,
February 1994.
Document de travail No. 96, Promouvoir la maîtrise locale et régionale du développement : une démarche participative à Madagascar, par
Philippe de Rham et Bernard Lecomte, juin 1994.
Working Paper No. 97, The OECD Green Model: an Updated Overview, by Hiro Lee, Joaquim Oliveira-Martins and Dominique van der
Mensbrugghe, August 1994.
Working Paper No. 98, Pension Funds, Capital Controls and Macroeconomic Stability, by Helmut Reisen and John Williamson,
August 1994.
Working Paper No. 99, Trade and Pollution Linkages: Piecemeal Reform and Optimal Intervention, by John Beghin, David Roland-Holst
and Dominique van der Mensbrugghe, October 1994.
Working Paper No. 100, International Initiatives in Biotechnology for Developing Country Agriculture: Promises and Problems, by Carliene
Brenner and John Komen, October 1994.
Working Paper No. 101, Input-based Pollution Estimates for Environmental Assessment in Developing Countries, by Sébastien Dessus,
David Roland-Holst and Dominique van der Mensbrugghe, October 1994.
Working Paper No. 102, Transitional Problems from Reform to Growth: Safety Nets and Financial Efficiency in the Adjusting Egyptian
Economy, by Mahmoud Abdel-Fadil, December 1994.
Working Paper No. 103, Biotechnology and Sustainable Agriculture: Lessons from India, by Ghayur Alam, December 1994.
Working Paper No. 104, Crop Biotechnology and Sustainability: a Case Study of Colombia, by Luis R. Sanint, January 1995.
Working Paper No. 105, Biotechnology and Sustainable Agriculture: the Case of Mexico, by José Luis Solleiro Rebolledo, January 1995.
Working Paper No. 106, Empirical Specifications for a General Equilibrium Analysis of Labour Market Policies and Adjustments, by Andréa
Maechler and David Roland-Holst, May 1995.
Document de travail No. 107, Les Migrants, partenaires de la coopération internationale : le cas des Maliens de France, par Christophe Daum,
juillet 1995.
Document de travail No. 108, Ouverture et croissance industrielle en Chine : étude empirique sur un échantillon de villes, par Sylvie
Démurger, septembre 1995.
Working Paper No. 109, Biotechnology and Sustainable Crop Production in Zimbabwe, by John J. Woodend, December 1995.
Document de travail No. 110, Politiques de l’environnement et libéralisation des échanges au Costa Rica : une vue d’ensemble, par Sébastien
Dessus et Maurizio Bussolo, février 1996.
Working Paper No. 111, Grow Now/Clean Later, or the Pursuit of Sustainable Development?, by David O’Connor, March 1996.
Working Paper No. 112, Economic Transition and Trade-Policy Reform: Lessons from China, by Kiichiro Fukasaku and Henri-Bernard
Solignac Lecomte, July 1996.
Working Paper No. 113, Chinese Outward Investment in Hong Kong: Trends, Prospects and Policy Implications, by Yun-Wing Sung,
July 1996.
Working Paper No. 114, Vertical Intra-industry Trade between China and OECD Countries, by Lisbeth Hellvin, July 1996.
Document de travail No. 115, Le Rôle du capital public dans la croissance des pays en développement au cours des années 80, par Sébastien
Dessus et Rémy Herrera, juillet 1996.
Working Paper No. 116, General Equilibrium Modelling of Trade and the Environment, by John Beghin, Sébastien Dessus, David Roland-
Holst and Dominique van der Mensbrugghe, September 1996.
Working Paper No. 117, Labour Market Aspects of State Enterprise Reform in Viet Nam, by David O’Connor, September 1996.
Document de travail No. 118, Croissance et compétitivité de l’industrie manufacturière au Sénégal, par Thierry Latreille et Aristomène
Varoudakis, octobre 1996.
Working Paper No. 119, Evidence on Trade and Wages in the Developing World, by Donald J. Robbins, December 1996.
Working Paper No. 120, Liberalising Foreign Investments by Pension Funds: Positive and Normative Aspects, by Helmut Reisen,
January 1997.
Document de travail No. 121, Capital Humain, ouverture extérieure et croissance : estimation sur données de panel d’un modèle à coefficients
variables, par Jean-Claude Berthélemy, Sébastien Dessus et Aristomène Varoudakis, janvier 1997.
Working Paper No. 122, Corruption: The Issues, by Andrew W. Goudie and David Stasavage, January 1997.
Working Paper No. 123, Outflows of Capital from China, by David Wall, March 1997.
Working Paper No. 124, Emerging Market Risk and Sovereign Credit Ratings, by Guillermo Larraín, Helmut Reisen and Julia von
Maltzan, April 1997.
Working Paper No. 125, Urban Credit Co-operatives in China, by Eric Girardin and Xie Ping, August 1997.
Working Paper No. 126, Fiscal Alternatives of Moving from Unfunded to Funded Pensions, by Robert Holzmann, August 1997.
Working Paper No. 127, Trade Strategies for the Southern Mediterranean, by Peter A. Petri, December 1997.
Working Paper No. 128, The Case of Missing Foreign Investment in the Southern Mediterranean, by Peter A. Petri, December 1997.
Working Paper No. 129, Economic Reform in Egypt in a Changing Global Economy, by Joseph Licari, December 1997.
© OECD 2011 65
Working Paper No. 130, Do Funded Pensions Contribute to Higher Aggregate Savings? A Cross-Country Analysis, by Jeanine Bailliu and
Helmut Reisen, December 1997.
Working Paper No. 131, Long-run Growth Trends and Convergence Across Indian States, by Rayaprolu Nagaraj, Aristomène Varoudakis
and Marie-Ange Véganzonès, January 1998.
Working Paper No. 132, Sustainable and Excessive Current Account Deficits, by Helmut Reisen, February 1998.
Working Paper No. 133, Intellectual Property Rights and Technology Transfer in Developing Country Agriculture: Rhetoric and Reality, by
Carliene Brenner, March 1998.
Working Paper No. 134, Exchange-rate Management and Manufactured Exports in Sub-Saharan Africa, by Khalid Sekkat and Aristomène
Varoudakis, March 1998.
Working Paper No. 135, Trade Integration with Europe, Export Diversification and Economic Growth in Egypt, by Sébastien Dessus and
Akiko Suwa-Eisenmann, June 1998.
Working Paper No. 136, Domestic Causes of Currency Crises: Policy Lessons for Crisis Avoidance, by Helmut Reisen, June 1998.
Working Paper No. 137, A Simulation Model of Global Pension Investment, by Landis MacKellar and Helmut Reisen, August 1998.
Working Paper No. 138, Determinants of Customs Fraud and Corruption: Evidence from Two African Countries, by David Stasavage and
Cécile Daubrée, August 1998.
Working Paper No. 139, State Infrastructure and Productive Performance in Indian Manufacturing, by Arup Mitra, Aristomène Varoudakis
and Marie-Ange Véganzonès, August 1998.
Working Paper No. 140, Rural Industrial Development in Viet Nam and China: A Study in Contrasts, by David O’Connor, September 1998.
Working Paper No. 141,Labour Market Aspects of State Enterprise Reform in China, by Fan Gang,Maria Rosa Lunati and David
O’Connor, October 1998.
Working Paper No. 142, Fighting Extreme Poverty in Brazil: The Influence of Citizens’ Action on Government Policies, by Fernanda Lopes
de Carvalho, November 1998.
Working Paper No. 143, How Bad Governance Impedes Poverty Alleviation in Bangladesh, by Rehman Sobhan, November 1998.
Document de travail No. 144, La libéralisation de l’agriculture tunisienne et l’Union européenne: une vue prospective, par Mohamed
Abdelbasset Chemingui et Sébastien Dessus, février 1999.
Working Paper No. 145, Economic Policy Reform and Growth Prospects in Emerging African Economies, by Patrick Guillaumont, Sylviane
Guillaumont Jeanneney and Aristomène Varoudakis, March 1999.
Working Paper No. 146, Structural Policies for International Competitiveness in Manufacturing: The Case of Cameroon, by Ludvig Söderling,
March 1999.
Working Paper No. 147, China’s Unfinished Open-Economy Reforms: Liberalisation of Services, by Kiichiro Fukasaku, Yu Ma and Qiumei
Yang, April 1999.
Working Paper No. 148, Boom and Bust and Sovereign Ratings, by Helmut Reisen and Julia von Maltzan, June 1999.
Working Paper No. 149, Economic Opening and the Demand for Skills in Developing Countries: A Review of Theory and Evidence, by David
O’Connor and Maria Rosa Lunati, June 1999.
Working Paper No. 150, The Role of Capital Accumulation, Adjustment and Structural Change for Economic Take-off: Empirical Evidence from
African Growth Episodes, by Jean-Claude Berthélemy and Ludvig Söderling, July 1999.
Working Paper No. 151, Gender, Human Capital and Growth: Evidence from Six Latin American Countries, by Donald J. Robbins,
September 1999.
Working Paper No. 152, The Politics and Economics of Transition to an Open Market Economy in Viet Nam, by James Riedel and William
S. Turley, September 1999.
Working Paper No. 153, The Economics and Politics of Transition to an Open Market Economy: China, by Wing Thye Woo, October 1999.
Working Paper No. 154, Infrastructure Development and Regulatory Reform in Sub-Saharan Africa: The Case of Air Transport, by Andrea
E. Goldstein, October 1999.
Working Paper No. 155, The Economics and Politics of Transition to an Open Market Economy: India, by Ashok V. Desai, October 1999.
Working Paper No. 156, Climate Policy Without Tears: CGE-Based Ancillary Benefits Estimates for Chile, by Sébastien Dessus and David
O’Connor, November 1999.
Document de travail No. 157, Dépenses d’éducation, qualité de l’éducation et pauvreté : l’exemple de cinq pays d’Afrique francophone, par
Katharina Michaelowa, avril 2000.
Document de travail No. 158, Une estimation de la pauvreté en Afrique subsaharienne d’après les données anthropométriques, par Christian
Morrisson, Hélène Guilmeau et Charles Linskens, mai 2000.
Working Paper No. 159, Converging European Transitions, by Jorge Braga de Macedo, July 2000.
Working Paper No. 160, Capital Flows and Growth in Developing Countries: Recent Empirical Evidence, by Marcelo Soto, July 2000.
Working Paper No. 161, Global Capital Flows and the Environment in the 21st Century, by David O’Connor, July 2000.
Working Paper No. 162, Financial Crises and International Architecture: A “Eurocentric” Perspective, by Jorge Braga de Macedo,
August 2000.
Document de travail No. 163, Résoudre le problème de la dette : de l’initiative PPTE à Cologne, par Anne Joseph, août 2000.
Working Paper No. 164, E-Commerce for Development: Prospects and Policy Issues, by Andrea Goldstein and David O’Connor,
September 2000.

66 © OECD 2012
Working Paper No. 165, Negative Alchemy? Corruption and Composition of Capital Flows, by Shang-Jin Wei, October 2000.
Working Paper No. 166, The HIPC Initiative: True and False Promises, by Daniel Cohen, October 2000.
Document de travail No. 167, Les facteurs explicatifs de la malnutrition en Afrique subsaharienne, par Christian Morrisson et Charles
Linskens, octobre 2000.
Working Paper No. 168, Human Capital and Growth: A Synthesis Report, by Christopher A. Pissarides, November 2000.
Working Paper No. 169, Obstacles to Expanding Intra-African Trade, by Roberto Longo and Khalid Sekkat, March 2001.
Working Paper No. 170, Regional Integration In West Africa, by Ernest Aryeetey, March 2001.
Working Paper No. 171, Regional Integration Experience in the Eastern African Region, by Andrea Goldstein and Njuguna S. Ndung’u,
March 2001.
Working Paper No. 172, Integration and Co-operation in Southern Africa, by Carolyn Jenkins, March 2001.
Working Paper No. 173, FDI in Sub-Saharan Africa, by Ludger Odenthal, March 2001
Document de travail No. 174, La réforme des télécommunications en Afrique subsaharienne, par Patrick Plane, mars 2001.
Working Paper No. 175, Fighting Corruption in Customs Administration: What Can We Learn from Recent Experiences?, by Irène Hors;
April 2001.
Working Paper No. 176, Globalisation and Transformation: Illusions and Reality, by Grzegorz W. Kolodko, May 2001.
Working Paper No. 177, External Solvency, Dollarisation and Investment Grade: Towards a Virtuous Circle?, by Martin Grandes, June 2001.
Document de travail No. 178, Congo 1965-1999: Les espoirs déçus du « Brésil africain », par Joseph Maton avec Henri-Bernard Solignac
Lecomte, septembre 2001.
Working Paper No. 179, Growth and Human Capital: Good Data, Good Results, by Daniel Cohen and Marcelo Soto, September 2001.
Working Paper No. 180, Corporate Governance and National Development, by Charles P. Oman, October 2001.
Working Paper No. 181, How Globalisation Improves Governance, by Federico Bonaglia, Jorge Braga de Macedo and Maurizio Bussolo,
November 2001.
Working Paper No. 182, Clearing the Air in India: The Economics of Climate Policy with Ancillary Benefits, by Maurizio Bussolo and David
O’Connor, November 2001.
Working Paper No. 183, Globalisation, Poverty and Inequality in sub-Saharan Africa: A Political Economy Appraisal, by Yvonne M. Tsikata,
December 2001.
Working Paper No. 184, Distribution and Growth in Latin America in an Era of Structural Reform: The Impact of Globalisation, by Samuel
A. Morley, December 2001.
Working Paper No. 185, Globalisation, Liberalisation, Poverty and Income Inequality in Southeast Asia, by K.S. Jomo, December 2001.
Working Paper No. 186, Globalisation, Growth and Income Inequality: The African Experience, by Steve Kayizzi-Mugerwa, December 2001.
Working Paper No. 187, The Social Impact of Globalisation in Southeast Asia, by Mari Pangestu, December 2001.
Working Paper No. 188, Where Does Inequality Come From? Ideas and Implications for Latin America, by James A. Robinson,
December 2001.
Working Paper No. 189, Policies and Institutions for E-Commerce Readiness: What Can Developing Countries Learn from OECD Experience?,
by Paulo Bastos Tigre and David O’Connor, April 2002.
Document de travail No. 190, La réforme du secteur financier en Afrique, par Anne Joseph, juillet 2002.
Working Paper No. 191, Virtuous Circles? Human Capital Formation, Economic Development and the Multinational Enterprise, by Ethan
B. Kapstein, August 2002.
Working Paper No. 192, Skill Upgrading in Developing Countries: Has Inward Foreign Direct Investment Played a Role?, by Matthew
J. Slaughter, August 2002.
Working Paper No. 193, Government Policies for Inward Foreign Direct Investment in Developing Countries: Implications for Human Capital
Formation and Income Inequality, by Dirk Willem te Velde, August 2002.
Working Paper No. 194, Foreign Direct Investment and Intellectual Capital Formation in Southeast Asia, by Bryan K. Ritchie, August 2002.
Working Paper No. 195, FDI and Human Capital: A Research Agenda, by Magnus Blomström and Ari Kokko, August 2002.
Working Paper No. 196, Knowledge Diffusion from Multinational Enterprises: The Role of Domestic and Foreign Knowledge-Enhancing
Activities, by Yasuyuki Todo and Koji Miyamoto, August 2002.
Working Paper No. 197, Why Are Some Countries So Poor? Another Look at the Evidence and a Message of Hope, by Daniel Cohen and
Marcelo Soto, October 2002.
Working Paper No. 198, Choice of an Exchange-Rate Arrangement, Institutional Setting and Inflation: Empirical Evidence from Latin America,
by Andreas Freytag, October 2002.
Working Paper No. 199, Will Basel II Affect International Capital Flows to Emerging Markets?, by Beatrice Weder and Michael Wedow,
October 2002.
Working Paper No. 200, Convergence and Divergence of Sovereign Bond Spreads: Lessons from Latin America, by Martin Grandes,
October 2002.
Working Paper No. 201, Prospects for Emerging-Market Flows amid Investor Concerns about Corporate Governance, by Helmut Reisen,
November 2002.
Working Paper No. 202, Rediscovering Education in Growth Regressions, by Marcelo Soto, November 2002.
© OECD 2011 67
Working Paper No. 203, Incentive Bidding for Mobile Investment: Economic Consequences and Potential Responses, by Andrew Charlton,
January 2003.
Working Paper No. 204, Health Insurance for the Poor? Determinants of participation Community-Based Health Insurance Schemes in Rural
Senegal, by Johannes Jütting, January 2003.
Working Paper No. 205, China’s Software Industry and its Implications for India, by Ted Tschang, February 2003.
Working Paper No. 206, Agricultural and Human Health Impacts of Climate Policy in China: A General Equilibrium Analysis with Special
Reference to Guangdong, by David O’Connor, Fan Zhai, Kristin Aunan, Terje Berntsen and Haakon Vennemo, March 2003.
Working Paper No. 207, India’s Information Technology Sector: What Contribution to Broader Economic Development?, by Nirvikar Singh,
March 2003.
Working Paper No. 208, Public Procurement: Lessons from Kenya, Tanzania and Uganda, by Walter Odhiambo and Paul Kamau,
March 2003.
Working Paper No. 209, Export Diversification in Low-Income Countries: An International Challenge after Doha, by Federico Bonaglia and
Kiichiro Fukasaku, June 2003.
Working Paper No. 210, Institutions and Development: A Critical Review, by Johannes Jütting, July 2003.
Working Paper No. 211, Human Capital Formation and Foreign Direct Investment in Developing Countries, by Koji Miyamoto, July 2003.
Working Paper No. 212, Central Asia since 1991: The Experience of the New Independent States, by Richard Pomfret, July 2003.
Working Paper No. 213, A Multi-Region Social Accounting Matrix (1995) and Regional Environmental General Equilibrium Model for India
(REGEMI), by Maurizio Bussolo, Mohamed Chemingui and David O’Connor, November 2003.
Working Paper No. 214, Ratings Since the Asian Crisis, by Helmut Reisen, November 2003.
Working Paper No. 215, Development Redux: Reflections for a New Paradigm, by Jorge Braga de Macedo, November 2003.
Working Paper No. 216, The Political Economy of Regulatory Reform: Telecoms in the Southern Mediterranean, by Andrea Goldstein,
November 2003.
Working Paper No. 217, The Impact of Education on Fertility and Child Mortality: Do Fathers Really Matter Less than Mothers?, by Lucia
Breierova and Esther Duflo, November 2003.
Working Paper No. 218, Float in Order to Fix? Lessons from Emerging Markets for EU Accession Countries, by Jorge Braga de Macedo and
Helmut Reisen, November 2003.
Working Paper No. 219, Globalisation in Developing Countries: The Role of Transaction Costs in Explaining Economic Performance in India,
by Maurizio Bussolo and John Whalley, November 2003.
Working Paper No. 220, Poverty Reduction Strategies in a Budget-Constrained Economy: The Case of Ghana, by Maurizio Bussolo and
Jeffery I. Round, November 2003.
Working Paper No. 221, Public-Private Partnerships in Development: Three Applications in Timor Leste, by José Braz, November 2003.
Working Paper No. 222, Public Opinion Research, Global Education and Development Co-operation Reform: In Search of a Virtuous Circle, by Ida
Mc Donnell, Henri-Bernard Solignac Lecomte and Liam Wegimont, November 2003.
Working Paper No. 223, Building Capacity to Trade: What Are the Priorities?, by Henry-Bernard Solignac Lecomte, November 2003.
Working Paper No. 224, Of Flying Geeks and O-Rings: Locating Software and IT Services in India’s Economic Development, by David
O’Connor, November 2003.
Document de travail No. 225, Cap Vert: Gouvernance et Développement, par Jaime Lourenço and Colm Foy, novembre 2003.
Working Paper No. 226, Globalisation and Poverty Changes in Colombia, by Maurizio Bussolo and Jann Lay, November 2003.
Working Paper No. 227, The Composite Indicator of Economic Activity in Mozambique (ICAE): Filling in the Knowledge Gaps to Enhance
Public-Private Partnership (PPP), by Roberto J. Tibana, November 2003.
Working Paper No. 228, Economic-Reconstruction in Post-Conflict Transitions: Lessons for the Democratic Republic of Congo (DRC), by
Graciana del Castillo, November 2003.
Working Paper No. 229, Providing Low-Cost Information Technology Access to Rural Communities In Developing Countries: What Works?
What Pays? by Georg Caspary and David O’Connor, November 2003.
Working Paper No. 230, The Currency Premium and Local-Currency Denominated Debt Costs in South Africa, by Martin Grandes, Marcel
Peter and Nicolas Pinaud, December 2003.
Working Paper No. 231, Macroeconomic Convergence in Southern Africa: The Rand Zone Experience, by Martin Grandes, December 2003.
Working Paper No. 232, Financing Global and Regional Public Goods through ODA: Analysis and Evidence from the OECD Creditor
Reporting System, by Helmut Reisen, Marcelo Soto and Thomas Weithöner, January 2004.
Working Paper No. 233, Land, Violent Conflict and Development, by Nicolas Pons-Vignon and Henri-Bernard Solignac Lecomte,
February 2004.
Working Paper No. 234, The Impact of Social Institutions on the Economic Role of Women in Developing Countries, by Christian Morrisson
and Johannes Jütting, May 2004.
Document de travail No. 235, La condition desfemmes en Inde, Kenya, Soudan et Tunisie, par Christian Morrisson, août 2004.
Working Paper No. 236, Decentralisation and Poverty in Developing Countries: Exploring the Impact, by Johannes Jütting,
Céline Kauffmann, Ida Mc Donnell, Holger Osterrieder, Nicolas Pinaud and Lucia Wegner, August 2004.
Working Paper No. 237, Natural Disasters and Adaptive Capacity, by Jeff Dayton-Johnson, August 2004.

68 © OECD 2012
Working Paper No. 238, Public Opinion Polling and the Millennium Development Goals, by Jude Fransman, Alphonse L. MacDonnald,
Ida Mc Donnell and Nicolas Pons-Vignon, October 2004.
Working Paper No. 239, Overcoming Barriers to Competitiveness, by Orsetta Causa and Daniel Cohen, December 2004.
Working Paper No. 240, Extending Insurance? Funeral Associations in Ethiopia and Tanzania, by Stefan Dercon, Tessa Bold, Joachim
De Weerdt and Alula Pankhurst, December 2004.
Working Paper No. 241, Macroeconomic Policies: New Issues of Interdependence, by Helmut Reisen, Martin Grandes and Nicolas Pinaud,
January 2005.
Working Paper No. 242, Institutional Change and its Impact on the Poor and Excluded: The Indian Decentralisation Experience, by
D. Narayana, January 2005.
Working Paper No. 243, Impact of Changes in Social Institutions on Income Inequality in China, by Hiroko Uchimura, May 2005.
Working Paper No. 244, Priorities in Global Assistance for Health, AIDS and Population (HAP), by Landis MacKellar, June 2005.
Working Paper No. 245, Trade and Structural Adjustment Policies in Selected Developing Countries, by Jens Andersson, Federico Bonaglia,
Kiichiro Fukasaku and Caroline Lesser, July 2005.
Working Paper No. 246, Economic Growth and Poverty Reduction: Measurement and Policy Issues, by Stephan Klasen, (September 2005).
Working Paper No. 247, Measuring Gender (In)Equality: Introducing the Gender, Institutions and Development Data Base (GID),
by Johannes P. Jütting, Christian Morrisson, Jeff Dayton-Johnson and Denis Drechsler (March 2006).
Working Paper No. 248, Institutional Bottlenecks for Agricultural Development: A Stock-Taking Exercise Based on Evidence from Sub-Saharan
Africa by Juan R. de Laiglesia, March 2006.
Working Paper No. 249, Migration Policy and its Interactions with Aid, Trade and Foreign Direct Investment Policies: A Background Paper, by
Theodora Xenogiani, June 2006.
Working Paper No. 250, Effects of Migration on Sending Countries: What Do We Know? by Louka T. Katseli, Robert E.B. Lucas and
Theodora Xenogiani, June 2006.
Document de travail No. 251, L’aide au développement et les autres flux nord-sud : complémentarité ou substitution ?, par Denis Cogneau et
Sylvie Lambert, juin 2006.
Working Paper No. 252, Angel or Devil? China’s Trade Impact on Latin American Emerging Markets, by Jorge Blázquez-Lidoy, Javier
Rodríguez and Javier Santiso, June 2006.
Working Paper No. 253, Policy Coherence for Development: A Background Paper on Foreign Direct Investment, by Thierry Mayer, July 2006.
Working Paper No. 254, The Coherence of Trade Flows and Trade Policies with Aid and Investment Flows, by Akiko Suwa-Eisenmann and
Thierry Verdier, August 2006.
Document de travail No. 255, Structures familiales, transferts et épargne : examen, par Christian Morrisson, août 2006.
Working Paper No. 256, Ulysses, the Sirens and the Art of Navigation: Political and Technical Rationality in Latin America, by Javier Santiso
and Laurence Whitehead, September 2006.
Working Paper No. 257, Developing Country Multinationals: South-South Investment Comes of Age, by Dilek Aykut and Andrea
Goldstein, November 2006.
Working Paper No. 258, The Usual Suspects: A Primer on Investment Banks’ Recommendations and Emerging Markets, by Sebastián Nieto-
Parra and Javier Santiso, January 2007.
Working Paper No. 259, Banking on Democracy: The Political Economy of International Private Bank Lending in Emerging Markets, by Javier
Rodríguez and Javier Santiso, March 2007.
Working Paper No. 260, New Strategies for Emerging Domestic Sovereign Bond Markets, by Hans Blommestein and Javier Santiso, April
2007.
Working Paper No. 261, Privatisation in the MEDA region. Where do we stand?, by Céline Kauffmann and Lucia Wegner, July 2007.
Working Paper No. 262, Strengthening Productive Capacities in Emerging Economies through Internationalisation: Evidence from the
Appliance Industry, by Federico Bonaglia and Andrea Goldstein, July 2007.
Working Paper No. 263, Banking on Development: Private Banks and Aid Donors in Developing Countries, by Javier Rodríguez and Javier
Santiso, November 2007.
Working Paper No. 264, Fiscal Decentralisation, Chinese Style: Good for Health Outcomes?, by Hiroko Uchimura and Johannes Jütting,
November 2007.
Working Paper No. 265, Private Sector Participation and Regulatory Reform in Water supply: the Southern Mediterranean Experience, by
Edouard Pérard, January 2008.
Working Paper No. 266, Informal Employment Re-loaded, by Johannes Jütting, Jante Parlevliet and Theodora Xenogiani, January 2008.
Working Paper No. 267, Household Structures and Savings: Evidence from Household Surveys, by Juan R. de Laiglesia and Christian
Morrisson, January 2008.
Working Paper No. 268, Prudent versus Imprudent Lending to Africa: From Debt Relief to Emerging Lenders, by Helmut Reisen and Sokhna
Ndoye, February 2008.
Working Paper No. 269, Lending to the Poorest Countries: A New Counter-Cyclical Debt Instrument, by Daniel Cohen, Hélène Djoufelkit-
Cottenet, Pierre Jacquet and Cécile Valadier, April 2008.
Working Paper No.270, The Macro Management of Commodity Booms: Africa and Latin America’s Response to Asian Demand, by Rolando
Avendaño, Helmut Reisen and Javier Santiso, August 2008.
© OECD 2011 69
Working Paper No. 271, Report on Informal Employment in Romania, by Jante Parlevliet and Theodora Xenogiani, July 2008.
Working Paper No. 272, Wall Street and Elections in Latin American Emerging Democracies, by Sebastián Nieto-Parra and Javier Santiso,
October 2008. Working Paper No. 273, Aid Volatility and Macro Risks in LICs, by Eduardo Borensztein, Julia Cage, Daniel Cohen and Cécile Valadier,
November 2008.
Working Paper No. 274, Who Saw Sovereign Debt Crises Coming?, by Sebastián Nieto-Parra, November 2008.
Working Paper No. 275, Development Aid and Portfolio Funds: Trends, Volatility and Fragmentation, by Emmanuel Frot and Javier Santiso,
December 2008.
Working Paper No. 276, Extracting the Maximum from EITI, by Dilan Ölcer, February 2009.
Working Paper No. 277, Taking Stock of the Credit Crunch: Implications for Development Finance and Global Governance, by Andrew Mold,
Sebastian Paulo and Annalisa Prizzon, March 2009.
Working Paper No. 278, Are All Migrants Really Worse Off in Urban Labour Markets? New Empirical Evidence from China, by Jason
Gagnon, Theodora Xenogiani and Chunbing Xing, June 2009.
Working Paper No. 279, Herding in Aid Allocation, by Emmanuel Frot and Javier Santiso, June 2009.
Working Paper No. 280, Coherence of Development Policies: Ecuador’s Economic Ties with Spain and their Development Impact, by Iliana
Olivié, July 2009.
Working Paper No. 281, Revisiting Political Budget Cycles in Latin America, by Sebastián Nieto-Parra and Javier Santiso, August 2009.
Working Paper No. 282, Are Workers’ Remittances Relevant for Credit Rating Agencies?, by Rolando Avendaño, Norbert Gaillard and
Sebastián Nieto-Parra, October 2009.
Working Paper No. 283, Are SWF Investments Politically Biased? A Comparison with Mutual Funds, by Rolando Avendaño and Javier
Santiso, December 2009.
Working Paper No. 284, Crushed Aid: Fragmentation in Sectoral Aid, by Emmanuel Frot and Javier Santiso, January 2010.
Working Paper No. 285, The Emerging Middle Class in Developing Countries, by Homi Kharas, January 2010.
Working Paper No. 286, Does Trade Stimulate Innovation? Evidence from Firm-Product Data, by Ana Margarida Fernandes and Caroline
Paunov, January 2010.
Working Paper No. 287, Why Do So Many Women End Up in Bad Jobs? A Cross-Country Assessment, by Johannes Jütting, Angela Luci
and Christian Morrisson, January 2010.
Working Paper No. 288, Innovation, Productivity and Economic Development in Latin America and the Caribbean, by Christian Daude,
February 2010.
Working Paper No. 289, South America for the Chinese? A Trade-Based Analysis, by Eliana Cardoso and Márcio Holland, April 2010.
Working Paper No. 290, On the Role of Productivity and Factor Accumulation in Economic Development in Latin America and the Caribbean,
by Christian Daude and Eduardo Fernández-Arias, April 2010.
Working Paper No. 291, Fiscal Policy in Latin America: Countercyclical and Sustainable at Last?, by Christian Daude, Ángel Melguizo and
Alejandro Neut, July 2010.
Working Paper No. 292, The Renminbi and Poor-Country Growth, by Christopher Garroway, Burcu Hacibedel, Helmut Reisen and
Edouard Turkisch, September 2010.
Working Paper No. 293, Rethinking the (European) Foundations of Sub-Saharan African Regional Economic Integration, by Peter Draper,
September 2010.
Working Paper No. 294, Taxation and more representation? On fiscal policy, social mobility and democracy in Latin America, by Christian
Daude and Angel Melguizo, September 2010.
Working Paper No. 295, The Economy of the Possible: Pensions and Informality in Latin America, by Rita Da Costa, Juan R. de Laiglesia,
Emmanuelle Martínez and Angel Melguizo, January 2011.
Working Paper No. 296, The Macroeconomic Effects of Large Appreciations, by Markus Kappler, Helmut Reisen, Moritz Schularick and
Edourd Turkisch, February 2011.
Working Paper No. 297, Ascendance by descendants? On intergenerational education mobility in Latin America, by Christian Daude,
March 2011.
Working Paper No. 298, The Impact of Migration Policies on Rural Household Welfare in Mexico and Nicaragua, by J. Edward Taylor and
Mateusz Filipski, May 2011.
Working Paper No. 299, Continental vs. intercontinental migration: an empirical analysis of the impact of immigration reforms on Burkina
Faso, by Fleur Wouterse, May 2011.
Working Paper No. 300, “Stay with us”? The impact of emigration on wages in Honduras, by Jason Gagnon, June 2011.
Working Paper No. 301, Public infrastructure investment and fiscal sustainability in Latin America: Incompatible goals?, by Luis Carranza,
Angel Melguizo and Christian Daude, June 2011.
Working Paper No. 302, Recalibrating Development Co-operation: How Can African Countries Benefit from Emerging Partners?, by Myriam
Dahman Saidi and Christina Wolf, July 2011.
Working Paper No. 303, Sovereign Wealth Funds as Investors in Africa: Opportunities and Barriers, by Edouard Turkisch, September 2011.
Working Paper No. 304, The Process of Reform in Latin America: A Review Essay, by Jeff Dayton-Johnson, Juliana Londoño and Sebastián
Nieto-Parra, October 2011.
Working Paper No. 305, Being “Middle-Class” in Latin America, by Francesca Castellani and Gwenn Parent, October 2011.

70 © OECD 2012
Working Paper No. 306, Revisiting MDG Cost Estimates from a Domestic Resource Mobilisation Perspective, by Vararat Atisophon, Jesus
Bueren, Gregory De Paepe, Christopher Garroway and Jean-Philippe Stijns, December 2011.
Working Paper No. 307, Labour Market Labour Market Changes, Labour Disputes and Social Cohesion in China, by Cai Fang and Wang
Meiyan, January 2012.
Working Paper No. 308, Technological Upgrading in China and India: What do we Know? by Jaejoon Woo, January 2012
Working Paper No. 309, Making Reform Happen in Colombia: The Process of Regional Transfer Reform, by Sebastián Nieto-Parra and
Mauricio Olivera, January 2012.
Working Paper No. 310, Korea’s Low-Carbon Green Growth Strategy, by Sang In Kang, Jin-gyu Oh and Hongseok Kim, March 2012.
Related Documents