THE PROBLEMS OF MUNICIPAL SOLID WASTE AT HYDERABAD CITY, PAKISTAN Presented By SAIMA KALWAR PhD Student FACULTY OF BUILT ENVIRONMENT UNIVERSITY OF MALAYA MALAYSIA NEW ENVIRONMENTAL ENGINEERING II, ADVANCED DECEMBER 24, 2014

Welcome message from author
This document is posted to help you gain knowledge. Please leave a comment to let me know what you think about it! Share it to your friends and learn new things together.
Transcript
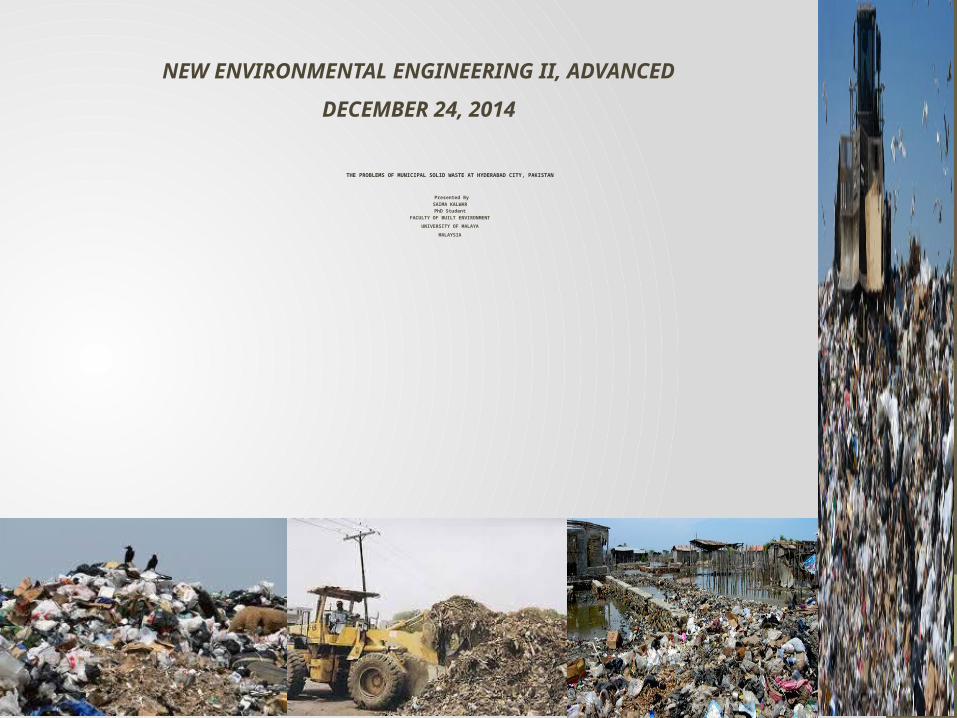
THE PROBLEMS OF MUNICIPAL SOLID WASTE AT HYDERABAD CITY, PAKISTAN
Presented BySAIMA KALWARPhD Student
FACULTY OF BUILT ENVIRONMENTUNIVERSITY OF MALAYA
MALAYSIA
NEW ENVIRONMENTAL ENGINEERING II, ADVANCEDDECEMBER 24, 2014
◙ What is Municipal Solid waste
◙ Main Sources of Municipal Solid Waste
◙ Generation of Municipal Solid Waste
◙ Dumping Sites of MSW in Hyderabad City
◙ Garbage Collection System and its Problems
◙ Effects of Municipal Solid Waste
◙ Suggestions For Improvement of MSW
Presentation Contents
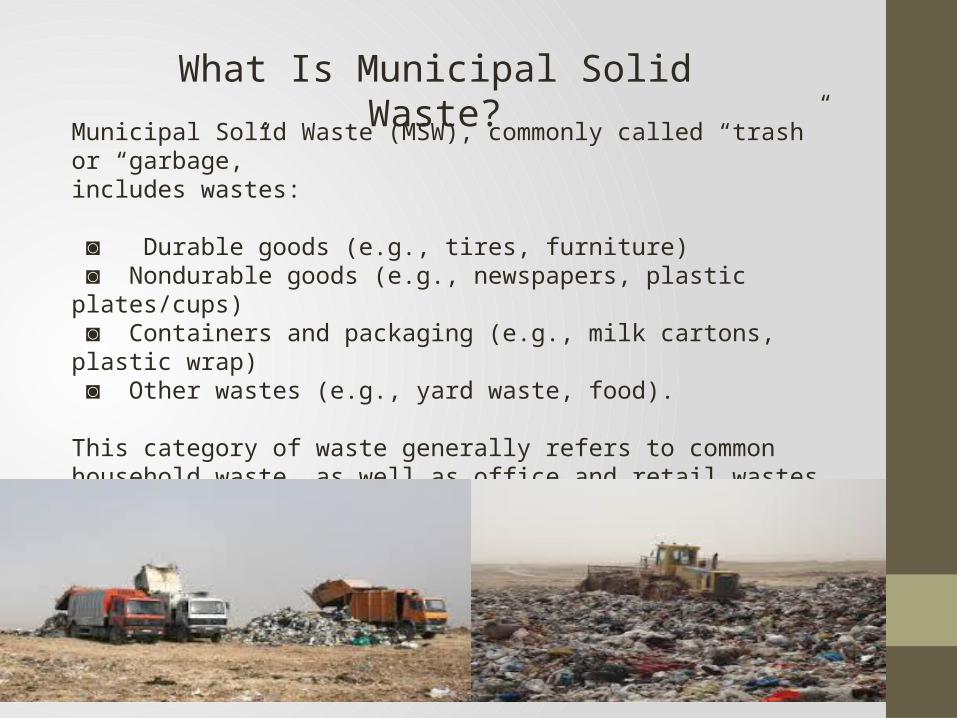
What Is Municipal Solid Waste?Municipal Solid Waste (MSW), commonly called “trash”
or “garbage,” includes wastes:
◙ Durable goods (e.g., tires, furniture) ◙ Nondurable goods (e.g., newspapers, plastic plates/cups) ◙ Containers and packaging (e.g., milk cartons, plastic wrap) ◙ Other wastes (e.g., yard waste, food).
This category of waste generally refers to common household waste, as well as office and retail wastes, but excludes industrial, hazardous and construction wastes and collected usually by local government bodies (Center for Sustainable Systems, University of Michigan. 2014).
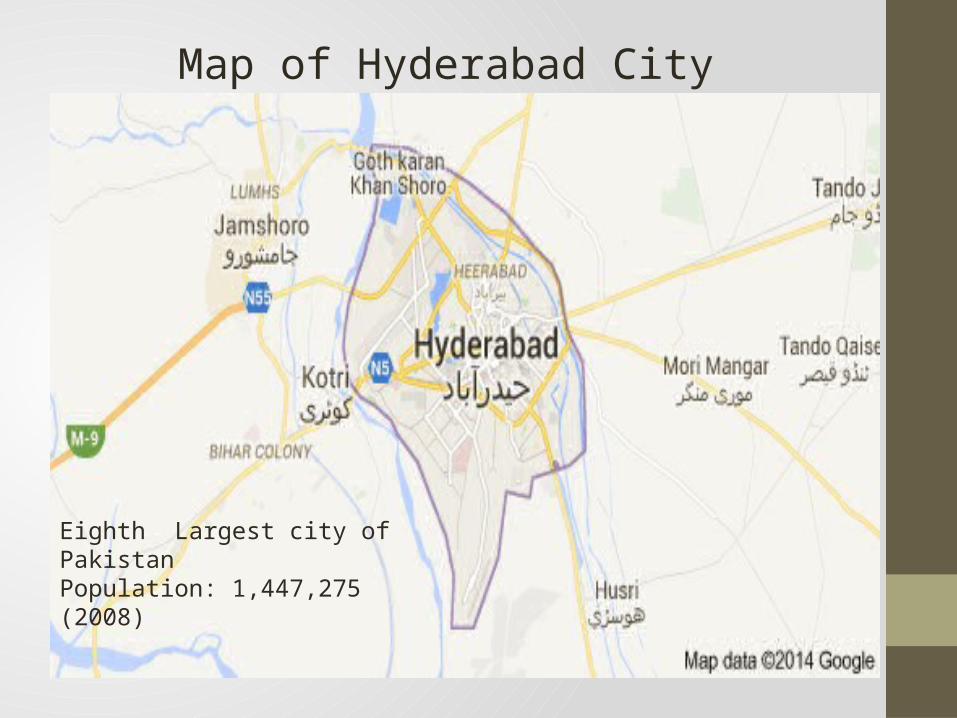
Map of Hyderabad City
Eighth Largest city of PakistanPopulation: 1,447,275 (2008)
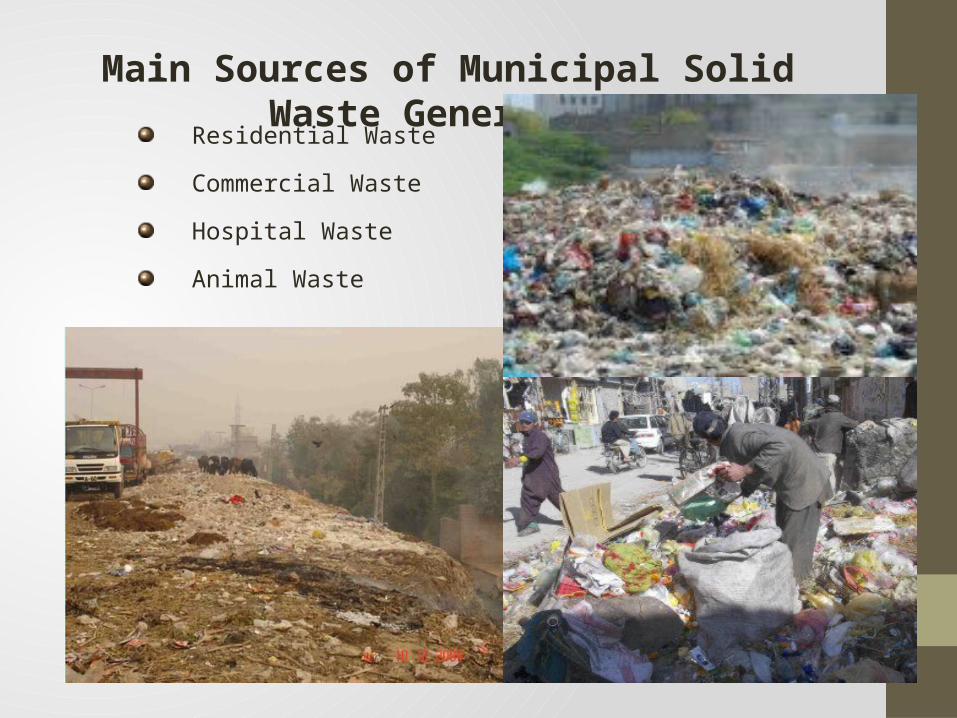
Main Sources of Municipal Solid Waste GenerationResidential Waste
Commercial WasteHospital WasteAnimal Waste
S. No
Waste Type Generation Rate (kg/Head/Day)
Total Solid Waste
Generation in Tons/day
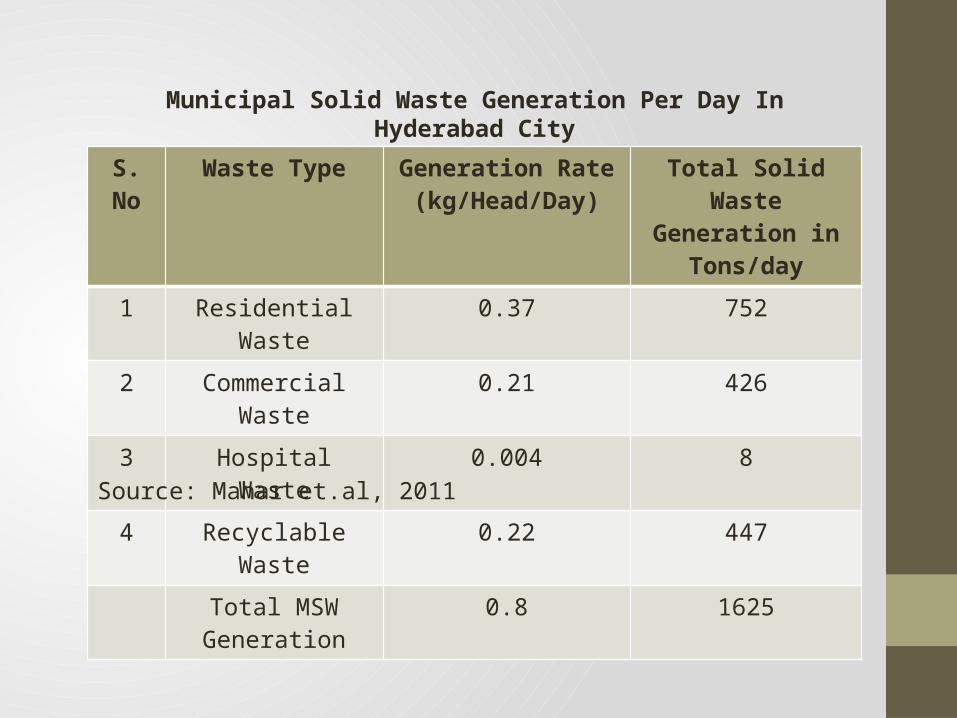
1 Residential Waste
0.37 752
2 Commercial Waste
0.21 426
3 Hospital Waste
0.004 8
4 Recyclable Waste
0.22 447
Total MSW Generation
0.8 1625
Municipal Solid Waste Generation Per Day In Hyderabad City
Source: Mahar et.al, 2011
Seasons Residential Waste
Commercial Waste
Total
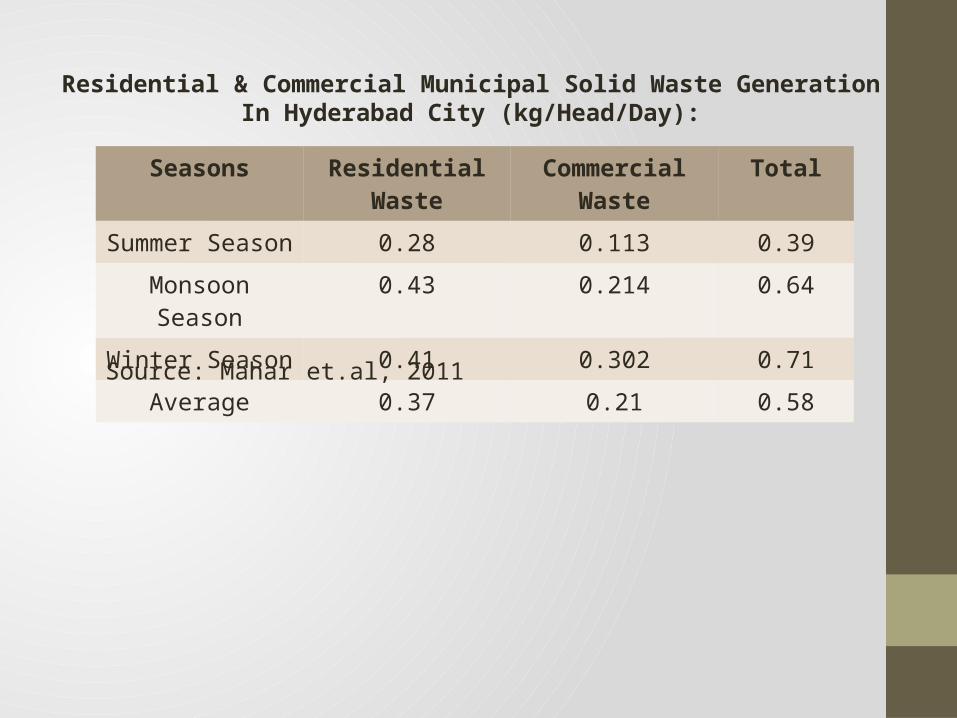
Summer Season 0.28 0.113 0.39Monsoon Season
0.43 0.214 0.64
Winter Season 0.41 0.302 0.71Average 0.37 0.21 0.58
Residential & Commercial Municipal Solid Waste Generation In Hyderabad City (kg/Head/Day):
Source: Mahar et.al, 2011
No. GH
No. PH
Total NB
GR (kg/Bed/D
ay)
AW NB x GR
Population
(Census 1998)
GR (kg/Head/Day)= AW/ Population
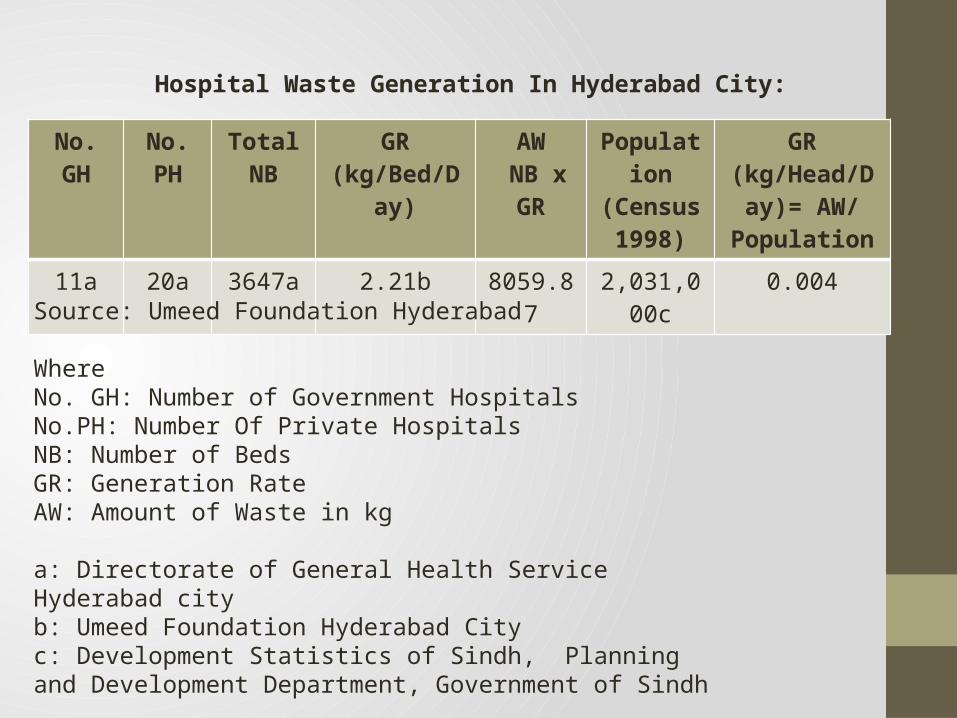
11a 20a 3647a 2.21b 8059.87
2,031,000c
0.004
Hospital Waste Generation In Hyderabad City:
Source: Umeed Foundation Hyderabad
WhereNo. GH: Number of Government HospitalsNo.PH: Number Of Private HospitalsNB: Number of BedsGR: Generation RateAW: Amount of Waste in kg
a: Directorate of General Health Service Hyderabad cityb: Umeed Foundation Hyderabad Cityc: Development Statistics of Sindh, Planning and Development Department, Government of Sindh
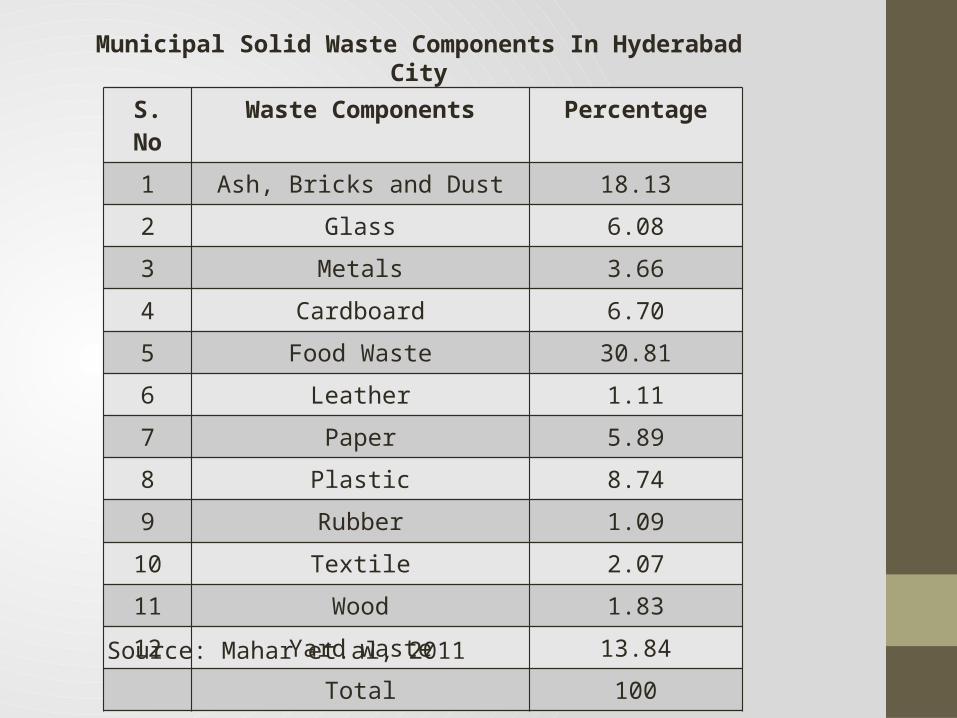
S. No
Waste Components Percentage
1 Ash, Bricks and Dust 18.132 Glass 6.083 Metals 3.664 Cardboard 6.705 Food Waste 30.816 Leather 1.117 Paper 5.898 Plastic 8.749 Rubber 1.0910 Textile 2.0711 Wood 1.8312 Yard waste 13.84
Total 100
Municipal Solid Waste Components In Hyderabad City
Source: Mahar et.al, 2011
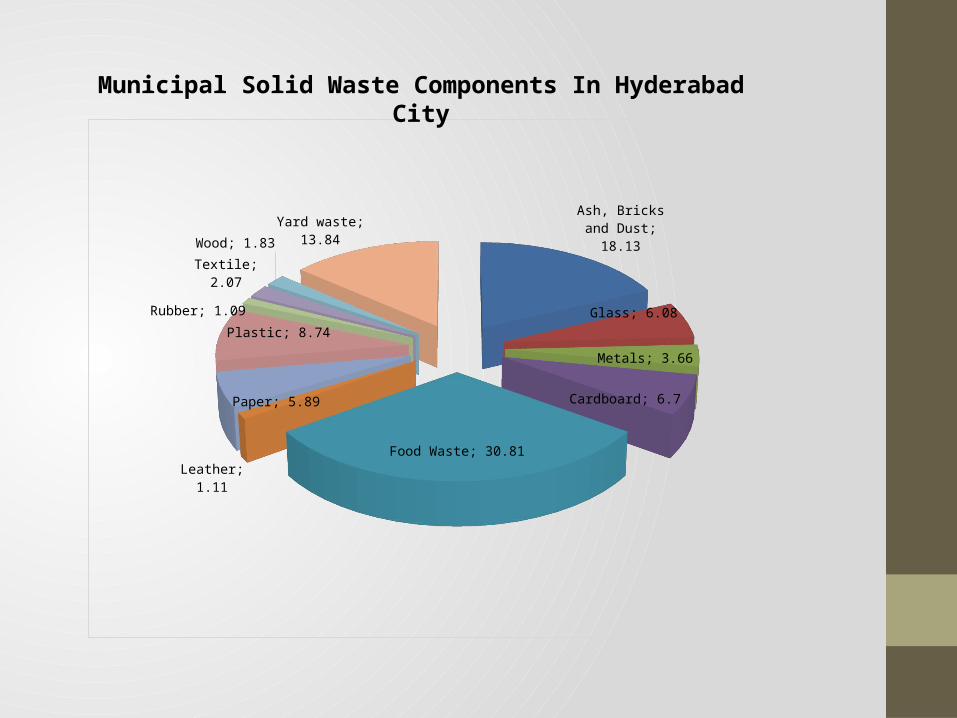
Ash, Bricks and Dust; 18.13
Glass; 6.08
Metals; 3.66
Cardboard; 6.7
Food Waste; 30.81Leather; 1.11
Paper; 5.89
Plastic; 8.74Rubber; 1.09
Textile; 2.07
Wood; 1.83Yard waste;
13.84
Municipal Solid Waste Components In Hyderabad City
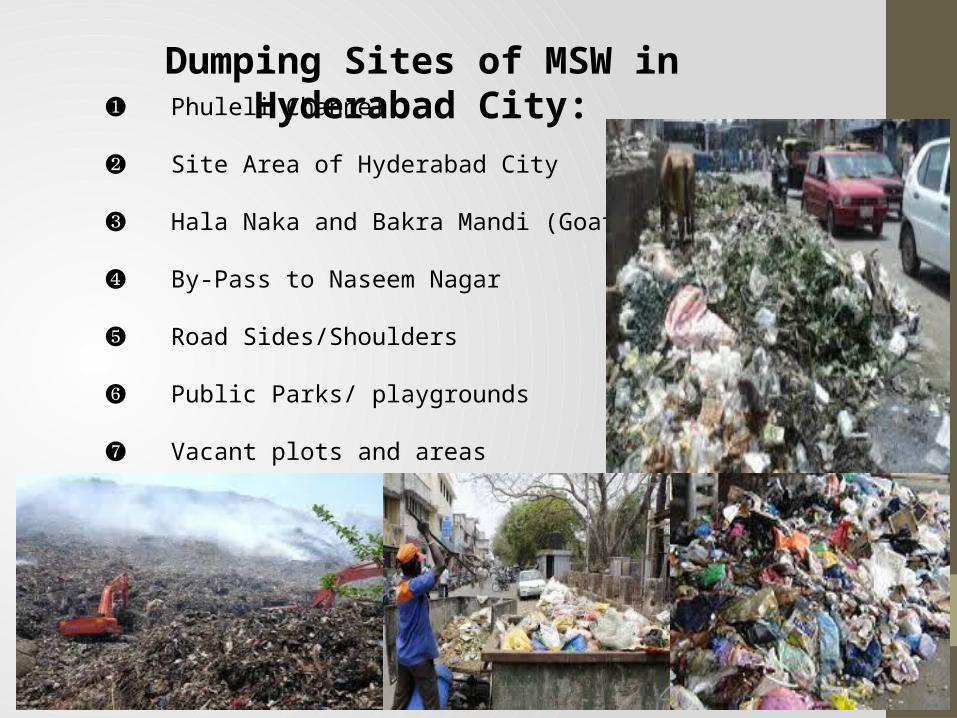
❶ Phuleli Channel
❷ Site Area of Hyderabad City
❸ Hala Naka and Bakra Mandi (Goat Market)
❹ By-Pass to Naseem Nagar
❺ Road Sides/Shoulders
❻ Public Parks/ playgrounds
❼ Vacant plots and areas
Dumping Sites of MSW in Hyderabad City:
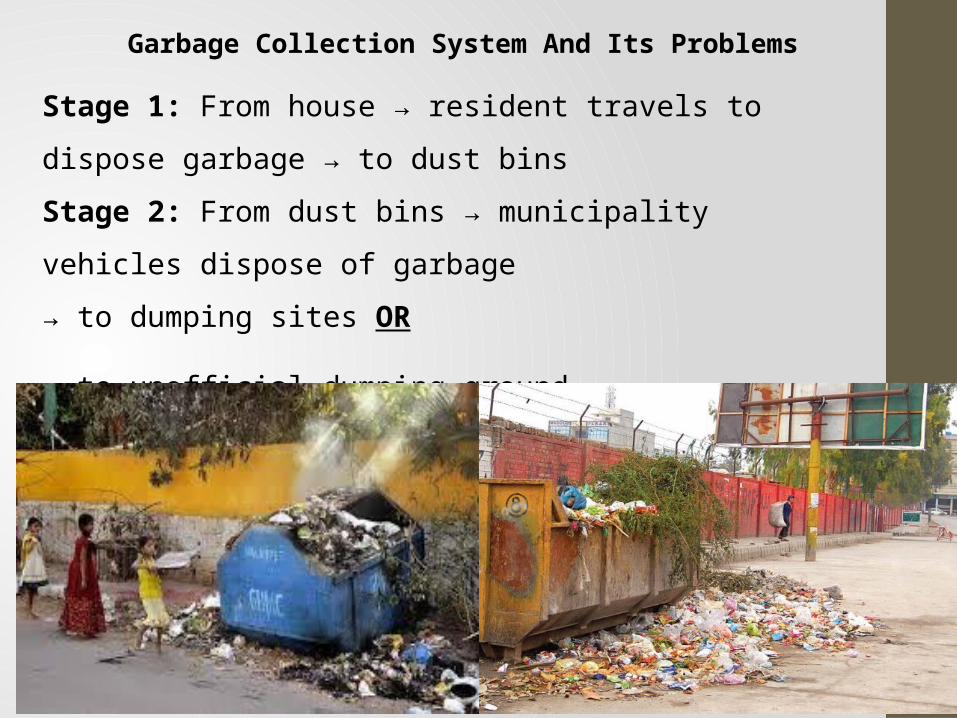
Garbage Collection System And Its Problems
Stage 1: From house → resident travels to dispose garbage → to dust bins Stage 2: From dust bins → municipality vehicles dispose of garbage → to dumping sites OR
→ to unofficial dumping ground
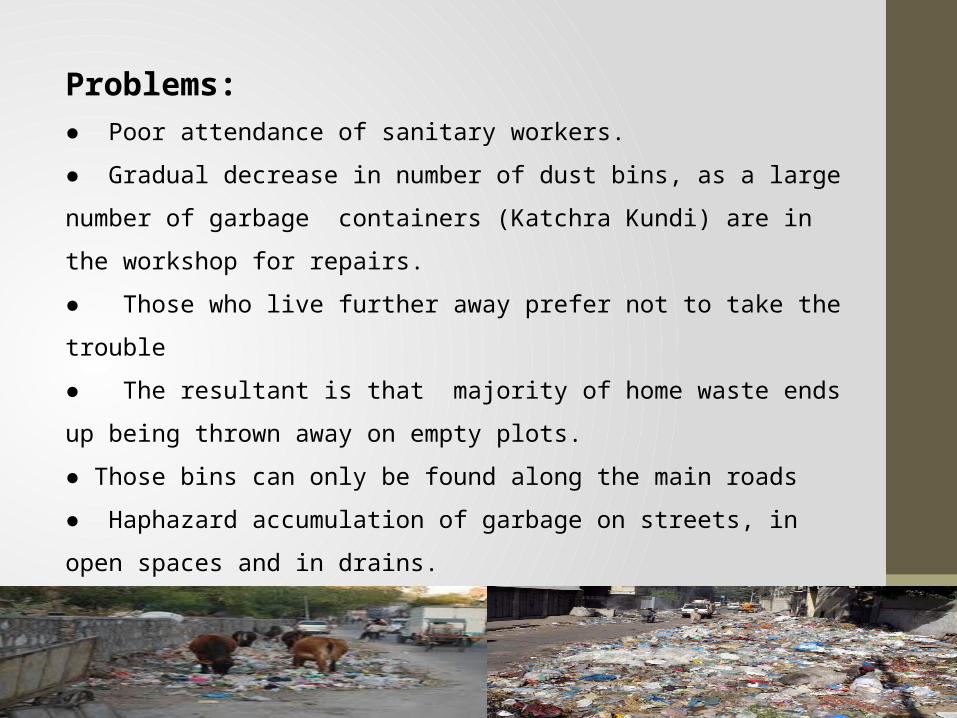
Problems:● Poor attendance of sanitary workers. ● Gradual decrease in number of dust bins, as a large number of garbage containers (Katchra Kundi) are in the workshop for repairs. ● Those who live further away prefer not to take the trouble ● The resultant is that majority of home waste ends up being thrown away on empty plots.● Those bins can only be found along the main roads● Haphazard accumulation of garbage on streets, in open spaces and in drains. ● The uncollected waste usually finds it way in sewers, is eaten by the cattle, or left to rot in the open, or burnt on roadsides. These are harmful practices.
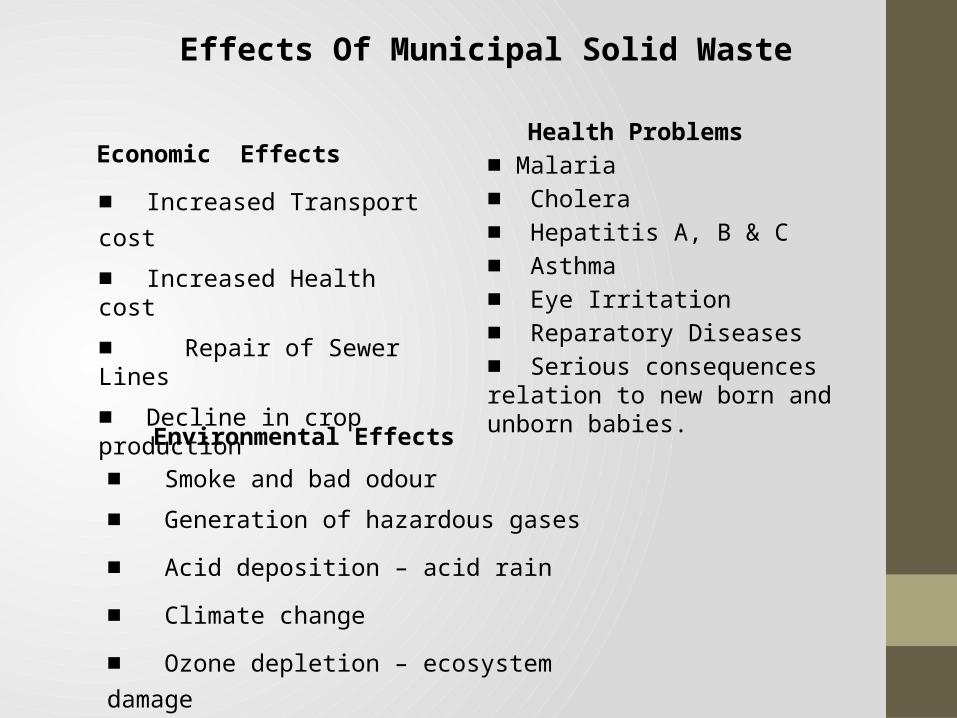
Effects Of Municipal Solid Waste
Economic Effects■ Increased Transport cost ■ Increased Health cost■ Repair of Sewer Lines■ Decline in crop production
Health Problems ■ Malaria■ Cholera■ Hepatitis A, B & C ■ Asthma■ Eye Irritation■ Reparatory Diseases ■ Serious consequences relation to new born and unborn babies. Environmental Effects
■ Smoke and bad odour■ Generation of hazardous gases■ Acid deposition – acid rain ■ Climate change ■ Ozone depletion – ecosystem damage
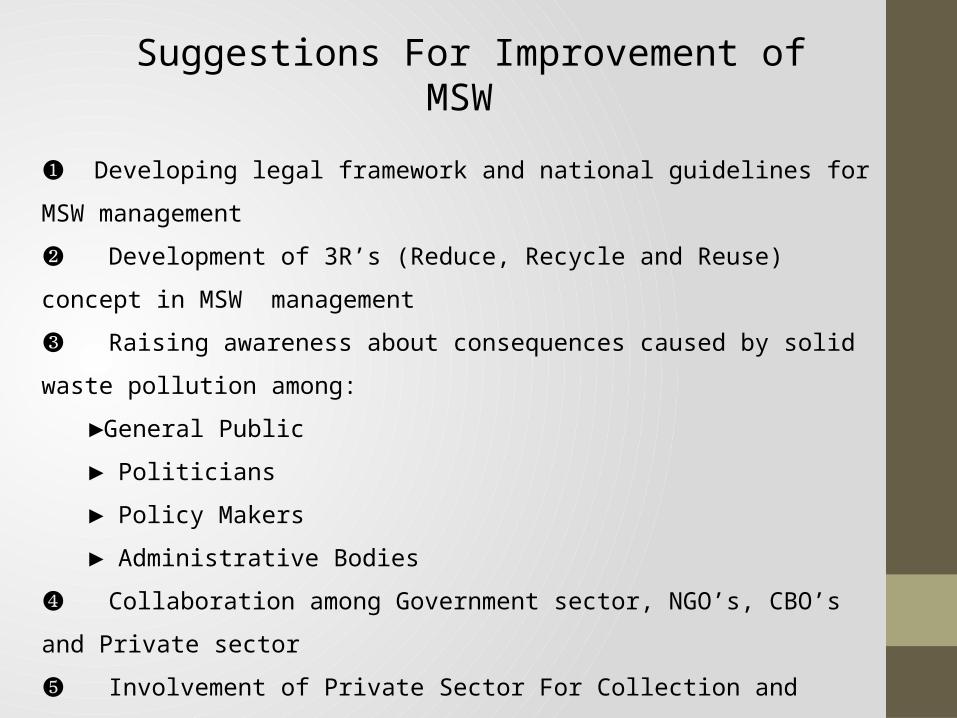
Suggestions For Improvement of MSW
❶ Developing legal framework and national guidelines for MSW management ❷ Development of 3R’s (Reduce, Recycle and Reuse)
concept in MSW management ❸ Raising awareness about consequences caused by solid
waste pollution among:►General Public► Politicians► Policy Makers► Administrative Bodies
❹ Collaboration among Government sector, NGO’s, CBO’s and Private sector ❺ Involvement of Private Sector For Collection and
Recycling on commercial basis House to house collection ❻of MSW should be organized ❼ Littering of solid waste should be prohibited in
cities, towns and urban areas ❽ Proper segregation would be vital for scientific
disposal of waste

THANK YOU
Related Documents