The Problem of Unemployment in Europe and America A Lecture at the American University of Paris September 23, 2004

The Problem of Unemployment in Europe and America A Lecture at the American University of Paris September 23, 2004.
Dec 22, 2015
Welcome message from author
This document is posted to help you gain knowledge. Please leave a comment to let me know what you think about it! Share it to your friends and learn new things together.
Transcript

The Problem of Unemployment in Europe and
America
A Lecture at the American
University of Paris
September 23, 2004

byJames K. Galbraith
The University of Texas Inequality Project
http://utip.gov.utexas.edu
Based on an article co-authored with Enrique Garcilazo published in Banca Nazionale del Lavoro Quarterly Review
No. 228, March 2004

The Standard View
• Employment is determined in a labor market.
• Labor markets are national.
• Flexibility reduces unemployment.
• The United States has more jobs than Europe, but only at the expense of more inequality.
• Is this good or bad? A political question

“Data! Data! Data!
I can’t make bricks without clay.”
Sherlock Holmes
The Adventure of the Copper Beeches

The U.T. Inequality Project
• Measures global pay inequality.
• Estimates global income inequalities.
• Shows now inequality has risen under globalization.
• Is changing our understanding of the relationship of inequality to unemployment.

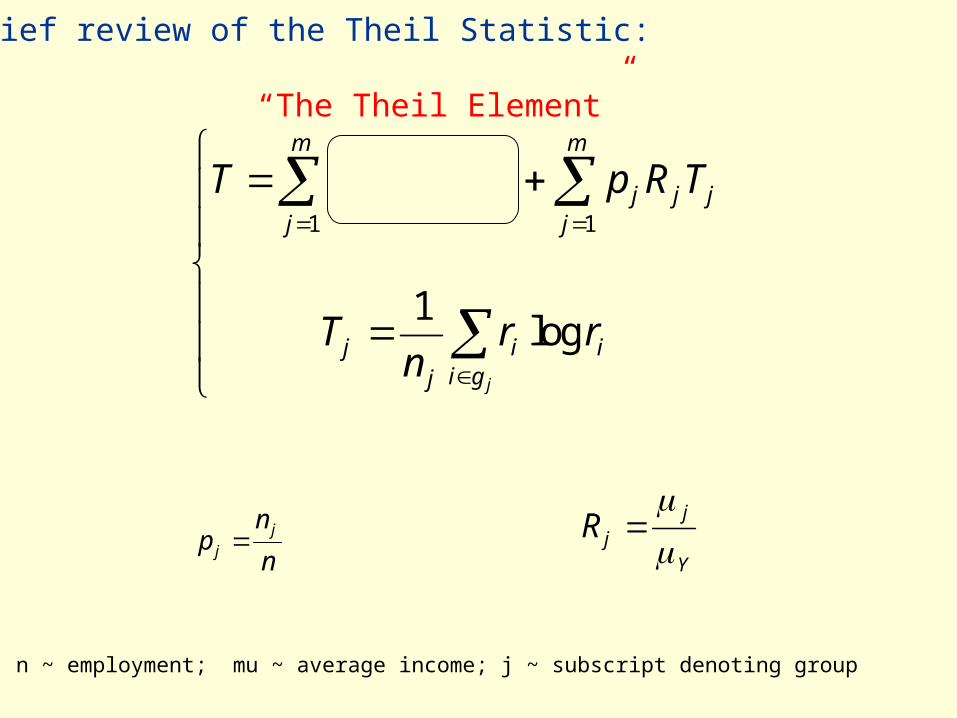
We use Theil’s T statistic, measured across sectors within each country, region or province, to show the evolution of economic inequality.
The components of the statistic provide a measure of the contribution of each “province-sector cell” to inequality. This measure takes account both of the relative income of the cell and its size in relation to the whole employed population.
The method permits us to map changes in the flow of incomes across regions and across sectors very accurately through time, using national data sources & without relying on sample surveys.
General Technique
T p R R p R T
Tn
r r
j jj
m
j jj
m
j j
jj
ii g
i
j
1 1
1
log
log
pn
njj R j
j
Y
A brief review of the Theil Statistic:
n ~ employment; mu ~ average income; j ~ subscript denoting group
“The Theil Element”

Advantages
• Our method permits us to assess the value of inequality at each geographic level:
• Within provinces
• Within countries
• Across large regions – such as Europe.

The U.S. Case
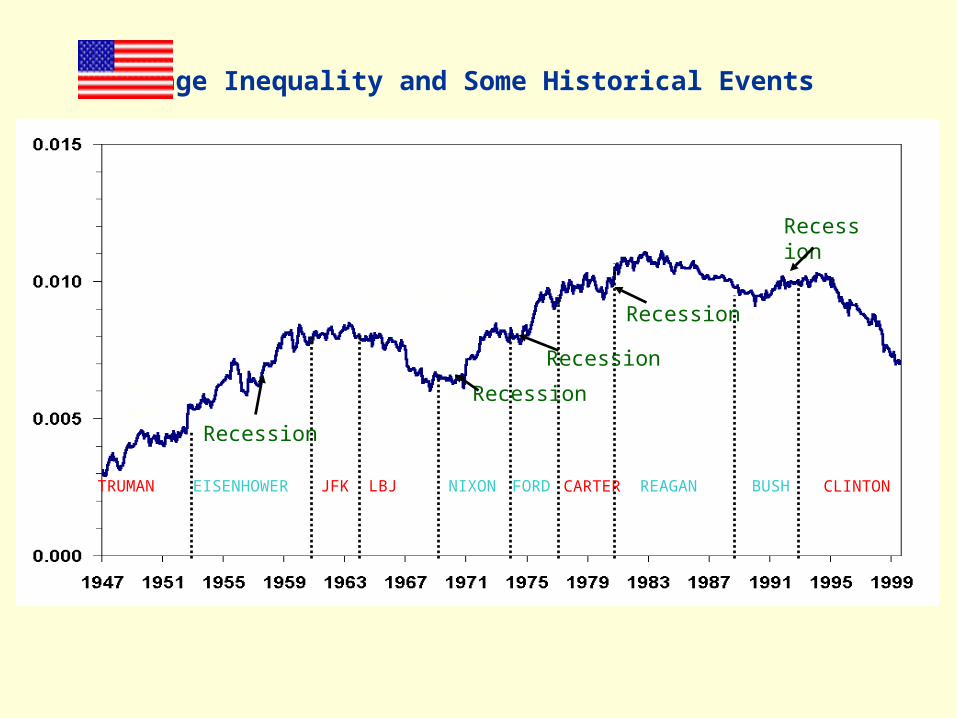
• In the American case, we have measured inequalities of pay (weekly earnings) in the manufacturing sector on a monthly basis going back to January, 1947, for sectors that are continuously measured since that time. The result gives us a time series of pay inequalities in a key part of the American industrial economy.
JFK LBJ NIXON FORD CARTER REAGAN BUSH CLINTON
Wage Inequality and Some Historical Events
TRUMAN EISENHOWER
Korean War
Recession
Vietnam War
Recession
Recession
Recession
Recession

Wage Inequality and Unemployment
Open Unemployment
Rate
A strong positive correlation between the unemployment rate and wage inequality in the US is exhibited here.

The U.S and Europe
• First, let’s compare U.S. inequality to that in each European country.
• Then, let’s compare U.S. inequality to that in Europe-as-a-whole
• Finally, we ask, what is the relationship between unemployment and inequality in Europe?

EHII -- Estimated Household Income Inequality for OECD Countries
Gin
i co
effi
cie
nt
SWE DNK FIN NOR AUS ISL NZL CAN JPN IRL PRT
GBR LUX DEU NLD FRA AUT BEL ITA USA ESP GRC
25
30
35
40
45
1963
1963
1963
19631963
1963
1963 19631963
1977
19681963
1963 1963
1963
1967
1963
1963
1963
1963
1963
1963
1999
1999
1998
1994
1999
1994
1998
1999
1997
1998
1996
1999
1996
1992
19991998
1999
1999 1998
1999
1989
1999
Low High
0
0.01
0.02
0.03
0.04
0.05
Th
eil V
alu
e
19781979
19801981
19821983
19841985
19861987
19881989
19901991
1992
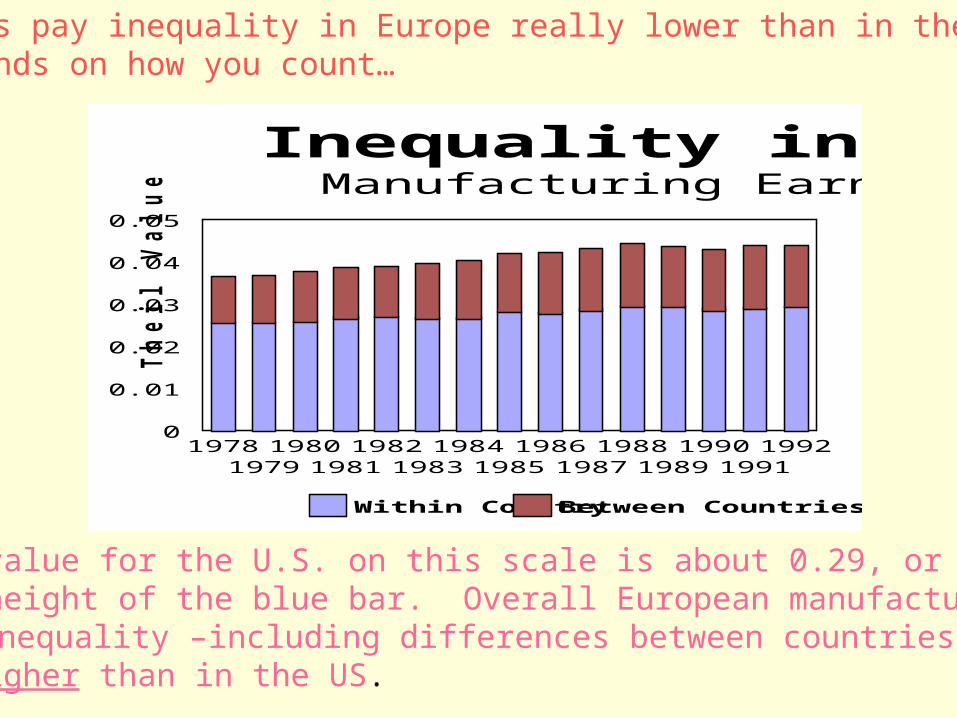
Within CountryBetween Countries
Inequality in EuropeManufacturing Earnings
The value for the U.S. on this scale is about 0.29, or roughly the height of the blue bar. Overall European manufacturing pay inequality –including differences between countries –is higher than in the US.
Now, is pay inequality in Europe really lower than in the U.S.?It depends on how you count…

European Regional Panel Data Set
• Pay across Sectors by European Region
• From Eurostat’s REGIO
• Annual 1984-2000, up to 159 Regions
• Enables us to compute measures of inequality within and between regions.
• Permits construction of a panel with which we can isolate regional, national and continental effects

Table 1. Population differentials for nations and regions in Europe.
Variable Obs Mean Std. Dev. Min Max -------------------------------------------------------------------------- Nations: Population 169 28128 25164 355.9 80759.6 (000s)
Regions: Population 1853 2306 2556 22.5 17663.2

ImpoverishedFar Below AverageBelow AverageLow low NeutralLow NeutralNeutralHigh NeutralAbove AverageProsperousWealthy
Contribution of European Provinces in Inequality Across the European continent, late 1990s.

Within Region 19960.003 - 0.0150.015 - 0.0260.026 - 0.0270.027 - 0.0360.036 - 0.0450.045 - 0.0660.066 - 0.0810.081 - 0.1050.105 - 0.1470.147 - 0.222
1000 0 1000 2000 Miles
N
EW
S
European Inequality Across Sectors,Within Provinces, 1996

A Simple Theory of European Unemployment
• Demand Factors:– GDP Growth and Investment– Wealth and Demand for Services
• Supply Factors:– Inequalities of Pay– Transition to Work for Youth

Hypotheses
• Growth reduces unemployment. (-)
• Higher incomes mean fewer unemployed. (-)
• Inequality increases unemployment (+)
• More younger workers means more unemployed. (+)

Total Male Female < 25 Yrs > 25 Yrs Beta Pvalue Beta Pvalue Beta Pvalue Beta Pvalue Beta Pvalue
Theil 4.969 0.039 3.221 0.126 6.805 0.039 11.967 0.032 4.081 0.042 PopUn24 57.019 0.000 50.581 0.000 76.462 0.000 112.319 0.000 38.037 0.000 RelWage -7.085 0.000 -4.951 0.000 -9.907 0.000 -6.371 0.004 -7.434 0.000 G-GDP -4.485 0.025 -5.670 0.001 -2.347 0.393 -6.299 0.175 -4.687 0.005 R^2 0.6140 0.5869 0.6535 0.6172 0.5831 N 1465 1465 1465 1465 1465
Beta Pvalue Beta Pvalue Beta Pvalue Beta Pvalue Theil 4.027 0.180 4.808 0.039 5.393 0.087 4.969 0.039 PopUn24 50.205 0.000 48.640 0.000 54.227 0.000 57.019 0.000 RelWage -2.816 0.000 -6.809 0.000 -2.210 0.002 -7.085 0.000 G-GDP -11.830 0.000 -8.561 0.000 -9.494 0.001 -4.485 0.025 Regional X X X X Country X X Time X X R^2 0.1644 0.5702 0.2057 0.6140
Table 2. Coefficient Estimates: Linear Model - (1984-2000).
Table 3. Analysis of Variance Explained Under Different Specifications.
Regression analysis of European unemployment
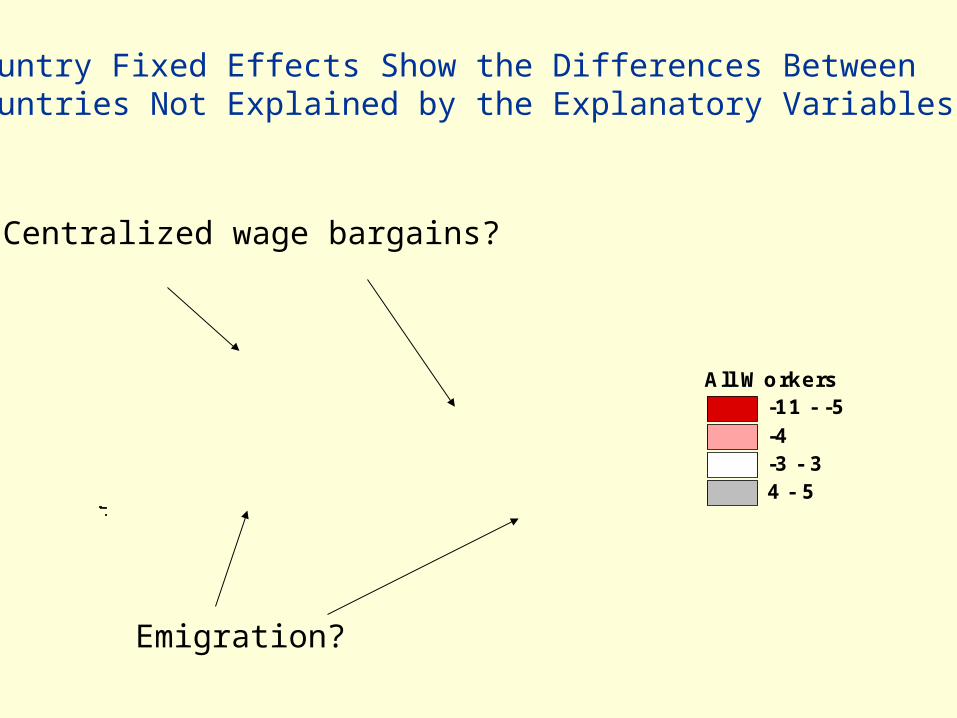
All Workers-11 - -5-4-3 - 34 - 5
Emigration?
Centralized wage bargains?
Country Fixed Effects Show the Differences Between Countries Not Explained by the Explanatory Variables.
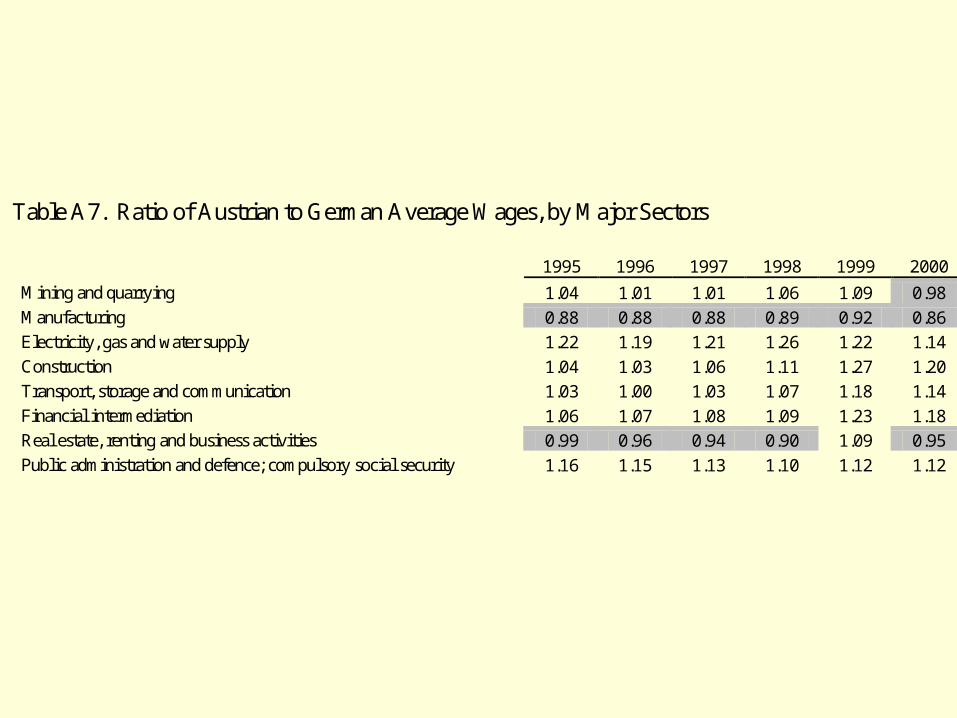
Table A7. Ratio of Austrian to German Average Wages, by Major Sectors 1995 1996 1997 1998 1999 2000
Mining and quarrying 1.04 1.01 1.01 1.06 1.09 0.98
Manufacturing 0.88 0.88 0.88 0.89 0.92 0.86 Electricity, gas and water supply 1.22 1.19 1.21 1.26 1.22 1.14
Construction 1.04 1.03 1.06 1.11 1.27 1.20 Transport, storage and communication 1.03 1.00 1.03 1.07 1.18 1.14
Financial intermediation 1.06 1.07 1.08 1.09 1.23 1.18 Real estate, renting and business activities 0.99 0.96 0.94 0.90 1.09 0.95
Public administration and defence; compulsory social security 1.16 1.15 1.13 1.10 1.12 1.12

European Effects
-8
-6
-4
-2
0
2
4
6
8
1984
1985
1986
1987
1988
1989
1990
1991
1992
1993
1994
1995
1996
1997
1998
1999
2000
Years
Un
emp
loym
ent
Total Male Female <25 Yrs >25 Yrs
Single European Act
Maastricht Treaty
Birth of the Euro
Growth and Stability pact
Time Fixed Effects Show the Movements of Unemployment Across All Regions, After Taking Account of the Regressors

Conclusions
• Labor markets are not national.• Macroeconomic conditions matter.• Youth is a problem. • Equality of pay helps. • Flexibility does not.• Small countries have an advantage.• EU policies started off very poorly.• But there is hope for the future.

For more information:
The University of Texas Inequality Project
http://utip.gov.utexas.edu
Type “Inequality” into Google to find us on the Web
Related Documents