Department of Economic and Technological Change Center for Development Research (ZEF) The private sector and the marginalized poor – An assessment of the potential role of business in reducing poverty and marginality in rural Ethiopia Inaugural Dissertation zur Erlangung des Grades Doktor der Agrarwissenschaften (Dr. agr.) der Landwirtschaftlichen Fakultät der Rheinischen Friedrich‐Wilhelms‐Universität Bonn vorgelegt von Christine Husmann aus Wien 2015

Welcome message from author
This document is posted to help you gain knowledge. Please leave a comment to let me know what you think about it! Share it to your friends and learn new things together.
Transcript
DepartmentofEconomicandTechnologicalChange
CenterforDevelopmentResearch(ZEF)
Theprivatesectorandthemarginalizedpoor–
AnassessmentofthepotentialroleofbusinessinreducingpovertyandmarginalityinruralEthiopia
InauguralDissertation
zur
ErlangungdesGrades
DoktorderAgrarwissenschaften
(Dr.agr.)
der
LandwirtschaftlichenFakultät
der
RheinischenFriedrich‐Wilhelms‐UniversitätBonn
vorgelegtvon
ChristineHusmann
ausWien
2015

FirstSupervisor:Prof.Dr.JoachimvonBraun
SecondSupervisor:Prof.Dr.StefanieBröring
DateofExam:31.10.2014
YearofPublication:2015
i
ContentI. Introduction ..................................................................................................................................... 1
I‐1 Background and motivation for the study .................................................................................. 1
I‐2 Innovative approaches and new roles: business in alteration .................................................... 3
I‐3 Research question and hypothesis .............................................................................................. 8
I‐4 Definitions and conceptual framework ....................................................................................... 9
I‐5 Design of the study and data sources .......................................................................................14
I‐6 Ethiopia as study country ..........................................................................................................15
I‐7 Outline of the study ...................................................................................................................19
II. Identifying marginality hotspots in Ethiopia: locating future markets? ........................................ 20
II‐1 Marginality – a short introduction of the concept ....................................................................20
II‐2 Where are the marginalized poor in Ethiopia? .........................................................................23
Marginality hotspot mapping – method and data ..........................................................23 II‐2.1
The dimensions of marginality and their proxies ............................................................24 II‐2.2
Sensitivity analysis and validation of the marginality hotspot map ...............................32 II‐2.3
Limitations of the mapping approach and implications for further analyses .................36 II‐2.4
II‐3 How many people are marginalized in Ethiopia? ......................................................................37
II‐4 Marginality hotspots and their concurrence with other socio‐economic and agro‐
ecologic factors ..........................................................................................................................41
Marginality hotspots and agro‐ecological zones ............................................................41 II‐4.1
Ethnic diversity, ethnic dominance and marginality .......................................................42 II‐4.2
II‐5 Can business reach out to marginalized people? ......................................................................49
II‐6 Conclusion .................................................................................................................................54
III. The demand side of BoP markets: the marginalized poor as consumers and producers ............. 56
III‐1 Introduction: the people at the bottom of the economic pyramid ..........................................56
Who is the BoP and why it is important to know it ........................................................57 III‐1.1
Need, latent need and demand ......................................................................................58 III‐1.2
III‐2 Who are the BoP consumers and on what do they spend? ......................................................58
Definitions of BoP consumers .........................................................................................58 III‐2.1
On what do BoP consumers spend? ...............................................................................62 III‐2.2
Factors influencing the purchasing behavior of the BoP – what do we know? ..............63 III‐2.3
Preliminary conclusion: what do we know about BoP consumers? ...............................65 III‐2.4
III‐3 Who is the BoP in Ethiopia? Needs and demand of the marginalized poor .............................66
Introduction ....................................................................................................................66 III‐3.1
Survey methodology .......................................................................................................67 III‐3.2
III‐4 Empirical findings about the people at the bottom of the economic pyramid in Ethiopia ......69
Community characteristics ..............................................................................................69 III‐4.1
Basic characteristics of the respondents ........................................................................70 III‐4.2
Expenditures and savings of the marginalized poor .......................................................72 III‐4.3
Needs and demand of the marginalized poor ................................................................75 III‐4.4
Do the marginalized poor have access to improved agricultural inputs? .......................79 III‐4.5
Do the marginalized poor participate on the market as sellers? ....................................80 III‐4.6
ii
III‐5 Conclusion: lessons learnt about the needs of the marginalized poor and potential
untapped markets .....................................................................................................................83
IV. The supply side of BoP markets and prospects for the private sector to reduce poverty in rural
Ethiopia .......................................................................................................................................... 86
IV‐1 Institutions and transaction costs – defining the concepts.......................................................86
IV‐2 Transaction costs in the agricultural sector of poor countries – what do we know so
far? .............................................................................................................................................87
Agriculture and the private sector in Ethiopia: a short introduction of the IV‐2.1
historical and institutional background ..........................................................................89
National policies and regulations governing agricultural input markets ........................90 IV‐2.2
Implications for the private sector ..................................................................................93 IV‐2.3
IV‐3 Are there firms targeting the poor? Agricultural input provision in Ethiopia ...........................97
Seeds of major crops .......................................................................................................97 IV‐3.1
Why is there not more investment in seed production? ................................................98 IV‐3.2
The direct seed marketing pilots .................................................................................. 102 IV‐3.3
Institutions preventing the private sector from increasing seed production and IV‐3.4
targeting the marginalized poor .................................................................................. 104
What is the nature of transaction costs arising in the Ethiopia seed system? ............ 105 IV‐3.5
The fertilizer system ..................................................................................................... 108 IV‐3.6
Problems in the fertilizer system ................................................................................. 109 IV‐3.7
The private sector and the fertilizer market ................................................................ 111 IV‐3.8
Institutional analysis: transaction costs along the fertilizer value chain ..................... 112 IV‐3.9
Provision of other seeds and agro‐chemicals .............................................................. 113 IV‐3.10
IV‐4 Conclusion: institutions and the private sector on agricultural input markets ...................... 115
V. Conclusion ................................................................................................................................... 118
VI. References ................................................................................................................................... 129
VII. Appendix ...................................................................................................................................... 147
i
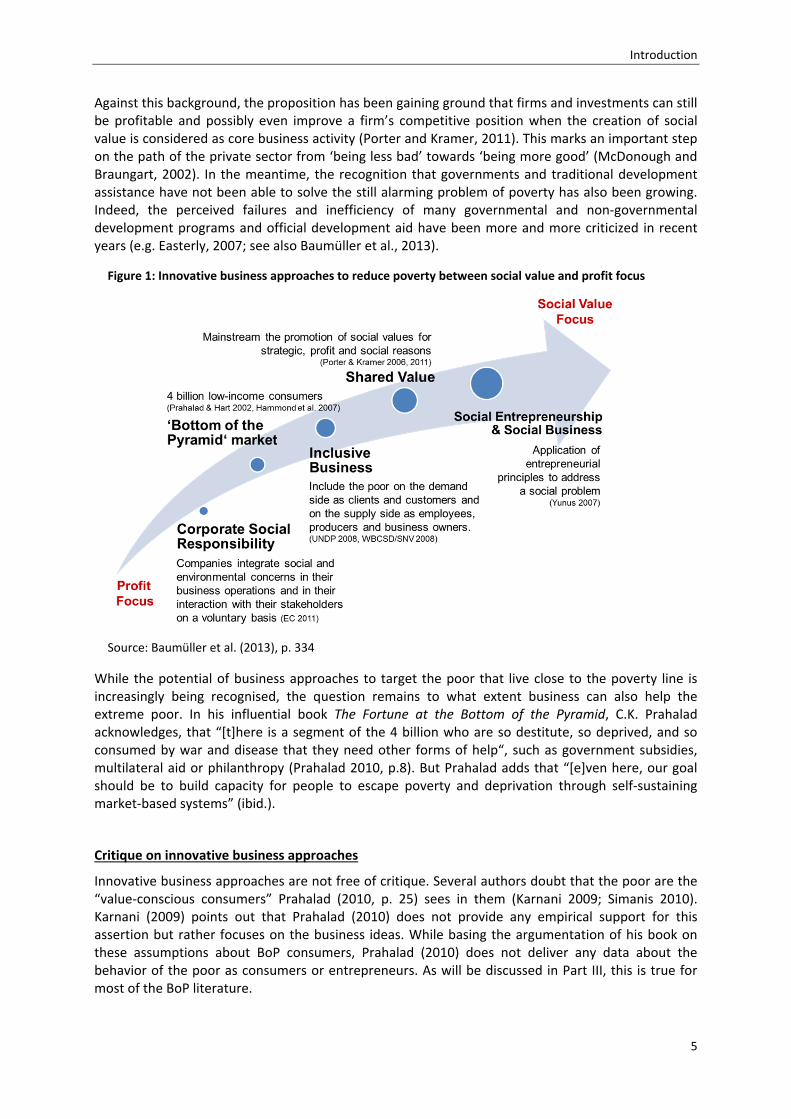
FiguresFigure 1: Innovative business approaches to reduce poverty between social value and profit
focus .......................................................................................................................................... 5
Figure 2: Conceptual framework and relevant theories for the analysis of the opportunities of
the private sector to provide agricultural inputs to marginalized poor smallholders ............12
Figure 3: Marginality: the position of individuals or groups within different systems ..........................22
Figure 4: Share of soils that are unsuitable for agriculture in total land area .......................................31
Figure 5: Percent of woredas covered by PSNP for different incidences of marginality .......................34
Figure 6: The number of marginalized poor people in Ethiopia (estimation for 2012) .........................38
Figure 7: Correlation between ethnic fractionalization and marginality (linear prediction) .................46
Figure 8: Correlation between dominance of main ethnic group and marginality (linear
prediction) ...............................................................................................................................47
Figure 9: BoP consumers and their relative importance in different regions ........................................61
Figure 10: Relative size of BoP market sectors ......................................................................................63
Figure 11: Monthly expenditures and savings per person [ETB] ...........................................................72
Figure 12: Cash income distribution across regions ...............................................................................74
Figure 13: Composition of the consumption basket ..............................................................................75
Figure 14: Most urgent unsatisfied needs of the marginalized poor per region ...................................77
Figure 15: Products that are found too expensive by the marginalized poor .......................................78
Figure 16: The most urgent unsatisfied needs of the marginalized poor ..............................................78
Figure 17: Amount of fertilizer distributed in SNNP over the last years ................................................80
Figure 18: Products sold on the market by the marginalized poor ........................................................81
Figure 19: Products the marginalized poor sell to traders .....................................................................82
Figure 20: Agricultural investments in Ethiopia since 1992 ...................................................................90
Figure 21: Outstanding loans and sectoral non‐performing loan ratios of the Commercial
Bank of Ethiopia for the quarter ended March 2012 .............................................................95
Figure 22: The formal seed system in Ethiopia ................................................................................... 100
Figure 23: Sales of hybrid maize seed (in ‘000 quintals) ..................................................................... 101
Figure 24: The fertilizer value chain .................................................................................................... 109
Figure 25: Fertilizer supply and use by farmers in 2010 ..................................................................... 110
TablesTable 1: Identified proxies for mapping marginality hotpots on subnational level in Ethiopia .............28
Table 2: Comparison of marginality hotspot and non‐hotspot areas for socio‐economic
indicators ................................................................................................................................30
Table 3: Indicators and their cut‐off points for the marginality hotspot map using lowest
quartiles ..................................................................................................................................33
Table 4: Numbers of marginalized poor people in 2012 ........................................................................37
Table 5: Estimated market size for Ethiopia (2012) ...............................................................................40
Table 6: Kolmogorov‐Smirnov test for equality of distribution of ethnic fractionalization ...................46
ii
Table 7: Kolmogorov‐Smirnov test for equality of distribution of the dominance of one ethnic
group .......................................................................................................................................47
Table 8: Suitability of different business approaches to cater to people in different area types .........54
Table 9: Examples of different definitions of BoP consumers ...............................................................59
Table 10: Comparison of basic characteristics between kebeles ...........................................................71
Table 11: Overview over different expenditure variables and their values for all woredas ..................73
Table 12: Targeted growth of agriculture and allied activities according to the GTP ............................90
Table 13: Targeted growth of road infrastructure according to the GTP ..............................................91
Table 14: Difference between supply and demand of improved seeds of various crops ......................97
Table 15: Overview of studies on transaction costs on agricultural markets in poor countries ......... 150
Table 16: List of seed producing firms in Ethiopia in 2012 ................................................................. 155
Table 17: Components of the seed system and respective actors ...................................................... 156
MapsMap 1: Marginality hotspot map of Ethiopia .........................................................................................27
Map 2: Share of population with per capita expenditures below national average .............................32
Map 3: Gini coefficient for each region ..................................................................................................32
Map 4: Marginality hotspot map using the lowest quartile as cut‐off point .........................................33
Map 5: Overlap of marginality with coverage of the PSNP ....................................................................34
Map 6: Population distribution in Ethiopia ............................................................................................38
Map 7: Traditional agro‐ecological zones of Ethiopia in comparison with the location of
marginality hotspots ...............................................................................................................42
Map 8: Ethnic group constituting more than half of the population .....................................................45
Map 9: Ethnic fractionalization ..............................................................................................................48
Map 10: Share of the dominant ethnic group in total population .........................................................48
Map 11: Predominant livelihoods and farming systems ........................................................................50
Map 12: Connectivity in Ethiopia ...........................................................................................................50
Map 13: Rough classification of areas with different business challenges ............................................51
Map 14: Business challenges overlaid with marginality hotspots .........................................................51
Map 15: Per‐capita consumption across regions ...................................................................................53
Map 16: Location of the study sites .......................................................................................................69
Map 17: The regions in Ethiopia .......................................................................................................... 147
Maps 18: Maps for the single dimensions of marginality ................................................................... 148
Maps 19: Maps for the single dimensions of marginality using the lowest quartile as cut‐off
point ..................................................................................................................................... 149
iii
BoxesBox 1: A short overview over innovative business approaches ............................................................... 4
Box 2: Transaction costs, market failure and Pareto efficiency .............................................................10
Box 3: Sample of interview partners ......................................................................................................15
Box 4: Sen’s capability approach ............................................................................................................21
Box 5: The spheres of life proposed by Gatzweiler et al. (2011) ...........................................................23
Box 6: The ethno‐linguistic fractionalization index as measure of ethnic diversity ...............................43
Box 7: The Buying Power Index (BPI) .....................................................................................................60
Box 8: Special financial institutions in Ethiopia: equb and iddir .............................................................76
Box 9: Definitions of institutions ............................................................................................................86
Box 10: Definitions of transaction costs .................................................................................................87
Box 11: The Ethiopian administrative levels and respective agricultural government bodies ..............96
Box 12: Different types of transaction costs ....................................................................................... 106
Box 13: Fertilizer procurement under control of the government ..................................................... 111
Box 14: Michael Porter’s concept of competitive advantage ............................................................. 116
ExamplesExample 1: Enterprise EthioPEA .............................................................................................................83
Example 2: Asela Malt’s program of sourcing barley malt from smallholder farmers ..........................83
Example 3: Feed the Future ...................................................................................................................96
Example 4: The GIZ project to strengthen the seed sector in Ethiopia ..................................................99
Example 5: Improved barley seed production .................................................................................... 101
Example 6: The Advanced Maize Seed Adoption Program ................................................................. 105
Example 7: The integrated Seed System Development Programme (ISSD) ........................................ 108
Example 8: A social enterprise establishing a vegetable value chain ................................................. 113
Example 9: Companies evaluating other agricultural input markets – the ATC Kulumsa project ...... 115
iv
AbbreviationsADLI Agriculture Development Led Industrialization
AGRA Alliance for a Green Revolution in Africa
AIC Agricultural Input Corporation
AISE Agricultural Input Supply Enterprise
AMDE Agricultural Growth Program‐Agribusiness and Markets Development
ASE Amhara Seed Enterprise
ATA Agricultural Transformation Agency
ATC Agricultural Training Center
BoA Bureau of Agriculture
BoP Bottom of the Pyramid
CAADP Comprehensive Africa Agriculture Development Programme
CBE Commercial Bank of Ethiopia
CIESIN Center for International Earth Science Information Network
CIMMYT International Center for Maize and Wheat Improvement
CSA Central Statistical Authority
DA Development Agent
DAP Diammonium Phosphate
DHS Demographic and Health Survey
EG‐PSDS Economic Growth and Private Sector Development Support
EIAR Ethiopian Institute of Agricultural Research
ELF Ethno‐Linguistic Fractionalization Index
EPRDF Ethiopian People's Revolutionary Democratic Front
ERHS Ethiopian Rural Household Survey
ESE Ethiopian Seed Enterprise
ETB Ethiopian Birr
FAO Food and Agriculture Organization of the United Nations
FGGD Food Insecurity, Poverty and Environment Global GIS Database
FTF Feed the Future
GDP Gross National Product
GFP Gemeinschaft zur Förderung der privaten deutschen Pflanzenzüchtung e.V.
GHI Global Hunger Index
GIS Geographic Information System
GIZ Gesellschaft für Internationale Zusammenarbeit
GoE Government of Ethiopia
GTP Growth and Transformation Plan
ha Hectare
HICE Household Income and Consumption Expenditure Survey
iDE International Development Enterprises
IFC International Finance Corporation
v
IFPRI International Food Policy Research Institute
ILO International Labour Organization
K‐S Kolmogorov‐Smirnov
MFI Microfinance Institution
MICS Multiple Indicator Cluster Survey
MoA Ministry of Agriculture
MoFED Ministry of Finance and Economic Development
MoI Ministry of Industry
NBE National Bank of Ethiopia
NGO Non‐Governmental Organization
NIE New Institutional Economics
OECD Organisation for Economic Co‐operation and Development
OSE Oromia Seed Enterprise
p.a. per annum
PIF Policy and Investment Framework
Plc Private Limited Company
PPP Purchasing Power Parity
PSNP Productive Safety Net Programme
Qt Quintal
RARI Regional agricultural research institute
SEDAC Socioeconomic Data and Applications Center
SNNP Southern Nations and Nationalities and Peoples’ Region
SSE South Seed Enterprise
TC Transaction costs
UN United Nations
UN DESA United Nations Department of Economic and Social Affairs
UNAIDS Joint United Nations Programme on HIV/AIDS
UNDP United Nations Development Programme
UNESCO United Nations Educational, Scientific and Cultural Organization
UNFPA United Nations Population Fund
UN‐HABITAT United Nations Human Settlements Programme
USD US Dollars
WBCSD World Business Council on Sustainable Development
WFP United Nations World Food Programme
WHO World Health Organization
WMS Welfare Monitoring Survey
WRI World Resources Institute

vi
AcknowledgementsThis work would not have been possible without the support of many people. First and foremost I want to thank Prof. Dr. Joachim von Braun who guided me through this work and provided invaluable support. I also want to thank Dr. Franz Gatzweiler for his support and comments to this study. I am grateful to Heike Baumüller who helped me with very useful comments and motivational support throughout the last three years. Many thanks to my Ethiopian colleagues at ZEF, especially Dawit Diriba Guta and Tigabu Degu Getahun, who supported me with many useful comments and contacts in Ethiopia. Thanks also go to Valerie Graw who developed parts of the mapping methodology that is used in this study. Guido Luechters helped me to solve many statistical problems and with his incredible positive spirit.
Of course, this work mostly benefits from all the valuable insights I gained in Ethiopia. There, many people dedicated their time and other resources to share information with me and supported my research. I especially want to thank Dr. Dawit Alemu for sharing information with me during and after my visits to Ethiopia and for providing very useful comments on an earlier draft of this book. Dawit Asha in Ofa has greatly helped me during the first days of my field research. I am also indebted to Dr. Assefa Admassie and his team at EEA for their support, especially to Dr. Seid Nuru Ali for his motivating words during my field research. Thanks also go to many, many other Ethiopians who supported me at various stages of my research. Without their hospitality I would not have been able to write this book.
Thanks to all my friends for all they give me. I am deeply grateful to A and Y for being a constant source of inspiration and optimism – an invaluable gift in general and a refreshing and energy‐sustaining counterbalance to the sometimes depressing content of my work in particular. Finally and most importantly, I want to thank my parents and my husband. There are no words to express my gratitude to them for their steady and unconditional support.
Financial support by the Bill & Melinda Gates Foundation is gratefully acknowledged. The Johanna und Fritz Buch Gedächtnis‐Stiftung generously supported the publication of this book, which is also gratefully acknowledged.
Abstract
vii
AbstractThe present research analyzes the role that the private sector can play in reducing poverty and marginality in Ethiopia by providing improved agricultural inputs to marginalized poor farmers. Two important insights motivate the present research: one is the rise of various innovative business approaches in the last years that aim at reducing poverty or contributing to the solution to other societal problems. These innovative business approaches add social returns to a firm’s bottom line and thus provide additional reasons for companies to invest in agricultural markets in poor countries like Ethiopia apart from pure profit seeking.
The other insight motivating this research is that the very poorest have long not benefitted from poverty reduction efforts. In that context, marginality has been identified as a root cause of poverty and its persistence. Marginality helps to explain why certain groups are left behind while other parts of a society prosper. Thus, the concept of marginality is presented and applied to the context of Ethiopia. Using Geographic Information System (GIS) software, a marginality map of Ethiopia is created by overlaying seven indicators capturing different aspects of marginality. Results show that marginality is a severe and widespread problem in Ethiopia with more than 40 million people being severely marginalized. Marginality hotspots are found in Amhara and SNNP. Interestingly, marginality hotspots are not correlated with agro‐ecological zones and are ethnically more homogeneous than non‐hotspot areas. Furthermore, areas posing specific business opportunities and challenges are identified based on information on population density, quality of road and mobile phone connection and farming systems. This area classification reveals that companies catering to the marginalized poor need to go the ‘last mile’ within areas exhibiting special business challenges and opportunities rather than investing in separated areas.
After having identified and located the marginalized poor in Ethiopia, survey data that is representative for the most marginalized in the country is analyzed concerning purchasing behavior and needs expressed by the marginalized poor. Using descriptive statistics it can be shown that the amount of cash the marginalized poor have at hand varies considerably across regions but not very much within regions. The marginalized poor have in common that they spend a high percentage of their expenditures on food (around 70%), followed by commodities such as kerosene and clothes. The three most bought products are salt, kerosene and soap. This translates into considerable market sizes of these products. The survey also shows that the marginalized poor have diversified needs. While most of them name higher‐order food products like dairy products or meat as most urgent unsatisfied needs, agricultural items, including livestock, as well as housing and commodities like clothing are also mentioned frequently.
That people mention agricultural inputs as one of their most urgent unsatisfied needs can be explained by the fact that productivity of smallholder farmers is very low in Ethiopia and improved agricultural inputs are in short supply. Thus, an institutional analysis of the seed, fertilizer and agro‐chemical markets is carried out to understand the frictions on these markets and to assess possibilities for the private sector to contribute to the reduction of poverty and marginality through adequate investments. Analyzing more than 60 expert interviews carried out in Ethiopia, it turns out that the market for seeds of major crops is highly regulated by the government, with institutions favoring public companies. Based on a de facto monopoly on breeder seed, Ethiopian seed companies depend on the government for most of their operations, including price setting. One implication of this system is that all seed is distributed via one channel, which leads to a lack of traceability of the seed and, as a result, lacking accountability for seed producers. Moreover, it causes a lack of agro‐dealers as seed distribution is exclusively carried out by cooperatives and cooperative unions on behalf of the government. Thus, cooperatives and Development Agents spend much of their time on demand assessments and seed distribution although they actually have other tasks. The only exceptions from the strict government control are international seed companies that produce their own varieties.
Abstract
viii
Institutions favoring public organizations have led to a situation, in which fertilizer importation and distribution is completely under government control, with no private companies being active on this market. The markets for fruit and vegetable seeds and agro‐chemicals, however, are less regulated. A multitude of small private firms engages in import and distribution. Nevertheless, there is a shortage also for these products that is mainly caused by a lack of access to finance. Due to the absence of an agro‐dealer network in the country, the availability of fruit and vegetable seeds and agro‐chemicals is very limited outside urban centers as small traders do not have the capacity to invest in marketing infrastructure.
To motivate private companies to invest in agricultural markets and to cater to the marginalized poor, several institutional changes are necessary. For seed companies, access to breeder seed, the assignment of more land and the availability of plant breeders are crucial elements. Especially access to breeder seed implies the ability for companies to determine full‐fledged firm strategies, including price determination and marketing strategies. For fertilizer companies, a fair tendering process and the abolishment of import quantity prescriptions are of major importance. Such well‐designed market liberalization efforts are likely to result in the creation of an agro‐dealer network as a positive externality that would also benefit traders of fruit and vegetable seeds and agro‐chemicals. For all companies, access to finance at reasonable cost, especially with lower collateral requirements, is essential to expand operations.
While companies can be expected to push for changes, the current system and the self‐conception of the Ethiopian government require the government to be in the lead in the efforts for changes. Successful role models, support by other stakeholders and successes with investment incentive schemes in other sectors in Ethiopia could encourage the government to gradually liberalize the market. If institutional changes are enacted to partly liberalize the market, it needs to be ensured that the marginalized poor, who currently benefit from the government’s equity approach, are included in the value chains even if companies do not operate with innovative business approaches. However, as the poor constitute a very large share of the market, Ethiopia may even be a leading example for companies in how to apply business models catering to the poor as companies are forced to adjust to this target group if they want to develop the largest part of the market.
Zusammenfassung
ix
ZusammenfassungDie vorliegende Studie analysiert die Rolle, die der Privatsektor durch Produktion und Verkauf von landwirtschaftlichen Inputs bei der Reduzierung von Armut und Marginalität in Äthiopien spielen kann. Zwei wichtige Erkenntnisse motivieren die Studie: zum Einen sind dies innovative Geschäftsmodelle, die in den letzten Jahren entwickelt wurden. Diese Geschäftsmodelle zielen auf die Reduzierung von Armut oder die Lösung eines anderen gesellschaftlichen Problems ab. Sie fügen der betriebswirtschaftlichen Gewinnrechnung soziale Renditen zusätzlich zu finanziellen Gewinnen hinzu. Dadurch erweitern sie die Gründe für ein Unternehmen, in landwirtschaftliche Märkte in armen Ländern wie Äthiopien zu investieren.
Die zweite Erkenntnis ist, dass die Ärmsten lange Zeit nicht von Fortschritten bei der Armutsbekämpfung profitiert haben. In diesem Zusammenhang wurde Marginalität als Grundursache für Armut und den Fortbestand von Armut identifiziert. Marginalität hilft zu erklären, warum manche Gruppen zurückgelassen werden, während andere Teile einer Gesellschaft prosperieren. Vor diesem Hintergrund wird das Konzept der Marginalität vorgestellt und auf den äthiopischen Kontext angewendet. Mithilfe Geographischer Informationssysteme wird eine Marginalitätskarte für Äthiopien erstellt, die sieben verschiedene Indikatoren übereinanderlegt, die verschiedene Aspekte von Marginalität repräsentieren. Die Ergebnisse zeigen, dass Marginalität ein ernstes und weit verbreitetes Problem in Äthiopien darstellt: mehr als 40 Millionen Menschen sind sehr marginalisiert. Marginalitätshotspots befinden sich in Amhara und in SNNP. Interessanterweise sind Marginalitätshotspots nicht mit agro‐ökologischen Faktoren korreliert und ethnisch homogener als andere Gegenden. Zudem werden mithilfe von Daten zu Bevölkerungsdichte, Straßen‐ und Mobilfunknetzen und agrarwirtschaftlichen Systemen Gegenden identifiziert, die bestimmte gemeinsame Merkmale haben bezüglich ihrer Möglichkeiten und Herausforderungen für Investitionen aus dem Privatsektor. Die Klassifizierung zeigt, dass Firmen, die die marginalisierten Armen erreichen wollen, die ‚letzte Meile‘ in Gegenden mit gewissen Merkmalen überwinden, aber nicht in separaten Gegenden investieren müssen.
Nach dieser Identifizierung und Lokalisierung der marginalisierten Armen in Äthiopien werden Daten einer Haushaltsbefragung ausgewertet, die repräsentativ für die am meisten marginalisierten sind. Diese Daten werden bezüglich der Kaufkraft, des Kaufverhaltens und der Wünsche, die die Marginalisierten haben, analysiert. Mit Methoden deskriptiver Statistik kann gezeigt werden, dass die Geldbeträge, die die marginalisierten Armen zu Verfügung haben, deutlich zwischen, aber relativ wenig innerhalb der beiden Regionen schwanken, in denen die Befragung durchgeführt wurde. Die marginalisierten Armen haben gemeinsam, dass sie einen Großteil des ihnen zur Verfügung stehenden Geldes für Nahrungsmittel ausgeben (ca. 70%), gefolgt von Gütern wie Petroleum und Kleidung. Die drei meist gekauften Produkte sind Salz, Petroleum und Seife. Dies führt zu beträchtlichen Marktgrößen für diese Produkte. Die Haushaltsdaten zeigen zudem, dass die marginalisierten Armen sehr verschiedene Bedürfnisse haben. Während die meisten Nahrungsmittel, insbesondere Milchprodukte und Fleisch, als dringendstes unbefriedigtes Bedürfnis nennen, werden auch landwirtschaftliche Inputs, einschließlich Nutztieren, eine Verbesserung der Behausung und Güter wie Kleidung häufig genannt.
Dass Menschen landwirtschaftliche Inputs als eines der dringendsten unbefriedigten Bedürfnisse nennen kann dadurch erklärt werden, dass die Produktivität von Kleinbauern sehr gering und landwirtschaftliche Inputs knapp sind. Aus diesem Grund wird eine Analyse der Institutionen durchgeführt, die die Saatgut‐ und Düngemittelmärkte regeln, um die Friktionen auf diesen Märkten zu verstehen und Möglichkeiten zu eruieren, wie der Privatsektor durch geeignete Investitionen zur Reduzierung von Armut und Marginalität in Äthiopien beitragen kann. Die Analyse von mehr als 60 in Äthiopien geführten Experteninterviews ergibt, dass die Märkte für Saatgut bestimmter von der Regierung ausgewählter Pflanzen sehr streng reguliert und von Institutionen geformt sind, die staatliche Saatgutfirmen begünstigen. Aufgrund eines faktischen Monopols staatlicher Forschungsinstitute auf Samen, die für die Saatgutproduktion benötigt werden, sind private
Zusammenfassung
x
Saatgutunternehmen von der Regierung abhängig und verpflichtet, das gesamte produzierte Saatgut an die Regierung zu verkaufen zu Preisen, die von der Regierung bestimmt werden. Eine Folge davon ist, dass alles Saatgut auf Anweisung der Regierung von Kooperativen und Kooperativenverbänden über einen einzigen Verteilungskanal vermarktet wird. Dies führt dazu, dass die Herkunft des Saatguts nicht zurückverfolgt werden kann und Unternehmen deshalb nicht zur Rechenschaft gezogen werden können, falls ihr Saatgut von schlechter Qualität ist. Außerdem führt dieser Verteilungsmechanismus dazu, dass es kein Händlernetzwerk für landwirtschaftliche Inputs im Land gibt und dass Kooperativen und Mitarbeiter staatlicher landwirtschaftlicher Beratungsdienste viel Zeit damit verbringen, die Nachfrage zu erfassen und Saatgut zu verteilen, obwohl sie eigentlich andere Aufgaben haben. Ausgenommen von den strengen Regelungen sind die zwei internationalen Saatgutfirmen in Äthiopien, da diese eigene Sorten produzieren.
Aufgrund strenger Regulierungen, die den Privatsektor benachteiligen, sind Düngemittelimporte und –verteilung vollständig in staatlicher Hand, kein einziges privates Unternehmen ist auf diesem Markt aktiv. Die Märkte für Obst‐ und Gemüsesaatgut sowie Agrochemikalien sind hingegen kaum reguliert. Eine Vielzahl kleiner privater Firmen importiert und verkauft diese Inputs. Durch das Fehlen eines Händlernetzwerkes ist die Verfügbarkeit dieser Inputs außerhalb urbaner Zentren jedoch sehr eingeschränkt, da die Firmen nicht die Kapazitäten haben, eigene Vermarktungsnetzwerke aufzubauen.
Um Anreize für Firmen zu schaffen, in landwirtschaftliche Märkte zu investieren und die marginalisierten Armen in ihre Wertschöpfungsketten einzubeziehen, sind verschiedene institutionelle Veränderungen nötig. Saatgutfirmen sind auf Zugang zu Zuchtsaatgut und Land sowie die Verfügbarkeit von Pflanzenzüchtern angewiesen. Insbesondere der Zugang zu Zuchtsaatgut ist von zentraler Bedeutung, da dies den Firmen ermöglichen würde, eine komplette Geschäftsstrategie zu entwickeln, einschließlich Preissetzung und Marketingstrategien. Für Düngemittelfirmen sind ein gerechter Ausschreibungs‐ und Angebotsprozess und die Abschaffung von Mengenvorschriften beim Import erforderlich, um wieder in den Markt einzusteigen. Wohlüberlegte und dosierte Schritte zur Liberalisierung der Märkte hätten auch die Schaffung eines Händlernetzwerkes zur Folge, was die Verbreitung von Obst‐ und Gemüsesaaten und Agrochemikalien begünstigen würde. Zugang zu günstigen Krediten, insbesondere die Lockerungen von Bestimmungen zu Sicherheiten, ist eine zentrale Voraussetzung für alle Unternehmen, wenn sie ihre Aktivitäten erweitern wollen.
Während der Privatsektor auf institutionelle Änderungen drängen kann, erfordert die aktuelle Situation und das Selbstverständnis der äthiopischen Regierung, dass der Staat bei Änderungen federführend ist. Erfolgreiche Reformen in anderen Ländern, Unterstützung von verschiedenen Akteuren in Äthiopien und positive Erfahrungen mit Investitionsanreizen in anderen Wirtschaftssektoren in Äthiopien können die Regierung positiv beeinflussen, landwirtschaftliche Märkte schrittweise zu liberalisieren. Wenn institutionelle Veränderungen zur Liberalisierung durchgesetzt werden, muss jedoch sichergestellt werden, dass die marginalisierten Armen, die momentan vom Gleichheitsansatz der äthiopien Regierung profitieren, nicht zurückbleiben und in die Wertschöpfungsketten und Absatzmärkte der Unternehmen integriert werden, auch wenn diese nicht mit innovativen Geschäftsmodellen operieren. Da jedoch die Armen einen Großteil des Marktes ausmachen, kann Äthiopien sogar ein führendes Beispiel dafür werden, wie Geschäftsmodelle modifiziert werden können, um die Armen einzubeziehen, da Firmen gezwungen sind, die Armen als Zielgruppe zu sehen, wenn sie den Großteil des Marktes erschließen wollen.
Introduction
1
I. Introduction
I‐1 Backgroundandmotivationforthestudy
Without questioning that progress concerning poverty reduction has been made, these achievements cannot hide the fact that still 870 million people are chronically undernourished (FAO, 2012a), nearly 800 million youths and adults are illiterate (UNDP, 2012), 2.6 billion people lack access to basic sanitation and 900 million lack access to clean water (WHO and UNAIDS, 2010), 924 million are not adequately sheltered (UN‐HABITAT, 2003), more than 1.4 billion people lack access to electricity (OECD, 2012) and 215 million children are child laborers (ILO, 2013). These numbers leave little doubt that efforts towards eliminating poverty need to be increased.
For a long time the poorest have not benefitted from the successes in poverty reduction but have been left behind (von Braun et al., 2009). In certain parts of the world the number of extreme poor people, i.e. those living on less than $1.25 per day, increased between 1990 and 2008: while some regions, most notably East Asia and the Pacific, saw a decline in the absolute number of extreme poor people, the number of extreme poor people in Sub‐Saharan Africa increased by about 96 million, from 290 million in 1990 to 386 million in 2008. Yet, the share of extremely poor in the total population of the region decreased from 56.5% to 47.5% (Ahmed et al., 2007a; von Braun et al., 2009).
Looking beneath the $1.25‐poverty line reveals that still 70% of the ultra‐poor (at an updated ultra‐poverty line of $0.63 a day) are located in Sub‐Saharan Africa. Compared to other regions, their share in the total population is decreasing only very slowly: from 24.5% in 1990 to 20% in 2008 (Ahmed et al., 2013). However, global poverty reduction in the time span between 1990 and 2008 was equal between people living somewhat below the $1.25‐poverty line and the ultra‐poor (Ahmed et al., 2013).
Despite these achievements latest data shows that globally 1.3 billion people lived on less than $1.25 a day in 2008 (The World Bank, 2012a) and approximately one billion people are going hungry (Conway, 2012). These very poorest are not recognized as investment opportunity (von Braun, 2010) and remain underserved, lacking access to basic goods and services.
Recent research that attempted to understand why the poorest have long been and still often are left behind led to the development of the concept of marginality (Gatzweiler et al., 2011; von Braun and Gatzweiler, 2013; see also Part II). Marginality has been found to be a root cause of poverty (Gatzweiler et al., 2011; von Braun et al., 2009). It is defined “as an involuntary position and condition of an individual or group at the edge of social, economic, and ecological systems, preventing the access to resources, assets, services, restraining freedom of choice, preventing the development of capabilities, and causing extreme poverty” (Gatzweiler et al., 2011, p. 3). The reasons why the marginalized poor are not benefitting from general economic growth and interventions that aim at reducing poverty are, amongst others, that the marginalized poor live in unfavorable areas and thus suffer from poor agro‐ecological conditions and from meager or no transport infrastructure, they may be subjects of social or ethnic discrimination or have a low social status in their community or wider society (Gatzweiler et al., 2011). These conditions require special poverty reduction measures for these disadvantaged groups. Yet, relatively little is known about these people living in extreme deprivation (von Braun et al., 2009).
This raises the question how and by whom already existing poverty reduction measures can be improved and new ones added in order to reach out to the marginalized poor. To answer this question, the present research catches on a new idea that is gaining momentum at the moment. This idea is that business has an enormous power to solve social problems if it overcomes the narrow understanding of capitalism and the “outdated approach of value creation that has emerged over the past few decades” (Porter and Kramer, 2011, p. 4). New approaches like ‘social business’ as
Introduction
2
developed by Muhammed Yunus (Yunus, 2007), ‘inclusive business’ (UNDP, 2008) or the “Shared Value” concept developed by Porter and Kramer (2011, 2006) as well as a rapidly increasing number of successful social entrepreneurs have opened new ways for the private sector to combine profit and social interests such as poverty reduction (see also Baumüller et al., 2013 and Section I‐2).
For decades firms have mainly been seen as causing or worsening global problems like climate change and poverty by polluting the environment, depleting resources and employing people in poor countries under precarious and dangerous conditions. Development researchers, governments and most business people themselves considered jobs and tax payments as all that firms owe to society. These narrow expectations have significantly changed. Not only have laws and regulations concerning environmental pollution and labor standards become stricter, firms have also acknowledged the need to cooperate concerning global issues such as health care and agriculture. This, for instance, led to the release of patents that previously hindered research on medicines or plants that are of little commercial interest to companies but essential for many poor people. Lifting such patent or plant variety protection enabled public research and large scale production (see e.g. Merges (2004) for a general overview and related strategic interests of companies; see also e.g. www.goldenrice.org for the concrete case of free of charge access to intellectual property needed to breed Golden Rice).
Moreover, firms are now taking over an active role in poverty reduction. Companies from different sectors invest in markets such as telecommunication, health care and food products in poor countries, explicitly aiming at including poor people as producers or consumers in their value chains. By sourcing from smallholder farmers, selling products in small quantities and at low prices, by developing distribution channels that extent markets to poor people and those living in remote areas (see e.g. Shukla and Bairiganjan, 2011; Nelson et al., 2009) and by inventing new products for underserved markets, e.g. medicines that can be taken on an empty stomach or without water (see e.g. Haupt and Krämer, 2012), companies have achieved to combine the needs of poor people with business interests.
Yet, after long years with negative headlines about social and environmental damages caused by firms in all parts of the world, many are skeptical about the merits of private companies targeting the poor. Concerns reach from the economic viability of such projects (Simanis, 2010) to worries about the ability of the poor to make rational decisions when having an increased set of choices, including offers such as alcoholic drinks or tobacco (Banerjee and Duflo, 2007; Karnani, 2009a) to fundamental questions concerning the kind of development that is promoted (Bendell, 2005). However, strict control of firm’s (and any other stakeholder’s) activities through independent parties has always been needed and is especially important when the weakest parts of a society are involved. But given this enclosure, there are good reasons to expect that the poor will benefit from new competitive markets, especially from a reduction of the so‐called ‘poverty penalty’ and an increased set of choices (Prahalad, 2010), which should both improve with increased competition on the supply side. As these changes in the role of business and the related concerns are central to this study, they are discussed in more detail in Section I‐2.
Generally, the poorest and marginalized are not necessarily the target group one would think of when assessing new markets for the private sector since they are expected to have (and are partially defined by) low purchasing power. However, there are good reasons to search for possible links between the two groups: people who are underserved so far can benefit from access to products and services and companies can develop new markets and make profits (Prahalad, 2010; von Braun, 2010). Not many years ago, only very few people thought about making profits by serving poor people. Visionaries introduced this idea that is now widely discussed and experimented with.1 A plausible next step is to explore how far business can be pushed, i.e. whether these activities can also
1 See e.g. the initiatives by firms of all sizes that are presented on platforms like Business Call to Action (www.businesscalltoaction.org) and Business Fights Poverty (www.businessfightspoverty.org).
Introduction
3
be extended to include the extreme poor and marginalized – a group that is in great need of poverty reduction interventions as has been explained (see also Part II and III).
Ethiopia is a country in which investments in the reduction of poverty and marginality are urgently needed. More than 80% of the 86 million inhabitants live in rural areas and in severe poverty (Alkire and Santos, 2010; see also section I‐6 and Part II). The great majority of them depends as smallholder farmers on agriculture for their livelihoods (Central Statistical Agency (CSA), 2012a). These smallholders suffer from a very low productivity (see e.g. Seyoum Taffesse et al., 2011). To increase productivity, however, improved inputs like seeds, fertilizer and better farming practices are crucial (see e.g. von Braun et al., 1992; Conway, 2012; The Montpellier Panel, 2013).
The agricultural input sector in Ethiopia is currently not able to satisfy the demand for inputs like improved seeds and fertilizer (see e.g. Spielman et al., 2011). Several seed companies are operating in the country but still demand for seed is far greater than supply (Ministry of Agriculture (MoA), 2013). If receiving inputs, farmers frequently suffer from late delivery of seed and fertilizer caused by complicated distribution mechanisms and poor transportation infrastructure. Thus, there is a need for increased supply and more efficient distribution systems in the country (Dercon and Vargas Hill, 2009; Rashid et al., 2007; see Part IV‐3).
Empirical studies suggest that the current situation is not the efficient outcome of demand and supply meeting at a certain price but that institutions drive up transaction costs leading to insufficient supply of and unmet demand for agricultural inputs (Alemu, 2011, 2010; Bishaw et al., 2008; Louwaars, 2010; Spielman et al., 2011). This is a Pareto‐inefficient outcome (Arrow, 1969) that – from an allocation theoretical perspective – is considered to be a market failure (Bator, 1958; Spulber, 1999; this argument is discussed in detail in Section I‐4).
Against this background, a careful analysis of the institutional setting and the transaction costs arising on agricultural input markets is needed to get a better understanding of the reasons for the observed frictions on these markets and to assess possible solutions. Only if these costs are reduced, there is a chance that the private sector can expand activities to make products also accessible to the marginalized poor.
To explain the background of the present study and the reasons why it is justified to look at the role of the private sector in reducing poverty among the marginalized poor although at first glance it may seem to be pointless to expect companies to do business with the very poorest, innovative business approaches are presented in more detail in the next section.
I‐2 Innovativeapproachesandnewroles:businessinalteration2
In the last two decades, discussions about the role that the private sector should play in a society have been shifting towards ascribing business a responsibility to contribute to the solutions to societal problems such as climate change or poverty. These claims came from outside and inside the private sector and have led to the development of several business approaches that aim at contributing to poverty reduction (see Box 1 and Figure 1).
These changes base on a long history of debates on the role of businesses in society, which some trace as far back as India’s Kautily in the 4th century BC or Cicero in Rome (Blowfield and Frynas, 2005). In the time of the Industrial Revolution, entrepreneurs like John Cadbury, Robert Owen and Léon Harmel took measures towards solving the problem of feeding, clothing and employing a great number of people, trying to improve the working and living conditions of the workers and their families (Boddice, 2009; see also Baumüller et al., 2013).
2 This section relies heavily on Baumüller et al. (2011) and Baumüller et al. (2013).
Introduction
4
Over the past four decades, the business world has seen a rapid evolution from ‘command and control’ approaches to addressing environmental and social issues towards the pro‐active application of business strategies to pursue social goals. Especially in the 1990s, the strict separation between business and philanthropy got weaker and new approaches to combining the two through corporate partnerships with non‐governmental organizations (NGOs), strategic philanthropy and other forms of social innovation emerged.
Box 1: A short overview over innovative business approaches3
The introduction of the ‘bottom of the pyramid’ (BoP) concept by Prahalad and Hart in 2002 marks a milestone in the debates around the role of business in promoting social goals and poverty reduction. The authors were the first pointing at the ‘fortune’ that lies at the 4 billion strong bottom of the income pyramid. The BoP market is usually defined by income, with the annual income cut‐off ranging from $360 to $3,260 (see also Section III‐2.1). People comprising the ‘base of the pyramid’ have significant unmet needs, including access to finance, housing, water, sanitation, electricity and health services (Hammond et al., 2007) while often being subject to a ‘poverty penalty’ in the form of higher prices and lower quality of goods and services compared to more affluent consumers (Gradl and Knobloch, 2010). The argument of the BoP approach is that although individual consumers have low purchasing power, the sheer size of the market makes it still very lucrative (Prahalad, 2010).
‘Inclusive business’ or ‘inclusive markets’ emphasize the benefits of engaging the poor along the entire supply chain. While the BoP approach focusses on the poor as consumers, inclusive business models include the poor on the demand side as clients and customers and on the supply side as employees, producers and business owners (Jenkins et al., 2010; UNDP, 2008). Following this approach, the United Nations Development Programme (UNDP) set up the Growing Inclusive Markets Initiative in 2006 with the aim of better understanding “how the private sector can contribute to human development and to the Millennium Development Goals” (UNDP, 2008, p. v).
With their concept of ‘Shared Value’, Porter and Kramer (2006, 2011) take the argument for the role of the private sector in advancing human development and poverty alleviation one step further by arguing that for strategic, profit and social reasons it is in fact in the interest of all business to promote social values. Thus, rather than creating special ‘social’ entities that address issues such as poverty or environmental damage, they prompt companies to bring “business and society back together” (Porter and Kramer, 2011, p. 4) by addressing societal and environmental concerns related to their products and designing production processes that benefit the workers and their families. Porter and Kramer (2006, 2011) argue that it is not a matter of altruism to commit to this change but a strategic advantage that pays off in the mid‐ to long‐term.
In contrast to the aforementioned approaches, for which profit making remains a primary goal, a ‘social entrepreneur’ uses entrepreneurial principles to organize, create, and manage a venture with the primary aim of bringing about social change. Unlike a business entrepreneur who typically measures performance in terms of profit and return, a social entrepreneur measures success in terms of progress towards the creation of social value (Dees, 1998; Haugh, 2006; Nicholls, 2006; Thompson, 2002). The explicit and central social mission of social entrepreneurs is reflected in the emphasis on projects designed to improve people’s quality of life by focussing mainly on the sectors of health, nutrition, education, the creation of stable productive jobs and training (Bornstein, 2007; see also Certo and Miller, 2008; Dees, 1998; Guclu et al., 2002; Mair and Martí, 2006; Nicholls, 2006; Seelos and Mair, 2007).
The concept of ‘social business’ was mainly shaped by Muhammed Yunus, the founder of Grameen Bank in Bangladesh, who argues that for a ‘social business’ the creation of social value is the main purpose of business activities, not just a complement to profit creation (e.g. Yunus, 2007). The boundary between social entrepreneurship and social business is not quite clear. Connotations tend towards calling non‐profit enterprises ‘social enterprise’ and for‐profit enterprises ‘social business’. However, there is no agreement on this partition in the literature (Baumüller et al., 2013).
3 The content of this box relies heavily on Baumüller et al. (2011). More detailed information about these approaches, empirical examples and corresponding innovations in finance can also be found there.
Introduction
5
Against this background, the proposition has been gaining ground that firms and investments can still be profitable and possibly even improve a firm’s competitive position when the creation of social value is considered as core business activity (Porter and Kramer, 2011). This marks an important step on the path of the private sector from ‘being less bad’ towards ‘being more good’ (McDonough and Braungart, 2002). In the meantime, the recognition that governments and traditional development assistance have not been able to solve the still alarming problem of poverty has also been growing. Indeed, the perceived failures and inefficiency of many governmental and non‐governmental development programs and official development aid have been more and more criticized in recent years (e.g. Easterly, 2007; see also Baumüller et al., 2013).
While the potential of business approaches to target the poor that live close to the poverty line is increasingly being recognised, the question remains to what extent business can also help the extreme poor. In his influential book The Fortune at the Bottom of the Pyramid, C.K. Prahalad acknowledges, that “[t]here is a segment of the 4 billion who are so destitute, so deprived, and so consumed by war and disease that they need other forms of help“, such as government subsidies, multilateral aid or philanthropy (Prahalad 2010, p.8). But Prahalad adds that “[e]ven here, our goal should be to build capacity for people to escape poverty and deprivation through self‐sustaining market‐based systems” (ibid.).
Critique on innovative business approaches
Innovative business approaches are not free of critique. Several authors doubt that the poor are the “value‐conscious consumers” Prahalad (2010, p. 25) sees in them (Karnani 2009; Simanis 2010). Karnani (2009) points out that Prahalad (2010) does not provide any empirical support for this assertion but rather focuses on the business ideas. While basing the argumentation of his book on these assumptions about BoP consumers, Prahalad (2010) does not deliver any data about the behavior of the poor as consumers or entrepreneurs. As will be discussed in Part III, this is true for most of the BoP literature.
Figure 1: Innovative business approaches to reduce poverty between social value and profit focus
Source: Baumüller et al. (2013), p. 334
Introduction
6
Karnani (2008) criticizes that seeing the poor as value‐conscious and smart consumers is “romanticizing”. He claims this view to be “empirically false” and morally problematic (Karnani, 2008, p. 49). Since the poor are often illiterate and access to information is limited, information asymmetries between producers and consumers are often high and lead to dangerous power imbalances that can hit the poor considerably as their resilience is low. Furthermore, he cautions against the danger that the perception of the poor as value‐conscious consumers may lead to a neglect of “legal, regulatory, and social mechanisms to protect the poor who are vulnerable consumers” (p. 49) and invites governments to illegitimately shift parts of their responsibility for poverty reduction to the private sector.
Other authors stress that reducing poverty by increasing mass consumption is somewhat paradox if this goes hand in hand with selling all kinds of products in single plastic sachets in a context of global climate change (Cross et al., 2012). Similarly, Bendell (2005) not only questions the environmental impact of small package sizes but raises ethical concerns about the kind of development that is promoted by creating demand for luxury products like hair shampoo among the poorest with marketing techniques suggesting that traditional and local products are not good enough for somebody aiming at being modern and a bit more like the richer people.
Simanis' (2012) skepticism against the BoP euphoria roots in another concern. He contends that the BoP is not actually a market. Simanis (2010, 2012) argues that there is no market for many products that are deemed to be useful for the poor, e.g. means to clean water, stoves or electricity, since a consumer market is a lifestyle built around a product. Yet, the poor have not adjusted their behavior and budgets to integrate these products into their lives. Thus, Simanis (2010, 2012) argues that the BoP is not the big untapped market that it is often claimed to be but that a market must first be created. This makes business at the BoP much more difficult and explains why even textbook‐like designed initiatives like Procter & Gamble’s water purification product PUR failed. PUR was co‐designed by the target group, easy to use, shelf‐stable, cheap and intensively promoted together with a locally established organization and still failed to yield the expected returns to investment. The product was finally shifted to the philanthropic arm of the company when even after several years of intensive marketing no market for the product had evolved (Seagle and Christensen, 2011; Simanis, 2012).
These points of critique hint at important shortcomings of and challenges for business approaches catering to the poor. Yet, none of them generally questions that the private sector can (and should) contribute to poverty reduction by integrating poor people into their value chains. However, this general agreement about the necessity of private sector engagement is not to be confused with considering the private sector as silver bullet, which is also acknowledged by most authors (see e.g. Prahalad, 2010; Hammond et al., 2007). Outcomes in terms of improved well‐being of the poor still have to be proven and hinge on productive cooperation and (mutual) control of different stakeholders, including governments and NGOs, as will be discussed in Part I.
Implications and the way forward
As outlined in Box 1, there is a wide variety of innovative business approaches that all have their strengths and weaknesses to contribute to poverty reduction, especially to reach out to the marginalized poor. Their ability to extend their outreach beyond the lower middle‐classes depends on factors such as profit focus and access to finance.4
It is unrealistic to expect companies to be able to reach all of the extreme poor and marginalized. There are limits for any individual or type of stakeholder to overcome extreme poverty and marginality. However, these limits are context specific and should not be drawn too restrictively.
4 For a detailed discussion of these advantages and disadvantages see Baumüller et al. (2011)
Introduction
7
Most of the presented approaches are relatively new and still need to be evaluated. Such evaluations can then inform an assessment of how such approaches could best help to reduce extreme poverty and marginality, whether they are replicable and can be scaled up (see also Baumüller et al., 2013, 2011).
None of the presented business approaches will succeed by itself but will require equally innovative cooperation with public authorities, development organization and above all, the extreme poor themselves. The last years have shown the rise of various such cooperations, e.g. the Business Alliance Against Chronic Hunger initiated by the World Economic Forum in 2006 (World Economic Forum, 2012a), the Global Alliance for Improved Nutrition (GAIN, 2012), the Alliance for a Green Revolution in Africa (AGRA, 2012a), which was also initiated in 2006, Grow Africa (Grow Africa, 2012), A New Vision for Agriculture (World Economic Forum, 2012a) and most recently the New Alliance for Food Security and Nutrition (henceforth ‘New Alliance’), which was formed in May 2012 as a partnership between G8 nations, African countries and the private sector (The Chicago Council on Global Affairs, 2012; The White House, 2012). On the initiating symposium of the New Alliance, the President of the United States, Barack Obama, his Secretary of the State, Hillary Rodham Clinton, the Prime Minister of Ethiopia at the time, Meles Zenawi, the President of Ghana at the time, John Atta Mills, and the President of Tanzania, Jakaya Mrisho Kikwete, as well as CEOs of various fortune 500 companies were present and discussed the need for and the advantages of private sector investments for poverty reduction. The private sector pledged three billion US Dollars (USD) for investments in the agricultural sector in various African countries (The Chicago Council on Global Affairs, 2012). The explicit aim is to “lift 50 million people out of poverty over the next 10 years through inclusive and sustained agricultural growth” (www.usaid.gov/news‐information/press‐releases/advancing‐new‐alliance‐food‐security‐and‐nutrition). The initiative initially focussed on the three African countries of Ghana, Ethiopia and Tanzania, but now already extended to Mozambique, Burkina Faso Côte d’Ivoire.
These alliances are supposed to make a big step forward towards increased private sector engagement for poverty reduction. However, as has also been pointed out by various stakeholders, success in form of measurable improvements for the targeted populations still needs to be proven, even more so since farmers are not involved in most of these alliances, which causes fears, e.g. that food sovereignty may be threatened (Cissokho, 2012).
Moreover, the question arises to which extent the promises made by business are really translated into action. Without being too strict with and expecting too much from the private sector, it is at least surprising that two years after the initiating symposium, still 24 out of 77 firms do not mention this new alliance on their webpage, among them large corporation like BASF, PepsiCo, Diageo and Unilever.5 17 of the member companies provide an annual report on their website. Going through these annual reports it turns out that only in 5 of them the New Alliance is mentioned while 12 remain silent about the new initiative, among them again some of the ‘big players’ like AGCO Corporation, Archer Daniels Midland, BASF, Bayer Crop Science, Diageo, Heineken, Monsanto, PepsiCo, Rabobank, SABMiller, SAP and Unilever.6 These findings do not say anything about these companies’ real investments but it does motivate a closer look at what they are doing and what they are achieving concerning their goal of reducing poverty, focusing here on Ethiopia as one of the three countries in the focus of this new initiative.
After many years of negative headlines about companies’ behaviour in poor countries, there is still much scepticism about how serious companies are concerning their change in strategy. But taken all
5 Internet research on the 12th of December 2012 and again on the 29th of March 2014, using the search function on the website of each firm with the key words ‘new alliance’, ‘food security and nutrition’, ‘G8’ and “New Alliance for Food Security and Nutrition”. 6 Internet research on the 25th of August 2013, using the search function on the websites and in the documents of the annual reports.
Introduction
8
together, these developments – various innovative business approaches and possibly powerful alliances between governments, business and NGOs – show that the private sector increasingly commits itself to contribute to poverty reduction. The first steps to comprehend poverty reduction as core business instead of only Corporate Social Responsibility are done but there is still a long way to go to prove that companies’ commitments are more than declarations of intent and to verify the success of these business approaches in terms of measurable outcomes.
This study does not try to evaluate innovative business approaches but goes one step further and analyzes in how far business can extend its outreach towards extremely poor people. The new approaches deliver the rationale why it could be a profitable business case to cater to marginalized poor farmers in Ethiopia: social returns would be extremely high and the market is big in terms of the number of people. Thus, there are good reasons for investing in this market. To what extent these investments are already made and – given the low level of observed investments – how they could be further increased is the subject of this study, especially of Part IV.
I‐3 Researchquestionandhypothesis
As has been explained, the present research is motivated by two important findings. One is that the marginalized poor have not benefited from successes in poverty reduction for a long time and their share in the total population is still shrinking only slowly, especially in Sub‐Saharan Africa. The other is that innovative business models have emerged that put social values in the core of business strategies. Thus, this research tries to bring the two together to see under which circumstances investments by the private sector can reduce marginality and poverty.
For this task, the first field of investigation is to analyze where the marginalized poor are in Ethiopia. Furthermore, the analysis will reveal information about their expenditures and how much they actually pay for the products they buy, which will throw a bridge to possible investments by the private sector.
The second field of investigation is the one of business. The objective is to find out, which companies are operating in the agricultural input sector in Ethiopia at the moment and how far they reach out to the marginalized poor. The role of institutions and resulting transaction costs in this context will be in the center of analysis.
The main research question is what role business does already play and can play in future for the reduction of extreme poverty and marginality in rural Ethiopia by providing improved agricultural inputs to marginalized poor farmers. The answer to this quite broad question requires information about
‐ The needs of the marginalized poor the private sector could respond to (the demand side); ‐ The causes and constraints for not responding to these needs yet (the supply side); ‐ The possibilities and incentives needed to facilitate investments in the marginalized poor
(institutional arrangements).
Starting with the demand side, two main questions need to be answered if business is to be matched with the needs and potentials of poor and marginalized people, namely:
• Where are hotspots of marginality, i.e. where are the marginalized poor? • What are the most urgent unsatisfied needs of the marginalized poor? • What market volume potentially evolves?
These insights will then inform the analysis of how firms could respond to the needs of the marginalized poor. The questions arising for the supply side are:
• What is the actual state of affairs of business approaches in the agricultural input sector targeting the poor in rural Ethiopia, who is reached and who is not and why?
Introduction
9
• What is the nature of transaction costs that arise when selling (agricultural) goods and services to the marginalized poor?
• Which incentives should be strengthened through what means for private sector initiatives to expand its services and product portfolios to cater to the marginalized poor?
The underlying argument is that different types of businesses have good reasons to invest in the marginalized poor (von Braun 2010; see also Section I‐2). If these investments are not made, there must be high barriers to investments, or in other words, transaction costs must be assumed to be prohibitively high. The nature of these transaction costs are in the focus of this research. Along this line of argumentation, the hypothesis is that investments in the marginalized poor by the private sector are scarce because the institutional setting and the resulting transaction costs lead to the non‐existence of a market that would include the marginalized poor as market participants.
I‐4 Definitionsandconceptualframework
The present research builds on a recent strand of literature about market‐based solutions for poverty reduction (Porter and Kramer, 2011; Prahalad and Hart, 2002; Yunus, 2007). Thus, markets are central in the following analysis. As Swedberg (1994) has nicely elaborated, the word ‘market’ has many different meanings: while it was introduced into the English language meaning ‘trade’ or ‘place to trade’, it was soon referring to the physical market place, the gathering at this place and the legal right to hold a meeting at a marketplace. The meaning was then extended to buying and selling in general and to “sale as controlled by demand and supply” (Oxford English Dictionary, 1989, p. 385; cited from Swedberg, 1994, p. 255).
In economics, markets are usually seen as price‐making mechanisms that are central to the allocation of resources. The term also refers to geographic areas, within which there is demand for a product (Swedberg, 1994). Authors in the tradition of New Institutional Economics argue that markets are also institutions in their own right (see e.g. Coase, 1988) that exist to facilitate exchange and reduce the costs of exchange transactions. However, as Marx ([1867] 1996) once noted, “it is plain that commodities cannot go to the market and make exchanges on their own account” (p.96; cited from Swedberg, 1994, p. 258). Consequently, analyzing market structures should include an analysis of social institutions that facilitate exchange (Coase, 1988, p. 8) since markets are shaped to a large extent by the social relations between market actors (see e.g. Geertz, 1992; Granovetter, 1985, 2005; Fligstein, 1996).
Against this background, markets are understood in the following as an “actual or nominal place where forces of demand and supply operate, and where buyers and sellers interact (directly or through intermediaries) to trade goods, services, or contracts or instruments, for money or barter. Markets include mechanisms or means for (1) determining the price of the traded item, (2) communicating the price information, (3) facilitating deals and transactions, and (4) effecting distribution” (Business Dictionary, 2013).
Transaction costs impede or in some cases entirely block the formation of markets (Arrow, 1969; Stiglitz, 1989). As a result, they give rise to market failures, i.e. “the failure of a more or less idealized system of price‐market institutions to sustain ‘desirable’ activities or to estop ‘undesirable’ activities” (Bator, 1958, p. 351), where the desirability of an activity is “evaluated relative to the solution values of some explicit or implicit maximum‐welfare problem” and the term ‘activities’ covers consumption and production (ibid.). Market failures can have many reasons and do not need to be absolute (Arrow, 1969; Bator, 1958). One much discussed example of a market failure is the case of externalities. Yet, also a situation in which supply and demand fail to meet because the highest price a buyer is willing to pay is lower than the lowest price at which a seller would sell can – at least in some cases – be considered as market failure since transaction costs and the (resulting) failures of complementary markets can be assumed to cause the failure of such a market to exist (Arrow, 1969, p. 11; see also Box 2).
Introduction
10
Transaction costs drive a wedge between producer and consumer prices such that even in theory ‘free markets’ do not lead to Pareto efficient results when transaction costs are taken into account (Arrow, 1969). As a result, deviations from the free market are socially desirable; the free market cannot serve as fictive first best option a society should strive for and whose approximation can guide the design of an institutional setting (Demsetz, 1969). Instead of such a ‘nirvana approach’ as Demsetz (1969) calls it, many scholars favor a comparative approach evaluating real alternative institutional arrangements based on the identification of the relevant transaction costs that determine economic performance and a “comparative evaluation of alternative modes in terms of their transaction cost attributes” (Williamson, 1980, p. 5; see also Demsetz, 1969; Acemoglu and Robinson, 2012).
Box 2: Transaction costs, market failure and Pareto efficiency
Arrow (1969) has laid out the relationship between transaction costs, market failure and Pareto efficiency. In a perfectly competitive market equilibrium, households with certain initial resources consume those consumption bundles that maximize their utility at a given set of prices. Firms produce bundles of goods that maximize their profits at the same set of prices. Production bundles and initial resources must equal aggregate consumption. Prices play a parametric role for each individual and are identical for all individuals. This situation implies the assumptions that all prices can be known by all individuals and that the process of price charging is costless. Furthermore, the assumptions of convexity of household indifference maps and firm production possibility sets and of the universality of markets are crucial for a competitive equilibrium to lead to Pareto efficiency. Arrow (1969) shows that a competitive equilibrium is Pareto efficient if markets are universal even if the convexity assumption does not hold and, secondly, that if both assumptions hold any Pareto‐efficient allocation can be achieved as a competitive equilibrium if resources are adequately redistributed with costless lump‐sum transfers. However, the violation of the assumption of the universality of markets as well as almost all cases of imperfectly competitive markets imply Pareto‐inefficient results.
Furthermore, risk and uncertainty may cause Pareto‐inefficient results of competitive equilibria. Problems of ‘adverse selection’ and information asymmetries cause equilibrium outcomes not to be Pareto‐efficient. Moreover, costs of information and of the transmission of information prevent results to be Pareto‐efficient.
The case of externalities and examples for missing markets, e.g. many markets for future transactions, show that the assumption of the universality of markets does not hold. Markets may fail to exist because it is not possible to exclude non‐payers, due to a lack of information that would permit market transactions or because demand and supply are equated at zero, i.e. the highest price someone would be willing to pay is below the lowest price at which a seller would sell. Arrow describes such a situation as being “by itself in a way presumptive of inefficiency” (p. 11).
In other words, there are transaction costs that are “attached to any market and indeed to any mode of resource allocation” (p. 12), resulting out of exclusion costs, costs of information and communication and the costs of disequilibrium. The latter arise as in every complex system it takes time to compute the optimal allocation. Thus, “in a price system, transaction costs drive a wedge between buyer’s and seller’s prices and thereby give rise to welfare losses as in the usual analysis” (p. 12). Transaction costs, however, can be reduced by collective action and in the form of political processes and social norms. Market failures in the form of the failure of markets to exist are a particular case where transaction costs are so high that they entirely impede the formation of markets (Arrow, 1969). Yet, as the case of risk and uncertainty shows, the duality theorem and the related welfare implications may fail for a multitude of reasons, leading to a situation where markets exist but do not lead to Pareto‐efficient outcomes (Arrow, 1969; Bator, 1958).
Transaction costs in turn are determined by the institutions in place (see e.g. Williamson, 1985). Institutions affect the economic organization of a society (North, 2005, 1990; Ostrom, 1990; Williamson, 2005, 1985), they are understood here as “coordinating devices” (Tordjman, 2004, p. 21). The present study follows the definition of North (1990), who defines institutions as “the humanly devised constraints that shape human interaction” (p. 3). Accordingly, institutions “structure incentives in human exchange, whether political, social, or economic” (ibid.).
Introduction
11
Against this background, it is palpable that the institutional setting, the resulting transaction costs and incentive structure impact the strategies of firms. A firm strategy is the “internally consistent configuration of activities that distinguishes a firm from its rivals” (Porter, 1985, p. xvi). Porter (1985) uses the term ‘value chain’ to summarize the set of activities a firm carries out. Thus, the final supply, composed of all firms’ product portfolios, sales prices, the marketing strategies and selected target groups are an outcome of the firms’ strategies and their translation into their value chains (Porter, 1985, 2002; see also Box 14 in Part IV).
The conceptual framework of this study and the theories used to analyze the different parts of this framework are illustrated in Figure 2. The central point is whether and on which level supply and demand meet. There are two main bottlenecks: one is the overall supply of inputs. There is evidence, that in Ethiopia the supply of agricultural inputs, especially improved seed, is by far not enough to meet demand (MoA, 2013). This bottleneck also includes issues of seed and fertilizer prices, quality and availability of complementary inputs. The second bottleneck relates to distributional questions, i.e. whether those farmers most in need for improvements in their well‐being have access to improved inputs, i.e. whether improved inputs are available and farmers have the purchasing power to transform their need into demand. This second bottleneck is based on a strand of recent research on marginality that analyzes exclusion from access to resources, assets and services and restrained freedom of choice as a root cause of poverty (Gatzweiler et al., 2011; von Braun and Gatzweiler, 2013a).
These concerns are addressed here with a focus on the question what the private sector can contribute to make supply meet demand. As has been discussed in Section I‐2, the focus on the private sector is motivated by the changes in the thinking about and the claims raised towards the role of the private sector in the society (see e.g. Porter and Kramer, 2006; Hart, 2005). These changes are reflected in the rise of innovative business approaches that introduce the contribution to solutions to societal problems such as poverty as more or less equal part of the firm strategy (Porter and Kramer, 2011; Prahalad and Hart, 2002; UNDP, 2008; Yunus, 2007).
Innovative business approaches augment the reasons for companies to invest in poor countries like Ethiopia and to explicitly cater to poor people within such countries as they add social returns – additional to financial returns – to a firm’s bottom line. However, while these innovative business approaches explicitly deliver arguments why it is justified to look at the role that the private sector can play in reducing poverty, this does not imply that companies following ‘conventional’ business strategies have no reason to invest in Ethiopian agricultural input markets for pure profit interests. The country is the second most populous African nation (The World Bank, 2012b), it is still predominantly agrarian (Alemu, 2010) and has exhibited high rates of economic growth in the last years (IMF, 2012). Thus, it may also be a promising future market for companies following strategies without any reference to innovative business approaches.
Clear‐cut separations between ‘innovative’ (in the sense of pursuing social value creation) and ‘conventional’ (in the sense of pure profit maximization) business approaches are hardly possible. As has been outlined in Section I‐2, innovative business approaches deliver all the more compelling reasons for companies to cater to the poor in Ethiopia since especially social returns to investment promise to be high (von Braun, 2010; Wale, 2006). Yet, the present analysis focuses on the question, whether companies manage to provide improved inputs to consumers, especially to the marginalized poor – however they call their strategy.
Given these incentives in the form of financial and social returns, the question arises why there is so little supply of improved agricultural inputs in Ethiopia although demand is high (MoA, 2013). To analyze the origins of and potential solutions to this market failure, the present research project takes on the task formulated by Arrow (1969), who argues that the identification of transaction costs is necessary to optimize resource allocation and reduce welfare‐diminishing market distortions. That the current situation indeed is a market failure in the sense described by Bator (1958) can be
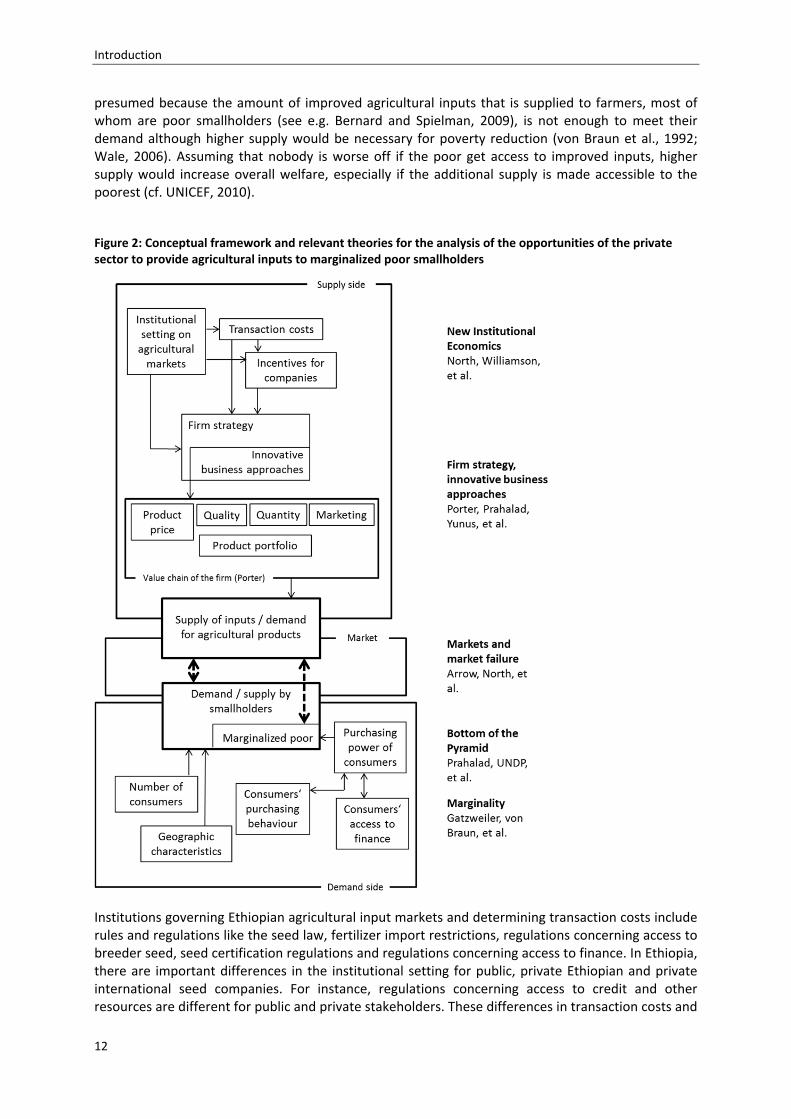
Introduction
12
presumed because the amount of improved agricultural inputs that is supplied to farmers, most of whom are poor smallholders (see e.g. Bernard and Spielman, 2009), is not enough to meet their demand although higher supply would be necessary for poverty reduction (von Braun et al., 1992; Wale, 2006). Assuming that nobody is worse off if the poor get access to improved inputs, higher supply would increase overall welfare, especially if the additional supply is made accessible to the poorest (cf. UNICEF, 2010).
Figure 2: Conceptual framework and relevant theories for the analysis of the opportunities of the private sector to provide agricultural inputs to marginalized poor smallholders
Institutions governing Ethiopian agricultural input markets and determining transaction costs include rules and regulations like the seed law, fertilizer import restrictions, regulations concerning access to breeder seed, seed certification regulations and regulations concerning access to finance. In Ethiopia, there are important differences in the institutional setting for public, private Ethiopian and private international seed companies. For instance, regulations concerning access to credit and other resources are different for public and private stakeholders. These differences in transaction costs and
Introduction
13
other ‘external’ reasons such as managers’ or shareholders’ weighing up of financial and social returns lead to different strategies, which result in differences in the amount and quality of inputs supplied and the targeted market segments (see also ‘supply side’ box in Figure 2).
As profits are a necessary condition to motivate investments – even when following the arguments of innovative business approaches – the analysis requires a closer look at the demand side, going beyond the fact that stated demand for inputs is higher than supply at current prices. To incentivize private sector investments it is important to know who and where the customers are, on what they spend and how their situation may change in the future since all these factors are relevant for the market development potential. Especially for agricultural inputs, the geographic characteristics of the areas where customers live are important elements shaping demand since e.g. factors like soil types, availability of water and distance to markets call for certain product properties such as long storage life or drought resistance (see also ‘demand side’ box in Figure 2).
However, demand only arises if wants are backed up by purchasing power (Kotler and Armstrong, 2010). Consequently, the amount of money people have at their disposal and access to credit for the poor are important aspects on the demand side. Yet, access to credit is often conditional on collaterals. Microfinance institutions usually apply group lending methods such that people who are relatively better off are more likely to be accepted in a borrower group as their risk of default is lower. Thus, access to credit itself often depends explicitly or implicitly on the already existing purchasing power. Furthermore, due to the nonseparability of demand and supply in farm households (Singh et al., 1986), the demand of smallholder farmers for improved agricultural inputs and other goods is directly connected with the demand of companies for agricultural products that are produced by smallholders. With these pieces of information at hand, the purchasing behavior and purchasing power of the marginalized poor needs to be analyzed to assess in how far market‐based approaches can reach these groups and improve their well‐being (see again ‘demand side’ box in Figure 2).
The concept of marginality helps to identify those most in need of improvements in their well‐being. The marginalized poor are those who have least benefited from betterments in the society at large because they are excluded, experience discrimination, suffer from disadvantageous ecological conditions and/or live in remote areas. The present research focuses on this group on the demand side. One reason for this focus is that not only social returns on investment are likely to be higher when targeting the poorest and most disadvantaged people but that this may also be more cost‐effective than focusing on the ‘low‐hanging fruits’ when aiming at poverty reduction (UNICEF, 2010). Additionally, the focus on the marginalized poor can also be justified from an ethical point of view: as Rawls (2005) elaborates in his “second principle of justice’, social and economic inequalities should be tackled in a way that secures the greatest benefits to the least‐advantaged members of a society (p. 63).
From an academic point of view, the focus on the marginalized poor is not only justified by ethical reasons but also because it is where the research frontier is. Many examples show that companies can earn profits by catering to the lower middle class (see e.g. Prahalad, 2010 or the case study collection by UNDP, 2013). Yet, although some authors claim that it is possible and profitable for companies to cater to those living on less than $1 a day (Polak and Warwick, 2013), there is little scientific evidence on how far the private sector can go towards including the marginalized poor in their value chains and which institutional environment is needed to enable and incentivize such efforts.
The scope of the supply side analysis of the present study comprises the institutional factors shaping the markets for seed, fertilizer and agrochemicals. Private companies are restricted to those that are formal, registered companies and appear in public registers such as the business directory or the “Enterprise map for Ethiopia” compiled by Sutton and Kellow (2010). Furthermore, the analysis is restricted to the markets for seeds, fertilizer and other agro‐chemicals. These are also the inputs that
Introduction
14
are prioritized by the Government of Ethiopia (GoE) in its different strategic and policy frameworks for achieving improvements in the productivity of smallholders (MoA, 2010). It is quite pioneering to analyze the business opportunities of making these products available to the marginalized poor although the use of improved seeds and fertilizer have – thanks to large programs of seed and fertilizer promotion that started already in the 1960s – a long‐standing tradition in the country even among smallholder farmers (see e.g. Rashid et al., 2007; Berhanu, 2009). The case is different for machinery and irrigation, which are still in very early stages of adoption among smallholder farmers and for which there is hardly any information about demand for these products. The focus on the markets of seeds, fertilizer and agro‐chemicals is further justified by empirical evidence that these products are most essential as first steps to increase productivity and thus reduce poverty – more so with, but even without irrigation and farm machinery (Mendola, 2007). Thus, this research focuses on the institutional setting regulating the markets for seeds, fertilizer and agro‐chemicals, leaving other inputs aside.
I‐5 Designofthestudyanddatasources
To assess the potential of the private sector to contribute to poverty reduction in rural Ethiopia, the current research applies a case study research strategy (Hartley, 2004; Yin, 2013). Case studies are a tool to provide in‐depth analyses of phenomena within certain contexts to illuminate theoretical issues. A case study is an “empirical inquiry that investigates a contemporary phenomenon (the “case”) in depth and within its real‐world context, especially when the boundaries between phenomenon and context may not be clearly evident” (Yin, 2013, p. 16). Thus, the context is deliberately part of the design as an explanatory factor because the aim of a case study is to understand how processes or behavior influence and are influenced by their specific context (Eisenhardt, 1989; Hartley, 2004).
A case study is not a method but a research strategy (Eisenhardt, 1989). Within such a research strategy, a variety of methods can be used, such as semi‐structured or rather unstructured interviews, participant observations or surveys (Hartley, 2004). Due to the wide range of data and methods, that can be used and the different levels of analysis they can employ, case studies are an especially useful strategy for studying complex phenomena (Eisenhardt, 1989; Yin, 2013). Furthermore, case studies are an appropriate research strategy for prospective studies as compared to other methods that are more adequate for analyzing events in the past or impact evaluations (Zucker, 2009).
The ‘case’ in the present research is the institutional setting and transaction costs on agricultural input markets in Ethiopia and the resulting incentives and disincentives for companies to invest in agricultural input provision to the marginalized poor. This ‘case’ embeds several units of analysis: the institutions shaping the input markets (e.g. the seed law, fertilizer import regulations etc.), different stakeholders who organize supply, i.e. production or import and distribution of inputs (e.g. ministries and other government organizations, seed companies, etc.) as well as the marginalized poor farmers on the demand side. As the research is about poverty reduction among smallholders, the analysis of the demand side restricts itself to smallholder farmers, omitting large‐scale and state farms (see also Figure 2). Innovative business approaches are not entities to be explicitly empirically studied but are part of the reason why this case is chosen and provide a framework within which different business approaches can be structured and classified.
The present study relies on primary and secondary data. Secondary data was obtained from different sources, such as the Central Statistical Agency (CSA), the Ministry of Agriculture (MoA), the Demographic and Health Survey (DHS), the Household Income and Consumption Expenditure Survey (HICE) as well as the Ethiopian Rural Household Survey (ERHS).
Primary data was collected mainly during November 2011 and April 2012 in Ethiopia and during a short visit in the country in April 2013. 65 interviews were conducted with experts from the
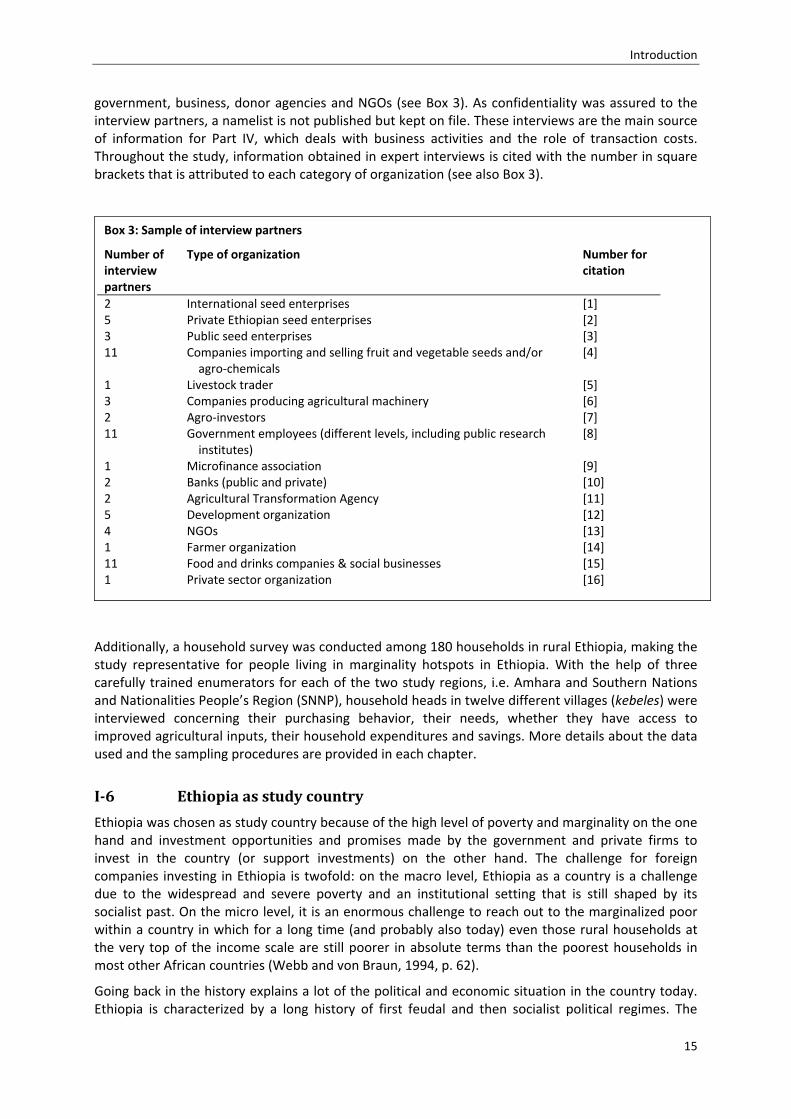
Introduction
15
government, business, donor agencies and NGOs (see Box 3). As confidentiality was assured to the interview partners, a namelist is not published but kept on file. These interviews are the main source of information for Part IV, which deals with business activities and the role of transaction costs. Throughout the study, information obtained in expert interviews is cited with the number in square brackets that is attributed to each category of organization (see also Box 3).
Additionally, a household survey was conducted among 180 households in rural Ethiopia, making the study representative for people living in marginality hotspots in Ethiopia. With the help of three carefully trained enumerators for each of the two study regions, i.e. Amhara and Southern Nations and Nationalities People’s Region (SNNP), household heads in twelve different villages (kebeles) were interviewed concerning their purchasing behavior, their needs, whether they have access to improved agricultural inputs, their household expenditures and savings. More details about the data used and the sampling procedures are provided in each chapter.
I‐6 Ethiopiaasstudycountry
Ethiopia was chosen as study country because of the high level of poverty and marginality on the one hand and investment opportunities and promises made by the government and private firms to invest in the country (or support investments) on the other hand. The challenge for foreign companies investing in Ethiopia is twofold: on the macro level, Ethiopia as a country is a challenge due to the widespread and severe poverty and an institutional setting that is still shaped by its socialist past. On the micro level, it is an enormous challenge to reach out to the marginalized poor within a country in which for a long time (and probably also today) even those rural households at the very top of the income scale are still poorer in absolute terms than the poorest households in most other African countries (Webb and von Braun, 1994, p. 62).
Going back in the history explains a lot of the political and economic situation in the country today. Ethiopia is characterized by a long history of first feudal and then socialist political regimes. The
Box 3: Sample of interview partners
Number of interview partners
Type of organization Number for citation
2 International seed enterprises [1] 5 Private Ethiopian seed enterprises [2] 3 Public seed enterprises [3] 11 Companies importing and selling fruit and vegetable seeds and/or
agro‐chemicals [4]
1 Livestock trader [5] 3 Companies producing agricultural machinery [6] 2 Agro‐investors [7] 11 Government employees (different levels, including public research
institutes) [8]
1 Microfinance association [9] 2 Banks (public and private) [10] 2 Agricultural Transformation Agency [11] 5 Development organization [12] 4 NGOs [13] 1 Farmer organization [14] 11 Food and drinks companies & social businesses [15] 1 Private sector organization [16]
Introduction
16
country is nearly unique in Sub‐Saharan Africa in being a nation state for centuries. The kingdom of Aksum, which comprised the area of what is now northern Ethiopia, was founded around 400 BC. Aksum had trade relationships with India, Arabia, Greece and the Roman Empire, was relatively urbanized and had its own coins. In the 7th century, Aksum lost its colonies in Arabia and its trade routes due to the expansion of the Arabs. The result was economic decline and a re‐focus of the state on rural areas (Acemoglu and Robinson, 2010; Marcus, 2002; Pankhurst, 2008).
Similarly to Europe after the fall of the Roman Empire, feudalism emerged in what today is Ethiopia with land being the most important resource. The predominant land holding system that is testified for the period beginning with the 13th century was called ‘gult’, which was a grant of land by the Emperor for which the peasant had to provide military services in exchange. Additionally, peasants had to dispense one half to three quarters of their agricultural produce to the land owner, making the gult system even more extractive than was feudalism in Europe at that time (Acemoglu and Robinson, 2010; Marcus, 2002; see also Pankhurst, 2008).
Absolutism was perfect in Ethiopia; there were no constraints to the power of the Emperor. The consequence was great insecurity of property rights, which was part of the political strategy of the Emperor. Land fell back to the Crown after the death of the gult‐holder such that it could not be inherited by the eldest son. Peasants got land assigned and withdrawn arbitrarily. The frequency of exchange of the tiller was high: every two to three years, often even several times within one year, land was taken from a peasant and given to another to keep the peasants in close dependency on the Emperor. As a result, investment in land was minimal (Acemoglu and Robinson, 2010; Pankhurst, 2008; Zewde, 2001).
The Derg (‘the committee’ in Amharic) that overthrew the last Emperor Haile Selassie in 1974 established a socialist economic system in the country. Market forces were repressed and most private property, financial institutions and manufacturing firms were nationalized (Geda, 2008). Agricultural production was organized around peasant cooperatives, state‐owned farms and collectives. The regime secured it’s power over the rural population by forming peasant associations and marketing boards (Geda, 2008). Extension services were reduced to instruments of political control over the peasantry (Spielman et al., 2011).
In 1991, the Ethiopian People Revolutionary Democratic Front (EPRDF) took power. The party introduced more market‐friendly policies, following more or less the typical structural adjustment policies promoted by the Bretton Woods institutions (Geda, 2008). As a result, economic growth increased from 2.3% during the Derg regime (Geda, 2008) to around 10% between 2004 and 2011 (International Monetary Fund, 2012; The World Bank, 2012b). Now, The Economist rates the country as one of the “top growers” in the world (The Economist, 2011). However, a gross domestic product (GDP) per capita of $1,135 in purchasing power parity (PPP) in 2012 is an increase of 4% compared to 2011 (International Monetary Fund, 2012) but is still not a high number.
The need for improvements in quality of life is high: 51% of women and 30% of men have never received formal education (DHS, 2011). Life expectancy at birth is 59 years and only 34% of the rural population have access to an improved water source (The World Bank, 2012b).
Although Ethiopia is one of the countries (together with Mozambique, Nicaragua, Niger, Angola, Bangladesh and Vietnam) that can show the largest absolute progress in the GHI between 1990 and 2011 – moving from ‘extremely alarming’ to ‘alarming’ (von Grebmer et al., 2011) – latest data from 2005‐07 shows that still 41% of the population are undernourished (FAO, 2012a), 35% of children under five are underweight and that the under‐five mortality rate is at around 10% (DHS, 2011; von Grebmer et al., 2011).
According to official data, 29% of the population live below the national poverty line, which is a considerable improvement compared to 44% in 1999/00 and 39% in 2004/5 (CSA, 2012b). The World Development Report 2010 does not offer any recent data on poverty but estimates that in 1999/2000, 55.6% of the Ethiopian population lived below the 1.25$‐poverty line and 86% of the
Introduction
17
population had less than $2 a day (data from 1999‐2000, expenditure base; The World Bank, 2011). However, caution is demanded with all these numbers: Ahmed et al. (2007) found the official poverty data of Ethiopia “unrealistically low” (p. 33) and did not include them in their analysis.
The socialist past of Ethiopia with an eventual shift to more market‐friendly policies and the prevalence of smallholder farming reminds of the situation of transition economies in Central and Eastern European Countries (Heidhues and Brüntrup, 2003; von Braun and Lohlein, 2003). Yet, there are important differences between the two settings: in the transition countries, the establishment of land markets, which still do not exist in Ethiopia, helped to increase productivity (Lerman, 2003) although the number of subsistence farms remains high (von Braun and Lohlein, 2003). While in the transition economies of the former Soviet Union policies to decrease market risks, the rationalization of taxation and the facilitation of scale economies in input and output markets were or still are of primary importance, the priorities for poor countries like Ethiopia are technological change, the improvement of market infrastructure and strengthening of rural financial institutions (von Braun and Lohlein, 2003).
Challenges in rural Ethiopia for private sector investments
Additional to these political‐historical aspects, there are several other challenges that slow down and make it more complicated for the private sector (and other actors) to induce changes in Ethiopia, especially in rural areas. Three of these challenges, that are particularly relevant in Ethiopia are high rates of child labor and low education levels as well as low capital accumulation due to the frequent reoccurrence of natural disasters in the past (see e.g. Gill, 2010). These aspects are shortly discussed in the following as they have implications for private sector investments in Ethiopia.
Ethiopia’s population is already large and keeps growing rapidly. The population was projected at 86 million in 2012 (FAO, 2012b), making Ethiopia the second most populous country in Sub‐Saharan Africa after Nigeria. A high fertility rate (5.3; UNFPA, 2011) and low life expectancy (59.3 years; The World Bank, 2012b) explain why the Ethiopian population is heavily concentrated in the young age cohorts: more than half of the population is under 24 years old (Getachew and Kallaur, 2005). Many of these youngsters work. As a result, Ethiopia has one of the highest rates of child labor in the world (Guarcello et al., 2006).
More than 7.5 million children between 5 and 14 years of age were at work in 2001, when the last child labor survey that is publicly available was conducted (CSA, 2002). This was more than 50% of children in the country at that time. Child economic activity rises with age, but even 40% of even the youngest group of children between 5 and 9 years of age were working. Rural children are much more likely to be involved in child labor than children living in urban areas (54% versus 15% respectively). According to the same survey, boys have a higher rate of economic activity than girls but this data does not take into account activities like water fetching and fuel wood collection, which are mostly done by girls or women (CSA, 2002; Guarcello et al., 2006). A second round of the child labor survey in 2007 showed a 52% reduction in the percentage of children who were involved in paid work (Woldehanna et al., 2008b). This reduction is assumed to be caused by substantial improvements in wealth and asset levels of households. However, while a separate comparison for urban and rural areas in the second round generally confirms the reduction in child labor, a comparison by region shows that the reduction in paid child labor between both survey rounds is statistically significant only for Addis Ababa and SNNP (Woldehanna et al., 2008b).
Nearly all children work for their families without wages, only 2% work outside the family for wages (Guarcello et al., 2006). 12% of the economically active children work in the service sector and 4% in manufacturing. The great majority of children, around 80%, works in the agricultural sector (CSA, 2002), which is not surprising in consideration of the fact that around 80% of the total Ethiopian population lives on agriculture.
Introduction
18
The high numbers of working children are worrisome since working as a child violates children’s human rights (Admassie, 2000) and significantly influences lifetime patterns of (un)employment and payment. Former child laborers are particularly disadvantaged in terms of finding and maintaining a job as adults due to their low levels of human capital (Guarcello et al., 2006; Admassie, 2000).
The flip side of these high rates of child labor in Ethiopia is low education levels. According to the World Bank, only 30% of adults (above age of 15) and about 45% of youths between 15 and 24 years of age are literate in Ethiopia. Women are even more deprived than men with only 28% of the 15 to 24 year old being able to read and write. The average for Sub‐Sahara Africa is 54% and 67% respectively (UNESCO, 2012).
Not even 50% of each cohort remains in school until the last grade of primary school, compared to an average of 60% in Sub‐Sahara Africa. Only 13% of the youths are enrolled in secondary education (The World Bank, 2012c). This implies that most young people have very low levels of human capital when entering the labor market.
Low enrollment ratios are a predominantly rural problem: only 30% of the rural youths between 5 and 17 years of age received formal or informal education in 2001 while 80% of the urban population was attending school. More than 60% of rural youths have never entered school compared to 17% of their urban counterparts (CSA, 2002; Guarcello et al., 2006).
However, overall school enrollment especially for primary education increased significantly since 2001. The rate and the number of children enrolled in primary education doubled and the number of children enrolled in secondary education nearly tripled since then (The World Bank, 2012c). Thus, it can be assumed that the situation in rural areas also improved in the last decade although it is not clear by how much.
Apart from the negative implications for the wider society, these low skill levels may be problematic for companies investing in Ethiopia as they drive up costs for searching skilled employees, designing marketing activities and maintaining consumer relationships.
Another challenge that may affect business in rural Ethiopia in various ways is the high frequency of natural disasters. Major natural disasters, mostly in the forms of droughts, occurred in 1973, 1984, 1991, 2000, 2009 and 2011 in Ethiopia, each time threating between one and eight million people with starvation. More than ten other droughts of smaller scales are recorded for the time between 1950 and the early 1990s (Webb et al., 1992, p. 20). These shocks made millions of people dependent on food aid and caused immense losses of lives and assets.
The droughts in Ethiopia had long‐lasting negative effects on food security (von Braun et al., 1999; Webb et al., 1992), child growth (Yamano et al., 2005) and asset holding (Dercon, 2004; Webb et al., 1992). In absence of insurances and despite considerable amounts of food aid delivered to the country starting in the mid‐1980s, these shocks caused many people to fall into poverty traps that are hard to escape. Dercon (2004) shows with the help of a survey among households affected by the 1984 drought that rainfall shocks not only have substantial immediate negative impacts on consumption but still affected consumption growth in the 1990s.
As a result, the long‐term effects of natural disasters are immense. Many people die, children experience phases of (even more severe) under‐ and malnourishment (Yamano et al., 2005), which impairs the cognitive and behavioral development of the child and causes reduced immune‐competence as well as increased morbidity and mortality. If the children survive, they suffer from diminished intellectual performance and low work capacity (Martorell, 1999), which again aggravates the problem of low skill levels.
Apart from these serious impacts on human capital formation, droughts and other shocks prevent the accumulation of physical capital. As has been described in numerous studies, farmers try to cope with weather shocks by selling their assets (see e.g. Carter et al., 2007). This is especially true for the poorest who take more time to recover and continue with fewer assets than before the shock (Carter
Introduction
19
and Barrett, 2006; Carter et al., 2007). Hence, frequent natural disasters led to very low capital accumulation in most rural areas of Ethiopia, which may reduce business potentials as people have few assets and thus few means to back up consumption expenditures.
These factors are essential to understand why poverty remains a tenacious problem in rural Ethiopia. All interventions, especially investments in agriculture, will need to take these aspects into account if they are to successfully introduce (behavioral) change among the rural population.
I‐7 Outlineofthestudy
This study is divided into five parts. The sequence of the chapter results out of the conceptual framework illustrated in Figure 2 but follows a different order to improve the flow of arguments. Part I introduced the topic, the background of the research and the research questions. Innovative business approaches were presented, which aim at reducing poverty or contributing to the solution to other societal problems. These new business approaches form the background of the present research: by adding social returns as additional bottom line, they recognize poor people in countries like Ethiopia as promising investment opportunities. Examples of such innovative business approaches in Ethiopia are provided at several points in the empirical parts of the study (Part II‐Part IV).
Against this background, Part II introduces the concept of marginality. On the basis of this concept, marginality hotspots are identified to locate the marginalized poor in Ethiopia. Furthermore, drivers of marginality and the concurrence of marginality with other socio‐economic and agricultural phenomena are scrutinized.
After having identified and located this new potential target group, Part III continues with looking at the demand side of prospective new markets. Starting with a review of what is already known about poor consumers, the chapter continues with an analysis of data from the household survey among the marginalized poor revealing insights about their expenditure patterns and needs. This analysis also provides a rough picture of market sizes and demand for different products.
Part IV turns to the supply side, focussing on agricultural input provision. Data obtained with the help of expert interviews conducted in Ethiopia is analyzed concerning the state of affairs of private sector activities on agricultural input markets and the nature of transaction costs arising on these markets, especially when companies intend to sell to the marginalized poor. The complex seed and fertilizer systems of the country are explained and potential institutional changes for increased investments in the production and distribution of agricultural inputs are discussed. Part V concludes and assesses the prospects for the private sector to contribute to poverty reduction in Ethiopia.
Marginality hotspots in Ethiopia
20
II. Identifying marginality hotspots in Ethiopia: locating futuremarkets?
Whether the private sector can contribute to poverty reduction does not only depend on the particular business strategy and the trade‐off between financial and social values but also on the characteristics of people and regions that shall be targeted. Thus, information about geographic characteristics as well as about the location and the number of people and their purchasing power are necessary to assess whether there is a market that is worthwhile to be invested in (see also Section I‐2). Yet, these features are likely to differ across different target groups.
Authors like Polak and Warwick (2013) argue (and have even shown in practice) that it is possible to establish profitable businesses including those living of $1 a day or less. Going even one step further, the present study analyzes in how far the private sector can go concerning catering even to the marginalized poor. This target group poses special challenges to the private sector as the marginalized poor live in remote areas and are likely to be among the poorest people of a society.
For this analysis, the first step is to identify who and where the marginalized poor are and how many Ethiopians are marginalized poor. This information will help to assess whether this group may be a potential target group for the private sector.
This chapter starts with an outline of the concept of marginality. Section II‐2 transfers this concept to the mapping approach and explains the methodology and the data used for the marginality hotspot mapping. Section II‐3 provides estimations of how many people in Ethiopia are marginalized poor and Section II‐4 looks at the concurrence of marginality with other socio‐economic and agro‐ecological factors. Section II‐5 analyzes regional differences in marginality and other factors influencing business opportunities and section II‐6 concludes.
II‐1 Marginality–ashortintroductionoftheconcept
Marginality addresses the nexus between poverty, exclusion and ecology.7 The present research draws on the definition of marginality developed by Gatzweiler et al. (2011) who define marginality as “an involuntary position and condition of an individual or group at the margins of social, political, economic, ecological, and biophysical systems, that prevent them from access to resources, assets, services, restraining freedom of choice, preventing the development of capabilities, and eventually causing extreme poverty”. This definition includes not only social, economic, political and spatial aspects but also contains an ecological dimension since it has been shown in many studies that there is a close relationship between ecosystems and human well‐being (see e.g. Millennium Ecosystem Assessment, 2005). Thus, people’s endowments with land and other natural resources are critical determinants of poverty and marginality (see also Pingali et al., 2013).
The definition of marginality used here draws on the work of other authors. Gurung and Kollmair (2005) describe marginality as a concept referring to socio‐cultural, political, economic and geographic spheres where disadvantaged people struggle to gain societal and spatial access to resources and full participation in social life (p. 10). “In other words, marginalized people might be socially, economically, politically, geographically and legally ignored, excluded or neglected” (ibid.).
Thus, marginality is a complex condition of disadvantage experienced by individuals and communities (Mehretu et al., 2000). The concept is closely linked to inequality, vulnerability, relative deprivation (Runciman, 1966) and social exclusion (see also Gurung and Kollmair, 2005, p. 14; Saith, 2007; Sen, 2000).
7 The concept of marginality has been elaborated extensively elsewhere (Gatzweiler et al., 2011; Gatzweiler and Baumüller, 2013; von Braun and Gatzweiler, 2013b). For this reason, only the basic elements of the concept are discussed here to provide the necessary background for the analysis in the following sections.
Marginality hotspots in Ethiopia
21
Marginality is usually described in social and spatial terms. The former focuses on demography, religion, culture, social structure, economics and politics in connection with access to resources by individuals and groups. The emphasis is placed on the understanding of the underlying causes of exclusion, inequality, social injustice and spatial segregation of people (Gurung and Kollmair, 2005; Sommers et al., 1999). The spatial dimensions of marginality are primarily based on the physical location and distance from centers (Gurung and Kollmair, 2005).
The definition of marginality used in this research is anthropocentric. It describes people positioned on the brink of different social, economic, and ecological systems (Gatzweiler and Baumüller, 2013; see also Figure 3). The marginalized suffer from limited access to resources and opportunities, restrained freedom of choice, and confined development of personal capabilities (von Braun and Gatzweiler, 2013b). Exclusion from economic growth as well as other dimensions of societal progress is an indication of the extremely poor being at the margins of society.
The concept of marginality serves to connect the fields of poverty, environment and development. Since marginality is a multidimensional and multidisciplinary concept, it is well suited to integrate these different fields and the multitude of aspects within these fields, from discrimination, social exclusion and aspiration failure to the degradation of ecosystems (von Braun and Gatzweiler, 2013a).
Marginalized poor people are affected by both marginality and poverty (von Braun and Gatzweiler, 2013b). Thus, the concept of marginality is not an alternative to the concept of poverty. Rather, both concepts overlap and complement each other. As has been indicated, marginality might often be a cause for poverty but the relationship is not necessarily only going in this one direction (see also Dasgupta, 2009). The concept of marginality builds on Sen’s capability approach (see Box 4). However, dealing with marginality implies going beyond the analysis and measurement of poverty and looking at opportunities and barriers that result out of people’s position in their wider or narrower societies and ecological circumstances.
Box 4: Sen’s capability approach
The capability approach developed by Amartya Sen is now widely accepted and applied in poverty research (see e.g. Sen, 1981, 1992, 1999). In his approach, Sen stresses the importance of freedom for the assessment of a person’s well‐being. He highlights that individuals differ in their ability to transform resources into valuable activities and that many different activities might lead to well‐being. For this reason, materialistic and non‐materialistic aspects need to be taken into account when evaluating human welfare. He also underscores the importance of inequality and the distribution of opportunities within a society.
The philosophical background: Sen’s approach stands in the tradition of philosophical discussions about welfare, utilitarianism and justice. For a long time, utilitarianism had dominated the scene, guiding social policy to maximize welfare. The publication of John Rawls’ A Theory of Justice in 1971 was a landmark in the welfare discussion. Rawls criticized utilitarianism for simply aggregating welfare without taking distributional patterns into account and objected the utilitarian assumption that welfare is an aspect of a person’s condition that requires normative attention (Cohen, 1993). Rawls proposed to substitute aggregation by equality and welfare by primary goods (Cohen, 1993; Rawls, 1999). Yet, despite its great influence on social policy, Rawls’ approach was criticized for not considering the equality of opportunity for welfare instead of equality of welfare.
Sen’s arguments: Sen argues against these welfare metrics in general. He rather focuses on opportunities or ‘capabilities’ in his terminology. In his approach, it is not welfare, or at least not welfare alone, what people should have the opportunity to achieve but a certain condition of a person, which is neither captured by the person’s stock of goods nor by his welfare level but by what Sen calls ‘functionings’. Against this background, Sen advanced two large changes in the discussion: one from the state of opportunity and second from goods and welfare to what he calls ‘functionings’ (Cohen, 1993).
Sen’s terminology: Sen sees living as “a combination of various ‘doings and beings’, with quality of life to be assessed in terms of the capability to achieve valuable functionings” (Sen, 1993, p. 31). He explains ‘capability’ as “a person’s ability to do valuable acts or reach valuable states of being” (Sen, 1993, p. 30). Capabilities represent the alternative combinations of things a person is able to do or to be, i.e. the various ‘functionings’
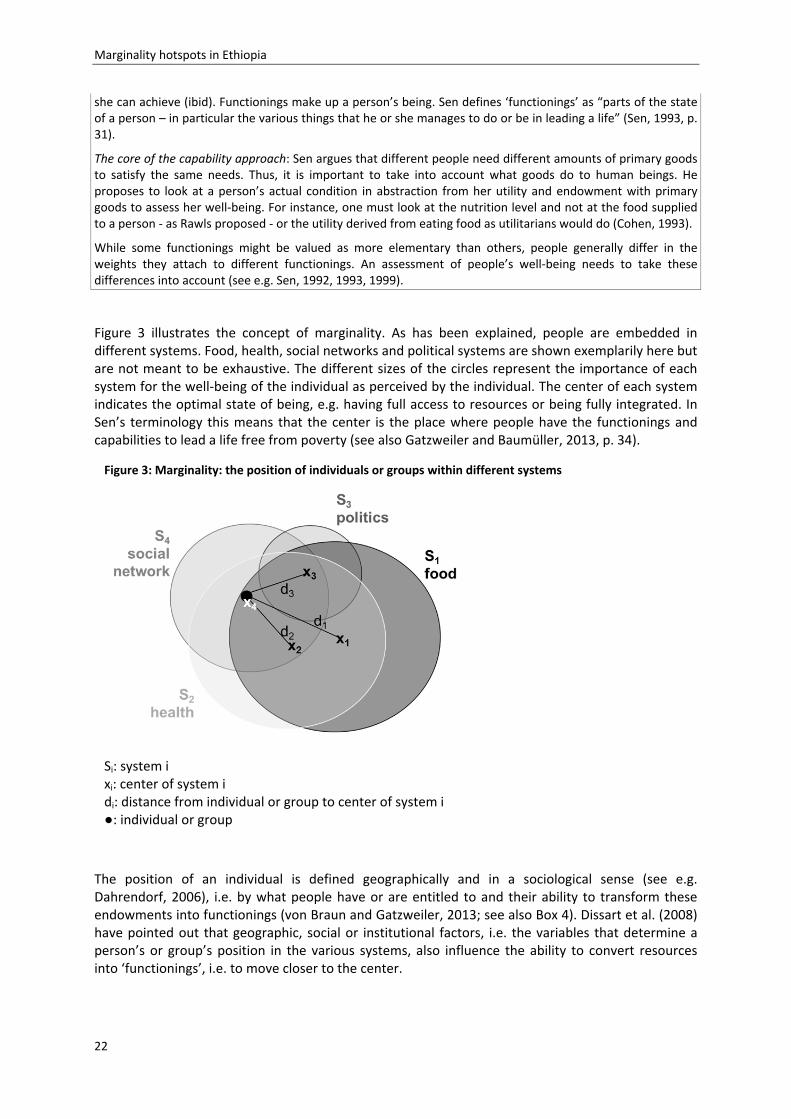
Marginality hotspots in Ethiopia
22
she can achieve (ibid). Functionings make up a person’s being. Sen defines ‘functionings’ as “parts of the state of a person – in particular the various things that he or she manages to do or be in leading a life” (Sen, 1993, p. 31).
The core of the capability approach: Sen argues that different people need different amounts of primary goods to satisfy the same needs. Thus, it is important to take into account what goods do to human beings. He proposes to look at a person’s actual condition in abstraction from her utility and endowment with primary goods to assess her well‐being. For instance, one must look at the nutrition level and not at the food supplied to a person ‐ as Rawls proposed ‐ or the utility derived from eating food as utilitarians would do (Cohen, 1993).
While some functionings might be valued as more elementary than others, people generally differ in the weights they attach to different functionings. An assessment of people’s well‐being needs to take these differences into account (see e.g. Sen, 1992, 1993, 1999).
Figure 3 illustrates the concept of marginality. As has been explained, people are embedded in different systems. Food, health, social networks and political systems are shown exemplarily here but are not meant to be exhaustive. The different sizes of the circles represent the importance of each system for the well‐being of the individual as perceived by the individual. The center of each system indicates the optimal state of being, e.g. having full access to resources or being fully integrated. In Sen’s terminology this means that the center is the place where people have the functionings and capabilities to lead a life free from poverty (see also Gatzweiler and Baumüller, 2013, p. 34).
The position of an individual is defined geographically and in a sociological sense (see e.g. Dahrendorf, 2006), i.e. by what people have or are entitled to and their ability to transform these endowments into functionings (von Braun and Gatzweiler, 2013; see also Box 4). Dissart et al. (2008) have pointed out that geographic, social or institutional factors, i.e. the variables that determine a person’s or group’s position in the various systems, also influence the ability to convert resources into ‘functionings’, i.e. to move closer to the center.
Figure 3: Marginality: the position of individuals or groups within different systems
Si: system i xi: center of system i di: distance from individual or group to center of system i ●: individual or group
Marginality hotspots in Ethiopia
23
Marginality refers to a certain point that is considered to be far away from the center of a system. Yet, it is debatable from which distance on somebody is considered as marginalized in the respective dimension and whether (or to what extent) this distance and the center should be defined in absolute or relative terms (see also discussion about thresholds used for marginality mapping in Section II‐2.1). Furthermore, as the figure shows, a certain person or group might at the same time be marginalized in some dimensions while being integrated in other systems (see also Dunne, 2005; Gatzweiler and Baumüller, 2013). The example in Figure 3 shows the case of an individual being marginalized in the systems of food, health and politics but perfectly integrated in social networks.
To operationalize the marginality concept and to allow for measurements and mapping exercises Gatzweiler et al. (2011) developed a list of spheres of life that broadly outline the dimensions in which people can be marginalized (see Box 5). It includes economic, demographic, geographic and ecological variables as well as dimensions related to quality of life, infrastructure, public order and institutions.
II‐2 WherearethemarginalizedpoorinEthiopia?
Marginalityhotspotmapping–methodanddataII‐2.1
The methodology and the selection of much of the data used to represent the spheres of life (see Box 5) has been developed by Graw and Ladenburger (2012). A global picture of where the marginalized poor live can also be found there. In the following, the analysis will concentrate on Ethiopia.
Box 5: The spheres of life proposed by Gatzweiler et al. (2011)
A. Economy – variables defining the economy or livelihood activities
Production, consumption, different types of income, income inequality, assets, ownership of land or other property, social‐ and network capital, access to social transfer systems, prices, labor supply/demand, resource flows, investments, trade
B. Demography – variables defining the actors/stakeholders
Population size, ‐density, birth/death rates, migration, ethnicity C. Landscape design, land use and location – spatial variables
Urban/rural space, agricultural/forest use, proportion of land used for recreation, traffic (roads), settlement, protected areas, areas for water retention, distance from urban centers, remoteness
D. Behavior and quality of life
Health, security, human rights, education, social connectedness, exclusion, social segregation/integration, crime, ethnic tensions, civil war; Aspirations, happiness, mutual support, alienation, gender equality
E. Ecosystems, natural resources and climate
Precipitation, soil fertility, soil erosion, biodiversity, ecosystem intactness, goods and services
F. Infrastructure – variables defining the structures required for the exchange of energy, matter and information
Communication, transport (e.g. road, rail), market places, hospitals, schools, universities, power supply system, water supply system, sanitation
G. Public domain and institutions – variables defining how the system is regulated, the inner order
Regulations, laws, contract, contract enforcement, conflict resolution mechanisms, formal and informal institutions
Source: Gatzweiler et al. (2011, p. 8)
Marginality hotspots in Ethiopia
24
The determination of the number of variables to be included and the selection of the variables representing the spheres of life is a difficult task that is always subject to discussion and criticism. The challenge in the present case is to represent all spheres of life while keeping the number of variables as low as possible to ensure clarity and visibility (Graw and Husmann, 2013; Graw and Ladenburger, 2012). To achieve this, each sphere of life is represented by one variable. The following variables have been selected:
A. Total monthly household expenditure is taken as proxy for the economic sphere of life; B. Prevalence of stunting among children under five is chosen to represent the demographic
sphere; C. Travel time to major cities represents landscape design; D. The percentage of people facing a health problem but not going to a doctor or traditional
healer represents behavior and quality of life; E. Land area with soil constraints is used as proxy for the sphere of life comprising ecological
factors and natural resources; F. Percentage of households not having access to clean water represents the sphere of life
dealing with infrastructure; and G. Gender discrimination, measured by the percentage of women agreeing to being beaten if
they neglect their children, is used as an indicator for the sphere of public domain and institutions as it represents an important informal institution (norm) in the country.
These proxies cannot in all cases be unanimously assigned to one single sphere of life. This is not surprising because the spheres of life are themselves interrelated and causally intertwined.
For each dimension, a cut‐off point is defined. People living in areas with values worse than this threshold are considered as marginalized in the respective dimension. Since marginality is a relative concept, the cut‐off points of the socio‐economic dimensions are defined in a country‐specific way, namely the national average. For other dimensions, the cut‐off points are defined based on values proposed in the literature (see below).
The definition of thresholds is always debatable. In this case, the national average is chosen as a compromise between allowing for variance in the data and the acknowledgment of the widespread extreme poverty in the country, especially in rural areas. In Ethiopia, the urban areas are usually the positive outliers, thus indicating what is possible in the country or more figuratively, indicating the nation‐specific center of a system. Thus, most rural areas would fall below a threshold that would set higher standards. On the other hand, setting lower standards, e.g. defining a threshold at the bottom third, would consider many people as not being marginalized who live under extremely precarious conditions. For this reason, the national average is deemed to be the best threshold for socio‐economic variables combining relative and absolute aspects of deprivation. For the global land area with soil constraints, travel time to the next larger city as well as prevalence of stunting other thresholds are used since national averages are not considered as meaningful in these dimensions. The variables and the respective thresholds are discussed in the following.
ThedimensionsofmarginalityandtheirproxiesII‐2.2
The economic sphere of life is represented by the total monthly household expenditure. The Household Income and Consumption Expenditure survey (HICE) 2004/05, from which the data used here is taken, is the only dataset offering nationally representative data on household expenditures. Expenditure data is deemed to be useful to represent the economic sphere of life as expenditure data is usually considered as more informative about the wealth of a household than income data (Banerjee and Duflo, 2007; Deaton, 2004). The threshold used is the national average (1941.98 ETB). The national poverty line for Ethiopia in 2004/05 is not indicated in the HICE 2004/05 survey report and cannot be found elsewhere. It was 1075 ETB in 1995/6 and 3781 ETB in 2010/11, based on the cost of basic need method (Ministry of Finance and Economic Development (MoFED), 2012).
Marginality hotspots in Ethiopia
25
However, public poverty data in Ethiopia is often disputed (see e.g. Ahmed et al., 2007), which is another reason to take the national average as a threshold instead of the national (or another) poverty line. Yet, although the national average as threshold in this dimension does not correspond to the national poverty line, it is roughly consistent with $1 per day in purchasing power parity (PPP) and can therefore still serve as an indication for both marginality and poverty.
In this dimension, the value for Gambela is estimated as the HICE survey does not cover this region. Based on the wealth index provided by the DHS 2005, in which Gambela fares below the national average, the region is considered as marginalized in the economic dimension. Although the wealth index differs from household expenditure since it combines various indicators capturing household assets and utility services (Rutstein and Johnson, 2004), it can still be considered as an adequate substitute to capture the economic sphere of life given the lack of alternative expenditure data for Gambela.
The prevalence of stunting, i.e. low height for age (de Onis et al., 2011), represents the health and quality of life sphere. Children are defined as stunted if their height is below the fifth percentile of the reference population in height for age (Lewit and Kerrebrock, 1997). Stunting is also a measure for chronic undernutrition and thus a good overall indicator for health and hunger as it reflects long‐term cumulative effects of nutrition deficiency (Syrquin, 2011; Yohannes et al., 2010). The subnational dataset on “Prevalence of stunting among children under five by lowest available sub‐national administrative unit, varying years” was produced by the FAO Food Insecurity, Poverty and Environment Global GIS Database (FGGD) project8. The dataset relies on different sources such as DHS surveys, UNICEF MICS, WHO Global Database on Child Growth and Malnutrition as well as other national surveys. For Ethiopia, data is available at regional level. The threshold is determined to be at the value of 50%, the highest class of stunting identified by the FGGD data set. In other words, people in an area are considered as marginalized if 50% or more of the children are stunted.
Travel time to major cities is chosen as proxy representing the sphere of land scape design, land use and location. The dataset was developed by Nelson (2008). Combining information about population density, transport networks such as roads, navigable rivers or lakes, rails etc., land cover and slope, Nelson (2008) developed a cost‐distance model with which it is possible to calculate the travel time to certain locations of interests using land (road/off‐road) and water based means of travel (European Commission Joint Research Centre, Land Resource Management Unit, 2010 see also Table 1 for a list of input variables).
The cut‐off point for this dimension is determined to be where people need to travel for more than 10 hours to reach the next city with at least 50,000 inhabitants. The number of 50,000 is based on the agglomeration index proposed in the World Development Report 2009 that defines settlements with more than 50,000 inhabitants as ‘large’ (The World Bank, 2009, p. 54). Following this classification, about 30 cities in Ethiopia can be classified as ‘large’ (CSA, 2008). The threshold of 10 hours travel time – a relatively high value, corresponding to at least one full day travel – is chosen since it can be assumed that on the way to such a ‘large settlement’ there are smaller agglomerations that already satisfy a part of the demand that leads people to large cities (see also Graw and Ladenburger, 2012).
The percentage of households facing a health problem but not going to a health institution or traditional healer represents behavior and quality of life. This dimension is composed of two variables in the Welfare Monitoring Survey (WMS) of 2004/05, the latest available data when the marginality map was created. Of those people facing a health problem in the last 30 days before the survey, the fraction of people was calculated who did not visit any health institution or a traditional
8 The Food Insecurity, Poverty and Environment Global GIS Database (FGGD) was also implemented by FAO (as FIVIMS) as an initiative to improve the use of disaggregated spatial information on different scales, global and national level (Huddleston et al., 2006; see also http://geonetwork3.fao.org/fggd/).
Marginality hotspots in Ethiopia
26
healer. This indicator is thus a proxy for access to health care since it only takes into account people who really faced a health problem but did not seek professional advice. The threshold for this dimension is set at the national average (42%).
For this dimension, the value for Gambela needed to be estimated again as the WMS does not cover Gambela region. Data provided by the Ministry of Health (2010, p. 23) shows that Gambela fares above national average concerning the ratio of physicians, nurses, health officers and health extension workers per inhabitant. Therefore, people in Gambela are considered as not being marginalized in this dimension.
Similar to Graw and Ladenburger (2012) the dataset on “Global land area with soil constraints”, which was developed within the FGGD project, is used to represent the ecological sphere. The data on soil constraints is chosen as soils are a result of geomorphological and climatic conditions, hence also entailing information about the climate (see e.g. Strahler and Strahler, 2005). Furthermore, they are the basis of all agricultural production and thus central to the livelihoods of many Ethiopians. In this dataset, soil suitability for agriculture is assessed with the help of information on soil depth, chemical status and natural fertility, drainage and texture. Certain areas such as dunes, salt flats, deserts or glaciers are generally classified as unsuitable for agriculture (van Velthuizen et al., 2007).
For this dimensions, the national average is not a meaningful cut‐off. Rather, people living on soils falling in the categories of ‘frequent severe’ and ‘very frequent severe’ soil constraints as well as soils ‘unsuitable for agriculture’ according to the classification developed by the FAO (see also van Velthuizen et al., 2007) are considered as being marginalized in this dimension.
Access to safe drinking water is a very important aspect since it is central to health and adequate nutrition. The percentage of households getting their water from unprotected wells or springs captures the minimal part of the Ethiopian population without access to safe drinking water. Minimal because it is not said that water from other, seemingly better sources such as pipes is indeed of decent quality. The data used for this indicator stems from the DHS 2005, the latest version of the survey when the map was created. For this dimension the threshold is also the national average (13%).
The sphere of public domain and institution is captured by gender discrimination, which is measured by the indicator of “women saying wife beating is ok if she neglects the children”, taken from the DHS 2005. This indicator is especially interesting since it captures gender discrimination in form of beating women as well as the ‘adaptation problem’ described e.g. by Nussbaum (1997). The adaptation problem describes the situation that many women adapt to their deprivation and accept it as normal and even legitimate as a strategy to bear deprivation and suppression.9 Also for this dimension the cut‐off point is the national average (62%).
9 Other indices like questions about preference of sending a boy rather than a girl to school or asking children whether they see their father beating their mother would probably be more reliable indicators for capturing gender discrimination since domestic violence is usually underreported (Yigzaw et al., 2005). Yet, due to a lack of such data and the advantage of capturing the adaptation problem the wife beating‐indicator is chosen.
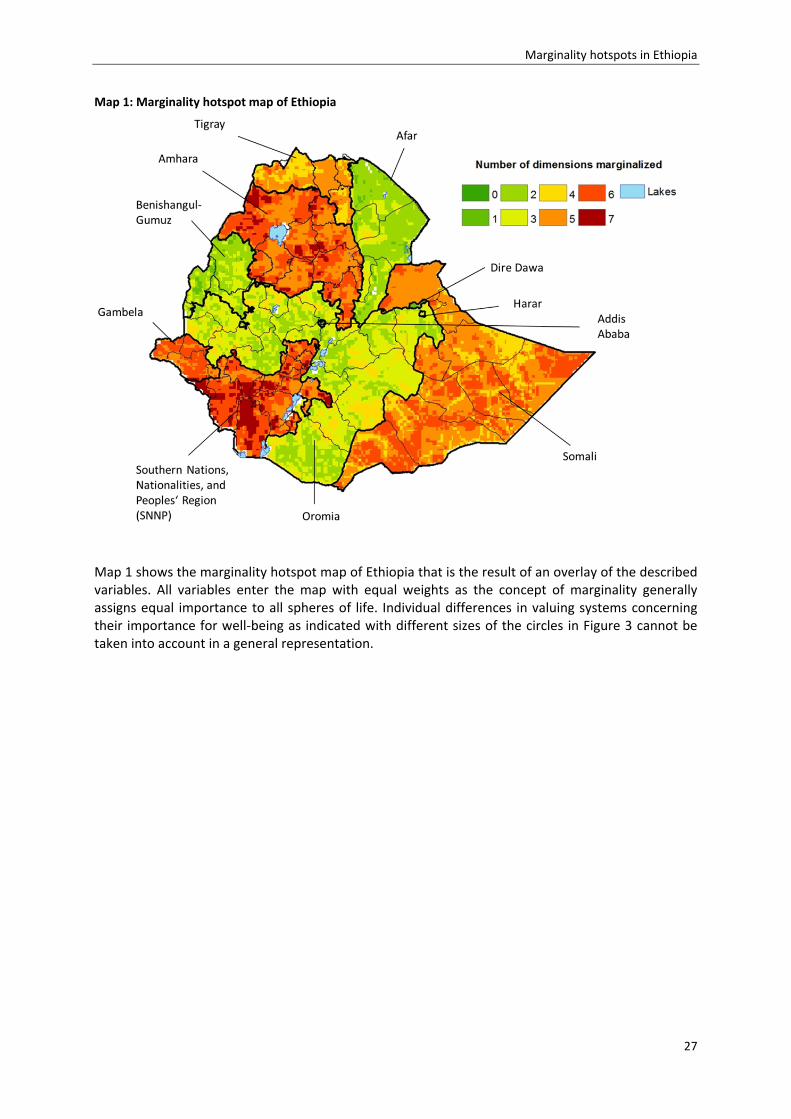
Marginality hotspots in Ethiopia
27
Map 1: Marginality hotspot map of Ethiopia
Map 1 shows the marginality hotspot map of Ethiopia that is the result of an overlay of the described variables. All variables enter the map with equal weights as the concept of marginality generally assigns equal importance to all spheres of life. Individual differences in valuing systems concerning their importance for well‐being as indicated with different sizes of the circles in Figure 3 cannot be taken into account in a general representation.
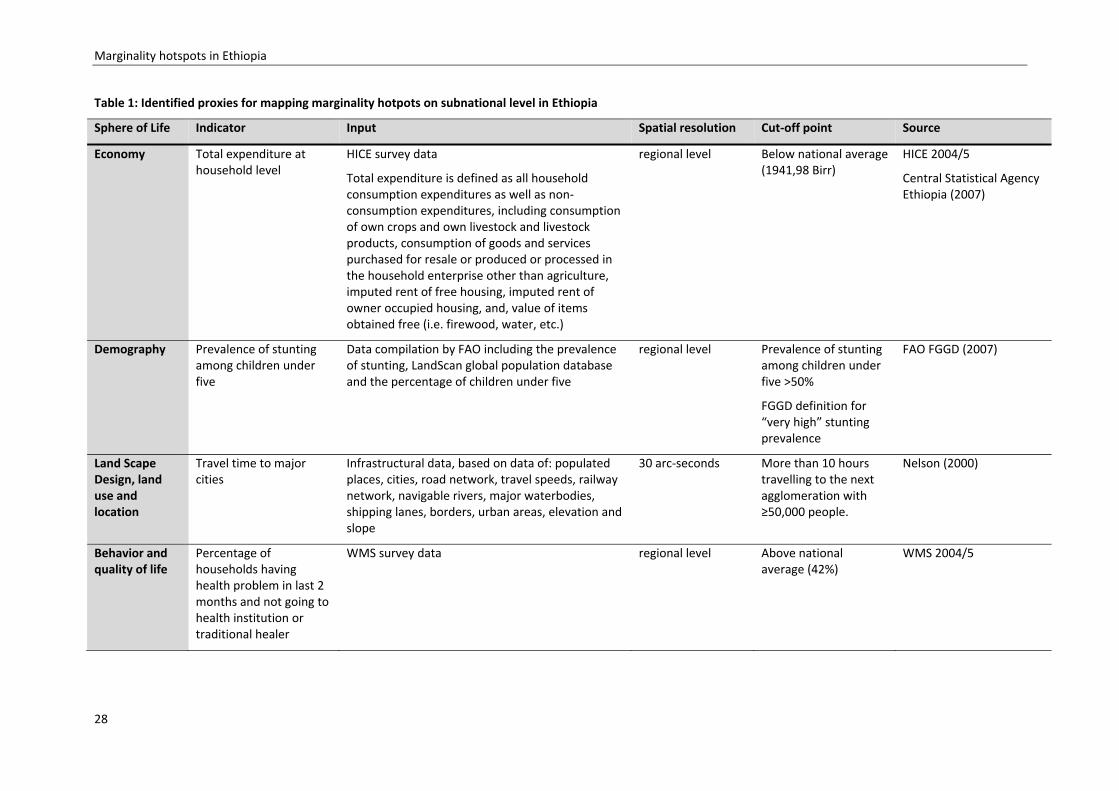
Marginality hotspots in Ethiopia
28
Table 1: Identified proxies for mapping marginality hotpots on subnational level in Ethiopia
Sphere of Life Indicator Input Spatial resolution Cut‐off point Source
Economy Total expenditure at household level
HICE survey data
Total expenditure is defined as all household consumption expenditures as well as non‐consumption expenditures, including consumption of own crops and own livestock and livestock products, consumption of goods and services purchased for resale or produced or processed in the household enterprise other than agriculture, imputed rent of free housing, imputed rent of owner occupied housing, and, value of items obtained free (i.e. firewood, water, etc.)
regional level Below national average (1941,98 Birr)
HICE 2004/5
Central Statistical Agency Ethiopia (2007)
Demography Prevalence of stunting among children under five
Data compilation by FAO including the prevalence of stunting, LandScan global population database and the percentage of children under five
regional level Prevalence of stunting among children under five >50%
FGGD definition for “very high” stunting prevalence
FAO FGGD (2007)
Land Scape Design, land use and location
Travel time to major cities
Infrastructural data, based on data of: populated places, cities, road network, travel speeds, railway network, navigable rivers, major waterbodies, shipping lanes, borders, urban areas, elevation and slope
30 arc‐seconds More than 10 hours travelling to the next agglomeration with ≥50,000 people.
Nelson (2000)
Behavior and quality of life
Percentage of households having health problem in last 2 months and not going to health institution or traditional healer
WMS survey data regional level Above national average (42%)
WMS 2004/5
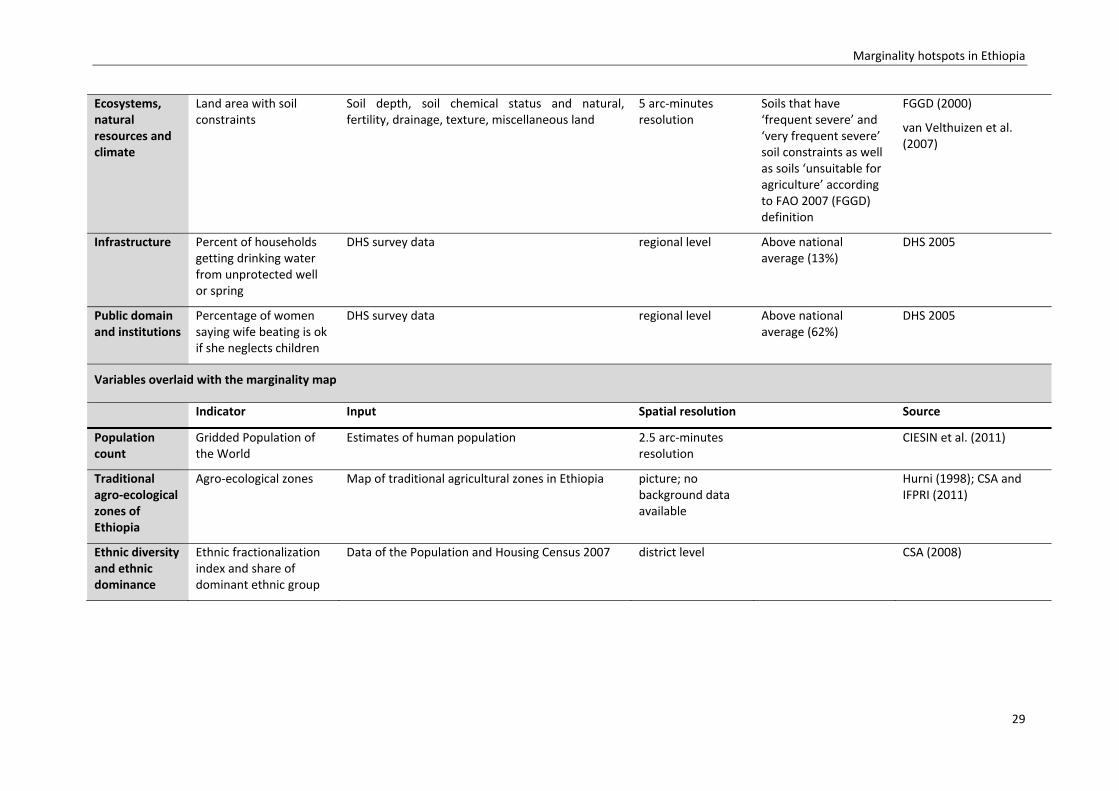
Marginality hotspots in Ethiopia
29
Ecosystems, natural resources and climate
Land area with soil constraints
Soil depth, soil chemical status and natural, fertility, drainage, texture, miscellaneous land
5 arc‐minutes resolution
Soils that have ‘frequent severe’ and ‘very frequent severe’ soil constraints as well as soils ‘unsuitable for agriculture’ according to FAO 2007 (FGGD) definition
FGGD (2000)
van Velthuizen et al. (2007)
Infrastructure Percent of households getting drinking water from unprotected well or spring
DHS survey data regional level Above national average (13%)
DHS 2005
Public domain and institutions
Percentage of women saying wife beating is ok if she neglects children
DHS survey data regional level Above nationalaverage (62%)
DHS 2005
Variables overlaid with the marginality map
Indicator Input Spatial resolution Source
Population count
Gridded Population of the World
Estimates of human population 2.5 arc‐minutesresolution
CIESIN et al. (2011)
Traditional agro‐ecological zones of Ethiopia
Agro‐ecological zones Map of traditional agricultural zones in Ethiopia picture; no background data available
Hurni (1998); CSA and IFPRI (2011)
Ethnic diversity and ethnic dominance
Ethnic fractionalization index and share of dominant ethnic group
Data of the Population and Housing Census 2007 district level CSA (2008)
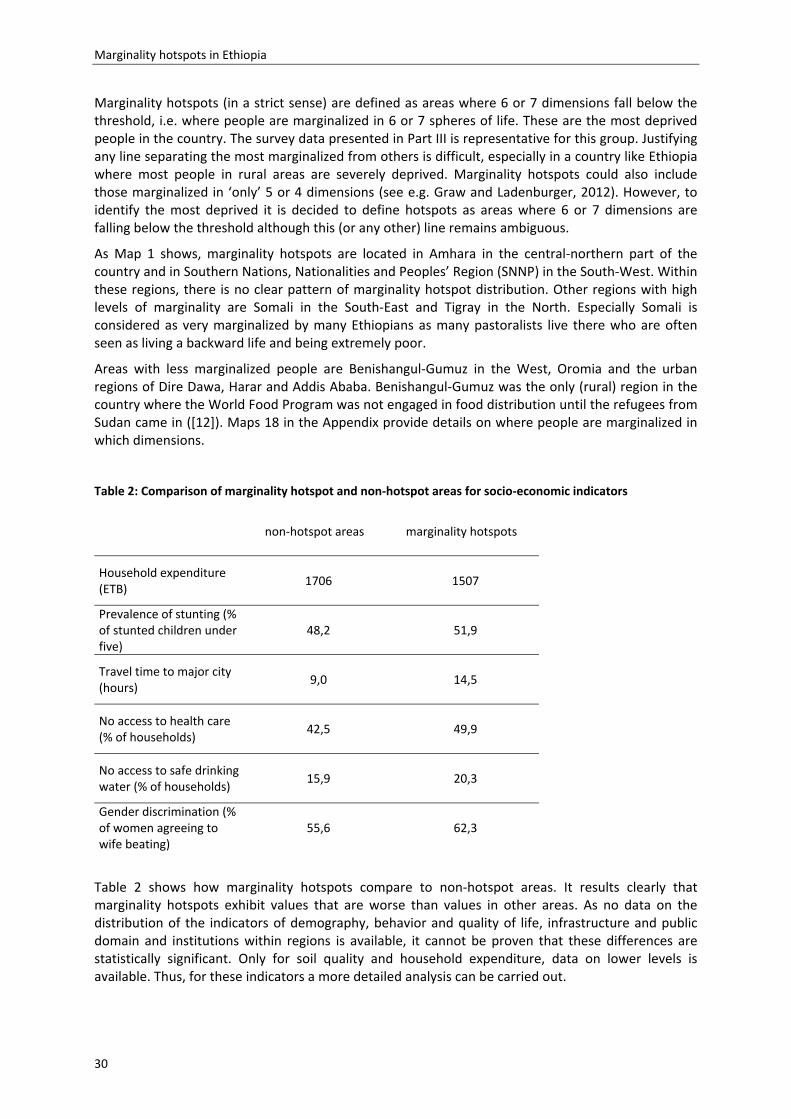
Marginality hotspots in Ethiopia
30
Marginality hotspots (in a strict sense) are defined as areas where 6 or 7 dimensions fall below the threshold, i.e. where people are marginalized in 6 or 7 spheres of life. These are the most deprived people in the country. The survey data presented in Part III is representative for this group. Justifying any line separating the most marginalized from others is difficult, especially in a country like Ethiopia where most people in rural areas are severely deprived. Marginality hotspots could also include those marginalized in ‘only’ 5 or 4 dimensions (see e.g. Graw and Ladenburger, 2012). However, to identify the most deprived it is decided to define hotspots as areas where 6 or 7 dimensions are falling below the threshold although this (or any other) line remains ambiguous.
As Map 1 shows, marginality hotspots are located in Amhara in the central‐northern part of the country and in Southern Nations, Nationalities and Peoples’ Region (SNNP) in the South‐West. Within these regions, there is no clear pattern of marginality hotspot distribution. Other regions with high levels of marginality are Somali in the South‐East and Tigray in the North. Especially Somali is considered as very marginalized by many Ethiopians as many pastoralists live there who are often seen as living a backward life and being extremely poor.
Areas with less marginalized people are Benishangul‐Gumuz in the West, Oromia and the urban regions of Dire Dawa, Harar and Addis Ababa. Benishangul‐Gumuz was the only (rural) region in the country where the World Food Program was not engaged in food distribution until the refugees from Sudan came in ([12]). Maps 18 in the Appendix provide details on where people are marginalized in which dimensions.
Table 2: Comparison of marginality hotspot and non‐hotspot areas for socio‐economic indicators
non‐hotspot areas marginality hotspots
Household expenditure (ETB)
1706 1507
Prevalence of stunting (% of stunted children under five)
48,2 51,9
Travel time to major city (hours)
9,0 14,5
No access to health care (% of households)
42,5 49,9
No access to safe drinking water (% of households)
15,9 20,3
Gender discrimination (% of women agreeing to wife beating)
55,6 62,3
Table 2 shows how marginality hotspots compare to non‐hotspot areas. It results clearly that marginality hotspots exhibit values that are worse than values in other areas. As no data on the distribution of the indicators of demography, behavior and quality of life, infrastructure and public domain and institutions within regions is available, it cannot be proven that these differences are statistically significant. Only for soil quality and household expenditure, data on lower levels is available. Thus, for these indicators a more detailed analysis can be carried out.
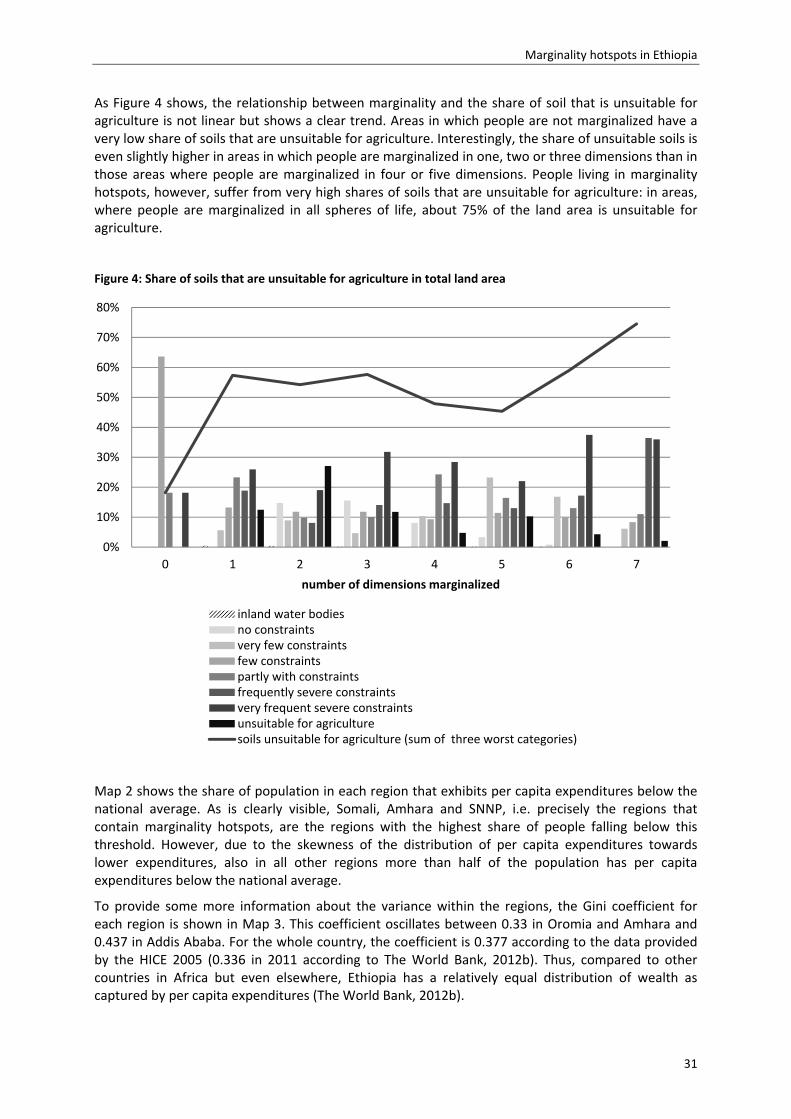
Marginality hotspots in Ethiopia
31
As Figure 4 shows, the relationship between marginality and the share of soil that is unsuitable for agriculture is not linear but shows a clear trend. Areas in which people are not marginalized have a very low share of soils that are unsuitable for agriculture. Interestingly, the share of unsuitable soils is even slightly higher in areas in which people are marginalized in one, two or three dimensions than in those areas where people are marginalized in four or five dimensions. People living in marginality hotspots, however, suffer from very high shares of soils that are unsuitable for agriculture: in areas, where people are marginalized in all spheres of life, about 75% of the land area is unsuitable for agriculture.
Figure 4: Share of soils that are unsuitable for agriculture in total land area
Map 2 shows the share of population in each region that exhibits per capita expenditures below the national average. As is clearly visible, Somali, Amhara and SNNP, i.e. precisely the regions that contain marginality hotspots, are the regions with the highest share of people falling below this threshold. However, due to the skewness of the distribution of per capita expenditures towards lower expenditures, also in all other regions more than half of the population has per capita expenditures below the national average.
To provide some more information about the variance within the regions, the Gini coefficient for each region is shown in Map 3. This coefficient oscillates between 0.33 in Oromia and Amhara and 0.437 in Addis Ababa. For the whole country, the coefficient is 0.377 according to the data provided by the HICE 2005 (0.336 in 2011 according to The World Bank, 2012b). Thus, compared to other countries in Africa but even elsewhere, Ethiopia has a relatively equal distribution of wealth as captured by per capita expenditures (The World Bank, 2012b).
0%
10%
20%
30%
40%
50%
60%
70%
80%
0 1 2 3 4 5 6 7
number of dimensions marginalized
inland water bodiesno constraintsvery few constraintsfew constraintspartly with constraintsfrequently severe constraintsvery frequent severe constraintsunsuitable for agriculturesoils unsuitable for agriculture (sum of three worst categories)

Marginality hotspots in Ethiopia
32
As Map 3 shows, the inequality within regions containing marginality hotspots is among the lowest across all regions. Thus, while caution is still demanded when interpreting the marginality hotspot map as intra‐regional variance is not captured for several dimensions of marginality, at least for the economic sphere of life, inequality in regions with marginality hotspots is not exceedingly high.
SensitivityanalysisandvalidationofthemarginalityhotspotmapII‐2.3
As a kind of sensitivity analysis concerning the chosen cut‐off points another marginality hotspot map is produced using the lowest, i.e. ‘worst’ quartile as threshold for the socio‐economic indicators instead of the national average, 12 hours instead of 10 hours travel time to the next agglomeration and the two most severe classes of soil constraints (see Table 3; data sources as in Table 1 if not indicated otherwise). As Map 4 shows, the general geographic distribution of marginality hotspot areas remains unchanged when changing the cut‐off points (see also Maps 19 in the Appendix for the single dimensions of marginality with the new thresholds). SNNP and Amhara are still the two regions with people being marginalized in most dimensions, followed by Somali and Tigray. What is interesting is that there is no area anymore where people are marginalized in all 7 dimensions simultaneously. Nevertheless, the identification of marginality hotspots does not seem to be very sensitive to the definition of the thresholds as the general distributional pattern does not change. In the following, Map 1 is used as basis for the analysis since the general high level of deprivation in the country suggests using the map with the lower thresholds, in the present case national averages.
Map 3: Gini coefficient for each region
Map 2: Share of population with per capita expenditures below national average
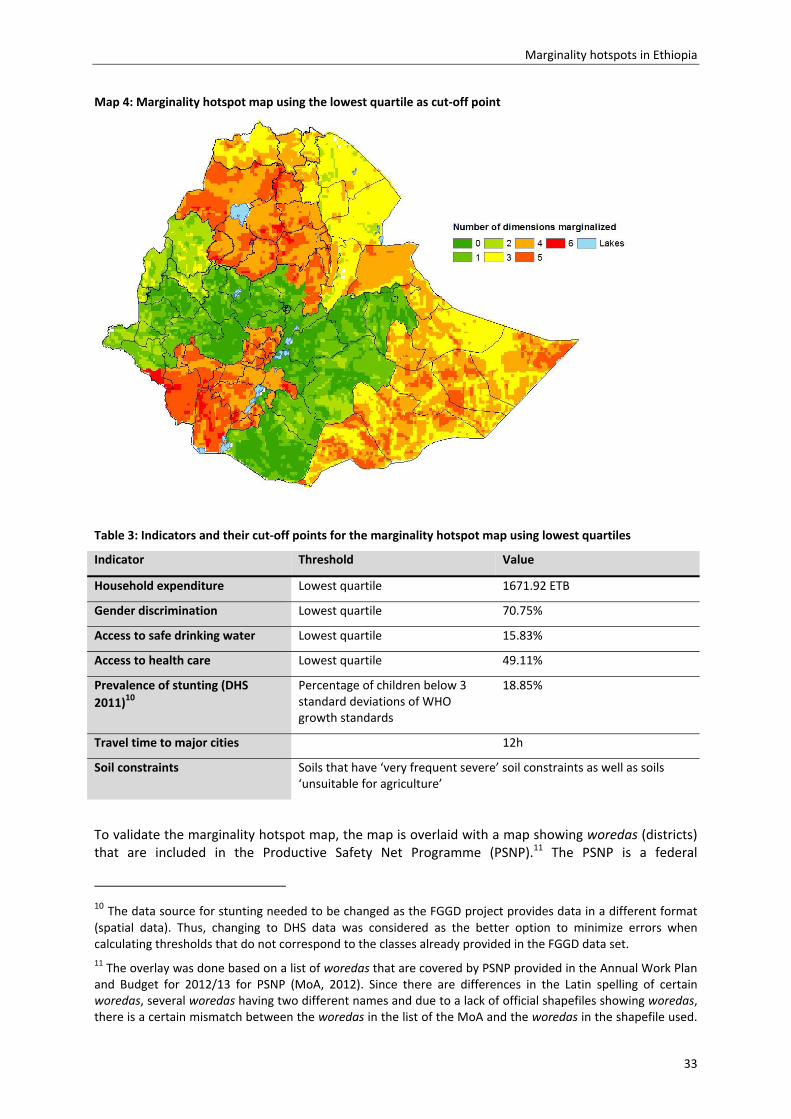
Marginality hotspots in Ethiopia
33
Map 4: Marginality hotspot map using the lowest quartile as cut‐off point
Table 3: Indicators and their cut‐off points for the marginality hotspot map using lowest quartiles
Indicator Threshold Value
Household expenditure Lowest quartile 1671.92 ETB
Gender discrimination Lowest quartile 70.75%
Access to safe drinking water Lowest quartile 15.83%
Access to health care Lowest quartile 49.11%
Prevalence of stunting (DHS
2011)10
Percentage of children below 3 standard deviations of WHO growth standards
18.85%
Travel time to major cities 12h
Soil constraints Soils that have ‘very frequent severe’ soil constraints as well as soils ‘unsuitable for agriculture’
To validate the marginality hotspot map, the map is overlaid with a map showing woredas (districts) that are included in the Productive Safety Net Programme (PSNP).11 The PSNP is a federal
10 The data source for stunting needed to be changed as the FGGD project provides data in a different format (spatial data). Thus, changing to DHS data was considered as the better option to minimize errors when calculating thresholds that do not correspond to the classes already provided in the FGGD data set. 11 The overlay was done based on a list of woredas that are covered by PSNP provided in the Annual Work Plan and Budget for 2012/13 for PSNP (MoA, 2012). Since there are differences in the Latin spelling of certain woredas, several woredas having two different names and due to a lack of official shapefiles showing woredas, there is a certain mismatch between the woredas in the list of the MoA and the woredas in the shapefile used.
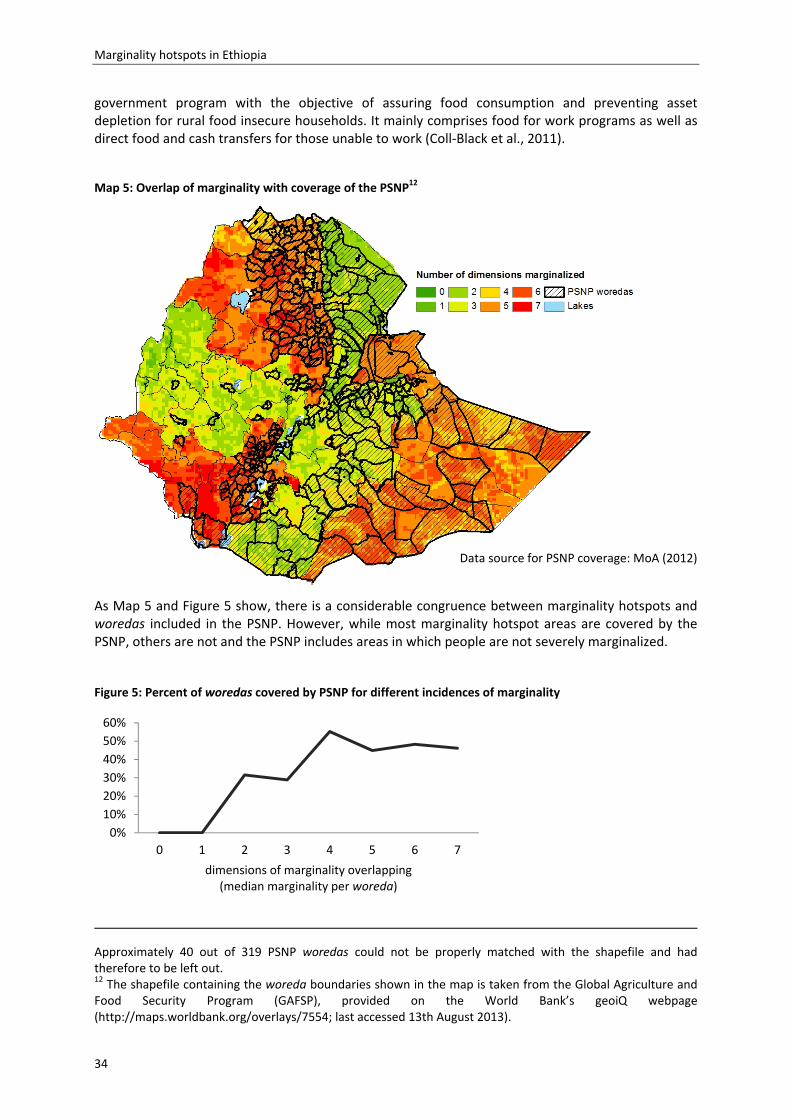
Marginality hotspots in Ethiopia
34
government program with the objective of assuring food consumption and preventing asset depletion for rural food insecure households. It mainly comprises food for work programs as well as direct food and cash transfers for those unable to work (Coll‐Black et al., 2011).
Map 5: Overlap of marginality with coverage of the PSNP12
As Map 5 and Figure 5 show, there is a considerable congruence between marginality hotspots and woredas included in the PSNP. However, while most marginality hotspot areas are covered by the PSNP, others are not and the PSNP includes areas in which people are not severely marginalized.
Figure 5: Percent of woredas covered by PSNP for different incidences of marginality
Approximately 40 out of 319 PSNP woredas could not be properly matched with the shapefile and had therefore to be left out. 12 The shapefile containing the woreda boundaries shown in the map is taken from the Global Agriculture and Food Security Program (GAFSP), provided on the World Bank’s geoiQ webpage (http://maps.worldbank.org/overlays/7554; last accessed 13th August 2013).
0%
10%
20%
30%
40%
50%
60%
0 1 2 3 4 5 6 7
dimensions of marginality overlapping(median marginality per woreda)
Data source for PSNP coverage: MoA (2012)
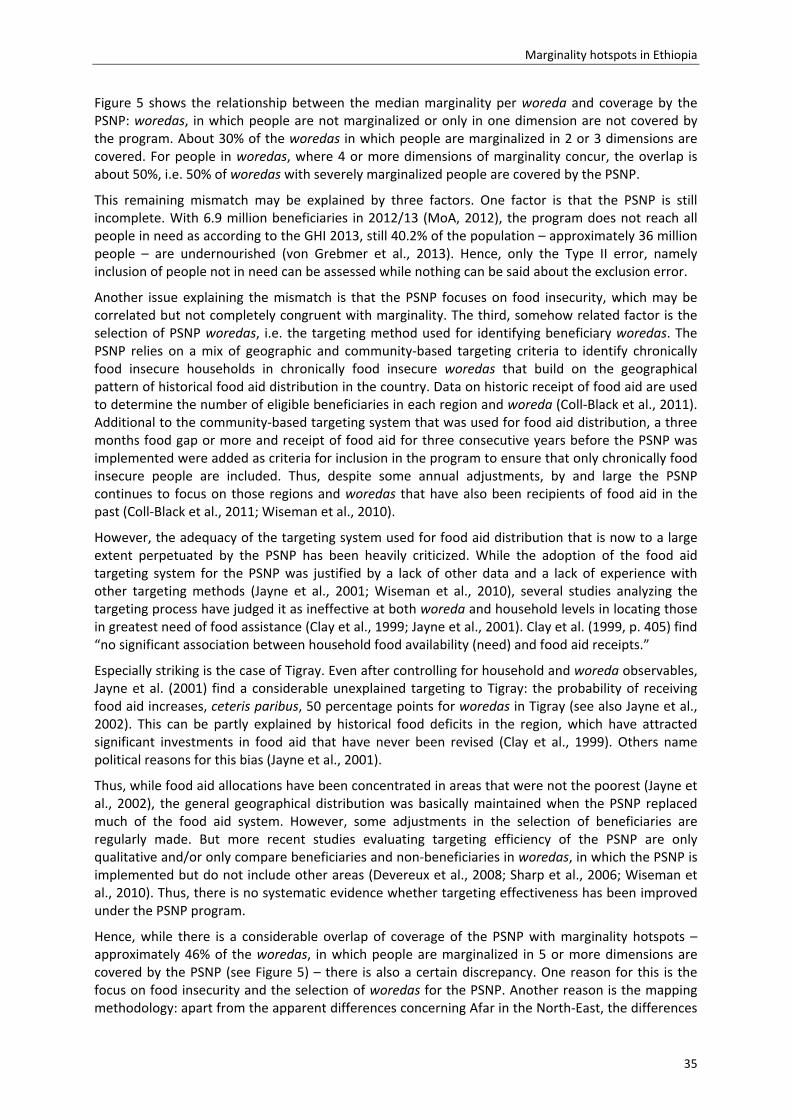
Marginality hotspots in Ethiopia
35
Figure 5 shows the relationship between the median marginality per woreda and coverage by the PSNP: woredas, in which people are not marginalized or only in one dimension are not covered by the program. About 30% of the woredas in which people are marginalized in 2 or 3 dimensions are covered. For people in woredas, where 4 or more dimensions of marginality concur, the overlap is about 50%, i.e. 50% of woredas with severely marginalized people are covered by the PSNP.
This remaining mismatch may be explained by three factors. One factor is that the PSNP is still incomplete. With 6.9 million beneficiaries in 2012/13 (MoA, 2012), the program does not reach all people in need as according to the GHI 2013, still 40.2% of the population – approximately 36 million people – are undernourished (von Grebmer et al., 2013). Hence, only the Type II error, namely inclusion of people not in need can be assessed while nothing can be said about the exclusion error.
Another issue explaining the mismatch is that the PSNP focuses on food insecurity, which may be correlated but not completely congruent with marginality. The third, somehow related factor is the selection of PSNP woredas, i.e. the targeting method used for identifying beneficiary woredas. The PSNP relies on a mix of geographic and community‐based targeting criteria to identify chronically food insecure households in chronically food insecure woredas that build on the geographical pattern of historical food aid distribution in the country. Data on historic receipt of food aid are used to determine the number of eligible beneficiaries in each region and woreda (Coll‐Black et al., 2011). Additional to the community‐based targeting system that was used for food aid distribution, a three months food gap or more and receipt of food aid for three consecutive years before the PSNP was implemented were added as criteria for inclusion in the program to ensure that only chronically food insecure people are included. Thus, despite some annual adjustments, by and large the PSNP continues to focus on those regions and woredas that have also been recipients of food aid in the past (Coll‐Black et al., 2011; Wiseman et al., 2010).
However, the adequacy of the targeting system used for food aid distribution that is now to a large extent perpetuated by the PSNP has been heavily criticized. While the adoption of the food aid targeting system for the PSNP was justified by a lack of other data and a lack of experience with other targeting methods (Jayne et al., 2001; Wiseman et al., 2010), several studies analyzing the targeting process have judged it as ineffective at both woreda and household levels in locating those in greatest need of food assistance (Clay et al., 1999; Jayne et al., 2001). Clay et al. (1999, p. 405) find “no significant association between household food availability (need) and food aid receipts.”
Especially striking is the case of Tigray. Even after controlling for household and woreda observables, Jayne et al. (2001) find a considerable unexplained targeting to Tigray: the probability of receiving food aid increases, ceteris paribus, 50 percentage points for woredas in Tigray (see also Jayne et al., 2002). This can be partly explained by historical food deficits in the region, which have attracted significant investments in food aid that have never been revised (Clay et al., 1999). Others name political reasons for this bias (Jayne et al., 2001).
Thus, while food aid allocations have been concentrated in areas that were not the poorest (Jayne et al., 2002), the general geographical distribution was basically maintained when the PSNP replaced much of the food aid system. However, some adjustments in the selection of beneficiaries are regularly made. But more recent studies evaluating targeting efficiency of the PSNP are only qualitative and/or only compare beneficiaries and non‐beneficiaries in woredas, in which the PSNP is implemented but do not include other areas (Devereux et al., 2008; Sharp et al., 2006; Wiseman et al., 2010). Thus, there is no systematic evidence whether targeting effectiveness has been improved under the PSNP program.
Hence, while there is a considerable overlap of coverage of the PSNP with marginality hotspots – approximately 46% of the woredas, in which people are marginalized in 5 or more dimensions are covered by the PSNP (see Figure 5) – there is also a certain discrepancy. One reason for this is the focus on food insecurity and the selection of woredas for the PSNP. Another reason is the mapping methodology: apart from the apparent differences concerning Afar in the North‐East, the differences
Marginality hotspots in Ethiopia
36
in Oromia, where people are marginalized in only few dimensions but the PSNP targets several woredas, can be explained by using national levels as thresholds for the socio‐economic dimensions. Thus, while people in Oromia are on average above the threshold in several dimensions, there may still be many people who are poor and food insecure.
LimitationsofthemappingapproachandimplicationsforfurtheranalysesII‐2.4
The way the marginality map is constructed, i.e. the definition of the spheres of life, the variables representing them and the thresholds chosen bear some limitations. One such limitation is that an analysis of the relationships among the seven variables used for the marginality hotspot mapping is not possible. The reason is that for five variables the data is only available on regional level while for two variables (accessibility and soil constraints) the data is on pixel level. Additional to the difficulties of comparing data on so different levels it is likely that there is a considerable ‘ecological bias’. As Rothman et al. (2008, p. 519) put it, an “ecologic bias can be interpreted as the failure of associations seen at one level of grouping to correspond to effect measures at the grouping level of interest. For example, relations observed in county‐level data may poorly track relations that exist at the individual level […] or at the neighborhood level […], and so would be biased if individual‐level or neighborhood‐Ievel relations were of interest […]”. Thus, the different spatial levels of the data do not permit a more detailed investigation of the relationships between these variables.
Another important limitation is the use of region‐level data for most of the socio‐economic indicators. Data on such a high level considerably smooth variation within a region, let alone within woredas and kebeles (villages). Although virtually all rural areas in Ethiopia exhibit high prevalences of poverty and food insecurity (Coll‐Black et al., 2011; Jayne et al., 2001; Woldehanna et al., 2008a), there are variations in wealth within woredas and kebeles. However, as there is no data on lower levels that is representative for the whole country, the marginality hotspot map had to be created relying on higher‐level data. However, at least for the economic dimension, this limitation could be ameliorated by looking at the intra‐regional distribution of expenditures and by showing intra‐regional inequality in separated maps.
In addition, as marginalized people are identified based on the location where they live, this implies that all people living in a marginality hotspot are considered as marginalized although some people in these areas might not be affected, e.g., by a lack of access to health care or to safe drinking water. On the other hand, people in areas that are not classified as marginality hotspots may be deprived in several spheres of life but do not appear in the marginality hotspot map. This implication, which is mainly relevant for the socio‐economic dimensions, is a result of the available data and the chosen methodology. National‐level mapping exercises are not apt to show differences on individual or household level. Thus, when interpreting the marginality hotspot map, it should be kept in mind that within‐regional variation exists but is not captured in the maps presented.
These limitations have some implications for the estimations of the number of marginalized poor people (Section II‐3) and of market sizes (Section III‐4.4.1). However, as the more detailed analysis of the distribution of per capita expenditure within and across regions shows, the drawbacks of the use of regional level data may not be that severe: First, low inequality implies that summarizing all people living in a marginality hotspot area may not be that distortionary. Secondly, while not all people within marginality hotspots are equally marginalized, people in other areas that exhibit average values above the thresholds are actually deprived in several dimensions. Thus, the inclusion error may be cancelled out by the exclusion error. Furthermore, since the estimation of market sizes is based on the survey data that is representative for all people living in marginality hotspots, the intra‐hotspot variance is captured in this data and thus enters the estimation of market sizes.
A last critical point is the definition of marginality hotspots as areas showing values worse than the thresholds in 6 or 7 dimensions. This definition was necessary to identify the poorest and marginalized but does not imply that those being marginalized in ‘only’ 5 dimensions are
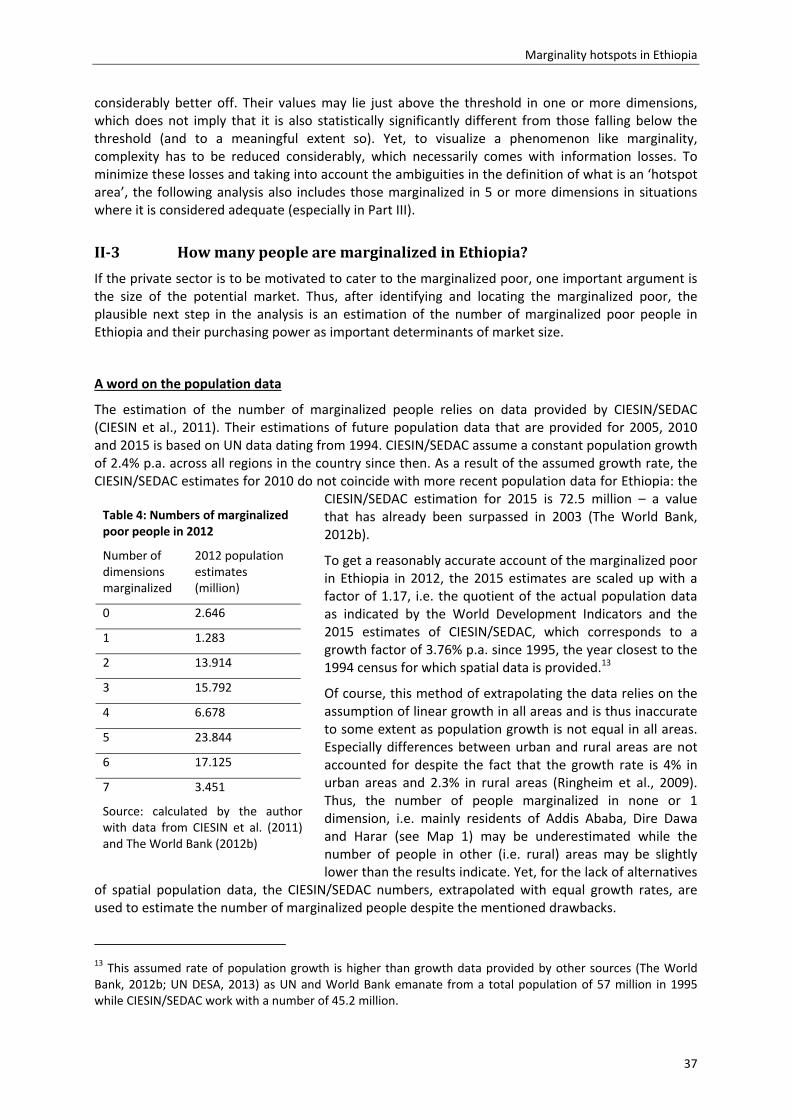
Marginality hotspots in Ethiopia
37
considerably better off. Their values may lie just above the threshold in one or more dimensions, which does not imply that it is also statistically significantly different from those falling below the threshold (and to a meaningful extent so). Yet, to visualize a phenomenon like marginality, complexity has to be reduced considerably, which necessarily comes with information losses. To minimize these losses and taking into account the ambiguities in the definition of what is an ‘hotspot area’, the following analysis also includes those marginalized in 5 or more dimensions in situations where it is considered adequate (especially in Part III).
II‐3 HowmanypeoplearemarginalizedinEthiopia?
If the private sector is to be motivated to cater to the marginalized poor, one important argument is the size of the potential market. Thus, after identifying and locating the marginalized poor, the plausible next step in the analysis is an estimation of the number of marginalized poor people in Ethiopia and their purchasing power as important determinants of market size.
A word on the population data
The estimation of the number of marginalized people relies on data provided by CIESIN/SEDAC (CIESIN et al., 2011). Their estimations of future population data that are provided for 2005, 2010 and 2015 is based on UN data dating from 1994. CIESIN/SEDAC assume a constant population growth of 2.4% p.a. across all regions in the country since then. As a result of the assumed growth rate, the CIESIN/SEDAC estimates for 2010 do not coincide with more recent population data for Ethiopia: the
CIESIN/SEDAC estimation for 2015 is 72.5 million – a value that has already been surpassed in 2003 (The World Bank, 2012b).
To get a reasonably accurate account of the marginalized poor in Ethiopia in 2012, the 2015 estimates are scaled up with a factor of 1.17, i.e. the quotient of the actual population data as indicated by the World Development Indicators and the 2015 estimates of CIESIN/SEDAC, which corresponds to a growth factor of 3.76% p.a. since 1995, the year closest to the 1994 census for which spatial data is provided.13
Of course, this method of extrapolating the data relies on the assumption of linear growth in all areas and is thus inaccurate to some extent as population growth is not equal in all areas. Especially differences between urban and rural areas are not accounted for despite the fact that the growth rate is 4% in urban areas and 2.3% in rural areas (Ringheim et al., 2009). Thus, the number of people marginalized in none or 1 dimension, i.e. mainly residents of Addis Ababa, Dire Dawa and Harar (see Map 1) may be underestimated while the number of people in other (i.e. rural) areas may be slightly lower than the results indicate. Yet, for the lack of alternatives
of spatial population data, the CIESIN/SEDAC numbers, extrapolated with equal growth rates, are used to estimate the number of marginalized people despite the mentioned drawbacks.
13 This assumed rate of population growth is higher than growth data provided by other sources (The World Bank, 2012b; UN DESA, 2013) as UN and World Bank emanate from a total population of 57 million in 1995 while CIESIN/SEDAC work with a number of 45.2 million.
Table 4: Numbers of marginalized poor people in 2012
Number of dimensions marginalized
2012 population estimates (million)
0 2.646
1 1.283
2 13.914
3 15.792
4 6.678
5 23.844
6 17.125
7 3.451
Source: calculated by the author with data from CIESIN et al. (2011) and The World Bank (2012b)
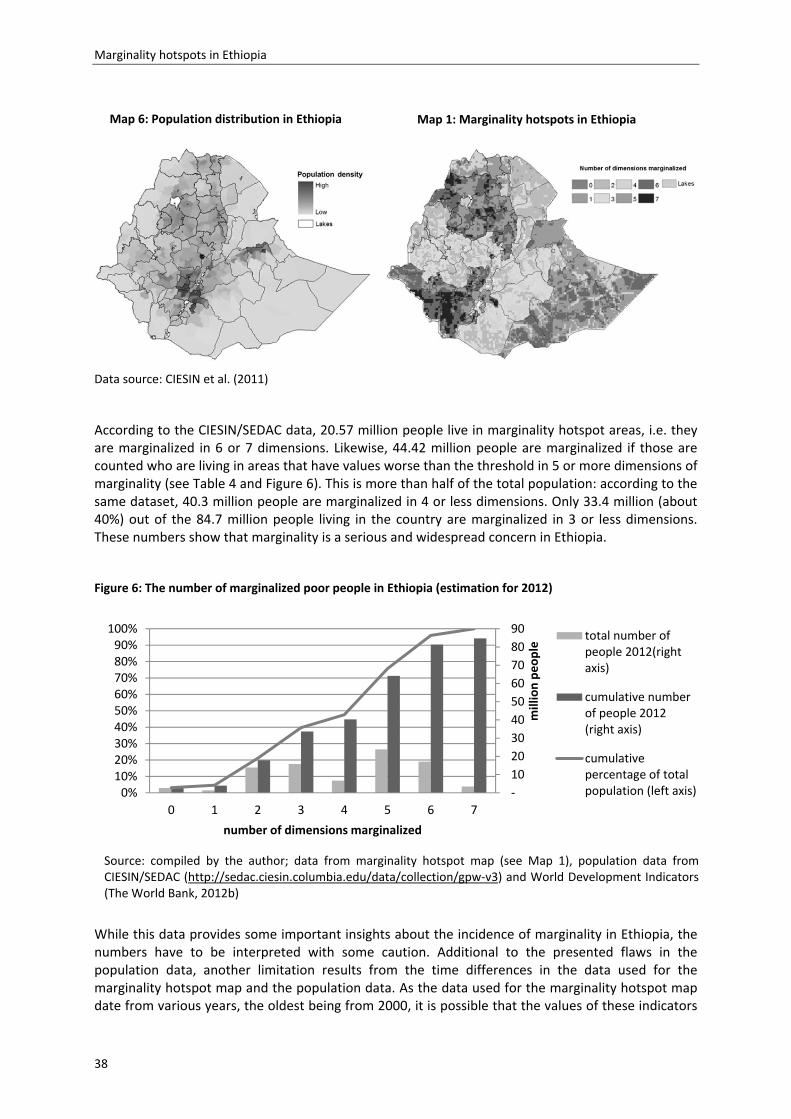
Marginality hotspots in Ethiopia
38
Data source: CIESIN et al. (2011)
According to the CIESIN/SEDAC data, 20.57 million people live in marginality hotspot areas, i.e. they are marginalized in 6 or 7 dimensions. Likewise, 44.42 million people are marginalized if those are counted who are living in areas that have values worse than the threshold in 5 or more dimensions of marginality (see Table 4 and Figure 6). This is more than half of the total population: according to the same dataset, 40.3 million people are marginalized in 4 or less dimensions. Only 33.4 million (about 40%) out of the 84.7 million people living in the country are marginalized in 3 or less dimensions. These numbers show that marginality is a serious and widespread concern in Ethiopia.
Figure 6: The number of marginalized poor people in Ethiopia (estimation for 2012)
While this data provides some important insights about the incidence of marginality in Ethiopia, the numbers have to be interpreted with some caution. Additional to the presented flaws in the population data, another limitation results from the time differences in the data used for the marginality hotspot map and the population data. As the data used for the marginality hotspot map date from various years, the oldest being from 2000, it is possible that the values of these indicators
Source: compiled by the author; data from marginality hotspot map (see Map 1), population data from CIESIN/SEDAC (http://sedac.ciesin.columbia.edu/data/collection/gpw‐v3) and World Development Indicators (The World Bank, 2012b)
‐
10
20
30
40
50
60
70
80
90
0%10%20%30%40%50%60%70%80%90%100%
0 1 2 3 4 5 6 7
million people
number of dimensions marginalized
total number ofpeople 2012(rightaxis)
cumulative numberof people 2012(right axis)
cumulativepercentage of totalpopulation (left axis)
Map 6: Population distribution in Ethiopia Map 1: Marginality hotspots in Ethiopia
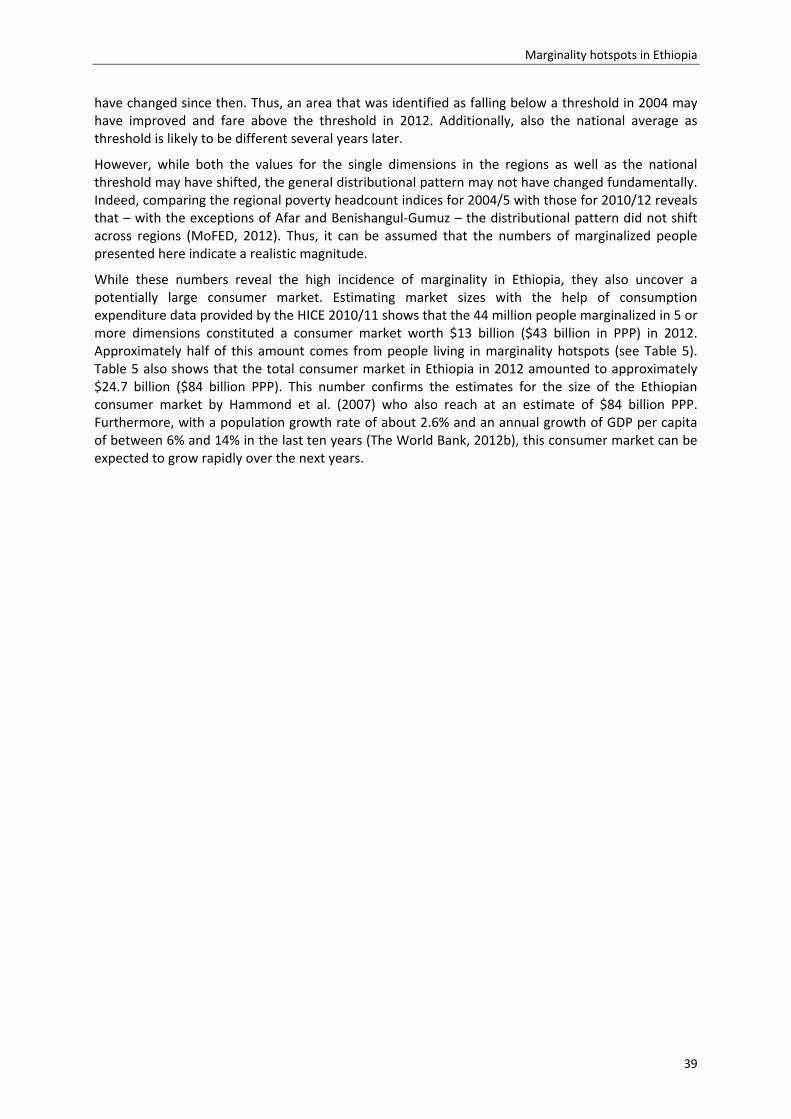
Marginality hotspots in Ethiopia
39
have changed since then. Thus, an area that was identified as falling below a threshold in 2004 may have improved and fare above the threshold in 2012. Additionally, also the national average as threshold is likely to be different several years later.
However, while both the values for the single dimensions in the regions as well as the national threshold may have shifted, the general distributional pattern may not have changed fundamentally. Indeed, comparing the regional poverty headcount indices for 2004/5 with those for 2010/12 reveals that – with the exceptions of Afar and Benishangul‐Gumuz – the distributional pattern did not shift across regions (MoFED, 2012). Thus, it can be assumed that the numbers of marginalized people presented here indicate a realistic magnitude.
While these numbers reveal the high incidence of marginality in Ethiopia, they also uncover a potentially large consumer market. Estimating market sizes with the help of consumption expenditure data provided by the HICE 2010/11 shows that the 44 million people marginalized in 5 or more dimensions constituted a consumer market worth $13 billion ($43 billion in PPP) in 2012. Approximately half of this amount comes from people living in marginality hotspots (see Table 5). Table 5 also shows that the total consumer market in Ethiopia in 2012 amounted to approximately $24.7 billion ($84 billion PPP). This number confirms the estimates for the size of the Ethiopian consumer market by Hammond et al. (2007) who also reach at an estimate of $84 billion PPP. Furthermore, with a population growth rate of about 2.6% and an annual growth of GDP per capita of between 6% and 14% in the last ten years (The World Bank, 2012b), this consumer market can be expected to grow rapidly over the next years.
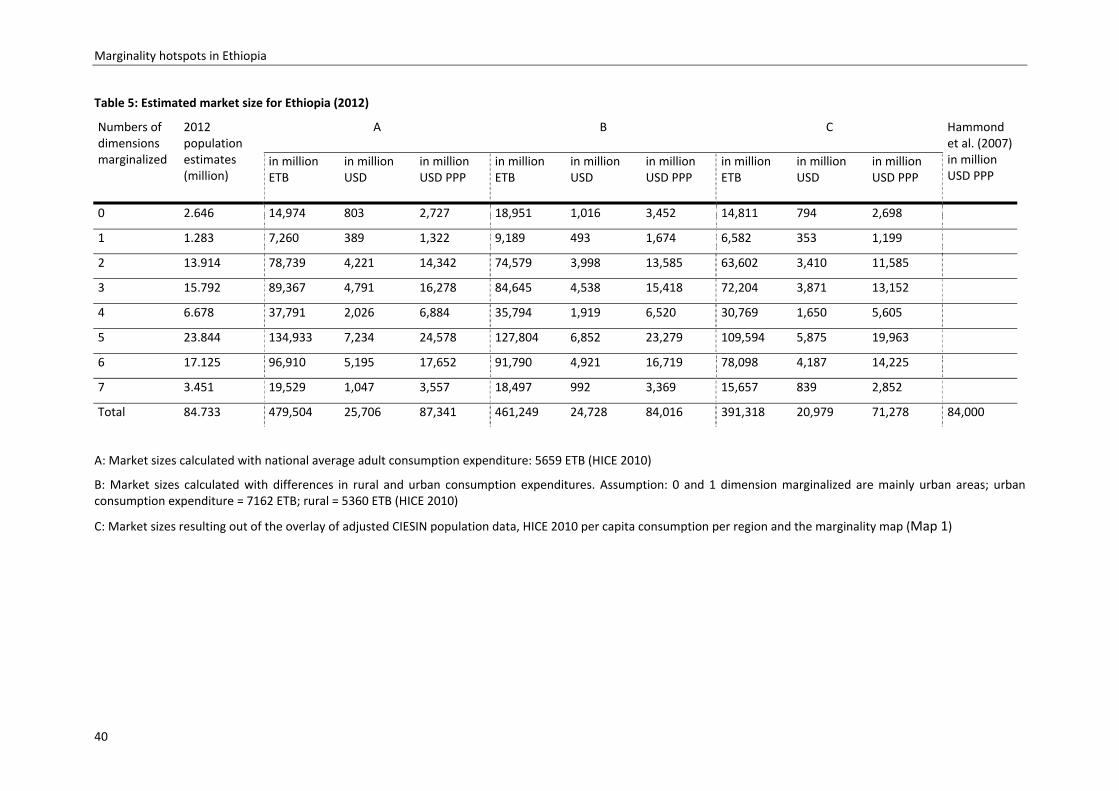
Marginality hotspots in Ethiopia
40
Table 5: Estimated market size for Ethiopia (2012)
Numbers of dimensions marginalized
2012 population estimates (million)
A B C Hammond et al. (2007) in million USD PPP
in million ETB
in million USD
in million USD PPP
in million ETB
in million USD
in million USD PPP
in million ETB
in million USD
in million USD PPP
0 2.646 14,974 803 2,727 18,951 1,016 3,452 14,811 794 2,698
1 1.283 7,260 389 1,322 9,189 493 1,674 6,582 353 1,199
2 13.914 78,739 4,221 14,342 74,579 3,998 13,585 63,602 3,410 11,585
3 15.792 89,367 4,791 16,278 84,645 4,538 15,418 72,204 3,871 13,152
4 6.678 37,791 2,026 6,884 35,794 1,919 6,520 30,769 1,650 5,605
5 23.844 134,933 7,234 24,578 127,804 6,852 23,279 109,594 5,875 19,963
6 17.125 96,910 5,195 17,652 91,790 4,921 16,719 78,098 4,187 14,225
7 3.451 19,529 1,047 3,557 18,497 992 3,369 15,657 839 2,852
Total 84.733 479,504 25,706 87,341 461,249 24,728 84,016 391,318 20,979 71,278 84,000
A: Market sizes calculated with national average adult consumption expenditure: 5659 ETB (HICE 2010)
B: Market sizes calculated with differences in rural and urban consumption expenditures. Assumption: 0 and 1 dimension marginalized are mainly urban areas; urban consumption expenditure = 7162 ETB; rural = 5360 ETB (HICE 2010)
C: Market sizes resulting out of the overlay of adjusted CIESIN population data, HICE 2010 per capita consumption per region and the marginality map (Map 1)
Marginality hotspots in Ethiopia
41
II‐4 Marginalityhotspotsandtheirconcurrencewithothersocio‐economicandagro‐ecologicfactors
The variables for the marginality hotspot mapping have been selected on the basis of the concept of marginality and the spheres of life. This concept has been developed for a global application, adaptation to the country level has happened mainly concerning the determination of certain thresholds. However, as countries are characterized by certain particularities, overlaying the marginality hotspot map with such peculiar phenomena helps to relate the concept of marginality to national conditions.
Two features that are especially salient in Ethiopia are the dominance of the agricultural sector in the economy (see also Part III) and the ethnic diversity that has also played a role in history and the formation of institutions (see e.g. Marcus, 2002).14 For these reasons, the marginality hotspot map is overlaid with a map of traditional agro‐ecological zones that indicate agricultural potential and cropping patterns and with maps showing ethnic diversity and ethnic dominance.
Marginalityhotspotsandagro‐ecologicalzonesII‐4.1
As most people in Ethiopia live on agriculture (Alemu, 2010; see also Part III) it is interesting to see whether marginality hotspots are concentrated in certain agro‐ecological zones. The location of agro‐ecological zones is correlated with the predominant soils and their suitability for agriculture, which is already a dimension of the marginality hotspot map. Nevertheless, it is worthwhile to see in how far the agricultural potential overlaps with marginality hotspots as such zones are defined not only by the predominant soils but also by rainfall patterns, altitude and other factors, thus possibly indicating areas of underused potential that could be exploited for marginality reduction.
Hurni (1998) reports that due to the importance of altitude for the country’s agro‐ecological systems, Ethiopian land users have traditionally classified the environment in relation to topography. This way, early travelers in the 18th century started to use the term 'kolla' for especially hot parts of the country, 'dega' traditionally meant ‘hill or high ground' while zones at high altitudes were usually named 'wurch'.
More specifically, a commonly agreed on classification for the predominant agro‐ecological zones in the country is as follows:
Wurch zone: in this zone, usually no rainfed crops are grown. Frost is a frequent phenomenon and afroalpine grasslands are the dominant land use type if altitudes are not too high;
Dega zone: crops such as barley, wheat, and pulses are grown but no teff and maize. Within Dega, the following differentiation can be made:
o high dega: only barley and sometimes potatoes are grown, but no wheat and pulses; o lower dega: still a relatively cold climate predominates but allows for cultivating
wheat and pulses additional to the crops grown in high dega but not for the cultivation of teff or maize;
Weyna Dega zone: this is the most dominant agricultural zone in Ethiopia. All major rainfed crops can be grown in most parts, particularly teff and maize. In lower parts of the zone, cash crops like coffee, tea or enset can be cultivated. Conditions allow for at least one cropping season per year.
Kolla zone: this zone lies below weyna dega, implying moisture limitations for crops such as maize, potatoes, wheat and pulses. The dominant crop is sorghum but also teff and maize
14 Of course, the list of Ethiopian peculiarities is much longer. However, these two features have been selected for their special relevance for the present research.
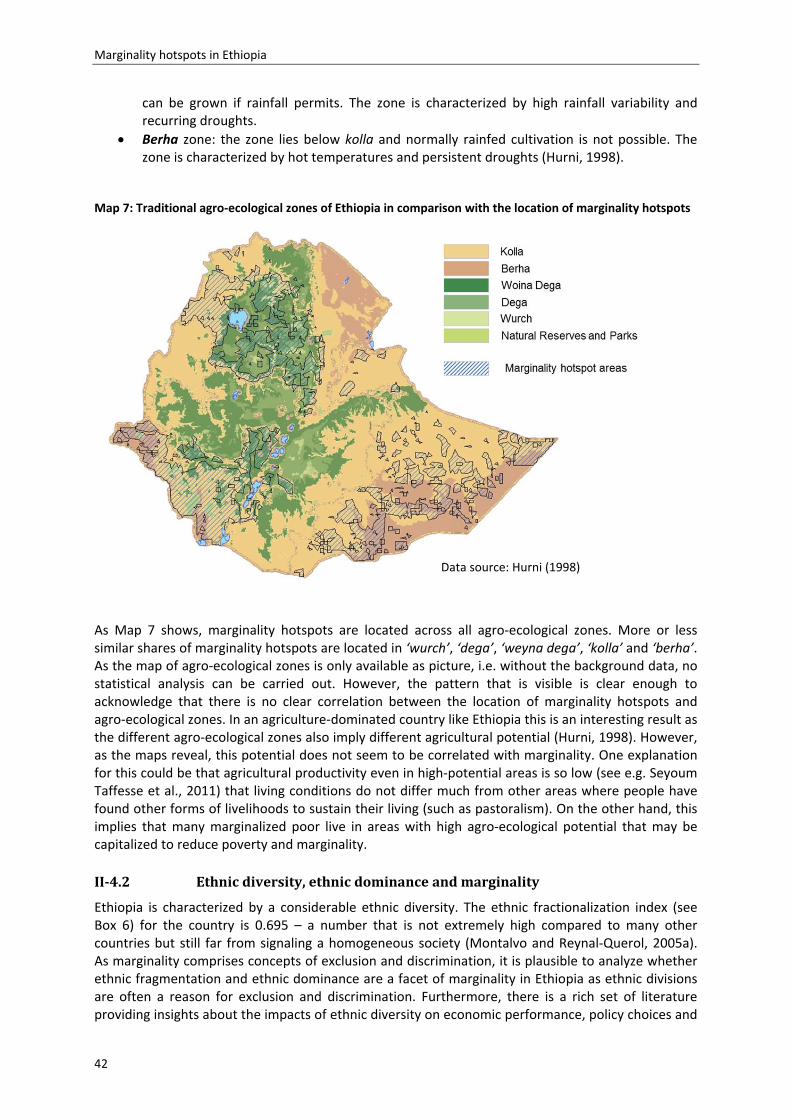
Marginality hotspots in Ethiopia
42
can be grown if rainfall permits. The zone is characterized by high rainfall variability and recurring droughts.
Berha zone: the zone lies below kolla and normally rainfed cultivation is not possible. The zone is characterized by hot temperatures and persistent droughts (Hurni, 1998).
Map 7: Traditional agro‐ecological zones of Ethiopia in comparison with the location of marginality hotspots
As Map 7 shows, marginality hotspots are located across all agro‐ecological zones. More or less similar shares of marginality hotspots are located in ‘wurch’, ‘dega’, ‘weyna dega’, ‘kolla’ and ‘berha’. As the map of agro‐ecological zones is only available as picture, i.e. without the background data, no statistical analysis can be carried out. However, the pattern that is visible is clear enough to acknowledge that there is no clear correlation between the location of marginality hotspots and agro‐ecological zones. In an agriculture‐dominated country like Ethiopia this is an interesting result as the different agro‐ecological zones also imply different agricultural potential (Hurni, 1998). However, as the maps reveal, this potential does not seem to be correlated with marginality. One explanation for this could be that agricultural productivity even in high‐potential areas is so low (see e.g. Seyoum Taffesse et al., 2011) that living conditions do not differ much from other areas where people have found other forms of livelihoods to sustain their living (such as pastoralism). On the other hand, this implies that many marginalized poor live in areas with high agro‐ecological potential that may be capitalized to reduce poverty and marginality.
Ethnicdiversity,ethnicdominanceandmarginalityII‐4.2
Ethiopia is characterized by a considerable ethnic diversity. The ethnic fractionalization index (see Box 6) for the country is 0.695 – a number that is not extremely high compared to many other countries but still far from signaling a homogeneous society (Montalvo and Reynal‐Querol, 2005a). As marginality comprises concepts of exclusion and discrimination, it is plausible to analyze whether ethnic fragmentation and ethnic dominance are a facet of marginality in Ethiopia as ethnic divisions are often a reason for exclusion and discrimination. Furthermore, there is a rich set of literature providing insights about the impacts of ethnic diversity on economic performance, policy choices and
Data source: Hurni (1998)
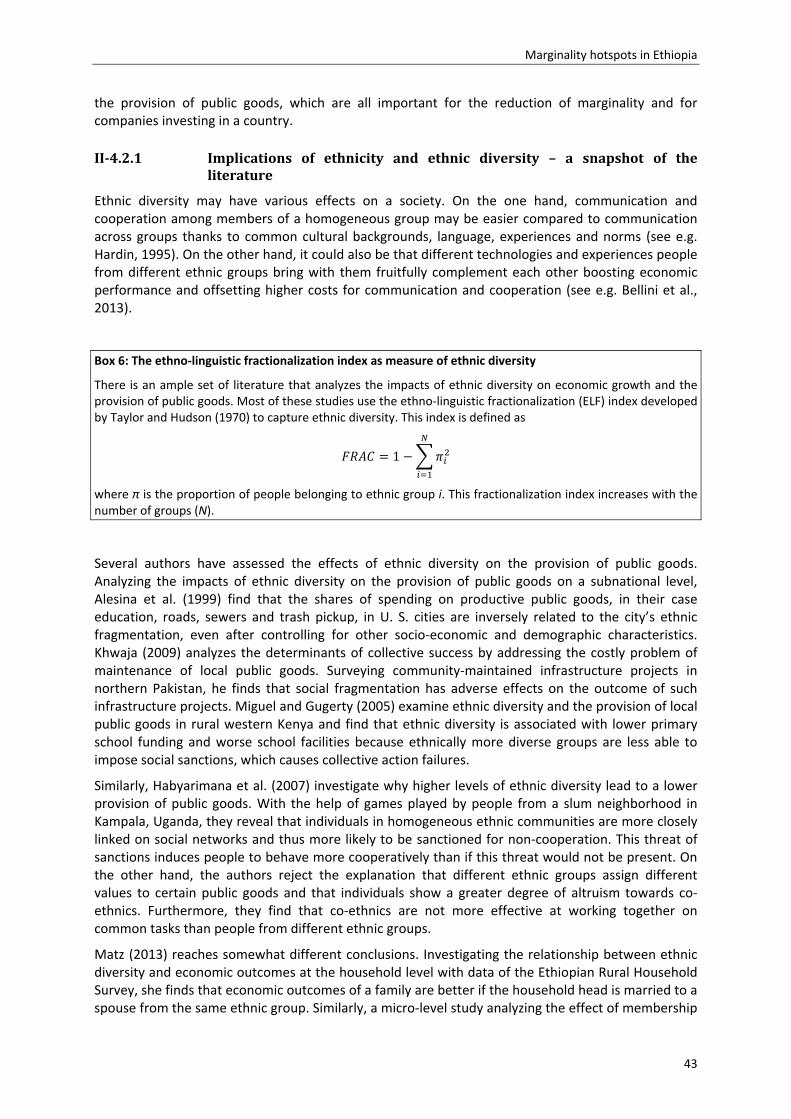
Marginality hotspots in Ethiopia
43
the provision of public goods, which are all important for the reduction of marginality and for companies investing in a country.
II‐4.2.1 Implications of ethnicity and ethnic diversity – a snapshot of theliterature
Ethnic diversity may have various effects on a society. On the one hand, communication and cooperation among members of a homogeneous group may be easier compared to communication across groups thanks to common cultural backgrounds, language, experiences and norms (see e.g. Hardin, 1995). On the other hand, it could also be that different technologies and experiences people from different ethnic groups bring with them fruitfully complement each other boosting economic performance and offsetting higher costs for communication and cooperation (see e.g. Bellini et al., 2013).
Box 6: The ethno‐linguistic fractionalization index as measure of ethnic diversity
There is an ample set of literature that analyzes the impacts of ethnic diversity on economic growth and the provision of public goods. Most of these studies use the ethno‐linguistic fractionalization (ELF) index developed by Taylor and Hudson (1970) to capture ethnic diversity. This index is defined as
1
where π is the proportion of people belonging to ethnic group i. This fractionalization index increases with the number of groups (N).
Several authors have assessed the effects of ethnic diversity on the provision of public goods. Analyzing the impacts of ethnic diversity on the provision of public goods on a subnational level, Alesina et al. (1999) find that the shares of spending on productive public goods, in their case education, roads, sewers and trash pickup, in U. S. cities are inversely related to the city’s ethnic fragmentation, even after controlling for other socio‐economic and demographic characteristics. Khwaja (2009) analyzes the determinants of collective success by addressing the costly problem of maintenance of local public goods. Surveying community‐maintained infrastructure projects in northern Pakistan, he finds that social fragmentation has adverse effects on the outcome of such infrastructure projects. Miguel and Gugerty (2005) examine ethnic diversity and the provision of local public goods in rural western Kenya and find that ethnic diversity is associated with lower primary school funding and worse school facilities because ethnically more diverse groups are less able to impose social sanctions, which causes collective action failures.
Similarly, Habyarimana et al. (2007) investigate why higher levels of ethnic diversity lead to a lower provision of public goods. With the help of games played by people from a slum neighborhood in Kampala, Uganda, they reveal that individuals in homogeneous ethnic communities are more closely linked on social networks and thus more likely to be sanctioned for non‐cooperation. This threat of sanctions induces people to behave more cooperatively than if this threat would not be present. On the other hand, the authors reject the explanation that different ethnic groups assign different values to certain public goods and that individuals show a greater degree of altruism towards co‐ethnics. Furthermore, they find that co‐ethnics are not more effective at working together on common tasks than people from different ethnic groups.
Matz (2013) reaches somewhat different conclusions. Investigating the relationship between ethnic diversity and economic outcomes at the household level with data of the Ethiopian Rural Household Survey, she finds that economic outcomes of a family are better if the household head is married to a spouse from the same ethnic group. Similarly, a micro‐level study analyzing the effect of membership
Marginality hotspots in Ethiopia
44
in kin groups on the Ghanaian labor market reveals that members of the locally dominant kin group reap a wage premium of 25% in the public sector of the Ghanaian labor market but none in the private sector (Collier and Garg, 1999).
Other studies examine the relationship between ethnic diversity and economic growth on higher levels, i.e. national scale. Montalvo and Reynal‐Querol (2005a) analyze how ethno‐linguistic and religious diversity affect economic development. They argue that when a society is divided into different groups tensions arise along these divisions. The authors derive three lines of influence: first, they cite rent‐seeking models that show that resources spent by groups in order to gain or maintain political influence are a kind of social cost that negatively affects economic growth since such investments are not productive and deviate resources from investments in the productive sector. Secondly, they argue that ethnic and religious differences can cause civil war (see also Reynal‐Querol, 2002). Furthermore, even if ethnic heterogeneity causes only the potential of conflict, it negatively affects growth because instability and uncertainty reduce investments. And finally, they argue that ethnic diversity induces governments to increase government consumption in order to mitigate potential conflict, which negatively affects growth as well. When empirically testing these hypotheses with data of 138 countries, they find that ethno‐linguistic fractionalization directly affects growth in a negative way (Montalvo and Reynal‐Querol, 2005a, 2005b; 2002).
These results are in line with findings of other authors that ethnic diversity explains much of the poor economic growth performance in Africa by impeding agreements about the provision of public goods and creating incentives for growth‐reducing policies that ensure rents for the groups in power at the expense of the society at large (Easterly and Levine, 1997). Also Mauro (1995) finds a strong negative relationship between ethno‐linguistic fractionalization and investments and thus economic growth.
Collier (2001), however, argues that ethnic diversity “does not, usually, cause slower growth and it does not, usually, cause civil war” (p. 130 f.). Borrowing from findings in New Institutional Economics (Greif, 1992; Posner, 1980), he argues that kinship creates social bonds that lower transaction costs by creating clear rules of lifetime membership, thus overcoming problems of adverse selection and moral hazard. Furthermore, he reasons that kin groups help to enforce bilateral contracts among group members and provide a web of insurances by establishing reciprocal obligations among group members. Thus, a society with several such groups might be more efficient than a homogeneous but atomized society (Collier, 2001). Differentiating his results for political systems, he finds that ethnic diversity does not reduce economic growth in democracies but lowers growth in dictatorships while ethnic dominance reduces growth independently from the political system. Collier (2001) also finds that ethnic diversity alters the productivity of capital, making private capital stocks more and public ones less productive compared to homogeneous societies, although the effects are not large and only significant at the 10% level.
Not only ethnic diversity but also ethnicity has been found to be important in explaining differences in wealth and economic performance. Michalopoulos and Papaioannou (2014) look at ethnicity and economic development in Sub‐Sahara Africa and find that national institutions do not explain differences in economic performance within ethnic groups that live in areas that are divided by national borders. The authors conclude that ethnicity fixed effects are more important for economic performance than national institutions (Michalopoulos and Papaioannou, 2014).
Similarly, Alesina et al. (2012) analyze differences in well‐being across ethnic groups within countries. They find that a considerable part of ethnic inequality can be explained by differences in geographic endowments across ethnic homelands. Furthermore, the authors show that ethnic inequality within countries goes hand in hand with lower levels of development of the whole country.
Furthermore, ‘culture’ – defined as “those customary beliefs, values, and social constraints that ethnic, religious, and social groups transmit fairly unchanged from generation to generation” (Sapienza et al., 2006, p. 3) and thus closely related to ethnicity – has also been found to cause
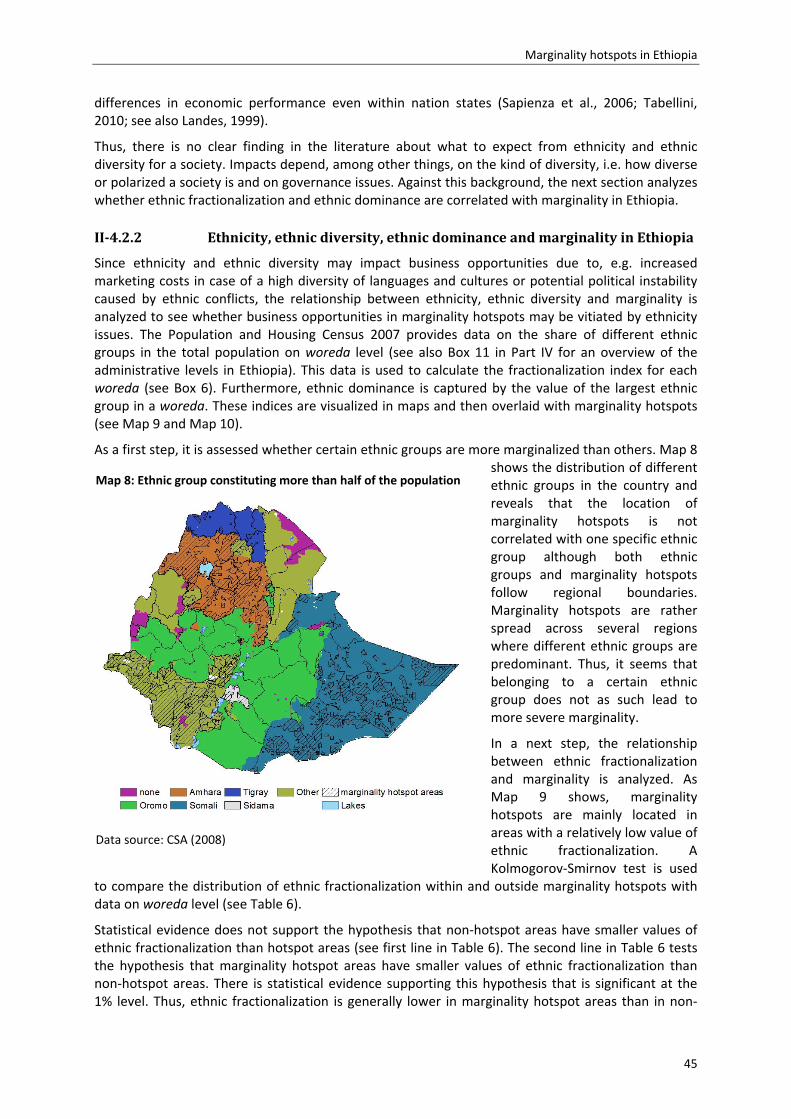
Marginality hotspots in Ethiopia
45
differences in economic performance even within nation states (Sapienza et al., 2006; Tabellini, 2010; see also Landes, 1999).
Thus, there is no clear finding in the literature about what to expect from ethnicity and ethnic diversity for a society. Impacts depend, among other things, on the kind of diversity, i.e. how diverse or polarized a society is and on governance issues. Against this background, the next section analyzes whether ethnic fractionalization and ethnic dominance are correlated with marginality in Ethiopia.
II‐4.2.2 Ethnicity,ethnicdiversity,ethnicdominanceandmarginalityinEthiopia
Since ethnicity and ethnic diversity may impact business opportunities due to, e.g. increased marketing costs in case of a high diversity of languages and cultures or potential political instability caused by ethnic conflicts, the relationship between ethnicity, ethnic diversity and marginality is analyzed to see whether business opportunities in marginality hotspots may be vitiated by ethnicity issues. The Population and Housing Census 2007 provides data on the share of different ethnic groups in the total population on woreda level (see also Box 11 in Part IV for an overview of the administrative levels in Ethiopia). This data is used to calculate the fractionalization index for each woreda (see Box 6). Furthermore, ethnic dominance is captured by the value of the largest ethnic group in a woreda. These indices are visualized in maps and then overlaid with marginality hotspots (see Map 9 and Map 10).
As a first step, it is assessed whether certain ethnic groups are more marginalized than others. Map 8 shows the distribution of different ethnic groups in the country and reveals that the location of marginality hotspots is not correlated with one specific ethnic group although both ethnic groups and marginality hotspots follow regional boundaries. Marginality hotspots are rather spread across several regions where different ethnic groups are predominant. Thus, it seems that belonging to a certain ethnic group does not as such lead to more severe marginality.
In a next step, the relationship between ethnic fractionalization and marginality is analyzed. As Map 9 shows, marginality hotspots are mainly located in areas with a relatively low value of ethnic fractionalization. A Kolmogorov‐Smirnov test is used
to compare the distribution of ethnic fractionalization within and outside marginality hotspots with data on woreda level (see Table 6).
Statistical evidence does not support the hypothesis that non‐hotspot areas have smaller values of ethnic fractionalization than hotspot areas (see first line in Table 6). The second line in Table 6 tests the hypothesis that marginality hotspot areas have smaller values of ethnic fractionalization than non‐hotspot areas. There is statistical evidence supporting this hypothesis that is significant at the 1% level. Thus, ethnic fractionalization is generally lower in marginality hotspot areas than in non‐
Map 8: Ethnic group constituting more than half of the population
Data source: CSA (2008)
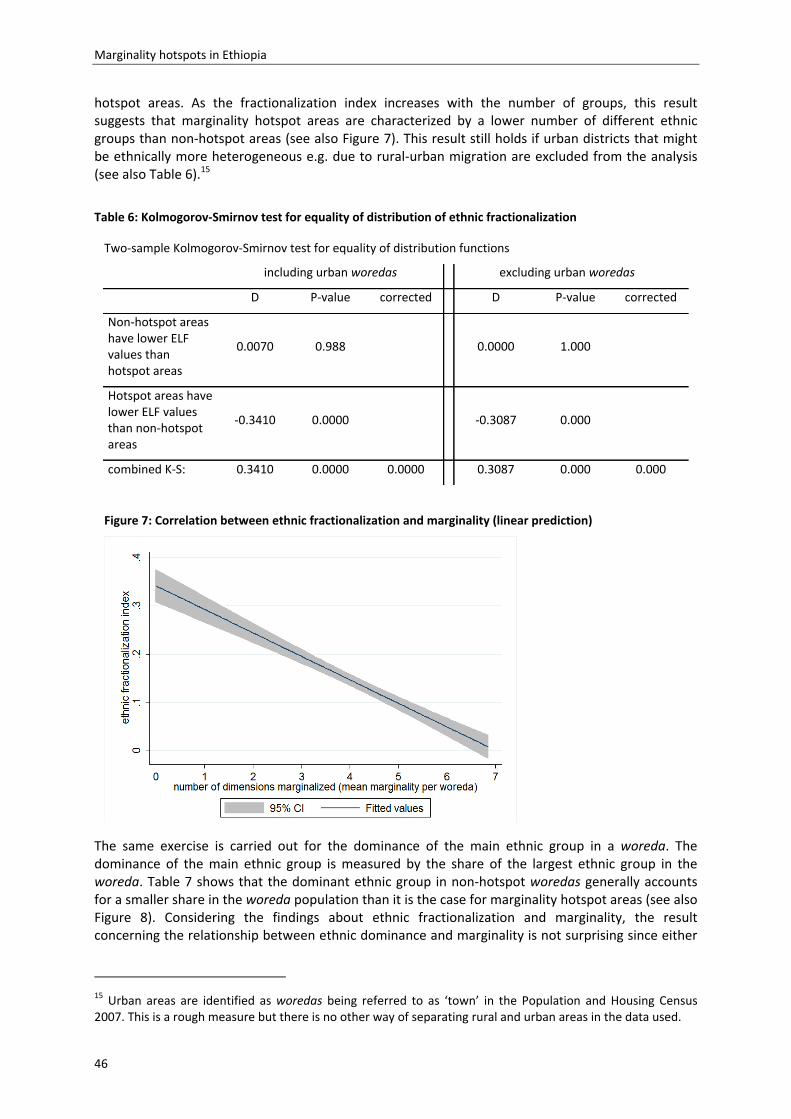
Marginality hotspots in Ethiopia
46
hotspot areas. As the fractionalization index increases with the number of groups, this result suggests that marginality hotspot areas are characterized by a lower number of different ethnic groups than non‐hotspot areas (see also Figure 7). This result still holds if urban districts that might be ethnically more heterogeneous e.g. due to rural‐urban migration are excluded from the analysis (see also Table 6).15
The same exercise is carried out for the dominance of the main ethnic group in a woreda. The dominance of the main ethnic group is measured by the share of the largest ethnic group in the woreda. Table 7 shows that the dominant ethnic group in non‐hotspot woredas generally accounts for a smaller share in the woreda population than it is the case for marginality hotspot areas (see also Figure 8). Considering the findings about ethnic fractionalization and marginality, the result concerning the relationship between ethnic dominance and marginality is not surprising since either
15 Urban areas are identified as woredas being referred to as ‘town’ in the Population and Housing Census 2007. This is a rough measure but there is no other way of separating rural and urban areas in the data used.
Figure 7: Correlation between ethnic fractionalization and marginality (linear prediction)
Two‐sample Kolmogorov‐Smirnov test for equality of distribution functions
including urban woredas excluding urban woredas
D P‐value corrected D P‐value corrected
Non‐hotspot areas have lower ELF values than hotspot areas
0.0070 0.988
0.0000 1.000
Hotspot areas have lower ELF values than non‐hotspot areas
‐0.3410 0.0000
‐0.3087 0.000
combined K‐S: 0.3410 0.0000 0.0000 0.3087 0.000 0.000
Table 6: Kolmogorov‐Smirnov test for equality of distribution of ethnic fractionalization
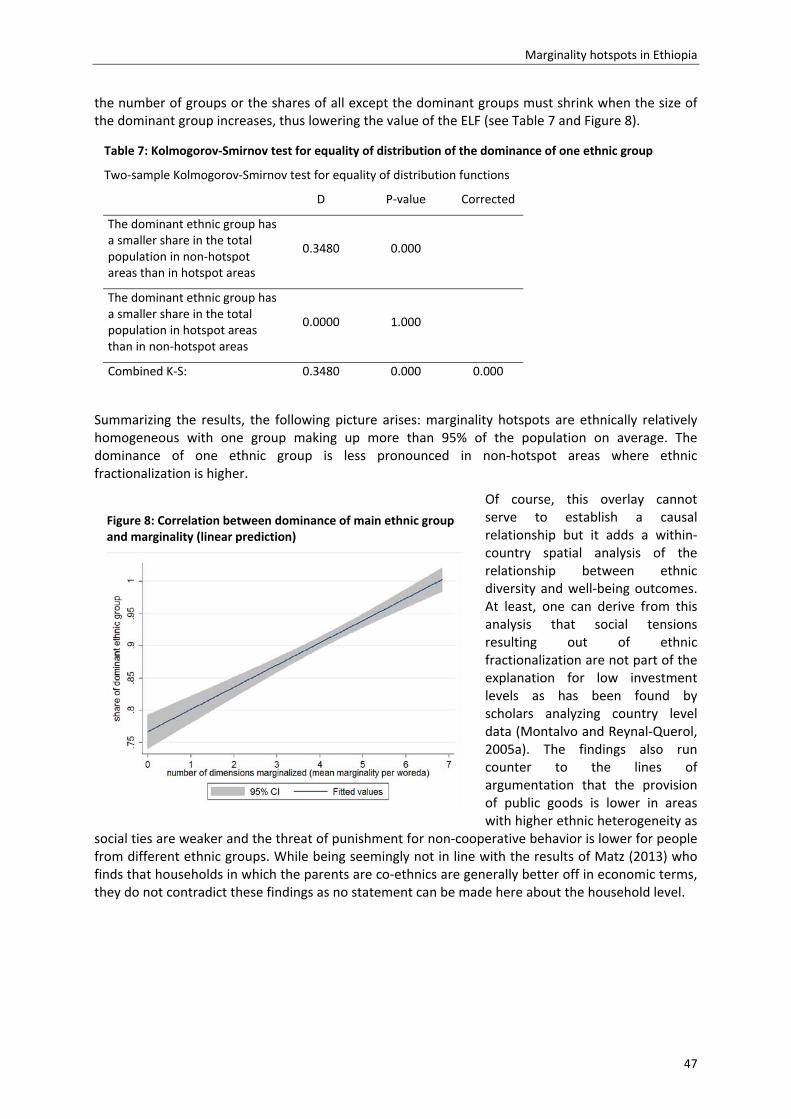
Marginality hotspots in Ethiopia
47
the number of groups or the shares of all except the dominant groups must shrink when the size of the dominant group increases, thus lowering the value of the ELF (see Table 7 and Figure 8).
Summarizing the results, the following picture arises: marginality hotspots are ethnically relatively homogeneous with one group making up more than 95% of the population on average. The dominance of one ethnic group is less pronounced in non‐hotspot areas where ethnic fractionalization is higher.
Of course, this overlay cannot serve to establish a causal relationship but it adds a within‐country spatial analysis of the relationship between ethnic diversity and well‐being outcomes. At least, one can derive from this analysis that social tensions resulting out of ethnic fractionalization are not part of the explanation for low investment levels as has been found by scholars analyzing country level data (Montalvo and Reynal‐Querol, 2005a). The findings also run counter to the lines of argumentation that the provision of public goods is lower in areas with higher ethnic heterogeneity as
social ties are weaker and the threat of punishment for non‐cooperative behavior is lower for people from different ethnic groups. While being seemingly not in line with the results of Matz (2013) who finds that households in which the parents are co‐ethnics are generally better off in economic terms, they do not contradict these findings as no statement can be made here about the household level.
Table 7: Kolmogorov‐Smirnov test for equality of distribution of the dominance of one ethnic group
Two‐sample Kolmogorov‐Smirnov test for equality of distribution functions
D P‐value Corrected
The dominant ethnic group has a smaller share in the total population in non‐hotspot areas than in hotspot areas
0.3480 0.000
The dominant ethnic group has a smaller share in the total population in hotspot areas than in non‐hotspot areas
0.0000 1.000
Combined K‐S: 0.3480 0.000 0.000
Figure 8: Correlation between dominance of main ethnic group and marginality (linear prediction)
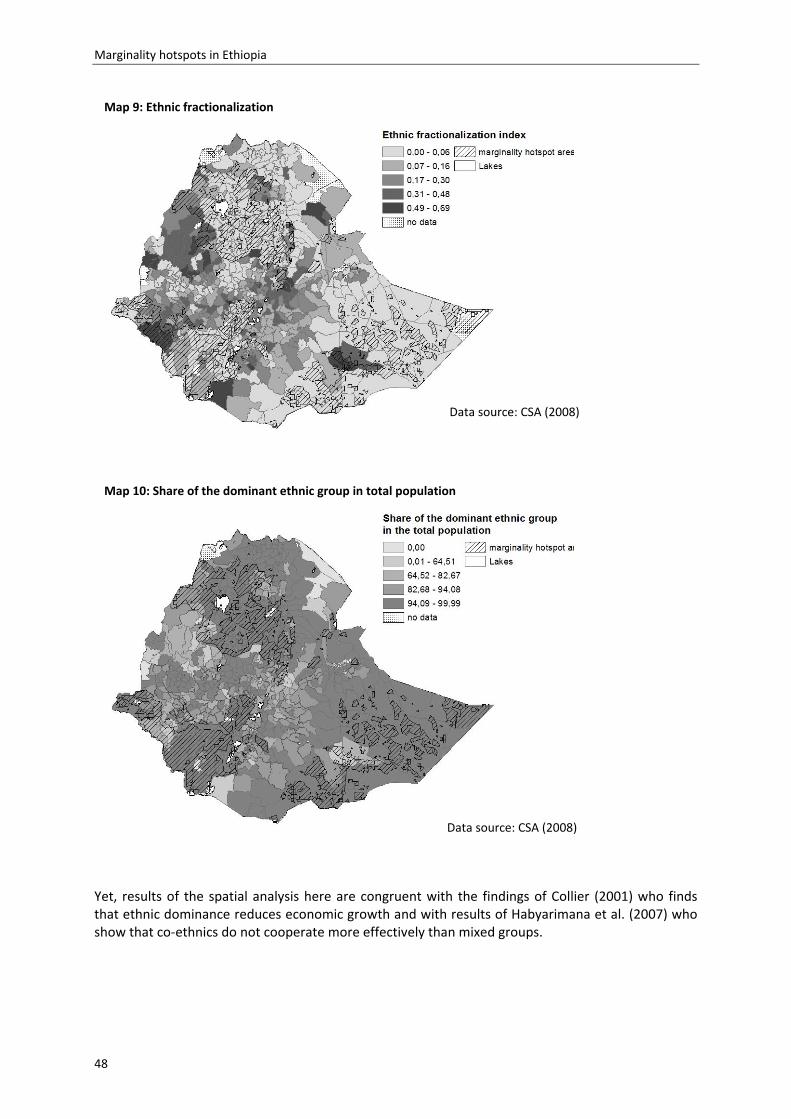
Marginality hotspots in Ethiopia
48
Yet, results of the spatial analysis here are congruent with the findings of Collier (2001) who finds that ethnic dominance reduces economic growth and with results of Habyarimana et al. (2007) who show that co‐ethnics do not cooperate more effectively than mixed groups.
Map 9: Ethnic fractionalization
Map 10: Share of the dominant ethnic group in total population
Data source: CSA (2008)
Data source: CSA (2008)
Marginality hotspots in Ethiopia
49
II‐5 Canbusinessreachouttomarginalizedpeople?
Having identified marginality hotspots in Ethiopia, the question arises whether and how the private sector can reach out to these areas, or more precisely, which business approaches are most apt to cater to the marginalized poor. Baumüller et al. (2013) have elaborated that the suitability of the different approaches to engage the extreme poor and marginalized depends on
(1) “the extent to which the different approaches are able [and willing] to involve the extreme poor themselves”;
(2) “their flexibility to direct business objectives towards the reduction of extreme poverty and marginality”; and
(3) “their ability to successfully operate with non‐business public and civil society partners and in sectors of particular interest to the extreme poor” (p.344).
However, the potential of different business approaches to reduce poverty and marginality will also depend on the characteristics of different regions and people living in these regions. Here, (a) population density, (b) accessibility, e.g. in terms of mobile phone, internet and road connections, as well as (c) the predominant form of livelihood and/or farming systems may be important factors determining market sizes and transaction costs and thus incentives to invest in these markets:
If population density is low, it is more difficult to create a market as, ceteris paribus, market size is smaller. Transaction costs might increase, amongst other reasons, because the search for customers is likely to be more difficult if people are widely dispersed.
Accessibility in terms of road connections is important to reduce transportation costs. Furthermore, transaction costs rise even more than proportionally with distance (Staal et al., 1997). However, such costs can be reduced by reducing the need to travel, i.e. the possibilities to exchange information with other means such as ICT (De Silva and Ratnadiwakara, 2008). Thus, accessibility in the sense of a general connection to other areas and people is an important element determining transaction costs and thus incentives for companies to invest in a certain region.
And finally, in a country like Ethiopia the predominant form of livelihood may play an important role. Pastoralists move around and are thus more difficult to locate. As a result, it may be more costly to create a market because it is more difficult to establish stable supply chains or the established supply chains are only usable for a certain part of the year. In non‐pastoralist areas, people in regions where two or three harvests per year are possible may enjoy less volatile cash flows, which allows for stabler consumption. Furthermore, risk is reduced as incomes do not depend on only one harvest per year. Less volatility in consumption reduces transaction costs for firms as they need to spend less on information about and adaptation to seasonal changes. Furthermore, especially for companies selling agricultural inputs, it may be more worthwhile to invest in supply chains in regions where more harvests per year are possible as people may buy inputs more than once a year.
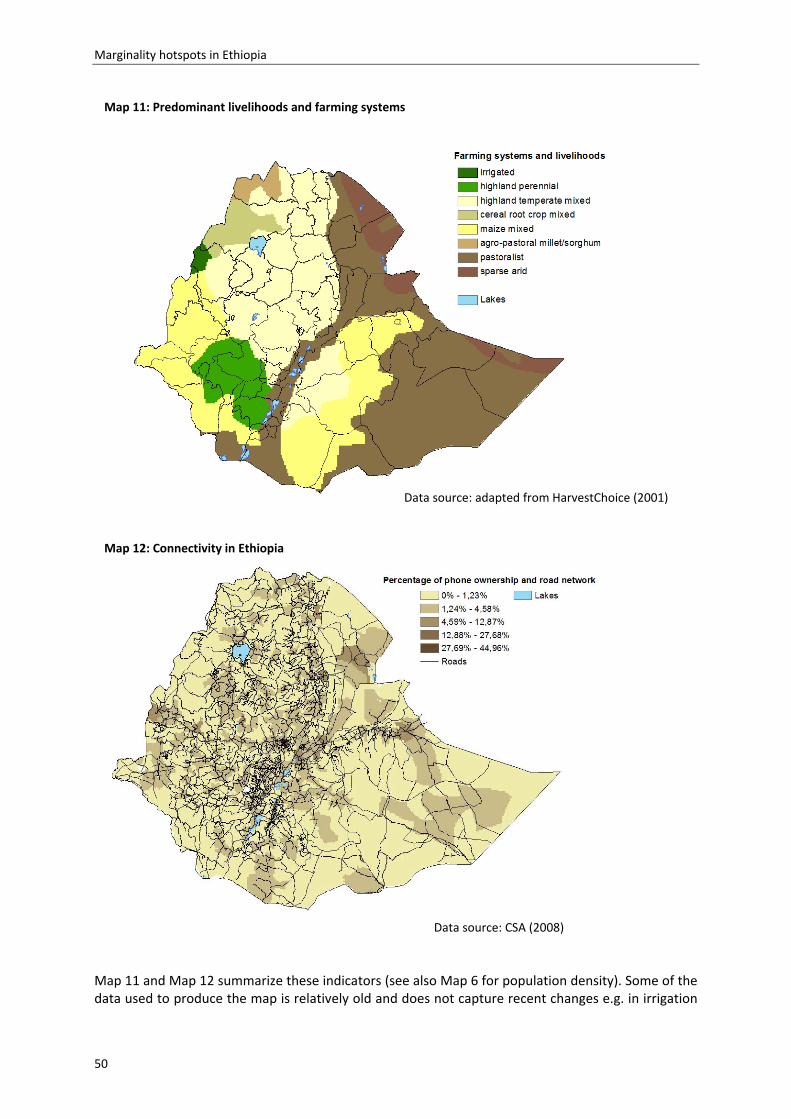
Marginality hotspots in Ethiopia
50
Map 11 and Map 12 summarize these indicators (see also Map 6 for population density). Some of the data used to produce the map is relatively old and does not capture recent changes e.g. in irrigation
Map 11: Predominant livelihoods and farming systems
Map 12: Connectivity in Ethiopia
Data source: adapted from HarvestChoice (2001)
Data source: CSA (2008)
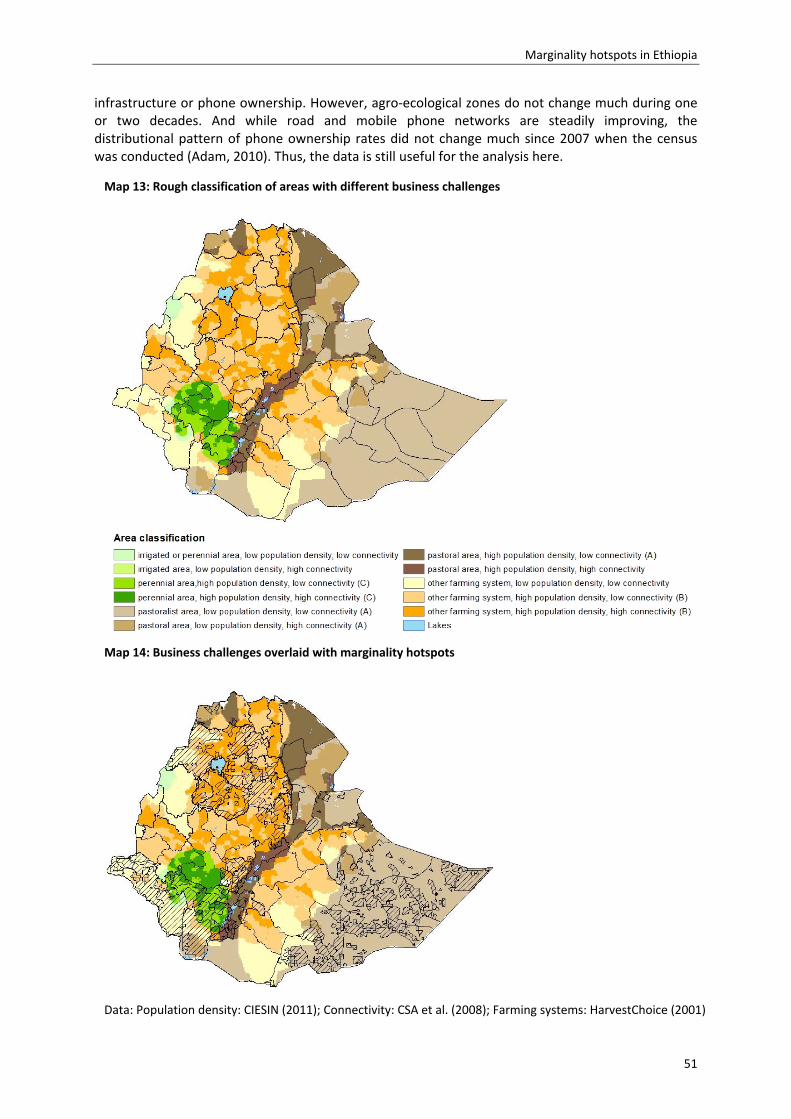
Marginality hotspots in Ethiopia
51
infrastructure or phone ownership. However, agro‐ecological zones do not change much during one or two decades. And while road and mobile phone networks are steadily improving, the distributional pattern of phone ownership rates did not change much since 2007 when the census was conducted (Adam, 2010). Thus, the data is still useful for the analysis here.
Map 13: Rough classification of areas with different business challenges
Map 14: Business challenges overlaid with marginality hotspots
Data: Population density: CIESIN (2011); Connectivity: CSA et al. (2008); Farming systems: HarvestChoice (2001)
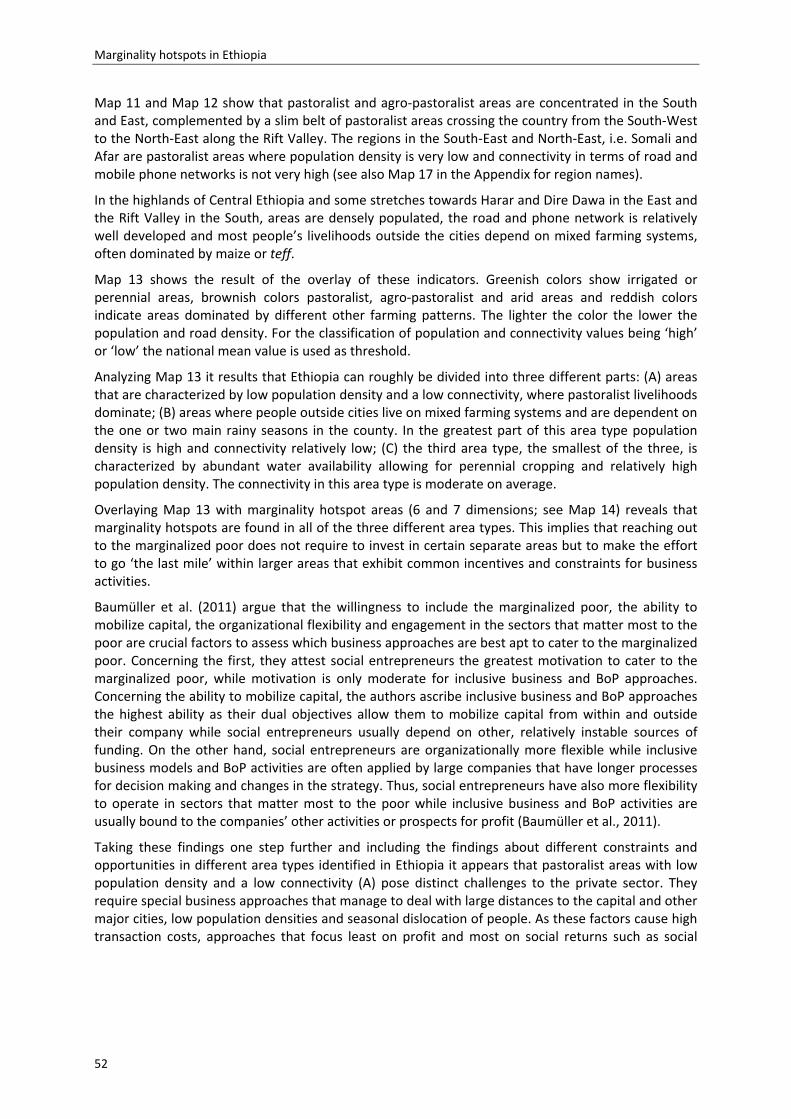
Marginality hotspots in Ethiopia
52
Map 11 and Map 12 show that pastoralist and agro‐pastoralist areas are concentrated in the South and East, complemented by a slim belt of pastoralist areas crossing the country from the South‐West to the North‐East along the Rift Valley. The regions in the South‐East and North‐East, i.e. Somali and Afar are pastoralist areas where population density is very low and connectivity in terms of road and mobile phone networks is not very high (see also Map 17 in the Appendix for region names).
In the highlands of Central Ethiopia and some stretches towards Harar and Dire Dawa in the East and the Rift Valley in the South, areas are densely populated, the road and phone network is relatively well developed and most people’s livelihoods outside the cities depend on mixed farming systems, often dominated by maize or teff.
Map 13 shows the result of the overlay of these indicators. Greenish colors show irrigated or perennial areas, brownish colors pastoralist, agro‐pastoralist and arid areas and reddish colors indicate areas dominated by different other farming patterns. The lighter the color the lower the population and road density. For the classification of population and connectivity values being ‘high’ or ‘low’ the national mean value is used as threshold.
Analyzing Map 13 it results that Ethiopia can roughly be divided into three different parts: (A) areas that are characterized by low population density and a low connectivity, where pastoralist livelihoods dominate; (B) areas where people outside cities live on mixed farming systems and are dependent on the one or two main rainy seasons in the county. In the greatest part of this area type population density is high and connectivity relatively low; (C) the third area type, the smallest of the three, is characterized by abundant water availability allowing for perennial cropping and relatively high population density. The connectivity in this area type is moderate on average.
Overlaying Map 13 with marginality hotspot areas (6 and 7 dimensions; see Map 14) reveals that marginality hotspots are found in all of the three different area types. This implies that reaching out to the marginalized poor does not require to invest in certain separate areas but to make the effort to go ‘the last mile’ within larger areas that exhibit common incentives and constraints for business activities.
Baumüller et al. (2011) argue that the willingness to include the marginalized poor, the ability to mobilize capital, the organizational flexibility and engagement in the sectors that matter most to the poor are crucial factors to assess which business approaches are best apt to cater to the marginalized poor. Concerning the first, they attest social entrepreneurs the greatest motivation to cater to the marginalized poor, while motivation is only moderate for inclusive business and BoP approaches. Concerning the ability to mobilize capital, the authors ascribe inclusive business and BoP approaches the highest ability as their dual objectives allow them to mobilize capital from within and outside their company while social entrepreneurs usually depend on other, relatively instable sources of funding. On the other hand, social entrepreneurs are organizationally more flexible while inclusive business models and BoP activities are often applied by large companies that have longer processes for decision making and changes in the strategy. Thus, social entrepreneurs have also more flexibility to operate in sectors that matter most to the poor while inclusive business and BoP activities are usually bound to the companies’ other activities or prospects for profit (Baumüller et al., 2011).
Taking these findings one step further and including the findings about different constraints and opportunities in different area types identified in Ethiopia it appears that pastoralist areas with low population density and a low connectivity (A) pose distinct challenges to the private sector. They require special business approaches that manage to deal with large distances to the capital and other major cities, low population densities and seasonal dislocation of people. As these factors cause high transaction costs, approaches that focus least on profit and most on social returns such as social
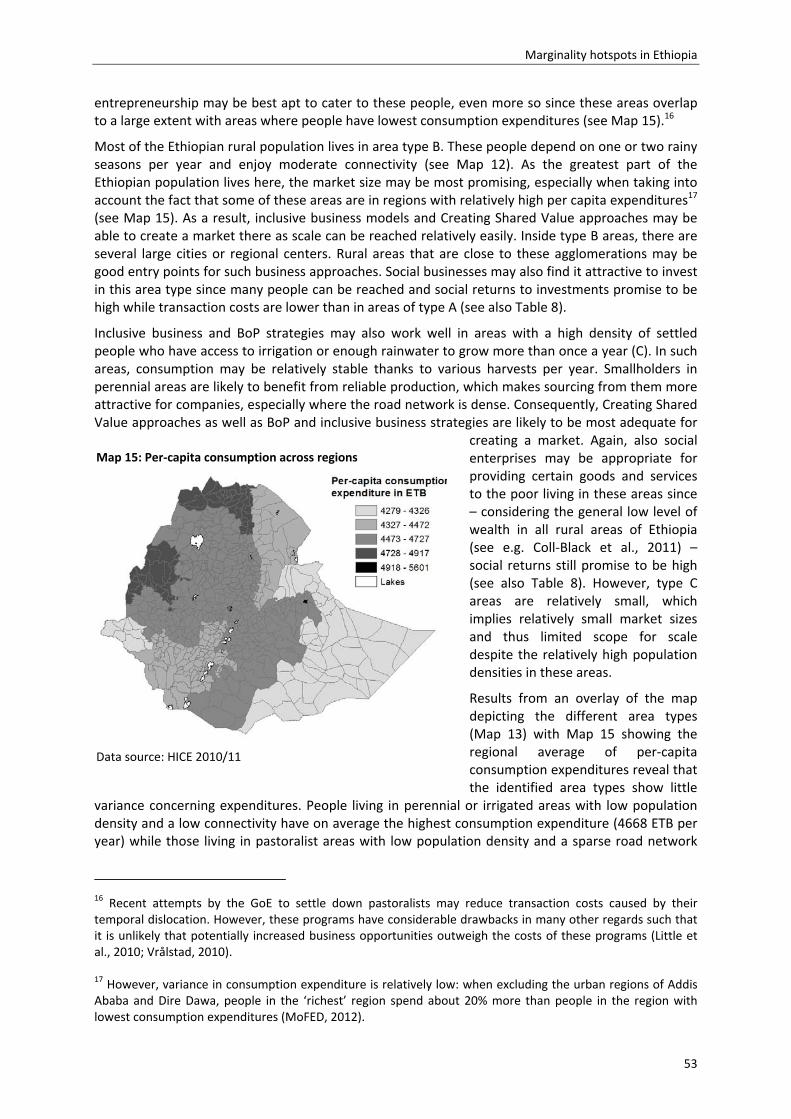
Marginality hotspots in Ethiopia
53
entrepreneurship may be best apt to cater to these people, even more so since these areas overlap to a large extent with areas where people have lowest consumption expenditures (see Map 15).16
Most of the Ethiopian rural population lives in area type B. These people depend on one or two rainy seasons per year and enjoy moderate connectivity (see Map 12). As the greatest part of the Ethiopian population lives here, the market size may be most promising, especially when taking into account the fact that some of these areas are in regions with relatively high per capita expenditures17 (see Map 15). As a result, inclusive business models and Creating Shared Value approaches may be able to create a market there as scale can be reached relatively easily. Inside type B areas, there are several large cities or regional centers. Rural areas that are close to these agglomerations may be good entry points for such business approaches. Social businesses may also find it attractive to invest in this area type since many people can be reached and social returns to investments promise to be high while transaction costs are lower than in areas of type A (see also Table 8).
Inclusive business and BoP strategies may also work well in areas with a high density of settled people who have access to irrigation or enough rainwater to grow more than once a year (C). In such areas, consumption may be relatively stable thanks to various harvests per year. Smallholders in perennial areas are likely to benefit from reliable production, which makes sourcing from them more attractive for companies, especially where the road network is dense. Consequently, Creating Shared Value approaches as well as BoP and inclusive business strategies are likely to be most adequate for
creating a market. Again, also social enterprises may be appropriate for providing certain goods and services to the poor living in these areas since – considering the general low level of wealth in all rural areas of Ethiopia (see e.g. Coll‐Black et al., 2011) – social returns still promise to be high (see also Table 8). However, type C areas are relatively small, which implies relatively small market sizes and thus limited scope for scale despite the relatively high population densities in these areas.
Results from an overlay of the map depicting the different area types (Map 13) with Map 15 showing the regional average of per‐capita consumption expenditures reveal that the identified area types show little
variance concerning expenditures. People living in perennial or irrigated areas with low population density and a low connectivity have on average the highest consumption expenditure (4668 ETB per year) while those living in pastoralist areas with low population density and a sparse road network
16 Recent attempts by the GoE to settle down pastoralists may reduce transaction costs caused by their temporal dislocation. However, these programs have considerable drawbacks in many other regards such that it is unlikely that potentially increased business opportunities outweigh the costs of these programs (Little et al., 2010; Vrålstad, 2010). 17 However, variance in consumption expenditure is relatively low: when excluding the urban regions of Addis Ababa and Dire Dawa, people in the ‘richest’ region spend about 20% more than people in the region with lowest consumption expenditures (MoFED, 2012).
Map 15: Per‐capita consumption across regions
Data source: HICE 2010/11
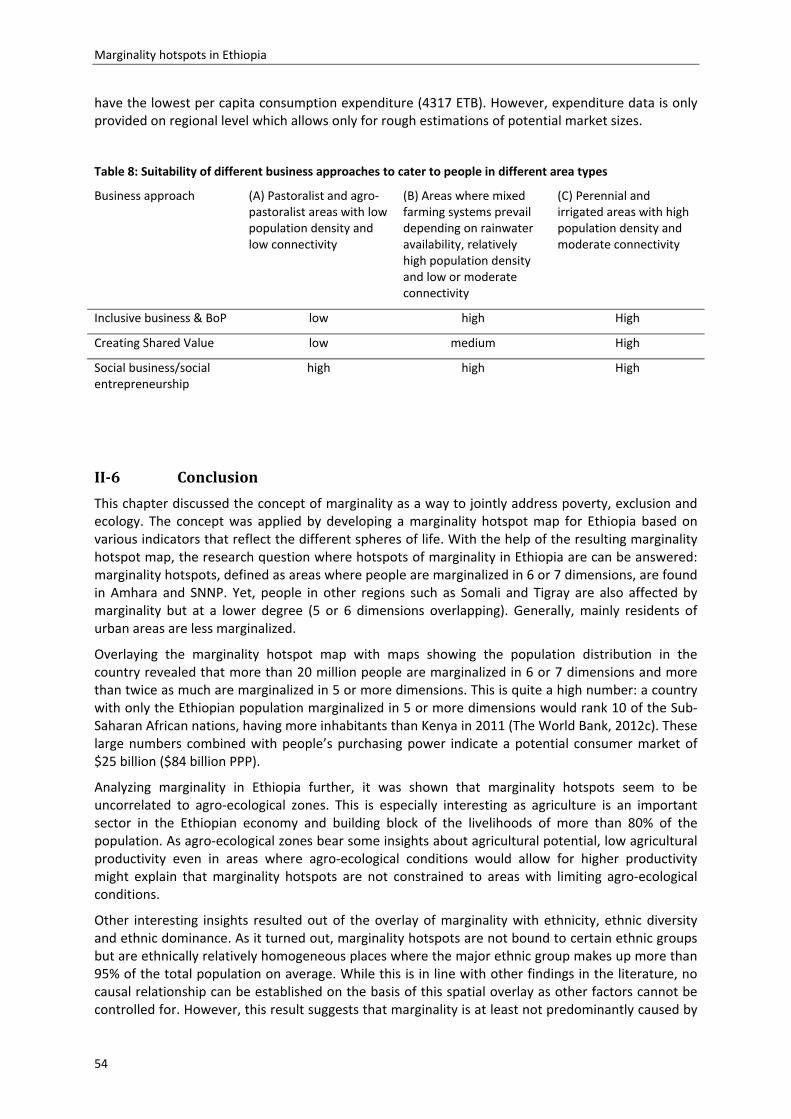
Marginality hotspots in Ethiopia
54
have the lowest per capita consumption expenditure (4317 ETB). However, expenditure data is only provided on regional level which allows only for rough estimations of potential market sizes.
Table 8: Suitability of different business approaches to cater to people in different area types
Business approach (A) Pastoralist and agro‐pastoralist areas with low population density and low connectivity
(B) Areas where mixed farming systems prevail depending on rainwater availability, relatively high population density and low or moderate connectivity
(C) Perennial and irrigated areas with high population density and moderate connectivity
Inclusive business & BoP low high High
Creating Shared Value low medium High
Social business/social entrepreneurship
high high High
II‐6 Conclusion
This chapter discussed the concept of marginality as a way to jointly address poverty, exclusion and ecology. The concept was applied by developing a marginality hotspot map for Ethiopia based on various indicators that reflect the different spheres of life. With the help of the resulting marginality hotspot map, the research question where hotspots of marginality in Ethiopia are can be answered: marginality hotspots, defined as areas where people are marginalized in 6 or 7 dimensions, are found in Amhara and SNNP. Yet, people in other regions such as Somali and Tigray are also affected by marginality but at a lower degree (5 or 6 dimensions overlapping). Generally, mainly residents of urban areas are less marginalized.
Overlaying the marginality hotspot map with maps showing the population distribution in the country revealed that more than 20 million people are marginalized in 6 or 7 dimensions and more than twice as much are marginalized in 5 or more dimensions. This is quite a high number: a country with only the Ethiopian population marginalized in 5 or more dimensions would rank 10 of the Sub‐Saharan African nations, having more inhabitants than Kenya in 2011 (The World Bank, 2012c). These large numbers combined with people’s purchasing power indicate a potential consumer market of $25 billion ($84 billion PPP).
Analyzing marginality in Ethiopia further, it was shown that marginality hotspots seem to be uncorrelated to agro‐ecological zones. This is especially interesting as agriculture is an important sector in the Ethiopian economy and building block of the livelihoods of more than 80% of the population. As agro‐ecological zones bear some insights about agricultural potential, low agricultural productivity even in areas where agro‐ecological conditions would allow for higher productivity might explain that marginality hotspots are not constrained to areas with limiting agro‐ecological conditions.
Other interesting insights resulted out of the overlay of marginality with ethnicity, ethnic diversity and ethnic dominance. As it turned out, marginality hotspots are not bound to certain ethnic groups but are ethnically relatively homogeneous places where the major ethnic group makes up more than 95% of the total population on average. While this is in line with other findings in the literature, no causal relationship can be established on the basis of this spatial overlay as other factors cannot be controlled for. However, this result suggests that marginality is at least not predominantly caused by
Marginality hotspots in Ethiopia
55
social exclusion on the basis of ethnicity as the location of hotspots is not correlated to the predominant ethnic group in an area.
Furthermore, this chapter has identified different areas with specific business opportunities and challenges, based on the criteria of population density, connectivity in form of road and mobile phone networks and the predominant forms of livelihood. An overlay of these criteria revealed that there are three main area types in Ethiopia that may be interesting for different business approaches. Since transaction costs for investing in pastoralist and agro‐pastoralist areas with low population density and low connectivity (area type A) are, compared to other regions, relatively high while the size of the potential market is relatively small, investments in these areas will mainly be attractive for social businesses and social entrepreneurs who attach high values to social returns. Type B areas where mixed farming systems prevail, population density is relatively high and connectivity is low or moderate are more interesting for BoP and inclusive business approaches as transaction costs are lower than in type A areas but market sizes are much bigger, mainly due to the higher population densities. Finally, type C areas are characterized by perennial and irrigated areas with high population density and moderate connectivity. This area type offers the lowest transaction costs due to the relatively good connectivity and big market sizes as population density is high and incomes are likely to be relatively stable (see Table 8).
An important finding is that marginality hotspots are located in all three areas types. This implies that catering to the marginalized poor requires going the ‘last mile’ within certain areas rather than investing in separated areas that are fundamentally different in terms of the mentioned criteria delineating business opportunities and challenges. Yet, whether companies really make the effort to go ‘the last mile’ within the identified area types and include the marginalized poor in their value chains will depend on the factors elaborated by Baumüller et al. (2011).
Another interesting question is the role that ‘conventional’ business approaches can play. Especially in areas close to the capital or a company’s production plants, where population density is high and connectivity is good, purely profit‐maximizing companies may find profitable consumer markets and possibilities to source raw materials. Due to the scarcity of many food products such as wheat, barley or tomatoes ([7], [4]), depending on the time horizon for investments, it pays for companies to engage in activities ensuring supply from smallholder farmers as long as this is still less costly as importing. Several companies already started to establish such supply chains, e.g. Asela Malt ([15]; see also Example 2), others plan such activities for the near future ([15]). Similar arguments apply for the establishment of consumer markets.
NGOs are not considered in these considerations as they are not part of the private sector. However, for all of the mentioned approaches cooperation with NGOs and farmer organizations will be crucial as transaction costs can be considerably reduced. Amongst other advantages companies can save on search and information and market entry costs if they avail themselves of the knowledge about local conditions and social capital of these organizations (Gregoratti, 2011).
The demand side of BoP markets
56
III. The demand side of BoP markets: the marginalized poor asconsumersandproducers
III‐1 Introduction:thepeopleatthebottomoftheeconomicpyramid
The Bottom of the Pyramid (BoP) is often praised as a huge untapped market. A lot has been written about strategies for companies to explore and capitalize on this market (see e.g. Prahalad, 2010; Karamchandani et al., 2011; Elaydi and Harrison, 2010 to name just a few). Despite some criticism on these approaches (Karnani, 2009b; Simanis, 2010; see also Section I‐2), the debate is not anymore about whether the private sector should engage the poor but about how to do so best (Reficco and Márquez, 2012).
The basic idea of recognizing poor people as market opportunities was introduced by some influential business thinkers, first and foremost by Muhammed Yunus and C.K. Prahalad (see e.g. Hamel and Prahalad, 1996; Prahalad and Hart, 2002; Prahalad, 2010; Yunus, 2007) who were then followed by many others (see also Section I‐2). The main arguments for bringing the private sector and the poor together can be divided into two lines of argumentation: one is the societal necessity for getting the private sector on board of poverty reduction efforts since traditional development cooperation has a role to play but has not redressed the problem of poverty (Polak and Warwick, 2013; Prahalad, 2010). An important argument in this context, besides the big amount of knowledge and money that is expected to be made available to the benefit of the poor, is scale. Whether initiatives started by single entrepreneurs or by multinational companies, profitable business approaches are likely to be scalable relatively easily because they can attract investors and are not dependent on donations or government funding.
The other line of argumentation addresses the business community and stresses that there are viable business opportunities at the bottom of the pyramid. Prahalad (2010) uses the rapid spread of cell phones even to very poor people as a case in point. The BoP is considered as a source of innovations in business models and applications. Therefore and due to the sheer number of people, multinational companies and other large firms cannot ignore this market without the danger of falling behind competitors (Prahalad, 2010).
Thus, summarizing the reasons for companies to co‐create new markets with poor people, one can name three major arguments: the first is the huge market opportunity with several billion new customers. The second argument is the crowded home markets that for many companies already lose importance in terms of the share of profits coming from them compared to markets in emerging economies. The third argument is the disruptive forces that wipe out companies that miss important changes and innovations, with recognizing the poor as investment opportunity being such an important innovation (see also Polak and Warwick, 2013).
Especially for smallholder farmers private sector investments may bring improvements in well‐being if investments are well designed. Investors may bring capital, technology, knowledge, infrastructure and market access and can thus catalyze development in rural areas. Yet, benefits for the smallholders depend on the business models applied and the conditions for sharing ownership, decision‐making, risks and rewards (Vermeulen and Cotula, 2010).
On the other hand, given constraints in food supply and rising demand for food caused by a rapidly growing population, agri‐investors have good reasons to extent their value chains to poor smallholder farmers to augment their sources of food products. Particularly the proponents of the Creating Shared Value concept stress that investments in making value chains socially beneficial and environmentally sustainable is crucial for competitiveness and commercial success in the long run as poverty and resource depletion will threaten the resource bases on which food (and other) companies rely on (www.nestle.com/csv).
The demand side of BoP markets
57
These arguments summarize why companies should invest in BoP markets but they remain silent about whom to target within these markets. While the lower middle class still embraces a huge number of people who are relatively easy to reach and may thus be a good entry point for companies, social returns are likely to be higher when catering to the extreme poor (Polak and Warwick, 2013; UNICEF, 2010).
Independently from the concrete business approach discussed, it is striking how little attention is paid to the demand side. When reading about the poor as possible target group, astonishingly little empirical evidence on the consumers (or producers) and how they live is provided. Questions of “[w]hat life style do [the BoP consumers] aspire to? What life style do they invest in?” (Prahalad, 2010, p. 18) remain largely unanswered in the literature about the BoP market. There are few micro‐level studies on the purchasing behavior of the poor (Banerjee and Duflo 2007; Karnani 2009; D’Andrea and Herrero 2007). Many studies analyzing companies catering to the poor or assessing possible strategies for companies to do so in the future do not say anything about the consumers except that they are ‘poor’ or ‘low‐income’ (e.g. Brugmann and Prahalad, 2007; Elaydi and Harrison, 2010; Kirchgeorg and Winn, 2006; Reficco and Márquez, 2012). Often, rather general observations such as that BoP consumers live in areas with limited accessibility are the only descriptions of factors shaping the lives of the target group that go beyond their income or expenditure.
Based on these arguments, the following section focuses on the as yet less investigated consumer or demand side of BoP markets.18 Questions of who BoP consumers actually are, what they buy and what drives their purchasing decisions are answered by reviewing the literature and analyzing empirical data from a household survey in Ethiopia.
WhoistheBoPandwhyitisimportanttoknowitIII‐1.1
For companies it is important to understand who the BoP consumers are and how they live since the specific context of poverty is relevant for firms doing business with the poor. Human behavior, including purchasing behavior, is “a function of both the person and the situation” (Bertrand et al., 2006, p. 9). Consequently, companies need to understand the context and the realities of poor people’s everyday life if they want to help them getting out of poverty (D’Andrea and Herrero, 2007; Weidner et al., 2010). Firms need to adjust marketing strategies and market segmentation according to the circumstances they operate in. Socio‐economic, cultural, familial and religious settings can be serious hurdles to engaging the poor in value chains and thus require custom‐fit measures.
Along these lines, it is important for companies not to confuse countries with markets. Especially large countries are rather an agglomeration of markets separated by factors such as income levels, industrial priorities and cultures as e.g. Cui and Liu (2000) find for the case of urban consumers in China and Steenkamp and Burgess (2002) for consumers in South Africa. Large differences among consumers of various regions concerning educational attainment and consumer psychographics such as life satisfaction, collective‐ vs. individual‐orientation, preference of foreign brands and most frequently used media can lead to greatly varying consumption patterns inside a single country (Cui and Liu, 2000).
In more practical terms, recognizing the heterogeneity of consumers along various dimensions is essential to correctly assess demand, develop products and devise marketing strategies since differences in attitudes and lifestyles have a significant impact on purchasing behavior (Cui and Liu, 2000; D’Andrea et al., 2004; Steenkamp and Burgess, 2002). This implies that companies need to have a profound understanding of people’s (latent) needs to design products that find demand.
18 Literature on the supply side, i.e. business strategies for investing and marketing in BoP markets and business models most viable for different sectors can be found e.g. in Prahalad (2010); Proctor and Vorley (2008); Vermeulen and Cotula (2010); Vorley et al. (2009); Weidner et al. (2010); www.regoverningmarkets.org.
The demand side of BoP markets
58
Moreover, they will need multiple variables for segmentation that vary with target group and context for successful marketing on BoP markets (Cui and Liu, 2000; D’Andrea and Herrero, 2007).
Need,latentneedanddemandIII‐1.2
Before analyzing the demand side of the BoP, it is useful to highlight an important concept to which the critique of Simanis (2012; see Section I‐2) – stating that there is actually no market for many products at the BoP – also points to but which is hardly mentioned in the BoP literature: the difference between needs, wants, latent (or hidden) needs and demand.
Viewing it from a marketing perspective, Kotler and Armstrong (2010, p. 30) define human needs as “states of felt deprivation”. They differentiate between basic physical needs such as food, clothing, warmth and safety, social needs such as the need for belonging and affection and finally individual needs like knowledge and self‐expression. Other authors developed other classifications of human needs but arrived at very similar definitions (Doyal and Gough, 1991; Max‐Neef, 1992; Stewart, 1985 for earlier discussions on the concept of basic human needs; see also Streeten and Burki, 1978).
According to Kotler and Armstrong (2010, p. 30) “[w]ants are the form human needs take as they are shaped by culture and individual personality”, they are the objects that can satisfy a need. The need for food, for instance, will results in a want for French fries in the Netherlands and for enjera in Ethiopia. Demand finally only arises when wants are backed up by purchasing power.
Especially for poor people this chain is complicated by the prevalence of latent needs. Latent or hidden needs are needs that are present but rest on a sub‐conscious level and have thus not been consciously realized by a person. For this reason, people are unable to articulate these needs (Goffin and Lemke, 2004; Kotler and Armstrong, 2010; Slater et al., 2010). Thus, companies will find it much more difficult to develop products that satisfy such hidden needs because the usual market research instruments such as surveys or focus group discussions are not suitable to detect them (Goffin and Lemke, 2004).
Confusing needs with demand and not recognizing which latent needs and wants people have are common problems of companies and other organizations that try to cater to the BoP (Karamchandani et al., 2011). Thus, it is crucial to clearly separate these concepts and to take heed of them when analyzing data about people’s needs and purchasing behavior.
III‐2 WhoaretheBoPconsumersandonwhatdotheyspend?
DefinitionsofBoPconsumersIII‐2.1
Despite the large and rapidly growing amount of articles and studies about the BoP and the recent uptake of research on poor consumers in the field of marketing (see e.g. Martin and Hill, 2012; Hill et al., 2012; Hill and Gaines, 2007; Blocker et al., 2013) the question of who these customers are and how they live is hardly addressed in the literature. The great majority of studies about BoP markets limits itself to define and describe the consumers by their income.
Prahalad and Hart (2002) who coined the expression of the ‘bottom of the pyramid’ define the BoP as the 4 billion poor who have an income of less than $1,500 per year in PPP. In his famous book The fortune at the bottom of the pyramid, Prahalad (2010, p.xiv) refers to the BoP as the 4 billion people living on less than $2 a day, which is about half of the income he uses as threshold in the earlier publication. Yet, he does not deliver any explanation for this change. However, he also cautions that there is “no single definition of the Bottom of the Pyramid that can be useful” since a “definition must fit the focus for productive engagement” (p. 7).
A widely cited study by Hammond et al. (2007) for the World Resources Institute (WRI) and the International Finance Corporation (IFC) differentiates different market segments and groups of BoP consumers based on their yearly income. Relying on surveys from 36 countries, they identify 4 billion
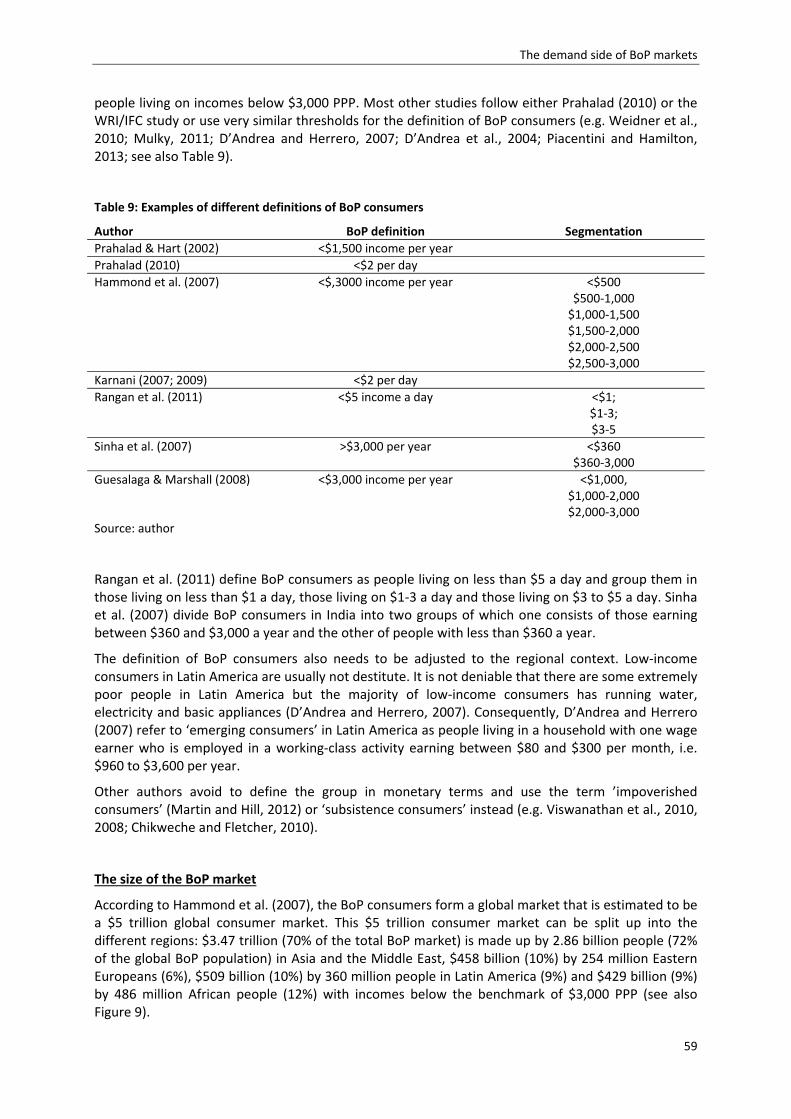
The demand side of BoP markets
59
people living on incomes below $3,000 PPP. Most other studies follow either Prahalad (2010) or the WRI/IFC study or use very similar thresholds for the definition of BoP consumers (e.g. Weidner et al., 2010; Mulky, 2011; D’Andrea and Herrero, 2007; D’Andrea et al., 2004; Piacentini and Hamilton, 2013; see also Table 9).
Table 9: Examples of different definitions of BoP consumers
Author BoP definition Segmentation
Prahalad & Hart (2002) <$1,500 income per year
Prahalad (2010) <$2 per day
Hammond et al. (2007) <$,3000 income per year <$500 $500‐1,000 $1,000‐1,500 $1,500‐2,000 $2,000‐2,500 $2,500‐3,000
Karnani (2007; 2009) <$2 per day
Rangan et al. (2011) <$5 income a day <$1; $1‐3; $3‐5
Sinha et al. (2007) >$3,000 per year <$360 $360‐3,000
Guesalaga & Marshall (2008) <$3,000 income per year <$1,000, $1,000‐2,000 $2,000‐3,000
Source: author
Rangan et al. (2011) define BoP consumers as people living on less than $5 a day and group them in those living on less than $1 a day, those living on $1‐3 a day and those living on $3 to $5 a day. Sinha et al. (2007) divide BoP consumers in India into two groups of which one consists of those earning between $360 and $3,000 a year and the other of people with less than $360 a year.
The definition of BoP consumers also needs to be adjusted to the regional context. Low‐income consumers in Latin America are usually not destitute. It is not deniable that there are some extremely poor people in Latin America but the majority of low‐income consumers has running water, electricity and basic appliances (D’Andrea and Herrero, 2007). Consequently, D’Andrea and Herrero (2007) refer to ‘emerging consumers’ in Latin America as people living in a household with one wage earner who is employed in a working‐class activity earning between $80 and $300 per month, i.e. $960 to $3,600 per year.
Other authors avoid to define the group in monetary terms and use the term ’impoverished consumers’ (Martin and Hill, 2012) or ‘subsistence consumers’ instead (e.g. Viswanathan et al., 2010, 2008; Chikweche and Fletcher, 2010).
The size of the BoP market
According to Hammond et al. (2007), the BoP consumers form a global market that is estimated to be a $5 trillion global consumer market. This $5 trillion consumer market can be split up into the different regions: $3.47 trillion (70% of the total BoP market) is made up by 2.86 billion people (72% of the global BoP population) in Asia and the Middle East, $458 billion (10%) by 254 million Eastern Europeans (6%), $509 billion (10%) by 360 million people in Latin America (9%) and $429 billion (9%) by 486 million African people (12%) with incomes below the benchmark of $3,000 PPP (see also Figure 9).
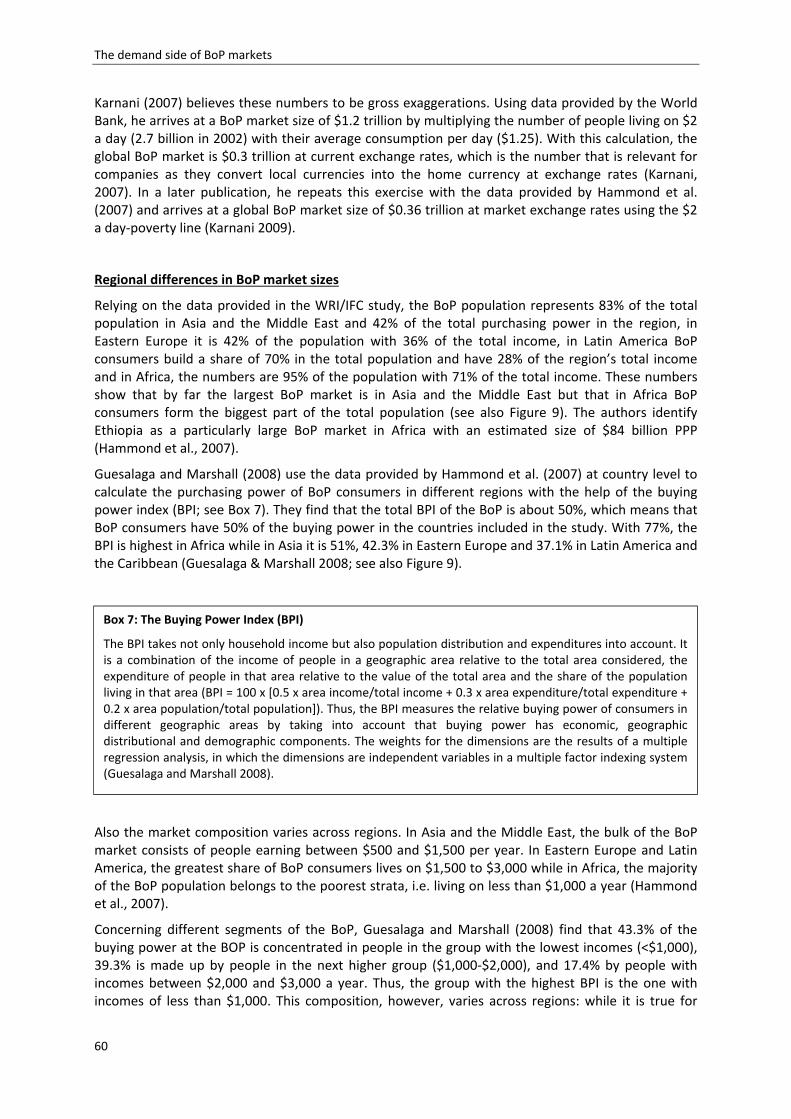
The demand side of BoP markets
60
Karnani (2007) believes these numbers to be gross exaggerations. Using data provided by the World Bank, he arrives at a BoP market size of $1.2 trillion by multiplying the number of people living on $2 a day (2.7 billion in 2002) with their average consumption per day ($1.25). With this calculation, the global BoP market is $0.3 trillion at current exchange rates, which is the number that is relevant for companies as they convert local currencies into the home currency at exchange rates (Karnani, 2007). In a later publication, he repeats this exercise with the data provided by Hammond et al. (2007) and arrives at a global BoP market size of $0.36 trillion at market exchange rates using the $2 a day‐poverty line (Karnani 2009).
Regional differences in BoP market sizes
Relying on the data provided in the WRI/IFC study, the BoP population represents 83% of the total population in Asia and the Middle East and 42% of the total purchasing power in the region, in Eastern Europe it is 42% of the population with 36% of the total income, in Latin America BoP consumers build a share of 70% in the total population and have 28% of the region’s total income and in Africa, the numbers are 95% of the population with 71% of the total income. These numbers show that by far the largest BoP market is in Asia and the Middle East but that in Africa BoP consumers form the biggest part of the total population (see also Figure 9). The authors identify Ethiopia as a particularly large BoP market in Africa with an estimated size of $84 billion PPP (Hammond et al., 2007).
Guesalaga and Marshall (2008) use the data provided by Hammond et al. (2007) at country level to calculate the purchasing power of BoP consumers in different regions with the help of the buying power index (BPI; see Box 7). They find that the total BPI of the BoP is about 50%, which means that BoP consumers have 50% of the buying power in the countries included in the study. With 77%, the BPI is highest in Africa while in Asia it is 51%, 42.3% in Eastern Europe and 37.1% in Latin America and the Caribbean (Guesalaga & Marshall 2008; see also Figure 9).
Also the market composition varies across regions. In Asia and the Middle East, the bulk of the BoP market consists of people earning between $500 and $1,500 per year. In Eastern Europe and Latin America, the greatest share of BoP consumers lives on $1,500 to $3,000 while in Africa, the majority of the BoP population belongs to the poorest strata, i.e. living on less than $1,000 a year (Hammond et al., 2007).
Concerning different segments of the BoP, Guesalaga and Marshall (2008) find that 43.3% of the buying power at the BOP is concentrated in people in the group with the lowest incomes (<$1,000), 39.3% is made up by people in the next higher group ($1,000‐$2,000), and 17.4% by people with incomes between $2,000 and $3,000 a year. Thus, the group with the highest BPI is the one with incomes of less than $1,000. This composition, however, varies across regions: while it is true for
Box 7: The Buying Power Index (BPI)
The BPI takes not only household income but also population distribution and expenditures into account. It is a combination of the income of people in a geographic area relative to the total area considered, the expenditure of people in that area relative to the value of the total area and the share of the population living in that area (BPI = 100 x [0.5 x area income/total income + 0.3 x area expenditure/total expenditure + 0.2 x area population/total population]). Thus, the BPI measures the relative buying power of consumers in different geographic areas by taking into account that buying power has economic, geographic distributional and demographic components. The weights for the dimensions are the results of a multiple regression analysis, in which the dimensions are independent variables in a multiple factor indexing system (Guesalaga and Marshall 2008).
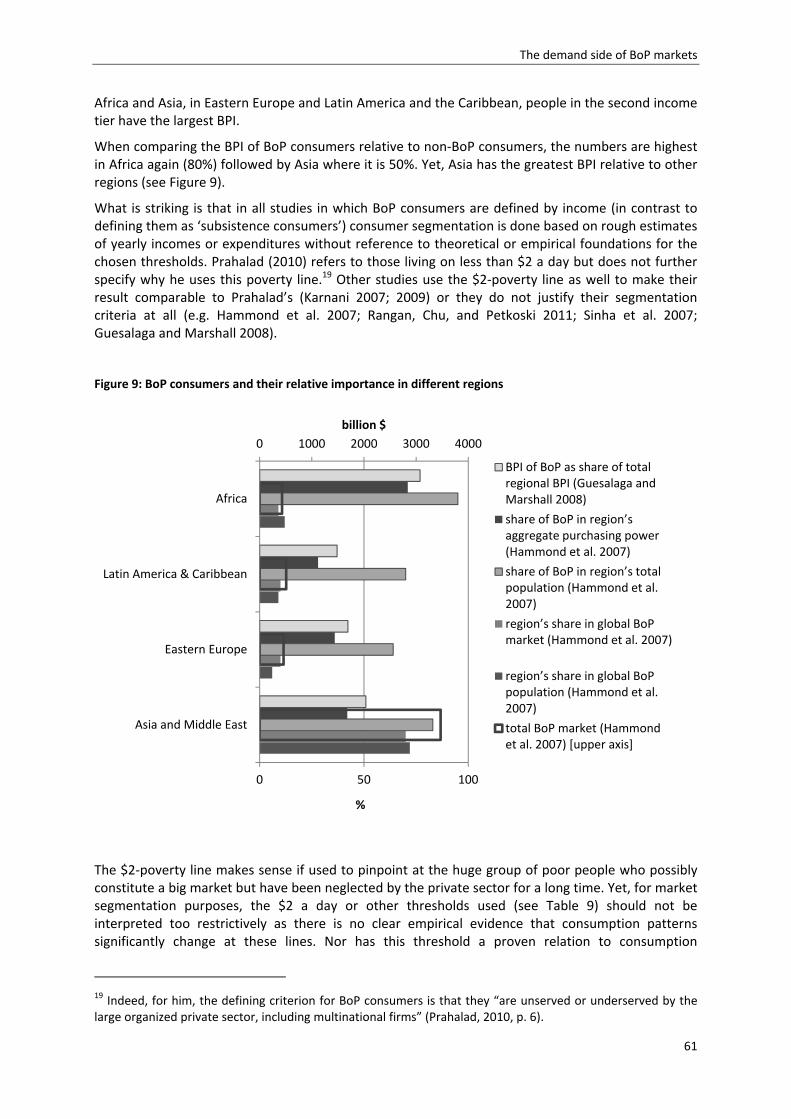
The demand side of BoP markets
61
Africa and Asia, in Eastern Europe and Latin America and the Caribbean, people in the second income tier have the largest BPI.
When comparing the BPI of BoP consumers relative to non‐BoP consumers, the numbers are highest in Africa again (80%) followed by Asia where it is 50%. Yet, Asia has the greatest BPI relative to other regions (see Figure 9).
What is striking is that in all studies in which BoP consumers are defined by income (in contrast to defining them as ‘subsistence consumers’) consumer segmentation is done based on rough estimates of yearly incomes or expenditures without reference to theoretical or empirical foundations for the chosen thresholds. Prahalad (2010) refers to those living on less than $2 a day but does not further specify why he uses this poverty line.19 Other studies use the $2‐poverty line as well to make their result comparable to Prahalad’s (Karnani 2007; 2009) or they do not justify their segmentation criteria at all (e.g. Hammond et al. 2007; Rangan, Chu, and Petkoski 2011; Sinha et al. 2007; Guesalaga and Marshall 2008).
Figure 9: BoP consumers and their relative importance in different regions
The $2‐poverty line makes sense if used to pinpoint at the huge group of poor people who possibly constitute a big market but have been neglected by the private sector for a long time. Yet, for market segmentation purposes, the $2 a day or other thresholds used (see Table 9) should not be interpreted too restrictively as there is no clear empirical evidence that consumption patterns significantly change at these lines. Nor has this threshold a proven relation to consumption
19 Indeed, for him, the defining criterion for BoP consumers is that they “are unserved or underserved by the large organized private sector, including multinational firms” (Prahalad, 2010, p. 6).
0 1000 2000 3000 4000
0 50 100
Asia and Middle East
Eastern Europe
Latin America & Caribbean
Africa
billion $
%
BPI of BoP as share of totalregional BPI (Guesalaga andMarshall 2008)
share of BoP in region’s aggregate purchasing power (Hammond et al. 2007)
share of BoP in region’s total population (Hammond et al. 2007)
region’s share in global BoP market (Hammond et al. 2007)
region’s share in global BoP population (Hammond et al. 2007)
total BoP market (Hammondet al. 2007) [upper axis]
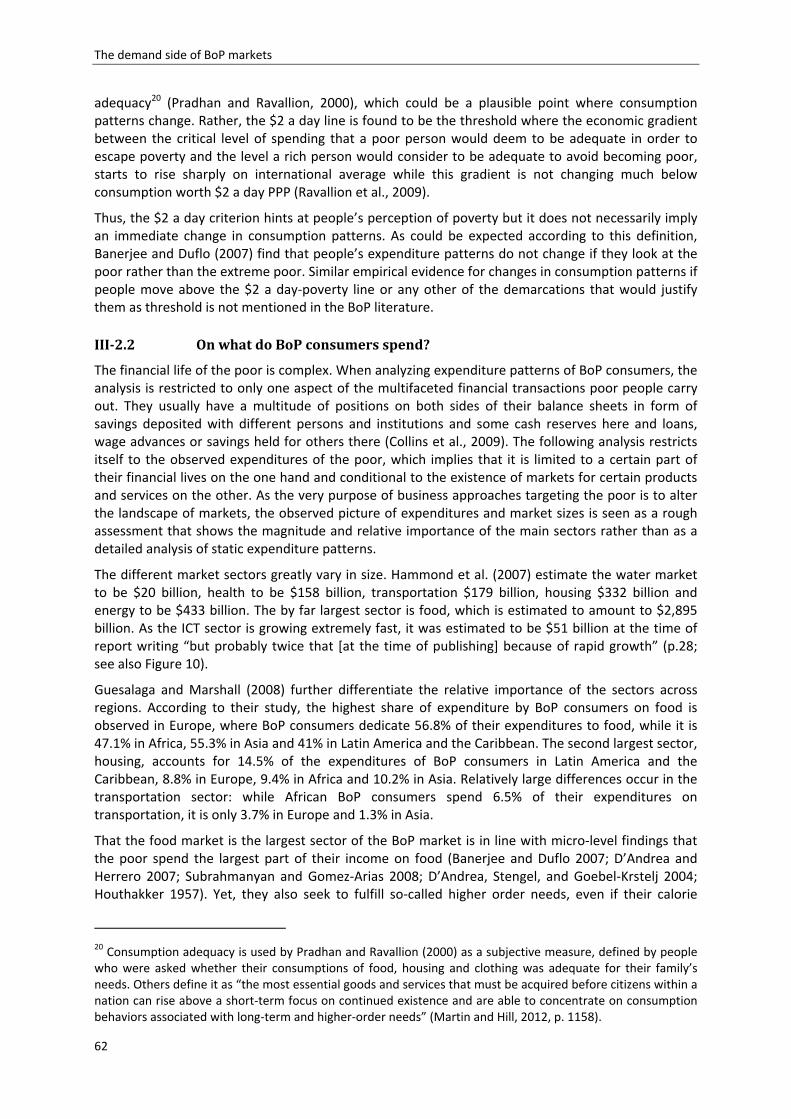
The demand side of BoP markets
62
adequacy20 (Pradhan and Ravallion, 2000), which could be a plausible point where consumption patterns change. Rather, the $2 a day line is found to be the threshold where the economic gradient between the critical level of spending that a poor person would deem to be adequate in order to escape poverty and the level a rich person would consider to be adequate to avoid becoming poor, starts to rise sharply on international average while this gradient is not changing much below consumption worth $2 a day PPP (Ravallion et al., 2009).
Thus, the $2 a day criterion hints at people’s perception of poverty but it does not necessarily imply an immediate change in consumption patterns. As could be expected according to this definition, Banerjee and Duflo (2007) find that people’s expenditure patterns do not change if they look at the poor rather than the extreme poor. Similar empirical evidence for changes in consumption patterns if people move above the $2 a day‐poverty line or any other of the demarcations that would justify them as threshold is not mentioned in the BoP literature.
OnwhatdoBoPconsumersspend?III‐2.2
The financial life of the poor is complex. When analyzing expenditure patterns of BoP consumers, the analysis is restricted to only one aspect of the multifaceted financial transactions poor people carry out. They usually have a multitude of positions on both sides of their balance sheets in form of savings deposited with different persons and institutions and some cash reserves here and loans, wage advances or savings held for others there (Collins et al., 2009). The following analysis restricts itself to the observed expenditures of the poor, which implies that it is limited to a certain part of their financial lives on the one hand and conditional to the existence of markets for certain products and services on the other. As the very purpose of business approaches targeting the poor is to alter the landscape of markets, the observed picture of expenditures and market sizes is seen as a rough assessment that shows the magnitude and relative importance of the main sectors rather than as a detailed analysis of static expenditure patterns.
The different market sectors greatly vary in size. Hammond et al. (2007) estimate the water market to be $20 billion, health to be $158 billion, transportation $179 billion, housing $332 billion and energy to be $433 billion. The by far largest sector is food, which is estimated to amount to $2,895 billion. As the ICT sector is growing extremely fast, it was estimated to be $51 billion at the time of report writing “but probably twice that [at the time of publishing] because of rapid growth” (p.28; see also Figure 10).
Guesalaga and Marshall (2008) further differentiate the relative importance of the sectors across regions. According to their study, the highest share of expenditure by BoP consumers on food is observed in Europe, where BoP consumers dedicate 56.8% of their expenditures to food, while it is 47.1% in Africa, 55.3% in Asia and 41% in Latin America and the Caribbean. The second largest sector, housing, accounts for 14.5% of the expenditures of BoP consumers in Latin America and the Caribbean, 8.8% in Europe, 9.4% in Africa and 10.2% in Asia. Relatively large differences occur in the transportation sector: while African BoP consumers spend 6.5% of their expenditures on transportation, it is only 3.7% in Europe and 1.3% in Asia.
That the food market is the largest sector of the BoP market is in line with micro‐level findings that the poor spend the largest part of their income on food (Banerjee and Duflo 2007; D’Andrea and Herrero 2007; Subrahmanyan and Gomez‐Arias 2008; D’Andrea, Stengel, and Goebel‐Krstelj 2004; Houthakker 1957). Yet, they also seek to fulfill so‐called higher order needs, even if their calorie
20 Consumption adequacy is used by Pradhan and Ravallion (2000) as a subjective measure, defined by people who were asked whether their consumptions of food, housing and clothing was adequate for their family’s needs. Others define it as “the most essential goods and services that must be acquired before citizens within a nation can rise above a short‐term focus on continued existence and are able to concentrate on consumption behaviors associated with long‐term and higher‐order needs” (Martin and Hill, 2012, p. 1158).
The demand side of BoP markets
63
requirements are still not fully met and thus dedicate a part of their budget to other consumer products (Banerjee and Duflo, 2007; Subrahmanyan and Gomez‐Arias, 2008).
Figure 10: Relative size of BoP market sectors
However, the sheer size of the market sectors does not say anything about how much poor people pay for the products they buy. The ‘poverty penalty’ (Horsfield, 2009; Mendoza, 2011; Prahalad and Hart, 2002) is one of the main pillars the BoP argument rests on as it offers an ample market entry opportunity for firms since lower prices are expected to develop new customer markets. Prahalad and Hart (2002) name examples where poor people in an urban slum in Mumbai pay as much as 53 times more for credits, 37 times more for water, 10 times more for medication, 1.8 times more for phone calls and 1.2 time more for rice than richer people in the same city. In remote rural areas prices are often even higher due to high transportation costs, less information due to ‘media darkness’ and even less competition among suppliers (Prahalad, 2010).
To some extent the prices poor people pay for the products they buy also depend on the structure of the national economy. In India, e.g., a domestic industry exists that produces low‐cost and low‐quality products such as clothes, cigarettes, soap or toothpaste for the Indian market. As a result, there is a range of domestically produced consumer goods that are relatively cheap compared to their imported equivalents. In other countries, domestic production of many products is small or non‐existent such that people depend on more expensive imports (Banerjee and Duflo, 2007).
Factors influencing the purchasing behavior of the BoP – what do weIII‐2.3know?
Few studies go beyond metrics of income or expenditure to describe BoP consumers. And even fewer studies use primary data to analyze purchasing behavior and factors influencing this behavior. Yet, several authors stress the importance of examining consumer behavior since understanding needs and other factors influencing the buying decisions of the poor is crucial for developing successful business models (see e.g. Subrahmanyan and Gomez‐Arias, 2008; Cui and Liu, 2000; Steenkamp and Burgess, 2002).
When it comes to descriptions of the consumption behavior of the poor, appraisals oscillate between the extremes: while some authors are surprised that the poor do not simply use their expenditure to maximize calorie intake (Banerjee and Duflo, 2007), other authors see them as “value‐conscious”
0,4% 3,2%3,6%
6,6%
8,7%
57,9%
1,0%18,6%
BoP market sectorsHammond et al. (2007)
water
health
transportation
housing
energy
food
ICT
other
0,5% 2,9%4,5%
10,4%
6,2%
53,2%
1,4%
20,9%
BoP market sectors measured with BPIGuesalaga and Marshall (2008)
The demand side of BoP markets
64
(Prahalad, 2010, p. 25), “sophisticated and creative” consumers (Subrahmanyan and Gomez‐Arias, 2008, p. 410) while again others claim that “the poor lack self‐control and yield to temptation” (Karnani 2009, p.3) or find a “resistance to change” (Shukla and Bairiganjan, 2011, p. 4) concerning consumption expenditures and buying behavior. Moderate views such as expressed by Bertrand et al. (2004) are rare. These authors believe that “[t]he behavioral patterns of the poor […] may be neither perfectly calculating nor especially deviant. Rather, the poor may exhibit the same basic weaknesses and biases as do people from other walks of life, except that in poverty, with its narrow margins for error, the same behaviors often manifest themselves in more pronounced ways and can lead to worse outcomes” (p. 419).
Some authors argue that the circumstances and challenges subsistence consumers face when making a purchase, require them to approach the purchase differently than it is the case for richer consumers. While purchases are usually habitual for richer people, for the poor a purchasing decision requires detailed involvement (Chikweche and Fletcher, 2010).
D’Andrea and Herrero (2007) find that the purchasing decisions of the poor are influenced by many factors. Price is only one of them. Rather than only looking at shelf prices, they try to minimize total purchasing costs that also include travel time and prices, time spent standing in line or logistical constraints. Against this background, it is also less surprising that especially emerging consumers in Latin America are found to be willing to pay higher prices for brand products (D’Andrea et al., 2004). Various reasons motivate this behavior: first, poor people try to minimize risk by buying higher quality products. As their budgets are low, they have less margin for errors and thus resort to established and proven products (D’Andrea and Herrero, 2007). Secondly, the poor try to improve their self‐esteem as buyer and caregiver by buying brand products instead of the cheapest ones (D’Andrea and Herrero, 2007). And finally, despite concerns about affordability, they buy the more expensive brand products since they derive satisfaction not only from their own consumption but also from getting along better than their peers or at least keeping up with them (Diener et al., 1999; Fafchamps and Shilpi, 2008; Guillén Royo, 2007).
In contrast to the “resistance to change” asserted by some authors (Shukla and Bairiganjan, 2011, p. 4), Chikweche and Fletcher (2010) find that subsistence consumers are always looking for product innovations. Especially multi‐purpose products (e.g. multi‐purpose soap), cheaper products or products that are more readily available than established ones are welcomed by poor consumers. Surveyed consumers in Zimbabwe also state that they appreciate direct marketing activities such as in store sampling or road shows and that such activities have an influence on their buying decisions.
A study by Viswanathan et al. (2010), however, shows that not companies’ marketing activities but family and friends are the most important sources of information subsistence consumers rely on for their buying decisions. As literacy levels are generally low among BoP consumers and information in the vernacular language is often lacking, formal, especially written sources of information are less helpful for the poor (Chikweche and Fletcher, 2010; Shukla and Bairiganjan, 2011; Viswanathan et al., 2010).
Other factors determining buying decisions of the poor are the relationships with shopkeepers as they are often a source of credit for the poor. For this reason, trust and social ties between buyers and sellers have an important effect on the decision of the poor where to buy (Chikweche and Fletcher, 2010; D’Andrea and Herrero, 2007; Viswanathan et al., 2010; Weidner et al., 2010).
Chikweche and Fletcher (2010) also find changing gender roles induced by declining real incomes. Their study shows that responsibility for purchases is more and more shared between husbands and wives across all groups of subsistence consumers since budget constraints and product shortages have led to either husbands or wives buying a product whoever finds it at a cheaper price whereas purchases were previously the task of the wife alone.
In many poor countries, political factors leave their mark on consumers’ purchasing behavior. Chikweche and Fletcher (2010) analyze factors influencing purchasing decisions of subsistence
The demand side of BoP markets
65
consumers in Zimbabwe and find that people are required to show ruling party membership cards if they want to buy subsidized products. While this special case may be specific to the circumstances in Zimbabwe, similar obstacles for subsistence consumers caused by political constraints and/or product scarcities can be observed in many places. In Ethiopia, such political constraints are prevalent for sugar and edible oil that are only distributed by the government due to the pronounced scarcity of the products.
Preliminaryconclusion:whatdoweknowaboutBoPconsumers?III‐2.4
The question what is known about the purchasing behavior of the poor and factors influencing it can be answered with: something but astonishingly little. The poor spend most of their budget on food. Especially when incomes rise, they are willing to pay more for brand products. They seek most information about products from their family and friends and attach importance to trust and social ties to shop owners as they often depend on them as source of credit. BoP consumers aim at minimizing total purchasing costs, which implies that the retail price of products is only one of several components making a product cheap or expensive in their view. Yet, despite these important insights, a lot of valuable information about the poor as customers is still missing. For instance, only very few studies differentiate between rural and urban consumers although there is evidence that there are significant differences in consumption patterns (Guillén Royo, 2007). Furthermore, assessments of the needs of the poor and adequate want satisfiers rely mainly on the judgments of outsiders rather than on the opinions of the poor themselves.
However, ambiguities concerning BoP consumers already start with identifying them. Definitions of BoP consumers are not consistent and rarely justified with empirically informed arguments. Yet, there is a general agreement that the BoP is a huge consumer market made up by several billion poor people. The market of low‐income consumers is sometimes subdivided into several tiers defined by yearly income (see e.g. Prahalad and Hart, 2002). But this subdivision usually refers to higher income groups making no differentiation between those living on less than $2 a day. Only Hammond et al. (2007) stratify the BoP market in $500‐tiers, starting with those living on less than $500 a year as one group and those living on $500‐$1,000 as another one (see Table 9), thus splitting up the ‘actual’ BoP market in two groups. They then analyze from which tier expenditures in several market sectors come from. They (and some few studies building on them) are also the only one including a rural‐urban differentiation.
When it comes to poverty reduction such differentiations become critical. As Lanvin (2005, p. 15) puts it, the “arithmetic” of firm strategy and that of poverty do not necessarily overlap. “For a poverty fighter, the ‘next billion’ would refer to those who need to be taken out of absolute poverty; for an IT executive, the ‘next billion’ would more spontaneously refer to the next wave of customers that could emerge from developing countries, particularly in the mobile market” (cited from Schwittay, 2011, p. 72).
This very question of which groups among the poor can be customers is hardly ever addressed in the literature (D’Andrea and Herrero, 2007). Schwittay (2011, 2009) shows exemplarily with the example of HP’s e‐Inclusion project how a business project initially designed to cater to the rural poor was finally shifted to addressing target groups that are easier to reach out to when the initial set‐up did not yield the expected returns.
Against this background, two big challenges arise: one is scaling up successful business models to reach more poor people. The other is ‘pushing down’, i.e. pushing business approaches to also cater to those people who are difficult to reach out to – the marginalized poor. To shed some light on possible entry points for companies to reach out to people in such difficult settings like marginality hotspots, the next section assesses the context of poor and marginalized consumers in rural Ethiopia, their needs and experiences with market participation.
The demand side of BoP markets
66
III‐3 Who is theBoP in Ethiopia?Needs and demand of themarginalizedpoor
The previous section has identified several research gaps in the BoP literature, especially concerning the question how poor the target population is or can be for private sector investments, needs felt by the consumers and factors influencing their purchasing behavior. The following section tries to fill some of these gaps by highlighting on what very poor and marginalized people in Ethiopia spend, what they would like to buy and what they themselves consider as their most urgent unsatisfied needs. The estimation of the market sizes of the most bought products is a first step towards an assessment whether the marginalized poor can be a profitable market for domestic or foreign firms.
IntroductionIII‐3.1
A lot has been written about many different aspects of the lives of the poor in Ethiopia. Consumption and market transactions, however, have mainly been analyzed against the background of how they are affected by shocks or other factors. Dercon (2004), e.g., shows that the famine in 1984/5 still slowed down consumption growth in the 1990s. Skoufias and Quisumbing (2005) analyze changes in consumption induced by different shocks and find that food consumption generally seems to be better insured against shocks than non‐food consumption. The authors suspect that this observation can be explained by well‐functioning community risk‐sharing arrangements for food consumption. However, Dercon et al. (2006) find a significant impact of droughts and illness of a household member on per capita consumption (food and non‐food not separated) although the latter exhibits only a small impact (see also Dercon and Christiaensen, 2011).
Dercon and Hoddinott (2005) analyze the effect of market linkages on consumption and find that access to market towns has an effect on economic activities in rural areas. They show that if people live far away from the local market towns they are less likely to purchase inputs or sell a variety of products. Accordingly, they find a positive effect on welfare if access to market towns improves. More and better roads and transport facilities strongly increase consumption (ibid.). Dercon et al. (2009) show that access to an all‐weather road increases consumption growth by 16%.
Less is known about the private sector in Ethiopia. As has been explained in Section I‐6, Ethiopia is a challenging place for the private sector (see also Part IV). This explains why there are only very few examples of inclusive business models rolled out beyond a pilot phase as yet. One of the few exceptions is the Manual Distribution Centers of CocaCola (see e.g. Nelson et al., 2009). Other ‘big players’ in innovative business approaches such as Nestlé and Unilever contrast strongly: Nestlé was found to be a ‘one man show’ when visiting the country office in mid‐2012 with the only employee having arrived there only shortly before. Unilever left the country altogether in 2004 due to recurrent losses (Mekuria, 2004). Initiatives by Ethiopian companies are rare and hardly documented. Thus, there are very few experiences to draw on concerning private sector initiatives developing new markets in Ethiopia. The few Ethiopian examples are presented in the ‘Example‐Boxes’ throughout the following text.
Building on this information, a survey was conducted in marginality hotspots to add some detailed information about what the marginalized poor buy, what they would like to buy and what they name as their most urgent unsatisfied needs. The survey was designed to shed some light on the marginalized poor as consumers and producers and reveal possible entry points for the private sector.
The demand side of BoP markets
67
SurveymethodologyIII‐3.2
III‐3.2.1 Datacollection
In spring 2012, data from 180 households was collected in Ethiopian marginality hotspots to get information about the marginalized poor as special potential consumer group. Three enumerators were carefully trained for data collection in each region. In SNNP, local people were needed to translate from Amharic into the different local languages. People from the villages with good knowledge of Amharic were recruited by the kebele administrators on short notice. The trained enumerators discussed the purpose of the survey and all questions with the local assistants. In this context, the enumerators also asked the local assistants to go through the questionnaire with each other and translate the wording of the questions back to Amharic to control for misinterpretation or misleading wording of the question.
The selection of local assistants in SNNP by local woreda administrators might have caused fears of political control by the respondents that led them to hide certain unsatisfied needs like e.g. sugar or edible oil, which are scarce in the country and therefore only distributed by the government. However, as there is no significant difference between the needs mentioned in SNNP and in Amhara where ‘external’ people conducted the interview in absence of local government staff, this influence can be considered as negligible.
Although the training was done with great care, handling answers of the respondents through two stages until being noted on paper is likely to cause some noise. Yet, quality of the data from SNNP can be considered as quite high since the local assistants understood the importance of exact translations very well and all enumerators put much effort in ensuring correct answers to the questions. Furthermore, the questions are very short and straightforward, which helped to minimize confusion among the local translators.
Some explanations concerning the questionnaire seem to be adequate since its shortness may be surprising. Originally, a comprehensive questionnaire was developed containing questions about household demographics, all crops planted and use of improved seed and other inputs. Yet, after careful pre‐tests the questionnaire had to be shortened considerably due to the very limited time span interviewees could concentrate. During the pre‐tests it turned out that interviewees lost concentration after about 45 minutes and were then likely to give inaccurate answers, which they could not repeat when the question was asked again a bit later. For this reason, it was decided to go ahead with very few questions but more accurate answers and miss other information. The final questionnaire entails about twenty questions, which provide the minimum of information needed to answer the research questions.
Findings from the shortened questionnaire were then complemented with information from expert interviews and observations of general village characteristics. Questions concerning access to electricity for example were rendered obsolete for most respondents because their village was not connected to a power grid and other sources of electricity were not available in the village according to interviewed members of the local administration. Furthermore, a lot of general information about characteristics of respondents and their villages is part of the marginality mapping and thus already included in the marginality hotspot map and could therefore be skipped from the questionnaire.
In the following chapter, findings from this survey are sometimes compared with data of the ERHS. The ERHS is a publicly available panel data set provided by IFPRI and the University of Oxford covering 1477 households in 15 different villages in Ethiopia. With the help of geographic information about the villages (GPS coordinates) a marginality dummy was constructed for the ERHS data that indicates whether a village is located in a marginality hotspot or not. If not indicated otherwise, comparisons refer to findings about respondents living in villages that are located in marginality hotspots.
The demand side of BoP markets
68
III‐3.2.2 Thesamplingprocedure
The sampling procedure involved three steps of stratification and systematic random sampling within the strata. Stratified sampling was used since it “combines the conceptual simplicity of simple random sampling with potentially significant gains in reliability” (Levy and Lemeshow, 2008, p. 122). Levy and Lemeshow (2008, p. 175) determine the sample size for a stratified random sampling according to
where N is the total population, z is the usual reliability coefficient based on the normal distribution,
being set to 1,96 in the present case to have a confidence interval of 95%, i.e. an α of 0.05, and being the population mean; ε defines the maximum range an estimated parameter is allowed to deviate from the true unknown value and was set to be 10% here, which is a common value in the literature (Levy and Lemeshow, 2008). Based on these values and the standard deviations and mean average market expenditures evaluated in the pre‐test, which exhibited a very low variance, the resulting sample size was calculated to be 135 households to be representative for the people marginalized in 6 or 7 dimensions. The survey sample size was finally determined to be 180 to leave some room for missing data and non‐response.
The data collected is representative for people living in marginality hotspots in Ethiopia. Households were selected randomly by the following sampling procedure: based on the marginality hotspot map of Ethiopia (see Map 1), Amhara and SNNP were selected as study regions since both regions contain woredas in which people are marginalized in 6 and 7 dimensions. Thus, the first stage contains stratification, each region being one stratum. From both strata, woredas with marginality hotspot areas were selected and listed with the number of people living there according to the 2007 Census (CSA 2008). Systematic‐random sampling (see Magnani, 1997, p. 25), which ensures unbiased estimates of population means, proportions and totals (Levy and Lemeshow, 2008) was used to select two woredas in each region. The number of two woredas per region was chosen as a compromise between diversity and feasibility given limited time and resources. With the same methodology, kebeles were chosen within the selected four woredas with the help of household data provided by the local woreda administration. In the kebeles, random walk following a strict walking rule led the enumerators to the households. In each kebele, fifteen households were interviewed, resulting in a total of 180 interviews.
Additionally, on every market in the local market town of the visited woredas, several traders and shop owners were interviewed, especially those selling salt, kerosene, sugar and soap – products that were expected to be bought by the greatest number of people and that are classical ‘BoP products’, i.e. products (or their substitutes) that are successfully marketed to poor people in other countries (see e.g. case studies in Prahalad, 2010). Traders selling salt and kerosene were counted and at least 20% of them were interviewed. For soap and sugar the sampling procedure was more difficult because these products are also sold in the local shops that were difficult to count. Yet, also for these products every fifth trader on the market was interviewed. These interviews were used to learn more about the value chains of the products and the profit margins involved when selling to the marginalized poor.
As the data is representative for the marginalized poor in Ethiopia survey data is sometimes presented referring to the ‘marginalized poor’ instead of referring only to ‘survey respondents’. All results in the following refer to this group. If other data is used, this is clearly indicated.
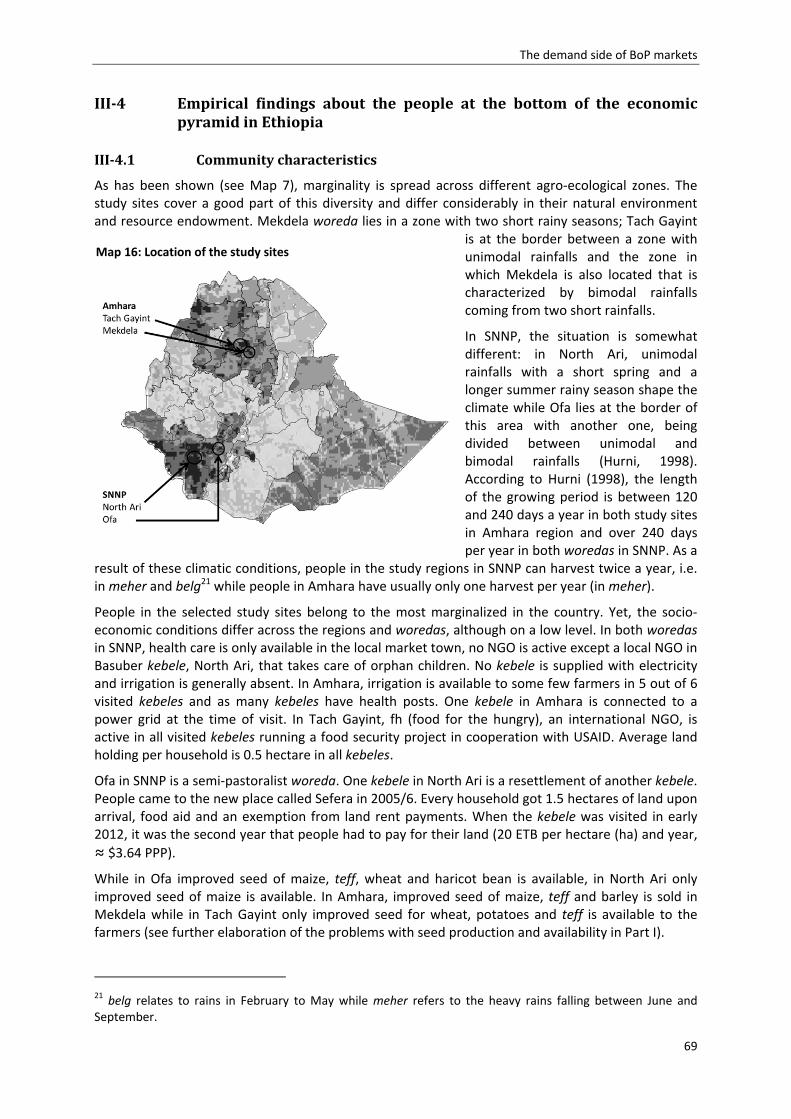
The demand side of BoP markets
69
III‐4 Empirical findings about the people at the bottom of the economicpyramidinEthiopia
CommunitycharacteristicsIII‐4.1
As has been shown (see Map 7), marginality is spread across different agro‐ecological zones. The study sites cover a good part of this diversity and differ considerably in their natural environment and resource endowment. Mekdela woreda lies in a zone with two short rainy seasons; Tach Gayint
is at the border between a zone with unimodal rainfalls and the zone in which Mekdela is also located that is characterized by bimodal rainfalls coming from two short rainfalls.
In SNNP, the situation is somewhat different: in North Ari, unimodal rainfalls with a short spring and a longer summer rainy season shape the climate while Ofa lies at the border of this area with another one, being divided between unimodal and bimodal rainfalls (Hurni, 1998). According to Hurni (1998), the length of the growing period is between 120 and 240 days a year in both study sites in Amhara region and over 240 days per year in both woredas in SNNP. As a
result of these climatic conditions, people in the study regions in SNNP can harvest twice a year, i.e. in meher and belg21 while people in Amhara have usually only one harvest per year (in meher).
People in the selected study sites belong to the most marginalized in the country. Yet, the socio‐economic conditions differ across the regions and woredas, although on a low level. In both woredas in SNNP, health care is only available in the local market town, no NGO is active except a local NGO in Basuber kebele, North Ari, that takes care of orphan children. No kebele is supplied with electricity and irrigation is generally absent. In Amhara, irrigation is available to some few farmers in 5 out of 6 visited kebeles and as many kebeles have health posts. One kebele in Amhara is connected to a power grid at the time of visit. In Tach Gayint, fh (food for the hungry), an international NGO, is active in all visited kebeles running a food security project in cooperation with USAID. Average land holding per household is 0.5 hectare in all kebeles.
Ofa in SNNP is a semi‐pastoralist woreda. One kebele in North Ari is a resettlement of another kebele. People came to the new place called Sefera in 2005/6. Every household got 1.5 hectares of land upon arrival, food aid and an exemption from land rent payments. When the kebele was visited in early 2012, it was the second year that people had to pay for their land (20 ETB per hectare (ha) and year,
≈ $3.64 PPP).
While in Ofa improved seed of maize, teff, wheat and haricot bean is available, in North Ari only improved seed of maize is available. In Amhara, improved seed of maize, teff and barley is sold in Mekdela while in Tach Gayint only improved seed for wheat, potatoes and teff is available to the farmers (see further elaboration of the problems with seed production and availability in Part I).
21 belg relates to rains in February to May while meher refers to the heavy rains falling between June and September.
Map 16: Location of the study sites
The demand side of BoP markets
70
BasiccharacteristicsoftherespondentsIII‐4.2
All of the respondents are household heads. Most respondents are between 30 and 40 years old (see Table 10). Some admitted that they did not know their age and some claimed to be 100 years old. The majority of the respondents are male (107 out of 181). In both regions about 40% of the respondents are female.
According to the survey, people living in marginality hotspots in Amhara need about one hour to get to the next market. People in hotspot regions in SNNP need considerably more time (90 minutes on average; see also Table 10). In most kebeles, there are small shops selling basic items such as soap, plastic containers, some biscuits or pens. The average time to get to the next shop is only about ten to fifteen minutes. Yet, most people mainly shop on the local markets.
Usually, people go to the local market twice a week. In most woredas, markets are not daily but held on special market days once or twice a week. In North Ari, where many people live far from the local market town, people only go once a week (see also Table 10).
Nearly all respondents live on agriculture. Only 2 respondents do not live on agriculture themselves but rent out their land. However, some respondents (30%) earn additional income from the PSNP, petty trading or other activities such as being teacher in the local school or working as a broker.22
22 Earnings were not asked for in detail as the point of interest was expenditures, independently from where the money in the household comes from.
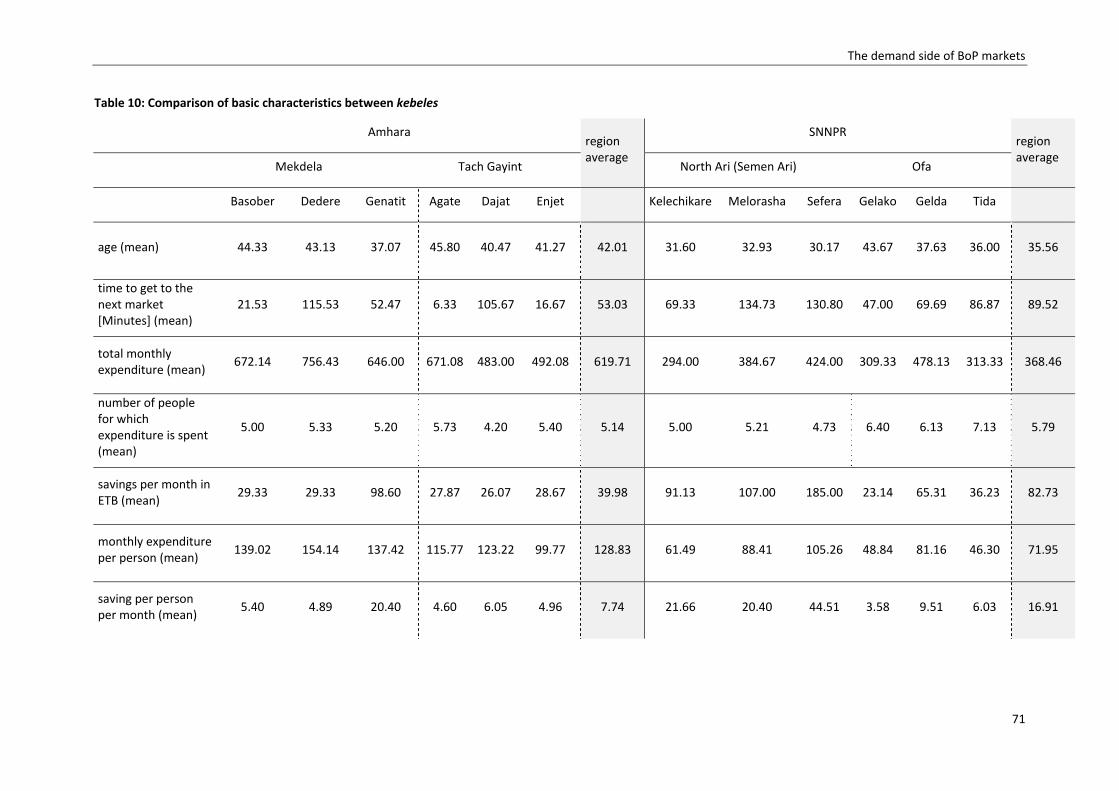
The demand side of BoP markets
71
Table 10: Comparison of basic characteristics between kebeles
Amhara region average
SNNPR region average
Mekdela Tach Gayint North Ari (Semen Ari) Ofa
Basober Dedere Genatit Agate Dajat Enjet
Kelechikare Melorasha Sefera Gelako Gelda Tida
age (mean) 44.33 43.13 37.07 45.80 40.47 41.27 42.01 31.60 32.93 30.17 43.67 37.63 36.00 35.56
time to get to the next market [Minutes] (mean)
21.53 115.53 52.47 6.33 105.67 16.67 53.03 69.33 134.73 130.80 47.00 69.69 86.87 89.52
total monthly expenditure (mean)
672.14 756.43 646.00 671.08 483.00 492.08 619.71 294.00 384.67 424.00 309.33 478.13 313.33 368.46
number of people for which expenditure is spent (mean)
5.00 5.33 5.20 5.73 4.20 5.40 5.14 5.00 5.21 4.73 6.40 6.13 7.13 5.79
savings per month in ETB (mean)
29.33 29.33 98.60 27.87 26.07 28.67 39.98 91.13 107.00 185.00 23.14 65.31 36.23 82.73
monthly expenditure per person (mean)
139.02 154.14 137.42 115.77 123.22 99.77 128.83 61.49 88.41 105.26 48.84 81.16 46.30 71.95
saving per person per month (mean)
5.40 4.89 20.40 4.60 6.05 4.96 7.74 21.66 20.40 44.51 3.58 9.51 6.03 16.91
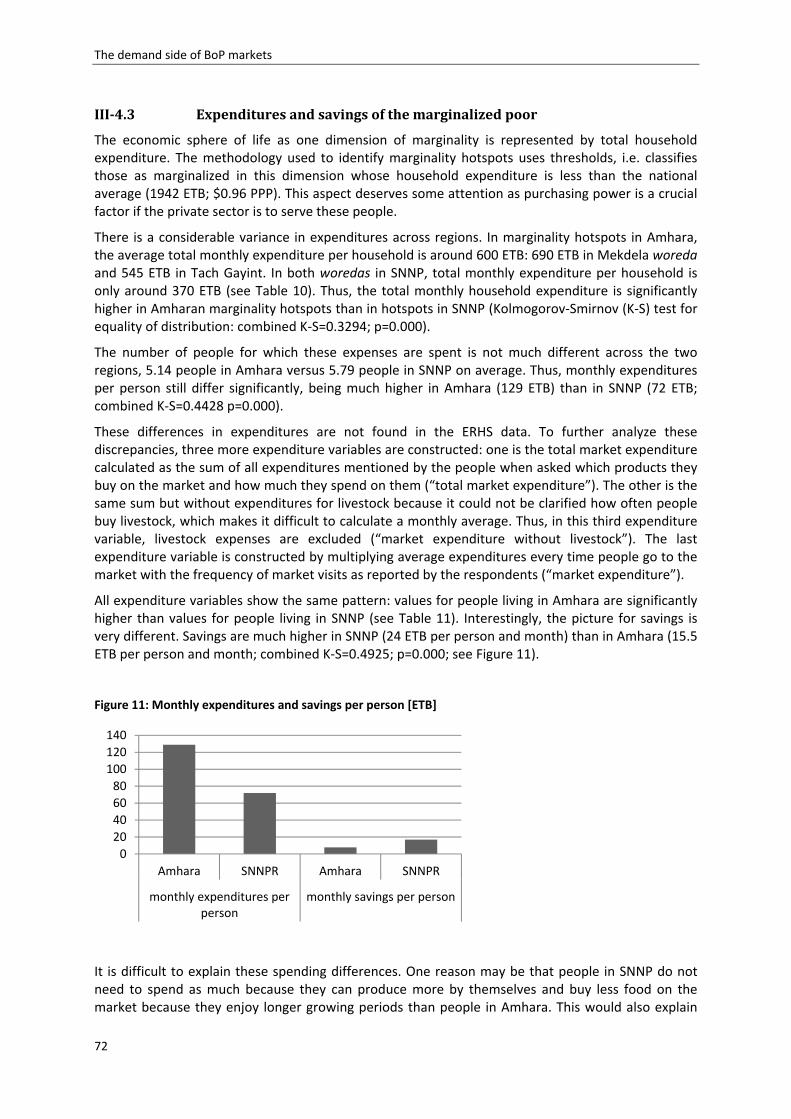
The demand side of BoP markets
72
ExpendituresandsavingsofthemarginalizedpoorIII‐4.3
The economic sphere of life as one dimension of marginality is represented by total household expenditure. The methodology used to identify marginality hotspots uses thresholds, i.e. classifies those as marginalized in this dimension whose household expenditure is less than the national average (1942 ETB; $0.96 PPP). This aspect deserves some attention as purchasing power is a crucial factor if the private sector is to serve these people.
There is a considerable variance in expenditures across regions. In marginality hotspots in Amhara, the average total monthly expenditure per household is around 600 ETB: 690 ETB in Mekdela woreda and 545 ETB in Tach Gayint. In both woredas in SNNP, total monthly expenditure per household is only around 370 ETB (see Table 10). Thus, the total monthly household expenditure is significantly higher in Amharan marginality hotspots than in hotspots in SNNP (Kolmogorov‐Smirnov (K‐S) test for equality of distribution: combined K‐S=0.3294; p=0.000).
The number of people for which these expenses are spent is not much different across the two regions, 5.14 people in Amhara versus 5.79 people in SNNP on average. Thus, monthly expenditures per person still differ significantly, being much higher in Amhara (129 ETB) than in SNNP (72 ETB; combined K‐S=0.4428 p=0.000).
These differences in expenditures are not found in the ERHS data. To further analyze these discrepancies, three more expenditure variables are constructed: one is the total market expenditure calculated as the sum of all expenditures mentioned by the people when asked which products they buy on the market and how much they spend on them (“total market expenditure”). The other is the same sum but without expenditures for livestock because it could not be clarified how often people buy livestock, which makes it difficult to calculate a monthly average. Thus, in this third expenditure variable, livestock expenses are excluded (“market expenditure without livestock”). The last expenditure variable is constructed by multiplying average expenditures every time people go to the market with the frequency of market visits as reported by the respondents (“market expenditure”).
All expenditure variables show the same pattern: values for people living in Amhara are significantly higher than values for people living in SNNP (see Table 11). Interestingly, the picture for savings is very different. Savings are much higher in SNNP (24 ETB per person and month) than in Amhara (15.5 ETB per person and month; combined K‐S=0.4925; p=0.000; see Figure 11).
Figure 11: Monthly expenditures and savings per person [ETB]
It is difficult to explain these spending differences. One reason may be that people in SNNP do not need to spend as much because they can produce more by themselves and buy less food on the market because they enjoy longer growing periods than people in Amhara. This would also explain
0
20
40
60
80
100
120
140
Amhara SNNPR Amhara SNNPR
monthly expenditures perperson
monthly savings per person
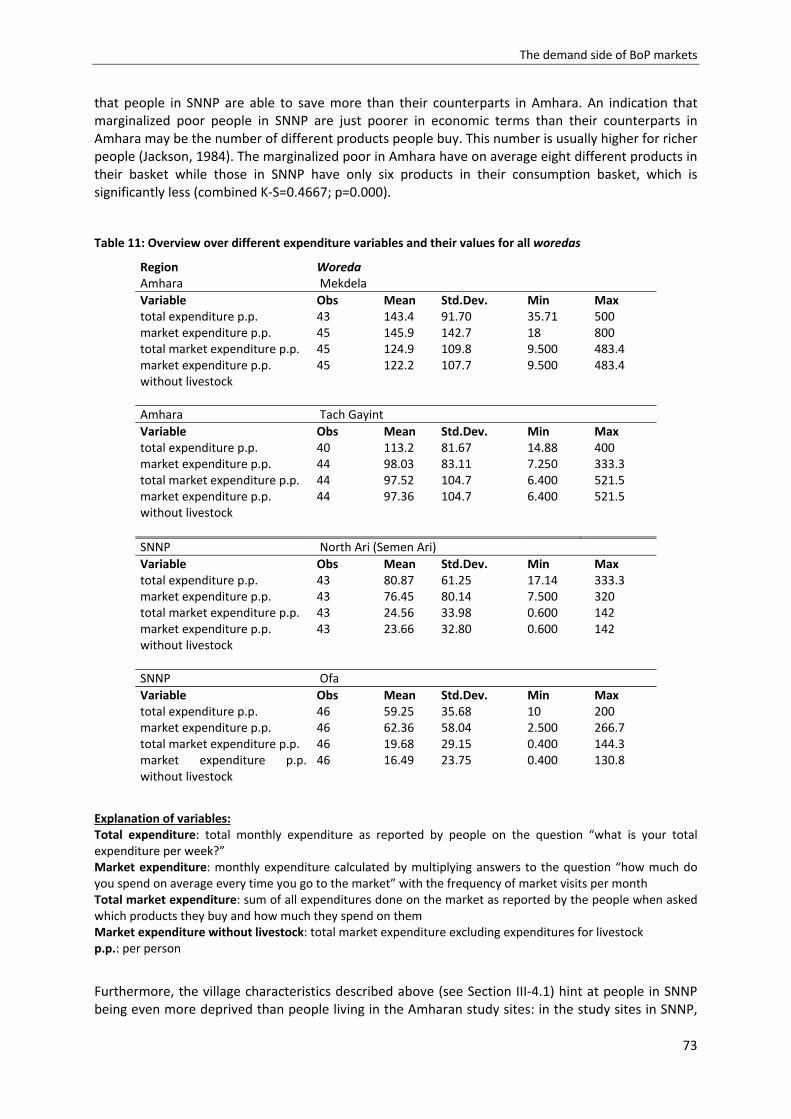
The demand side of BoP markets
73
that people in SNNP are able to save more than their counterparts in Amhara. An indication that marginalized poor people in SNNP are just poorer in economic terms than their counterparts in Amhara may be the number of different products people buy. This number is usually higher for richer people (Jackson, 1984). The marginalized poor in Amhara have on average eight different products in their basket while those in SNNP have only six products in their consumption basket, which is significantly less (combined K‐S=0.4667; p=0.000).
Table 11: Overview over different expenditure variables and their values for all woredas
Region Woreda Amhara Mekdela
Variable Obs Mean Std.Dev. Min Max total expenditure p.p. 43 143.4 91.70 35.71 500 market expenditure p.p. 45 145.9 142.7 18 800 total market expenditure p.p. 45 124.9 109.8 9.500 483.4 market expenditure p.p. without livestock
45 122.2 107.7 9.500 483.4
Amhara Tach Gayint
Variable Obs Mean Std.Dev. Min Max total expenditure p.p. 40 113.2 81.67 14.88 400 market expenditure p.p. 44 98.03 83.11 7.250 333.3 total market expenditure p.p. 44 97.52 104.7 6.400 521.5 market expenditure p.p. without livestock
44 97.36 104.7 6.400 521.5
SNNP North Ari (Semen Ari)
Variable Obs Mean Std.Dev. Min Max total expenditure p.p. 43 80.87 61.25 17.14 333.3 market expenditure p.p. 43 76.45 80.14 7.500 320 total market expenditure p.p. 43 24.56 33.98 0.600 142 market expenditure p.p. without livestock
43 23.66 32.80 0.600 142
SNNP Ofa
Variable Obs Mean Std.Dev. Min Max total expenditure p.p. 46 59.25 35.68 10 200 market expenditure p.p. 46 62.36 58.04 2.500 266.7 total market expenditure p.p. 46 19.68 29.15 0.400 144.3 market expenditure p.p. without livestock
46 16.49 23.75 0.400 130.8
Explanation of variables: Total expenditure: total monthly expenditure as reported by people on the question “what is your total expenditure per week?” Market expenditure: monthly expenditure calculated by multiplying answers to the question “how much do you spend on average every time you go to the market” with the frequency of market visits per month Total market expenditure: sum of all expenditures done on the market as reported by the people when asked which products they buy and how much they spend on them Market expenditure without livestock: total market expenditure excluding expenditures for livestock p.p.: per person
Furthermore, the village characteristics described above (see Section III‐4.1) hint at people in SNNP being even more deprived than people living in the Amharan study sites: in the study sites in SNNP,
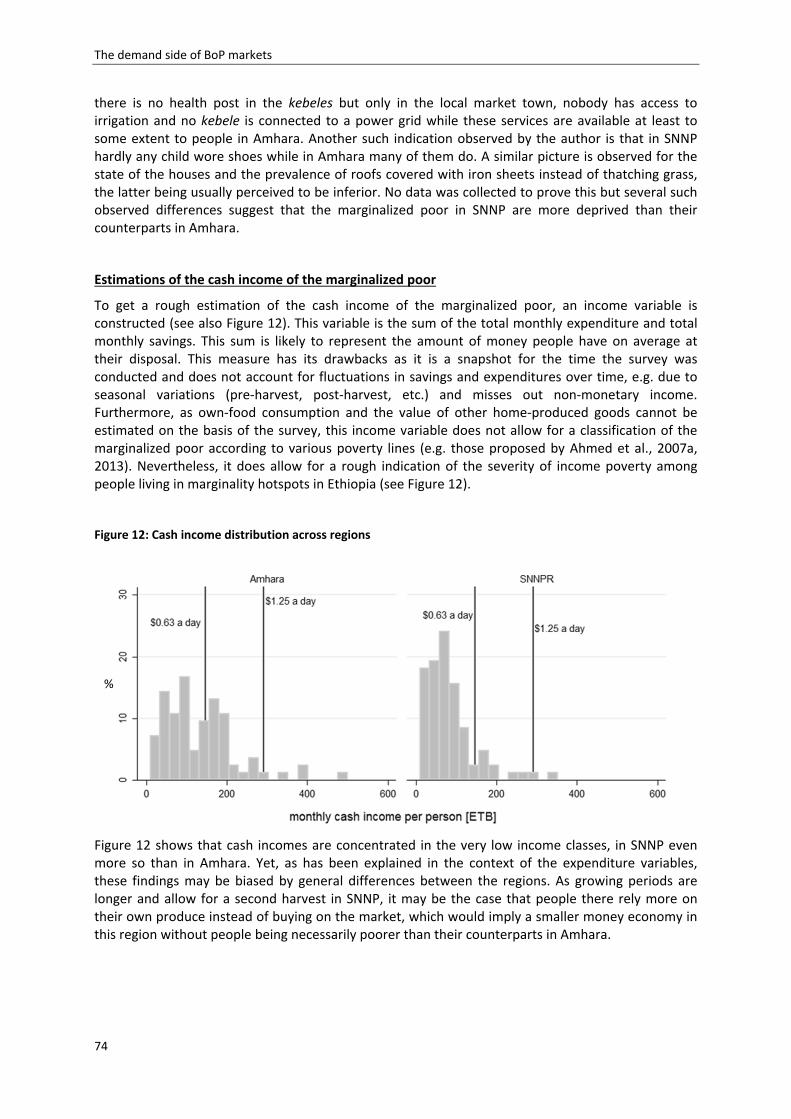
The demand side of BoP markets
74
there is no health post in the kebeles but only in the local market town, nobody has access to irrigation and no kebele is connected to a power grid while these services are available at least to some extent to people in Amhara. Another such indication observed by the author is that in SNNP hardly any child wore shoes while in Amhara many of them do. A similar picture is observed for the state of the houses and the prevalence of roofs covered with iron sheets instead of thatching grass, the latter being usually perceived to be inferior. No data was collected to prove this but several such observed differences suggest that the marginalized poor in SNNP are more deprived than their counterparts in Amhara.
Estimations of the cash income of the marginalized poor
To get a rough estimation of the cash income of the marginalized poor, an income variable is constructed (see also Figure 12). This variable is the sum of the total monthly expenditure and total monthly savings. This sum is likely to represent the amount of money people have on average at their disposal. This measure has its drawbacks as it is a snapshot for the time the survey was conducted and does not account for fluctuations in savings and expenditures over time, e.g. due to seasonal variations (pre‐harvest, post‐harvest, etc.) and misses out non‐monetary income. Furthermore, as own‐food consumption and the value of other home‐produced goods cannot be estimated on the basis of the survey, this income variable does not allow for a classification of the marginalized poor according to various poverty lines (e.g. those proposed by Ahmed et al., 2007a, 2013). Nevertheless, it does allow for a rough indication of the severity of income poverty among people living in marginality hotspots in Ethiopia (see Figure 12).
Figure 12: Cash income distribution across regions
Figure 12 shows that cash incomes are concentrated in the very low income classes, in SNNP even more so than in Amhara. Yet, as has been explained in the context of the expenditure variables, these findings may be biased by general differences between the regions. As growing periods are longer and allow for a second harvest in SNNP, it may be the case that people there rely more on their own produce instead of buying on the market, which would imply a smaller money economy in this region without people being necessarily poorer than their counterparts in Amhara.
%
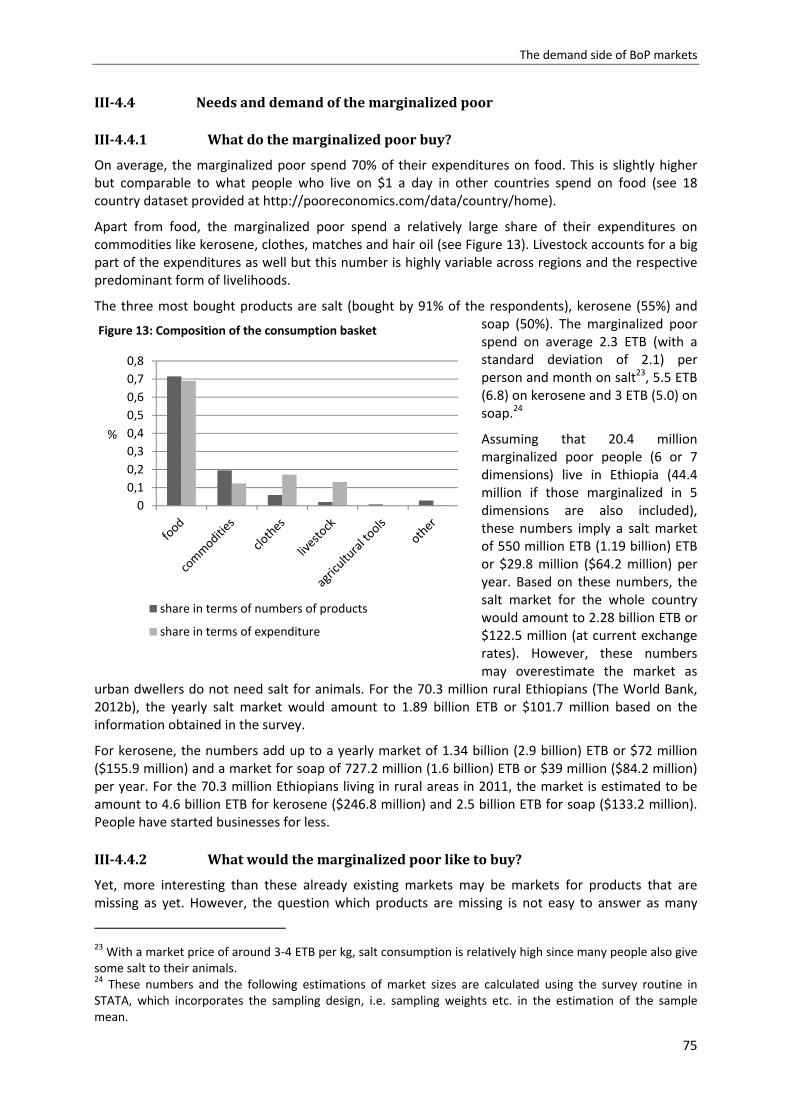
The demand side of BoP markets
75
NeedsanddemandofthemarginalizedpoorIII‐4.4
III‐4.4.1 Whatdothemarginalizedpoorbuy?
On average, the marginalized poor spend 70% of their expenditures on food. This is slightly higher but comparable to what people who live on $1 a day in other countries spend on food (see 18 country dataset provided at http://pooreconomics.com/data/country/home).
Apart from food, the marginalized poor spend a relatively large share of their expenditures on commodities like kerosene, clothes, matches and hair oil (see Figure 13). Livestock accounts for a big part of the expenditures as well but this number is highly variable across regions and the respective predominant form of livelihoods.
The three most bought products are salt (bought by 91% of the respondents), kerosene (55%) and soap (50%). The marginalized poor spend on average 2.3 ETB (with a standard deviation of 2.1) per person and month on salt23, 5.5 ETB (6.8) on kerosene and 3 ETB (5.0) on soap.24
Assuming that 20.4 million marginalized poor people (6 or 7 dimensions) live in Ethiopia (44.4 million if those marginalized in 5 dimensions are also included), these numbers imply a salt market of 550 million ETB (1.19 billion) ETB or $29.8 million ($64.2 million) per year. Based on these numbers, the salt market for the whole country would amount to 2.28 billion ETB or $122.5 million (at current exchange rates). However, these numbers may overestimate the market as
urban dwellers do not need salt for animals. For the 70.3 million rural Ethiopians (The World Bank, 2012b), the yearly salt market would amount to 1.89 billion ETB or $101.7 million based on the information obtained in the survey.
For kerosene, the numbers add up to a yearly market of 1.34 billion (2.9 billion) ETB or $72 million ($155.9 million) and a market for soap of 727.2 million (1.6 billion) ETB or $39 million ($84.2 million) per year. For the 70.3 million Ethiopians living in rural areas in 2011, the market is estimated to be amount to 4.6 billion ETB for kerosene ($246.8 million) and 2.5 billion ETB for soap ($133.2 million). People have started businesses for less.
III‐4.4.2 Whatwouldthemarginalizedpoorliketobuy?
Yet, more interesting than these already existing markets may be markets for products that are missing as yet. However, the question which products are missing is not easy to answer as many
23 With a market price of around 3‐4 ETB per kg, salt consumption is relatively high since many people also give some salt to their animals. 24 These numbers and the following estimations of market sizes are calculated using the survey routine in STATA, which incorporates the sampling design, i.e. sampling weights etc. in the estimation of the sample mean.
Figure 13: Composition of the consumption basket
0
0,1
0,2
0,3
0,4
0,5
0,6
0,7
0,8
%
share in terms of numbers of products
share in terms of expenditure
The demand side of BoP markets
76
needs of the marginalized poor are likely to be hidden needs and thus not easily revealed by asking the potential customers. This assumption seems to be confirmed: when asking the marginalized poor which products they would like to buy but are not available on the market, the answer is quite clear: 70% of the respondents say that “everything is available on the local market but we cannot afford it”.
One indication which needs are most irksome for the marginalized poor can be found by asking for the affordability of products. When questioned which products on the market or in the shop the marginalized poor would like to buy but are too expensive for them, 73% of all answers relate to food products, 20% to commodities and 5% to livestock, especially improved breeds of poultry or sheep that are sold in some woredas. 7% of the respondents say that they need an ox for plowing but cannot afford it. Only 3 out of 180 respondents (1.7%) say that they can afford everything they need (see also Figure 15).
The answers also hint at a deficit and resulting high prices of dairy products: of the 11% of the answers stating that food is among the products that are available on the market but too expensive, many refer to dairy products like butter and cheese as well as meat (10%). 41 of the 43 people saying dairy products are too expensive belong to the poorest quartile while only very few of those people in higher income groups refer to dairy products as being too expensive. This seems to confirm that wealthier people strive for tastier and more nutritious food, such as dairy products, when minimum requirements of calorie consumption are met (cf. Banerjee and Duflo, 2011).
It is surprising that neither agricultural inputs like improved seeds or fertilizer nor credit are mentioned as being too expensive despite the frequently stated demand for these products and the inability to buy them for a lack of money and/or credit. This puzzle may be explained by the wording of the question, which asked for products on the market or in the shop. Seeds and fertilizer are not provided on the market (as the physical local market) but by farmer cooperatives. The same applies for credit, which is also either provided by these institutions or local groups such as iddir or equb (see Box 8). Thus, respondents might have excluded these items from their answers because they are not procured on markets or in shops like other commodities.
III‐4.4.3 Whatarethemosturgentunsatisfiedneedsofthemarginalizedpoor?
The question what their most urgent unsatisfied need is was not a trivial one for the respondents. Many had great difficulties to answer this question and needed a lot of time to think about it. 12% of the respondents could not say anything about their needs even when given much time for the answer. Of those not being able to state their most urgent unsatisfied needs 12 are female and 9 are male, which implies that 16% of the female and 8% of the male respondents were unable to name
Box 8: Special financial institutions in Ethiopia: equb and iddir
Iddir and equb are both widespread forms of collective action in Ethiopia. Iddir groups are burial societies. Members meet once or twice a month and pay a little fee of 1 or 2 ETB. When a member dies, the club makes a payment to the surviving family (Dercon et al., 2008). Equb are also locally organized groups whose participants make regular payments into a fund, which is then given to each member in turn according to certain selection criteria (randomly selected by a lot or in a predetermined order) until every member has received the fund. Almost all households in a community participate, independently from their religion, status or race (Kedir, 2005). For the lack of access to bank accounts, the sum mobilized by these equb is estimated to be quite large, Tschakert (1976) estimates the amount saved in these clubs at 8‐10% of the country’s GDP at that time; Mauri (1987) surveyed 95 equbs in Addis Ababa and finds that their savings amount already to 15% of the total household savings deposited in the largest Ethiopian Bank, the Commercial Bank of Ethiopia. Despite the diffusion of bank branches into rural areas since then, equb still play an important role for financial intermediation in Ethiopia (Kedir et al., 2011).
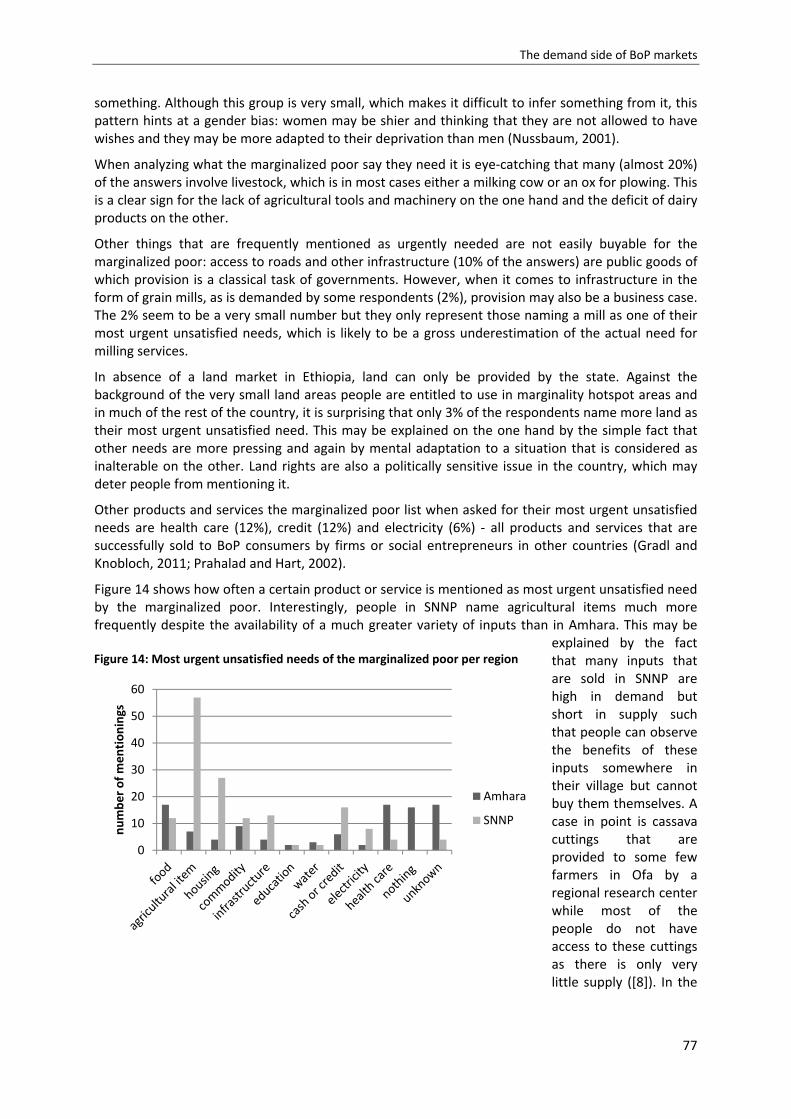
The demand side of BoP markets
77
something. Although this group is very small, which makes it difficult to infer something from it, this pattern hints at a gender bias: women may be shier and thinking that they are not allowed to have wishes and they may be more adapted to their deprivation than men (Nussbaum, 2001).
When analyzing what the marginalized poor say they need it is eye‐catching that many (almost 20%) of the answers involve livestock, which is in most cases either a milking cow or an ox for plowing. This is a clear sign for the lack of agricultural tools and machinery on the one hand and the deficit of dairy products on the other.
Other things that are frequently mentioned as urgently needed are not easily buyable for the marginalized poor: access to roads and other infrastructure (10% of the answers) are public goods of which provision is a classical task of governments. However, when it comes to infrastructure in the form of grain mills, as is demanded by some respondents (2%), provision may also be a business case. The 2% seem to be a very small number but they only represent those naming a mill as one of their most urgent unsatisfied needs, which is likely to be a gross underestimation of the actual need for milling services.
In absence of a land market in Ethiopia, land can only be provided by the state. Against the background of the very small land areas people are entitled to use in marginality hotspot areas and in much of the rest of the country, it is surprising that only 3% of the respondents name more land as their most urgent unsatisfied need. This may be explained on the one hand by the simple fact that other needs are more pressing and again by mental adaptation to a situation that is considered as inalterable on the other. Land rights are also a politically sensitive issue in the country, which may deter people from mentioning it.
Other products and services the marginalized poor list when asked for their most urgent unsatisfied needs are health care (12%), credit (12%) and electricity (6%) ‐ all products and services that are successfully sold to BoP consumers by firms or social entrepreneurs in other countries (Gradl and Knobloch, 2011; Prahalad and Hart, 2002).
Figure 14 shows how often a certain product or service is mentioned as most urgent unsatisfied need by the marginalized poor. Interestingly, people in SNNP name agricultural items much more frequently despite the availability of a much greater variety of inputs than in Amhara. This may be
explained by the fact that many inputs that are sold in SNNP are high in demand but short in supply such that people can observe the benefits of these inputs somewhere in their village but cannot buy them themselves. A case in point is cassava cuttings that are provided to some few farmers in Ofa by a regional research center while most of the people do not have access to these cuttings as there is only very little supply ([8]). In the
Figure 14: Most urgent unsatisfied needs of the marginalized poor per region
0
10
20
30
40
50
60
number of mentionings
Amhara
SNNP
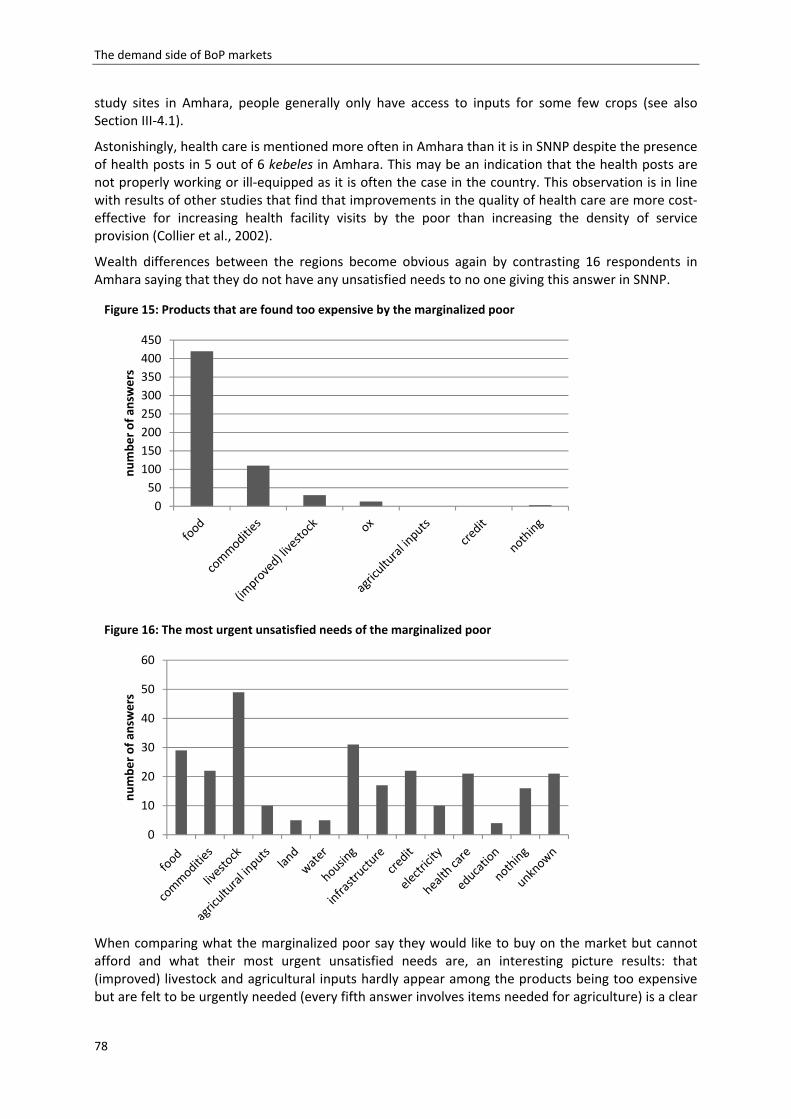
The demand side of BoP markets
78
study sites in Amhara, people generally only have access to inputs for some few crops (see also Section III‐4.1).
Astonishingly, health care is mentioned more often in Amhara than it is in SNNP despite the presence of health posts in 5 out of 6 kebeles in Amhara. This may be an indication that the health posts are not properly working or ill‐equipped as it is often the case in the country. This observation is in line with results of other studies that find that improvements in the quality of health care are more cost‐effective for increasing health facility visits by the poor than increasing the density of service provision (Collier et al., 2002).
Wealth differences between the regions become obvious again by contrasting 16 respondents in Amhara saying that they do not have any unsatisfied needs to no one giving this answer in SNNP.
When comparing what the marginalized poor say they would like to buy on the market but cannot afford and what their most urgent unsatisfied needs are, an interesting picture results: that (improved) livestock and agricultural inputs hardly appear among the products being too expensive but are felt to be urgently needed (every fifth answer involves items needed for agriculture) is a clear
Figure 15: Products that are found too expensive by the marginalized poor
0
50
100
150
200
250
300
350
400
450
number of an
swers
Figure 16: The most urgent unsatisfied needs of the marginalized poor
0
10
20
30
40
50
60
number of an
swers
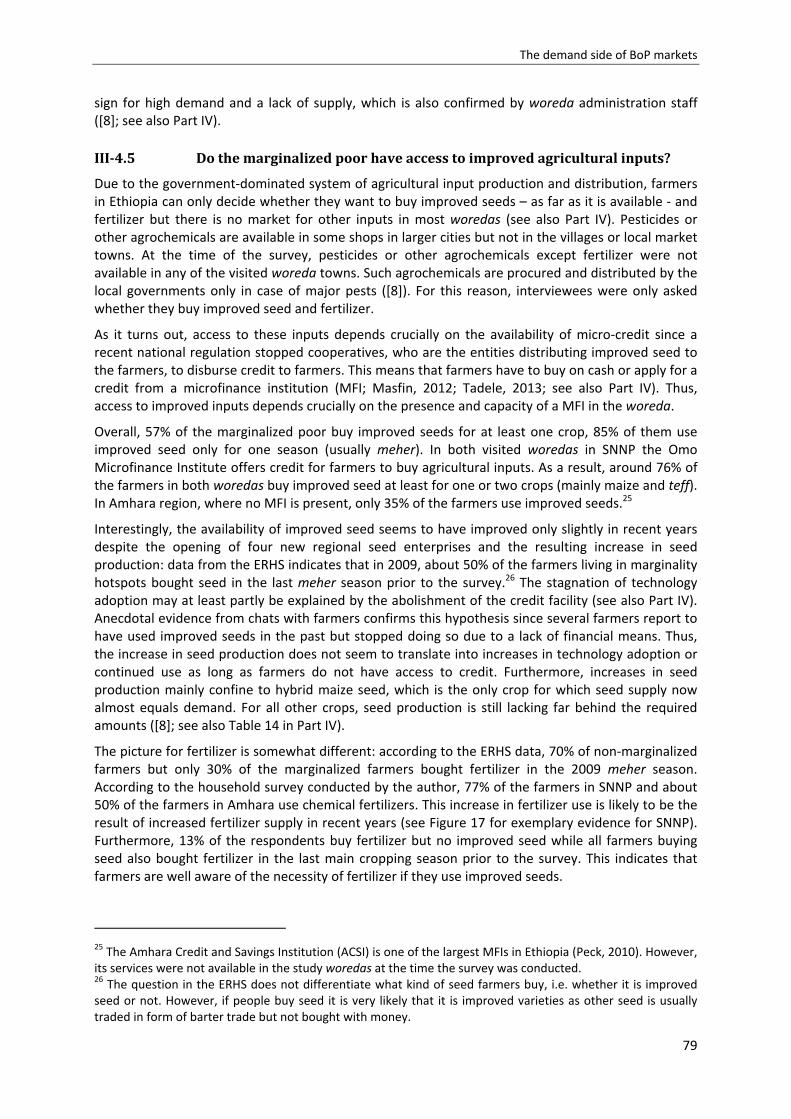
The demand side of BoP markets
79
sign for high demand and a lack of supply, which is also confirmed by woreda administration staff ([8]; see also Part IV).
Dothemarginalizedpoorhaveaccesstoimprovedagriculturalinputs?III‐4.5
Due to the government‐dominated system of agricultural input production and distribution, farmers in Ethiopia can only decide whether they want to buy improved seeds – as far as it is available ‐ and fertilizer but there is no market for other inputs in most woredas (see also Part IV). Pesticides or other agrochemicals are available in some shops in larger cities but not in the villages or local market towns. At the time of the survey, pesticides or other agrochemicals except fertilizer were not available in any of the visited woreda towns. Such agrochemicals are procured and distributed by the local governments only in case of major pests ([8]). For this reason, interviewees were only asked whether they buy improved seed and fertilizer.
As it turns out, access to these inputs depends crucially on the availability of micro‐credit since a recent national regulation stopped cooperatives, who are the entities distributing improved seed to the farmers, to disburse credit to farmers. This means that farmers have to buy on cash or apply for a credit from a microfinance institution (MFI; Masfin, 2012; Tadele, 2013; see also Part IV). Thus, access to improved inputs depends crucially on the presence and capacity of a MFI in the woreda.
Overall, 57% of the marginalized poor buy improved seeds for at least one crop, 85% of them use improved seed only for one season (usually meher). In both visited woredas in SNNP the Omo Microfinance Institute offers credit for farmers to buy agricultural inputs. As a result, around 76% of the farmers in both woredas buy improved seed at least for one or two crops (mainly maize and teff). In Amhara region, where no MFI is present, only 35% of the farmers use improved seeds.25
Interestingly, the availability of improved seed seems to have improved only slightly in recent years despite the opening of four new regional seed enterprises and the resulting increase in seed production: data from the ERHS indicates that in 2009, about 50% of the farmers living in marginality hotspots bought seed in the last meher season prior to the survey.26 The stagnation of technology adoption may at least partly be explained by the abolishment of the credit facility (see also Part IV). Anecdotal evidence from chats with farmers confirms this hypothesis since several farmers report to have used improved seeds in the past but stopped doing so due to a lack of financial means. Thus, the increase in seed production does not seem to translate into increases in technology adoption or continued use as long as farmers do not have access to credit. Furthermore, increases in seed production mainly confine to hybrid maize seed, which is the only crop for which seed supply now almost equals demand. For all other crops, seed production is still lacking far behind the required amounts ([8]; see also Table 14 in Part IV).
The picture for fertilizer is somewhat different: according to the ERHS data, 70% of non‐marginalized farmers but only 30% of the marginalized farmers bought fertilizer in the 2009 meher season. According to the household survey conducted by the author, 77% of the farmers in SNNP and about 50% of the farmers in Amhara use chemical fertilizers. This increase in fertilizer use is likely to be the result of increased fertilizer supply in recent years (see Figure 17 for exemplary evidence for SNNP). Furthermore, 13% of the respondents buy fertilizer but no improved seed while all farmers buying seed also bought fertilizer in the last main cropping season prior to the survey. This indicates that farmers are well aware of the necessity of fertilizer if they use improved seeds.
25 The Amhara Credit and Savings Institution (ACSI) is one of the largest MFIs in Ethiopia (Peck, 2010). However, its services were not available in the study woredas at the time the survey was conducted. 26 The question in the ERHS does not differentiate what kind of seed farmers buy, i.e. whether it is improved seed or not. However, if people buy seed it is very likely that it is improved varieties as other seed is usually traded in form of barter trade but not bought with money.
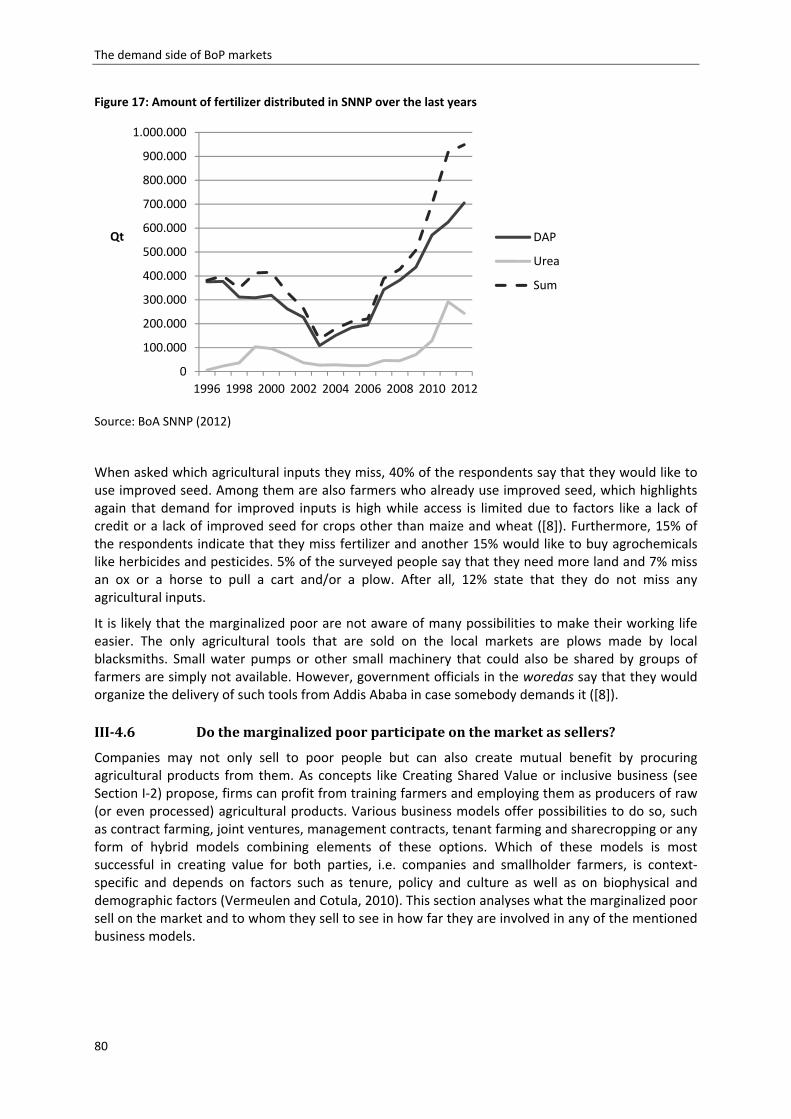
The demand side of BoP markets
80
Figure 17: Amount of fertilizer distributed in SNNP over the last years
Source: BoA SNNP (2012)
When asked which agricultural inputs they miss, 40% of the respondents say that they would like to use improved seed. Among them are also farmers who already use improved seed, which highlights again that demand for improved inputs is high while access is limited due to factors like a lack of credit or a lack of improved seed for crops other than maize and wheat ([8]). Furthermore, 15% of the respondents indicate that they miss fertilizer and another 15% would like to buy agrochemicals like herbicides and pesticides. 5% of the surveyed people say that they need more land and 7% miss an ox or a horse to pull a cart and/or a plow. After all, 12% state that they do not miss any agricultural inputs.
It is likely that the marginalized poor are not aware of many possibilities to make their working life easier. The only agricultural tools that are sold on the local markets are plows made by local blacksmiths. Small water pumps or other small machinery that could also be shared by groups of farmers are simply not available. However, government officials in the woredas say that they would organize the delivery of such tools from Addis Ababa in case somebody demands it ([8]).
Dothemarginalizedpoorparticipateonthemarketassellers?III‐4.6
Companies may not only sell to poor people but can also create mutual benefit by procuring agricultural products from them. As concepts like Creating Shared Value or inclusive business (see Section I‐2) propose, firms can profit from training farmers and employing them as producers of raw (or even processed) agricultural products. Various business models offer possibilities to do so, such as contract farming, joint ventures, management contracts, tenant farming and sharecropping or any form of hybrid models combining elements of these options. Which of these models is most successful in creating value for both parties, i.e. companies and smallholder farmers, is context‐specific and depends on factors such as tenure, policy and culture as well as on biophysical and demographic factors (Vermeulen and Cotula, 2010). This section analyses what the marginalized poor sell on the market and to whom they sell to see in how far they are involved in any of the mentioned business models.
0
100.000
200.000
300.000
400.000
500.000
600.000
700.000
800.000
900.000
1.000.000
1996 1998 2000 2002 2004 2006 2008 2010 2012
Qt DAP
Urea
Sum
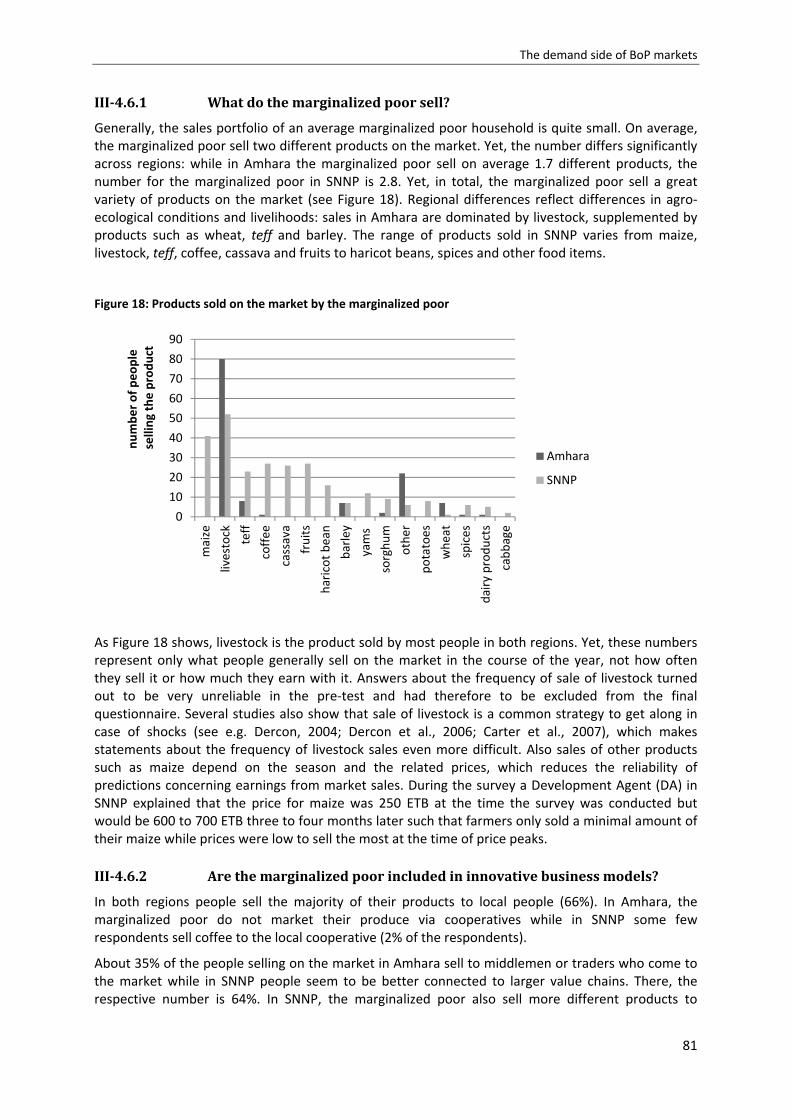
The demand side of BoP markets
81
III‐4.6.1 Whatdothemarginalizedpoorsell?
Generally, the sales portfolio of an average marginalized poor household is quite small. On average, the marginalized poor sell two different products on the market. Yet, the number differs significantly across regions: while in Amhara the marginalized poor sell on average 1.7 different products, the number for the marginalized poor in SNNP is 2.8. Yet, in total, the marginalized poor sell a great variety of products on the market (see Figure 18). Regional differences reflect differences in agro‐ecological conditions and livelihoods: sales in Amhara are dominated by livestock, supplemented by products such as wheat, teff and barley. The range of products sold in SNNP varies from maize, livestock, teff, coffee, cassava and fruits to haricot beans, spices and other food items.
Figure 18: Products sold on the market by the marginalized poor
As Figure 18 shows, livestock is the product sold by most people in both regions. Yet, these numbers represent only what people generally sell on the market in the course of the year, not how often they sell it or how much they earn with it. Answers about the frequency of sale of livestock turned out to be very unreliable in the pre‐test and had therefore to be excluded from the final questionnaire. Several studies also show that sale of livestock is a common strategy to get along in case of shocks (see e.g. Dercon, 2004; Dercon et al., 2006; Carter et al., 2007), which makes statements about the frequency of livestock sales even more difficult. Also sales of other products such as maize depend on the season and the related prices, which reduces the reliability of predictions concerning earnings from market sales. During the survey a Development Agent (DA) in SNNP explained that the price for maize was 250 ETB at the time the survey was conducted but would be 600 to 700 ETB three to four months later such that farmers only sold a minimal amount of their maize while prices were low to sell the most at the time of price peaks.
III‐4.6.2 Arethemarginalizedpoorincludedininnovativebusinessmodels?
In both regions people sell the majority of their products to local people (66%). In Amhara, the marginalized poor do not market their produce via cooperatives while in SNNP some few respondents sell coffee to the local cooperative (2% of the respondents).
About 35% of the people selling on the market in Amhara sell to middlemen or traders who come to the market while in SNNP people seem to be better connected to larger value chains. There, the respective number is 64%. In SNNP, the marginalized poor also sell more different products to
0
10
20
30
40
50
60
70
80
90
maize
livestock
teff
coffee
cassava
fruits
haricot bean
barley
yams
sorghum
other
potatoes
wheat
spices
dairy products
cabbage
number of people
selling the product
Amhara
SNNP
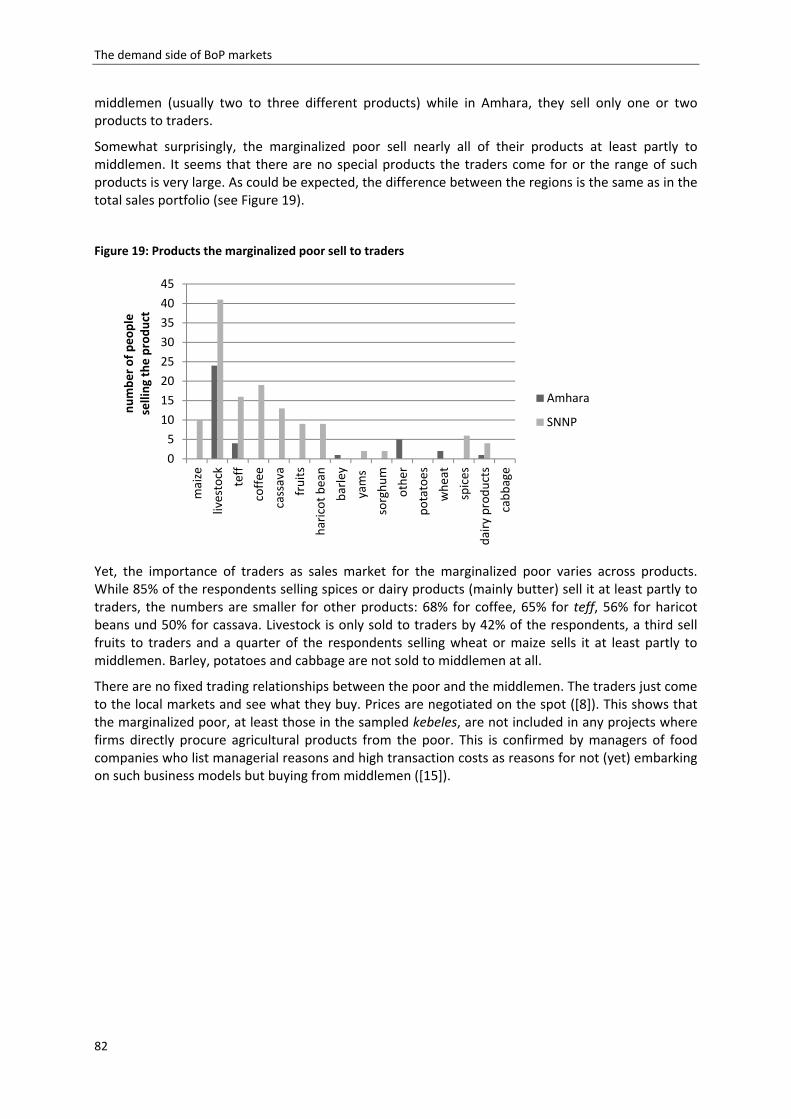
The demand side of BoP markets
82
middlemen (usually two to three different products) while in Amhara, they sell only one or two products to traders.
Somewhat surprisingly, the marginalized poor sell nearly all of their products at least partly to middlemen. It seems that there are no special products the traders come for or the range of such products is very large. As could be expected, the difference between the regions is the same as in the total sales portfolio (see Figure 19).
Figure 19: Products the marginalized poor sell to traders
Yet, the importance of traders as sales market for the marginalized poor varies across products. While 85% of the respondents selling spices or dairy products (mainly butter) sell it at least partly to traders, the numbers are smaller for other products: 68% for coffee, 65% for teff, 56% for haricot beans und 50% for cassava. Livestock is only sold to traders by 42% of the respondents, a third sell fruits to traders and a quarter of the respondents selling wheat or maize sells it at least partly to middlemen. Barley, potatoes and cabbage are not sold to middlemen at all.
There are no fixed trading relationships between the poor and the middlemen. The traders just come to the local markets and see what they buy. Prices are negotiated on the spot ([8]). This shows that the marginalized poor, at least those in the sampled kebeles, are not included in any projects where firms directly procure agricultural products from the poor. This is confirmed by managers of food companies who list managerial reasons and high transaction costs as reasons for not (yet) embarking on such business models but buying from middlemen ([15]).
0
5
10
15
20
25
30
35
40
45
maize
livestock
teff
coffee
cassava
fruits
haricot bean
barley
yams
sorghum
other
potatoes
wheat
spices
dairy products
cabbage
number of people
selling the product
Amhara
SNNP
The demand side of BoP markets
83
One exception to this lack of inclusion in inclusive business models are some farmers in Ofa who multiply seed on behalf of the South Seed Enterprise (SSE), the public seed enterprise for SNNP. These farmers get a 15% margin over the grain price at harvest for the seed they produce. Due to negative experiences with farmers not selling the produced seed back to SSE but capitalizing on high black market prices, farmers now get the improved seed for multiplication and inputs against a down payment of usually 25%, if needed on the basis of credit. Additionally, farmers get training and packaging materials free of charge. Furthermore, farmers are allowed to keep 10% of the produced seed for themselves. This business model can be considered as a form of inclusive business as it explicitly targets poor smallholders with the aim of capacity building and stabilizing seed supply. These efforts, however, still suffer from several challenges including inadequate training for farmers, limited incentives for farmers to sell the seed back due to very low grain prices at the time of harvest and low returns for the SSE from these schemes (Alemu, 2011). However, no such seed multiplying farmer was in the sample.
III‐5 Conclusion: lessons learnt about theneedsof themarginalizedpoorandpotentialuntappedmarkets
While still a lot needs to be learnt about the marginalized poor, especially about their hidden needs and their willingness to pay for several products, the presented results already reveal some interesting insights about their consumption behavior and possible entry points for companies. As
Example 1: Enterprise EthioPEA
EthioPEA is a public‐private partnership between PepsiCo, Inc., the PepsiCo Foundation, the WFP and USAID. The initiative was set up in 2011 to increase chickpea production and promote long‐term nutritional and economic security in Ethiopia (www.pepsico.com). Specifically, the project intends to target about 10,000 chickpea growing farmers who are supposed to increase their productivity with the help of modern agricultural practices and irrigation techniques. PepsiCo aims at creating new domestic and export markets for Ethiopian chickpeas while improving the overall quality of the soil farmed and increasing smallholder’s incomes. WFP wants to develop a locally sourced, nutrient‐rich supplementary food with the produced chickpeas to combat malnutrition. The food product to be produced in Ethiopia will be similar to “AchaMum”, a ready to use supplementary food for children, which was developed in Pakistan during the 2011 flood emergency. In Ethiopia, WFP’s initial target is to reach nearly 40,000 Ethiopian children between 6‐23 months of age. As a long‐term goal, the partners involved in the project aim to expand the program to prevent malnutrition across the Horn of Africa (http://www.wfp.org/stories/wfp‐pepsico‐and‐usaid‐fight‐child‐malnutrition‐ethiopia). However, no recent information about implementation was available as at 13.2.2014, neither on the WFP nor on the USAID website.
Example 2: Asela Malt’s program of sourcing barley malt from smallholder farmers
Another example of a company pursuing the idea of targeting poor farmers as producers is Asela Malt. This state‐owned company is one of the very few companies engaged in malt production in Ethiopia, which it sells mainly to the large breweries. Due to a substantial lack of barley malt in Ethiopia, the company launched an initiative to inform farmers about the prices they would pay for different qualities of barley malt via radio. This price information was broadcasted several times a day in two different languages at the time of harvest. Asela Malt offered the farmers to pick up the barley in the farmers’ communities and cover half of the transportation costs if they supply a minimum of 50 quintals (Qt; 1Qt = 100kg). With this initiative, Asela Malt could nearly double its malt production from 220,000Qt to 400,000Qt in the first year, produced by 43,000 farmers ([15]). Still, malt supply, including the development and distribution of improved barley seed, remains a concern. However, as the example shows, even relatively easy and low cost initiatives can lead to increased supply for companies and higher incomes for farmers as they omit middlemen and directly get the prices the processing company pays.
The demand side of BoP markets
84
yet, the marginalized poor are hardly directly targeted by companies as producers or consumers. However, there seem to be promising consumer markets that are not confined to the marginalized poor but can be extended to other people as well since needs of other rural poor are likely to be similar. Some of these possible entry points are discussed in the following.
The most‐bought products like salt and soap are classical examples of products marketed to BoP consumers in other countries and estimated market sizes for Ethiopia are quite large. The big market for kerosene, for instance, shows that there may be demand for fuel and other sources of light. As kerosene is perceived to be relatively expensive (about 20 ETB per liter) cheaper alternatives are likely to be welcomed by the consumers if properly marketed.
As the data shows, there is a clear need for improved housing. This may also be a promising entry point for companies as there is hardly any competition on the market as yet. If anything, iron sheets are available in the local market towns. There is only one type of mattresses available and hardly anything else to make living a bit more comfortable.
Another important field is the market for productive assets: hardly any agricultural tools are sold on the market. Plows made by local blacksmiths are the only devices available. Anecdotal evidence suggests that if cleverly marketed, demand for small agricultural machinery can be created: two managers of John Deere (called GEDEB Engineering Plc. in Ethiopia) stated that they were quite successful in marketing small tractors to farmers in the wheat belt around Asela where they developed models how a group of farmers can afford a tractor together and share it for their work ([6]). Similar projects could be developed in marginality hotspot areas to ease farmers’ burden with plowing. As the frequent occurrence of responses stating the need for oxen or horses for plowing suggests, there is at least a need for plowing tools, which would render demand generation possible.
The lack of improved seed that is also lamented by the marginalized poor hints at a huge untapped market that offers ample opportunities for the private sector. According to various sources, demand for improved seed is high, not only among the marginalized poor (MoA, 2013; Spielman et al., 2011). Part IV will focus on this sector.
Health care is another field of concern stated by the marginalized poor. Despite considerable efforts of the government to improve health care, there is still a substantial gap between supply and demand. Projects in a row of other countries in Sub‐Sahara Africa show that innovative business approaches can improve health outcomes of the rural poor.27
Concerning the marginalized poor as producers, there are also some interesting findings. As the results show, the poor produce a great variety of agricultural products. Even though marginality hotspots are often located in areas with soils that are not very suitable for agriculture, certain crops grow well in these areas.28 Thus, there are possibilities for food companies to include the marginalized poor directly in their value chains. However, considerable investments may be needed as training of farmers takes time and missing storage facilities and other infrastructure constitute considerable challenges as the example of farmer‐based seed production shows. Nevertheless, as many agricultural inputs such as wheat or barley malt need to be imported at the moment due to a 27 A case in point is Riders for Health, a social business that mobilizes health workers (usually by providing them a motor bike) who then visit rural communities to provide services like health education, disease surveillance, immunizations, maternal and child health services as well as HIV counseling (http://www.riders.org). Other examples are Jaipur Foot, a social enterprise providing cheap or even gratis prosthesis for the poor that enable them to walk and work again (http://www.jaipurfoot.org); or Aravind Eye Care, a company providing different kind of health services centered on better sight to poor people (http://www.aravind.org). A similar business exists in Ethiopia: Signum Vitae offers eye cataract operations as well as glasses and contact lenses to poor people at cheap prices, for the poorest even for free. Signum Vitae is a profitable business and tries to expand its operations but focuses on urban dwellers as they are much easier to reach ([15]). 28 One example for this is cassava, which is high performing in Ofa (SNNP) according to the local woreda administration ([8]).

The demand side of BoP markets
85
lack of supply in the country, investments in value chains within the country could be a cheaper alternative in the mid‐ and long term.
The demand side of BoP markets
86
IV. The supply side ofBoPmarkets and prospects for the privatesectortoreducepovertyinruralEthiopia29
IV‐1 Institutionsandtransactioncosts–definingtheconcepts
As Part II and III illustrated, economic performance in Ethiopia is not sufficient to provide all people with sufficient exchange entitlements that would enable them to satisfy their needs (cf. Sen, 1981). The majority of the Ethiopians must still be classified as poor and vulnerable (Bromley and Anderson 2012).
Considering these facts, the question arises why Ethiopia is so poor and what can be done about it. This question, i.e. why some countries are poor while others are rich, is one of the very fundamental questions economists try to answer (see e.g. Acemoglu et al., 2005; Acemoglu and Robinson, 2012; North, 1989, 1990; Spolaore and Wacziarg, 2013). For a long time, answers to this question were mainly given by neoclassical economists who explained long‐run growth with a country’s saving rate and other parameters of standard growth models (see e.g. Romer, 1986; Mankiw et al., 1992).
But some decades ago, a new field of economic research started to include institutions as fundamental cause of long‐run growth. Authors of this strand of science termed New Institutional Economics (NIE) see institutions and the resulting costs of transactions (see Box 10 for definitions) as the determining factors for the economic performance of a country (Coase, 1960; Commons, 1931; North, 1993). Institutional economists do not reject but distance themselves from neoclassical economics. They extend economic thinking by skipping some of the very fundamental assumption of neoclassical thinking such as perfect rationality of agents, full information and costless transactions and add institutions to the analysis. Some make their point very clear: “[n]eoclassical theory is simply an inappropriate tool to analyze and prescribe policies that will induce development. It is concerned with the operation of markets, not with how markets develop. How can one prescribe policies when one doesn't understand how economies develop?” (North, 1994, p. 359)
Box 9: Definitions of institutions
Institutions “tell what individuals must or must not do (compulsion or duty), what they may do without interference from other individuals (permission or liberty), what they can do with the aid of the collective power (capacity or right), and what they cannot expect the collective power to do on their behalf (incapacity or exposure).” (Commons, 1995, p. 6; emphasis in the original)
“Institutions are the rules whereby going concerns – families, clans, villages, firms, nation‐states – regularize and channel individual action and interaction. Institutions define and specify opportunity sets, or fields of action, for the members of a going concern. Put somewhat differently, institutions are the means whereby the collective control of individual action is given effect.” (Bromley, 2006, p. 32)
“Institutions are the rules of the game in a society, or more formally, are the humanly devised constraints that shape human interaction. In consequence they structure incentives in human exchange, whether political, social, or economic.” (North, 1990, p. 3)
“Economic institutions determine the incentives of and the constraints on economic actors, and shape economic outcomes. As such, they are social decisions, chosen for their consequences.” (Acemoglu et al., 2005, p. 386)
“’Institutions can be defined as the sets of working rules that are used to determine who is eligible to make decisions in some arena, what actions are allowed or constrained, what aggregation rules will be used, what
29 A shorter version of this chapter has been published as: Husmann, C. 2015. Transaction costs on the Ethiopian formal seed market and innovations for encouraging private sector investments. Quarterly Journal of International Agriculture Vol. 54, No. 1, pp. 59‐76.
The demand side of BoP markets
87
procedures must be followed, what information must or must not be provided, and what payoffs will be assigned to individuals depending on their actions.” (Ostrom, 1990, p. 51)
There are various definitions of the term ‘institution’ (see Box 9). For the present research, the classical definition coined by Douglas North who defines institutions as the “humanly devised constraints that shape human interaction” (North, 1990, p. 3; see Box 9) is adopted. As institutions “structure incentives in human exchange” (ibid.) they are critical for the economic performance of a country. More precisely, institutions determine the costs of transactions and “[i]t is […] the costs of transacting that are the key obstacles that prevent economies and societies from realizing well‐being” (North, 1989, p. 1320).
Transaction costs arise because individuals need time and resources to secure information, they have limited ability to process data and make plans, and they are boundedly rational in their behavior. Contracts need to be negotiated and enforced. Thus, running the economic system is costly (Arrow, 1969). To minimize these costs, people impose constraints on human interaction in order to structure exchange (North, 1993) and introduce certain ways of economic organization as an effort to align transactions (Williamson, 1991, p. 79).
Box 10: Definitions of transaction costs
“The economic counterpart of frictions is transaction cost.” (Williamson, 1985, p. 2)
“Transaction costs must be defined to be all the costs which do not exist in a Robinson Crusoe economy.” (Cheung, 1998, p. 515)
“Transaction costs are costs of running the economic system.” (Arrow, 1969, p. 1)
Transaction costs are the cost of “using the price mechanism” (Coase, 1937, p. 390) or “the cost of carrying out a transaction by means of an exchange on the open market.” (Coase, 1937, p. 395)
Transaction costs are the “costs of coordinating resources through market arrangements.” (Demsetz, 1995, p. 4)
Certain institutional arrangements facilitate governance of transactions better than others. But there is no blueprint for institutional settings ensuring a certain economic performance (Bromley, 2006). Since informal institutions such as social norms and beliefs have a considerable influence on people’s behavior and decisions, the effect of a particular setting of formal institutions is context specific. Furthermore, economic institutions are collective choices that are the outcome of a political process. As a result, they depend on the nature of political institutions and the distribution of political power in a society (Acemoglu and Robinson, 2007; Bromley, 2006).
IV‐2 Transactioncostsintheagriculturalsectorofpoorcountries–whatdoweknowsofar?
Transaction cost economics has been applied to study many different problems of economic organization. Extensive reviews by Shelanski and Klein (1995) and Rindfleisch and Heide (1997) find this “lens” of analysis (Rindfleisch and Heide, 1997, p. 1; Williamson, 2004) mainly applied to analyze problems of vertical integration, complex contracting and horizontal inter‐organizational relationships. Wang (2003) does include studies on agriculture in his review but limits them to those addressing industrialized countries. Masten (2001) stresses the importance of transaction cost economics for the analysis of agricultural markets and policy as well as vice versa the potential the analysis of agricultural markets has to refine transaction cost theory (see also Kherallah and Kirsten, 2002). Yet, also Masten (2001) and Richman and Macher (2006) restrict their surveys of empirical
The demand side of BoP markets
88
literature looking at transaction costs in agriculture to markets in industrialized countries for which especially the latter provides quite an extensive literature survey.
Transaction costs are often mentioned to be high on agricultural markets in poor countries (see e.g. Pingali et al., 2005; Makhura, 2001). Yet, studies analyzing the nature or size of transaction costs in detail are limited in number. For those studies analyzing transaction costs on agricultural markets the most recurrent theme is the influence of these costs on marketing decisions, market participation and income of smallholder farmers (see Table 15 in the Appendix).
The studies analyzing transaction costs on agricultural markets in poor countries have different objectives and, as a result, have different dependent variables. They also use a diverse set of methods to analyze these costs and their implications, such as regression analyses, partial equilibrium models or case studies. Furthermore, the studies include different numbers and types of transaction costs variables. Some studies focus on only certain types of transaction costs, e.g. Gabre‐Madhin (2001) looking only at the cost of searching for trading partners, while others try to include all kinds of transaction costs using a great number of variables (up to 20 variables in the case of de Bruyn et al., 2001). As a result, the studies and their results are difficult to compare. Yet, there are some recurrent insights that are shortly summarized here:
One important finding is that transaction costs are closely related to distance and that distance from markets negatively influences market participation and thus incomes (Alene et al., 2008; de Bruyn et al., 2001; Holloway et al., 2000; Kyeyamwa et al., 2008; Maltsoglou and Tanyeri‐Abur, 2005; Ouma et al., 2010; Rujis et al., 2004; Somda et al., 2005; Staal et al., 1997; Stifel et al., 2003). More specifically, Staal et al. (1997) find that transaction costs raise more than proportionally to transportation costs due to factors like increasing costs of information and risk of spoilage of agricultural products.
Other important insights refer to transaction costs in the form of costs of information and search and their impact on smallholders’ marketing decisions (Gabre‐Madhin, 2001; Staal et al., 1997; de Bruyn et al., 2001; De Silva and Ratnadiwakara, 2008; Kyeyamwa et al., 2008; Key et al., 2000; Maltsoglou and Tanyeri‐Abur, 2005). The main findings are twofold. The first important insight is that costs for search and information are high, amounting to about 20% of total marketing costs (Gabre‐Madhin, 2001) or 70% of the transaction costs, which amount to 15% of the overall production costs incurred by smallholder farmers (De Silva and Ratnadiwakara, 2008). The second important insight is that the influence of these costs on marketing decisions are difficult to capture: while Gabre‐Madhin (2001) finds that grain traders in Ethiopia are constrained by search and information costs, especially opportunity costs for search labor, Gong et al. (2006) find that information costs do not have an influence on marketing decisions of smallholder cattle farmers in China. Yet, as de Bruyn et al. (2001) stress, it is difficult to separate the effects of different costs on marketing decisions due to the high interaction between variables.
Another finding of several studies is the positive effect of organizations of collective action, such as cooperatives, in reducing transaction costs. These benefits accrue to both producers and buyers as cooperatives reduce the cost of information for both sides and take advantage of economies of scales in collection and transport (Holloway et al., 2000; Staal et al., 1997). Other findings are summarized in Table 15 in the Appendix.
As these studies show, transaction costs are important for smallholder farmers, their marketing decisions and income generation from agricultural produce. Yet, less is known about transaction costs arising for traders or firms when buying from smallholder farmers (Staal et al., 1997; Gabre‐Madhin, 1999; see also Table 15 in the Appendix). Even less is known about transaction costs arising on the side of the private sector when companies try to market to poor smallholders, which is not necessarily surprising given the relative novelty of business approaches recognizing the poor as untapped market segment. Recent studies starting to analyze constraints for companies entering agricultural markets in poor countries remain vague but indicate that “(a) laws, policies or regulations that constrain business operations; (b) government capacity to respond quickly; and (c)
The demand side of BoP markets
89
access to capital” are the main hurdles named by the private sector to realize investments in African agriculture (New Alliance for Food Security & Nutrition, 2013, p. 6). Against this background, the following section tries to start filling this knowledge gap by analyzing in detail the institutional setting and the resulting transaction costs that arise when selling agricultural inputs to poor farmers in Ethiopia.
AgricultureandtheprivatesectorinEthiopia:ashortintroductionoftheIV‐2.1historicalandinstitutionalbackground
As has been mentioned, transaction costs are a result of the institutional setting on a certain market in a certain country. For this reason, it is important to comprehend the institutional framework that governs agricultural input markets in Ethiopia in order to understand transaction costs arising for companies selling to smallholder farmers in Ethiopia.
A look at the country’s history is helpful to understand the situation of the private sector in the field of agriculture in Ethiopia. During the socialist Derg regime (1974‐1991), agricultural production was organized around peasant cooperatives, state‐owned farms and collectives. Extension services were instruments of political control over the peasants and input and credit provision was mainly focused on ameliorating the inefficiencies of state‐farms and peasant collectives (Wubneh, 2007, cited from Spielman et al., 2011; see also Rashid et al., 2007). As a result, the private sector was weak or non‐existent in the agricultural sector.
However, since the end of the Derg in 1991, the GoE has abandoned economic planning, adopted a market‐oriented economic system and introduced various policies and interventions to increase agricultural production (see e.g. Gebreselassie, 2006; Admassie and Abebaw, 2011). But still, the Ethiopian state has an ambivalent attitude towards the private sector and economic liberalization. After decades of socialist dictatorship the private sector is still weak. Directed state control is always evident although the Government of Ethiopia (GoE) is slowly opening up the economy and attracting investments at least in certain sectors (Alemu, 2011). Yet, Ethiopia ranks on position 146 of the Economic Freedom Index (it was on rank 134 in 2012; Heritage Foundation 2012) and on rank 127 in the World Bank’s “Ease of Doing Business” Index 2013, two ranks worse than in 2012 and 23 ranks worse than in 2011 (The World Bank and IFC, 2013, 2012, 2011).
One crucial institution that has not changed since the 1970s and that heavily affects private sector activities in Ethiopia is the lack of private property of land. Exclusive state‐ownership of land has remained unchanged since 1975 and is also not likely to be changed in the near future (Deininger and Jin, 2006). The land leasing contracts of up to 99 years issued by the government provide some security to investors but involve lengthy assignment procedures and other bureaucratic hurdles. Moreover, this lack of private property on land also affects the farmers who often do not have formal leasing contracts and thus lack incentives to invest in land (Deininger and Jin, 2006).
However, agricultural investments are now in the focus of Ethiopian politics. While after the end of the Derg regime a decade followed with very few investments in the agricultural sector (see Figure 20), higher amounts of money started to flow into agriculture after 2002. Broken down on the per capita growth of agricultural investments, the data show that numbers increased from virtually nothing to nearly $50 per capita in 2011 (see also Figure 20), which is still not much in consideration of the low agricultural capital stock in Ethiopia compared to other Sub‐Sahara African countries (FAO, 2012c). Since 1992, investments mainly went into large farms to grow cereals and other crops, 12% were dedicated to horticulture. Relatively recently, considerable investments go to flower farms that have been set up in various clusters in the country. The trade value of Ethiopian flowers rose from approximately $2 million in 2004 to $170 million in 2012 (UNdata, 2014).
Of all agricultural investments, 42% came from foreign investors, the remaining part in equal shares from public and private parties (Ethiopian Investment Authority, 2012). In 2011, the agricultural sector received about 7% of the total capital expenditure of the GoE (MoFED, 2012).
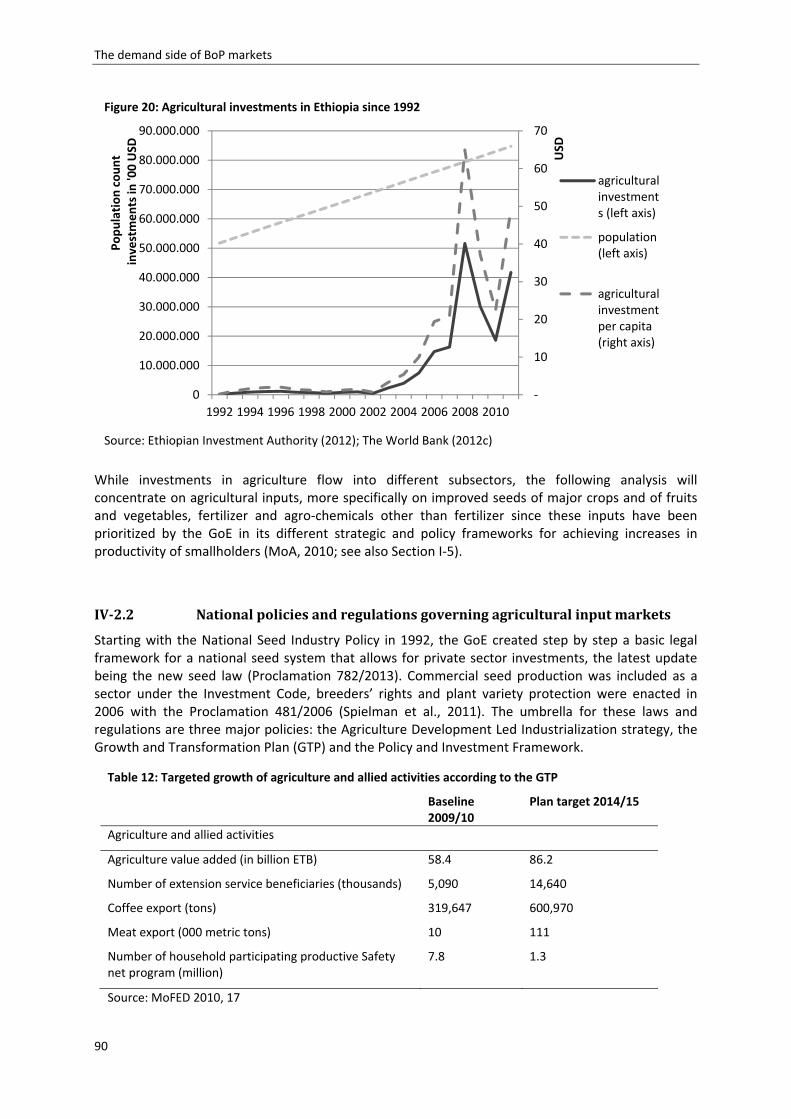
The demand side of BoP markets
90
While investments in agriculture flow into different subsectors, the following analysis will concentrate on agricultural inputs, more specifically on improved seeds of major crops and of fruits and vegetables, fertilizer and agro‐chemicals other than fertilizer since these inputs have been prioritized by the GoE in its different strategic and policy frameworks for achieving increases in productivity of smallholders (MoA, 2010; see also Section I‐5).
NationalpoliciesandregulationsgoverningagriculturalinputmarketsIV‐2.2
Starting with the National Seed Industry Policy in 1992, the GoE created step by step a basic legal framework for a national seed system that allows for private sector investments, the latest update being the new seed law (Proclamation 782/2013). Commercial seed production was included as a sector under the Investment Code, breeders’ rights and plant variety protection were enacted in 2006 with the Proclamation 481/2006 (Spielman et al., 2011). The umbrella for these laws and regulations are three major policies: the Agriculture Development Led Industrialization strategy, the Growth and Transformation Plan (GTP) and the Policy and Investment Framework.
Figure 20: Agricultural investments in Ethiopia since 1992
Source: Ethiopian Investment Authority (2012); The World Bank (2012c)
‐
10
20
30
40
50
60
70
0
10.000.000
20.000.000
30.000.000
40.000.000
50.000.000
60.000.000
70.000.000
80.000.000
90.000.000
1992 1994 1996 1998 2000 2002 2004 2006 2008 2010
USD
Population count
investments in
'00 USD
agriculturalinvestments (left axis)
population(left axis)
agriculturalinvestmentper capita(right axis)
Table 12: Targeted growth of agriculture and allied activities according to the GTP
Baseline 2009/10
Plan target 2014/15
Agriculture and allied activities
Agriculture value added (in billion ETB) 58.4 86.2
Number of extension service beneficiaries (thousands) 5,090 14,640
Coffee export (tons) 319,647 600,970
Meat export (000 metric tons) 10 111
Number of household participating productive Safety net program (million)
7.8 1.3
Source: MoFED 2010, 17
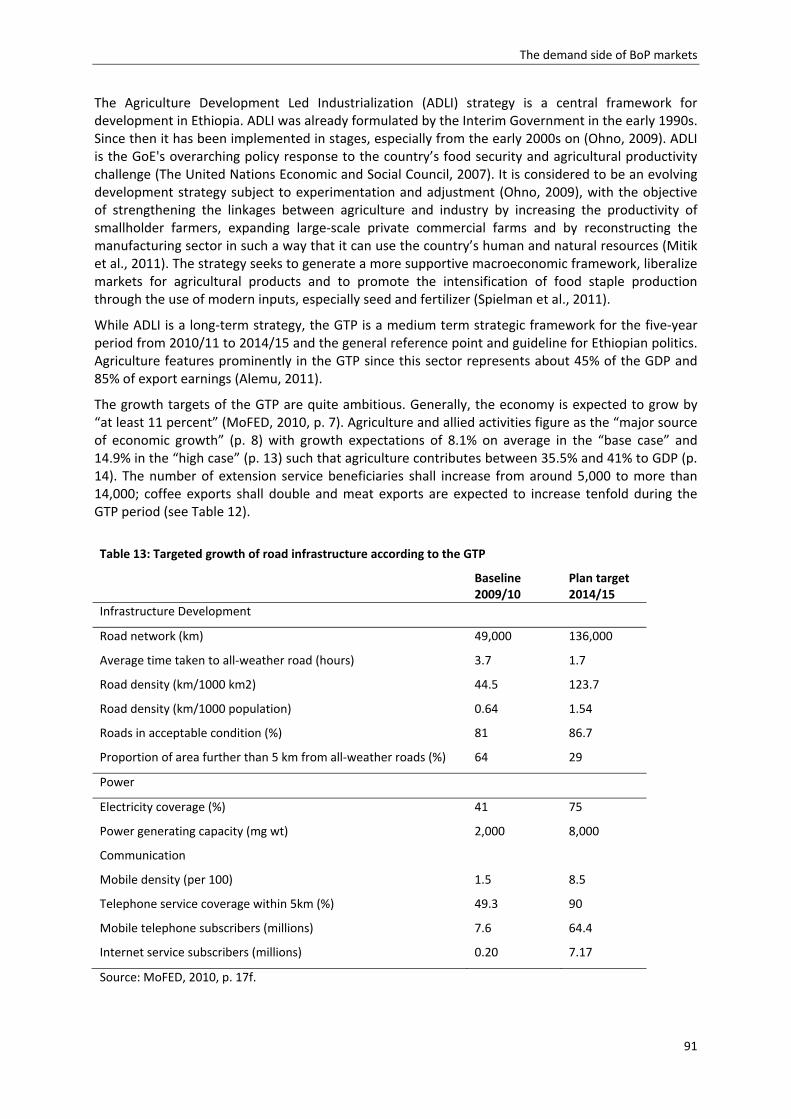
The demand side of BoP markets
91
The Agriculture Development Led Industrialization (ADLI) strategy is a central framework for development in Ethiopia. ADLI was already formulated by the Interim Government in the early 1990s. Since then it has been implemented in stages, especially from the early 2000s on (Ohno, 2009). ADLI is the GoE's overarching policy response to the country’s food security and agricultural productivity challenge (The United Nations Economic and Social Council, 2007). It is considered to be an evolving development strategy subject to experimentation and adjustment (Ohno, 2009), with the objective of strengthening the linkages between agriculture and industry by increasing the productivity of smallholder farmers, expanding large‐scale private commercial farms and by reconstructing the manufacturing sector in such a way that it can use the country’s human and natural resources (Mitik et al., 2011). The strategy seeks to generate a more supportive macroeconomic framework, liberalize markets for agricultural products and to promote the intensification of food staple production through the use of modern inputs, especially seed and fertilizer (Spielman et al., 2011).
While ADLI is a long‐term strategy, the GTP is a medium term strategic framework for the five‐year period from 2010/11 to 2014/15 and the general reference point and guideline for Ethiopian politics. Agriculture features prominently in the GTP since this sector represents about 45% of the GDP and 85% of export earnings (Alemu, 2011).
The growth targets of the GTP are quite ambitious. Generally, the economy is expected to grow by “at least 11 percent” (MoFED, 2010, p. 7). Agriculture and allied activities figure as the “major source of economic growth” (p. 8) with growth expectations of 8.1% on average in the “base case” and 14.9% in the “high case” (p. 13) such that agriculture contributes between 35.5% and 41% to GDP (p. 14). The number of extension service beneficiaries shall increase from around 5,000 to more than 14,000; coffee exports shall double and meat exports are expected to increase tenfold during the GTP period (see Table 12).
Table 13: Targeted growth of road infrastructure according to the GTP
Baseline 2009/10
Plan target 2014/15
Infrastructure Development
Road network (km) 49,000 136,000
Average time taken to all‐weather road (hours) 3.7 1.7
Road density (km/1000 km2) 44.5 123.7
Road density (km/1000 population) 0.64 1.54
Roads in acceptable condition (%) 81 86.7
Proportion of area further than 5 km from all‐weather roads (%) 64 29
Power
Electricity coverage (%) 41 75
Power generating capacity (mg wt) 2,000 8,000
Communication
Mobile density (per 100) 1.5 8.5
Telephone service coverage within 5km (%) 49.3 90
Mobile telephone subscribers (millions) 7.6 64.4
Internet service subscribers (millions) 0.20 7.17
Source: MoFED, 2010, p. 17f.
The demand side of BoP markets
92
The GTP does not say much about the role that the private sector can play to achieve the stated goals. The only reference to the private sector in the section about agriculture states that “the private sector is encouraged to increase its share of investment in agriculture” (p. 19). Private sector investment is mostly thought of as large‐scale farming mainly in horticulture as well as production of other export products and raw materials for industries (p. 26). How the provision of improved agricultural inputs will be achieved is not clearly stated: “the necessary activities will be implemented to enhance the role of breeders and seed suppliers in the country” (p. 25) is all that is said concerning seed, the issue of fertilizer provision does not appear at all in the GTP.
However, much attention is paid to create the enabling infrastructure that would facilitate private sector engagement. Road infrastructure is planned to increase threefold in terms of road density, the proportion of areas further than five kilometres away from an all‐weather road shall be reduced by half to around 30% (see Table 13), which should substantially decrease transportation costs – a reason named by some firms for not investing in marginalized areas (see section IV‐3.10).
The Policy and Investment Framework (PIF) provides a strategic framework for the prioritization and planning of investments in Ethiopia’s agricultural sector. The PIF is a 10‐year road map for agricultural and rural development that identifies priority areas for investment and estimates the financing needs to be provided by the GoE and its development partners. It is set up to operationalize the Comprehensive Africa Agriculture Development Programme (CAADP) Compact signed by the GoE and its development partners in September 2009.30 Key areas to promote rural development and agricultural growth are identified as input systems, especially the seed system, soil fertility, cooperatives, technology access and adoption, extension and research as well as output markets for key commodities (MoA, 2010; see also Berhanu, 2013).
The PIF identifies improved seed and fertilizer as “lead technologies” for rural development (p. 8). Seed multiplication and the distribution of improved genetics are seen as critical for improving productivity. However, analyzing the drawbacks and stakeholders in the current system, the PIF refers to the private sector somewhat derogatively as “Pioneer Hybrid and other small seed enterprises” (MoA, 2010).
The PIF recognizes the mandate for seed production, pricing and distribution among public and private enterprises, seed importation, and the role of the GoE in regulating the seed industry as key policy issues. It even mentions the need for a fair competitive framework between the Ethiopian Seed Enterprise (ESE), the regional public seed enterprises and private seed enterprises. Furthermore, it is acknowledged that institutional arrangements in the seed system need to be better integrated and coordinated with clear lines of responsibility covering plant breeding and basic seed supply and seed multiplication, distribution and marketing, quality control and certification as well as pricing.
However, while “simple and affordable agronomic packages including the use of improved seeds, fertilizers and fertility management, weed and pest control, and improved harvest and post‐harvest management” (p. 17) are named as instruments to enable smallholders to increase their productivity, there is no information about how the desired private sector participation in the supply of agricultural inputs, particularly the production and distribution of high quality seed will be induced. Similarly, the need for a network of agro‐dealers and the critical role of the private sector in establishing such a network is acknowledged but again, policies or instruments enabling the creation of an agro‐dealer network are not mentioned (MoA, 2010).
30 The CAADP Compact is an initiative of the African Union’s New Partnership for Africa’s Development (NEPAD) Planning and Coordinating Agency (NPCA) founded on a vision and strategic framework to eradicate hunger and poverty and place the continent on a path for sustainable socio‐economic growth (http://www.nepad‐caadp.net/).
The demand side of BoP markets
93
Institutional support to achieve the targeted growth and systemic changes comes from a new organization, the Agricultural Transformation Agency (ATA). It was established in December 2010 and is set up as a high‐level organization that shall respond to a core set of needs identified by the MoA and its governing Transformation Council, which is chaired by the Prime Minister (Agricultural Transformation Agency, 2012). The ATA is modeled after similar public‐sector bodies in Asia that played important roles in the growth of these economies. The organization shall help to achieve the targeted agricultural growth by identifying solutions to systemic bottlenecks in both key system areas and value chains of priority cropping systems. These include, amongst other areas, the seed sector, soil health and fertility management as well as the value chains of teff, maize, wheat and pulses. Strengthening the private sector is an explicit target of the ATA ([11]).
Another important institutional change in the context of the GTP is the new seed law that was accepted by the GoE in January 2013. In preparation of the new seed law, the ATA had facilitated consultations with private seed enterprises, breeders and other stakeholders. Seed company managers had a chance to express their desire for the new seed law to strengthen the private sector, to improve the protection of intellectual property rights on seed and to introduce a clear‐cut seed policy that clarifies procedures, regulations, rights and obligations for seed producers ([1], [2]).
Similarly to the previous law, the new proclamation (Seed Proclamation No. 782/2013) regulates the processes of seed registration, quality control, import and export of seed etc. The new law does not deviate much from the previous proclamation (Seed Proclamation No. 206/2000) but contains some novelties:
One such novelty is that the new law talks about providing seed to the “market” (p. 6808) while the word market did not appear in the previous proclamation. Another new feature is that farmers’ rights are explicitly protected by ensuring that the proclamation is not applicable for any farm‐saved seed used or exchanged between smallholder farmers and agro‐pastoralists (Proclamation 782/2013, 3.2.a) and b)). However, this provision restricts exceptions from the seed proclamation to farm‐saved seeds while the previous law did not apply to any seeds produced by farmers (Seed Proclamation No. 206/2000, 3.2). Furthermore, the new law contains a section on “Integrated Production Planning” (Proclamation 782/2013, 7.1.‐3.) that foresees an integrated planning process for seed production and a seed production database that contains, among other things, an annual seed production plan. Lastly, the new proclamation foresees that all seed testing laboratories in the country should follow internationally recognized testing procedures and need to be accredited (Proclamation 782/2013, 11.1.‐2.), which was not required under the previous seed law.
ImplicationsfortheprivatesectorIV‐2.3
The creation of the ATA is seen positively by most public and private seed enterprises and other stakeholders in the sector ([1], [2], [8]). However, what the new organization can finally achieve concerning improvements in the selected value chains and targeted input systems remains to be evaluated in the future. Especially positive for the private sector is that the ATA offers a forum where all stakeholders, including the private seed companies, can get together to bring in their concerns and needs.
Also the improvement of road and other infrastructure is beneficial for the private sector since it lowers transportation and other transaction costs. The expansion of mobile phone coverage and internet services opens up new possibilities for businesses to unlock the market poor farmers possibly constitute as it paves the way for ICT‐based services and eases communication with potential customers. Experience from other poor countries indicates that mobile phone services can facilitate agricultural technology adoption among farmers, improving the income of farmers (Baumüller, 2012) and breaking new possibilities to the private sector. Yet, Ethiopia is starting from very low levels with a mobile phone subscription rate of 9 subscribers per 100 inhabitants in 2009/10 (MoFED, 2010), which is a low number compared to an average of about 70 in developing countries
The demand side of BoP markets
94
for the same point in time (World Telecommunication/ICT Indicators Database, 2012). If Ethiopia achieves to meet the goal set in the GTP, it would just draw level with the developing country average in 2009/10.
Summarizing one can say that commercialization of agriculture is a firm component of the overarching development strategy in Ethiopia. Yet, the GTP does not explicitly strengthen the private sector but rather envisages only a limited range of investments for businesses, focusing on large‐scale farming and production of export products and raw materials for industries. Positive developments are under way in form of improvements of the enabling infrastructure, however, starting from low levels.
The finance problem in Ethiopia
Against these mostly positive developments stands the issue of finance that has recently undergone changes that are not necessarily positive for both the private sector and the farmers. Access to credit is crucial for smallholders as well as for companies. But both face severe difficulties when applying for credit. Indeed, access to finance is the single most frequently mentioned issue named when managers are asked what makes their business difficult (Alemayehu, 2012; [1], [2], [4]).
The finance sector in Ethiopia is largely dominated by public banks. There are three public banks in the country: the Commercial Bank of Ethiopia (CBE) the Construction and Business Bank and the Development Bank of Ethiopia (MoFED, 2011). Ethiopian firms access capital mostly through the CBE (CBE, 2012). Dashen Bank, the largest private bank in Ethiopia and often cited as an exemplarily well managed bank (see e.g. African Business, 2011) has only one fifth of the size of the CBE in terms of loans in 2011. Outstanding loans of all private banks together just equal the outstanding loans of the CBE (CBE, 2012; Access Capital, 2012).
The dominance of the public banks is further strengthened by a new directive of the National Bank of Ethiopia (No. MFA/NBEBILLS/001/2011 of March 2011). According to this new directive all banks except the CBE and the Development Bank of Ethiopia (both public banks) are obliged to buy bills of the National Bank of Ethiopia (NBE), so called ‘NBE bills’, for 27% of all disbursements the bank gives. NBE bills are long‐term obligations of the NBE with a maturity period of five years. In other words, for every new extension of loans and advances including overdraft facilities, private banks have to buy NBE bills for 27% of the value of the disbursements. While the private banks have to buy the bills on a monthly basis, the NBE pays the interest of 3% per annum – with an actual inflation rate of around 18% in 2011 (International Monetary Fund, 2012) – on an annual basis (NBE, 2011). Although stakeholders of private banks were not willing to comment on the new regulation, other experts in the field see a new reluctance of private banks to disburse loans as a result of the new directive ([11]; Alemayehu, 2012).
However, after being hesitant to give credit to firms investing in agribusiness for a long time, the CBE has substantially improved its human resource base to evaluate risks in this sector, which led to a new, more favorable policy of credit disbursement to agriculture in the bank ([10]). This is also reflected in the data: agriculture is the third largest recipient of loans and the ratio of non‐performing loans is one of the lowest among all sectors in the Ethiopian economy (see Figure 21).
Given the difficulties to get credit from Ethiopian banks, it is even more surprising that managers do not demand credit from non‐national sources of finance. The African Development Bank or the IFC, i.e. the private sector part of the World Bank, sit on “hundreds of millions of dollars awaiting many more companies to tap into” (Alemayehu, 2012). Private companies in the agricultural sector are an explicit target group of the IFC (ibid). Yet, a lack of knowledge about these sources of finance, complicated application procedures and the strict requirements regarding business plans discourage managers to take advantage of these sources of finance (Alemayehu, 2012).
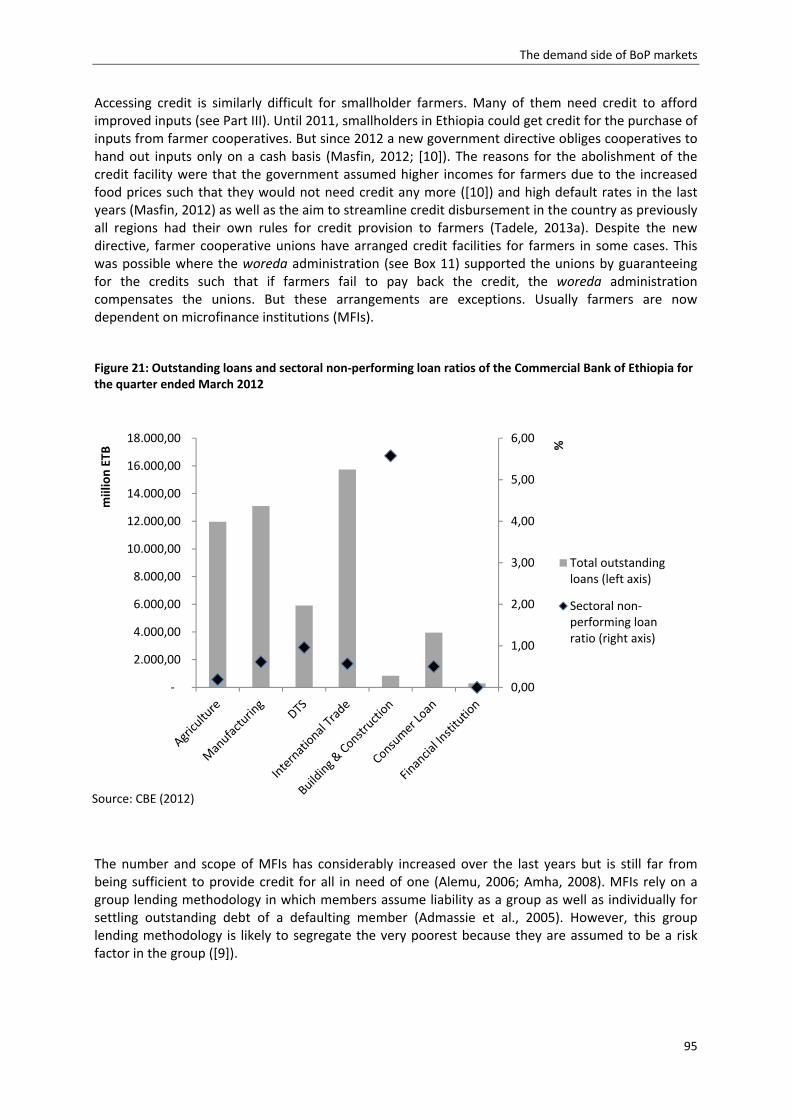
The demand side of BoP markets
95
Accessing credit is similarly difficult for smallholder farmers. Many of them need credit to afford improved inputs (see Part III). Until 2011, smallholders in Ethiopia could get credit for the purchase of inputs from farmer cooperatives. But since 2012 a new government directive obliges cooperatives to hand out inputs only on a cash basis (Masfin, 2012; [10]). The reasons for the abolishment of the credit facility were that the government assumed higher incomes for farmers due to the increased food prices such that they would not need credit any more ([10]) and high default rates in the last years (Masfin, 2012) as well as the aim to streamline credit disbursement in the country as previously all regions had their own rules for credit provision to farmers (Tadele, 2013a). Despite the new directive, farmer cooperative unions have arranged credit facilities for farmers in some cases. This was possible where the woreda administration (see Box 11) supported the unions by guaranteeing for the credits such that if farmers fail to pay back the credit, the woreda administration compensates the unions. But these arrangements are exceptions. Usually farmers are now dependent on microfinance institutions (MFIs).
Figure 21: Outstanding loans and sectoral non‐performing loan ratios of the Commercial Bank of Ethiopia for the quarter ended March 2012
The number and scope of MFIs has considerably increased over the last years but is still far from being sufficient to provide credit for all in need of one (Alemu, 2006; Amha, 2008). MFIs rely on a group lending methodology in which members assume liability as a group as well as individually for settling outstanding debt of a defaulting member (Admassie et al., 2005). However, this group lending methodology is likely to segregate the very poorest because they are assumed to be a risk factor in the group ([9]).
0,00
1,00
2,00
3,00
4,00
5,00
6,00
‐
2.000,00
4.000,00
6.000,00
8.000,00
10.000,00
12.000,00
14.000,00
16.000,00
18.000,00
%
miilion ETB
Total outstandingloans (left axis)
Sectoral non‐performing loanratio (right axis)
Source: CBE (2012)
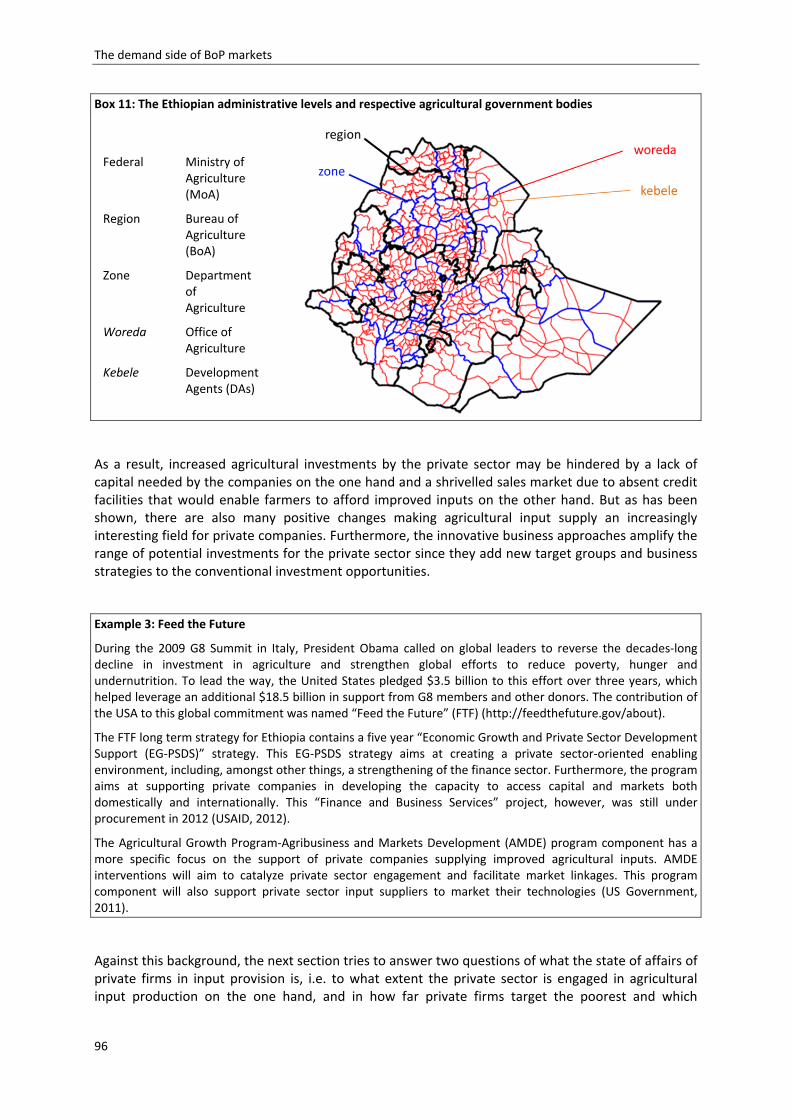
The demand side of BoP markets
96
Box 11: The Ethiopian administrative levels and respective agricultural government bodies
As a result, increased agricultural investments by the private sector may be hindered by a lack of capital needed by the companies on the one hand and a shrivelled sales market due to absent credit facilities that would enable farmers to afford improved inputs on the other hand. But as has been shown, there are also many positive changes making agricultural input supply an increasingly interesting field for private companies. Furthermore, the innovative business approaches amplify the range of potential investments for the private sector since they add new target groups and business strategies to the conventional investment opportunities.
Example 3: Feed the Future
During the 2009 G8 Summit in Italy, President Obama called on global leaders to reverse the decades‐long decline in investment in agriculture and strengthen global efforts to reduce poverty, hunger and undernutrition. To lead the way, the United States pledged $3.5 billion to this effort over three years, which helped leverage an additional $18.5 billion in support from G8 members and other donors. The contribution of the USA to this global commitment was named “Feed the Future” (FTF) (http://feedthefuture.gov/about).
The FTF long term strategy for Ethiopia contains a five year “Economic Growth and Private Sector Development Support (EG‐PSDS)” strategy. This EG‐PSDS strategy aims at creating a private sector‐oriented enabling environment, including, amongst other things, a strengthening of the finance sector. Furthermore, the program aims at supporting private companies in developing the capacity to access capital and markets both domestically and internationally. This “Finance and Business Services” project, however, was still under procurement in 2012 (USAID, 2012).
The Agricultural Growth Program‐Agribusiness and Markets Development (AMDE) program component has a more specific focus on the support of private companies supplying improved agricultural inputs. AMDE interventions will aim to catalyze private sector engagement and facilitate market linkages. This program component will also support private sector input suppliers to market their technologies (US Government, 2011).
Against this background, the next section tries to answer two questions of what the state of affairs of private firms in input provision is, i.e. to what extent the private sector is engaged in agricultural input production on the one hand, and in how far private firms target the poorest and which
Federal Ministry of Agriculture (MoA)
Region Bureau of Agriculture (BoA)
Zone Department of Agriculture
Woreda Office of Agriculture
Kebele Development Agents (DAs)
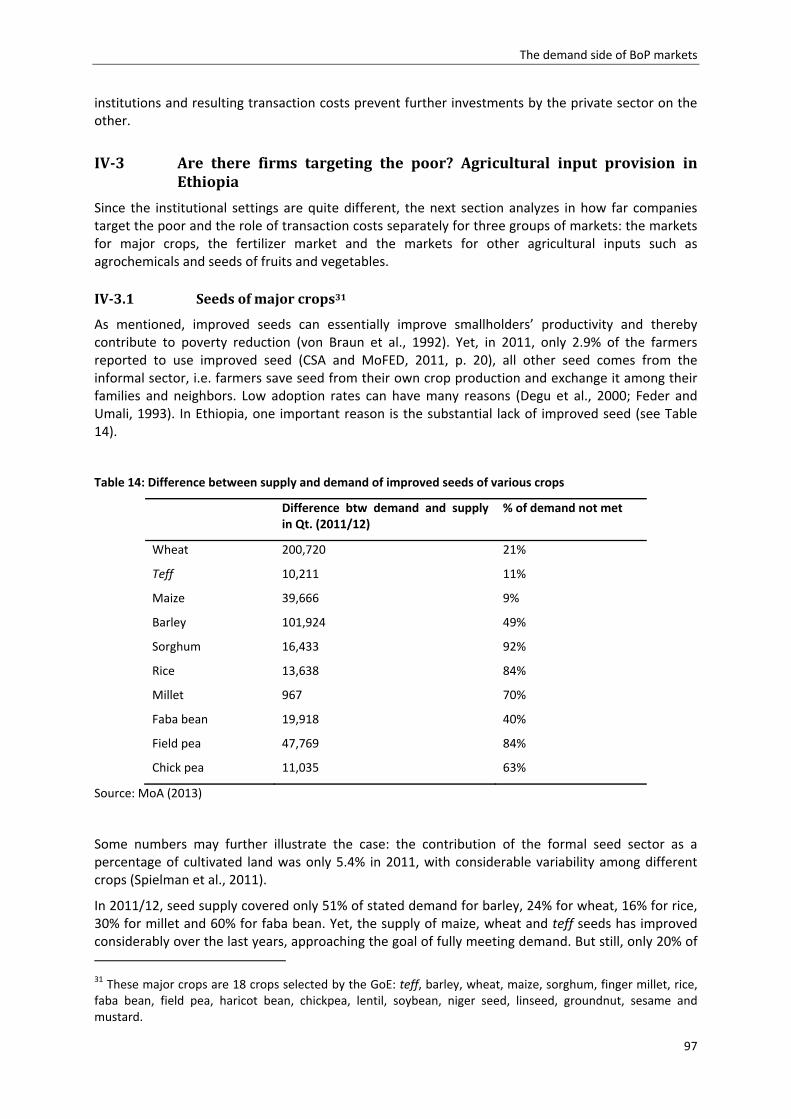
The demand side of BoP markets
97
institutions and resulting transaction costs prevent further investments by the private sector on the other.
IV‐3 Are there firms targeting the poor? Agricultural input provision inEthiopia
Since the institutional settings are quite different, the next section analyzes in how far companies target the poor and the role of transaction costs separately for three groups of markets: the markets for major crops, the fertilizer market and the markets for other agricultural inputs such as agrochemicals and seeds of fruits and vegetables.
Seedsofmajorcrops31IV‐3.1
As mentioned, improved seeds can essentially improve smallholders’ productivity and thereby contribute to poverty reduction (von Braun et al., 1992). Yet, in 2011, only 2.9% of the farmers reported to use improved seed (CSA and MoFED, 2011, p. 20), all other seed comes from the informal sector, i.e. farmers save seed from their own crop production and exchange it among their families and neighbors. Low adoption rates can have many reasons (Degu et al., 2000; Feder and Umali, 1993). In Ethiopia, one important reason is the substantial lack of improved seed (see Table 14).
Table 14: Difference between supply and demand of improved seeds of various crops
Difference btw demand and supply in Qt. (2011/12)
% of demand not met
Wheat 200,720 21%
Teff 10,211 11%
Maize 39,666 9%
Barley 101,924 49%
Sorghum 16,433 92%
Rice 13,638 84%
Millet 967 70%
Faba bean 19,918 40%
Field pea 47,769 84%
Chick pea 11,035 63%
Source: MoA (2013)
Some numbers may further illustrate the case: the contribution of the formal seed sector as a percentage of cultivated land was only 5.4% in 2011, with considerable variability among different crops (Spielman et al., 2011).
In 2011/12, seed supply covered only 51% of stated demand for barley, 24% for wheat, 16% for rice, 30% for millet and 60% for faba bean. Yet, the supply of maize, wheat and teff seeds has improved considerably over the last years, approaching the goal of fully meeting demand. But still, only 20% of 31 These major crops are 18 crops selected by the GoE: teff, barley, wheat, maize, sorghum, finger millet, rice, faba bean, field pea, haricot bean, chickpea, lentil, soybean, niger seed, linseed, groundnut, sesame and mustard.
The demand side of BoP markets
98
the area cultivated with maize, 4% of the wheat area and less than 1% of the teff area are cultivated using seed from the formal sector (CSA, 2012c).
When discussing the seed market it is helpful to differentiate between three groups of seed producers: public seed enterprises, private Ethiopian seed enterprises and international (private) seed enterprises. There are five public seed companies in Ethiopia: the Ethiopian Seed Enterprise (ESE), the Amhara Seed Enterprise (ASE), the Oromia Seed Enterprise (OSE), the South Seed Enterprise (SSE) and the Somali Seed Enterprise. The ESE was the only seed company in the country for several decades before some private seed companies entered the market. The regional public seed enterprises were established recently, starting with ASE and OSE in 2009. Their statutes foresee them to produce different kind of seeds for Ethiopian farmers. Profit making is not a primary goal (Amhara Regional State, 2008).
The number of private Ethiopian seed enterprises is not clear. In 2004, 26 firms were licensed to produce seed but only eight firms were active in seed production (Byerlee et al., 2007). Other sources mention 33 seed producing companies but without specifying who they are (see e.g. Atilaw and Korbu, 2012). In 2011, 16 private seed enterprises were listed in the business directory but it is not clear whether they were all operating at that time (see also Table 16 in the Appendix).
Two international seed enterprises are producing some of these selected major crops in Ethiopia (as at July 2012), Hi‐Bred Pioneer, which belongs to the US‐based company DuPont, and Seed Co. from Zimbabwe, the latter being only in the third year of seed production in Ethiopia at the time of data collection (early 2012). Both international seed companies focus on the production and sale of hybrid maize ([1]). Seed Co. also produces smaller quantities of wheat, teff and beans ([1]).
An important remark in this context is the definition of a private company here. In this study, a private seed company is understood as a firm with a business and a seed producing license, producing seed on its own account and bearing the full risk of the business. Thus, the cooperative unions or farmers employed as seed producers by public seed companies or other organizations such as NGOs do not fall into this category.
However, this does not imply that seed companies produce all their seed themselves. The SSE, e.g., has no land on its own but produces all its seed with the help of farmers who get inputs and training from SSE and commit themselves to sell all produced seed back to SSE with a 15% price top‐up over grain prices ([8]; see also Section III‐4.6). Furthermore, several of the private Ethiopian seed enterprises produce seed for Pioneer Hi‐Bred on their land (e.g. Hadiya Seed). Yet, in the analysis here, the actual ‘physical’ producer is not the subject of analysis but the companies that finally sell the seed and are responsible for its production, quality control and marketing.
Moreover, FAO and NGOs like Self‐help Africa support farmer based seed production with certified varieties but there is no data on the amount and the types of seed produced. According to experts, these projects are on a very small scale and do not have an effect on the larger system ([8]).
Whyistherenotmoreinvestmentinseedproduction?IV‐3.2
If the stated demand is much higher than seed production, the question arises what prevents private seed companies from increasing investments in seed production to tap this market? The answer to this question lies in the institutional setting governing seed production and distribution in Ethiopia.
As illustrated in Figure 22 the Ethiopian seed system is quite complex (see also Table 17 in the Appendix). The process of seed production starts with an assessment of seed demand, which is carried out by the Development Agents (DAs) on kebele level.32 Information on seed demand is then passed upwards the government administration ladder and collected by the Bureaus of Agriculture
32 For more information about this process and critique see e.g. Alemu (2010); Dalberg Global Development Advisors (2012); Spielman et al. (2011).
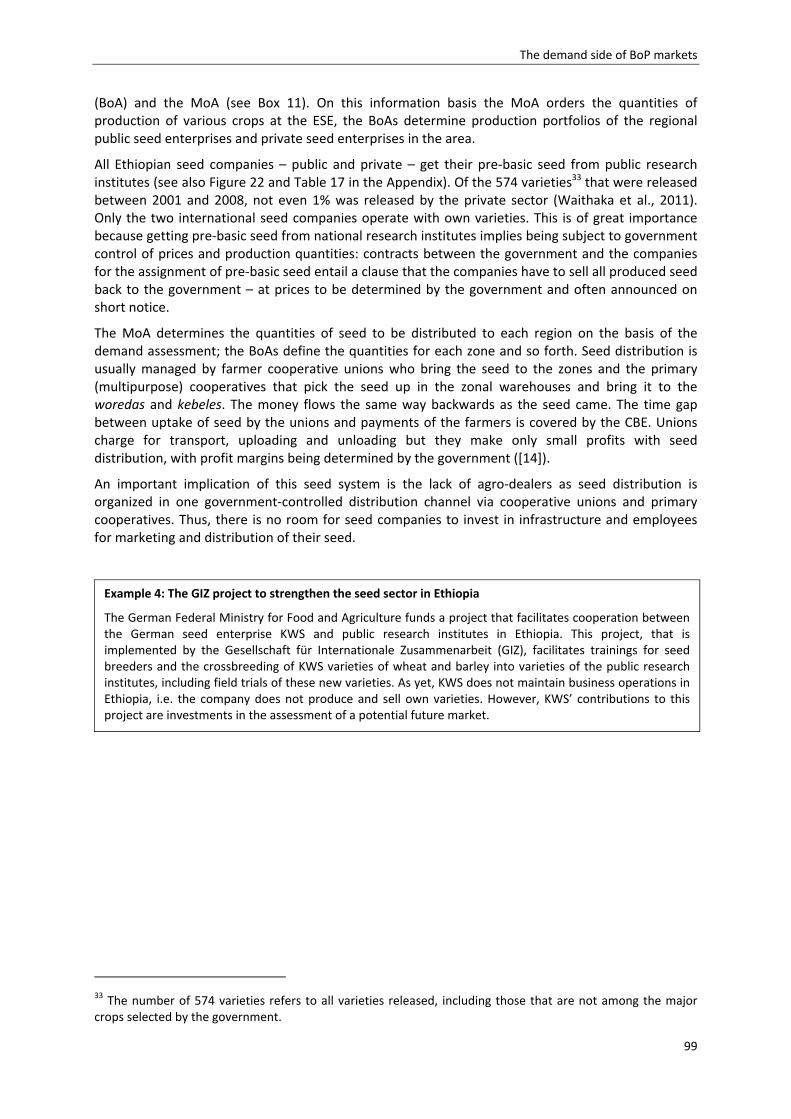
The demand side of BoP markets
99
(BoA) and the MoA (see Box 11). On this information basis the MoA orders the quantities of production of various crops at the ESE, the BoAs determine production portfolios of the regional public seed enterprises and private seed enterprises in the area.
All Ethiopian seed companies – public and private – get their pre‐basic seed from public research institutes (see also Figure 22 and Table 17 in the Appendix). Of the 574 varieties33 that were released between 2001 and 2008, not even 1% was released by the private sector (Waithaka et al., 2011). Only the two international seed companies operate with own varieties. This is of great importance because getting pre‐basic seed from national research institutes implies being subject to government control of prices and production quantities: contracts between the government and the companies for the assignment of pre‐basic seed entail a clause that the companies have to sell all produced seed back to the government – at prices to be determined by the government and often announced on short notice.
The MoA determines the quantities of seed to be distributed to each region on the basis of the demand assessment; the BoAs define the quantities for each zone and so forth. Seed distribution is usually managed by farmer cooperative unions who bring the seed to the zones and the primary (multipurpose) cooperatives that pick the seed up in the zonal warehouses and bring it to the woredas and kebeles. The money flows the same way backwards as the seed came. The time gap between uptake of seed by the unions and payments of the farmers is covered by the CBE. Unions charge for transport, uploading and unloading but they make only small profits with seed distribution, with profit margins being determined by the government ([14]).
An important implication of this seed system is the lack of agro‐dealers as seed distribution is organized in one government‐controlled distribution channel via cooperative unions and primary cooperatives. Thus, there is no room for seed companies to invest in infrastructure and employees for marketing and distribution of their seed.
33 The number of 574 varieties refers to all varieties released, including those that are not among the major crops selected by the government.
Example 4: The GIZ project to strengthen the seed sector in Ethiopia
The German Federal Ministry for Food and Agriculture funds a project that facilitates cooperation between the German seed enterprise KWS and public research institutes in Ethiopia. This project, that is implemented by the Gesellschaft für Internationale Zusammenarbeit (GIZ), facilitates trainings for seed breeders and the crossbreeding of KWS varieties of wheat and barley into varieties of the public research institutes, including field trials of these new varieties. As yet, KWS does not maintain business operations in Ethiopia, i.e. the company does not produce and sell own varieties. However, KWS’ contributions to this project are investments in the assessment of a potential future market.
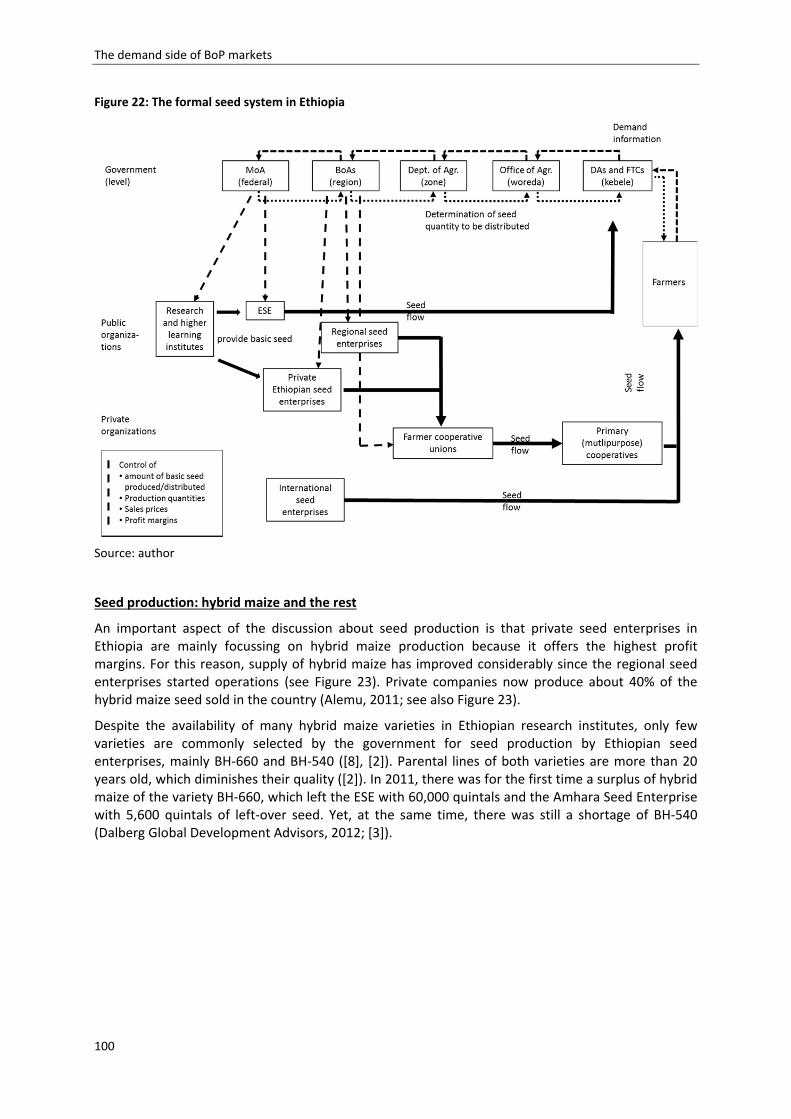
The demand side of BoP markets
100
Figure 22: The formal seed system in Ethiopia
Source: author
Seed production: hybrid maize and the rest
An important aspect of the discussion about seed production is that private seed enterprises in Ethiopia are mainly focussing on hybrid maize production because it offers the highest profit margins. For this reason, supply of hybrid maize has improved considerably since the regional seed enterprises started operations (see Figure 23). Private companies now produce about 40% of the hybrid maize seed sold in the country (Alemu, 2011; see also Figure 23).
Despite the availability of many hybrid maize varieties in Ethiopian research institutes, only few varieties are commonly selected by the government for seed production by Ethiopian seed enterprises, mainly BH‐660 and BH‐540 ([8], [2]). Parental lines of both varieties are more than 20 years old, which diminishes their quality ([2]). In 2011, there was for the first time a surplus of hybrid maize of the variety BH‐660, which left the ESE with 60,000 quintals and the Amhara Seed Enterprise with 5,600 quintals of left‐over seed. Yet, at the same time, there was still a shortage of BH‐540 (Dalberg Global Development Advisors, 2012; [3]).
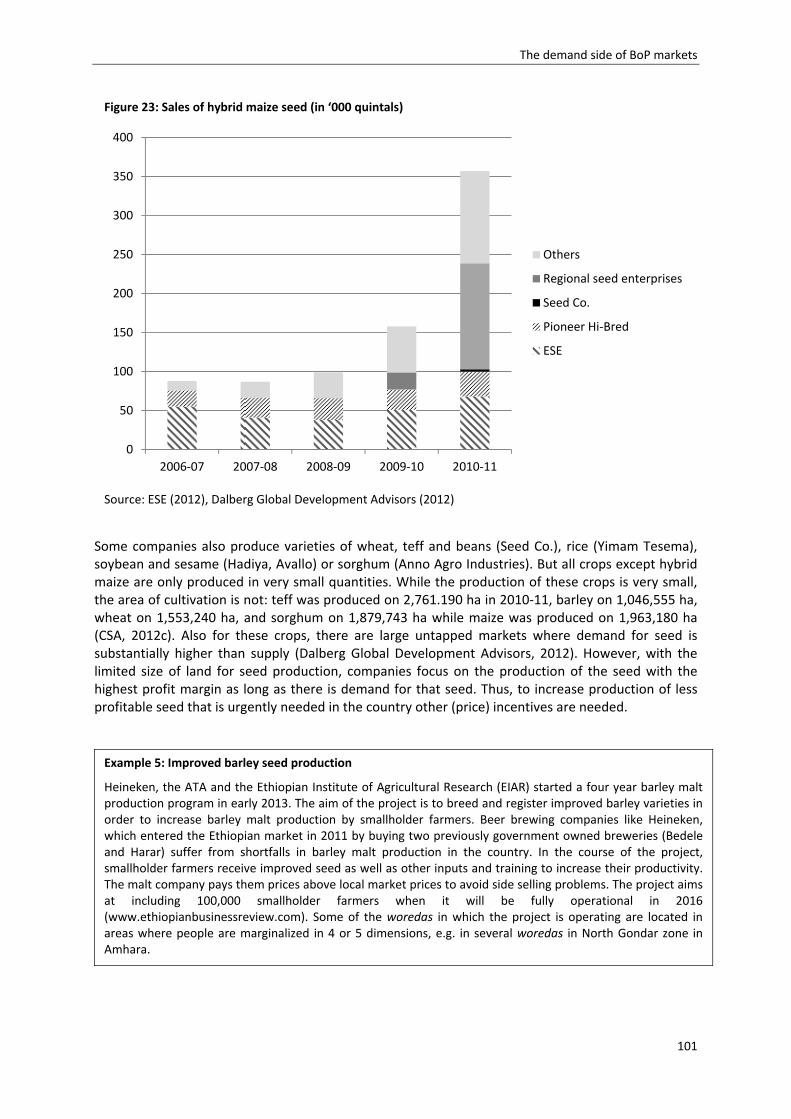
The demand side of BoP markets
101
Some companies also produce varieties of wheat, teff and beans (Seed Co.), rice (Yimam Tesema), soybean and sesame (Hadiya, Avallo) or sorghum (Anno Agro Industries). But all crops except hybrid maize are only produced in very small quantities. While the production of these crops is very small, the area of cultivation is not: teff was produced on 2,761.190 ha in 2010‐11, barley on 1,046,555 ha, wheat on 1,553,240 ha, and sorghum on 1,879,743 ha while maize was produced on 1,963,180 ha (CSA, 2012c). Also for these crops, there are large untapped markets where demand for seed is substantially higher than supply (Dalberg Global Development Advisors, 2012). However, with the limited size of land for seed production, companies focus on the production of the seed with the highest profit margin as long as there is demand for that seed. Thus, to increase production of less profitable seed that is urgently needed in the country other (price) incentives are needed.
Figure 23: Sales of hybrid maize seed (in ‘000 quintals)
Source: ESE (2012), Dalberg Global Development Advisors (2012)
0
50
100
150
200
250
300
350
400
2006‐07 2007‐08 2008‐09 2009‐10 2010‐11
Others
Regional seed enterprises
Seed Co.
Pioneer Hi‐Bred
ESE
Example 5: Improved barley seed production
Heineken, the ATA and the Ethiopian Institute of Agricultural Research (EIAR) started a four year barley malt production program in early 2013. The aim of the project is to breed and register improved barley varieties in order to increase barley malt production by smallholder farmers. Beer brewing companies like Heineken, which entered the Ethiopian market in 2011 by buying two previously government owned breweries (Bedele and Harar) suffer from shortfalls in barley malt production in the country. In the course of the project, smallholder farmers receive improved seed as well as other inputs and training to increase their productivity. The malt company pays them prices above local market prices to avoid side selling problems. The project aims at including 100,000 smallholder farmers when it will be fully operational in 2016 (www.ethiopianbusinessreview.com). Some of the woredas in which the project is operating are located in areas where people are marginalized in 4 or 5 dimensions, e.g. in several woredas in North Gondar zone in Amhara.
The demand side of BoP markets
102
ThedirectseedmarketingpilotsIV‐3.3
Increased pressure from private seed companies and interventions of the Local Seed Business project34 led to the first trials, in which Ethiopian seed companies could directly sell their seed to farmers. Starting in Amhara in 2011 and followed in Oromia and SNNP in 2012, Ethiopian seed companies were allowed for the first time to directly market their seed of hybrid maize.
In Amhara, the project was planned with four companies, each of which got one woreda assigned for direct seed sales. However, before the pilot started one company stepped out because the company could not reach an agreement with the government about the modalities of the project; ASE resigned during the project due to marketing difficulties (Astatike et al., 2012). Thus, the project was finalized with only two companies, ESE and Avallo International, in two woredas.
Initially seed marketing was planned to be carried out with the help of agro‐dealers. But due to the lack of experienced agro‐dealers in the project woredas the participating seed companies decided to execute seed marketing with their own staff ([2]; Astatike et al., 2012).
Preliminary results of the Amhara pilot suggest that seed availability and timely delivery was better in project woredas than in non‐project woredas (Astatike et al., 2012). The pilot also revealed that demand estimations for the pilot woredas were quite inaccurate. The project was not reiterated in Amhara in 2012 since the ASE was left with a lot of unsold seed that the government decided to sell preferentially in 2012 in the framework of the normal seed distribution system.
The methodology of assigning one woreda to each company was changed in the Oromia pilot in 2012 where different companies could sell in one woreda ([3], [8]). In Oromia, two districts were chosen where the participating companies could sell their seed directly to the farmers. All seed companies operating in Oromia were invited to participate in the pilot. Some did voluntarily and others were explicitly asked to participate for bringing in scarce varieties ([2], [8]). Finally, two public (ESE and OSE), five private seed companies and one seed‐producing cooperative union (Meki Batu) participated in the pilot ([8]).
While in Amhara and Oromia the direct seed marketing was restricted to hybrid maize, also other varieties such as wheat could be directly marketed in five woredas in SNNP in 2012. Yet, as there are only two public seed enterprises selling seed in this regional state, i.e. the ESE and SSE, the change there involved mainly the supply chain of seed and less the recognizability of the seed producer.
Preliminary results for the 2012 direct seed marketing pilot in Oromia shows that all companies were able to sell almost all their seed, except for the maize variety BH‐660, which did not perform the season before such that farmers developed some skepticism against this variety ([8]). In one woreda (Sibu Sire), seed sales exceeded the estimated demand by 15%, in the other woreda, sales approximately equalled estimated demand (ISSD, 2013).
Hybrid maize and wheat seed sales were equally successful in SNNP with only minimal left‐overs. Participating companies in both regions even felt that they could have sold more seed if they would have had better demand information and fewer difficulties with transportation and storage in the woredas.
Still, in both woredas in Oromia more improved seed was sold than in any other year before and more than was initially foreseen (ISSD, 2013). This may have various reasons. First, shops of agro‐dealers were open seven days a week and during the whole day while the cooperatives previously distributing the seed only opened for two afternoons a week due to the lack of full‐time employees.
34 The Local Seed Business project is a joint effort of various Ethiopian universities, the Oromia Agricultural Research Institute, Oromia Seed Enterprise and the Wageningen UR Centre for Development Innovation. It cooperates with several organizations within regional government (BoAs and RARIs), the GoE (EIAR and ESE) and various NGOs. The project is funded by the Dutch Ministry of Economic Affairs, Agriculture and Innovation and the Directorate General for International Cooperation through the Dutch embassy in Ethiopia (LSB, 2011).
The demand side of BoP markets
103
Thus, it was easier now for farmers to access seed. Secondly, seed was available on time before planting and until planting was finished. Thus, previously well‐known problems of late arrivals of seed were avoided. Third, agro‐dealers and seed company employees engaged in seed distribution are said to provide good technical advice to farmers. This, together with some marketing by the companies might have increased awareness and trust in the seed. Finally, some farmers reported that they also bought seed for their relatives living in neighboring woredas who saw the benefits of early seed arrival and technical advice by the agro‐dealers. Thus, a part of the increased seed distribution might be due to ‘leakage’ to other woredas.
In both trials prices were still fixed by the government and a mark‐up for transportation was not allowed, which discouraged some seed producers since they now had to come up for transportation costs themselves that are normally covered by government and the cooperatives ([2]).
Despite high investment costs for the companies due to the lack of agro‐dealers and seed stores, the direct seed marketing pilots were welcomed by the participating companies and others who want to participate in the future ([2]). They are optimistic about the effects the pilots have concerning future market liberalization and see them as a chance to establish a brand name and to convince farmers of the superior quality of their seed compared to other companies. On the other hand, companies complained about information coming on short notice and an inadequate set‐up of the project because prices were still fixed and companies could not charge for their transportation costs. Others complained that they already had made contracts with the government about the marketing of their seed before they got the invitation to participate in the project ([2]).
The direct seed marketing trials can be seen as an important step towards market liberalization. However, the stop of the pilot in Amhara due to the difficulties of the ASE shows how fragile such changes are. Improvements in the methodology and careful evaluations of the project will be needed to smooth the way towards market liberalization for companies as well as for farmers. Companies need to prove that they are willing and able to deal with more competition and adjust their firm strategy accordingly.
The main benefits of the pilots can be summarized as:
Traceability of the seed and thus increased accountability for seed quality, which increases farmers’ trust;
Saved time resources of DAs and Subject Matter Specialists who were occupied with seed distribution previously and can now concentrate on training and advisory services for farmers;
Farmers do not hold DAs responsible for seed failure since seed distribution is now managed by agro‐dealers, which considerably improves the relationship between DAs and farmers;
Companies are rewarded for better quality and have thus an incentive to improve on quality in the future;
There is less seed fraud and storage damage along the value chain that is now much shorter than the previous one managed by cooperative unions and primary cooperatives.
As a result of these positive effects, the direct seed marketing pilots will be scaled up in Oromia and SNNP, re‐initiated in Amhara and newly established in Tigray in 2013. The MoA generally supports this new marketing process and encourages the regional governments to get in contact with the regional public and (if existing) private seed companies to negotiate the conditions ([8]).
Despite the generally very positive experience with the recent direct seed marketing pilots, some difficulties remain. An especially crucial point is the governance problem in form of the regulation determining who must cover costs for transportation and agro‐dealers. In 2012, sales prices were determined by the government and companies were not allowed to add up transportation costs and agro‐dealer commissions despite considerable expenses for long ways of transport, which drove their profit margins towards zero or even below that. Under these conditions, some companies indicated
The demand side of BoP markets
104
not to participate next year and produce seed for Pioneer Hi‐Bred instead, which secures reasonable profit margins (Hadiya Seed). Yet, from the side of the government, promises are made that sales prices would be more flexible in the next season, leaving room for transportation costs and commissions (88]). Whether this step of liberalization will be realized remains to be seen.
Other challenges are the lack of storage facilities in the woredas and a lack of trained agro‐dealers. The lack of improved seed of certain varieties, such as BH‐540 and the varieties sold by Pioneer Hi‐Bred, are not tackled with the direct seed marketing pilots since these shortages root deeper in the system – in the insufficient provision of basic seed due to the monopolized basic seed production and the shortage of land and credit for seed producers.
InstitutionspreventingtheprivatesectorfromincreasingseedproductionIV‐3.4andtargetingthemarginalizedpoor
The direct seed marketing pilots still represent exceptional cases. Under the normal institutional framework, seed companies are embedded in the strictly regulated system presented in section IV‐3.1. Various institutions in the current seed system prevent private seed companies from increasing seed production and eventually targeting the poor.
Important constraints for the private Ethiopian seed enterprises result out of the fact that none of them does own breeding though some managers expressed the intent to import new parental lines for own breeding to escape the strict government interference. However, breeding is a difficult business, which requires additional land and high‐skilled and experienced plant breeders as well as technical facilities. Accordingly, seed producers need to get more land assigned by the government to start own breeding, which takes a long time and is insecure. Additionally, it is difficult to hire experienced plant breeders in Ethiopia because currently plant breeders are government employees enjoying secure jobs and other privileges. Thus, it is difficult to attract them to private companies. This problem is aggravated by the fact that areas dedicated to plant breeding will be in remote areas because breeding requires isolated land plots. These circumstances oblige companies to pay high salaries to plant breeders since skilled people often do not want to live in remote areas ([2]). Moreover, the installation of the necessary technical facilities requires additional working capital, which is difficult to get (see also Section IV‐3.2).
Another possibility to avoid dependence on the government‐dominated seed system is to produce varieties bred by other companies in other countries. This way was pioneered by Alemayehu Mekonnen who introduced seed developed by Seed Co. to Ethiopia. Although the process of registering the seed in Ethiopia was lengthy and tiresome, this business plan seems to be very successful.
Other experts indicate that some Ethiopian seed companies are in contact with the International Center for Maize and Wheat Improvement (CIMMYT) for multiplying and selling their varieties in Ethiopia ([8]). Yet, at the time of data collection, these initiatives were still in an early stage.
On the other hand, several agricultural experts assume that some seed enterprises are quite content with the present form of the contracts because they do not need to care about marketing as long as the government commits itself to buy all produced seed ([11]).
The international seed companies are allowed to directly sell their seed to the customers. Still, Pioneer Hi‐Bred markets more than 90% of its seed via cooperatives to save on marketing costs; Seed Co. prefers to sell directly to the farmers via local farmers associations ([1]).
Another institution disadvantaging private Ethiopian seed companies is related to the distribution of seed. Farmers can select the varieties they want to purchase but they are usually not given the choice to opt for one particular source. It even often happens that the farmer cooperative unions or the primary cooperatives mix seed or refill it into other bags to make transportation easier, which confuses farmers about the quality of seed of different producers ([2]). Two problems arise as a
The demand side of BoP markets
105
result: first, this disables companies to establish a brand name, and second it blocks complaints by farmers about seed quality because the producer of the seed is not clearly identifiable.
Price determination is another issue posing major difficulties for the private Ethiopian seed companies. Compared to other Sub‐Sahara African countries the seed prices determined by the government are relatively low in Ethiopia. At first glance, this seems to be beneficial for the farmers but has also considerable disadvantages concerning users’ efficiency (Alemu, 2010, p. 24) and can lead to a crowding out of the private sector ([2]). The prices of major crop seeds are negotiated by the BoAs, the board and the management of the public seed enterprises. These prices are then binding maximum prices for the seed of all Ethiopian seed enterprises. Prices are based on estimations about farmers’ willingness to pay for seed but there is no systematic assessment about farmers’ willingness or ability to pay (Alemu, 2010). Prices vary considerably across regions and from year to year. In 2011, e.g., hybrid maize BH‐540 was sold at 2,000 ETB per quintal in Oromia while in Amhara the price was 1,500 ETB per quintal ([2], [3]). In the 2010‐11 cropping season Pioneer Hi‐Bred sold its hybrid maize at 2,784 ETB per quintal and sold all its stock ([1]), which is an indication that at least some Ethiopian farmers are willing to pay higher prices for high quality seed.
What is the nature of transaction costs arising in the Ethiopian seedIV‐3.5system?
Although it is not possible to quantify transaction costs resulting out of the presented institutions in the seed system since neither the companies nor the government keep detailed records of their costs, the nature of the transaction costs involved and the distribution of these costs can be identified (see also Box 12).
Costs for market entry have not been high in the past. Until now it was not difficult for private companies to start a seed business. Business owners need (1) an investment license, (2) a competence license and (3) a business license if they produce the seed on their own land. If the company does not operate on its own land but hires farmers to produce the seed it does not need the business license. Requirements to get the licenses are clear and the application procedure usually takes only a few weeks ([2]).
Licenses issued at the federal level must be refreshed every 3 years; licenses from regional level must be renewed every year. Both requires personal presence at the government office but does not take much time ([2]). However, private sector stakeholders fear that procedures become more tiresome and lengthy as the government may want to suppress additional competition for the regional public seed enterprises ([2]).
Transaction costs for international seed enterprises are especially high for market entry ([1]). Bureaucratic procedures are unclear and lengthy. New varieties that are brought to the country need to get registered in a procedure usually taking three to four years ([1]; Dalberg Global Development Advisors, 2012).
Example 6: The Advanced Maize Seed Adoption Program
A recent initiative, which is a result of the G8 New Alliance for Food Security and Nutrition, is the Advanced Maize Seed Adoption Program. This project, which is a public‐private partnership between DuPont Pioneer, the MoA, the ATA and USAID, aims at promoting the use of hybrid maize seed and other improved inputs by smallholder farmers. It includes the provision of sample seed to demonstration plots and field training sessions. Even more important for the seed system is that not only local seed and grain warehousing facilities are to be built but also a network of farmer dealers is to be set up in order to increase the availability of seed. In the forefront of this project, DuPont also opened a new seed processing plant and a large capacity storage warehouse at Menagasha near Addis Ababa to meet the increasing demand for its seed (USAID, 2013).
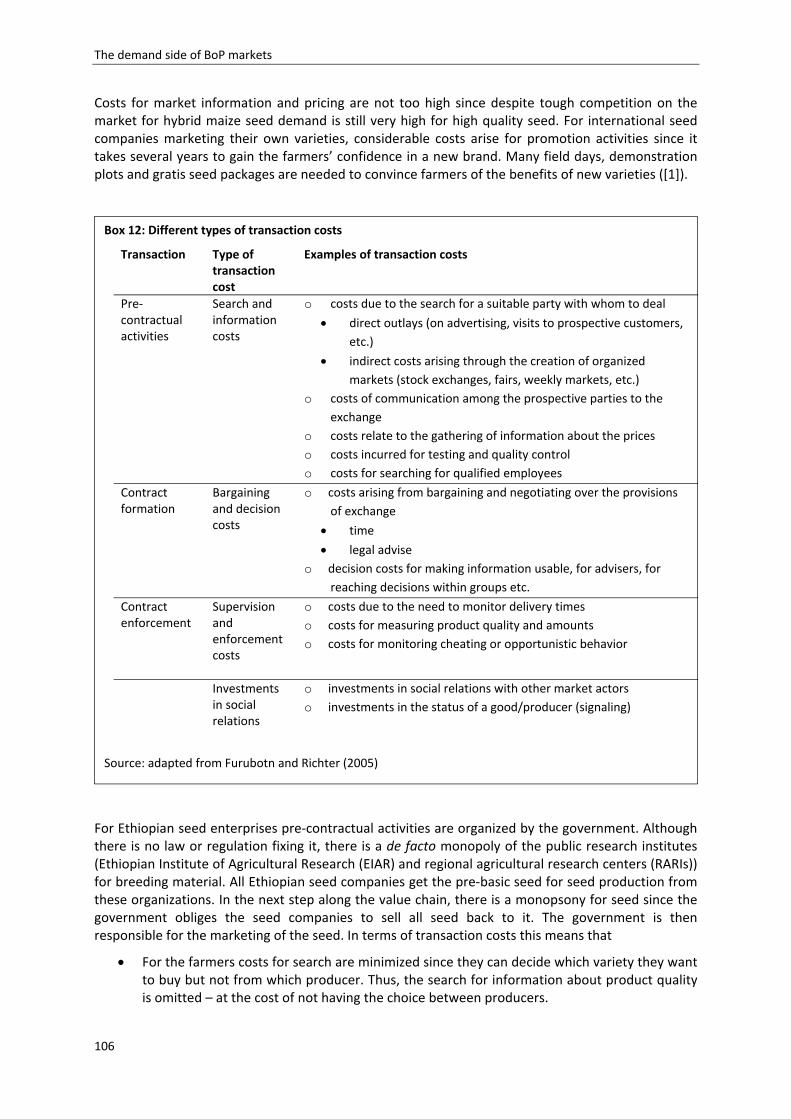
The demand side of BoP markets
106
Costs for market information and pricing are not too high since despite tough competition on the market for hybrid maize seed demand is still very high for high quality seed. For international seed companies marketing their own varieties, considerable costs arise for promotion activities since it takes several years to gain the farmers’ confidence in a new brand. Many field days, demonstration plots and gratis seed packages are needed to convince farmers of the benefits of new varieties ([1]).
For Ethiopian seed enterprises pre‐contractual activities are organized by the government. Although there is no law or regulation fixing it, there is a de facto monopoly of the public research institutes (Ethiopian Institute of Agricultural Research (EIAR) and regional agricultural research centers (RARIs)) for breeding material. All Ethiopian seed companies get the pre‐basic seed for seed production from these organizations. In the next step along the value chain, there is a monopsony for seed since the government obliges the seed companies to sell all seed back to it. The government is then responsible for the marketing of the seed. In terms of transaction costs this means that
For the farmers costs for search are minimized since they can decide which variety they want to buy but not from which producer. Thus, the search for information about product quality is omitted – at the cost of not having the choice between producers.
Box 12: Different types of transaction costs
Transaction Type of transaction cost
Examples of transaction costs
Pre‐contractual activities
Search and information costs
o costs due to the search for a suitable party with whom to deal
direct outlays (on advertising, visits to prospective customers,
etc.)
indirect costs arising through the creation of organized
markets (stock exchanges, fairs, weekly markets, etc.)
o costs of communication among the prospective parties to the
exchange
o costs relate to the gathering of information about the prices
o costs incurred for testing and quality control
o costs for searching for qualified employees
Contract formation
Bargaining and decision costs
o costs arising from bargaining and negotiating over the provisions
of exchange
time
legal advise
o decision costs for making information usable, for advisers, for
reaching decisions within groups etc.
Contract enforcement
Supervision and enforcement costs
o costs due to the need to monitor delivery times
o costs for measuring product quality and amounts
o costs for monitoring cheating or opportunistic behavior
Investments in social relations
o investments in social relations with other market actors
o investments in the status of a good/producer (signaling)
Source: adapted from Furubotn and Richter (2005)
The demand side of BoP markets
107
For the companies costs for search for customers and costs for information about the market do not arise because their product portfolio is largely determined by the government and they have to sell the produced seed to the government. This is changing substantially with the direct seed marketing pilots where companies are responsible for the demand assessment themselves.
Advertisement costs do not arise for Ethiopian seed companies since marketing is done by the government with the help of farmers’ cooperatives and farmers cannot chose the source of their seed.
For the government pre‐contractual transaction costs are considerable. Government employees spend much time to collect data about seed demand and to distribute seed. The typical time the head of extension in a woreda spends on collecting seed demand per season is one month, i.e. two months a year for both cropping seasons, and 45 days on distributing seed to the farmers ([8]). In the regional BoA five full‐time employees are charged with organizing seed supply and distribution ([8]). Additionally, employees in the zonal departments of agriculture and in the MoA are involved but it is not clear how many people dedicate their working time to seed distribution there.
Contract formation (bargaining) is similarly simplified for companies since the prices of major crop seed are negotiated by the BoA, the board and the management of the public seed enterprises. Since government regulations avoid direct contact and contracts between seed companies and farmers, there is no room for negotiations between customers and companies about prices or other parts of the contract. Ethiopian seed companies do not have any costs for the development or internal discussions of pricing strategies ([2]).
The post‐contractual transaction activities of contract execution, control, and enforcement are also minimized for seed companies by the actual government regulation. The theory of self‐enforcing agreements (Furubotn and Richter 2005, 339 f.) ceases to be valid since the seller of the seed is not the producer and complaints are usually not transferred back to the producer. The final consumer, i.e. the farmer cannot retaliate by stopping to purchase the product if the product turns out to be of bad quality because first he cannot identify the producer and second, because he cannot choose between different producers such that the only alternative would be not to buy improved seed at all.
As a result of the high transaction costs of providing credit to farmers ([8], [10]), there is now simultaneous exchange on the farm level, i.e. farmers have to pay the seed when the primary cooperatives deliver it.
Thus, in the current situation transaction costs are mainly born by the government. Governmental agencies assess demand, determine sales prices and organize distribution of seed, public banks finance the time elapse between seed delivery of the seed enterprises and payments of the farmers. Promotional activities are done by the DAs, if at all. Cooperatives have to carry the burden of transporting seed, which keeps them away from other tasks such as trainings for farmers or output marketing on which they should actually focus ([11]). The current distribution network is also the reason for the lack of agro‐dealers in the country, which is detrimental for the international seed companies and for Ethiopian seed companies participating in the direct marketing trials.
Considering the seed system as analyzed in this section, it can be doubted that the relation between the sum of transaction costs and outcomes in terms of efficiency35 of seed production and distribution is optimal in this system. Despite the high investments of time and other resources, inaccuracies in the demand assessments regularly lead to deficient outcomes that distort optimal seed production and distribution. High costs of capital and other burdens imposed by the government concerning variety registration prevent Ethiopian seed companies from investing in own
35 It is difficult to evaluate efficiency without a counterfactual. Yet, the analysis of the whole system from the demand assessment process until seed distribution suggests that there is a general agreement by all different stakeholders that the current system needs to be improved.
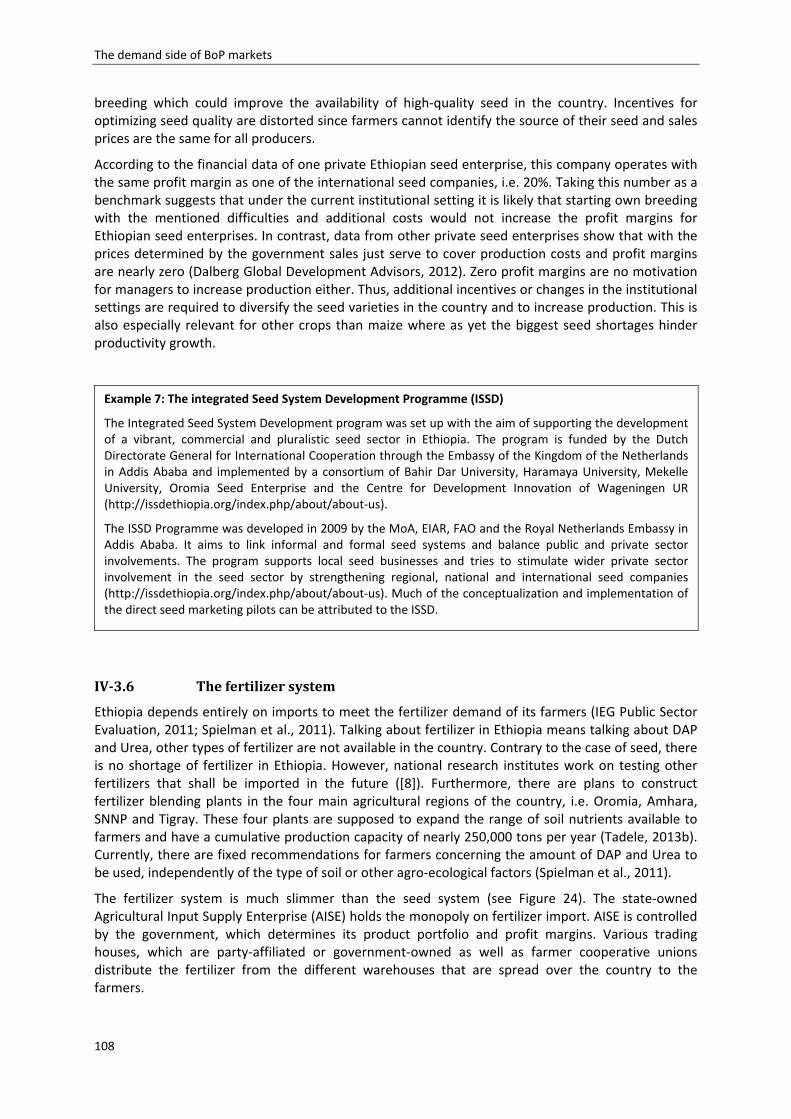
The demand side of BoP markets
108
breeding which could improve the availability of high‐quality seed in the country. Incentives for optimizing seed quality are distorted since farmers cannot identify the source of their seed and sales prices are the same for all producers.
According to the financial data of one private Ethiopian seed enterprise, this company operates with the same profit margin as one of the international seed companies, i.e. 20%. Taking this number as a benchmark suggests that under the current institutional setting it is likely that starting own breeding with the mentioned difficulties and additional costs would not increase the profit margins for Ethiopian seed enterprises. In contrast, data from other private seed enterprises show that with the prices determined by the government sales just serve to cover production costs and profit margins are nearly zero (Dalberg Global Development Advisors, 2012). Zero profit margins are no motivation for managers to increase production either. Thus, additional incentives or changes in the institutional settings are required to diversify the seed varieties in the country and to increase production. This is also especially relevant for other crops than maize where as yet the biggest seed shortages hinder productivity growth.
ThefertilizersystemIV‐3.6
Ethiopia depends entirely on imports to meet the fertilizer demand of its farmers (IEG Public Sector Evaluation, 2011; Spielman et al., 2011). Talking about fertilizer in Ethiopia means talking about DAP and Urea, other types of fertilizer are not available in the country. Contrary to the case of seed, there is no shortage of fertilizer in Ethiopia. However, national research institutes work on testing other fertilizers that shall be imported in the future ([8]). Furthermore, there are plans to construct fertilizer blending plants in the four main agricultural regions of the country, i.e. Oromia, Amhara, SNNP and Tigray. These four plants are supposed to expand the range of soil nutrients available to farmers and have a cumulative production capacity of nearly 250,000 tons per year (Tadele, 2013b). Currently, there are fixed recommendations for farmers concerning the amount of DAP and Urea to be used, independently of the type of soil or other agro‐ecological factors (Spielman et al., 2011).
The fertilizer system is much slimmer than the seed system (see Figure 24). The state‐owned Agricultural Input Supply Enterprise (AISE) holds the monopoly on fertilizer import. AISE is controlled by the government, which determines its product portfolio and profit margins. Various trading houses, which are party‐affiliated or government‐owned as well as farmer cooperative unions distribute the fertilizer from the different warehouses that are spread over the country to the farmers.
Example 7: The integrated Seed System Development Programme (ISSD)
The Integrated Seed System Development program was set up with the aim of supporting the development of a vibrant, commercial and pluralistic seed sector in Ethiopia. The program is funded by the Dutch Directorate General for International Cooperation through the Embassy of the Kingdom of the Netherlands in Addis Ababa and implemented by a consortium of Bahir Dar University, Haramaya University, Mekelle University, Oromia Seed Enterprise and the Centre for Development Innovation of Wageningen UR (http://issdethiopia.org/index.php/about/about‐us).
The ISSD Programme was developed in 2009 by the MoA, EIAR, FAO and the Royal Netherlands Embassy in Addis Ababa. It aims to link informal and formal seed systems and balance public and private sector involvements. The program supports local seed businesses and tries to stimulate wider private sector involvement in the seed sector by strengthening regional, national and international seed companies (http://issdethiopia.org/index.php/about/about‐us). Much of the conceptualization and implementation of the direct seed marketing pilots can be attributed to the ISSD.
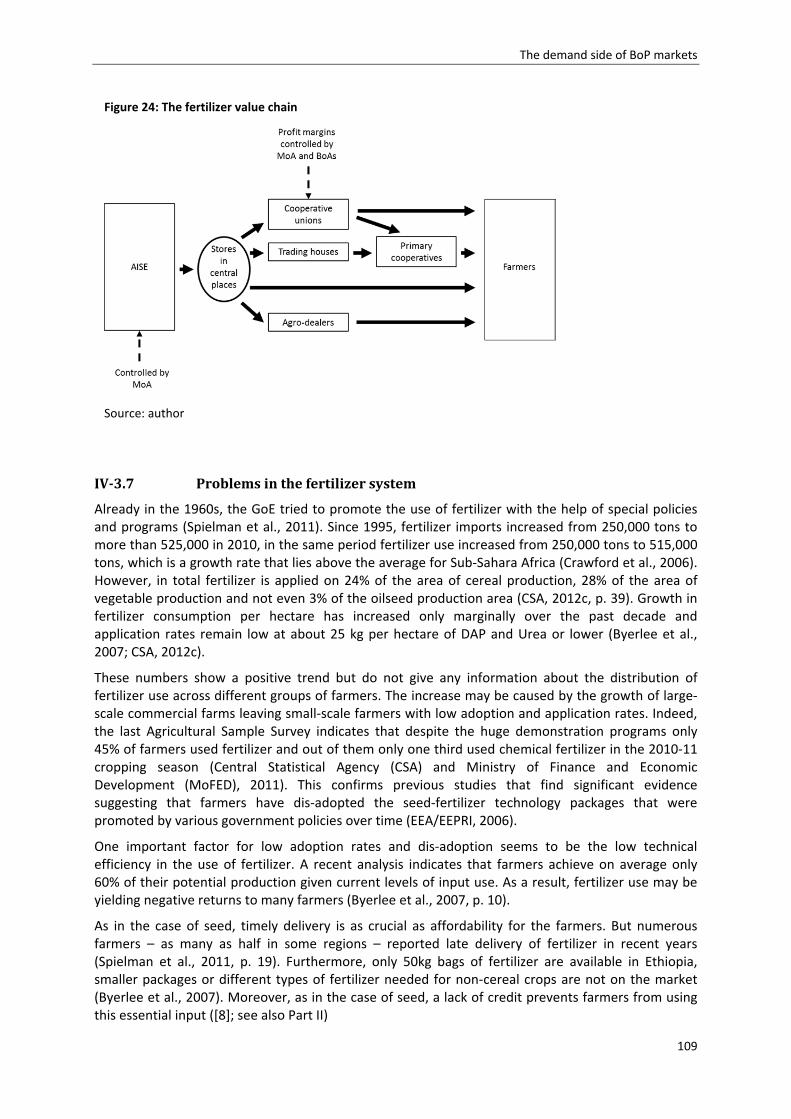
The demand side of BoP markets
109
ProblemsinthefertilizersystemIV‐3.7
Already in the 1960s, the GoE tried to promote the use of fertilizer with the help of special policies and programs (Spielman et al., 2011). Since 1995, fertilizer imports increased from 250,000 tons to more than 525,000 in 2010, in the same period fertilizer use increased from 250,000 tons to 515,000 tons, which is a growth rate that lies above the average for Sub‐Sahara Africa (Crawford et al., 2006). However, in total fertilizer is applied on 24% of the area of cereal production, 28% of the area of vegetable production and not even 3% of the oilseed production area (CSA, 2012c, p. 39). Growth in fertilizer consumption per hectare has increased only marginally over the past decade and application rates remain low at about 25 kg per hectare of DAP and Urea or lower (Byerlee et al., 2007; CSA, 2012c).
These numbers show a positive trend but do not give any information about the distribution of fertilizer use across different groups of farmers. The increase may be caused by the growth of large‐scale commercial farms leaving small‐scale farmers with low adoption and application rates. Indeed, the last Agricultural Sample Survey indicates that despite the huge demonstration programs only 45% of farmers used fertilizer and out of them only one third used chemical fertilizer in the 2010‐11 cropping season (Central Statistical Agency (CSA) and Ministry of Finance and Economic Development (MoFED), 2011). This confirms previous studies that find significant evidence suggesting that farmers have dis‐adopted the seed‐fertilizer technology packages that were promoted by various government policies over time (EEA/EEPRI, 2006).
One important factor for low adoption rates and dis‐adoption seems to be the low technical efficiency in the use of fertilizer. A recent analysis indicates that farmers achieve on average only 60% of their potential production given current levels of input use. As a result, fertilizer use may be yielding negative returns to many farmers (Byerlee et al., 2007, p. 10).
As in the case of seed, timely delivery is as crucial as affordability for the farmers. But numerous farmers – as many as half in some regions – reported late delivery of fertilizer in recent years (Spielman et al., 2011, p. 19). Furthermore, only 50kg bags of fertilizer are available in Ethiopia, smaller packages or different types of fertilizer needed for non‐cereal crops are not on the market (Byerlee et al., 2007). Moreover, as in the case of seed, a lack of credit prevents farmers from using this essential input ([8]; see also Part II)
Figure 24: The fertilizer value chain
Source: author
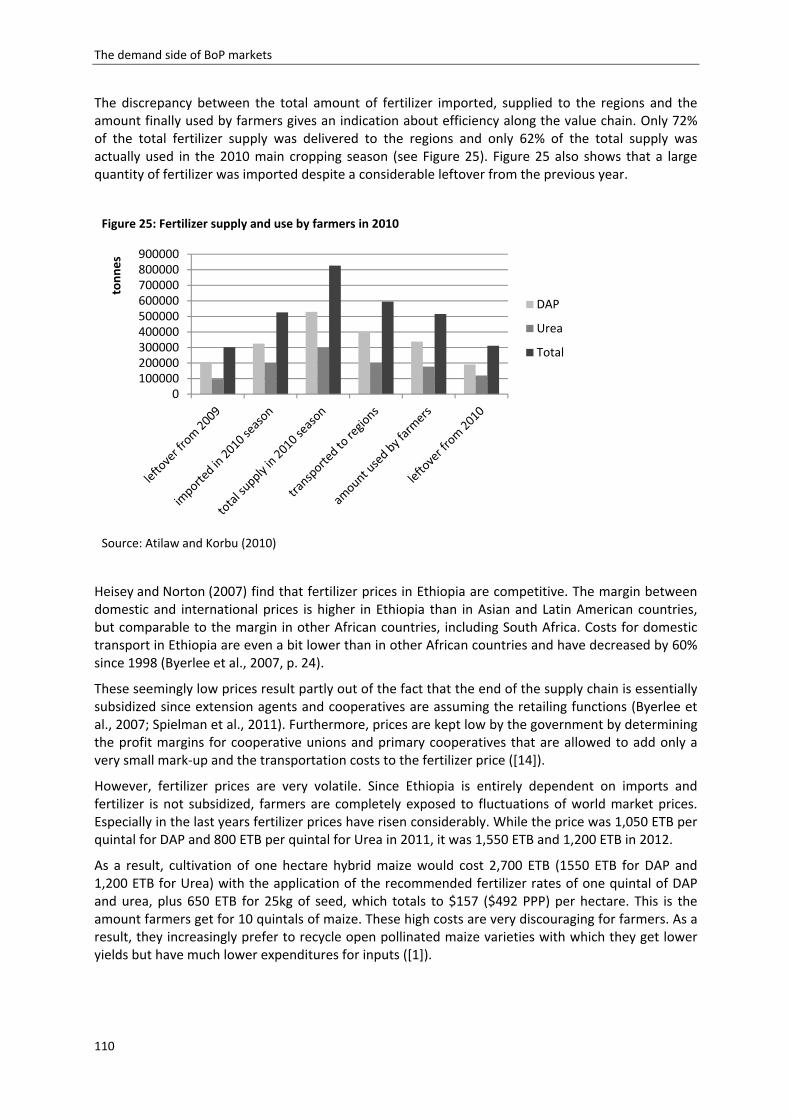
The demand side of BoP markets
110
The discrepancy between the total amount of fertilizer imported, supplied to the regions and the amount finally used by farmers gives an indication about efficiency along the value chain. Only 72% of the total fertilizer supply was delivered to the regions and only 62% of the total supply was actually used in the 2010 main cropping season (see Figure 25). Figure 25 also shows that a large quantity of fertilizer was imported despite a considerable leftover from the previous year.
Heisey and Norton (2007) find that fertilizer prices in Ethiopia are competitive. The margin between domestic and international prices is higher in Ethiopia than in Asian and Latin American countries, but comparable to the margin in other African countries, including South Africa. Costs for domestic transport in Ethiopia are even a bit lower than in other African countries and have decreased by 60% since 1998 (Byerlee et al., 2007, p. 24).
These seemingly low prices result partly out of the fact that the end of the supply chain is essentially subsidized since extension agents and cooperatives are assuming the retailing functions (Byerlee et al., 2007; Spielman et al., 2011). Furthermore, prices are kept low by the government by determining the profit margins for cooperative unions and primary cooperatives that are allowed to add only a very small mark‐up and the transportation costs to the fertilizer price ([14]).
However, fertilizer prices are very volatile. Since Ethiopia is entirely dependent on imports and fertilizer is not subsidized, farmers are completely exposed to fluctuations of world market prices. Especially in the last years fertilizer prices have risen considerably. While the price was 1,050 ETB per quintal for DAP and 800 ETB per quintal for Urea in 2011, it was 1,550 ETB and 1,200 ETB in 2012.
As a result, cultivation of one hectare hybrid maize would cost 2,700 ETB (1550 ETB for DAP and 1,200 ETB for Urea) with the application of the recommended fertilizer rates of one quintal of DAP and urea, plus 650 ETB for 25kg of seed, which totals to $157 ($492 PPP) per hectare. This is the amount farmers get for 10 quintals of maize. These high costs are very discouraging for farmers. As a result, they increasingly prefer to recycle open pollinated maize varieties with which they get lower yields but have much lower expenditures for inputs ([1]).
Figure 25: Fertilizer supply and use by farmers in 2010
Source: Atilaw and Korbu (2010)
0100000200000300000400000500000600000700000800000900000
tonnes
DAP
Urea
Total
The demand side of BoP markets
111
TheprivatesectorandthefertilizermarketIV‐3.8
The private sector always had a difficult standing on the fertilizer market. Under the military regime of the Derg, the private sector was excluded from participation in the fertilizer market. Fertilizer was subsidized and special credit programs were put in place to encourage fertilizer use, resulting in fertilizer consumption of around 100,000 tons in 1990.
In 1993, the GoE issued the National Fertilizer Policy, which supported fertilizer market development. This trend was continued by the National Fertilizer Sector Project, launched in 1996, that abolished the monopoly of the state‐owned Agricultural Inputs Supply Corporation (and transformed it into today’s AISE) and aimed at liberalized pricing, the abolition of subsidies and the regulation of fertilizer standards (Byerlee et al., 2007).
After an initially positive response of the private sector resulting in several private firms importing and distributing fertilizer, tides turned again (Byerlee et al., 2007; Stepanek, 1999). While the market share of the private sector was 33% in 1996 it was zero again in 1999 due to increased government interference and high capital costs, with AISE being the major stakeholder of fertilizer import in Ethiopia. It was only accompanied by some officially private companies that were closely affiliated with or owned by the governing party. In the mid‐2000s, also some cooperative unions entered the import market with considerable technical assistance from the Ministry of Agriculture (Byerlee et al., 2007).
The trends were similar in the case of wholesalers and retailers: while AISE had a market share of less than 50% during the mid‐ and late 1990s, it had regained the majority share by 2001, when private sector wholesalers, except for the party‐affiliated companies, had disappeared from the market due to tough competition with the public enterprises (EEA/EEPRI, 2006; Stepanek, 1999). Private dealers accounted for only 7% of fertilizer sales in 2004 (Byerlee et al., 2007; EEA/EEPRI, 2006).
Due to the extreme food shortage in the country, the GoE decided in 2009 to buy fertilizer in bulk (instead of batches of 25,000 tons) to improve efficiency in procurement. Thanks to its size, preferential treatment by the CBE ([10]) and its capacity, the AISE emerged as the sole importer of fertilizer again as a result of the new import regulation (Jayne et al., 2003). Other importers could not compete and started to make contractual agreements with the public enterprise to import on their behalf (IEG Public Sector Evaluation, 2011; [8], [4]). This development “set back the whole effort put into promoting fertilizer marketing reform by the [World] Bank [and other donors] over more than a decade” (IEG Public Sector Evaluation, 2011, p. viii). The cooperative unions that have been importing fertilizer are no longer doing so and are now engaged only in its distribution. Similarly, no private firms are engaged in fertilizer distribution and import. Thus, there is a perfect market concentration in the fertilizer market again – a situation that has been shown to be associated with higher fertilizer prices and welfare losses for farmers (Hernandez and Torero, 2013; Hoddinott et al., 2012)
Box 13: Fertilizer procurement under control of the government
As has been said, fertilizer import is completely under the control of the government. The example of fertilizer procurement in 2011‐12 shows that this can lead to considerable delays and inefficient processes when organizing fertilizer supply.
In August 2011 the MoA floated a tender for the supply of fertilizer for the 2011‐12 season. Due to the high prices offered by 20 bidding companies the MoA cancelled the tender again. Even the least financial offers of $551 for a tonne of Urea and $690 for DAP that were offered by the private Swiss based fertilizer trader Amropa‐AG were deemed to be too high.
As a result, the MoFED established the National Fertilizer Tender Committee, which includes representatives from the NBE, the CBE, MoA and MoFED. While the first round of negotiations had focussed on fertilizer traders, this committee chose 14 international manufacturers for negotiations over fertilizer supply.
The demand side of BoP markets
112
With the aim of buying 200,000 tons of fertilizer in a normal auction process when the international price would be lower again, the committee agreed with the companies in September 2011 on the purchase of 600,000 tons of both urea and DAP. However, the prices of $586 for one tonne of Urea and $733 for a tonne of DAP demanded during the negotiation were even higher than the prices that led to the cancellation of the tender process a month earlier. Nevertheless, the committee agreed to buy 150,000 tons of DAP from Yara and Amropa‐AG each and 250,000 tons of Urea from Indargo S.A. In January 2012, the committee floated a tender again to procure the remaining quantity of the required fertilizer. This time, Yara, Jordan and Mid Gulf supplied a total of 160,000 tons of DAP, and Indargo supplied 78,000 tons of Urea at lower prices.
Of the total 888,000 tons of fertilizer that were finally imported, the government distributed 625,025 tons to farmer cooperative unions across the country. In the end, farmers bought only 45.6% of the total amount in supply (Masfin, 2012).
Institutionalanalysis:transactioncostsalongthefertilizervaluechainIV‐3.9
Fertilizer is a politically very sensitive commodity in Ethiopia. “The view of the government is that the private sector distribution network is not adequate to ensure supply, and will take time to evolve; that the foreign exchange implications of fertilizer imports are too important for the government not to be involved in. There is also a long‐established central planning mind‐set, that sees use of fertilizer in terms of publicly‐set targets; but this is grounded in a deeper sense that something as critical to the country's food supply and economic performance is too important for the government not to be involved in.” (Furtado et al., 2007, p. 14)
Thus, what can be observed on the fertilizer market are artificially high transaction costs for the private sector. Due to bank regulations, private sector stakeholders are required to provide collaterals of 100% of the value of the fertilizer to be imported at the time a line of credit is opened. At the same time AISE enjoys privileged collateral requirements ([10]), which ensures it its monopoly.
The cooperatives unions’ distribution profit margin is determined by BoAs according to a guideline of the MoA, and is kept at a minimum: additional to the transport costs unions in SNNP, for instance, may add 1‐1,5 ETB per quintal on the price of fertilizer and primary cooperatives can add 4 ETB per quintal of fertilizer, which is a very small mark‐up with prices at 1,550 ETB per quintal of DAP and 1,200 ETB per quintal of urea in 2012 ([14]).36 As a result, private firms are largely crowded out from the fertilizer distribution business since firms cannot compete against competitors with such tight margins.
Pre‐contractual activities are organized – as in the case of seed – by the government. The monopoly of the AISE signifies that
Fertilizer distributers do not incur costs for market research concerning procurement of fertilizer since AISE is the only importer;
Advertisement costs do not arise for private stakeholders since marketing is done by the government with the help of farmers’ cooperatives and DAs. The only two types of fertilizer available in the country have already been introduced decades ago and are known to most farmers, which additionally lowers promotion costs.
Contract formation is likewise streamlined for cooperative unions and primary cooperatives since their profit margins are fixed by the government. Other distributors are seemingly free in price determination but have to compete with the cooperatives.
The post‐contractual transaction activities are also minimized since there are no product guarantees or other services provided by the sellers. As in the case of seed, there is usually simultaneous exchange, i.e. farmers need to pay the fertilizer upon delivery. Credit constraints are the same as in
36 As the profit margins are finally determined by the BoAs, profit margins for cooperatives vary across regions but are all of the magnitude described here for the case of SNNP.
The demand side of BoP markets
113
the case of seed (see Section IV‐3.2). Also similar to the case of seeds of major crops, outreach of fertilizer even to marginalized farmers is secured by the farmer cooperatives such that farmers’ access to fertilizer depends rather on the availability of credit than on the availability of fertilizer itself.
The artificially created monopoly of the state‐owned AISE blocks competition in price and quality of fertilizer. As in the case of major crop seeds, the government controls the whole system by securing public organizations a monopoly on the first element in the value chain, in the case of seed it is the parental lines and pre‐basic seed, in the case of fertilizer it is import. The rest of the value chain leaves very little space for the private sector. Since fertilizer distribution is “tiresome” ([4], [8]) and – due to competition with the cooperatives who have limited profit margins – not very profitable ([4]), there are hardly any incentives for the private sector to enter the fertilizer market.
Provisionofotherseedsandagro‐chemicalsIV‐3.10
The markets for other seeds and agro‐chemicals differ from the markets of the main crop seeds and fertilizer as they are much less regulated. Fruits, mainly avocado, mango, bananas, oranges, guavas and papayas are grown on 55,000 ha of land; vegetables, mainly red and green pepper, cabbage and tomatoes were grown on 127,000 ha of land in the main cropping season of 2010‐11. Thus, fruits and vegetables are a rather small market compared to the 9,690,734 ha used for cereal production (CSA, 2012c).
The market for seeds of fruits and vegetables is relatively open. Various stakeholders import and distribute seed, among them some foreign companies like Solagrow PLC and Cropgrow Crop Production PLC; Ethiopian and foreign companies are free to determine their profit margin and to sell the seed directly to farmers or farmer cooperatives. Most of the firms prefer to sell to farmer cooperatives or customers who come to the shops in Addis Ababa or other major cities to save on transportation costs ([4]). Only one of the interviewed companies employs distributors who sell agricultural inputs and farming equipment all over the country ([4]). Search for customers is not difficult since demand for such seed is high ([4]). Companies can usually sell all seed they have on stock. Thus, they do not need to actively engage in marketing in rural areas. Some companies can also rely on the support of DAs who promote their products and give training for farmers how to use the seed ([4]).
Companies need to get new seed registered, which can take two years and more and is perceived to be expensive (numbers vary from 30,000 ETB to 100,000 ETB for the registration of a new variety; [4]). To establish new products on the market, investments in demo plots, field days and trainings are necessary. Some companies can partly save on these costs thanks to their established brand name if they are known in a region for a long time already and have succeeded in establishing a trust relationship ([4]). Imports are tax free and there are no subsidies on seed ([4]).
Example 8: A social enterprise establishing a vegetable value chain
iDE is an international organization helping small‐scale farmers to improve their income by providing them irrigation technology, which enables the farmers to produce high‐value crops. The Ethiopian country program was started in 2007.
iDE has a comprehensive approach. The process starts with a market assessment, which crops are demanded and can be sold for high prices with low price volatility. For this purpose, the organization identifies high‐value crops that can be grown in the respective areas and it works together with agricultural research institutes to get appropriate seed.
The second step is the design of irrigation technology that is adequate for one household cultivating half a hectare of land. iDE then tries to create awareness for this irrigation technology and promotes high‐value crops such as tomatoes and onions that can be grown with the help of these irrigation technologies. If demand is created, iDE trains local smiths to build the water pumps. This creates jobs and makes the water pumps
The demand side of BoP markets
114
affordable and accessible. At the same time, farmers are trained in farming practices that they need to cultivate the high‐value crops. Finally, farmers are linked to the market. They are encouraged to build cooperatives such that they can sell in bulk and have better bargaining power.
In the whole process, manufacturers and farmers get the training for free but farmers pay for the pumps and installation or reparation services. For this purpose, iDE tries to collaborate with MFIs to provide credit to the farmers. Farmers can pay back the investment in one season, i.e. within three to four months: if a farmer plants a quarter of a hectare with onions of an improved variety he can harvest 20‐40 quintals on this area. With a market price of 400 ETB per quintal, this is enough to pay back the loan for the pump and installation, which sums up to 1,830 ETB.
The market analysis as well as training of manufacturers and farmers takes time in the beginning. But after four to five years, the project is self‐sustaining and iDE limits its activities to occasional consultancies. The project reached 8600 households in the first phase and is now scaled up to other areas in Ethiopia where groundwater is available in up to 20 meter depth ([13]; http://ethiopia.ideorg.org).
The market for agrochemicals is very similar to the one for fruit and vegetable seed and many companies are active on both markets. In many cases, pesticides are not regularly supplied to farmers but ordered by the DAs in concrete cases when pests or diseases are threatening the harvest ([8]). Pesticides are used on 20% of the areas, on which cereals are cultivated and 25% of the potato cultivation area but only on 1% to 3% of all other areas of agricultural usage (CSA, 2012c).
Search for customers of agrochemicals is not difficult despite “tough competition” ([8]) since demand is high. Most companies sell to large‐scale farmers and farmer cooperatives to save on marketing and transportation costs. When the brand is established in an area, firms can save on promotion costs and DAs often take over promotion and training for farmers ([4]).
A difference to the fruit and vegetable seeds market is that companies are licensed as importers and do not need to register the single products any more. Once they got their importers license they are free to bring different agrochemicals into the country without registration for each individual product ([4]). This has important implications for the quality of the pesticides and adequate use in cases where farmers directly buy pesticides from one of the few agro‐dealers. First, as the quality of agro‐chemicals is not controlled or regulated, there is no mechanism to ensure quality standards for these products and farmers have no means to complain in case of adulteration of the product. Moreover, due to considerable information asymmetries, farmers depend entirely on the information provided by the trader concerning quantity and mode of use. As no public authority controls the quality of the chemicals and the advice given to farmers, there is considerable room for misuse of market power at the expense of the farmers.
Companies determine the sales price of agrochemicals according to their own pricing strategy ([4]), the government does not interfere in the price setting of these products. The AISE is also active on these markets but not as dominant as in the case of fertilizer ([8]).
Companies operating on the agrochemical market do not incur high costs for search for customers, neither. All of them sell only in Addis Ababa and branches in other cities to people coming to their shops. None of the companies needs to commit the effort to sell outside big cities to market their whole stock.
Despite high demand companies do not import more seeds or agrochemicals due to limitations of working capital, which is restricted for most of them due to the high collateral requirements of the banks. Also in their case, 100% of the disbursed loan value needs to be deposited as collateral. This leads to a situation, in which despite a considerable shortage of e.g. tomatoes and onions ([4], [13]) many farmers do not have access to seeds of these vegetables.
One of the interviewed traders once tried to establish a distribution network to sell his products also in areas outside Addis Ababa but had to stop the project due to high transportation and operational
The demand side of BoP markets
115
costs ([4]). Due to the already mentioned lack of a system of agro‐dealers in the country, it is difficult for a single company of small size to market its products in remote areas.
IV‐4 Conclusion: institutions and the private sector on agricultural inputmarkets
Under the current institutional setting the private sector is mainly restricted to the production of seeds of major crops as well as import and distribution of fruit and vegetable seeds and agrochemicals. Two international seed companies are engaged in breeding and marketing of their own varieties of major crops, mainly of hybrid maize. As has been shown, transaction costs are especially high for the government, which controls essential parts of the agricultural input systems. The institutional setting prevents private firms from increasing and diversifying their production and from entering certain markets such as fertilizer import and distribution.
The current system of major seeds and fertilizer provision has considerable drawbacks. On the one hand, it ensures the provision of inputs like fertilizer and seed of major crops to all areas and groups of farmers. On the other hand, there is still a considerable lack of improved seed in the country. Moreover, the system suffers from a very inadequate and inefficient demand assessment (Teklewold et al., 2012), which is – additional to variations in climate and weather conditions – an important reason for high left‐overs of seed despite the fact that demand is higher than supply. Moreover, the system does not ensure farmers’ access to these inputs since it does not include credit facilities anymore and it hinders the private sector to innovate and expand by restricting firms to a very small subset of the range of activities a firm normally carries out.
The reduction of the activities that a company operating on agricultural input markets in Ethiopia can carry out has important consequences. According to Porter (1985), all activities a firm carries out along its value chain37 contribute to its competitive advantage. Furthermore, Porter distinguishes different scopes that related to a company’s value chain, which a firm needs to determine, such as market segments or the geographical areas a company wants to operate in (see also Box 14). Yet, if the number of activities is reduced the possibilities of a firm to develop a competitive advantage are reduced as well. This also implies that firms cannot innovate in these areas. If the government is the only remaining actor, as it is the case on the Ethiopian agricultural input markets, it does not need to
37 Porter (1985) uses the term value chain for different activities carried out within a firm. He uses the term value system for what is usually referred to as value chain, i.e. the flow of the products from inputs via production to the final customer.
Example 9: Companies evaluating other agricultural input markets – the ATC Kulumsa project
The Ethio‐German Agricultural Training Center (ATC) in Kulumsa was set up in 2010 as a joint effort by the EIAR, the MoA and the GIZ and is funded by the German Federal Ministry for Food and Agriculture. It serves to introduce farm machinery and agro‐chemicals and to provide trainings in the use of these inputs for employees in the public research center at Kulumsa. Furthermore, trials of new technologies on the fields of some selected farmers are conducted. Several private companies are involved in this project, including AGCO, providing tractors and combine harvesters, Lemken, a specialist for land preparation as well as seeding and plant protection equipment, Grimme who provides technology for potato cultivation and harvesting as well as Rauch, providing fertilizer application technology, Beinlich, a specialist for irrigation systems, Europlant, a company producing improved potato varieties, Bayer CropScience for crop protection technologies and finally Euro Grass B.V., another seed breeding company (www.giz.de/en/worldwide/18920.html). All these companies provide trainings and machinery for free for the public research institutes involved. These firms aim at evaluating the market in the country to assess the profitability of potential future investments. Whether they will start business operations in Ethiopia remains to be seen.
The demand side of BoP markets
116
establish and maintain a competitive advantage against any competitors, which implies that the incentive to innovate is considerably reduced.
Box 14: Michael Porter’s concept of competitive advantage
In his seminal book about competitive advantage Porter (1985) developed the idea that the whole value chain of a firm is decisive for its competitive advantage. All activities a firm carries out contribute to the firm's relative cost position and can be the basis for differentiation. “A cost advantage, for example, may stem from such disparate sources as a low‐cost physical distribution system, a highly efficient assembly process, or superior sales force utilization. Differentiation can stem from similarly diverse factors, including the procurement of high quality raw materials, a responsive order entry system, or a superior product design.” (Porter, 1985, p. 33)
According to Porter (1985) every firm's value chain is composed of nine generic categories of activities, which are linked together in a characteristic way. These activities can be divided into primary activities and support activities. Primary activities are inbound logistics, operations, outbound logistics, marketing and sales as well as service. Support activities comprise firm infrastructure, human resource management, technology development and procurement. The margin is the difference between the total value created and the cost of performing the various value activities.
Furthermore, Porter distinguishes four dimensions of scope that a firm needs to determine for its value chain. These are the scope of segments, i.e. the decision which varieties are to be produced and which buyers to be served, vertical scope, determining the extent to which activities are performed in‐house instead of by independent firms, geographic scope and industry scope, i.e. the range of related industries in which a firm competes (Porter, 1985, p. 54).
To develop and preserve a competitive advantage a company must streamline all aspects of the value chain to deliver greater value at the same costs or comparable value at lower costs than its competitors. This implies that a company follows a strategy that directs all activities towards delivering a unique mix of values. However, part of a strategy is to position the company on the market. This market positioning can be based on customer needs, customer’s accessibility or the variety of the firm’s products or services (Porter, 2002).
The argument here is that Ethiopian private seed companies and (previously existing) private fertilizer distributors are severely limited in their choice of market positioning options and the number of activities they can carry out as well as in the choice of the set of values the company wants to deliver and that this situation makes it extremely difficult for them to develop a competitive advantage. Ethiopian seed companies have hardly any meaningful choice concerning procurement of inputs, marketing and distribution. The only remaining option is operational effectiveness, i.e. to perform the very process of seed production better than rivals do in terms of production costs. Since the government buys all produced seed at the same price independent of quality, there is no direct competition between seed companies and therefore no stage where competitive advantage against direct rivals is needed. As a result, companies have no real incentive to innovate concerning the quality of their seed because improvements in quality are not rewarded.
For the same reasons, the choice of scopes of the firm’s value chain is limited in Ethiopia. The choice of segments is restricted since firms get the pre‐basic seed assigned by the government and marketing is not done by the seed company. Additionally, companies are dependent on the government for the assignment of more land to expand their seed production. As a result, they cannot operate on their optimal scale, which would ensure efficiency of production and thus lower marginal costs.
The two international seed enterprises are not subject to these restrictions since they operate with their own varieties. Pioneer Hi‐Bred sells high quality seed at higher prices than all Ethiopian seed companies and always manages to sell all seed on stock. The company also determines its geographic scope and the market segment to serve. Price setting is part of the company’s strategy. The same
The demand side of BoP markets
117
applies for Seed Co., which also offers high quality seed at relatively high prices. Both have successfully managed to introduce new varieties into the Ethiopian market and at least Seed Co. developed alternative marketing strategies.
For the farmers, this system implies that they do not benefit from innovations concerning quality or lower prices, neither concerning major seeds nor regarding fertilizer procurement and distribution. Their demand for seed of many crops is not satisfied since seed companies have to wait a long time to get more land from the government and there are hardly any incentives for the production of other crops than hybrid maize.
To summarize, improved seed of hybrid maize and fertilizer does reach the marginalized poor thanks to the distribution system devised by the government and accomplished by the farmer cooperatives and cooperative unions. However, a lack of credit implies that despite availability of some inputs farmers do not have access to them. For all crops except hybrid maize, there is a significant shortage of seed. The same applies for fruit and vegetable seeds and agrochemicals, which are not available in marginality hotspots.
To improve this situation, the GoE induced diverse institutional changes to improve agricultural input provision, such as installing new organizations like the ATA and the regional seed enterprises as well as a new seed law. On the other hand it reestablished the monopoly of the AISE to ensure control over fertilizer procurement. Despite some positive developments, it is unlikely that these changes are sufficient to ensure supply of quality seed and fertilizer for all Ethiopian farmers in the future since the problems of finance and the lack of incentives to produce seed that is commercially less attractive under the current setting are not solved.
Conclusion
118
V. ConclusionThis research has shed light on several aspects concerning the possibilities of the private sector to contribute to the reduction of poverty and marginality. First, it introduced the concept of marginality and identified marginality hotspots in Ethiopia. Marginality has been identified as a root cause of poverty. The concept refers to people being at the edge of social, political, economic and ecological systems, which prevents them from access to resources and assets and hinders the development of capabilities. Marginality thus helps to explain why some people have not or only in a limited way benefited from poverty reduction efforts in the last decades.
The concept of marginality was operationalized with the help of seven indicators representing the various spheres of life that determine people’s well‐being. These indicators have been overlaid using Geographic Information System software to produce a marginality hotspot map of Ethiopia that shows in how many of these spheres of life people in a certain area are marginalized. As has been shown, marginality hotspots are spread across northern and southern parts of Ethiopia and are neither bound to certain agro‐ecological conditions nor to special ethnic groups. However, a relationship between ethnic dominance and marginality was detected as marginality hotspots are located in areas where the dominant ethnic group constitutes on average more than 95% of the population while this dominance is less pronounced in non‐hotspot areas. This result holds even when urban areas, that are likely to have a higher ethnic diversity due to rural urban migration, are excluded from the analysis.
The mapping approach also revealed that marginality is a widespread concern in Ethiopia: more than 20 million people are marginalized in 6 or 7 dimensions and more than 40 million are marginalized in 5 or more dimensions. Thus, measured in terms of the number of people, the marginalized poor constitute a big market.
To answer the questions of what the needs of the marginalized poor are that the private sector could respond to and what the volumes of the markets are that the private sector could tap, it was analyzed which area‐specific opportunities and challenges prevail in marginality hotspots and elsewhere in the country that impact private sector investments. Furthermore, to assess potential market sizes, the purchasing power and purchasing behavior of the marginalized poor was scrutinized.
To capture regionally different opportunities and challenges for companies aiming at including the marginalized poor in their value chains, an analysis of area‐specific characteristics was carried out. It was found that there are three main area types in Ethiopia that pose different opportunities and challenges to firms: pastoralist areas may be the greatest challenge for profit‐maximizing investments due to the small and moving population living there, great distances of these people to regional centers and a sparse road network. Investments in people living in this area type may be rather interesting for social businesses or non‐private sector stakeholders. This is different for the other two area types, i.e. the irrigated or perennial areas and areas dominated by other (non‐pastoralist) farming patterns since population densities are relatively high, implying ceteris paribus larger market sizes, and the road and mobile phone network is mostly at least moderate, which reduces transaction costs. Especially in mixed‐farming areas, the market is big in terms of people and the connectivity of these people in terms of road and mobile phone network is steadily improving. Thus, people in these areas are an interesting target group for BoP, inclusive business or Creating Shared Value approaches. Marginality hotspots are found in all three area types. Thus, investments in the marginalized poor require companies to go ‘the last mile’ within the identified area types but do not require investments in different, separated areas far from other markets.
To see whether the marginalized poor constitute a potential market for the private sector, the study tried to shed some light on their expenditure patterns and needs. Reviewing the literature showed that there is a big knowledge gap concerning this kind of information. Literature on innovative
Conclusion
119
business approaches hardly goes into detail about the living conditions of the target group. Thus, a household survey was conducted in different marginality hotspots, with the data being representative for people marginalized in 6 or 7 dimensions, to fill some of these gaps. A common finding in the literature, i.e. that the very poor spend a large share (about 70%) of their budgets on food, can be confirmed for the marginalized poor. Moreover, the survey added insights about what the marginalized poor want to buy but cannot afford and what they name as their most urgent unsatisfied needs.
The products bought by the greatest number of people are salt, kerosene and soap. When asked what people would like to buy but cannot afford, more than 70% of the answers relate to food, especially dairy products and meat. This hints at potentially large markets for healthy processed food that satisfies the need for higher‐order food products and tastier calories. In total, these numbers indicate a food market volume of nearly $1 billion in marginality hotspot areas and nearly $2 billion in areas where people are marginalized in 5 or more dimensions. Based on numbers provided by the HICE survey, which is representative for the whole country, the food market in Ethiopia amounted to nearly $10 billion in 2011 ($33 billion PPP). Furthermore, oxen for plowing, agricultural inputs as well as housing and health care figure prominently among the most urgent unsatisfied needs of the marginalized poor. For most of these products and services, there are examples of companies using innovative business approaches to sell these products to poor people in other countries.
These results show that the marginalized poor in Ethiopia are a promising market segment to cater to. However, it is important to differentiate between needs stated by the poor and actual demand. Thus, further market research is necessary to understand for which products and corresponding prices demand is there or can be created and what the hidden needs are. Yet, as has also been shown in other countries, innovative marketing techniques, that may also include financing mechanisms, are able to convert needs and wants into demand.
The research also revealed that the marginalized poor are as yet not recognized as target group by the private sector. Products find their way to local markets only via middlemen and petty traders but there are no companies actively marketing certain products to the poor as it is done in other countries, e.g. Hindustan Unilever in India marketing iodized salt, soap and other products directly to the poor. Neither do companies procure products from smallholder farmers. Although farmers living in marginality hotspots sell a variety of products to traders who come to the local markets, there are only very few cases where companies actively try to engage smallholders as producers. Yet, those companies who put some effort in doing so in other (non‐hotspot) areas, like Asela Malt buying barley malt from poor farmers, report to be very satisfied with the quantity and quality supplied.
Agricultural inputs are demanded by the marginalized poor and have been shown in other studies to generally increase productivity if correctly applied. The question in the case of Ethiopia is how the private sector can participate in the government‐dominated system that is not able to produce enough seed to meet the demand in the country and that suffers from inefficient fertilizer procurement and distribution. The de facto monopoly on breeder seed together with high costs of finance have been identified as the main instruments of the government to control seed production, distribution and price setting, which hampers investments and the development of business strategies of Ethiopian seed enterprises. Since all Ethiopian seed companies, public and private ones, are dependent on public research institutes for the supply of breeder seed, they are obliged to comply to the conditions that come with the provision of the breeder seed, i.e. the sale of all produced seed to the government at prices to be determined by the government. The seed is then distributed by cooperative unions and primary cooperatives on behalf of the government. This singular distribution channel often leads to seed being mixed up along the value chain and implies that farmers can chose the variety they want to plant but not the producer of the seed, which again bereaves them of holding seed producers accountable if the seed fails. The flip side is that seed producers have no incentive to improve on seed quality as better quality is not rewarded since prices are the same for all producers and low quality cannot be penalized. The two international seed
Conclusion
120
enterprises do not suffer from these constraints since they operate with their own varieties and are thus not subject to the restrictions related to the provision of breeder seed from public institutes. These international seed companies seem to be very successful and do not face problems in seed marketing despite their considerably higher prices.
The distortions in the fertilizer system mainly root in an inefficient procuring and distribution system, which is exclusively in the hands of the government. Due to import regulations, the design of the tendering process for imports and a lack of foreign currency the private sector is excluded from this market. The situation is different for seeds of fruits and vegetables and agro‐chemicals other than fertilizer. These markets are only loosely regulated. Importers of agro‐chemicals, once registered as importer, can sell whatever product they want without the need to register or proof the quality of the products they sell. This lack of control leaves ample room for information asymmetries between agro‐dealers and farmers in cases where DAs cannot lend advice to farmers.
Linking these findings, it is important to acknowledge that farmers will only benefit if the interdependence of the input markets is recognized. Use of improved seed pays off only if seed and fertilizer are available (and accessible) on time. Especially for fertilizer this has not been ensured in the last years. This poses difficulties for seed enterprises because farmers may be economically better off without any improved inputs if inputs come too late or are too expensive.
Prospects for the agricultural private sector to contribute to poverty reduction in Ethiopia – what needs to be done?
To ensure supply of improved seed of all crops, contributions of the private sector will be needed. Even if the new regional seed enterprises expand and optimize their production over the next years, it is unlikely that they can satisfy the seed demand of all farmers in the country. This is also acknowledged by the government (World Economic Forum, 2012b).
Promises of strengthening the private sector have been made (see e.g. Meles Zenawi on the 3rd Symposium on Food Security and Nutrition, 18. May 2012; The Chicago Council on Global Affairs) but it remains to be seen in how far these promises will be realized and be brought in line with the vision of a ‘development state’, which implies that the state controls most of the economy (see e.g. Africa Confidential, 2012). The establishment of four new public seed enterprises runs counter to promises of support for the private sector. It is questionable whether the government is willing to expose these seed companies to increased competition on a less regulated market.
In the current system, there is no strong incentive for many seed producers to start to make themselves more independent from the government. It is uncertain (for some even unlikely) whether their profits would increase much but business would become much riskier. Thus, despite complaints about tight government regulations, there are hardly any measures undertaken to get out of the current seed production system. This is also reflected in the low participation rate of private seed companies in the direct marketing pilots (one company in Amhara and two in Oromia). The low participation rate can partly be explained by various disincentives for them to participate but it is also a signal that only very few seed companies have the capacity and the will to risk a step forward to real market competition. Given the low risk Ethiopian seed companies face in the current system, it may even be rational for them not to embark in projects with increased market competition.
To incentivize domestic as well as foreign investments, a well‐designed and stepwise market liberalization is needed. As has been explained, the point of orientation is not the ‘free market’ as not even in theory free markets bring about maximum welfare for a society when transaction costs are taken into account. Rather, incremental changes are required that provide incentives for the private sector to increase seed production and diversity in the product portfolio and to improve seed quality. Yet, the costs of such changes in terms of welfare losses of other stakeholders must be carefully evaluated. Some concrete changes that are most likely to increase incentives for the private sector
Conclusion
121
and result in better input supply for farmers in the middle‐ and long run are discussed in the following:
A central aspect for Ethiopian seed companies is that they need access to pre‐basic seed of the varieties and in the quantities of their choice and market it in areas and at prices according to their firm strategy. Since public seed companies are not obliged to make profits according to their statutes, these enterprises can ensure that even the marginalized poor have access to improved seed in case the private companies develop strategies that focus on other market segments.
Microfinance institutions or farmer cooperatives need to provide credits to the farmers. Without a credit facility, a rise in seed production will hardly benefit the majority of the peasants, especially the marginalized poor. MFIs are already serving many farmers but are still far from being omnipresent. However, an extended coverage is needed to backup the want for improved inputs with purchasing power. The extension of coverage, however, needs to be accompanied by lending methodologies that ensure repayments to avoid the high default rates that have eroded the credit system in the past.
Not only for the farmers but also for the seed companies access to credit is a decisive factor if they are to increase seed production and the diversity of varieties. However, collateral requirements and costs for negotiations with the banks need to be lowered such that seed companies have a realistic chance of accessing finance at reasonable costs. However, due to a lack of competition in the banking sector and complicated bureaucratic procedures for other sources of finance such as the IFC, many seed companies do not see any chance of increasing their working capital for new projects. Yet, increased capacity of the banks to evaluate risk in agriculture and low credit default rates in the sector should render it possible for the banks to lower collateral requirements in the near future. Another possibility for seed companies to access finance is AGRA that provides finance for seed companies for a certain period of time to facilitate market entry or new investments. Six Ethiopian seed enterprises, among them public, private and international seed enterprises already received grants from this source (AGRA, 2012b).
Another fundamental precondition for a more vibrant private sector is the assignment of more land for seed production and breeding efforts. Yet, more seed production and especially own breeding efforts that would free Ethiopian companies from most government control along the value chain also require high‐skilled plant breeders. The education of such people is a long‐term task that needs to be taken care of by the government in the form of support for universities and higher learning institutes.
Irrigation facilities would reduce risk and increase seed production. However, irrigation is in a very infant stage in Ethiopia: only 1.3% of the total cultivated land was under irrigation in 2011 (CSA and MoFED, 2011). Most seed companies do not have any irrigation or only very small facilities. But to ensure seed production year round and to enable farmers to get higher yields despite the lack of drought‐resistant seed, irrigation is a crucial element.
Additional to these ‘enabling changes’, it seems adequate to abolish the security for private seed enterprises that all produced seed is bought by the government. As long as seed companies do not need to use entrepreneurial spirit and design competitive firm strategies, many of them may remain in their cushy position where no huge profits are made but the government organizes the marketing and covers much of the risks.
The direct marketing pilots are a signal that the government is moving towards liberalizing the market. But the case of the pilot in Amhara shows how fragile such changes are. However, as the direct marketing pilots are now continued and even extended, private companies are more and more in the position to show that they are able and willing to market seed more efficiently than it is done in the established distribution system. Yet, challenges remain concerning price determination, which is still controlled by the government. When prices are liberalized, there is the danger that the poorest and marginalized are left behind. While some favour the approach to provide the scarce improved
Conclusion
122
seed mainly to the most productive farmers as they yield the highest returns, this raises equity issues that are not easily solved. Here, innovative business approaches can play a major role but company managers need the knowledge about these approaches and the freedom as well as the financial backup to design and apply such firm strategies.
The story for fertilizer importers is a bit different. Since all fertilizer is imported, the country is completely exposed to price volatility on this highly concentrated world market (Hernandez and Torero, 2013; Hoddinott et al., 2012). While the new fertilizer blending plant that is planned may alleviate this dependency, it remains crucial to let the private sector re‐enter the fertilizer market to increase competition, which will lead to efficiency gains and lower prices (see e.g. evidence from the cross‐country study by Hernandez and Torero, 2013). The necessary steps are a fair tendering process and flexible import quantities. Furthermore, private companies need access to finance at reasonable cost, especially reasonable collateral requirements, to be able to compete on this market.
To ensure that farmers have access to chemical fertilizer, prices have to be kept at levels that ensure optimal use. Several experts therefore propose subsidies on fertilizer to ensure farmers’ access to this essential input (see e.g. Lin, 2012). However, these changes are difficult to bring about since shortages of foreign currency and limited capacity to subsidize are among the main reasons for the government to control the fertilizer system. Additionally, control over fertilizer ensures the government political capital as this product is essential for a large part of the population (see also Berhanu, 2013).
However, foreign investments in the fertilizer market are in the pipeline. In line with the New Alliance for Food Security and Nutrition and the New Vision for Agriculture, the Norwegian fertilizer giant Yara signed a letter of intention to start short‐ and long‐term investments in Ethiopia that support the development of fertilizer trade and distribution as well as the development of an “integrated domestic market” (Yara International, 2012). Furthermore, a new fertilizer production plant is planned to be constructed to produce potash in Afar (Alemayehu, 2014) and regional fertilizer blending plants are to be set up in the four main agricultural regions in Ethiopia. How these investments will be integrated into the current market structure and what their effect will be on the private sector remains to be seen.
It holds for both the market for seed of major crops and the fertilizer market that competition will help to ensure that seed and fertilizer comes on time. As long as the government is responsible for the distribution system, tax payers have to come up for unsold inputs that remain on stock due to late delivery or inaccurate planning. Companies in a competitive environment have a strong incentive to minimize such frictions.
The case of agro‐chemicals is very different as this market is hardly controlled at all. A quality control mechanism is needed to ensure adequate product quality. Since agro‐chemicals do not need to be registered, information asymmetries concerning product quality need to be minimized. Furthermore, similar to the changes in the direct seed marketing pilots, farmers should get the opportunity to hold companies accountable in case of product adulteration, which is not the case in the current system.
For importers of fruit and vegetable seed and agro‐chemicals, access to foreign currency and access to finance at reasonable cost is essential to enable imports of these products in quantities that are sufficient to satisfy demand. Data from the expert interviews suggests that demand is not satisfied at the moment and traders admit that they could sell more if they could import larger quantities, even in the locations where they are present at the moment. Expanding beyond current markets and developing new markets in remote areas is currently too expensive for them because of the absence of an agro‐dealer network in the country. Yet, if the seed and fertilizer systems were liberalized, such a network of agro‐dealers would emerge as a positive externality, which would then also benefit small traders of agro‐chemicals who can then extend their market segments also to remote areas more easily.
Conclusion
123
If seed markets are liberalized and the centralized distribution system is replaced by market competition, access to seed for the poorest may be at stake. Thus, in a transition phase in which seed supply is not enough to meet demand and the private sector with conventional business approaches focuses on farmers who are better‐off and easier to reach, the public seed enterprises can cater to the poorest as, according to their statutes, they do not need to make profits. Alternatively, subsidies for the marginalized poor and investment incentives for companies may be temporary measures to ameliorate inequalities.
In the long term, however, private and public seed companies should compete for better quality and lower prices, both catering to the marginalized poor and to non‐poor farmers. Then, innovative business approaches are crucial as companies need to start catering to the poor when markets are liberalized since the poor are the largest customer group in the country in terms of the number of people and, if they have access to credit, also in terms of the amount of inputs bought. Thus, catering to the poor will be essential if the largest part of the Ethiopian market is to be developed for the future.
How can these changes be brought about?
Having identified some potentially fruitful changes, the question arises how these changes could be brought about. It is unlikely that the private seed companies can establish a lobby group that bargains with one voice for market liberalization any time soon. Yet, to change institutions, a critical mass of agents is needed that together reach a certain size in terms of market share or political importance and collectively work towards an institutional change ([12]; Acquaye‐Baddoo et al., 2010). At the moment, the private seed companies do not seem to have this critical mass and it is not clear how many of them really aim at changing the system. While there is an Ethiopian Seed Trade Association and a seed growers and processors association, these organizations are currently not very powerful. Since there are no private actors in the fertilizer system any more, no such organization exists in the fertilizer sector. The chamber of commerce as another business organization that could strengthen the voice of the private sector is very weak and does not cover the agricultural input sector so far ([16]). The ATA can support institutional changes by mediating between public and private stakeholders but this organization is itself dependent on the government and cannot enact changes in the system by itself.
Thus, while companies can still be expected to push for changes, the current situation and the self‐conception of the Ethiopian government require the government to be in the lead. This then entails the question what could motivate the GoE to enact market liberalizing changes. Several factors may be important in this regard, most notably successful role models, support by other stakeholders and successes with investment incentive schemes in other sectors in the country.
Successful role models are certainly conducive for the government to enact changes. However, while the neighbouring countries emanate from similar initial conditions, they have not successfully managed the transition to a liberalized market either so far (Ngugi, 2002; Tripp and Rohrbach, 2001). A more promising country to learn from is China, which also comes closer to the development path aspired by the Ethiopian government. While there remain challenges in the Chinese system, many insights can be gained (Cabral et al., 2006; Park, 2008):
Similar to the case of Ethiopia, agricultural research and plant breeding in China was almost completely managed by public organizations for the longest time. This situation only changed with a new seed law that was enacted in 2000. Until then, public seed companies were the only organizations that were allowed to multiply and sell cereal seed, while breeding was restricted to research institutes in the national agricultural research system. Non‐public seed companies and other private organizations were excluded from marketing seed of any major crop; local seed markets were monopolized by county seed companies.
Conclusion
124
The new seed law eliminated the monopoly of public seed companies. It permits all entities that are certified by the provincial agricultural administration, i.e. public companies, research institutes as well as private companies, to multiply and market seed. Now, the seed industry consists of a mixture of small local public and private seed companies with highly variable products and services. Approximately 50 established companies develop, produce and sell wholesale hybrid seeds while thousands of small, local seed retailers sell seed to farmers (Meng et al., 2006).
Now, the Chinese government puts private companies even at the core of the seed sector development (Peoples Republic of China State Council, 2013). The eight year plan for the development of a “modern crop seed industry” foresees considerable support for private sector development in the seed sector: while the public sector in form of research institutions, universities and colleges is expected to concentrate on basic research, seed breeding and production shall be carried out mainly by the private sector. In that context, private companies, especially large, vertically integrated companies that conduct breeding, production and marketing will be instructed to establish demonstration networks for new varieties, to set up village‐based supermarket chains, distribution centers, retail stores and other sales networks for seeds and to enhance after‐sales services. Furthermore, companies are explicitly expected to “assume social responsibilities” (Peoples Republic of China State Council, 2013, III.10).
Moreover, the Chinese plan pays much attention to the development of an adequate seed testing and quality control mechanisms to ensure high seed quality. Additionally, the establishment of a high‐quality education system that comprises different scientific research stations run by the public and private sector in cooperation features high on the priority list.
Instruments providing investment incentives for companies are corporate income tax exemptions for vertically integrated companies, financial subsidies for seed storage and other preferential tax policies for high‐tech seed enterprises. Furthermore, a modern seed industry development fund will be set up to support the development of commercial breeding. Moreover, financial institutions are encouraged to provide more credits for the purchase and storage of seed (Peoples Republic of China State Council, 2013).
So far, the Chinese government has achieved a considerable growth in seed production. However, small, local seed enterprises find it increasingly difficult to compete against large corporations that have entered the Chinese market (Yahoo Finance, 2014).
Also in the case of fertilizer, a lot can be learnt from China. Again, similarly to the Ethiopian case, the distribution and sales of fertilizer was controlled by the state‐owned Agricultural Input Corporation (AIC). However, the market liberalization in the late 1990s resulted in a quick growth of commercial fertilizer trade with the entry of many private companies and traders. While the market liberalization first led to disruptions and farmers loosing access to fertilizer due to increasing prices, these frictions could be transitionally ameliorated with the help of subsidies (Huang and Rozelle, 2008; Meng et al., 2006).
One of the most important policy reforms in the Chinese case was a fundamental shift in incentives for the public fertilizer trading and retailing enterprises. AIC managers and employees were allowed to use the system's trucks and warehouses and earn a share of trading profits in consideration for not firing workers, supporting retirees and keeping their local input retail outlets open (Huang and Rozelle, 2008). A two‐tiered price system was implemented, in which fertilizer was subsidized for farmers fulfilling certain conditions.
Although there were few traders at first, with the gradual liberalization of the fertilizer market private traders multiplied quickly and fertilizer became available even to farmers in poorer areas. Even the presence of public enterprises in the fertilizer market did not slow down liberalization although this could have diminished the effectiveness of markets concerning demand‐driven price adjustments. Competition in the sales of out‐of‐plan fertilizer let AIC employees learn about operating out of the plan and develop procurement and sales networks. As a result, AlC‐based
Conclusion
125
companies were not only competing against private companies but also amongst themselves. This enhanced competition considerably, improved the efficiency of the market and made traders more responsive to consumer demand concerning quantities and prices (Huang and Rozelle, 2008).
Several lessons can be learnt from the mentioned reforms. First, while deregulation efforts have proven to improve efficiency in the seed production system and increases in demand, one crucial lesson from the Chinese case is the focus on the complementarity between public and private organizations. While market liberalization has helped companies to enter the seed market, public sector responsibilities have been shifted towards basic research and improvements in seed quality control while the task of training and education of seed breeders is done in partnership with the private sector. Hence, deregulation alone is not sufficient to create vibrant and efficient markets, the enabling environment, including research, quality control and variety registration procedures in a timely manner, needs to be ensured. Secondly, it is important to bear in mind that China pursued a gradual approach. This step‐wise market liberalization reduced risk, allowed for learning from experience and gave sufficient time for companies, traders and farmers to develop or adjust to changing environments and policies (Park, 2008). And finally, while China taxed the rural sector in the process of economic growth, sufficient investments in infrastructure, such as irrigation facilities, roads and research were made. Together with price incentives this enabled farmers to steadily increase their incomes and productivity.
Not only the Chinese but also the German seed sector may be of some relevance for Ethiopia. The German seed industry is – similarly to the Ethiopian case – built up of mainly medium‐sized companies. About 130 plant breeding and seed trading companies operate in Germany, 60 of them are companies with own breeding programs. Most of the seed producer and trading companies are organized in regional associations and a national umbrella association, the German Plant Breeders' Association. This umbrella association is the central part of a network that serves as a platform for pre‐competitive joint research projects, patent issues, public variety testing and for safeguarding plant variety protection (www.bdp‐online.de).
The 60 member companies of the German Plant Breeders' Association that maintain own breeding programs pool resources for joint research. A subsidiary of the German Plant Breeders' Association, the so‐called alliance for the support of private German plant breeding (Gemeinschaft zur Förderung der privaten deutschen Pflanzenzüchtung e.V.; GFP), co‐ordinates these joint plant breeding research projects. The GFP facilitates cooperation among scientists, plant breeders and representatives of public authorities and makes recommendations for co‐operative research activities. These research projects are then carried out at public and private research facilities. They are co‐funded by public sector organizations and private companies (www.bdp‐online.de).
The GFP is set up as a non‐profit public‐interest organization. As such, it raises public funds, which are exclusively dedicated to research. These funds are then to be complemented by private funds in form of financial contributions and provision of field trial sites, facilities such as greenhouses, laboratory capacities or breeding material from the companies' own pool of genetic material. Public entities contributing to the fund are, amongst others, the German Ministry of Food and Agriculture, the German Ministry of Education and Research and the European Commission.
Apart from the GFP, the German Plant Breeders' Association has some other subsidiaries that support plant breeders and seed traders concerning issues related to intellectual property rights and plant variety protection, breeders’ rights as well as technology transfer.
The German example is relevant for the Ethiopian case as the industry structure is similar: it is made up of a multitude of medium‐sized companies rather than a few giant corporations dominating the market as it is the case in the US and many other countries (Fernandez‐Cornejo, 2004). In contrast to the common assumption that small companies lack the financial resources necessary to pursue their own research programs and can thus not compete against large corporations, the German seed producers circumvented the typical process of market consolidation by pooling resources for
Conclusion
126
research, for securing patent protection for research findings as well as for the organization of field trials, amongst other things. This experience may be instructive for Ethiopian seed companies as the organization in a national association of the German type identifies a way for medium‐sized private companies to engage in research and stay competitive. While the public sector is still central since such collaboration efforts hinge on public funding and the provision of other resources, public and private sources are organized to complement each other, with cooperation between public and private stakeholders being on a level playing field, not impairing firm strategies.
Apart from learning from role models, cooperation between governments can help to facilitate the entry of private companies into the market. Cooperation between the Ethiopian and the German government has resulted in the Ethio‐German Agricultural Training Center in Kulumsa. Negotiations on minister levels paved the way for German enterprises to engage in Ethiopia and lowered transaction costs for these companies to assess the Ethiopian market (see Example 9). Furthermore, support can be expected from international organizations like AGRA or ISSD (see Example 7), or initiatives like the New Vision for Agriculture, the New Alliance for Food Security and Nutrition or Feed the Future (see Example 3) that are ready to support the government in market liberalization efforts.
Additional to these sources of support, cooperation and support from NGOs is needed as well. The distribution of free seed by relief organizations or even by public entities in the context of agricultural development programs has been identified as one of the most serious constraints to seed system development (Tripp and Rohrbach, 2001). Although such programs have increased industry interest in crops such as sorghum, pearl millet and grain legumes, companies are reluctant to invest in producing quality seed of released varieties of these crops due to uncertainties about the reliability of seed demand (Tripp and Rohrbach, 2001; Tripp, 2000).
And finally, successful experiences from other sectors of the economy, especially other subsectors of agriculture may motivate the government to support private sector investments. Such positive experiences can be drawn from the flower sector where investments have been attracted by the government. Thanks to these programs, flower production increased significantly in the last two decades (Ayele, 2006; see also e.g. The Embassy of Ethiopia in China, 2013). The instruments used to attract these investments resemble very much those used in China to attract private investments in the seed and fertilizer markets, for instance corporate income tax exemptions, especially for companies that chose to set up in government‐preferred locations. However, past experiences in Ethiopia have also shown that without adequate investments in infrastructure, such fiscal incentives are not sufficient to attract investments in preferred areas (Ayele, 2006), which is an important aspect when investors shall be attracted to marginalized areas, especially those areas of type A and B as identified in Section II‐5. Nevertheless, fiscal incentives for companies in combination with investments in infrastructure seem to be adequate tools to spur investments in marginalized areas.
To provide incentives for commercial investments in agricultural input markets, especially the seed market, it is also important to take a regional perspective: harmonizing seed policies and regulations with neighboring countries promises increased interest from investors as transaction costs can be considerably reduced. Progress concerning the harmonization of seed market regulations in East Africa has already been made (Ngugi, 2002; Waithaka et al., 2011). Amongst other things, a multi‐country variety release is discussed that would reduce the need for field trials within a country to one year if the variety is registered in a neighboring country with comparable agro‐ecological conditions (Rohrbach et al., 2003). Incentives for investments would increase considerably if the market for a once registered variety could be expanded to other countries. Thus, further steps towards a harmonization of the Ethiopian seed market regulation with countries like Kenya, Uganda and Tanzania would help to lower transaction costs for investors and to increase the market.
Another very important factor is the change of informal institutions. In Ethiopia, many parts of the society are still considerably shaped by the socialist past. Entrepreneurial spirit is not very common
Conclusion
127
([12]), scepticism concerning business and the belief in a state‐directed economy are still widespread among government employees. But if the private sector is meant to increase operations, support needs to come from all levels of the government and other parts of the society, from universities to banks and consumers.
Innovative business approaches on Ethiopian agricultural input markets and beyond
While the government is seen to be in the lead and it has been discussed, which institutions need to be changed and how the government could do this to promote private sector investments, business has an important role to play in this process as well, especially against the background of innovative business approaches.
The examples mentioned in the study show the variety of fields in which innovative business approaches have already come into play in Ethiopian agriculture although their absolute number remains limited so far. Yet, the cases of the two international seed companies show that the seed market is an attractive field for foreign companies, even with ‘conventional’ business approaches. Costs for market entry are high but profits are made after some years of intensive promotion and advertisement.
Innovative business approaches may also play a role in determining the product portfolio of seed companies: while companies following ‘conventional’, BoP and inclusive business approaches will focus on the production of hybrid seeds that are more profitable, the provision of commercially less profitable seed like self‐pollinating crops offers a vast field of activity for social businesses and social entrepreneurs. In contrast, different business models do not necessarily imply a geographical market segmentation since marginality hotspots are not geographically separated from other areas.
As the less regulated agricultural output markets show, companies are already starting to recognize business opportunities and procure agricultural raw materials such as barley malt from the poor (see Example 1, Example 5 and Example 8). Although managers of seed companies are not familiar with the names of the various innovative business approaches, they are perfectly aware of the fact that their customers will mainly be poor people. Consequently, they will adjust their business model to these circumstances once institutions permit them to develop a full‐fledged firm strategy.
Several general insights emerge out of the Ethiopian case: First, countries in which the great majority of people in rural areas are (marginalized) poor may play a leading role for innovative business approaches since the private sector is forced to adjust to this target group if it wants to reach scale. Thus, in contrast to countries that are usually cited as being leading examples for innovative business approaches such as India, where the rural poor compete as customers with a great number of people who are much better off, countries like Ethiopia may become a great source of innovation for companies as more or less any investment in agricultural markets needs to cater to poor people for reaching scale.
Although agricultural input markets leave little room at the moment for companies to develop sophisticated business strategies, the case of agricultural output markets shows that companies develop business models that rely on the sourcing of agricultural produce from poor farmers without the label (or even the knowledge) of innovative business approaches such as inclusive business or Creating Shared Value. As the example of Asela Malt shows, the firm managed to reduce transaction costs and include smallholder farmers as suppliers in the company’s value chain with relatively simple measures, such as radio broadcasts of prices and payments of a share of the transportation costs, with the result of omitting middlemen and thus higher prices received by the farmers and a substantial increase of barley supply for the company. Although this is only one example, it shows that ‘conventional’ companies include poor farmers in their value chain if it pays off – without much ado about (the language of) innovative business approaches. Many more companies will follow this approach when they have sorted out their managerial and organizational issues they face now
Conclusion
128
shortly after privatization. Yet, this leads back again to the role of the government in promoting investments as measures like import subsidies on wheat and other agricultural products that are in place at the moment distort incentives to invest in business models including poor smallholders as producers.
The example of Asela Malt (Example 2) also shows that including the poor may also be profitable in the short term if not much training for the farmers is involved. Thus, such ‘straightforward’ business models can be a good entry point for companies to get to know the market. More sophisticated business models that include training for farmers and elaborated contracts between companies and farmers often rely on the support of NGOs that assume the task of communicating with the farmers. Especially for marginality hotspots where no or very few NGOs are present, ‘straightforward’ business models may be a promising starting point because initial investments and transaction costs are low. When such ‘straightforward’ supply chains are successfully established, they can be scaled up to include more farmers and upgraded to include trainings and other benefits.
Such a ‘graduation process’ that is based on the idea of manageable initial investments, early profitability and independence from other actors is in line with other strands in the literature that stress that profitability from the beginning on is key for companies including the poor in their value chains (Polak and Warwick, 2013). This model also indicates that the often described trade‐off between social and financial returns may be much less sharp than is usually assumed.
References
129
VI. References Access Capital, 2012. Banking Sector Review 2011. Acemoglu, D., Johnson, S., Robinson, J., 2005. Institutions as a fundamental cause of long‐run
growth. Handbook of Economic Growth 1, 385–472. Acemoglu, D., Robinson, J., 2007. The role of institutions in growth and development. The World
Bank. Commission on Growth and Development. Working Paper No. 10. Acemoglu, D., Robinson, J., 2010. Why is Africa poor? Economic History of Developing Regions 25,
21–50. Acemoglu, D., Robinson, J., 2012. Why Nations Fail: The Origins of Power, Prosperity, and Poverty,
1st ed. Crown Publishers, New York. Acquaye‐Baddoo, N.‐A., Ekong, J., Mwesige, D., Neefjes, R., Nass, L., Ubels, J., Visser, P., Wangdi, K.,
Were, T., Brouwers, J., 2010. Multi‐actor systems as entry points for capacity development. Capacity.org A gateway for capacity development 4–5.
Adam, L., 2010. Ethiopia ICT Sector Performance Review 2009/2010, Towards Evidence‐based ICT Policy and Regulation. researchICTafrica.net, Addis Ababa.
Admassie, A., 2000. The Incidence of Child Labour in Africa with Empirical Evidence from Rural Ethiopia. ZEF Discussion Papers on Development Policy 32, 1–72.
Admassie, A., Abebaw, D., 2011. Rural Poverty and Marginalization in Ethiopia: Review of Development Interventions. Presented at the Marginality and Extreme Poverty: Towards Inclusive Development for and with the Poorest, Center for Development Research, Bonn.
Admassie, A., Ageba, G., Demeke, M., 2005. Rural Finance in Ethiopia: Assessment of the Financial Products of Microfinance Institutions, Occasional Paper. Association of Ethiopian Microfinance Institutions, Addis Ababa.
Africa Confidential, 2012. Ethiopia: Development Over Democracy. Africa Confidential. African Business, 2011. Dashen Bank: Leading by Example. African Business 68–69. AGRA, 2012a. AGRA | Growing Africa Agriculture [WWW Document]. URL http://www.agra‐
alliance.org/ (accessed 7.31.12). AGRA, 2012b. AGRA | Grants information database [WWW Document]. AGRA Growing Africa’s
Agriculture. URL http://www.agra‐alliance.org/AGRA/en/grants/grants/grants‐database/?page=9 (accessed 8.17.12).
Agricultural Transformation Agency, 2012. Ethiopian Agricultural Transformation Agency [WWW Document]. URL http://www.ata.gov.et/about/ (accessed 7.24.12).
Ahmed, A.U., Vargas Hill, R., Naeem, F., 2013. The Poorest: Who and Where They Are?, in: von Braun, J., Gatzweiler, F.W. (Eds.), Marginality. Addressing the Nexus of Poverty, Exclusion and Ecology. Springer, Dordrecht Heidelberg New York London, pp. 85–100.
Ahmed, A.U., Vargas Hill, R., Smith, L.C., Frankenberger, T., Wiesmann, D.M., 2007a. The world’s most deprived: Characteristics and causes of extreme poverty and hunger. IFPRI, Washington.
Ahmed, A.U., Vargas Hill, R., Wiesmann, D.M., Smith, L.C., 2007b. Asia’s poorest and hungry: trends and characteristics. pp. 9–10.
Alemayehu, B., 2014. Israeli company pumps 25 million dollars into Afar Potash Production project. Addis Fortune.
Alemayehu, H., 2012. When businesses miss what they badly need. The Reporter. Alemu, B.A., 2006. Microfinancing and Poverty Reduction in Ethiopia. A Paper prepared under the
Internship Program of IDRC, ESARO, Nairobi. Alemu, D., 2010. Seed system potential in Ethiopia. Constraints and opportunities for enhancing the
seed sector. IFPRI, Addis Ababa, Washington. Alemu, D., 2011. The Political Economy of Ethiopian Cereal Seed Systems: State Control, Market
Liberalisation and Decentralisation. IDS Bulletin 42, 69–77. doi:10.1111/j.1759‐5436.2011.00237.x
References
130
Alene, A.D., Manyong, V.M., Omanya, G., Mignouna, H.D., Bokanga, M., Odhiambo, G., 2008. Smallholder market participation under transactions costs: Maize supply and fertilizer demand in Kenya. Food Policy 33, 318–328.
Alesina, A., Baqir, R., Easterly, W., 1999. Public goods and ethnic divisions. The Quarterly Journal of Economics 114, 1243–1284.
Alesina, A., Michalopoulos, S., Papaioannou, E., 2012. Ethnic inequality. CEPR Discussion Paper No. 9225.
Alkire, S., Santos, M.E., 2010. Ethiopia Country Briefing. Oxford Poverty & Human Development Initiative (OPHI), Multidimensional Poverty Index Country Briefing Series.
Amha, W., 2008. A Decade of Microfinance Institutions (MFIS) Development in Ethiopia: Growth, Performance, Impact and Prospect (2008‐2017), Occasional Paper. AEMFI Association of Ethiopian Microfinance Institutions, Addis Ababa.
Amhara Regional State, 2008. Document for establishment of Amhara Seed Enterprise. Arrow, K.J., 1969. The organization of economic activity: issues pertinent to the choice of market
versus nonmarket allocation. The analysis and evaluation of public expenditure: The PPB System 1, 59–73.
Astatike, M., Yimam, A., Tsegaye, D., Kefale, M., Mewa, D., Desalegn, T., Hassena, M., 2012. Experience of direct seed marketing in Amhara region (unpublished report). Local Seed Business, Addis Ababa.
Atilaw, A., Korbu, L., 2012. Roles of public and private seed enterprises, in: T/Wold, A., Fikre, A., Alemu, D., Desalgn, L., Kirub, A. (Eds.), The Defining Moments in Ethiopian Seed System. Ethiopian Institute of Agricultural Research, Addis Ababa, pp. 181–196.
Ayele, S., 2006. The industry and location impacts of investment incentives on SMEs start‐up in Ethiopia. Journal of International Development 18, 1–13. doi:10.1002/jid.1186
Banerjee, A., Duflo, E., 2011. Poor Economics: A Radical Rethinking of the Way to Fight Global Poverty. PublicAffairs, New York.
Banerjee, A.V., Duflo, E., 2007. The Economic Lives of the Poor. Journal of Economic Perspectives 21, 141–167.
Bator, F.M., 1958. The Anatomy of Market Failure. The Quarterly Journal of Economics 72, 351 –379. doi:10.2307/1882231
Baumüller, H., 2012. Facilitating agricultural technology adoption among the poor: The role of service delivery through mobile phones. ZEF Working Paper Series 93.
Baumüller, H., Husmann, C., von Braun, J., 2013. Innovative Business Approaches for the Reduction of Extreme Poverty and Marginality?, in: von Braun, J., Gatzweiler, F.W. (Eds.), Marginality. Addressing the Nexus of Poverty, Exclusion and Ecology. Springer, Dordrecht Heidelberg New York London, pp. 331–352.
Baumüller, H., Ladenburger, C., von Braun, J., 2011. Innovative Business Approaches for the Reduction of Extreme Poverty and Marginality? ZEF Working Paper 80.
Bellini, E., Ottaviano, G.I.P., Pinelli, D., Prarolo, G., 2013. Cultural Diversity and Economic Performance: Evidence from European Regions, in: Crescenzi, R., Percoco, M. (Eds.), Geography, Institutions and Regional Economic Performance, Advances in Spatial Science. Springer, Berlin Heidelberg, pp. 121–141.
Bendell, J., 2005. From Responsibility to Opportunity: CSR and the Future of Corporate Contributions to World Development. MHCi Monthly Feature.
Berhanu, A., 2009. The Ethiopian Extensions and the Farmer: A View from the Farm, in: Svein, E., Aspen, H., Teferra, B., Bekele, S. (Eds.), Proceedings of the 16th International Conference of Ethiopian Studies. NTNU, Trondheim, pp. 751–760.
Berhanu, K., 2013. CAADP Ethiopia: A new start? Futures Agricultures Working Paper 60, 28. Bernard, T., Spielman, D.J., 2009. Reaching the rural poor through rural producer organizations? A
study of agricultural marketing cooperatives in Ethiopia. Food Policy 34, 60–69. Bertrand, M., Mullainathan, S., Shafir, E., 2004. A Behavioral‐Economics View of Poverty. The
American Economic Review 94, 419–423. doi:10.2307/3592921
References
131
Bertrand, M., Mullainathan, S., Shafir, E., 2006. Behavioral economics and marketing in aid of decision making among the poor. Journal of Public Policy & Marketing 25, 8–23.
Beshir, A., 2005. Farmer‐based seed production an alternative for seed security: The Ethiopian Experience. SEED Info 8–10.
Bishaw, Z., Yonas, S., Belay, S., 2008. The status of the Ethiopian seed industry, in: Thijssen, M.H., Bishaw, Z., Beshir, A., de Boef, W.S. (Eds.), Farmers, Seeds and Varieties: Supporting Informal Seed Supply in Ethiopia. Wageningen International, Wageningen, pp. 23–31.
Blocker, C.P., Ruth, J.A., Sridharan, S., Beckwith, C., Ekici, A., Goudie‐Hutton, M., Rosa, J.A., Saatcioglu, B., Talukdar, D., Trujillo, C., 2013. Understanding poverty and promoting poverty alleviation through transformative consumer research. Journal of Business Research 66, 1195–1202.
Blowfield, M., Frynas, J.G., 2005. Setting New Agendas: Critical Perspectives on Corporate Social Responsibility in the Developing World. International Affairs 81, 499–513.
BoA SNNP, 2012. Fertilizer distribution data 1987/88‐2003/4 (EC). Government of Ethiopia, Addis Ababa.
Boddice, R., 2009. Forgotten antecedents: entrepreneurship, ideology and history, in: Ziegler, R. (Ed.), An Introduction to Social Entrepreneurship: Voices, Preconditions, Contexts. Edward Elgar Publishing, Cheltenham & Massachusetts, pp. 133–152.
Bornstein, D., 2007. How to change the world: social entrepreneurs and the power of new ideas. Oxford University Press US, New York.
Bromley, D., Anderson, G., 2012. Vulnerable People, Vulnerable States, Priorities for Development Economics. Routledge, London & New York.
Bromley, D.W., 2006. Sufficient Reason: Volitional Pragmatism and the Meaning of Economic Institutions. Princeton University Press, Princeton.
Brugmann, J., Prahalad, C.K., 2007. Cocreating business’s new social compact. Harvard Business Review 85, 80.
Business Dictionary, 2013. What is market? definition and meaning [WWW Document]. BusinessDictionary.com. URL http://www.businessdictionary.com/definition/market.html (accessed 11.6.13).
Byerlee, D., Spielman, D.J., Alemu, D., Gautam, M., 2007. Policies to promote cereal intensification in Ethiopia: A review of evidence and experience. IFPRI Discussion Paper 707.
Cabral, L., Poulton, C., Wiggins, S., Xhang, L., 2006. Reforming Agricultural Policies: Lessons from Four Countries. Futures Agricultures Working Paper 002, 1–40.
Carter, M.R., Barrett, C.B., 2006. The economics of poverty traps and persistent poverty: An asset‐based approach. Journal of Development Studies 42, 178–199.
Carter, M.R., Little, P.D., Mogues, T., Negatu, W., 2007. Poverty Traps and Natural Disasters in Ethiopia and Honduras. World Development 35, 835–856. doi:10.1016/j.worlddev.2006.09.010
Center for International Earth Science Information Network (CIESIN)/Columbia University, International Food Policy Research Institute (IFPRI), The World Bank, Centro Internacional de Agricultura Tropical (CIAT), 2011. Global Rural‐Urban Mapping Project, Version 1 (GRUMPv1): Population Count Grid. NASA Socioeconomic Data and Applications Center (SEDAC), Palisades, NY.
Central Statistical Agency (CSA), 2002. Ethiopia Child Labor Survey Report 2001, Statistical Bulletin. Central Statistical Agency, Addis Ababa.
Central Statistical Agency (CSA), 2007. Household Income, Consumption and Expenditure (HICE) Survey 2004/5. Central Statistical Agency, Addis Ababa.
Central Statistical Agency (CSA), 2008. Summary and Statistical report of the 2007 population and housing census. Central Statistical Agency, Addis Ababa.
Central Statistical Agency (CSA), 2012a. Household Consumption and Expenditure (HCE) Survey 2010/11. CSA, Addis Ababa.
References
132
Central Statistical Agency (CSA), 2012b. Welfare Monitoring Survey 2011. Statistical Report. Central Statistical Agency, Addis Ababa.
Central Statistical Agency (CSA), 2012c. Agriculture ‐ 2011, National Abstract Statistics. Central Statistical Agency, Addis Ababa.
Central Statistical Agency (CSA), Ethiopian Development Research Institute (EDRI), International Food Policy Research Institute (IFPRI) (Eds.), 2006. Atlas of the Ethiopian Rural Economy. CSA, EDRI & IFPRI, Addis Ababa, Washington.
Central Statistical Agency (CSA), Ministry of Finance and Economic Development (MoFED), 2011. Agricultural Sample Survey 2010‐11. Study Documentation. Central Statistical Agency & Ministry of Finance and Economic Development, Addis Ababa.
Certo, S.T., Miller, T., 2008. Social entrepreneurship: Key issues and concepts. Business Horizons 51, 267–271.
Cheung, S.N.S., 1998. The transaction costs paradigm. Economic Inquiry 36, 514–521. doi:10.1111/j.1465‐7295.1998.tb01733.x
Chikweche, T., Fletcher, R., 2010. Understanding factors that influence purchases in subsistence markets. Journal of Business Research 63, 643–650.
Ciaian, P., Kancs, d’Artis, Pokrivcak, J., 2008. Comparative Advantages, Transaction Costs and Factor Content in Agricultural Trade: Empirical Evidence from the CEE (2008 International Congress, August 26‐29, 2008, Ghent, Belgium No. 44135). European Association of Agricultural Economists.
Cissokho, M., 2012. Letter from African Civil Society Critical of Foreign Investment in African Agriculture at G8 Summit | Food First/Institute for Food and Development Policy [WWW Document]. Food First. URL http://www.foodfirst.org/en/Challenge+to+Green+Revolution+for+Africa (accessed 7.23.12).
Clay, D.C., Molla, D., Habtewold, D., 1999. Food aid targeting in Ethiopia: A study of who needs it and who gets it. Food Policy 24, 391–409.
Coase, R.H., 1937. The Nature of the Firm. Economica, New Series 4, 386–405. Coase, R.H., 1960. The problem of social cost. The Journal of Law and Economics III, 1–69. Coase, R.H., 1988. The Firm, the Market, and the Law. University of Chicago Press, Chicago & London. Cohen, G.A., 1993. Equality of What? On Welfare, Goods, and Capabilities, in: Nussbaum, M.C., Sen,
A. (Eds.), The Quality of Life. Clarendon Press, Oxford, pp. 9–29. Coll‐Black, S., Gilligan, D.O., Hoddinott, J., Kumar, N., Taffesse, A.S., Wiseman, W., 2011. Targeting
Food Security Interventions When “Everyone Is Poor”: The Case of Ethiopia’s Productive Safety Net Programme. ESSP II Working Paper 24, 1–40.
Collier, P., 2001. Implications of ethnic diversity. Economic Policy 16, 127–166. doi:10.1111/1468‐0327.00072
Collier, P., Dercon, S., Mackinnon, J., 2002. Density versus Quality in Health Care Provision: Using Household Data to Make Budgetary Choices in Ethiopia. World Bank Econ Rev 16, 425–448. doi:10.1093/wber/lhf003
Collier, P., Garg, A., 1999. On Kin Groups and Wages in the Ghanaian Labour Market. Oxford Bulletin of Economics and Statistics 61, 133–151. doi:10.1111/1468‐0084.00122
Collins, D., Morduch, J., Rutherford, S., Ruthven, O., 2009. Portfolios of the Poor: How the World’s Poor Live on $2 a Day. Princeton University Press, Princeton.
Commercial Bank of Ethiopia, 2012. Loans and Non‐Performing Loan Ratios for the first Quarter 2012.
Commons, J.R., 1931. Institutional Economics. The American Economic Review 21, 648–657. Commons, J.R., 1995. Legal Foundations of Capitalism. Transaction Publishers, New Brunswick. Conway, G., 2012. One Billion Hungry. Cornell University Press, New York. Crawford, E.W., Jayne, T.S., Kelly, V.A., 2006. Alternative approaches for promoting fertilizer use in
Africa. Agriculture & Rural Development Department, World Bank. Cross, J., Dolan, C., Rajak, D., Street, A., 2012. The BoP Approach: Sinner or Savior? Business Fights
Poverty.
References
133
Cui, G., Liu, Q., 2000. Regional market segments of China: opportunities and barriers in a big emerging market. Journal of consumer marketing 17, 55–72.
D’Andrea, G., Herrero, G., 2007. Understanding consumers and retailers at the Base of the Pyramid in Latin America, in: Rangan, V.K., Quelch, J.A., Herrero, G., Barton, B. (Eds.), Business Solutions for the Global Poor: Creating Social and Economic Value. John Wiley & Sons Inc, San Francisco, pp. 25–39.
D’Andrea, G., Stengel, E., Goebel‐Krstelj, A., 2004. 6 Truths about Emerging‐Market Consumers. Strategy+Business 58–69.
Dahrendorf, R., 2006. Homo sociologicus. Springer. Dalberg Global Development Advisors, 2012. Amhara Seed Enterprise Strategy Refresh. Dasgupta, P., 2009. Poverty Traps: Exploring the Complexity of Causation, in: von Braun, J., Vargas
Hill, R., Pandya‐Lorch, R. (Eds.), The Poorest and Hungry. Assessment, Analyses, and Actions. IFPRI, Washington, pp. 129–145.
De Bruyn, P., de Bruyn, J.N., Vink, N., Kirsten, J.F., 2001. How transaction costs influence cattle marketing decisions in the northern communal areas of Namibia. RAGR 40, 405–425. doi:10.1080/03031853.2001.9524961
De Onis, M., Blössner, M., Borghi, E., 2011. Prevalence and trends of stunting among pre‐school children, 1990–2020. Public Health Nutrition.
De Silva, H., Ratnadiwakara, D., 2008. Using ICT to reduce transaction costs in agriculture through better communication: A case study from Sri Lanka. LIRNEasia, Colombo, Sri Lanka.
Deaton, A., 2004. Measuring Poverty. Princeton Research Program in Development Studies Working Paper 564001.
Dees, J.G., 1998. The meaning of “social entrepreneurship” ‐ Comments and suggestions contributed from the Social Entrepreneurship Funders Working Group. The Fuqua School of Business, Duke University, Durham.
Degu, G., Mwangi, W., Verkuijl, H., Wondimu, A., 2000. An assessment of the adoption of seed and fertilizer packages and the role of credit in smallholder maize production in Sidama and North Omo Zones, Ethiopia. Cimmyt.
Deininger, K., Jin, S., 2006. Tenure security and land‐related investment: Evidence from Ethiopia. European Economic Review 50, 1245–1277.
Demographic and Health Survey (DHS) (Ed.), 2011. Ethiopia Demographic and Health Survey 2011. Preliminary Report. CSA & Measure DHS, ICF Macro Calverton, Addis Ababa, Maryland.
Demsetz, H., 1969. Information and Efficiency: Another Viewpoint. Journal of Law and Economics 12, 1–22.
Demsetz, H., 1995. The Economics of the Business Firm: Seven Critical Commentaries. Cambridge University Press.
Dercon, S., 2004. Growth and shocks: evidence from rural Ethiopia. Journal of Development Economics 74, 309–329.
Dercon, S., Christiaensen, L., 2011. Consumption risk, technology adoption and poverty traps: evidence from Ethiopia. Journal of Development Economics 96, 156–173.
Dercon, S., Gilligan, D.O., Hoddinott, J., Woldehanna, T., 2009. The impact of roads and agricultural extension on consumption growth and poverty in fifteen Ethiopian villages. Journal of Agricultural Economics 91, 1007–1021.
Dercon, S., Hoddinott, J., 2005. Livelihoods, Growth, and Links to Market Towns in 15 Ethiopian Villages. FCND Discussion Paper 194.
Dercon, S., Hoddinott, J., Woldehanna, T., 2006. Consumption, Vulnerability And Shocks In Rural Ethiopia, 1999‐2004. Ethiopian Journal of Economics 15, 55–84.
Dercon, S., Vargas Hill, R., 2009. Growth from agriculture in Ethiopia: Identifying key constraints. Paper prepared as part of a study on Agriculture and Growth in Ethiopia; Department for International Development, London.
Devereux, S., Sabates‐Wheeler, R., Slater, R., Tefera, M., Brown, T., Teshome, A., 2008. Ethiopia’s Productive Safety NEt Programme (PSNP): 2008 Assessment Report.
References
134
Diener, E., Suh, E.M., Lucas, R.E., Smith, H.L., 1999. Subjective well‐being: Three decades of progress. Psychological bulletin 125, 276.
Dissart, J.‐C., Bresson, F., Lallau, B., 2008. Assessing rural marginality: Contribution of the capability approach. Presented at the annual conference of the Human Development and Capability Association (HDCA), HDCA, New Delhi.
Doyal, L., Gough, I., 1991. A theory of human need. Macmillan, London. Dunne, R.J., 2005. Marginality: A Conceptual Extension, in: Dennis, Rutledge M. (Ed.), Marginality,
Power, and Social Structure: Issues in Race, Class, and Gender Analysis, Research in Race and Ethnic Relations. Elsevier, Oxford, pp. 11–28.
Easterly, W., 2007. The white man’s burden: why the west’s efforts to aid the rest have done so much ill and so little good. Oxford University Press, Oxford.
Easterly, W., Levine, R., 1997. Africa’s growth tragedy: policies and ethnic divisions. The Quarterly Journal of Economics 112, 1203–1250.
EEA/EEPRI, 2006. Evaluation of the Ethiopian agricultural extension with particular emphasis on the participatory demonstration and training extension system (PADETES). EEA/EEPRI (Ethiopian Economics Association/ Ethiopian Economic Policy Research Institute, Addis Ababa.
Eisenhardt, K.M., 1989. Building theories from case study research. The academy of management review 14, 532–550.
Elaydi, R., Harrison, C., 2010. Strategic motivations and choice in subsistence markets. Journal of Business Research 63, 651–655.
Ethiopian Investment Authority, 2012. Investment data. Ethiopian Seed Enterprise, 2012. Proposed selling price and cost comparison for the year 2002/3
[2011] (unpublished document). ESE, Addis Ababa. European Commission Joint Research Centre, Land Resource Management Unit, 2010. Travel time to
major cities: A global map of Accessibility [WWW Document]. Travel time to major cities: A global map of Accessibility. URL http://bioval.jrc.ec.europa.eu/products/gam/description.htm (accessed 8.1.13).
Fafchamps, M., Shilpi, F., 2008. Subjective welfare, isolation, and relative consumption. Journal of Development Economics 86, 43–60. doi:10.1016/j.jdeveco.2007.08.004
FAO, 2012a. The State of Food Insecurity in the World 2012. FAO, WFP, IFAD, Rome. FAO, 2012b. FAO Hunger Portal [WWW Document]. URL http://www.fao.org/hunger/en/ (accessed
10.29.12). FAO, 2012c. FAOSTAT [WWW Document]. FAOSTAT. URL
http://faostat3.fao.org/home/index.html#DOWNLOAD (accessed 8.2.12). Feder, G., Umali, D.L., 1993. The adoption of agricultural innovations: A review. Technological
Forecasting and Social Change 43, 215–239. doi:10.1016/0040‐1625(93)90053‐A Fernandez‐Cornejo, J., 2004. The Seed Industry in U.S. Agriculture: An Exploration of Data and
Information on Crop Seed Markets, Regulation, Industry Structure, and Research and Development. Agriculture Information Bulletin AIB‐786, 1–81.
FGGD, 2000. Global land area with soil constraints. FAO, Rome. Fligstein, N., 1996. Markets as Politics: A Political‐Cultural Approach to Market Institutions. American
Sociological Review 61, 656–673. doi:10.2307/2096398 Furtado, X., Smith, W.J., Whitfield, L., 2007. Ethiopia: Aid, Ownership and Sovereignty. Global
Governance Programme. Managing Aid Dependency Project Geg Working Paper 28. Gabre‐Madhin, E., 2001. Market institutions, transaction costs, and social capital in the Ethiopian
grain market. International Food Policy Research Institute, Washington D.C. Gabre‐Madhin, E.Z., 1999. Transaction costs and market institutions: grain brokers in Ethiopia. IFPRI
Markets Trade and Institutions Division, Discussion Paper. GAIN, 2012. GAIN ‐ Global Alliance for Improved Nutrition [WWW Document]. URL
http://jobs.gainhealth.org/ (accessed 7.31.12). Gatzweiler, F., Baumüller, H., Ladenburger, C., Von Braun, J., 2011. Marginality: Addressing the Root
Causes of Extreme Poverty. ZEF Working Paper Series 77.
References
135
Gatzweiler, F.W., Baumüller, H., 2013. Marginality—A Framework for Analyzing Causal Complexities of Poverty, in: von Braun, J., Gatzweiler, F.W. (Eds.), Marginality. Addressing the Nexus of Poverty, Exclusion and Ecology. Springer, Dordrecht Heidelberg New York London, pp. 27–40.
Gebreselassie, S., 2006. Intensification of smallholder agriculture in Ethiopia: options and scenarios, in: Future Agricultures Consortium Meeting at the Institute of Development Studies. Futures Agricultures.
Geda, A., 2008. The political economy of growth in Ethiopia, in: Ndulu, B.J., O’Connell, S.A., Bates, R.H., Collier, P., Soludo, C.C. (Eds.), The Political Economy of Economic Growth in Africa, 1960‐2000. Cambridge University Press, Cambridge, pp. 116–142.
Geertz, C., 1992. The Bazaar Economy: Information and Search in Peasant Marketing, in: Granovetter, M., Swedberg, R. (Eds.), The Sociology of Economic Life. Westview Press, Oxford, pp. 225–232.
Getachew, M., Kallaur, E., 2005. Youth Employment in Ethiopia: Overview and Inventory of Existing Policies and Programs. The World Bank, Washington D.C.
Gill, P., 2010. Famine and Foreigners: Ethiopia Since Live Aid. Oxford University Press, USA, New York. Goffin, K., Lemke, F., 2004. Uncovering your customer’s hidden needs. European Business Forum 18,
45–47. Gong, W., Parton, K., Cox, R.J., Zhou, Z., 2006. Transaction costs and cattle farmers’ choice of
marketing channels in China: A Tobit analysis. Management Research News 30, 47–56. doi:10.1108/01409170710724296
Gradl, C., Knobloch, C., 2010. Inclusive Business Guide: How to Develop Business and Fight Poverty. endeva, Berlin.
Gradl, C., Knobloch, C., 2011. Energize the BoP! Energy Business Model GEnerator for Low‐Income Markets. endeva, Berlin.
Granovetter, M., 1985. Economic action and social structure: the problem of embeddedness. American Journal of Sociology 91, 481–510.
Granovetter, M., 2005. The impact of social structure on economic outcomes. Journal of Economic Perspectives 19, 33–50.
Graw, V., Husmann, C., 2013. Mapping Marginality Hotspots – Geographical Targeting for Poverty Reduction, in: von Braun, J., Gatzweiler, F.W. (Eds.), Marginality. Addressing the Nexus of Poverty, Exclusion and Ecology. Spinger, Dordrecht Heidelberg New York London, pp. 69–84.
Graw, V., Ladenburger, C., 2012. Mapping Marginality Hotspots – Geographical Targeting for Poverty Reduction. ZEF Working Paper Series 88.
Gregoratti, C., 2011. Global nuts and local mangoes: a critical reading of the UNDP Growing Sustainable Business Initiative in Kenya. Agriculture and Human Values 28, 369–383.
Greif, A., 1992. Institutions and International Trade: Lessons from the Commercial Revolution. The American Economic Review 82, 128–133. doi:10.2307/2117388
Grow Africa, 2012. Grow Africa | Accelerating investments for sustainable growth in African agriculture [WWW Document]. URL http://growafrica.com/ (accessed 7.31.12).
Guarcello, L., Lyon, S., Rosati, F., 2006. The twin challenges of child labor and youth employment in Ethiopia. Understanding Children’s Work Programme Working Paper.
Guclu, A., Dees, J.G., Anderson, B.B., 2002. The process of social entrepreneurship: Creating opportunities worthy of serious pursuit. Center for Advancement of Social Entrepreneurship, The Fuqua School of Business, Duke University, Durham.
Guesalaga, R., Marshall, P., 2008. Purchasing power at the bottom of the pyramid: differences across geographic regions and income tiers. Journal of Consumer Marketing 25, 413–418.
Guillén Royo, M., 2007. Consumption and wellbeing: Motives for consumption and needs satisfiers in Peru (phd). University of Bath.
Gurung, G.S., Kollmair, M., 2005. Marginality: Concepts and their Limitations. IP6 Working Paper 4. Habyarimana, J., Humphreys, M., Posner, D.N., Weinstein, J.M., 2007. Why does ethnic diversity
undermine public goods provision? American Political Science Review 101, 709–725.
References
136
Hamel, G., Prahalad, C.K., 1996. Competing for the Future. Harvard Business Press, Watertown, Massachusetts.
Hammond, A.L., Kramer, W.J., Katz, R.S., Tran, J.T., Walker, C., 2007. The Next 4 Billion: Market Size and Business Size at the Base of the Pyramid. World Resources Institute and International Finance Corporation, Washington D.C.
Hardin, R., 1995. One for all: The logic of group conflict. Princeton University Press, Princeton. Hart, S.L., 2005. Capitalism at the Crossroads: The Unlimited Business Opportunities in Solving the
World’s Most Difficult Problems. Wharton School Publishing, New Jersey. Hartley, J., 2004. Case Study Research, in: Cassell, C., Symon, G. (Eds.), Essential Guide to Qualitative
Methods in Organizational Research. SAGE, pp. 323–333. HarvestChoice, 2001. Farming System Code. International Food Policy Research Institute (IFPRI) &
University of Minnesota, Washington D.C. & St. Paul, MN. Haugh, H., 2006. Social Enterprise: Beyond Economic Outcomes and Individual Returns, in: Social
Entrepreneurship. Palgrave Macmillan, New York, pp. 180–205. Haupt, S., Krämer, A., 2012. Bringing Medicines to Low‐income Markets. A guide to creating inclusive
business models for pharmaceutical companies. GIZ, Bonn & Eschborn. Heidhues, F., Brüntrup, M., 2003. Subsistence agriculture in development: Its role in processes of
structural change, in: Abele, Steffen, Frohberg, K. (Eds.), Subsistence Agriculture in Central and Eastern Europe: How to Break the Vicious Circle. IAMO, Halle (Saale), pp. 1–27.
Heisey, P.W., Norton, G.W., 2007. Fertilizers and other farm chemicals, in: Pingali, P., Evenson, R. (Eds.), Agricultural Development: Farmers, Farm Production and Farm Markets. Elsevier, Oxford & Amsterdam, pp. 2741–2777.
Heritage Foundation, 2013. 2013 Index of Economic Freedom [WWW Document]. 2013 Index of Economic Freedom. URL http://www.heritage.org/index/book/methodology (accessed 7.20.12).
Hernandez, M.A., Torero, M., 2013. Market concentration and pricing behavior in the fertilizer industry: a global approach. Agricultural Economics 44, 723–734. doi:10.1111/agec.12084
Hill, R.P., Gaines, J., 2007. The consumer culture of poverty: behavioral research findings and their implications in an ethnographic context. Journal of American Culture 30, 81–95.
Hill, R.P., Martin, K.D., Chaplin, L.N., 2012. A tale of two marketplaces: Consumption restriction, social comparison, and life satisfaction. Marketing Letters 23, 731–744.
Hoddinott, J., Rosegrant, M.W., Torero, M., 2012. Investments to reduce hunger and undernutrition. Challenge Paper hunger and malnutrition, Paper prepared for the Global Copenhagen Consensus 2012. Copenhagen Consensus 2012, Washington D.C.
Holloway, G., Nicholson, C., Delgado, C., Staal, S., Ehui, S., 2000. Agroindustrialization through institutional innovation Transaction costs, cooperatives and milk‐market development in the east‐African highlands. Agricultural Economics 23, 279–288.
Horsfield, G., 2009. The Poverty Penalty: The Price of Being Poor. LAP Lambert Academic Publishing, Saarbrpücken.
Houthakker, H.S., 1957. An international comparison of household expenditure patterns, commemorating the centenary of Engel’s law. Econometrica 25, 532–551.
Huang, J., Rozelle, S., 2008. China: Maize Economy, Incentives and Policies, in: Gulati, Dixon, J.M. (Eds.), Maize in Asia: Changing Markets and Incentives. Academic Foundation, pp. 93–186.
Hurni, H., 1998. Agroecological Belts of Ethiopia. Soil Conservation Research Program, Addis Ababa. IEG Public Sector Evaluation, 2011. Project Performance Report Ethiopia Fertilizer Support Project,
WorldBank Report. The WorldBank, Washington D.C. ILO, 2013. Child Labour [WWW Document]. Child Labour. URL
http://www.ilo.org/global/topics/child‐labour/lang‐‐en/index.htm (accessed 1.7.13). International Monetary Fund, 2012. World economic outlook database [WWW Document]. World
Economic Outlook. URL http://www.imf.org/external/data.htm (accessed 7.25.12). ISSD, 2013. Direct seed marketing: Additional channel to enhance seed marketing and distribution
system in Ethiopia.
References
137
Jackson, L.F., 1984. Hierarchic Demand and the Engel Curve for Variety. The Review of Economics and Statistics 66, 8–15. doi:10.2307/1924690
Jayne, T.S., Govereh, J., Wanzala, M., Demeke, M., 2003. Fertilizer market development: a comparative analysis of Ethiopia, Kenya, and Zambia. Food Policy 28, 293–316. doi:10.1016/j.foodpol.2003.08.004
Jayne, T.S., Strauss, J., Yamano, T., Molla, D., 2001. Giving to the Poor? Targeting of Food Aid in Rural Ethiopia. World Development 29, 887–910. doi:10.1016/S0305‐750X(01)00011‐0
Jayne, T.S., Strauss, J., Yamano, T., Molla, D., 2002. Targeting of food aid in rural Ethiopia: chronic need or inertia? Journal of Development Economics 68, 247–288. doi:10.1016/S0304‐3878(02)00013‐5
Jenkins, B., Ishikawa, E., Geaneotes, A., John, P., 2010. Inclusive Business Solutions: Expanding Opportunity and Access at the Base of the Pyramid (Report of a Conference held October 7–8, 2010 in Washington, DC). International Finance Corporation, Washington D.C.
Karamchandani, A., Kubzansky, M., Lalwani, N., 2011. Is the Bottom Of the Pyramid Really for You? Harvard Business Review 89, 107–111.
Karnani, A., 2007. The Mirage of Marketing to the Bottom of the Pyramid: How the private sector can help alleviate poverty. California Management Review 49, 90–111.
Karnani, A., 2008. Help, don’t romanticize, the poor. Business Strategy Review 19, 48–53. Karnani, A., 2009a. Romanticizing the poor. Stanford Social Innovation Review 7, 38–43. Karnani, A., 2009b. The Bottom of the Pyramid Strategy for Reducing Poverty: A Failed Promise. UN
DESA Working Paper. Kedir, A.M., 2005. The Economics of Rotating Savings and Credit Association: Evidence from Ethiopia.
International Conference on African Development Archives. Paper 93. Kedir, A.M., Disney, R., Dasgupta, I., 2011. Why use ROSCAs when you can use banks? Theory and
evidence from Ethiopia. Discussion paper series Forschungsinstitut zur Zukunft der Arbeit 5767, 1–32.
Key, N., Sadoulet, E., Janvry, A. de, 2000. Transactions Costs and Agricultural Household Supply Response. American Journal of Agricultural Economics 82, 245–259.
Kherallah, M., Kirsten, J.F., 2002. The new institutional economics: applications for agricultural policy research in developing countries. Agrekon 41, 111–134.
Khwaja, A.I., 2009. Can good projects succeed in bad communities? Journal of Public Economics 93, 899–916.
Kirchgeorg, M., Winn, M.I., 2006. Sustainability marketing for the poorest of the poor. Business Strategy and the Environment 15, 171–184. doi:10.1002/bse.523
Kotler, P., Armstrong, G., 2010. Principles of Marketing, 13th ed. Pearson Education, New Jersey. Kyeyamwa, H., Speelman, S., Van Huylenbroeck, G., Opuda‐Asibo, J., Verbeke, W., 2008. Raising
offtake from cattle grazed on natural rangelands in sub‐Saharan Africa: a transaction cost economics approach. Agricultural Economics 39, 63–72. doi:10.1111/j.1574‐0862.2008.00315.x
Landes, D.S., 1999. The wealth and poverty of nations: Why some are so rich and some so poor. WW Norton & Company, New York.
Lanvin, B., 2005. The next two billion. Communications and Strategies 2, 11–18. Lerman, Z., 2003. Institutions and technologies for subsistence agriculture: How to increase
commercialization, in: Abele, S., Frohberg, K. (Eds.), Subsistence Agriculture in Central and Eastern Europe: How to Break the Vicious Circle? IAMO, Halle (Saale), p. 28.
Levy, P.S., Lemeshow, S., 2008. Sampling of populations: methods and applications. Wiley, New York Chichester Weinheim Brisbane Singapore Toronto.
Lewit, E.M., Kerrebrock, N., 1997. Population‐Based Growth Stunting. The Future of Children. Children and Poverty 7, 149–156.
Lin, J.Y., 2012. New Structural Economics: A Framework for Rethinking Development and Policy. The World Bank, Washington D.C.
References
138
Little, P., Behnke, R., McPeak, J., Gebru, G., 2010. Future Scenarios for Pastoral Development in Ethiopia, 2010‐2025, Pastoral Economic Growth and Development Policy Assessment, Ethiopia. DfID, London.
Louwaars, N., 2010. The formal seed sector in Ethiopia. A study to strengthen its performance and impact. Local Seed Business Newsletter 12–13.
LSB, 2011. Editorial. Local Seed Business Newsletter 1. Magnani, R.J., 1997. Sampling guide. Food Security and Nutrition Monitoring (IMPACT) Project,
Washington D.C. Mair, J., Martí, I., 2006. Social entrepreneurship research: A source of explanation, prediction, and
delight. Journal of World Business 41, 36–44. Makhura, M.T., 2001. Overcoming transaction costs barriers to market participation of smallholder
farmers in the Northern Province of South Africa. University of Pretoria. Maltsoglou, I., Tanyeri‐Abur, A., 2005. Transaction costs, institutions and smallholder market
integration: Potato producers in Peru. ESA Working Paper. Mankiw, N.G., Romer, D., Weil, D.N., 1992. A contribution to the empirics of economic growth. The
quarterly journal of economics 107, 407–437. Marcus, H.G., 2002. A History of Ethiopia. Updated Edition. University of California Press, London. Martin, K.D., Hill, R.P., 2012. Life satisfaction, self‐determination, and consumption adequacy at the
bottom of the pyramid. Journal of Consumer Research 38, 1155–1168. Martorell, R., 1999. The nature of child malnutrition and its long‐term implications. Food & Nutrition
Bulletin 20, 288–292. Marx, K., 1996. Capital: A Critique of Political Economy. Regnery Gateway, Washington D.C. Masfin, M., 2012. Escalating Price affects Fertilizer Use and Farm Productivity. Addis Fortune. Masten, S.E., 2001. Transaction‐cost economics and the organization of agricultural transactions.
Advances in Applied Microeconomics 9, 173–195. doi:10.1016/S0278‐0984(00)09050‐7 Matungul, P.M., Lyne, M.C., Ortmann, G.F., 2001. Transaction costs and crop marketing in the
communal areas of Impendle and Swayimana, KwaZulu‐Natal. Development Southern Africa 18, 347.
Matz, J.A., 2013. Ethnicity, Marriage and Family Income. ZEF Discussion Papers on Development Policy 180, 1–42.
Mauri, A., 2006. The Role of Financial Intermediation in the Mobilisation and Allocation of Household Savings in Ethiopia: Interlinks Between Organized and Informal Circuits (SSRN Scholarly Paper No. ID 943426). Social Science Research Network, Rochester, NY.
Mauro, P., 1995. Corruption and Growth. The Quarterly Journal of Economics 110, 681–712. doi:10.2307/2946696
Max‐Neef, M., 1992. Development and human needs, in: Ekins, A., Max‐Neef, M. (Eds.), Real‐Life Economics. Understanding Wealth Creation. Routledge, London & New York.
McDonough, W., Braungart, M., 2002. Cradle to Cradle: Remaking the Way We Make Things, 1st ed. North Point Press, New York.
Mehretu, A., Pigozzi, B.W., Sommers, L.M., 2000. Concepts in social and spatial marginality. Geografiska Annaler. Series B. Human Geography 82, 89–101.
Mekuria, I., 2004. Ethiopia: Losses Drive Unilever Out of Ethiopia. Addis Fortune. Mendola, M., 2007. Agricultural technology adoption and poverty reduction: A propensity‐score
matching analysis for rural Bangladesh. Food Policy 32, 372–393. doi:10.1016/j.foodpol.2006.07.003
Mendoza, R.U., 2011. Why do the poor pay more? Exploring the poverty penalty concept. Journal of International Development 23, 1–28. doi:10.1002/jid.1504
Meng, E.C.H., Hu, R., Shi, X., Zhang, S., 2006. Maize in China. Production Systems, Constraints and Research Priorities. CIMMYT, Mexico, D.F.
Merges, R.P., 2004. A new dynamism in the public domain. The University of Chicago Law Review 183–203.
References
139
Michalopoulos, S., Papaioannou, E., 2014. National institutions and subnational development in Africa. The Quarterly Journal of Economics 129, 151–213.
Miguel, E., Gugerty, M.K., 2005. Ethnic diversity, social sanctions, and public goods in Kenya. Journal of Public Economics 89, 2325–2368.
Millennium Ecosystem Assessment, 2005. Ecosystems and Human Well‐Being: Synthesis. Island Press.
Ministry of Agriculture, 2010. Ethiopia’s Agricultural Sector Policy and Investment Framework (PIF) 2010‐2020.
Ministry of Agriculture, 2012. Revised Productive Safety Net and Household Asset Building Programs Annual Work Plan and Budget for 2012/13 (2005 EFY).
Ministry of Agriculture, 2013. Data on demand and supply of improved seed of different crops. Ministry of Finance and Economic Development, 2012. Ethiopia’s Progress Towards Eradicating
Poverty: An Interim Report on Poverty Analysis Study (201/2011). Ministry of Finance and Economic Development (MoFED), 2010. Growth and Transformation Plan
(GTP) 2010/11‐2014/15. Ministry of Finance and Economic Development of the Federal Democratic Republic of Ethiopia, Addis Ababa.
Ministry of Finance and Economic Development (MoFED), 2011. Public Financial Institutions in Ethiopia [WWW Document]. URL http://www.mofed.gov.et/English/Information/Pages/FinancialInstitutions.aspx (accessed 8.23.12).
Ministry of Finance and Economic Development (MoFED), 2012. National Ependiture Data. Ministry of Health, 2010. Health Sector Development Programme IV 2010/11‐2014/15. Ministry of
Health, Federal Democratic Republic of Ethiopia, Addis Ababa. Mitik, L., Lemma, S., Behute, B., 2011. Alternative Policy Strategy to ADLI for Ethiopia: A Dynamic CGE
Framework Analysis, in: 8th PEP General Meeting in Dakar, Senegal. PEP Network, Dakar. Montalvo, J.G., Reynal‐Querol, M., 2002. Why Ethnic Fractionalization? Polarization, Ethnic Conflict
and Growth. Working Paper. Montalvo, J.G., Reynal‐Querol, M., 2005a. Ethnic diversity and economic development. Journal of
Development economics 76, 293–323. Montalvo, J.G., Reynal‐Querol, M., 2005b. Ethnic polarization, potential conflict, and civil wars.
Potential Conflict, and Civil Wars. Mulky, A.G., 2011. Marketing to the bottom of the pyramid and subsistence markets ‐ a research
agenda. Acta Universatitis Agriculturae Et Silviculturae Mendelianae Brunesis LIX, 9–14. National Bank of Ethiopia, 2011. Directives No. MFA/NBEBILLS/001/2011. Nelson, A., 2008. Travel time to major cities: A global map of Accessibility. European Commission. Nelson, J., Ishikawa, E., Geaneotes, A., 2009. Developing Inclusive Business Models: A Review of
Coca‐Cola’s Manual Distribution Centers in Ethiopia and Tanzania. Harvard Kennedy School and International Finance Corporation.
New Alliance for Food Security & Nutrition, 2013. New Alliance for Food Security and Nutrition 2013 Progress Report. DFID, AU Commission and WEF, London.
Ngugi, D., 2002. Harmonization of Seed Policies and Regulations in East Africa, in: Rohrbach, D., Howard, J. (Eds.), Seed Trade Liberalization and Agro‐Biodiversity in Sub‐Saharan Africa. Presented at the Workshop on Impacts of Seed Trade Liberalization on Access to and Exchange of Agro‐Biodiversity, ICRISAT, Matopos Research Station, Bulawayo, Zimbabwe, pp. 101–120.
Nicholls, A., 2006. Social entrepreneurship: new models of sustainable social change. Oxford University Press, Oxford.
North, D.C., 1989. Institutions and economic growth: An historical introduction. World Development 17, 1319–1332. doi:10.1016/0305‐750X(89)90075‐2
North, D.C., 1990. Institutions, Institutional Change and Economic Performance. Cambridge University Press, Cambridge.
North, D.C., 1993. The New Institutional Economics and Development. Essay in Economic History.
References
140
North, D.C., 1994. Economic Performance Through Time. The American Economic Review 84, 359–368.
North, D.C., 2005. Understanding the Process of Economic Change. Princeton University Press, Princeton.
Nussbaum, M.C., 1997. Capabilities and human rights. Fordham Law Review 66, 273–300. Nussbaum, M.C., 2001. Women and human development: The capabilities approach. Cambridge
University Press, Cambridge. OECD, 2012. World Energy Outlook: 2012. Organization for Economic Cooperation & Development,
Paris. Ohno, K., 2009. Ethiopia: Political Regime and Development Policies. Tokyo: Graduate Institute. Ostrom, E., 1990. Governing the Commons: The Evolution of Institutions for Collective Action.
Cambridge University Press, Cambridge, Massachusetts. Ouma, E., Jagwe, J., Obare, G.A., Abele, S., 2010. Determinants of smallholder farmers’ participation
in banana markets in Central Africa: the role of transaction costs. Agricultural Economics 41, 111–122. doi:10.1111/j.1574‐0862.2009.00429.x
Oxford English Dictionary, 1989. Oxford English Dictionary. Oxford University Press, Oxford. Pankhurst, R., 2008. The Ethiopians: A History, Peoples of Africa. Blackwell Publishing, Oxford. Park, A., 2008. Agricultural Development in China: Lessons for Ethiopia. Briefing note prepared for
the DFID funded study “Understanding the constraints to continued rapid growth in Ethiopia: the role of agriculture.”
Peck, D., 2010. AEMFI Strategic Plan (2010‐2014). Making a difference to Ethiopia’s microfinance industry. The Association of Ethiopian Microfinance Institutions, Addis Ababa.
Peoples Republic of China State Council, 2013. National plan for Development of the Modern Crop Seed Industry (2012‐2020). Unofficial translation.
Piacentini, M., Hamilton, K., 2013. Consumption lives at the bottom of the pyramid. Marketing Theory 13, 397–400.
Pingali, P., Khwaja, Y., Meijer, M., 2005. Commercializing small farms: Reducing transaction costs, in: The Future of Small Farms. Proceedings of a Research Workshop. Wye, UK, June 26‐29, 2005. IFPRI, Washington D.C., pp. 61–74.
Pingali, P., Schneider, K., Zurek, M., 2013. Poverty, Agriculture and the Environment: The Case of Sub‐Saharan Africa, in: von Braun, J., Gatzweiler, F.W. (Eds.), Marginality. Addressing the Nexus of Poverty, Exclusion and Ecology. Spinger, Dordrecht Heidelberg New York London, pp. 151–168.
Polak, P., Warwick, M., 2013. The business solution to poverty designing products and services for three billion new customers. Berrett‐Koehler Publishers, Inc., San Francisco.
Porter, M.E., 1985. Competitive advantage: creating and sustaining superior performance. The Free Press, New York.
Porter, M.E., 2002. What is strategy? Strategy for business: A reader 10–31. Porter, M.E., Kramer, M.R., 2006. Strategy and Society: The Link Between Competitive Advantage and
Corporate Social Responsibility. Harvard Business Review 84, 78–92. Porter, M.E., Kramer, M.R., 2011. The Big Idea: Creating Shared Value. Harvard Business Review
January/February. Posner, R.A., 1980. A Theory of Primitive Society, with Special Reference to Law. Journal of Law and
Economics 23, 1–54. Pradhan, M., Ravallion, M., 2000. Measuring poverty using qualitative perceptions of consumption
adequacy. Review of Economics and Statistics 82, 462–471. Prahalad, C.K., 2010. The fortune at the bottom of the pyramid: eradicating poverty through profits
(Revised and Updated 5th Anniversary Edition). Wharton School Publishing, New Jersey. Prahalad, C.K., Hart, S.L., 2002. The Fortune at the Bottom of the Pyramid. strategy+business. Proctor, F.J., Vorley, B., 2008. Innovation in Business Models and Chainwide Learning for Market
Inclusion of Smallholder Producers. Agribusiness and Management Issues 8, 22–38.
References
141
Rangan, V.K., Chu, M., Petkoski, D., 2011. Segmenting the Base of the Pyramid. Harvard Business Review 89, 113–117.
Rashid, S., Assefa, M., Ayele, G., 2007. Distortions to Agricultural Incentives in Ethiopia. Agricultural Distortions Working Paper 48519, 1–46.
Ravallion, M., Chen, S., Sangraula, P., 2009. Dollar a day revisited. The World Bank Economic Review 23, 163–184.
Rawls, J., 1999. A theory of justice, revised edition. ed. Belknap Press, Cambridge, Massachusetts. Reficco, E., Márquez, P., 2012. Inclusive Networks for Building BOP Markets. Business Society 51,
512–556. doi:10.1177/0007650309332353 Reynal‐Querol, M., 2002. Ethnicity, political systems, and civil wars. Journal of Conflict Resolution 46,
29–54. Richman, B.D., Macher, J., 2006. Transaction Cost Economics: An Assessment of Empirical Research in
the Social Sciences. Duke Law School Legal Studies Research Papers 115. Rindfleisch, A., Heide, J.B., 1997. Transaction cost analysis: past, present, and future applications. the
Journal of Marketing 61, 30–54. Ringheim, K., Teller, C., Sines, E., 2009. Ethiopia at a Crossroads: Demography. Gender and
Development. Policy Brief 1–6. Rohrbach, D., Minde, I., Howard, J., 2003. Looking beyond national policies: Regional harmonization
of seed markets, in: Rohrbach, D., Howard, J. (Eds.), Seed Trade Liberalization and Agro‐Biodiversity in Sub‐Saharan Africa: Proceedings of a Workshop on Impacts of Seed Trade Liberalization on Access to and Exchange of Agro‐Biodiversity, 5‐6 Dec 2002, Matopos Research Station, Bulawayo, Zimbabwe. ICRISAT, Bulawayo, pp. 14–36.
Romer, P.M., 1986. Increasing returns and long‐run growth. Journal of Political Economy 94, 1002–1037.
Rothman, K.J., Greenland, S., Lash, T.L., 2008. Modern Epidemiology, 3rd ed. Lippincott Williams & Wilkins, Philadelphia, PA.
Rujis, A., Schweigman, C., Lutz, C., 2004. The impact of transport‐and transaction‐cost reductions on food markets in developing countries: evidence for tempered expectations for Burkina Faso. Agricultural Economics 31, 219–228.
Runciman, W.G., 1966. Relative deprivation & social justice: study attitudes social inequality in 20th century England. University of California Press, Los Angeles.
Rutstein, S.O., Johnson, K., 2004. The DHS Wealth Index, DHS Comparative Reports. ORC Macro, Calverton.
Saith, R., 2007. Social exclusion: the concept and application to developing countries, in: Stewart, F., Saith, R., Harriss‐White, B. (Eds.), Defining Poverty in the Developing World. Palgrave Macmillan, Basingstoke.
Sapienza, P., Zingales, L., Guiso, L., 2006. Does culture affect economic outcomes? Journal of Economic Perspectives 20, 23–48.
Schwittay, A., 2009. Taking Prahalad High‐Tech. Journal of Corporate Citizenship 2009, 97–107. Schwittay, A., 2011. The marketization of poverty. Current Anthropology 52, 71–82. Seagle, C., Christensen, L.J., 2011. Case study: Procter & Gamble’s Pur. Financial Times. Seelos, C., Mair, J., 2007. Profitable business models and market creation in the context of deep
poverty: a strategy view. Academy of Management Perspectives 21, 49–63. Sen, A., 1981. Poverty and famines: an essay on entitlement and deprivation. Oxford University
Press, Oxford. Sen, A., 1992. Inequality reexamined. Oxford University Press, Oxford. Sen, A., 1993. Capability and Well‐Being, in: The Quality of Life. Oxford University Press, Oxford, pp.
30–53. Sen, A., 1999. Development as freedom. Oxford University Press, Oxford. Sen, A., 2000. Social exclusion: Concept, application, and scrutiny. Asian Development Bank. Seyoum Taffesse, A., Dorosh, P., Asrat, S., 2011. Crop Production in Ethiopia: Regional Patterns and
Trends. ESSP Working Paper 0016.
References
142
Sharp, K., Brown, T., Teshome, A., 2006. Targeting Ethiopia’s Productive Safety Net Programme (PSNP).
Shelanski, H.A., Klein, P.G., 1995. Empirical Research in Transaction Cost Economics: A Review and Assessment. Journal of Law, Economics, & Organization 11, 335–361.
Shukla, S., Bairiganjan, S., 2011. The Base of Pyramid distribution challenge: Evaluating alternate distribution models of energy products for rural Base of Pyramid in India. XIFMR Research, Centre for Development Finance.
Simanis, E., 2010. Needs, needs everywhere, but not a market to tap: Market creation at the Base of the Pyramid”, in: Next Generation Business Strategies for the Base of the Pyramid. New Approaches for Building Mutual Value. FT Press, New Jersey, pp. 103–126.
Simanis, E., 2012. At the Base of the Pyramid. When selling to poor consumers, companies need to begin by doing something basic: They need to create the market. Wall Street Journal.
Singh, I., Squire, L., Strauss, J., 1986. Agricultural household models: extensions, applications, and policy. Johns Hopkins University Press, Baltimore, Maryland.
Sinha, K., Goodman, J., Mookerjee, A.S., Quelch, J.A., 2007. Marketing programs to reach India’s underserved., in: Rangan, V.K., Quelch, J.A., Herrero, G., Barton, B. (Eds.), Business Solutions for the Global Poor: Creating Social and Economic Value. John Wiley & Sons Inc, San Francisco, pp. 40–49.
Skoufias, E., Quisumbing, A.R., 2005. Consumption insurance and vulnerability to poverty: a synthesis of the evidence from Bangladesh, Ethiopia, Mali, Mexico and Russia. The European journal of development research 17, 24–58.
Slater, S.F., Mohr, J.J., Sengupta, S., 2010. Market Orientation, in: Wiley International Encyclopedia of Marketing. John Wiley & Sons, Ltd.
Somda, J., Tollens, E., Kamuanga, M., 2005. Transaction costs and the marketable surplus of milk in smallholder farming systems of The Gambia. Outlook on Agriculture 34, 189–195. doi:10.5367/000000005774378784
Sommers, L.M., Mehretu, A., Pigozzi, B.W.., 1999. Towards typologies of socio. economic marginality: North/South comparisons, in: Marginality in Space–past, Present and Future: Theoretical and Methodological Aspects of Cultural, Social and Economic Parameters of Marginal and Critical Regions. Ashgate Publishing Ltd., pp. 7–24.
Spielman, D.J., Kelemwork, D., Alemu, D., 2011. Seed, Fertilizer, and Agricultural Extension in Ethiopia. Ethiopia Strategy Support Program II (ESSP II) 20.
Spolaore, E., Wacziarg, R., 2013. Long‐Term Barriers to Economic Development. National Bureau of Economic Research Working Paper 19361, 1–67.
Spulber, D.F., 1999. Market microstructure: intermediaries and the theory of the firm. Cambridge University Press, Cambridge.
Staal, S., Delgado, C., Nicholson, C., 1997. Smallholder dairying under transactions costs in East Africa. World Development 25, 779–794. doi:10.1016/S0305‐750X(96)00138‐6
Steenkamp, J.‐B.E., Burgess, S.M., 2002. Optimum stimulation level and exploratory consumer behavior in an emerging consumer market. International Journal of Research in Marketing 19, 131–150.
Stepanek, J.C., 1999. Lessons from Ethiopia’s High‐input Technology Promotion Program: How the Organization of the Fertilizer Subsector Affects Maize Productivity. Michigan State University. Department of Agricultural Economics.
Stewart, F., 1985. Basic needs in developing countries. Johns Hopkins University Press, Baltimore, Maryland.
Stifel, D.C., Minten, B., Dorosh, P., 2003. Transactions Costs and Agricultural Productivity: Implications of Isolation for Rural Poverty in Madagascar. IFPRI MSSD Discussion Paper 56.
Stiglitz, J.E., 1989. Markets, Market Failures, and Development. The American Economic Review 79, 197–203.
Strahler, A.H., Strahler, A.N., 2005. Physical geography: science and systems of the human environment. John Wiley, New York.
References
143
Streeten, P., Burki, S.J., 1978. Basic needs: Some issues. World Development 6, 411–421. doi:10.1016/0305‐750X(78)90116‐X
Subrahmanyan, S., Gomez‐Arias, J.T., 2008. Integrated approach to understanding consumer behavior at bottom of pyramid. Journal of Consumer Marketing 25, 402–412.
Sutton, J., Kellow, N., 2010. An Enterprise Map of Ethiopia. International Growth Centre. Swedberg, R., 1994. Markets as Social Structures, in: Smelser, Neil J., Swedberg, R. (Eds.), The
Handbook of Economic Sociology. Princepton University Press, Princeton, pp. 255–282. Syrquin, M., 2011. GDP as a Measure of Economic Welfare. ICER Working Papers. Tabellini, G., 2010. Culture and institutions: economic development in the regions of Europe. Journal
of the European Economic Association 8, 677–716. Tadele, Y., 2013a. New Directive to Improve Farmer Input Purchasing. Addis Fortune. Tadele, Y., 2013b. Fertiliser Blending to Increase Crop Production. Addis Fortune. Taylor, C.L., Hudson, M.C., 1970. World Handbook of Political and Social Indicators. Yale University
Press, New Haven. Teklewold, A., Alemu, D., Kiyoshi, S., Kirub, A. (Eds.), 2012. Seed Demand Assessment. Practices,
Challenges, and Options, FRG II Project Empowering Farmers’ Innovation. EIAR/FRG, Addis Ababa.
The Chicago Council on Global Affairs, 2012. Food Security at the G8 [WWW Document]. URL http://www.thechicagocouncil.org/globalagdevelopment/gad/Events/2012/Sessions/Food_Security.aspx (accessed 7.23.12).
The Chicago Council on Global Affairs, n.d. The 3rd Annual Symposium on Global Agriculture and Food Security.
The Economist, 2011. The world in figures: Countries: Top growers. The Economist. The Embassy of Ethiopia in China, 2013. Horticulture and Floriculture Industry: Ethiopia’s
Comparative Advantage [WWW Document]. URL http://www.ethiopiaemb.org.cn/bulletin/05‐1/003.htm (accessed 2.26.14).
The Montpellier Panel, 2013. Sustainable Intensification: A New Paradigm for African Agriculture. London.
The United Nations Economic and Social Council, 2007. The Agricultural Development Led Industrialization (ADLI) strategy [WWW Document]. Development Strategies That Work. Country experiences presented at the ECOSOC Annual Ministerial Review. URL http://webapps01.un.org/nvp/indpolicy.action?id=124 (accessed 7.24.12).
The White House, 2012. Fact Sheet: G‐8 Action on Food Security and Nutrition [WWW Document]. URL http://www.whitehouse.gov/the‐press‐office/2012/05/18/fact‐sheet‐g‐8‐action‐food‐security‐and‐nutrition (accessed 7.23.12).
The World Bank, 2009. World Development Report 2009: Reshaping Economic Geography. World Bank, Washington D.C.
The World Bank, 2011. World Development Report 2012: Gender Equality and Development. World Bank, Washington D.C.
The World Bank, 2012a. PovcalNet ‐ an online poverty analysis tool [WWW Document]. URL http://iresearch.worldbank.org/PovcalNet/index.htm (accessed 1.16.13).
The World Bank, 2012b. World Development Indicators 2012. World Bank, Washington D.C. The World Bank, 2012c. World dataBank [WWW Document]. World dataBank African Development
Indicators. URL http://databank.worldbank.org/ddp/home.do?Step=2&id=4&DisplayAggregation=N&SdmxSupported=N&CNO=1147&SET_BRANDING=YES (accessed 12.6.12).
The World Bank, International Finance Corporation, 2011. Doing Business ‐ Making a difference for entrepreneurs [WWW Document]. Doing Business. URL http://www.doingbusiness.org/ (accessed 7.24.12).
The World Bank, International Finance Corporation, 2012. Doing Business ‐ Doing Business in a More Transparent World [WWW Document]. Doing Business. URL http://www.doingbusiness.org/ (accessed 7.24.12).

References
144
The World Bank, International Finance Corporation, 2013. Doing Business ‐ Smarter Regulations for Small and Medium‐Size Enterprises [WWW Document]. Doing Business. URL http://www.doingbusiness.org/ (accessed 7.24.12).
Thompson, J., 2002. The world of the social entrepreneur. International Journal of Public Sector Management 15, 412–431.
Tordjman, H., 2004. How to Study Markets? An Institutionalist Point of View. Revue d’économie industrielle 107, 19–36. doi:10.3406/rei.2004.3046
Tripp, R., 2000. Strategies for seed system development in sub‐Saharan Africa: A study of Kenya, Malawi, Zambia, and Zimbabwe. International crops research institute for the semi‐arid tropics (ICRISAT), Hyderabad.
Tripp, R., Rohrbach, D., 2001. Policies for African seed enterprise development. Food Policy 26, 147–161.
Tschakert, H., 1976. Handwerkliche Genossenschaften und ekub Sparvereine in Äthiopien. Zeitschrift für das gesamte Genossenschaftswesen 26, 169–180.
UN DESA, 2013. World Population Prospects, the 2012 Revision [WWW Document]. URL http://esa.un.org/unpd/wpp/Excel‐Data/population.htm (accessed 7.15.13).
UNdata, 2014. UNdata A world of information [WWW Document]. URL http://data.un.org/Data.aspx?d=ComTrade&f=_l1Code%3a7 (accessed 2.25.14).
UNDP, 2008. Creating value for all ‐ Growing Inclusive Markets. United Nations Development Programme, New York.
UNDP, 2012. Human Development Report 2011: Sustainability and Equity ‐ A Better Future for All. Palgrave Macmillan, New York.
UNDP, 2013. Growing Inclusive Markets | Business works for development | Development works for business [WWW Document]. Growing Inclusive Markets. URL http://www.growinginclusivemarkets.org/ (accessed 5.9.13).
UNESCO, 2012. UNESCO Institute for Statistics [WWW Document]. UIS Statistics in Brief. URL http://stats.uis.unesco.org/unesco/TableViewer/document.aspx?ReportId=121&IF_Language=eng&BR_Country=2300&BR_Region=40540 (accessed 12.6.12).
UNFPA, 2011. The state of the world’s midwifery 2011. UNFPA, New York. UN‐HABITAT, 2003. The Challenge of Slums. UN‐HABITAT, Nairobi. UNICEF, 2010. Narrowing the Gaps to Meet the Goals: An equity‐focused approach to child survival
and development. United Nations Children’s Fund, New York. US Government, 2011. Feed the Future. Ethiopia FY 2011–2015 Multi‐Year Strategy. USAID, 2012. Planned FTF Projects to be launched in 2012. Van Velthuizen, H., Huddleston, B., Fischer, G., Salvatore, M., Ataman, E., Nachtergaele, F.O., Zanetti,
M., Bloise, M., 2007. Mapping biophysical factors that influence agricultural production and rural vulnerability. FAO.
Vermeulen, S., Cotula, L., 2010. Making the Most of Agricultural Investment: A Survey of Business Models That Provide Opportunities for Smallholders. FAO & IIED, London, Rome, Bern.
Viswanathan, M., Sridharan, S., Ritchie, R., 2008. Marketing in Subsistence Marketplaces, in: Wankel, C. (Ed.), Alleviating Poverty Through Business Strategy. Gloval Case Studies in Social Entrepreneurship. Palgrave Macmillan, New York, pp. 209–231.
Viswanathan, M., Sridharan, S., Ritchie, R., 2010. Understanding consumption and entrepreneurship in subsistence marketplaces. Journal of Business Research 63, 570–581. doi:10.1016/j.jbusres.2009.02.023
von Braun, J., 2010. Extreme Armut ‐ eine Investitionschance. KfW Meinungsforum Entwicklungspolitik Juli, 1–2.
von Braun, J., Bouis, H., Kumar, S., Pandya‐Lorch, R., 1992. Improving food security of the poor: concept, policy, and programs. International Food Policy Research Institute, Washington D.C.
von Braun, J., Gatzweiler, F.W. (Eds.), 2013a. Marginality. Addressing the Nexus of Poverty, Exclusion and Ecology. Springer, Dordrecht Heidelberg New York London.
References
145
von Braun, J., Gatzweiler, F.W., 2013b. Marginality—An Overview and Implications for Policy, in: von Braun, J., Gatzweiler, F.W. (Eds.), Marginality. Addressing the Nexus of Poverty, Exclusion and Ecology. Springer, Dordrecht Heidelberg New York London, pp. 1–23.
von Braun, J., Lohlein, D., 2003. Policy options to overcome subsistence agriculture in the CEECs, in: Abele, S., Frohberg, K. (Eds.), Subsistence Agriculture in Central and Eastern Europe: How to Break the Vicious Circle. IAMO, Halle (Saale), pp. 46–70.
von Braun, J., Teklu, T., Webb, P., 1999. Famine in Africa: Causes, Responses, and Prevention. Johns Hopkins University Press & International Food Policy Research Institute, Baltimore, Maryland.
von Braun, J., Vargas Hill, R., Pandya‐Lorch, R., 2009. The Poorest and Hungry: A Synthesis of Analyses and Actions, in: von Braun, J., Vargas Hill, R., Pandya‐Lorch, R. (Eds.), The Poorest and Hungry. Assessment, Analyses, and Actions, IFPRI 2020. IFPRI, Washington, pp. 1–61.
von Grebmer, K., Headey, D., Olofinbiyi, T., Wiesmann, D., Fritschel, H., Yin, S., Yohannes, Y., Foley, C., von Oppeln, C., Iseli, B., Béné, C., Haddad, L., 2013. 2013 Global Hunger Index: The Challenge of Hunger: Building Resilience to Achieve Food and Nutrition Security. Welthungerhilfe, International Food Policy Research Institute, Concern Worldwide, Bonn, Washington D.C., Dublin.
von Grebmer, K., Torero, M., Olofinbiyi, T., Fritschel, H., Wiesmann, D., Yohannes, Y., Schofield, L., von Oppeln, C., 2011. Global Hunger Index. The Challenge of Hunger: Taming Price Spikes and Excessive Food Price Volatility. Deutsche Welthungerhilfe, IFPRI, and Concern Worldwide, Bonn, Washington, DC, and Dublin.
Vorley, B., Lundy, M., MacGregor, J., 2009. Business models that are inclusive of small farmers, in: da Silva, C., Baker, D., Shepherd, A., Jenane, C., Miranda‐da‐Cruz, S. (Eds.), Agro‐Industries for Development. FAO & UNIDO, Oxfordshire & Cambridge, pp. 186–222.
Vrålstad, K., 2010. Sedentarization in Filtu Woreda, Ethiopia: Impacts on health, ecology and society. Norwegian University of Life Sciences, Oslo.
Waithaka, M., Nzuma, J., Kyotalimye, M., Nyachae, O., 2011. Impacts of an improved seed policy environment in Eastern and Central Africa. ASARECA, Entebbe (Uganda).
Wale, E., 2006. What do farmers financially lose if they fail to use improved seeds? Some econometric results for wheat and implications for agricultural extension policy in Ethiopia. Ethiopian Journal of Economics XII, 59–79.
Wang, N., 2003. Measuring transaction costs: an incomplete survey. Ronald Coase Institute Working Papers.
Webb, P., von Braun, J., 1994. Famine and Food Security in Ethiopia. Lessons for Africa. John Wiley & Sons, Chichester.
Webb, P., von Braun, J., Yohannes, Y., 1992. Famine in Ethiopia: Policy Implications of Coping Failure at National and Household Levels. International Food Policy Research Institute, Washington D.C.
Weidner, K.L., Rosa, J.A., Viswanathan, M., 2010. Marketing to subsistence consumers: Lessons from practice. Journal of Business Research 63, 559–569.
WHO, UNAIDS, 2010. Progress on Sanitation and Drinking‐Water: 2010 Update. World Health Organization, Geneva.
Williamson, O., 2005. Transaction cost economics, in: Menard, C., Shirley, M.M. (Eds.), Handbook of New Institutional Economics. Springer, Dordrecht Heidelberg New York London, pp. 41–65.
Williamson, O.E., 1980. The organization of work a comparative institutional assessment. Journal of Economic Behavior & Organization 1, 5–38. doi:10.1016/0167‐2681(80)90050‐5
Williamson, O.E., 1985. The economic institutions of capitalism. The Free Press, New York. Williamson, O.E., 1991. Strategizing, economizing, and economic organization. Strategic management
journal 12, 75–94. Williamson, O.E., 2004. Transaction cost economics and agriculture: an excursion. The Role of
Institutions in Rural Policies and Agricultural Markets. Amsterdam: Elsevier 19–39. Winter‐Nelson, A., Temu, A., 2002. Institutional adjustment and transaction costs: product and inputs
markets in the Tanzanian coffee system. World Development 30, 561–574.
References
146
Wiseman, W., van Domelen, J., Coll‐Black, S., 2010. Designing and implementing a rural safety net in a low income setting. Lessons learnt from Ethiopia’s Productive Safety Net Program 2005‐2009. The World Bank, Washington D.C.
Woldehanna, T., Hoddinott, J., Dercon, S., 2008a. Poverty and inequality in Ethiopia: 1995/96‐2004/05. IFPRI mimeo 1–25.
Woldehanna, T., Mekonnen, A., Alemu, T., 2008b. Young lives: Ethiopia round 2 survey report, Young Lives Country Report. University of Oxford, Department of International Development, Oxford.
World Economic Forum, 2012a. Agriculture and Food Security | World Economic Forum ‐ Agriculture and Food Security [WWW Document]. URL http://www.weforum.org/issues/agriculture‐and‐food‐security (accessed 6.11.12).
World Economic Forum, 2012b. Accelerating Infrastructure Investments ‐ World Economic Forum on Africa 2012 [WWW Document]. Accelerating Infrastructure Investments ‐ World Economic Forum on Africa 2012 | World Economic Forum. URL http://www.weforum.org/videos/accelerating‐infrastructure‐investments‐world‐economic‐forum‐africa‐2012 (accessed 8.16.12).
World Telecommunication/ICT Indicators Database, 2012. Global ICT Trends. Wubneh, F.K., 2007. Realizing the Dream: Agricultural Extension for Rural Livelihoods Development in
Ethiopia. Institute of Social Studies, Addis Ababa. Yahoo Finance, 2014. Research and Markets: Latest News for the Chinese Seed Industry [WWW
Document]. URL http://finance.yahoo.com/news/research‐markets‐latest‐news‐chinese‐114300287.html (accessed 2.25.14).
Yamano, T., Alderman, H., Christiaensen, L., 2005. Child Growth, Shocks, and Food Aid in Rural Ethiopia. Am. J. Agr. Econ. 87, 273–288. doi:10.1111/j.1467‐8276.2005.00721.x
Yara International, 2012. Yara International [WWW Document]. URL http://www.yara.com/ (accessed 8.9.12).
Yigzaw, T., Yibric, A., Kebede, Y., 2005. Domestic violence around Gondar in Northwest Ethiopia. Ethiopian Journal of Health Development 18, 133–139.
Yin, R.K., 2013. Case study research: design and methods, 5th ed. SAGE Publications Ltd, Los Angeles, Calif. [u.a.].
Yohannes, Y., Fritschel, H., Olofinbiyi, T., Nestrova, B., Menon, P., Ruel, M.T., Grebmer, K. von, Oppeln, C. von, Towey, O., Golden, K., 2010. 2010 Global Hunger Index. The Challenge of Hunger: Focus on the Crisis of Child Undernutrition. International Food Policy Research Institute, Washington D.C.
Yunus, M., 2007. Creating a World Without Poverty: Social Business and the Future of Capitalism. PublicAffairs, New York.
Zewde, B., 2001. A history of modern Ethiopia, 1855‐1991, 2nd ed. James Curry Publishers, Oxford ; Athens; Addis Ababa.
Zucker, D.M., 2009. How to do Case Study Research, in: Garner, M., Wagner, C., Barbara Kawulich (Eds.), Teaching Research Methods in the Social Sciences. Ashgate Publishing, Ltd., Farnham, pp. 171–182.
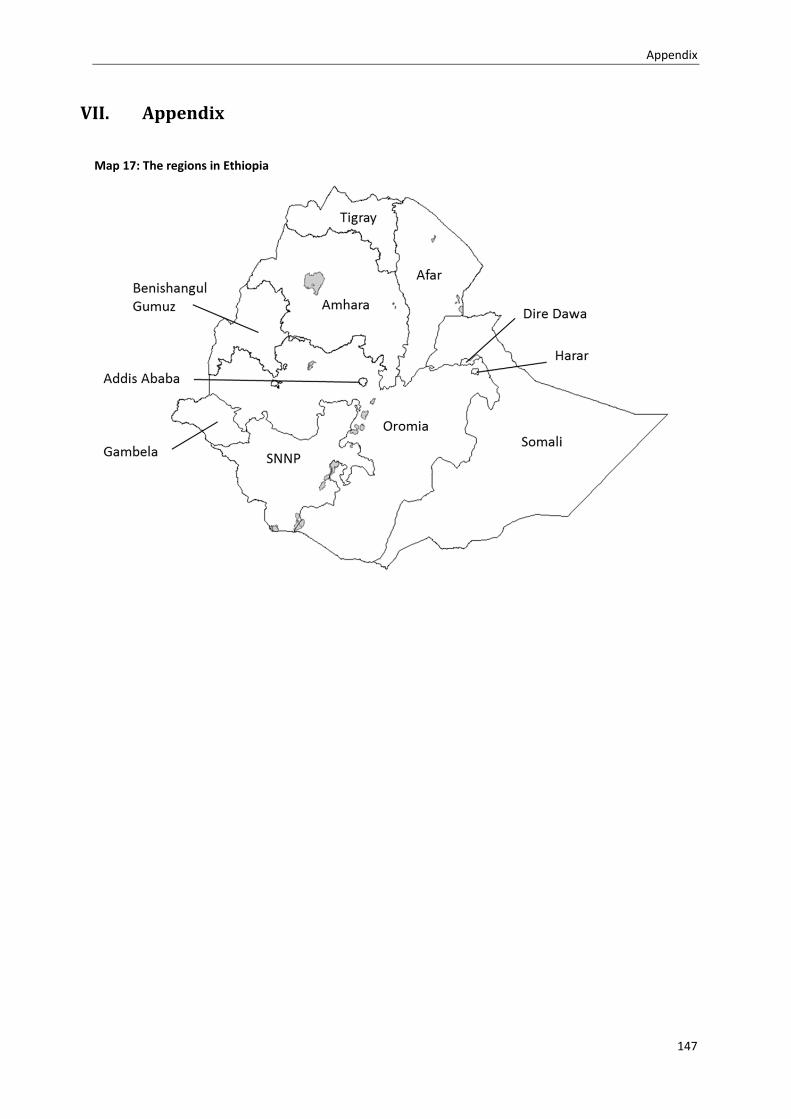
Appendix
147
VII. Appendix
Map 17: The regions in Ethiopia
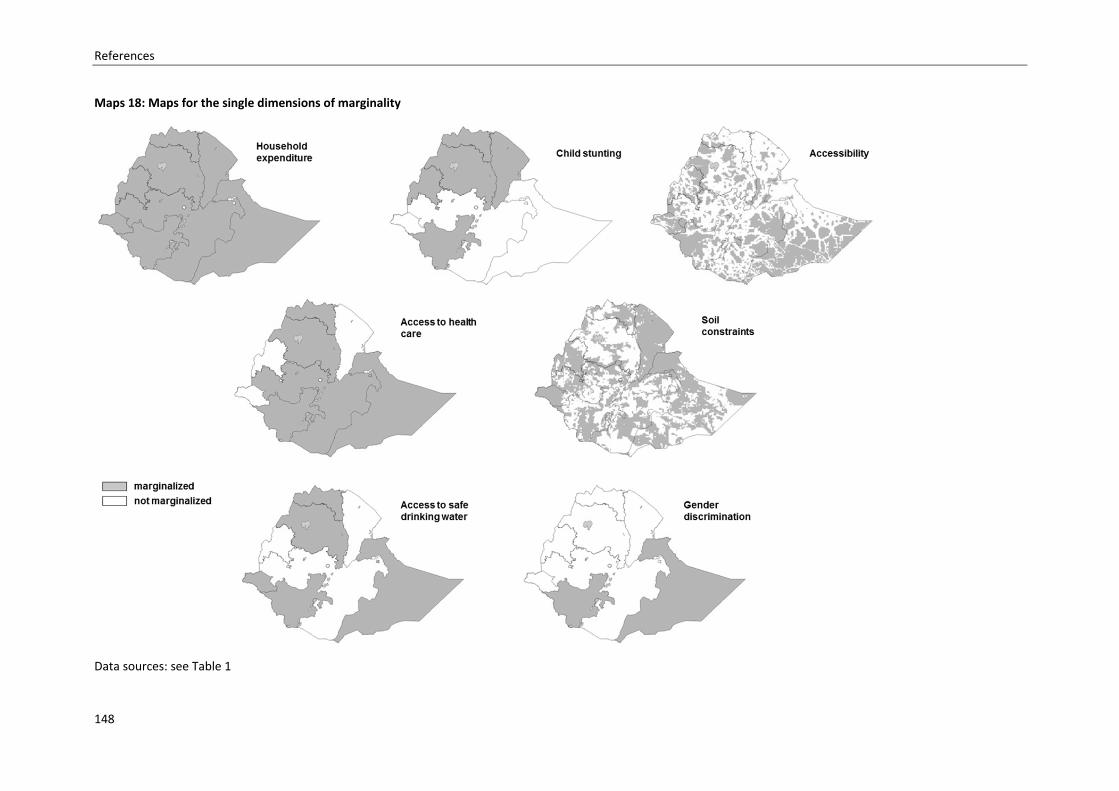
References
148
Maps 18: Maps for the single dimensions of marginality
Data sources: see Table 1
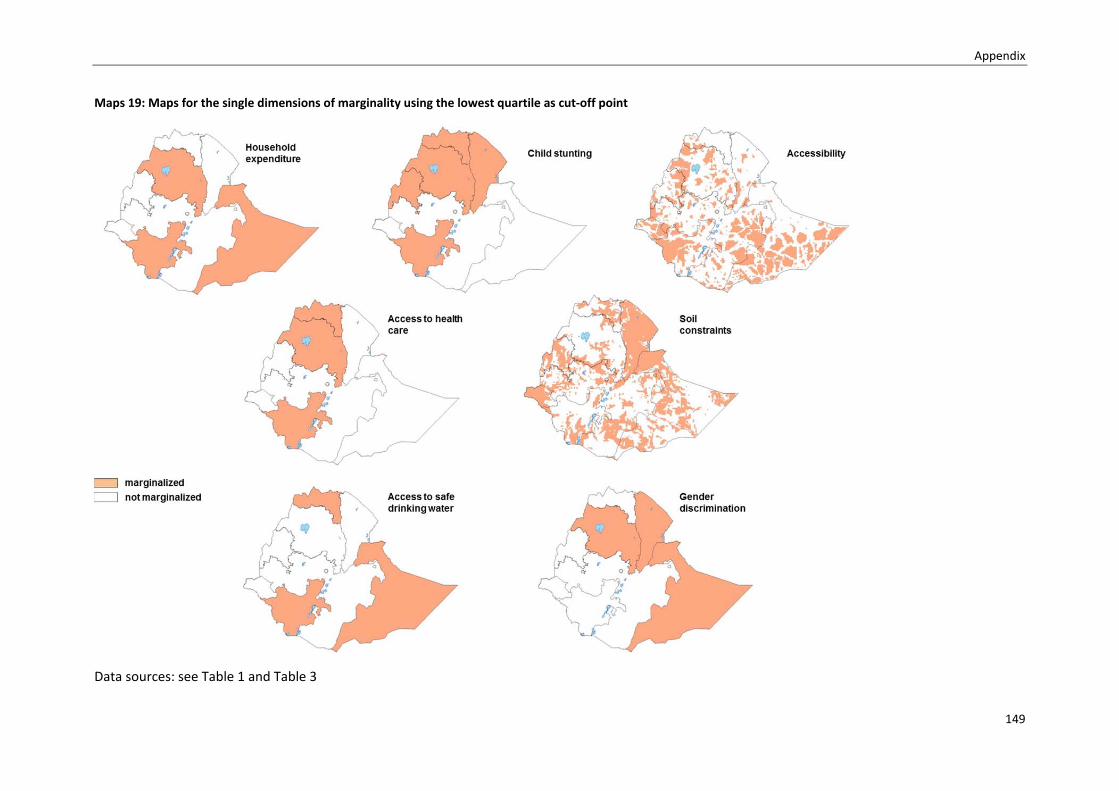
Appendix
149
Maps 19: Maps for the single dimensions of marginality using the lowest quartile as cut‐off point
Data sources: see Table 1 and Table 3
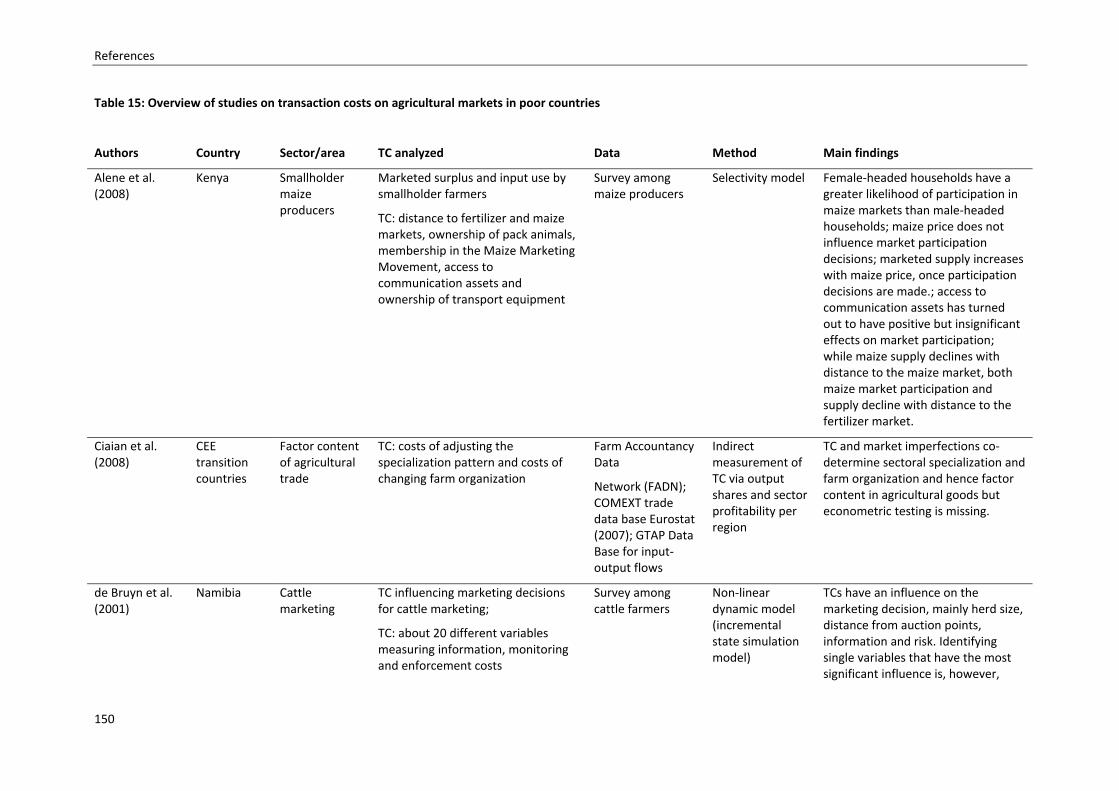
References
150
Table 15: Overview of studies on transaction costs on agricultural markets in poor countries
Authors Country Sector/area TC analyzed Data Method Main findings
Alene et al. (2008)
Kenya Smallholder maize producers
Marketed surplus and input use by smallholder farmers
TC: distance to fertilizer and maize markets, ownership of pack animals, membership in the Maize Marketing Movement, access to communication assets and ownership of transport equipment
Survey among maize producers
Selectivity model Female‐headed households have a greater likelihood of participation in maize markets than male‐headed households; maize price does not influence market participation decisions; marketed supply increases with maize price, once participation decisions are made.; access to communication assets has turned out to have positive but insignificant effects on market participation; while maize supply declines with distance to the maize market, both maize market participation and supply decline with distance to the fertilizer market.
Ciaian et al. (2008)
CEE transition countries
Factor content of agricultural trade
TC: costs of adjusting the specialization pattern and costs of changing farm organization
Farm Accountancy Data
Network (FADN); COMEXT trade data base Eurostat (2007); GTAP Data Base for input‐output flows
Indirect measurement of TC via output shares and sector profitability per region
TC and market imperfections co‐determine sectoral specialization and farm organization and hence factor content in agricultural goods but econometric testing is missing.
de Bruyn et al. (2001)
Namibia Cattle marketing
TC influencing marketing decisions for cattle marketing;
TC: about 20 different variables measuring information, monitoring and enforcement costs
Survey among cattle farmers
Non‐linear dynamic model (incremental state simulation model)
TCs have an influence on the marketing decision, mainly herd size, distance from auction points, information and risk. Identifying single variables that have the most significant influence is, however,
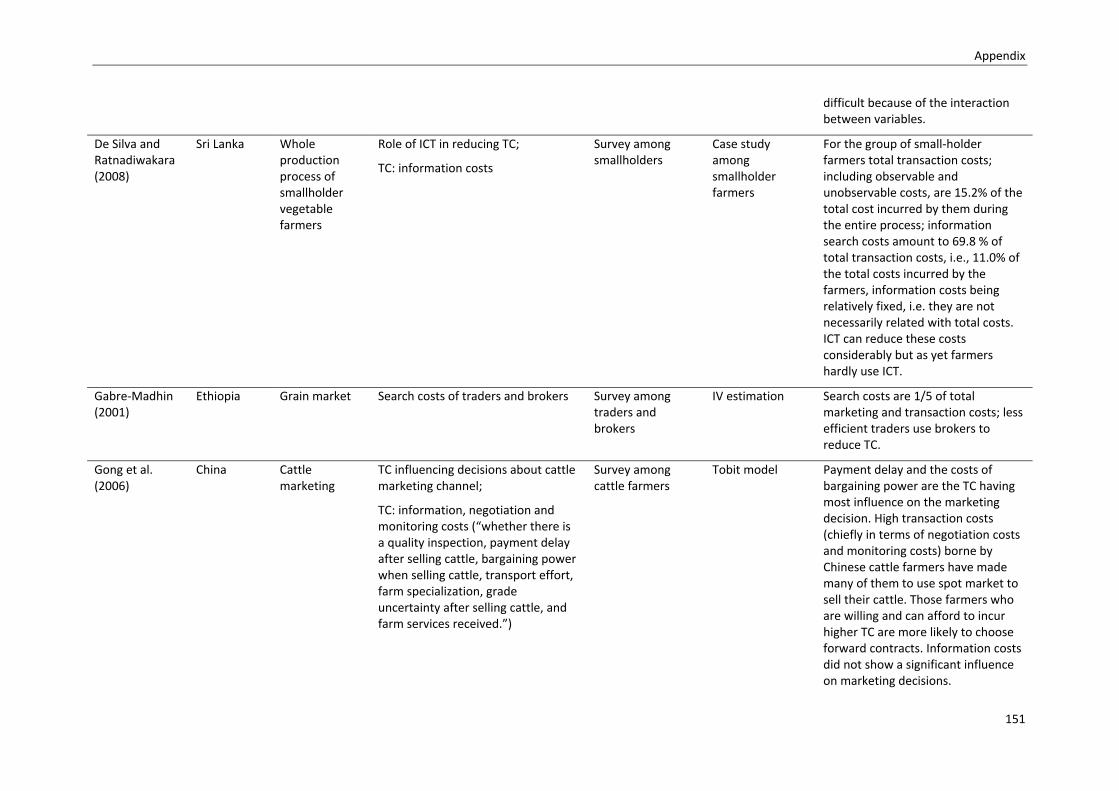
Appendix
151
difficult because of the interaction between variables.
De Silva and Ratnadiwakara (2008)
Sri Lanka Whole production process of smallholder vegetable farmers
Role of ICT in reducing TC;
TC: information costs
Survey among smallholders
Case study among smallholder farmers
For the group of small‐holder farmers total transaction costs; including observable and unobservable costs, are 15.2% of the total cost incurred by them during the entire process; information search costs amount to 69.8 % of total transaction costs, i.e., 11.0% of the total costs incurred by the farmers, information costs being relatively fixed, i.e. they are not necessarily related with total costs. ICT can reduce these costs considerably but as yet farmers hardly use ICT.
Gabre‐Madhin (2001)
Ethiopia Grain market Search costs of traders and brokers Survey among traders and brokers
IV estimation Search costs are 1/5 of total marketing and transaction costs; less efficient traders use brokers to reduce TC.
Gong et al. (2006)
China Cattle marketing
TC influencing decisions about cattle marketing channel;
TC: information, negotiation and monitoring costs (“whether there is a quality inspection, payment delay after selling cattle, bargaining power when selling cattle, transport effort, farm specialization, grade uncertainty after selling cattle, and farm services received.”)
Survey among cattle farmers
Tobit model Payment delay and the costs of bargaining power are the TC having most influence on the marketing decision. High transaction costs (chiefly in terms of negotiation costs and monitoring costs) borne by Chinese cattle farmers have made many of them to use spot market to sell their cattle. Those farmers who are willing and can afford to incur higher TC are more likely to choose forward contracts. Information costs did not show a significant influence on marketing decisions.
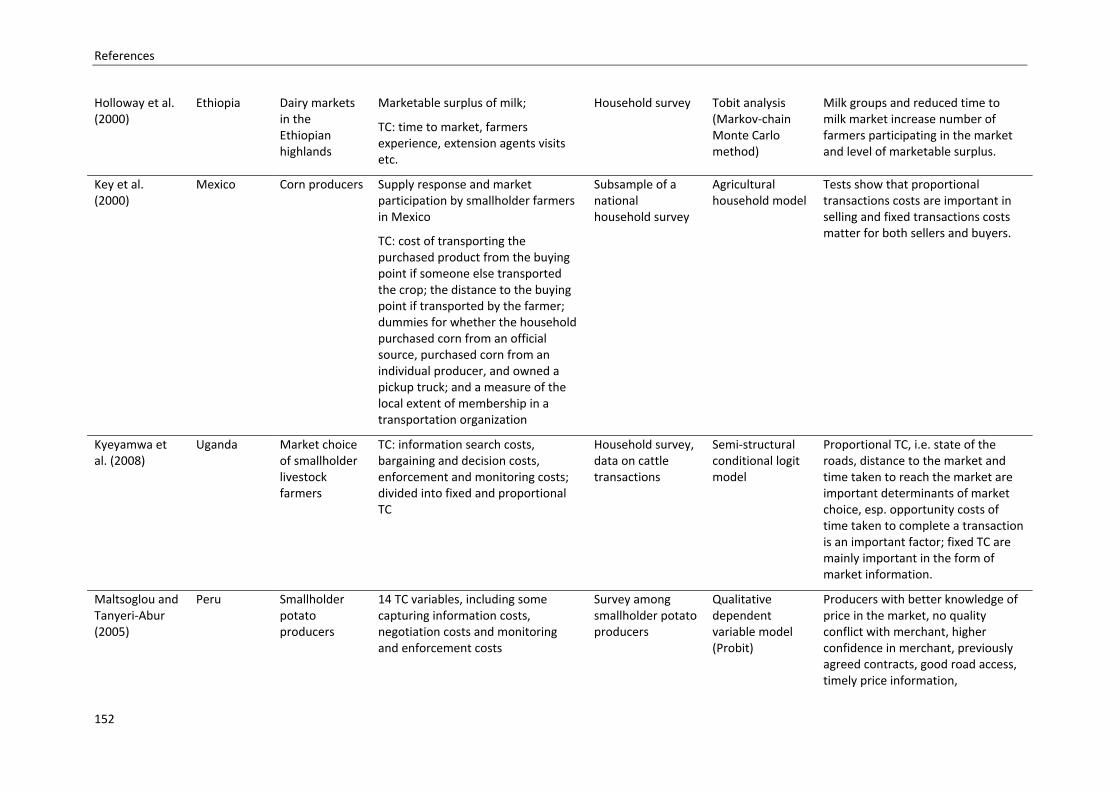
References
152
Holloway et al. (2000)
Ethiopia Dairy markets in the Ethiopian highlands
Marketable surplus of milk;
TC: time to market, farmers experience, extension agents visits etc.
Household survey Tobit analysis (Markov‐chain Monte Carlo method)
Milk groups and reduced time to milk market increase number of farmers participating in the market and level of marketable surplus.
Key et al. (2000)
Mexico Corn producers Supply response and market participation by smallholder farmers in Mexico
TC: cost of transporting the purchased product from the buying point if someone else transported the crop; the distance to the buying point if transported by the farmer; dummies for whether the household purchased corn from an official source, purchased corn from an individual producer, and owned a pickup truck; and a measure of the local extent of membership in a transportation organization
Subsample of a national household survey
Agricultural household model
Tests show that proportional transactions costs are important in selling and fixed transactions costs matter for both sellers and buyers.
Kyeyamwa et al. (2008)
Uganda Market choice of smallholder livestock farmers
TC: information search costs, bargaining and decision costs, enforcement and monitoring costs; divided into fixed and proportional TC
Household survey, data on cattle transactions
Semi‐structural conditional logit model
Proportional TC, i.e. state of the roads, distance to the market and time taken to reach the market are important determinants of market choice, esp. opportunity costs of time taken to complete a transaction is an important factor; fixed TC are mainly important in the form of market information.
Maltsoglou and Tanyeri‐Abur (2005)
Peru Smallholder potato producers
14 TC variables, including some capturing information costs, negotiation costs and monitoring and enforcement costs
Survey among smallholder potato producers
Qualitative dependent variable model (Probit)
Producers with better knowledge of price in the market, no quality conflict with merchant, higher confidence in merchant, previously agreed contracts, good road access, timely price information,
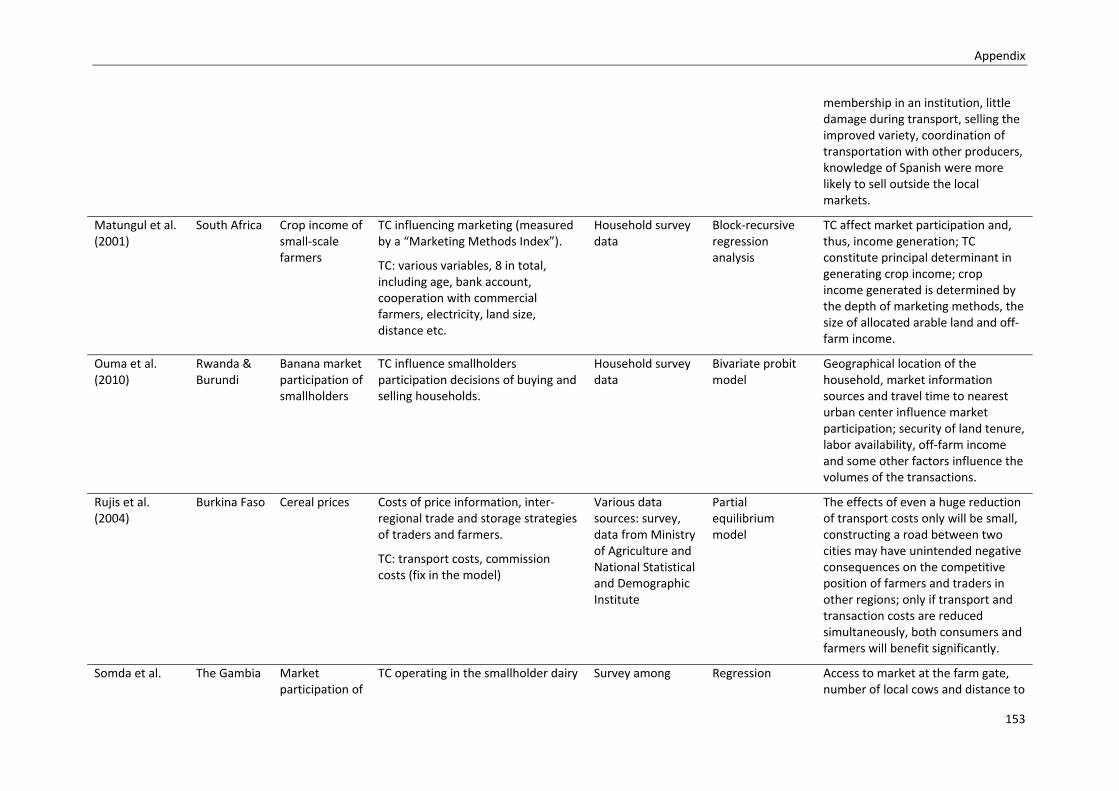
Appendix
153
membership in an institution, little damage during transport, selling the improved variety, coordination of transportation with other producers, knowledge of Spanish were more likely to sell outside the local markets.
Matungul et al. (2001)
South Africa Crop income of small‐scale farmers
TC influencing marketing (measured by a “Marketing Methods Index”).
TC: various variables, 8 in total, including age, bank account, cooperation with commercial farmers, electricity, land size, distance etc.
Household survey data
Block‐recursive regression analysis
TC affect market participation and, thus, income generation; TC constitute principal determinant in generating crop income; crop income generated is determined by the depth of marketing methods, the size of allocated arable land and off‐farm income.
Ouma et al. (2010)
Rwanda & Burundi
Banana market participation of smallholders
TC influence smallholders participation decisions of buying and selling households.
Household survey data
Bivariate probit model
Geographical location of the household, market information sources and travel time to nearest urban center influence market participation; security of land tenure, labor availability, off‐farm income and some other factors influence the volumes of the transactions.
Rujis et al. (2004)
Burkina Faso Cereal prices Costs of price information, inter‐regional trade and storage strategies of traders and farmers.
TC: transport costs, commission costs (fix in the model)
Various data sources: survey, data from Ministry of Agriculture and National Statistical and Demographic Institute
Partial equilibrium model
The effects of even a huge reduction of transport costs only will be small, constructing a road between two cities may have unintended negative consequences on the competitive position of farmers and traders in other regions; only if transport and transaction costs are reduced simultaneously, both consumers and farmers will benefit significantly.
Somda et al. The Gambia Market participation of
TC operating in the smallholder dairy Survey among Regression Access to market at the farm gate, number of local cows and distance to
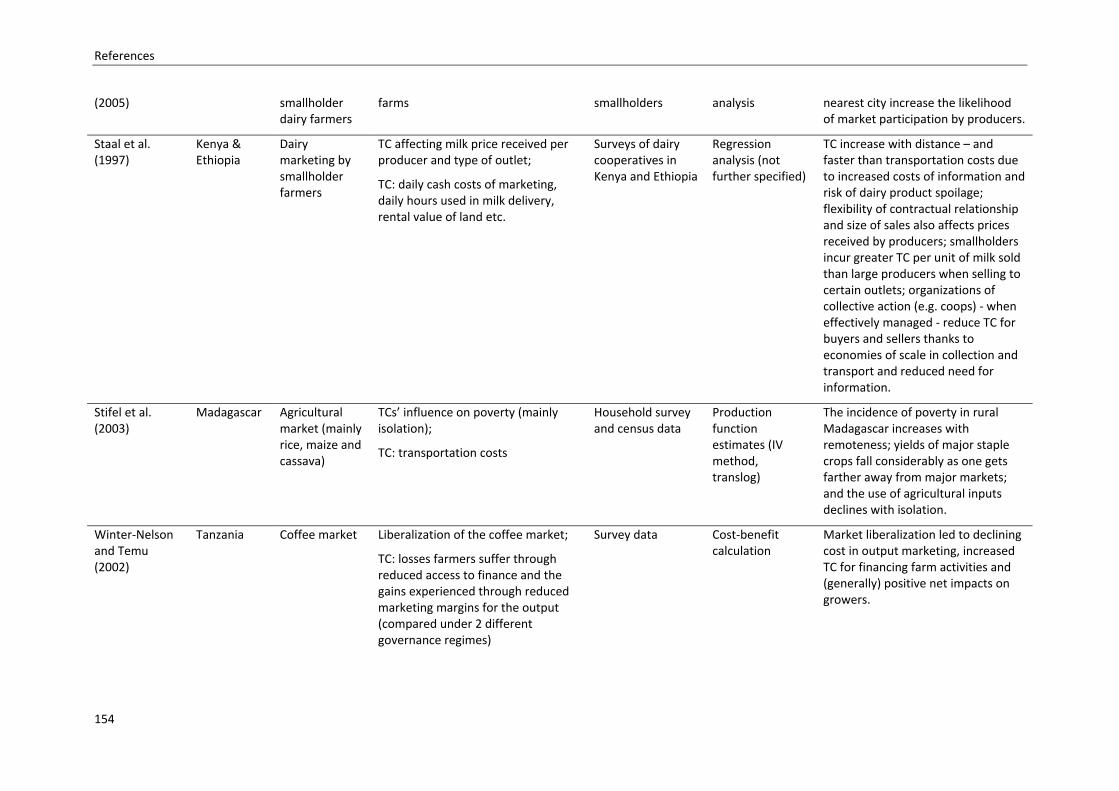
References
154
(2005) smallholder dairy farmers
farms smallholders analysis nearest city increase the likelihood of market participation by producers.
Staal et al. (1997)
Kenya & Ethiopia
Dairy marketing by smallholder farmers
TC affecting milk price received per producer and type of outlet;
TC: daily cash costs of marketing, daily hours used in milk delivery, rental value of land etc.
Surveys of dairy cooperatives in Kenya and Ethiopia
Regression analysis (not further specified)
TC increase with distance – and faster than transportation costs due to increased costs of information and risk of dairy product spoilage; flexibility of contractual relationship and size of sales also affects prices received by producers; smallholders incur greater TC per unit of milk sold than large producers when selling to certain outlets; organizations of collective action (e.g. coops) ‐ when effectively managed ‐ reduce TC for buyers and sellers thanks to economies of scale in collection and transport and reduced need for information.
Stifel et al. (2003)
Madagascar Agricultural market (mainly rice, maize and cassava)
TCs’ influence on poverty (mainly isolation);
TC: transportation costs
Household survey and census data
Production function estimates (IV method, translog)
The incidence of poverty in rural Madagascar increases with remoteness; yields of major staple crops fall considerably as one gets farther away from major markets; and the use of agricultural inputs declines with isolation.
Winter‐Nelson and Temu (2002)
Tanzania Coffee market Liberalization of the coffee market;
TC: losses farmers suffer through reduced access to finance and the gains experienced through reduced marketing margins for the output (compared under 2 different governance regimes)
Survey data Cost‐benefit calculation
Market liberalization led to declining cost in output marketing, increased TC for financing farm activities and (generally) positive net impacts on growers.
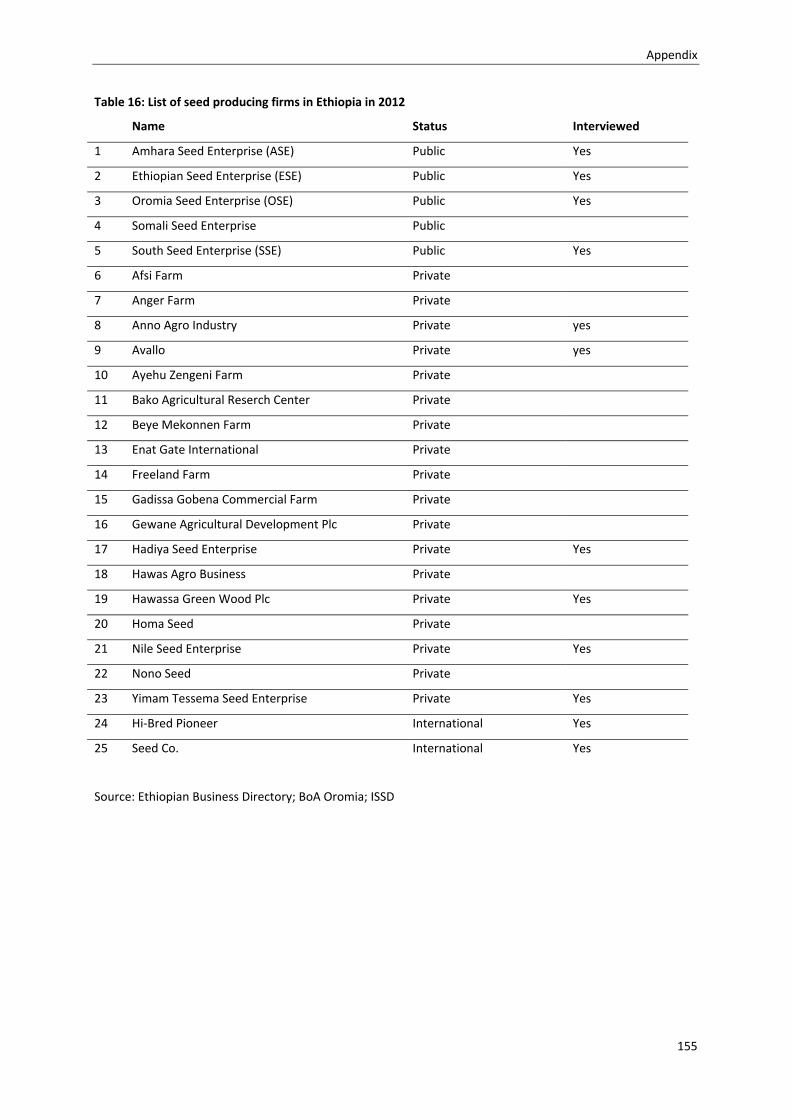
Appendix
155
Table 16: List of seed producing firms in Ethiopia in 2012
Name Status Interviewed
1 Amhara Seed Enterprise (ASE) Public Yes
2 Ethiopian Seed Enterprise (ESE) Public Yes
3 Oromia Seed Enterprise (OSE) Public Yes
4 Somali Seed Enterprise Public
5 South Seed Enterprise (SSE) Public Yes
6 Afsi Farm Private
7 Anger Farm Private
8 Anno Agro Industry Private yes
9 Avallo Private yes
10 Ayehu Zengeni Farm Private
11 Bako Agricultural Reserch Center Private
12 Beye Mekonnen Farm Private
13 Enat Gate International Private
14 Freeland Farm Private
15 Gadissa Gobena Commercial Farm Private
16 Gewane Agricultural Development Plc Private
17 Hadiya Seed Enterprise Private Yes
18 Hawas Agro Business Private
19 Hawassa Green Wood Plc Private Yes
20 Homa Seed Private
21 Nile Seed Enterprise Private Yes
22 Nono Seed Private
23 Yimam Tessema Seed Enterprise Private Yes
24 Hi‐Bred Pioneer International Yes
25 Seed Co. International Yes
Source: Ethiopian Business Directory; BoA Oromia; ISSD
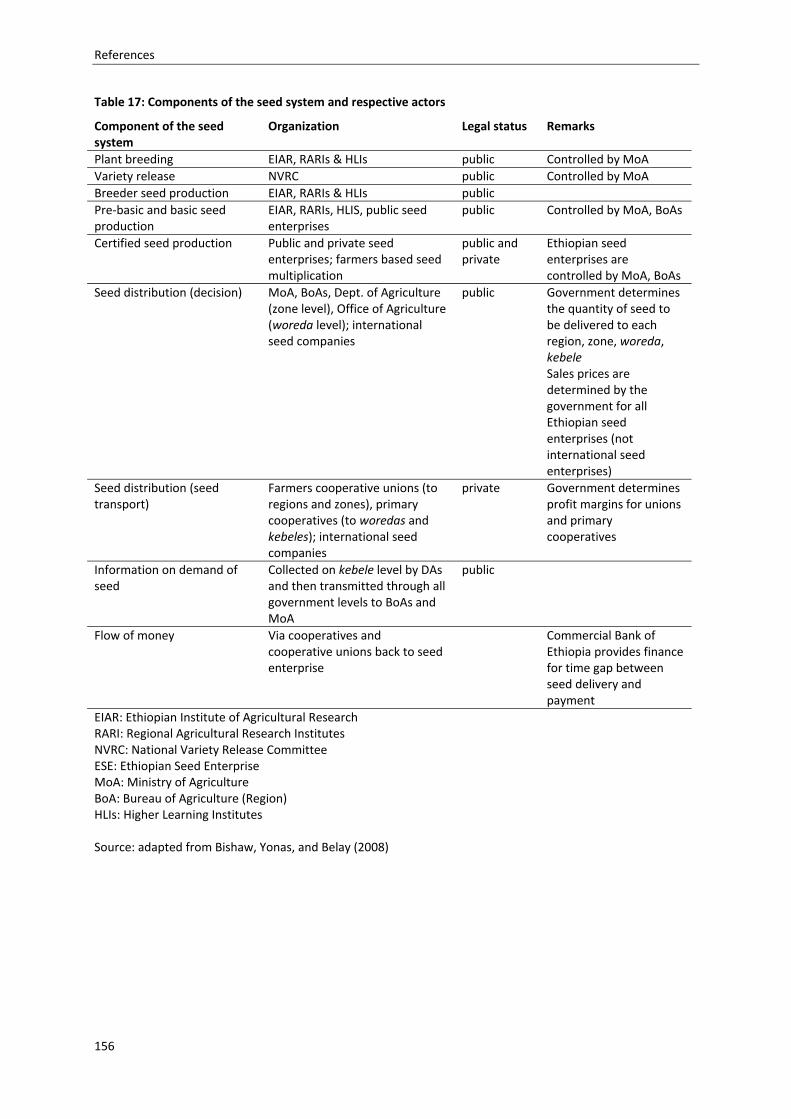
References
156
Table 17: Components of the seed system and respective actors
Component of the seed system
Organization Legal status Remarks
Plant breeding EIAR, RARIs & HLIs public Controlled by MoA
Variety release NVRC public Controlled by MoA
Breeder seed production EIAR, RARIs & HLIs public
Pre‐basic and basic seed production
EIAR, RARIs, HLIS, public seed enterprises
public Controlled by MoA, BoAs
Certified seed production Public and private seed enterprises; farmers based seed multiplication
public and private
Ethiopian seed enterprises are controlled by MoA, BoAs
Seed distribution (decision) MoA, BoAs, Dept. of Agriculture (zone level), Office of Agriculture (woreda level); international seed companies
public Government determines the quantity of seed to be delivered to each region, zone, woreda, kebele Sales prices are determined by the government for all Ethiopian seed enterprises (not international seed enterprises)
Seed distribution (seed transport)
Farmers cooperative unions (to regions and zones), primary cooperatives (to woredas and kebeles); international seed companies
private Government determines profit margins for unions and primary cooperatives
Information on demand of seed
Collected on kebele level by DAs and then transmitted through all government levels to BoAs and MoA
public
Flow of money Via cooperatives and cooperative unions back to seed enterprise
Commercial Bank of Ethiopia provides finance for time gap between seed delivery and payment
EIAR: Ethiopian Institute of Agricultural ResearchRARI: Regional Agricultural Research Institutes NVRC: National Variety Release Committee ESE: Ethiopian Seed Enterprise MoA: Ministry of Agriculture BoA: Bureau of Agriculture (Region) HLIs: Higher Learning Institutes Source: adapted from Bishaw, Yonas, and Belay (2008)
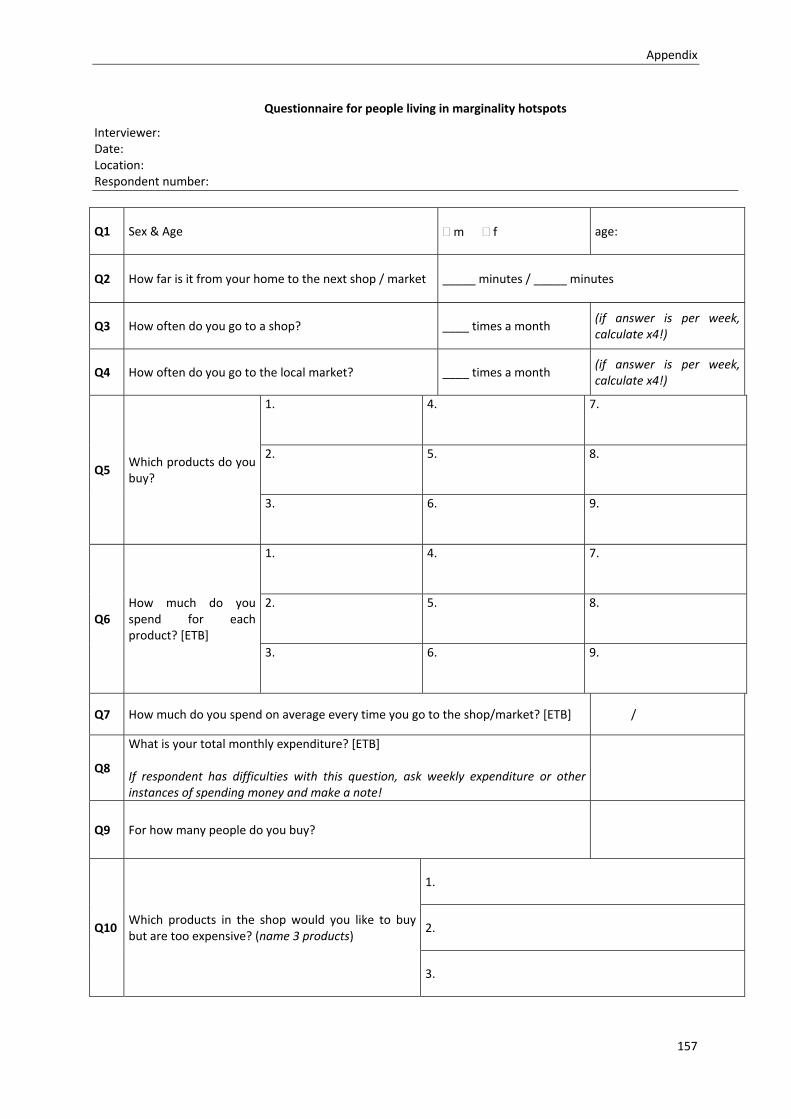
Appendix
157
Questionnaire for people living in marginality hotspots
Interviewer: Date: Location: Respondent number:
Q1 Sex & Age m f age:
Q2 How far is it from your home to the next shop / market _____ minutes / _____ minutes
Q3 How often do you go to a shop? ____ times a month (if answer is per week, calculate x4!)
Q4 How often do you go to the local market? ____ times a month (if answer is per week, calculate x4!)
Q5 Which products do you buy?
1. 4. 7.
2. 5. 8.
3. 6. 9.
Q6 How much do you spend for each product? [ETB]
1. 4. 7.
2. 5. 8.
3. 6. 9.
Q7 How much do you spend on average every time you go to the shop/market? [ETB] /
Q8
What is your total monthly expenditure? [ETB] If respondent has difficulties with this question, ask weekly expenditure or other instances of spending money and make a note!
Q9 For how many people do you buy?
Q10 Which products in the shop would you like to buy but are too expensive? (name 3 products)
1.
2.
3.
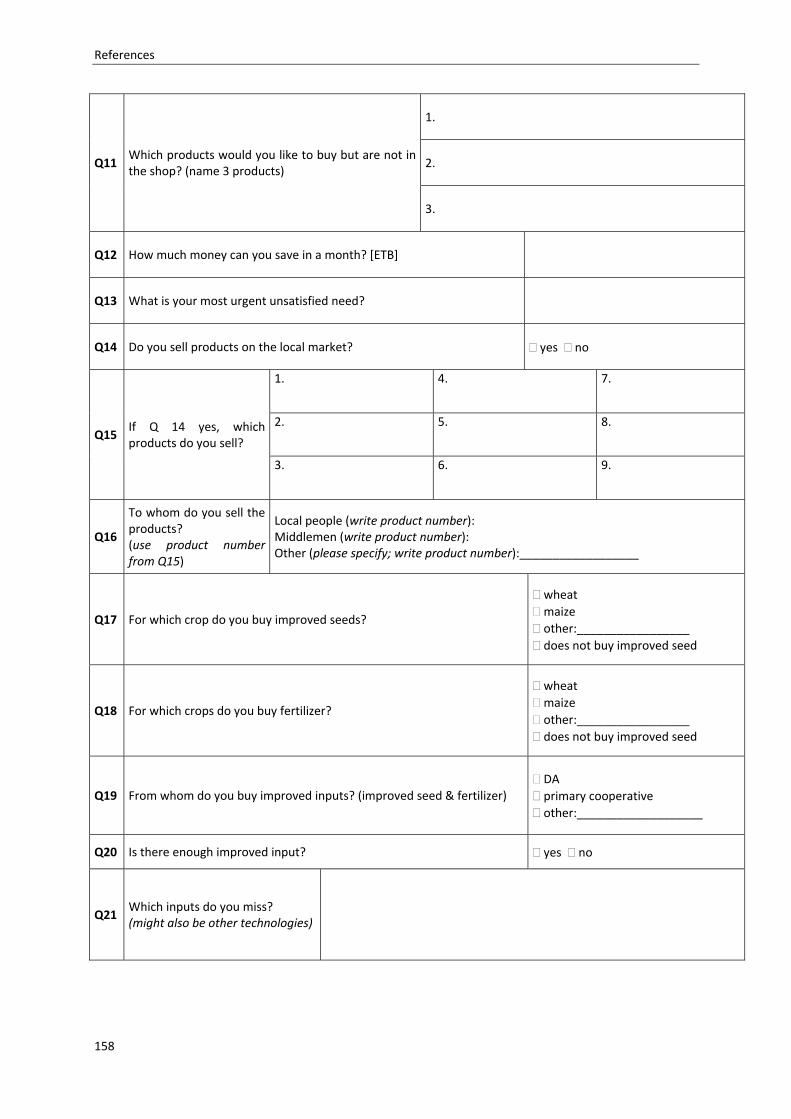
References
158
Q11 Which products would you like to buy but are not in the shop? (name 3 products)
1.
2.
3.
Q12 How much money can you save in a month? [ETB]
Q13 What is your most urgent unsatisfied need?
Q14 Do you sell products on the local market? yes no
Q15 If Q 14 yes, which products do you sell?
1. 4. 7.
2. 5. 8.
3. 6. 9.
Q16
To whom do you sell the products? (use product number from Q15)
Local people (write product number): Middlemen (write product number): Other (please specify; write product number):__________________
Q17 For which crop do you buy improved seeds?
wheat
maize
other:_________________
does not buy improved seed
Q18 For which crops do you buy fertilizer?
wheat
maize
other:_________________
does not buy improved seed
Q19 From whom do you buy improved inputs? (improved seed & fertilizer) DA
primary cooperative
other:___________________
Q20 Is there enough improved input? yes no
Q21 Which inputs do you miss? (might also be other technologies)
Related Documents