1 The Predictive Validity of the Abstract Reasoning Test and the Raven’s Advanced Progressive Matrices Test for the Academic Results of First Year Engineering Students. Julia Groves 458 533 Declaration: A research project submitted in partial fulfilment of the requirements for the degree of MA by coursework and Research Report in the field of Industrial Psychology in the Faculty if Humanities, University of Witwatersrand, Johannesburg, 14 February 2015. I declare that this research report is my own, unaided work. It has not been submitted before for any other degree or examination at this or any other university. ______________________ Julia Groves Date: Word Count: 25 992

Welcome message from author
This document is posted to help you gain knowledge. Please leave a comment to let me know what you think about it! Share it to your friends and learn new things together.
Transcript

1
The Predictive Validity of the Abstract
Reasoning Test and the Raven’s
Advanced Progressive Matrices Test for
the Academic Results of First Year
Engineering Students.
Julia Groves
458 533
Declaration:
A research project submitted in partial fulfilment of the requirements for the degree of
MA by coursework and Research Report in the field of Industrial Psychology in the
Faculty if Humanities, University of Witwatersrand, Johannesburg, 14 February
2015.
I declare that this research report is my own, unaided work. It has not been
submitted before for any other degree or examination at this or any other university.
______________________
Julia Groves
Date:
Word Count: 25 992

2
Abstract
This research project examined the predictive validity of the Abstract Reasoning Test
and the Raven’s Advanced Progressive Matrices on the academic results of first
year engineering students. Additionally, biographical variables were examined in
order to assess their contribution to the student’s scores on the psychometric tests.
This research is important as the engineering department were looking to combat the
high failure rate amongst first year engineering students. The department was
looking to use the ART and the Raven’s to foresee the subjects in which students
would struggle, enabling them to prepare extra assistance in this regard. The sample
was the 2013 and 2014 first year engineering students at the University of the
Witwatersrand, Johannesburg (N=395). The analysis showed that the ART and
Raven’s do not predict the academic results of engineering students in their first year
of study. The academic results refer to the marks obtained in the first year subjects
of Chemical and Metallurgical Engineering, Physics, Chemistry, Economics and
Mathematics. However, the biographical variables (especially those of home
language and race) play an important role in contributing to the scores achieved on
both psychometric tests.

3
ACKNOWLEDGEMENTS:
To my wonderful parents, Jacqui and Les Groves. I do not know where I would be
without your many, and much needed, words of encouragement and enlightenment.
A special thank you to my mum who has read this report many times and offered
invaluable feedback.
To Benjamin Deeb whose constant assistance and love supported me throughout
my post-graduate struggles.
To my supervisor, Dr Fiona Donald, on whom I relied consistently for guidance and
input throughout my Honours and Masters years.

4
Chapter 1: Table of Contents
1. Table of Contents Chapter 1: Table of Contents .................................................................................................................. 4
Chapter 2: Introduction .......................................................................................................................... 5
Chapter 3: Theoretical and Conceptual Background ...................................................................... 6
3.1 Education in South Africa ........................................................................................................ 6
3.2 Economics and the skills shortage in South Africa .................................................................. 7
3.3 Understanding the concept of Validity ................................................................................. 13
3.4 Intelligence Testing and Engineering .................................................................................... 14
3.5 The psychometric tests in this study ..................................................................................... 17
3.6 Background of similar studies ............................................................................................... 20
3.7 Research Hypotheses/Questions .......................................................................................... 23
Chapter 4: Method ................................................................................................................................ 24
4.1 Overall Research Design ....................................................................................................... 24
Chapter 5: Results ................................................................................................................................. 37
5.1 Phase 1: Combined sample ................................................................................................... 37
5.2 Phase 2: Results separated into 2013 and 2014 first year students ..................................... 54
5.3 Phase 3: Analysing the differences in the psychometric tests using year as a covariate ..... 81
Chapter 6: Discussion ............................................................................................................................ 86
6.1 Phase One Discussion ........................................................................................................... 86
6.2 Phase Two Discussion ........................................................................................................... 89
6.3 Phase Three ........................................................................................................................... 92
6.4 Comparing the results to the literature and its corresponding implications ....................... 92
6.5. The limitations of the study .................................................................................................. 96
6.6. Directions for future research............................................................................................... 97
Chapter 7: Conclusion ........................................................................................................................... 99
Chapter 8: References ......................................................................................................................... 102
Chapter 9: Appendices ........................................................................................................................ 106
9.1. Appendix A: Consent Form ................................................................................................. 106
9.2. Appendix B: Letter for 2014 Participants ............................................................................ 107
9.3. Appendix C: Letter for 2013 Participants ............................................................................ 108
9.4. Appendix D .......................................................................................................................... 109
9.5. Appendix E .......................................................................................................................... 110

5
Chapter 2: Introduction
2. Introduction
In South Africa there is a critical skills shortage which means that the professional
sector lacks individuals with certain skill sets – such as engineers (Daniels, 2007).
The skills shortage can be linked directly to the fact that there are many Grade 12
pupils who qualify for university acceptance who are products of a schooling system
which does not place emphasis on skills such as mathematics, science and
technology-based programmes (Zaaiman, van der Flier & Thijs, 2001, Christie,
1998). This inadequate schooling produces university candidates who struggle to
achieve well in courses for which these skills are essential (such as engineering)
(Zaaiman et al., 2001). These education problems are ones for which many
universities are still struggling to find a solution (Zaaiman et al., 2001). The possibility
of using psychometric and other tests which will highlight these inadequacies is an
appealing one as it will allow lecturers to identify the weaknesses within the skill sets
of the students, as well as pinpoint which students may require extra tutoring
(Zaaiman et al., 2001, Schaap & Luwes, 2013). Most universities are finding that
Grade 12 results are no longer a reliable predictor of what the students are capable
and are searching for other measures which will add to and enhance the selection
process (Schaap & Luwes, 2013).
The engineering department at the University of the Witwatersrand has archival data
regarding first year engineering students from 2013 and 2014 on the Abstract
Reasoning Test and the Raven’s Advanced Progressive Matrices. The aim of this
research report is to ascertain whether these tests have any predictive value with
regard to mid-year and end of year academic results. If this occurs, the engineering
department will be able to identify early in the year, which students may require extra
tutorage, and possibly, which subjects are weak in terms of both individuals and the
group as a whole. The variables in this study are the scores students achieved in
both tests (the Abstract Reasoning Test and the Raven’s Advanced Progressive
Matrices) as well as the mid-year and end of year results for their first year of tertiary
education.

6
This research report contains a theoretical and conceptual background, a
methodology, analysis and results, and discussion. The theoretical and conceptual
background will give a more in-depth discussion regarding the education problem
and skills shortage in South Africa, a brief overview of the tests to be used and the
qualities they are designed to measure. The methodology will contain more
information regarding the design and construct of the study, while the final two
chapters will show and explain the results found.
Chapter 3: Theoretical and Conceptual Background
3. Theoretical and Conceptual Background
3.1 Education in South Africa
The problems within the schooling system can themselves be attributed to problems
that arose during the Apartheid era and that have not yet been rectified (Christie,
1998). Most of the schools in which there are currently problems with education and
learning are schools that were previously in black-sectioned areas where goals to
excel in schooling were ignored by the Apartheid government (Christie, 1998). The
academic results recorded for the National Senior Certificate (NSC) exams showed
that in South Africa, 29.8% of Grade 12 pupils failed to pass their exams, while only
24.3% of learners qualified to attend university (Department of Basic Education,
2013). While the education programme has been gradually addressed from the
1980’s, the lack of education that preceded this period is generally blamed for the
‘skills shortage’ we have in South Africa (Chisholm, 1983). Chrisholm believes that
the inequality in South Africa with the high unemployment and lack of education
within the population will continue to work towards a lack of skills within our country
(Chrisholm, 1983). Although Chrisholm’s article is several years old, it can be seen
that what the author feared is indeed still a problem in our society with many of our
population remaining uneducated and the schooling system much in need of help
(Christie, 1998, Department of Basic Education, 2013). One’s level of education
directly influences one’s ability to find employment (http://beta2.statssa.gov.za/).
97.3% of graduates are employed in the formal sector, whereas only 52.9% of

7
candidates who have less than a Grade 12 education level are thusly employed
(http://beta2.statssa.gov.za/)
There have been many attempts to reform the education system – most of which
have failed. One such attempt, put into place to help the post-Apartheid education
system was outcome-based education (OBE) (Jansen, 1998). The fundamental
principles of this intervention were to furnish schools/teachers/principals with the
outcomes that the students are expected to achieve (Jansen, 1998) However, there
were a number of drawbacks to this system (Jansen, 1998). Firstly, it proved too
difficult for educators to manage and apply to their pre-set curriculums (Jansen,
1998). Secondly, there was no evidence that changing a schooling process or
outcome will have any impact on South Africa’s failing economy and skills shortage
(Jansen, 1998). Thirdly, the outcomes that have been decided on, do not address
values and the teaching of values to students which is so important in a society that
is trying to shake off the monstrosities of Apartheid (Jansen, 1998).
Some of the problems stemming from this absence of value-teaching include lack of
authority being held by both principals and teachers, poor attendance on behalf of
both students and teachers alike, demotivation and a low willingness to teach and be
taught and poor school results (Christie, 1998). Often the issues from the
surrounding community will spill over into the school environment with the children
displaying problems with alcohol and drugs, affiliation with gangs, violent tendencies
and criminal activities (Christie, 1998). All of these problems result in the emphasis
not being placed on education which will have an impact on poor understanding,
learning and final marks (Christie, 1998).
3.2 Economics and the skills shortage in South Africa
One’s success in academics is intrinsically linked to one’s success in future life in
terms of career choice and future opportunities (Laidra, Pullmann & Allik, 2006). It
can be argued that a test used prior to acceptance into a university course, which
would enable the department to separate those who should excel in the course, from
those who might fail (and thus require extra help during their time at university),
would be an important tool to ensure that universities are able to produce as many
qualified people as possible for the working world. The need for qualified engineers
in the South African context, particularly in terms of government projects such as

8
road infrastructure, is steadily increasing (Schaap & Luwes, 2013). There is also a
growing world-wide need in the international infrastructure for engineers (Schaap &
Luwes, 2013). As many qualified graduates (in various sectors) leave South Africa to
work abroad, it is important to have as large a pool of engineers as possible in order
to ensure that the need for engineers in the South African context is satisfied
(Schaap & Luwes, 2013).
It has been said that the most important economic question is how to increase
growth of output for each individual (Romer, 2001). The output of an individual is
what he/she is able to accomplish and provide for his/her organisation and country’s
economy (Romer, 2001). A small increase of the growth rate will lead to a cumulative
effect on the standard of living within the country (Romer, 2001). The twentieth
century in the United States was a stage characterised by rapid technological growth
which led to a high standard of living and, additionally, an education system which
provided the fast-paced output of technology that was needed in this innovative
period (Romer, 2001). It is believed that sustaining and improving this trend of
growth in the United States revolves around the improvement and focus on the
tertiary education of scientists and engineers (Romer, 2001). Romer’s article focuses
on the importance of this growing trend and predicts that faster growth would be able
to monetarily resolve any budget difficulties as well as provide resources for the
many social problems we face (Romer, 2001). As such, it shows the economic
benefits that one can expect from the training of a large base of engineers (Romer,
2001).
South Africa is not as fortunate as the United States in terms of skilled professionals
as SA suffers from a skills shortage (Daniels, 2007). The skills shortage can be
understood through the premise that the demand for skills far exceeds the supply
(Daniels, 2007). Labour supply is defined as the human capital who participate in the
labour market, while labour demand refers to the organisations that employ the
human capital (Daniels, 2007). Between these two are the arrangements that help
form the demand and supply relationship including the universities that train the
human capital/labour force (Daniels, 2007). When Daniels’ paper was researched,
South Africa’s economy was in an upswing after Apartheid in which increasing skills
amongst the labour force played an important part (Daniels, 2007). Currently, only
25% of the South African population are employed in skilled positions, with 46% in

9
semi-skilled positions and 29% in low-skilled occupations
(http://beta2.statssa.gov.za/). In terms of the Government’s definition, skills are
comprised both of qualifications and experience in the field (Daniels, 2007). A scarce
skill is defined as “a scarcity of qualified and experienced people, currently or
anticipated in the future, either (a) because such skilled people are not available, or
(b) because they are available but do not meet employment criteria” (as cited in
Daniels, 2007). Absolute scarcity of these skills is defined in (a) above, where people
do not hold the skills that are required, whereas relative scarcity refers to (b) above
(Daniels, 2007).
Critical skills refer to specific skills within an occupation (Daniels, 2007). This can be
divided into two groups: generic skills and particular occupational skills (Daniels,
2007). The former skills include double-loop learning, language, literacy and team-
player skills whereas the latter are skills specific to the occupation in which the
individual is working (Daniels, 2007). It is important to keep all of the above
definitions in mind when contemplating the skills shortage (Daniels, 2007). Various
changes between sectors in our economy can also contribute to skills shortages and
structural unemployment (Daniels, 2007). An example of this between-sector change
could be a decrease in employment in the primary sector and an increase in
available jobs in the tertiary sector (Daniels, 2007). The primary sector comprises the
agriculture, mining and petroleum industries, while the tertiary sector includes real
estate, transport and finance (Coughlin & Segev, 1999). This will result in the
problem of people in the primary sector being left without jobs while positions in the
tertiary sector are waiting for people who are able to fill them (Daniels, 2007).
Unfortunately, the people from the primary sector are not able to fill these open
positions due to their lack of the required skills (Daniels, 2007). A within-sector
change would mean changes within organisations that require employees to be re-
trained or taught new skills. At an economy-wide level, this could result in a critical
skills shortage (Daniels, 2007). This shows that South Africa is not only having to
deal with the skills shortage as a result of Apartheid education, but also skills based
changes due to reintegration with the international market (Daniels, 2007, Kingdon &
Knight, 2005). The result of this is that the labour demand was not great enough to
support the labour supply and as a result we have a mismatch between demand and
supply (Daniels, 2007, Kingdon & Knight, 2005).
10
In an attempt to curb this mismatch and to produce more skilled workers (as there is
greater opportunity and demand for them than unskilled labour) the Skills
Development Act was passed (Daniels, 2007, Kingdon & Knight, 2005). This Act
outlines what needs to happen for skills development to be changed and how
organisations are expected to train workers (Daniels, 2007, Kingdon & Knight, 2005).
This led to the Human Resources Development Strategy which tried to target three
levels of skills development by focusing on the linking of schooling (and adult)
education, human resource development (including tertiary education), demand-side
dimensions (skills that are to be given by the employers) and finally, national
systems of innovation, research and development (Daniels, 2007). However, the
impact of this has not yet been seen in the engineering sector.
In 2011, 9 287 students graduated as engineers in South Africa (Esterhuizen, 2013).
This number fell short of the goal set by the Higher Education and Training Minister,
Dr Blade Nzimande who was hoping to see 10 093 engineering science graduates
(Esterhuizen, 2013). Dr Nzimande reported that interventions were being put into
place in order to increase this number, but that changes would only be evident in
2015/2016 (Esterhuizen, 2013). In the mean time, only16% of enrolled students have
graduated, below that of the international calculation of 24% (Seggie, 2012). The
graph below displays the difference for the past number of years between the
number of students enrolled in engineering courses, compared to the percentage
that graduate as qualified engineers (Seggie, 2012). The graph shows the number of
students who registered in a given year, as well as the number of students who
graduated in that year (Seggie, 2012). So while it is not a direct comparison between
the same students, it does still serve to illustrate the gap between the number of
students a university will accept every year, compared to the number of engineers
they are able to produce into the working world (Seggie, 2012). As discussed above,
these figures should steadily increase throughout the upcoming years.

11
Figure 1: Degree & Diploma Enrolments vs. Graduates
South Africa is not the only country that is experiencing problems with identifying
suitable candidates and ensuring that these students complete the engineering
course to qualify. In an Australian study from 2002 to 2006, it was discovered that
only around 20% of the students who started the four-year engineering course were
able to graduate during those four years with 60% of their peers dropping out of the
course completely (Cuthbert & MacGillivray, 2007). It was also discovered that if an
extra support programme in mathematics was attended, then the student was twice
as likely to complete the course as one who did not (Cuthbert & MacGillivray, 2007).
This paper goes farther afield than Australia by additionally quoting a source from
the UK which states that there are drop-out rates of more than 20% and the main
concern is that students will be missing out on an invaluable education opportunity
by leaving the course (Cuthbert & MacGillivray, 2007). The United States is also
familiar with this problem with reportedly 50% of their engineering students dropping
out within the first two years of the course (Cuthbert & MacGillivray, 2007). In most
countries, this results in a constant struggle between the government (who want the
universities to produce as many graduates as possible) and the forever dwindling
pool of students who are able to complete these courses (Cuthbert & MacGillivray,
2007). In an attempt to try and keep as many students in the programme as

12
possible, many universities have developed courses that will run alongside the
tertiary syllabus and give the students the extra help and guidance they need
(Cuthbert & MacGillivray, 2007).
The greatest challenge within engineering courses appears to be the mathematical
content (Rylands & Coady, 2009). This is not purely a South African problem but is
seen in countries such as Australia, the UK, Ireland and the United States (Rylands
& Coady, 2009). This inability to cope with the mathematics component seems to
cause a high failure and drop-out rate, not only in engineering, but in other
mathematically based courses such as science and health subjects (Rylands &
Coady, 2009). Possibly one of the reasons for large failure rates is that students are
selected generally based on one number (which in South Africa would be their matric
average or their mathematics results) and they are then put into a class where
mathematics is taught to a broad range of students with various backgrounds and
various course choices (Rylands & Coady, 2009). In some instances, the solution
was to lower the level of mathematics that is taught (as we can see in our South
African schooling system) which resulted in students not gaining the skills they
required for future learning in other related courses (Rylands & Coady, 2009). The
study done by Rylands and Coady (2009) aimed to find a relationship between
secondary school mathematics results and first-year tertiary education mathematics
results. It was found that there was indeed a relationship between the secondary
school marks and the first-year university marks (Rylands & Coady, 2009). This
bodes badly for South Africa where basic education is a problem (Christie, 1998).
There are very few options available to those students who are studying engineering
but are unable to grasp the mathematics component (Rylands & Coady, 2009). Their
three options are to either repeat the year (which they can only do once), change to
a course that is not so mathematically based or to leave the university altogether
(Rylands & Coady, 2009). These solutions which are available to failing students can
only lead to adding to our skills shortage and specifically, the shortage of qualified
engineers. The authors of this study did not feel that it was plausible to include a
course alongside the current syllabus due to time constraints, but they came up with
the solution of a bridging course (Rylands & Coady, 2009). Students whose
mathematics results (before their tertiary education) are poor should be asked to
attend a preparatory mathematics course prior to commencing their engineering

13
degree (Rylands & Coady, 2009). They recommended that only those who are able
to pass this course should be entered into the engineering programme (Rylands &
Coady, 2009).
3.3 Understanding the concept of Validity
Before examining the tests to be studied as well as studies of a similar nature, it is
important to understand the concepts of validity and predictive validity. Validity can
be defined as the examination of what the test measures and how well it does so
(Anastasi, 1990). It aids in understanding what can be inferred from the test scores
(Anastasi, 1990). There are many types of validity which will be discussed below,
concluding with a definition of predictive validity which is crucial to this study.
Descriptive validity is the initial type of validity one would encounter in a study as it
involves the processes used when data gathering (Winter, 2000). Descriptive validity
would examine whether the processes of gathering the data were the same
throughout data collection and that the processes of coding the data were kept
consistent (Winter, 2000). Interprative validity is how the researcher interprets the
data (generally based on how he has worded it and captured it initially) (Winter,
2000). The interpretation of the data needs to be kept consistent throughout the
analyses (Winter, 2000). Evaluative validity refers to an application of an ‘evaluative
framework’ when interpreting the data (Winter, 2000). The ‘evaluative framework’ will
aid the researcher in keeping the interpretation consistent and without error (Winter,
2000).
Content validity refers to how well the test measures the subject matter that is being
examined (Messick, 1987). Criterion-related validity compares external criteria to the
test matter in order to ensure that the subject matter which it claims to test, is
actually being tested (Messick, 1987). Construct validity looks at the degree to which
explanatory concepts account for one’s performance on the assessment (Messick,
1987).
Predictive validity refers to the ability to use the test (or any other variable) to
predict/foresee other (possibly unrelated) factors (Anastasi, 1990). In this instance,
the predictive validity is using the test scores in an attempt to predict what the
student will be achieving in terms of academic results.

14
3.4 Intelligence Testing and Engineering
Both of the tests used in the current study are broadly referred to as measures of
intelligence (Babcock, 1994). Over the years intelligence has been a concept of
interest and has sparked debate which has led to several definitions; some of which
will be outlined here. Firstly, Intelligence can be defined as how well a person will
perform in various environments (Hernandez-Orallo & Dowe, 2010). An alternative
way of defining intelligence is that intelligence itself involves information processing
and that the action of processing can be measured through certain cognitive tasks
(Fagan, 2000). Yet another view of general intelligence is that it is the ability to gain
knowledge from one’s external environment and then apply it in an attempt to
understand and navigate new situations (Lam & Kirby, 2002). This definition speaks
most to the engineering subject of mathematical ability. The students will be taught
underlying theory and problem-solving reasoning, after which they will be expected
to apply it to new and abstract mathematical problems. This definition comes with
some basic underlying assumptions. Firstly, it assumes that people are born with
their potential intelligence and that it is a fixed asset. This base intelligence will then
be worked on to gain the newer knowledge and understanding, but this will only build
up to a certain level. Once the student has reached the peak of his/herpotential
intelligence, s/he will not be able to build on that further. Secondly, it assumes that
general intelligence is measurable through tests that pose problems such as
completing number series, recognising patterns and analogies which will make use
of mathematical reasoning, verbal abilities and spatial-visualisation (Lam & Kirby,
2002). As the Raven’s Advanced Progressive Matrices and the Abstract Reasoning
Test are both tests of pattern recognition and abstract thinking, by the above
definition, they are able to measure general intelligence (Lam & Kirby, 2002). The
definition of intelligence came to spark such debate that 52 experts colluded to give
the following all-encompassing definition: “A very general mental capability that,
among other things, involves the ability to reason, plan, solve problems, think
abstractly, comprehend complex ideas, learn quickly and learn from experience. It is
not merely book-learning, a narrow academic skill, or test-taking smarts. Rather, it
reflects a broader and deeper capability for comprehending our surroundings –
‘catching on’, ‘making sense’ of things or ‘figuring out’ what to do” (Gottfredson, 1997

15
as cited in Lubinski, 2004). Engineering subjects such as mathematics, that may be
based more on one’s reasoning and abstract thinking ability would relate back to
Gottfredson’s thinking rather than subjects such as Economics which would require
‘book-learning’.
There is a variety of intelligence tests, but there are three criteria which are common
to all the tests and which have to be examined when deciding on which test to use
(Hernandez-Orallo & Dowe, 2010). These three specifications are that there is a
subject to be tested, that a set of questions is posed to this subject and the scoring
of these questions correlate to a specific meaning (Hernandez-Orallo & Dowe,
2010). Both tests used in this study measure a participant’s general intelligence,
which is a concept coined by Spearman and thus referred to as ‘Spearman’s g”
(Duncan, Seitz, Kolodny, Bor, Herzog, Ahmed, Newell & Emslie, 2000, Embretson &
McCollam, 2000). Spearman noticed that participants who performed well in
cognitive tasks almost universally performed well in other, very different tasks
(Duncan et al., 2000). In order to understand this phenomenon, Spearman reasoned
that those participants must have a high g factor (general intelligence) which enables
them to perform well in various tasks (Duncan et al., 2000). Spearman also
acknowledged that a participant might only perform well in a specific task, which has
become to be known as Spearman’s ‘s’ – specific factor intelligence (Embretson &
McCollam, 2000). One of the tests in which high scores will correlate with a high g
factor is the Raven’s Progressive Matrices (Duncan et al., 2000). Thomson added to
this argument by stating that high g factor levels show the overall efficiency of the
participants’ cognitive functions (Duncan et al., 2000). A student of Spearman, John
Raven, developed a test which he felt would aid in measuring general reasoning
(Embretson & McCollam, 2000). This test was one of the predecessors to the
Advanced Raven’s Progressive Matrices as it contained the same three-by-three
array of patterns in which the ninth one had to be selected from a variety of choices
(Embretson & McCollam, 2000). As such, it can be argued that high scores on
general intelligence measures such as the Abstract Reasoning Test and the Raven’s
Advanced Progressive Matrices will show high cognitive abilities such as pattern
recognition and general intelligence in the participants, and an ability to perform well
academically.

16
Analytical reasoning is also an important concept when understanding these tests
and what they measure. Analytical reasoning is generally examined in relation to
complex problem solving such as may be found in a Mathematics engineering
course (Prietula & Simon, 1989). Analytical reasoning happens when the participant
gathers information, uses the knowledge that he or she already possesses and then
proposes a solution once they have fully understood (through observation) the
situation at hand (Prietula & Simon, 1989). This is based upon the idea that a person
will consider the different options available to them before choosing the one they feel
will work best (Prietula & Simon, 1989). This theory can be used to understand the
process the participants must go through in terms of the psychometric tests in this
study. They will need to use their knowledge and reasoning power to analyse the
pattern and the different options available to finish the pattern before choosing the
one they feel is the most correct.
Biographical variables will play an important part in the understanding a student has
in terms of psychometric tests and university learning. The language in which a
student is taught (and how that might differ from his/her home language) is such a
biographical variable (Schaap & Luwes, 2013). The proficiency with which a student
is able to understand and interpret the language that is used when teaching subjects,
such as mathematics, which require strong reasoning and strategic skills, is
important (Schaap & Luwes). As such, if the participant’s home language is not
English, it is important to investigate this variable and whether or not it has an impact
on the psychometric test scores and/or the academic results achieved by that
student (Schaap & Luwes, 2013).
Finally, gender has also been examined in the context of subjects that are strong in
mathematical and scientific content (van Langen & Dekkers, 2005). From secondary
school upwards, females are half as likely as males to choose subjects that are
based in science or mathematics (van Langen & Dekkers, 2005). This will inevitably
lead to engineering continuing to be a male-dominated field (van Langen & Dekkers,
2005). Although in most Western countries the number of females in engineering is
constantly rising to equal the number of men, this is not yet the case in all countries
(van Langen & Dekkers, 2005). Interestingly, van Langen and Dekkers (2005) looked
back over school subject choices and identified that there were many candidates
who would be qualified to study engineering, if they had taken the required subjects,
17
which they did not, despite being academically qualified to do so. They described
this loss of candidates as ‘spillage’ from the pipe that would service the need for
engineers and attribute some of this to the reason there is a shortage of qualified
people in this field (van Langen & Dekkers, 2005).
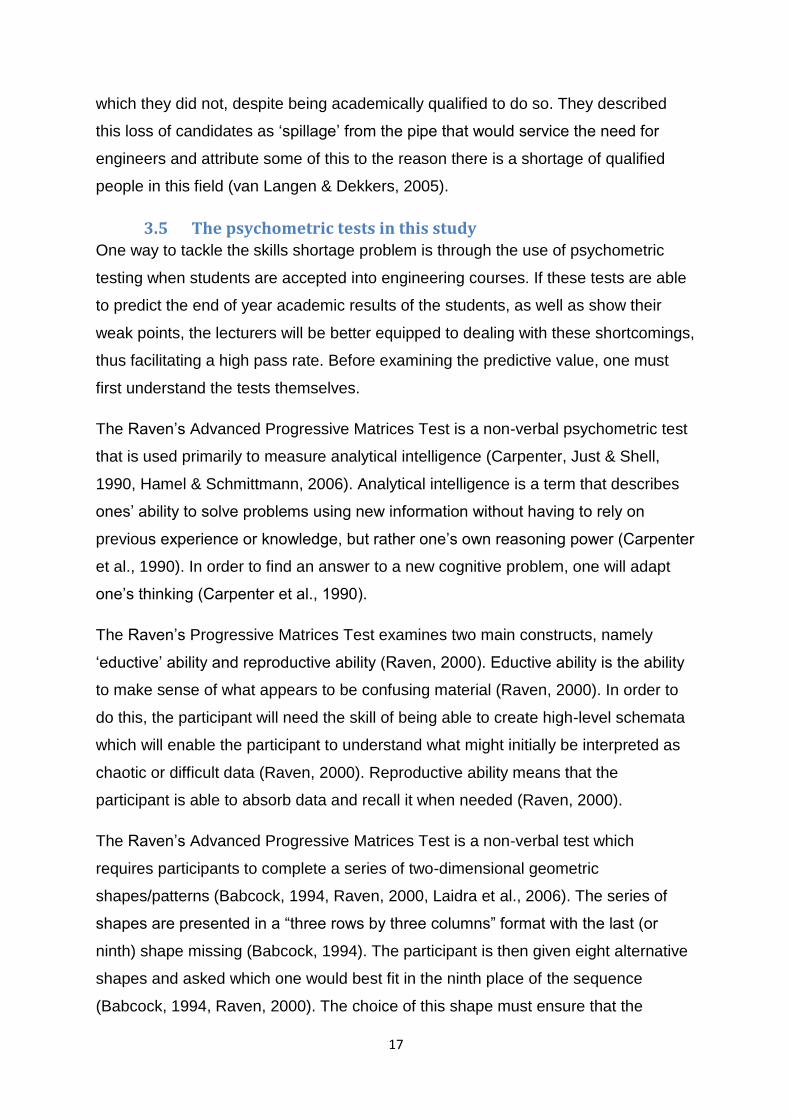
3.5 The psychometric tests in this study
One way to tackle the skills shortage problem is through the use of psychometric
testing when students are accepted into engineering courses. If these tests are able
to predict the end of year academic results of the students, as well as show their
weak points, the lecturers will be better equipped to dealing with these shortcomings,
thus facilitating a high pass rate. Before examining the predictive value, one must
first understand the tests themselves.
The Raven’s Advanced Progressive Matrices Test is a non-verbal psychometric test
that is used primarily to measure analytical intelligence (Carpenter, Just & Shell,
1990, Hamel & Schmittmann, 2006). Analytical intelligence is a term that describes
ones’ ability to solve problems using new information without having to rely on
previous experience or knowledge, but rather one’s own reasoning power (Carpenter
et al., 1990). In order to find an answer to a new cognitive problem, one will adapt
one’s thinking (Carpenter et al., 1990).
The Raven’s Progressive Matrices Test examines two main constructs, namely
‘eductive’ ability and reproductive ability (Raven, 2000). Eductive ability is the ability
to make sense of what appears to be confusing material (Raven, 2000). In order to
do this, the participant will need the skill of being able to create high-level schemata
which will enable the participant to understand what might initially be interpreted as
chaotic or difficult data (Raven, 2000). Reproductive ability means that the
participant is able to absorb data and recall it when needed (Raven, 2000).
The Raven’s Advanced Progressive Matrices Test is a non-verbal test which
requires participants to complete a series of two-dimensional geometric
shapes/patterns (Babcock, 1994, Raven, 2000, Laidra et al., 2006). The series of
shapes are presented in a “three rows by three columns” format with the last (or
ninth) shape missing (Babcock, 1994). The participant is then given eight alternative
shapes and asked which one would best fit in the ninth place of the sequence
(Babcock, 1994, Raven, 2000). The choice of this shape must ensure that the

18
pattern for both the row and column is continued (Babcock, 1994). An example of a
test item is given in Figure 2. The test takes between thirty and forty minutes to
complete, with 36 items in total (Babcock, 1994, Hamel & Schmittmann, 2006). The
difficulty of the items will gradually increase as the test progresses (Hamel &
Schmittmann, 2006). This test does not only test the thinking skills of the participant,
but also their ability to think clearly (Babcock, 1994). It is important to note that there
is a significant relationship between performance on the Raven’s Advanced
Progressive Matrices and other tests which are used to measure general intelligence
(Babcock, 1994). However, there is no conclusive evidence as to whether or not
one’s performance on the Raven’s Advanced Progressive Matrices is correlated to
verbal or non-verbal abilities (Babcock, 1994). It is also important to note that there is
additionally no conclusive evidence as to the relationship between the Raven’s
Advanced Progressive Matrices and memory tests (Babcock, 1994)
The use of the Raven’s Advanced Progressive Matrices Test to better understand
the cognitive abilities of engineering students is not a new concept. A few studies in
which the test was administered with a view to furthering various bases of knowledge
regarding engineering students’ cognitive abilities will now be discussed.
When using the Raven’s Advanced Progressive Matrices Test in a South African
university, it is important to consider the differences that might arise as a result of
biographical variables such as socio-economic status and race (Rushton, Skuy &
Figure 2: Example of an item in the Raven’s Advanced Progressive Matrices test

19
Bons, 2004). A study which examines the construct validity of the Raven’s Advanced
Progressive Matrices Test in terms of African and non-African students was
conducted at the University of the Witwatersrand in 2004 (Rushton et al., 2004). The
sample comprised 177 African students, 57 Indian students and 72 White students.
Out of the possible 36 problems in the Raven’s Advanced Progressive Matrices,
African students (on average) scored a 23 mean score, with the Indian students
scoring 26, and finally, the White students scoring 29 (Rushton et al., 2004).
Additionally, it was also found that the academic marks obtained by these student
groups behaved in much the same pattern, with the White students obtaining the
highest marks, followed by the Indian students and finally, the African students
(Rushton et al., 2004).
The Spearman-Jensen hypothesis states that differences in race become more
pronounced in tests that have a high general factor of intelligence (Rushton, Skuy &
Fridjhon, 2002). As such, one must add a cautionary note about interpreting scores
and linking them to the biographical variable of race (Schaap & Luwes, 2013).
Although 10 years have passed since these findings (and therefore results may be
different), one must keep these results in mind when interpreting the relationship
between test scores and end of year marks as it has been acknowledged that
Western tests may not properly reflect general and analytical intelligence in African
students (Rushton et al., 2004). In terms of other biographical variables, it is found
that race in South Africa links to socio-economic factors where previously
disadvantaged African pupils are often victims of a schooling system that lacks the
necessary infrastructure to give optimal learning opportunities (Schaap & Luwes,
2013). This will, in turn, lead to lower academic results at a tertiary education level
(Schaap & Luwes, 2013).
The Abstract Reasoning Test (ART) is very similar to the Raven’s Advanced
Progressive Matrices test. It too comprises shapes/patterns in a 3x3 matrix for which
the participant is required to choose the correct shape to complete the pattern in the
9th slot (Psytech, retrieved on 15/08/2014). This shape must complete the sequence
both horizontally and vertically (Psytech, retrieved on 15/08/2014). Figure 3 gives an
example of a test item. Participants are given 30 minutes to complete the 35
questions in the Abstract Reasoning Test, after which they are required to stop,
regardless of whether or not they have completed the test (Psytech, retrieved on

20
15/08/2014). In the Abstract Reasoning Test, the participant is only given six
possible choices from which to choose the shape that will complete the sequence
(Psytech, retrieved on 15/08/2014). As the Abstract Reasoning Test is similar to the
Raven’s Advanced Progressive Matrices, it can be argued that the ART measures
the same intellectual skills, cognitive skills and abilities as does the Raven’s
(Psytech, retrieved on 15/08/2014).
3.6 Background of similar studies
In essence, this study examines the relationship between the scores of students on
analytical intelligence tests and their academic marks. In a study which examined
school children between the level of Grade 2 to Grade 12, it was found that the
Raven’s Standard Progressive Matrices were the best predictor with regards to the
overall year mark achieved by the students (Laidra et al., 2006). However, the
authors warn that it appears that this correlation is stronger in younger children and
declines with age steadily throughout their schooling and into their tertiary education
(Laidra et al., 2006). However, they did acknowledge that this could possibly be due
to smaller sample sizes relating to the lesser number of pupils to choose from as the
population decreases as the education level increases (Laidra et al., 2006). The
other possibility for this decline is that the standard of work does not stay the same in
order to retain the same mark (Laidra et al., 2006). As one’s level of education
Figure 3 Figure 3: Example of a test item from the Abstract Reasoning Test

21
increases, so does the standard of work one is expected to produce (Laidra et al.,
2006).
Certain abilities of engineering students that can be tested and possibly improved
have previously been studied. One of these studies examined spatial ability and
visual imagery in relation to engineering students (Potter & van der Merwe, 2001).
Before this study was conducted, the failure rate for the Engineering Graphics
course at the University of the Witwatersrand was 36% (with an 80% failure rate
being calculated for the African students) (Potter & van der Merwe, 2001). It must
also be noted that on the whole, (although it was not statistically significant) female
students struggled slightly more than their male counterparts with regard to these
skills (Potter, van der Merwe, Kaufman & Delacour, 2006, Sorby, 2009). These
authors have also mentioned that they felt the greatest contributor to this lack of
skills could be traced back to the Apartheid era and the inferior education that some
scholars are still receiving as a result (Potter et al., 2006). When tested, these
students also showed low scores on various tests that measured spatial ability and
general academic performance (Potter & van der Merwe, 2001, Sorby, 2009).
However, it was found that students could be trained in perception and their ability to
use mental imagery improved (Potter & van der Merwe, 2001, Sorby, 2009). Once
the course was altered to improve the skills that were found to be weak, the pass
rate went up to 88% which was considered to be a vast improvement (Potter & van
der Merwe, 2001).
Table 1 shows the data gleaned from the Engineering Department regarding the
pass rates from 1995 – 2001 (Potter et al., 2006). The overall success of these
students was believed to be the result of changes to tuition and programmes that
aided those students who were struggling in a particular field (Potter et al., 2006).
The students were split into 2 groups, those who were seen to have weaknesses
within this skill set and who attended a year long course (A) and those who were
proficient in the skills and required a 6 month course only (B) (Potter et al., 2006).

22
Table 1: Academic Results in Wits Engineering students from 1995 to 2001
Year Course Pass Rate (%)
1995 A 84
B 83
1996 A 89
B 87
1997 A 94
B 92
1998 A 87
B 94
1999 A 95
B 82
2000 A 94
B 91
2001 A 93
B 92
As the above information shows, the weaknesses of a particular group/class can be
tested at the beginning of the year so as to alert the lecturers and class coordinators
as to where they should focus in order to try and combat any weaknesses while
improving the knowledge of the students. Using this knowledge, we can see that the
differences between the group of students who may have failed and those who were
likely to excel, was lessened, with all the students being given the opportunity to do
well (Potter et al., 2006).
The great divide between students in terms of their education and skills prior to
entering university and the skills they need to develop in the tertiary education forum
is not only found in South Africa (Taylor & Morgan, 1999). In Australia, several
challenges were found with regard to educating engineers in their first year of tertiary
education (Taylor & Morgan, 1999). The main challenges were the spread of student
abilities and the uneven preparedness within the class (Taylor & Morgan, 1999). This

23
meant that lecturers were at a loss as to where to start the curriculum and on which
skills to focus (Taylor & Morgan, 1999).
This study aims to understand whether or not the Raven’s Advanced Progressive
Matrices and the Abstract Reasoning Test can be used to find weaknesses in the
students at the beginning of the academic year. This information will give the
lecturers a chance to develop a syllabus with an emphasis on improving these
weaker areas, facilitating a higher pass rate which will benefit not only the students
and the university, but the South African shortage of engineers too.
Using the information given above, there is a basis for the research in terms of
finding a correlation between the Raven’s Advanced Progressive Matrices test and
the Abstract Reasoning Test and the academic marks engineering students will
achieve in their first year. The predictive validity of the tests will be used to ascertain
whether or not the psychometric assessments can be used as predictors of the
academic results students will achieve in both their mid-year and end of year results.
However, there is potential that biographical factors (for example, home language)
may negatively influence the scores that participants will receive on the psychometric
tests.
3.7 Research Hypotheses/Questions
1. The Abstract Reasoning Test scores predict first year engineering students’
mid and end of year results.
2. The Raven’s Advanced Progressive Matrices scores predict first year
engineering students’ mid and end of year results.
3. The Abstract Reasoning Test is a more powerful predictor of academic results
than the Raven’s Advanced Progressive Matrices.
4. Biographical variables contribute to the scores achieved by students on the
Abstract Reasoning Test and the Raven’s Advanced Progressive Matrices.

24
Chapter 4: Method
4. Method
4.1 Overall Research Design
This study was a non-experimental, cross-sectional, correlational design, using
archival data.
4.1.1 Sample
The sample came from the Engineering Department at the University of the
Witwatersrand. Specifically the archival data from the first year students from 2014
and 2013 was used. As such, this means that data was gathered through
convenience sampling.
The potential maximum size of the sample is 410 students from 2013 and 305
students from 2014. As such, the total possible sample for this study is 715
participants. These figures are taken from the number of students in the archival
data, however this number will be reduced as the students who did not participate in
the psychometric testing or who did not give consent for their results to be used in
the study are removed from the sample.
The archival data for 2013 recorded biographical variables such as education level,
race, first language, whether or not the participant has a disability and whether or not
their previous education was done primarily in English. The 2014 data has
additionally recorded whether the participants attended a private or government
school. It is also important to note that for both years, it was recorded whether or not
the student was repeating first year.
Due to differences in the data between the years, this project has been split into two
phases. These differences will be discussed in greater detail in the Results section of
this report. In Phase One, the sample is analysed as a whole in order to gain
information about the sample in completion, as well as overall trends. In Phase 2, the
2013 first year students and the 2014 first year students have been split and
analysed separately.
The biographical variables were analysed for each phase and the following figures
produced.

25
1.1.1 Phase 1: Biographical Information
Figure 4 displays the frequencies of sex within the total sample of students (both the
2013 and 2014 year)
Figure 4: Frequency of gender distribution (N=393)
1.8% of the sample did not provide their gender, 216 participants are male and 172
are female. This results in a majority 54.7% of the sample as men.

26
Figure 5: Frequency of age distribution among sample (N=395)
Figure 5 displays the frequencies for the different ages of students within the sample.
88.6% of the sample lay between the ages of 18 and 20 years old. The biggest age
group is the 19 year old students with 141 participants, followed by the 20 year old
and 18 year old students with 105 and 105 participants respectively.

27
Figure 6: Frequency of degree distribution among sample (N=393).
Figure 6 displays the frequency of students studying towards each of the various
degrees. The greatest grouping in the biographical variable of ‘Degree’ is the 186
students studying Chemical Engineering. The second highest group are the students
studying Engineering but for whom no specialisation was given. The smallest groups
according to Degree are the BSC Chemistry and the BSC Metallurgy Engineering
with Material Science which comprise one student each in this sample.

28
Figure 7: Frequency of home language distribution among sample (N=393)
Figure 7 gives an overview of the number of students who speak each language as
their primary, home language. The largest group in terms of home language are the
students who speak English as 19.7% (78 students) have English as their first
language. This is closely followed by Sepedi (18.2%) and isiZulu (16.7%). In total,
77.4% of the sample were students whose home language was an African language.
This is important to keep in mind in terms of the inherent, potential biases in
psychometric tests such as the Raven’s towards non-Western, non-English speaking
participants (Rushton et al., 2004). This bias was discussed in the previous section
and will be analysed with respect to the results in the Discussion section of this
report. A test will show bias if members of a certain group achieve similar academic
results as members of other groups, but lower scores on the test/assessment than
those members (Rushton et al., 2004).

29
Figure 8: Frequency of race distribution among sample (N=393)
Figure 8 displays the distribution of race in this sample. 80.3% of the participants are
African, 12.2% Asian, 5.3% White and 1% Coloured. As with the home language
bias, the intricacies of Apartheid and the lack of education for African students (as
discussed in the previous section) may also have an impact on this study and the
bias that results from the use of psychometric tests on this sample.
1.1.2 Phase 2: Biographical Information
This section will outlay the biographical variables for the 2013 first year students and
the 2014 first year students separately. This will allow for a comparison to be made
between the two samples.
Table 2: Comparison of Gender Ratios between 2013 and 2014 first year students
Gender 2013 First Years 2014 First Years
Male 58 158
Female 54 118
N 115 278
30
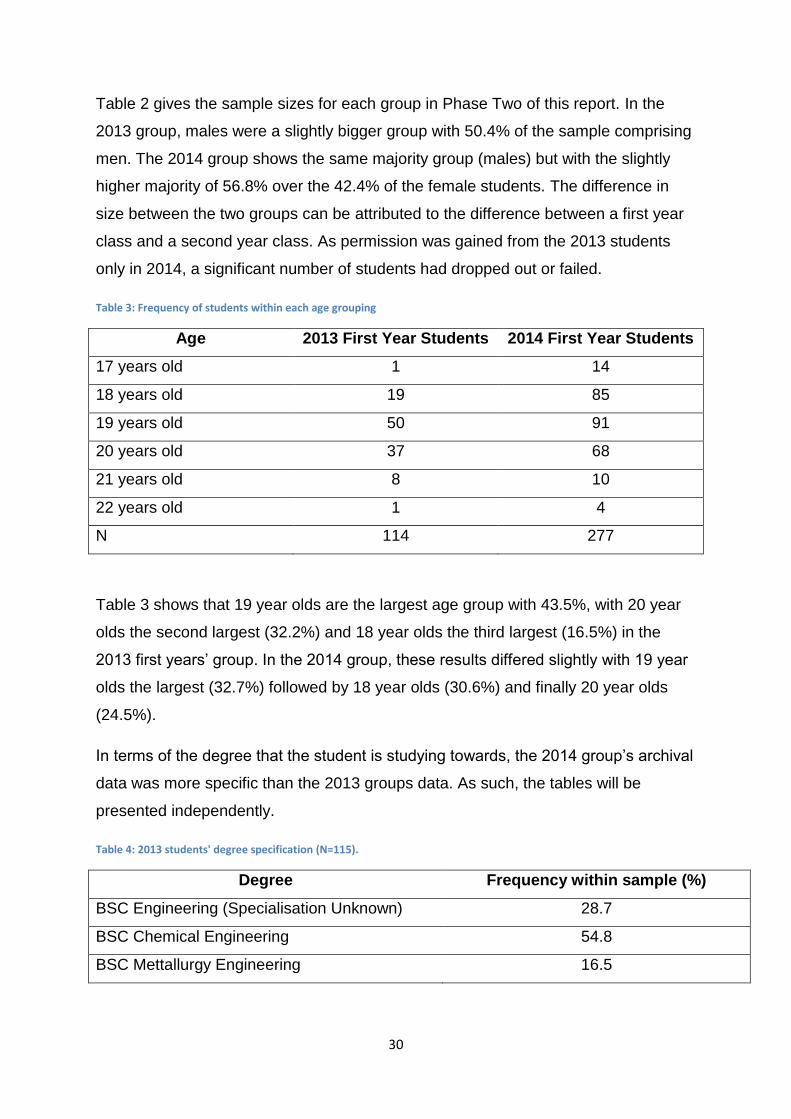
Table 2 gives the sample sizes for each group in Phase Two of this report. In the
2013 group, males were a slightly bigger group with 50.4% of the sample comprising
men. The 2014 group shows the same majority group (males) but with the slightly
higher majority of 56.8% over the 42.4% of the female students. The difference in
size between the two groups can be attributed to the difference between a first year
class and a second year class. As permission was gained from the 2013 students
only in 2014, a significant number of students had dropped out or failed.
Table 3: Frequency of students within each age grouping
Age 2013 First Year Students 2014 First Year Students
17 years old 1 14
18 years old 19 85
19 years old 50 91
20 years old 37 68
21 years old 8 10
22 years old 1 4
N 114 277
Table 3 shows that 19 year olds are the largest age group with 43.5%, with 20 year
olds the second largest (32.2%) and 18 year olds the third largest (16.5%) in the
2013 first years’ group. In the 2014 group, these results differed slightly with 19 year
olds the largest (32.7%) followed by 18 year olds (30.6%) and finally 20 year olds
(24.5%).
In terms of the degree that the student is studying towards, the 2014 group’s archival
data was more specific than the 2013 groups data. As such, the tables will be
presented independently.
Table 4: 2013 students' degree specification (N=115).
Degree Frequency within sample (%)
BSC Engineering (Specialisation Unknown) 28.7
BSC Chemical Engineering 54.8
BSC Mettallurgy Engineering 16.5

31
Table 4 shows that in the 2013 first year students, the majority of the sample are
studying towards a Chemical Engineering Degree. Table 5 shows the degrees to
which the 2014 first year students are studying.
Table 5: 2014 students' degree specification (N=278)
Degree Frequency within sample (%)
BSC Engineering (Specialisation Unknown) 30.2
BSC Chemical Engineering 44.2
BSC Mettallurgy Engineering 11.9
BSC Chemistry .4
BSC Materials Science with Metallurgical
Engineering
10.5
Not Provided 1.4
In the 2014 sample, the largest group of students is also studying toward attaining a
BSC Chemical Engineering degree. However, the specificity of the 2014 group
makes it difficult to compare the two years.
The first language of the student’s was analysed to produce the Table 6:
Table 6: Frequency of home language speakers for 2013 and 2014 students
First Language 2013 First Year Students 2014 First Year Students

32
English 14.8% 21.9%
Afrikaans 1.7% .4%
isiZulu 16.5% 16.9%
siSwati 2.6% 4%
isiNdebele 0% 1.8%
Sepedi 23.5% 16.2%
Xitsonga 7% 5.8%
Setswana 9.6% 10.8%
SeSotho 8.7% 6.5%
Tshivenda 5.2% 9.4%
isiXhosa 7% 5%
Other 2.6% 1.4%
N 115 278
This table shows Sepedi first language speakers as the largest group followed by
isiZulu and English first language speakers for the 2013 first year students. In the
2014 student group, English speakers were the largest group, after which isiZulu and
Sepedi home language speakers were the next largest respectively.
Finally, race was examined in Table 7 in terms of the two years.
Table 7: Racial differentiation between 2013 and 2014 first year students
Race 2013 First Year Students 2014 First Year Students
African 98 219
White 7 14
Asian 7 41
Coloured 2 2
Other 1 2
N 115 278
As with Phase One, African students are in the vast majority for both groups, which
again places emphasis on the cautionary point of interpreting and analysing the test
results with caution.

33
4.1.2 Procedure
The following process was followed with regard to the data collection aspect of this
research report:
1. The archival data was obtained from Lorenzo Woollacott in the Engineering
Department
2. The students whose data was to be used in this research report were
approached during lecture times and asked to sign the consent forms
(Appendix A). Before signing the consent forms, the participants were given
the participant information sheet to read through and keep should they have
any further questions. There are two different participant information letters,
one for students who were in second year at the time of data collection
(Appendix B), and the other for students who were in first year at the time of
data collection (Appendix C).
3. As the students who were completing their first year in 2014 had not
completed the Abstract Reasoning Test, Psytech was contacted and asked to
conduct the test during a lecture period where all the students were expected
to be present.
4. The consent forms were cross checked with the data obtained from the
Engineering Department and all students whose consent had not been given,
were deleted from the database.
5. The analyses were then conducted.
4.1.3 Analysis
Cronbach’s Alphas were used to calculate the reliability of the Abstract Reasoning
Test. The overall score was .78 meaning that the scale can be credibly used in this
research project. According to Gliem and Gliem, the following rules of thumb can be
applied to Cronbach’s Alpha: above .9 is excellent, above .8 is good, above .7 is
acceptable, above .6 is questionable, above .5 is poor and anything below that score
is not reliable (Gliem & Gliem, 2003). As such, this score reflects that the scale is
reliable.
Unfortunately, the archival data did not contain the item scores for the Raven’s
Advanced Progressive Matrices and the reliabilities could therefore not be
conducted.

34
To determine any differences in the data, skewness coefficients, T-Tests and Mann-
Whitney U tests were run.
In order to calculate the predictive value of the test, correlations and regressions
were used. A correlation was used to understand the strength and direction of the
association between the psychometric test scores and the academic results of the
students (Stangor, 2011). Regression was used to explore whether or not the test
scores can be used independently to predict what the participants might receive as
academic marks during their first year of study (Stangor, 2011).
Averages were calculated to compare the key variables (namely the Abstract
Reasoning Test and the Raven’s Advanced Progressive Matrices) on the basis of
certain demographics with ANOVAS and post-hoc tests used to ascertain where the
significant differences were.
Finally, ANCOVAs were used to ascertain whether there were any significant
differences on the high, medium and low scores on the ART and Raven’s taking the
different student years (2013 or 2014 first years) into consideration. How these three
groups were formed is discussed in more detail in the results section of this report.
4.1.4 Measures/Instruments
The first measure that was used is the Abstract Reasoning Test. The second
measure is the Raven’s Advanced Progressive Matrices Test. Both of these tests
have been discussed in detail in the literature review with an example question given
for each.
Please note that due to copyright issues, these tests have not been placed in the
appendices of this proposal. Should you require them, the Abstract Reasoning Test
is available from Psytech and the Raven’s Advanced Progressive Matrices from JvR.
4.1.5 Ethics
An application was made to the University of the Witwatersrand’s Human Research
Ethics Committee (non-medical) for approval before accessing or analysing any of
the data from the Engineering Department. The ethical clearance certificate can be
found in Appendix D of this report. However, this project falls under ethical approval
which has already been obtained for research in the Engineering faculty (Appendix
E).

35
3.1.5.1 Informed Consent
Participants were all asked to complete a consent form which gives me access to
their test scores on the Raven’s Advanced Progressive Matrices Test and the
Abstract Reasoning Test as well as their mid- and end of year academic marks (See
Appendix A). Participants who did not complete and return the consent form, have
had their marks deleted from the database before any analyses were done.
Participation in the study was entirely voluntary and no negative or positive
consequences will result from participation. It is also important to note that the
participants of the study will receive no benefit from participating.
3.1.5.2 Anonymity
Participants were asked for their student numbers in order to match their consent
forms to their test scores and academic marks. Once the database was cleaned of
any students who were not willing to participate, the student numbers of the
participants were deleted and the researcher had no further knowledge of which
marks belonged to which students for the analyses.
Anonymity could not be guaranteed to the participants in terms of the matching of
consent forms to test scores and academic marks, however, identities werel kept
strictly confidential and anonymity could be guaranteed in terms of analytic and final
write-up purposes.
3.1.5.2 Confidentiality
Only the researcher and her supervisor (outside of the Engineering Department and
Psytech) had access to the scores and marks with the student names/numbers. No
individual results were reported. This ensured confidentiality of individual results and
anonymity of individual results in the final report.
3.1.5.3 Potential harmful outcomes for subjects and procedures to deal with these
No potentially harmful outcomes were identified in this study. However, it must be
added that there were no benefits to participants for participating in the study.
3.1.5.4 Debriefing
A summary of the results obtained will be made available to the Engineering
Department at the University of the Witwatersrand. This summary will be emailed to
the lecturers within the department who assisted with the data collection and the
signing of consent forms.

36
This summary will be made available to students on public notice boards within their
department where they are easily able to access that information. No individual
scores will be given, just the overall trends that were found.
The results from the analyses will be reported in the research essay and possibly in
journal articles and at conferences. The scores and academic marks will be kept for
as much time as necessary and will be stored securely by the researcher’s
supervisor until all potential publications have been completed.

37
Chapter 5: Results
5. Results
This section is split into three phases. Phase one will analyse the sample as a whole,
encompassing both the first year students from 2013 and 2014. Phase two will then
be a division of the two groups, examining each year separately to analyse whether
any changes are found. Finally, Phase three will examine the relationship between
the scores achieved on the psychometric tests and the academic results achieved by
the students, using the year as a covariate.
5.1 Phase 1: Combined sample
The initial step in the analysis was to describe the data and examine its normality
(Table 8). The number of students who participated in each subject ranged from 212
(ECON1007 and CHEM1031 – both end of year results) to 391 (CHMT1000 – mid-
year). There was a decrease in student numbers between the mid-year and final
year results for each subject. This could be due to students failing or leaving the
university or course.
The minimum and maximum marks obtained by the students are provided. The
minimum mark1 was 12% in CHMT1000 (End of Year results), and the maximum
mark 98% for MATH1014 (End of Year Results). The means were fairly similar, with
the lowest mean score obtained in CHMT1000 (mid-year) (46.9%) and the highest in
MATH1014 (end of year) (64.85%). Finally, the standard deviations range from 10.27
to 15.39, with the largest standard deviation for MATH1014 (both mid- and end of
year results).
1 The score of 0 for CHMT1001 (End of Year) was discounted as it indicates non-participation in the subject.

38
Table 8: Descriptive Statistics for Academic Results
Subject N Min Max Mean Std Dev.
CHMT1000 Mid-Year Marks (Chemical and Metallurgical Engineering) 391 17.76 79.68 46.9 11.38
CHMT1000 End of Year Marks (Chemical and Metallurgical Engineering) 293 12.00 90.00 51.59 11.22
CHMT1001 Mid-Year Marks (Physics) 291 23.71 92.13 61.18 11.86
CHMT1001 End of Year Marks (Physics) 213 .00 91.00 63.80 13.54
CHEM1031 Mid-Year Marks (Chemistry) 233 30.66 95.65 59.25 11.61
CHEM1031 End of Year Marks (Chemistry) 212 38.00 93.00 61.22 10.27
ECON1007 Mid-Year Marks (Economics) 236 35.00 96.00 64.41 10.76
ECON1007 End of Year Marks (Economics) 212 35.00 96.00 64.81 10.69
MATH1014 Mid-Year Marks (Mathematics) 246 13.80 95.33 62.97 15.39
MATH1014 End of Year Marks (Mathematics) 218 20.00 98.00 64.85 15.10

39
Table 9: Skewness of Academic Results
Subject N Skewness Kurtosis
Statistic Std. Error Statistic Std. Error
CHMT1000 Mid-Year Marks (Chemical and Metallurgical Engineering) 391 .14 .12 -.23 .24
CHMT1000 End of Year Marks (Chemical and Metallurgical Engineering) 293 -.13 .14 .51 .28
CHMT1001 Mid-Year Marks (Physics) 291 .13 .14 .21 .28
CHMT1001 End of Year Marks (Physics) 213 -.95 .16 3.47 .33
CHEM1031 Mid-Year Marks (Chemistry) 233 .24 .15 -.02 .31
CHEM1031 End of Year Marks (Chemistry) 212 .37 .16 -.08 .33
ECON1007 Mid-Year Marks (Economics) 236 -.09 .15 -.03 .31
ECON1007 End of Year Marks (Economics) 212 -.08 .16 -.08 .33
MATH1014 Mid Year Marks (Mathematics) 246 -.15 .15 -.36 .30
MATH1014 End of Year Marks (Mathematics) 218 -.14 .16 -.37 .32
Table 9 displays the skewness statistics as between -1 and 1, which means the data is normally distributed which will result in
parametric tests being used in answering the research questions.
The remainder of this section is structured according to the research hypotheses.

40
5.1.1 H1: The Abstract Reasoning Test predicts first year engineering students’ mid and end of year university results.
Pearson’s correlations were conducted between the students’ academic results in each subject and the Abstract Reasoning Test
(Table 10). Throughout this section, the sample size differs according to the varying sizes of the class.
Table 10: Results of a Pearson Correlation between ART and academic results
Subject N r p
CHMT1000 Mid-Year Marks (Chemical and Metallurgical Engineering) 390 .12* .01
CHMT1000 End of Year Marks (Chemical and Metallurgical Engineering) 292 .11* .04
CHMT1001 Mid-Year Marks (Physics) 291 .09 .10
CHMT1001 End of Year Marks (Physics) 213 .09 .17
CHEM1031 Mid-Year Marks (Chemistry) 233 .15* .02
CHEM1031 End of Year Marks (Chemistry) 212 .15* .02
ECON1007 Mid-Year Marks (Economics) 236 .14* .02
ECON1007 End of Year Marks (Economics) 212 .12 .07
MATH1014 Mid-Year Marks (Mathematics) 246 .05 .36
MATH1014 End of Year Marks (Mathematics) 218 .02 .66
*p<.05
The significant correlations were found between the ART and CHMT1000 (both the mid-year results and the end of year results),
CHEM1031 (both the mid-year results and the end of year results) and ECON1007 for the mid-year results. These significant
correlations show a relationship between the Abstract Reasoning Test and these specific subjects. All of the relationships are
positive, which indicate that as the ART score increases in value, so does the students’ result in those subjects. However, all of
these correlation scores are close to 0 and show a weak relationship between the psychometric test and the academic result.

41
In order to test the predictive value of the Abstract Reasoning Test, linear regressions were used for every subject (Table 11).
Table 11: Results of a Linear Regression between the ART and Academic Results
Subject N R R2 p B
(Unstandardised
coefficients)
CHMT1000 Mid-Year Marks (Chemical and Metallurgical Engineering) 390 .12 .01 .01 39.80
.31
CHMT1000 End of Year Marks (Chemical and Metallurgical Engineering) 292 .11 .01 .04 45.13
.28
CHMT1001 Mid-Year Marks (Physics) 291 .09 .00 .10 55.54
.24
CHMT1001 End of Year Marks (Physics) 213 .09 .00 .17 57.41
.27
CHEM1031 Mid-Year Marks (Chemistry) 233 .15 .02 .02 50.51
.38
CHEM1031 End of Year Marks (Chemistry) 212 .15 .02 .02 53.19
.35
ECON1007 Mid-Year Marks (Economics) 236 .14 .02 .02 56.09
.36
ECON1007 End of Year Marks (Economics) 212 .12 .01 .07 58.11
.29

42
Subject N R R2 p B
(Unstandardised
coefficients)
MATH1014 Mid-Year Marks
(Mathematics)
246 .05 .00 .36 58.40
.19
MATH1014 End of Year Marks (Mathematics) 218 .02 .00 .66 62.61
.09
The R value shows the relationship between the ART and the academic result. All of the relationships (as described above) are
weak. The R2 value describes how much of the total variation of the academic results can be explained by the ART score. The
highest R2 value is that of CHEM1013 (end of year) where 2.5% of the variation of the academic results can be explained by the
ART score. This is low and does not offer any value in predicting or understanding the relationship between the two variables. The
significance column indicates the statistical significance of the regression. Thus, CHMT1000 (both sets of results), CHEM1031
(both sets of results) and ECON1007 (both sets of results) all show statistically significant results. CHMT1001 and MATH1014 are
not statistically significant.
The value in the final column (the B value) contains both the constant value (the first number) and the ART unstandardised
coefficient. These results can be used to create the regression equation. An example would be the equation of CHEM1031 (End of
Year) = 53.19 + .35 (ART). However, as the predictive values are so low, this equation will not be of use.
In synopsis, the ART scores predict some first year engineering students’ mid and end of year results, but the relationships are
weak and their predictive value is extremely poor.

43
5.1.2 H2: The Raven’s Advanced Progressive Matrices scores predict first year engineering students’ mid and end of year results.
As above, correlations and regressions were run in order to examine the respective relationships between the subjects taken by the
students and their scores on the Raven’s Advanced Progressive Matrices (Table 12).
Table 12: Results of a Pearson Correlation between Raven’s and academic results
Subject N Pearson Correlation p
CHMT1000 Mid-Year Marks (Chemical and Metallurgical Engineering) 390 -.27** .00
CHMT1000 End of Year Marks (Chemical and Metallurgical Engineering) 292 -.13* .04
CHMT1001 Mid-Year Marks (Physics) 291 .08 .21
CHMT1001 End of Year Marks (Physics) 213 .19* .01
CHEM1031 Mid-Year Marks (Chemistry) 233 .08 .27
CHEM1031 End of Year Marks (Chemistry 212 -.01 .89
ECON1007 Mid-Year Marks (Economics) 236 -.01 .80
ECON1007 End of Year Marks (Economics) 212 -.03 .65
MATH1014 Mid-Year Marks (Mathematics) 246 -.02 .71
MATH1014 End of Year Marks (Mathematics) 218 -.05 .45
*p<.05; **p<.01
These results show three significant correlations between the Raven’s and Academic Results. The first, CHMT1000 (mid-year)
shows a significant correlation at the .01 level, while CHMT1000 and CHMT1001 (both end of year results) show a correlation at
the .05 significance level. However, both CHMT1000 correlations show a negative relationship which suggests that as the students’
Raven’s score increases, so their CHMT1000 mark decreases. The positive relationship between CHMT1001 (end of year results)

44
and the Raven’s shows that as the students Raven’s score increases, so their academic result in CHMT1001 increases. However,
these relationships are all weak and do not indicate a medium or strong correlation.
Regressions were then used to calculate the predictive value of the Raven’s on the marks obtained by the students which can be
seen in Table 13.
Table 13: Results of a Linear Regression between the Ravens and Academic Results
Subject N R R2 p B
(Unstandardised
coefficients)
CHMT1000 Mid-Year Marks (Chemical and Metallurgical Engineering) 390 .27 .07 .00 54.48
-.30
CHMT1000 End of Year Marks (Chemical and Metallurgical Engineering) 292 .13 .01 .04 55.35
-.13
CHMT1001 Mid-Year Marks (Physics) 291 .08 .00 .21 58.55
.15
CHMT1001 End of Year Marks (Physics) 213 .19 .03 .01 55.70
.38
CHEM1031 Mid-Year Marks (Chemistry) 233 .08 .00 .27 57.70
.13
CHEM1031 End of Year Marks (Chemistry 212 .01 .00 .89 62.48
-.01

45
Subject N R R2 p B
(Unstandardised
coefficients)
ECON1007 Mid-Year Marks (Economics) 236 .01 .00 .80 66.04
-.02
ECON1007 End of Year Marks (Economics) 212 .03 .00 .65 66.88
-.05
MATH1014 Mid-Year Marks (Mathematics) 246 .02 .00 .71 65.38
-.05
MATH1014 End of Year Marks (Mathematics) 218 .05 .00 .45 68.26
-.11
As above, the R value can be used to examine the relationship between the two variables. The strongest relationship is between
the Raven’s and the mid-year result for CHMT1000, which shows a weak relationship. The R2 values also do not add much by way
of prediction, with the strongest value (CHMT1000 mid-year results) showing that 7.7% of the academic result can be explained by
the Raven’s score. In terms of the significance, three of the subjects show a significant relationship (namely CHMT1000 – both
results and CHMT1001 – mid year results). As above, the unstandardised coefficients could be used in the regression equation,
should any of the subjects be predictable by the Raven’s results.
In synopsis, the Raven’s scores predict some first year engineering students’ mid and end of year results, but the relationships are
weak and their predictive value is extremely poor.

46
5.1.3 H3: The Abstract Reasoning Test is a more powerful predictor for academic results than the Raven’s Advanced Progressive
Matrices
Table 14 summarises the significant relationships discussed in the previous two questions.
Table 14: Comparison of predictability between tests in 2014 first-year students
Subject Strength of linear relationship % explained by the test
ART Ravens ART Ravens
CHMT1000 Mid-Year Marks (Chemical and Metallurgical Engineering) Weak Weak 1.6 7.7
CHMT1000 End of Year Marks (Chemical and Metallurgical Engineering) Weak Weak 1.3 1.7
CHMT1001 End of Year Marks (Physics) Not significant Weak Not significant 3.7
CHEM1031 Mid-Year Marks (Chemistry) Weak Not significant 2.3 Not significant
CHEM1031 End of Year Marks (Chemistry Weak Not significant 2.5 Not significant
ECON1007 Mid-Year Marks (Economics) Weak Not significant 2.2 Not significant
ECON1007 End of Year Marks (Economics) Weak Not significant 1.5 Not significant
The results for the previous hypotheses indicate that both the ART and Raven’s are poor predictors of academic results for first
year engineering subjects. Therefore the question about the strength of one of these tests in relation to the other becomes
redundant as it can be concluded that neither the ART nor the Raven’s can be used as a predictor for academic results in first year
engineering subjects.
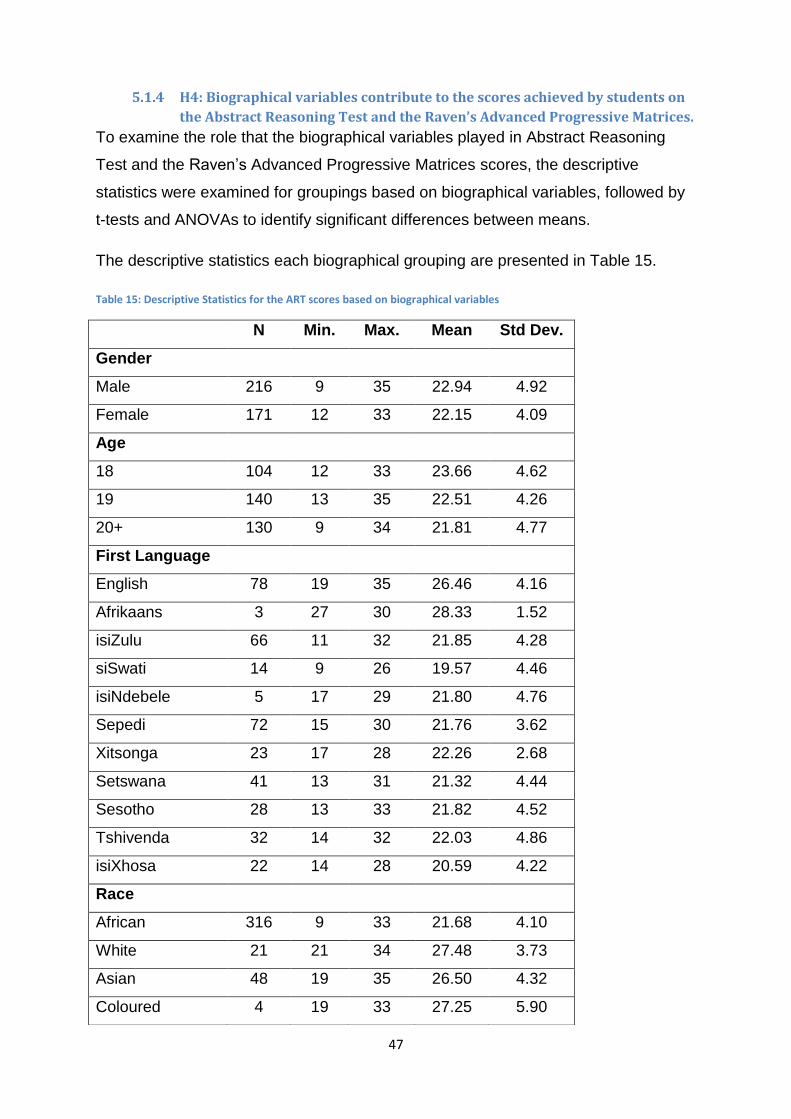
47
5.1.4 H4: Biographical variables contribute to the scores achieved by students on
the Abstract Reasoning Test and the Raven’s Advanced Progressive Matrices.
To examine the role that the biographical variables played in Abstract Reasoning
Test and the Raven’s Advanced Progressive Matrices scores, the descriptive
statistics were examined for groupings based on biographical variables, followed by
t-tests and ANOVAs to identify significant differences between means.
The descriptive statistics each biographical grouping are presented in Table 15.
Table 15: Descriptive Statistics for the ART scores based on biographical variables
N Min. Max. Mean Std Dev.
Gender
Male 216 9 35 22.94 4.92
Female 171 12 33 22.15 4.09
Age
18 104 12 33 23.66 4.62
19 140 13 35 22.51 4.26
20+ 130 9 34 21.81 4.77
First Language
English 78 19 35 26.46 4.16
Afrikaans 3 27 30 28.33 1.52
isiZulu 66 11 32 21.85 4.28
siSwati 14 9 26 19.57 4.46
isiNdebele 5 17 29 21.80 4.76
Sepedi 72 15 30 21.76 3.62
Xitsonga 23 17 28 22.26 2.68
Setswana 41 13 31 21.32 4.44
Sesotho 28 13 33 21.82 4.52
Tshivenda 32 14 32 22.03 4.86
isiXhosa 22 14 28 20.59 4.22
Race
African 316 9 33 21.68 4.10
White 21 21 34 27.48 3.73
Asian 48 19 35 26.50 4.32
Coloured 4 19 33 27.25 5.90

48
Table 15 shows some differences in means between the different biographical
groupings. Based on visual inspection, the ART marginally favours males over
females. Eighteen year olds performed better on the ART than older participants,
with the ART score decreasing as the participants increased in age. In terms of first
home language, Afrikaans students received the highest marks, with English
speakers, Tshivenda and Xitsonga speakers also performing well. siSwati first
language speakers scored the lowest results on the ART. The analysis of the
biographical variable of race showed that White and Coloured students performed
slightly better than Asian students, with African students obtaining the lowest mean
score on the ART.
Table 16: Descriptive Statistics for the Raven’s scores based on biographical variables
N Minimum Maximum Mean Std. Dev
Gender
Male 154 0 35 19.26 9.46
Female 138 0 67 18.43 11.23
Age
18 80 0 34 23.16 6.72
19 111 0 67 19.59 10.04
20+ 91 0 33 14.13 11.69
First Language
English 53 0 35 23.07 9.93
Afrikaans 3 27 34 31.66 4.04
isiZulu 48 0 30 18.83 8.79
siSwati 11 0 25 15.54 10.36
isiNdebele 2 14 27 20.50 9.19
Sepedi 57 0 30 16.89 10.28
Xitsonga 18 0 27 13.77 10.96
Setswana 34 0 67 19.26 13.04
Sesotho 20 0 31 17.05 10.92
Tshivenda 23 0 31 19.21 7.21
isiXhosa 18 0 28 19.05 9.18

49
N Minimum Maximum Mean Std. Dev
Race
African 241 0 67 17.78 10.14
White 16 20 35 29.06 4.44
Asian 32 0 34 21.90 10.14
Coloured 4 21 34 28.75 5.73
In terms of Table 16 the Raven’s Advanced Progressive Matrices, visual inspection
indicates that males performed slightly better than females, with the 18 year old
students performing better than their older counterparts and the Raven’s score once
again decreasing as the age of the participant increased. Afrikaans students far
outperformed their peers in the Raven’s with English students performing second
best. Setswana, Tshivenda and isiXhosa students also featured in the top half of the
sample in terms of their Raven’s scores, with Xitsonga students scoring the lowest
on average. Finally, White and Coloured students again performed better than Asian
and, lastly, African counterparts. These results almost perfectly mirror the results
found in terms of the ART with the only differences appearing in the home language
variable as Setswana speakers did not appear in the highest scorers for the ART,
and siSwati first language speakers scored the lowest on the Abstract Reasoning
Test.
However, as these results do not give any definitive findings (and the differences
found are small), ANOVAs and t-tests were conducted to test for significant
differences between the two groupings.

50
The following ANOVA tables were produced:
Table 17: ANOVA table between gender and psychometric tests
Sum of
Squares
df Mean
Square
F p
ART Grouping Between Groups 1.05 2 .52 1.33 .264
Within Groups 154.29 390 .39
Total 155.34 392
Raven’s Grouping Between Groups 1.07 2 .53 .78 .45
Within Groups 265.22 390 .68
Total 266.29 392
Table 17 displays that no significant differences were found between gender and the
ART and Raven’s.
Table18: ANOVA table between age and psychometric tests
Sum of
Squares
df Mean
Square
F p
ART Grouping Between Groups 5.41 3 1.80 4.68 .00
Within Groups 149.93 389 .38
Total 155.34 392
Raven’s Grouping Between Groups 17.12 3 5.70 8.91 .00
Within Groups 249.17 389 .64
Total 266.29 392
Table 18 shows a significant difference between age and the psychometric
assessments. In order to discover where the difference lies, an LSD post-hoc test
was conducted. Table 19 shows the significant mean differences between groups at
the .05 level.

51
Table 19: Post-hoc LSD significant differences table between the ART and age
(I) Age (J) Age Mean Difference (I-J) p
18 and younger 19 years old .17* .02
20 years old .30* .00
There were two significant differences in age for the ART, namely the difference
between students of 18 years and younger and 19 year old students, and students of
18 and younger and the 20 year old students. Inspection of the means indicated that
the 18 years and younger group performed significantly better than the 19 and 20
year olds. In terms of the Raven’s assessments, the following biographical variables
were found to show significant differences (Table 20).
Table 20: Post-hoc LSD significant differences between the Raven’s and age
(I) Age (J) Age Mean Difference (I-J) p
18 and younger 20 years old .54* .000
19 years old 20 years old .36* .000
The Raven’s shows significant differences between the students who are 18 and
younger and the students of 20 years of age, and the second significant relationship
was between the students who are 19 years old and those that are 20 years old.
There were no other significant differences found.
Table 21: ANOVA table between home language and psychometric tests
Sum of
Squares
df Mean
Square
F p
ART Grouping Between Groups 32.87 11 2.98 9.27 .00
Within Groups 122.46 380 .32
Total 155.34 391
Raven’s Grouping Between Groups 12.39 11 1.12 1.69 .07
Within Groups 252.67 380 .66
Total 265.06 391

52
The Raven’s shows no significant differences between home language and
psychometric tests (Table 21). As the ART does show significant differences, a post-
hoc test was conducted (Table 22).
Table22: Post-hoc LSD differences between ART and home language
(I) Home Language (J) Home Language Mean Difference (I-J) p
English isiZulu .60 .00
siSwati .84 .00
isiNdebele .84 .00
Sepedi .56 .00
Xitsonga .74 .00
Setswana .61 .00
Sesotho .68 .00
Tshivenda .65 .00
isiXhosa .68 .00
Afrikaans isiZulu 1.04 .00
siSwati 1.28 .00
isiNdebele 1.28 .00
Sepedi 1.00 .00
Xitsonga 1.18 .00
Setswana 1.05 .00
Sesotho 1.12 .00
Tshivenda 1.08 .00
isiXhosa 1.11 .00
Other 1.00 .02
isiNdebele Sepedi -.28 .02
The ART shows significant differences between English and the African languages,
while Afrikaans also shows a difference with the African languages, as well as the
‘Other’ category. The only difference found in ART scores between the African
languages was between isiNdebele and Sepedi and this was the only negative mean
difference. The negative difference in this case means that the Sepedi students
achieved higher ART scores than did the isiNdebele students. The mean differences

53
found between Afrikaans and the African languages were much bigger than those
found between English and the African languages. This indicates that where the
Afrikaans students are scoring highly, the African language students are achieving
low scores. English and Afrikaans students performed similarly on the ART.
Finally, race was examined via an ANOVA for both the ART and the Raven’s (Table
23).
Table 23: ANOVA table between the psychometric tests and race
Sum of
Squares
df Mean
Square
F p
ART Grouping Between Groups 28.45 4 7.11 21.74 .00
Within Groups 126.89 388 .32
Total 155.34 392
Raven’s Grouping Between Groups 10.93 4 2.73 4.15 .00
Within Groups 255.36 388 .65
Total 266.29 392
Significant differences were found for both the ART and the Raven’s in terms of race.
Post hoc tests were run to see where the significant differences lay (Table 24).
Table 24: Post-hoc LSD significant differences between the ART and race
(I) Race (J) Race Mean Difference (I-J) p
African White -.70 .00
Asian -.67 .00
Coloured -.83 .00
The significant differences within the race of the students are between African
students and all the remaining students (with the exception of the ‘Other’ category).
As the mean difference is negative, this shows that the African students’ marks are,
on average, lower than the mean marks obtained by the other students.

54
Table 25: Post-hoc LSD differences between the Raven’s and race
(I) Race (J) Race Mean Difference (I-J) p
African White -.59 .00
Coloured -.92 .00
White Asian .42 .04
Table 25 shows the significant differences on the Raven’s assessment are seen
between the African students and the White and Coloured students and between the
White and Asian students. The African students, on average are performing worse
than the White and Coloured students on the Raven’s, while the White students are
performing marginally, yet significantly, better than the Asian students on the
assessment. Although this difference is significant, the Asian students’ scores are
closer to the White students scores than are the other groups.
The ANOVAs display in more detail the various differences between the biographical
groups in terms of both the Ravens and the ART. The biggest difference was in the
home language category between the Afrikaans students and the African language
students.
5.2 Phase 2: Results separated into 2013 and 2014 first year
students
In order to further understand any differences between the years, T-Tests were run
to see the significant difference between the mean scores achieved each year on the
psychometric tests. The Art was examined for each year and the results obtained are
displayed in Table 26.
Table 26: Mean difference between years on the ART
Year N Mean p
2013 students 114 21.31 .00
2014 students 278 23.17 .00
Although the means are both significant, the difference is not meaningful between
these two groups. However, the Table 27 shows the mean scores from the Raven’s
between the different years. The means are both significant and the difference
between the two is huge. This can lead one to believe that there are differences in
the data and it would be worthwhile to examine the years independently in order to

55
analyse whether there are any substantial differences to the outcomes discovered in
Phase One.
Table 27: Mean differences between years on the Raven’s
Year N Mean p
2013 students 115 11.73 .00
2014 students 180 23.58 .00

56
Table 28 shows the differences in university subjects between the two years.
Table28: T-Test results examining the difference between academic results for the 2013 and 2014 first year students
Subject N
(2013)
N
(2014)
Mean
(2013)
Mean
(2014)
p
CHMT1000 Mid-Year Marks (Chemical and Metallurgical Engineering) 114 277 56.80 42.82 .00
CHMT1000 End of Year Marks (Chemical and Metallurgical Engineering) 115 178 59.17 46.70 .00
CHMT1001 Mid-Year Marks (Physics) 66 225 63.87 60.39 .00
CHMT1001 End of Year Marks(Physics) 69 144 66.84 62.35 .00
CHEM1031 Mid-Year Marks (Chemistry) 70 163 65.23 56.69 .00
CHEM1031 End of Year Marks (Chemistry) 70 142 67.26 58.25 .00
ECON1007 Mid-Year Marks(Economics) 69 167 70.38 61.96 .00
ECON1007 End of Year Marks (Economics) 71 141 70.39 62.01 .00
MATH1014 Mid-Year Marks (Mathematics) 72 174 65.87 61.78 .00
MATH1014 End of Year Marks (Mathematics) 72 146 70.21 62.22 .00
The mean scores for the 2014 students are consistently lower than those achieved by the 2013 class. These results are all
significant.

57
Due to these differences, in Phase two of this chapter, the results for the different
academic years were analysed separately (namely the 2013 first year students and
the 2014 first year students). The emergent hypotheses that arose were:
1. The Abstract Reasoning Test scores predict first year engineering students’
mid and end of year results for 2013 and 2014.
2. The Raven’s Advanced Progressive Matrices scores predict first year
engineering students’ mid and end of year results for 2013 and 2014.
3. The Abstract Reasoning Test is a more powerful predictor for academic
results than the Raven’s Advanced Progressive Matrices for 2013 and 2014.
4. Biographical variables contribute to the scores achieved by students on the
Abstract Reasoning Test and the Raven’s Advanced Progressive Matrices for
2013 and 2014.

58
5.2.1 2013 First Year Students
In order to gain a clearer overall understanding of the sample before answering the research questions, the descriptive statistics
were calculated. As the size of each class differs, the sample size differs for each grouping in the below table.
Table29: Descriptive Statistics for Academic Results (2013 First Year Students)
Subject N Min Max Mean Std.
Dev.
Skewness Kurtosis
Statistic Std. Error Statistic Std. Error
CHMT1000 Mid-Year Marks (Chemical and
Metallurgical Engineering)
114 36.32 79.68 56.80 9.32 .07 .22 -.46 .44
CHMT1000 End of Year Marks (Chemical and
Metallurgical Engineering)
115 31 90 59.17 8.43 .51 .22 2.56 .44
CHMT1001 Mid-Year Marks (Physics) 66 38.83 92.13 63.87 12.42 .26 .29 -.11 .58
CHMT1001 End of Year Marks (Physics) 69 0 91 66.84 15.01 -2.38 .28 10.08 .57
CHEM1031 Mid-Year Marks (Chemistry) 70 40.41 95.65 65.23 10.11 .35 .28 .39 .56
CHEM1031 End of Year Marks (Chemistry) 70 51 93 67.25 8.78 .51 .28 .24 .56
ECON1007 Mid-Year Marks (Economics) 69 42 96 70.37 9.61 -.28 .28 .79 .57
ECON1007 End of Year Marks (Economics) 71 42 96 70.39 9.61 -.24 .28 .59 .56
MATH1014 Mid-Year Marks (Mathematics) 72 37.33 95.33 65.87 13.47 .07 .28 -.40 .55
MATH1014 End of Year Marks (Mathematics) 72 48 97 70.20 11.04 .47 .28 -.16 .55

59
Table 29 contrasts to the descriptive statistics in Phase One as the number of students in each class from the mid-year to end of
year results either stay the same or increase. This may be due to students from the previous year having failed the second half of the
course and returning the following year to attain their pass.
The lowest mark obtained was 31% for CHMT10002 (End of Year) and the highest mark for MATH1014 (End of Year) with a
percentage of 97. The highest average mark is 70.39% for ECON1007 (End of Year results). The biggest discrepancy between the
marks achieved by the students is for CHMT1001 (End of Year). The skewness statistic displays the normality of the results. All of
the results are normally distributed with the exception of CHMT1001 (End of Year). CHMT1001 (End of Year) will be analysed using
non-parametric tests, while the rest of the results can be analysed using parametric tests.
Table 30: The descriptive statistics for the ART and Raven’s (2013 intake)
Psychometric Test N Min Max Mean Std. Dev. Skewness Kurtosis
Statistic Std. Error Statistic Std. Error
Abstract Reasoning Test 114 13 30 21.31 4.05 .14 .22 -.89 .44
Raven’s Advanced Progressive
Matrices
115 0 35 11.73 11.81 .21 .22 -1.59 .44
Table 30 shows the descriptive statistics for the ART and the Raven’s in the 2013 intake group. The lowest score on the ART is 13,
with a maximum score of 30, while the lowest score on the Ravens’ is 0 with a high score of 35. The mean score is 30 for the ART
and 35 for the Raven’s. The Raven’s shows the greatest standard deviation out of the two tests (due to such a low minimum score).
The data was also found to be normally distributed.
2 This is excluding the mark of 0 obtained in CHMT1001 (End of Year) as it indicates a lack of participation in the course

60
The remainder of the 2013 section of Phase Two presents the analyses conducted in order to answer each research question.
5.2.2 H1: The Abstract Reasoning Test scores predict first year engineering students’ mid and end of year results (2013 intake).
Pearson’s correlations were conducted between the ART and academic results (Table 31). Throughout this section, N differs
according to the varying sizes of the class.
Table 31: Results of a Pearson Correlation between the ART and academic results (2013 students)
Subject N Pearson
Correlation
p
CHMT1000 Mid-Year Marks (Chemical and Metallurgical Engineering) 113 .13 .16
CHMT1000 End of Year Marks (Chemical and Metallurgical Engineering) 114 .29** .00
CHMT1001 Mid-Year Marks (Physics) 66 .27* .02
CHEM1031 Mid-Year Marks (Chemistry) 70 .26* .02
CHEM1031 End of Year Marks (Chemistry 70 .31** .00
ECON1007 Mid-Year Marks (Economics) 69 .32** .00
ECON1007 End of Year Marks (Economics) 71 .30* .01
MATH1014 Mid-Year Marks (Mathematics) 72 .11 .32
MATH1014 End of Year Marks (Mathematics) 72 .07 .53
*p<.05, **p<.01
As CHMT1001 (End of Year) requires a non-parametric test, these results were analysed using a Spearman’s Correlation. The
results show a significant but weak correlation coefficient of .25* (N=69).

61
CHMT1000 (End of Year) results, CHEM1031 (End of Year) results and ECON1007 (Mid-Year) results were all significant at the .01
level. CHMT1001 (Mid-Year) results, CHEM1031 (Mid-Year) and ECON1007 (Mid-Year) results were all significant at the .05 level.
This translates to a significant correlation found between these results and the ART scores. However, the strongest of these
relationships is between ECON1007 (Mid-Year) results and the ART and this relationship is weak. As such, the significant
relationships found in this correlation analysis are weak.
In order to test the predictive value of the Abstract Reasoning Test, linear regressions were used for every subject (Table 32).
Table32: Results of a Linear Regression between the ART and academic results (2013 students)
Subject N R value R2 value p B
(Unstandardised
coefficients)
CHMT1000 Mid-Year Marks (Chemical and Metallurgical Engineering) 113 .13 .01 .16 50.29
.30
CHMT1000 End of Year Marks (Chemical and Metallurgical Engineering) 114 .29 .08 .00 46.32
.60
CHMT1001 Mid-Year Marks (Physics) 66 .27 .07 .02 45.48
.83
CHMT1001 End of Year Marks (Physics) 69 .16 .02 .16 53.17
.61
CHEM1031 Mid-Year Marks (Chemistry) 70 .26 .07 .02 50.90
.65

62
Subject N R value R2 value p B
(Unstandardised
coefficients)
CHEM1031 End of Year Marks (Chemistry 70 .31 .09 .00 52.57
.66
ECON1007 Mid-Year Marks (Economics) 69 .32 .10 .00 53.47
.76
ECON1007 End of Year Marks (Economics) 71 .30 .09 .01 54.87
.70
MATH1014 Mid-Year Marks (Mathematics) 72 .11 .01 .32 57.27
.38
MATH1014 End of Year Marks (Mathematics) 72 .07 .00 .53 65.761
.20
As discussed above, the R value shows the correlation between the ART and the academic result. The strongest relationship is
ECON1007 (Mid-Year) results and the ART. However, this relationship is weak, which means the other relationships are even
weaker.
The R2 value describes how much of the total variation of the academic results can be explained by the ART score. The highest R2
value is .10 for ECON1007 (Mid-Year) results. This means that 10% of the total variation in the Economics Mid-Year marks can be
explained by the ART. This value is also low, which again indicates that not much can be deduced from these results in terms of
applicability.

63
The final value in the column (the B value) contains both the constant value (the first
number) and the ART unstandardised coefficient. These results can be used to
create the regression equation. However, due to the low results, this equation will not
be useful as the regression shows an inability to predict students’ marks from their
ART scores.
5.2.3 H2: The Raven’s Advanced Progressive Matrices scores predict first year
engineering students mid and end of year results (2013 intake).
A Pearson’s correlation and a linear regression were run in order to examine the
respective relationships between the subjects taken by the students and their scores
on the Raven’s Advanced Progressive Matrices (Table 33).
Table 33: Results of a Pearson’s correlation between academic results and Ravens (2013 students)
Subject N Pearson
Correlation
p
CHMT1000 Mid-Year
(Chemical and Metallurgical Engineering)
114 -.14 .12
CHMT1000 End of Year
(Chemical and Metallurgical Engineering)
115 .19* .04
CHMT1001 Mid-Year (Physics) 69 .28* .01
CHEM1031 Mid-Year (Chemistry) 70 .12 .29
CHEM1031 End of Year (Chemistry) 70 .10 .39
ECON1007 Mid-Year (Economics) 69 -.01 .90
ECON1007 End of Year (Economics) 71 -.02 .86
MATH1014 Mid-Year (Mathematics) 72 -.13 .27
MATH1014 End of Year (Mathematics) 72 -.04 .68
*p<.05; **p<.01
A non-parametric Spearman’s Correlation was run for the CHMT1001 end of year
results. The result was a statistically insignificant correlation of .07 (N=66).
There were only two statistically significant results given in the correlation –
CHMT1000 (End of Year) and CHMT1001 (Mid-Year). However, both of these
results show very weak relationships.

64
In order to calculate the predictive value of the Raven’s Advanced Progressive
Matrices for the Academic Results, a linear regression was run for which the results
are displayed in Table 34.
Table 34: Results of a Linear Regression between the Ravens and academic results
Subject N R value R2
value
p B
(Unstandardised
coefficients)
CHMT1000 Mid-Year Marks
(Chemical and Metallurgical Engineering)
114 .14 .02 .12 58.15
-.11
CHMT1000 End of Year Marks
(Chemical and Metallurgical Engineering)
115 .19 .03 .04 57.56
.13
CHMT1001 Mid-Year Marks (Physics) 69 .04 .00 .72 65.28
-.06
CHMT1001 End of Year Marks (Physics) 66 .28 .07 .01 57.52
.47
CHEM1031 Mid-Year Marks (Chemistry) 70 .12 .01 .29 62.49
.14
CHEM1031 End of Year Marks
(Chemistry
70 .10 .01 .39 65.32
.10
ECON1007 Mid-Year Marks (Economics) 69 .01 .00 .90 70.65
-.01
ECON1007 End of Year Marks
(Economics)
71 .02 .00 .86 70.79
-.02
MATH1014 Mid-Year Marks
(Mathematics)
72 .13 .01 .27 69.31
-.18
MATH1014 End of Year Marks
(Mathematics)
72 .04 .00 .68 71.27
-.05
Two of the results given in the above table are significant (namely CHMT100 End of
Year results and CHMT1001 End of Year results). However, the R values are .19
and .28 respectively which show weak relationships. The R2 values show a 3% and
7% ability to use the academic results to explain the Raven’s score. These are both

65
very low percentages and show that the Raven’s scores are unable to be used to
predict the academic results of students.
5.2.4 H3: The Abstract Reasoning Test is a more powerful predictor for
academic results than the Raven’s Advanced Progressive Matrices (2013
intake).
Table 35 gives a synopsis of the relationships discussed in the previous two
questions.
Table 35: Comparison of predictability between tests in 2013 first-year students
Subject Strength of linear
relationship
% explained by the
test
ART Ravens ART Ravens
CHMT1000 End of Year Marks
(Chemical and Metallurgical Engineering)
Weak Weak 8 3
CHMT1001 Mid-Year Marks (Physics) Weak Not
Significant
7 Not
Significant
CHMT1001 End of Year Marks (Physics) Not
Significant
Weak Not
Significant
7
CHEM1031 Mid-Year Marks (Chemistry) Weak Not
Significant
7 Not
Significant
CHEM1031 End of Year Marks (Chemistry Weak Not
Significant
9 Not
Significant
ECON1007 Mid-Year Marks (Economics) Weak Not
Significant
10 Not
Significant
ECON1007 End of Year Marks (Economics) Weak Not
Significant
9 Not
Significant
Table 35 gives a summary of the relationships and predictability of the psychometric
tests on the academic results. The relationships are all weak and the percentages of
the academic results that can be explained by the test are low. This leads to the
conclusion that for the 2013 results (as for the group as a whole) the tests cannot be
used to predict the academic results achieved by the students.

66
5.2.5 H4: Biographical variables contribute to the scores achieved by students
on the Abstract Reasoning Test and the Raven’s Advanced Progressive
Matrices (2013 intake).
ANOVAs have been run in order to test for significant differences between the
various biographical variables on both the ART and the Raven’s. The first
biographical variable to be examined was that of gender, for which the results of the
test are displayed in Table 36.
Table 36: ANOVA table between psychometric tests and gender
Sum of
Squares
df Mean
Square
F p
ART Grouping Between Groups 1.31 2 .66 1.69 .18
Within Groups 43.72 112 .39
Total 45.04 114
Raven’s Grouping Between Groups 5.52 2 2.76 4.66 .01
Within Groups 66.42 112 .59
Total 71.94 114
There were no significant differences found in the ART scores between the male and
female students. However, when a post-hoc test was conducted it was discovered
that the only significant differences were found in connection with the gender
category of ‘not provided’. As such, no significant differences between male and
female can be commented on. The ANOVA run to test the significant differences
between age and the psychometric tests produced the following results in Table 37.
Table 37: ANOVA between psychometric tests and age
Sum of
Squares
df Mean
Square
F p
ART Grouping Between Groups 2.86 3 .95 2.51 .06
Within Groups 42.17 111 .38
Total 45.04 114
Raven’s Grouping Between Groups 16.80 3 5.60 11.27 .00
Within Groups 55.14 111 .49
Total 71.94 114

67
This shows a significant difference between the age groups on the Raven’s, but not
on the ART scores. A post-hoc test was run to discover where the significant
differences lay in the age groupings (Table 38).
Table 38: Post-hoc LSD significant differences table between the Raven’s and age
(I) Age (J) Age Mean
Difference (I-J)
p
18 and younger 20 years old .93 .00
19 years old 20 years old .77 .00
20 years old 21-and-over -.58 .03
Significant differences were found between the students of 20 years of age and the
other groups of students. The 20 year old group scored lower on the Raven’s than
any of the other groups.
The results of the ANOVA run between the psychometric tests and home language
can be seen in Table 39.
Table 39: ANOVA table between psychometric tests and home language
Sum of
Squares
df Mean
Square
F p
ART Grouping Between Groups 17.09 10 1.70 6.30 .00
Within Groups 27.93 103 .27
Total 45.02 113
Raven’s Grouping Between Groups 10.75 10 1.07 1.86 .06
Within Groups 59.50 103 .57
Total 70.25 113
Significant differences were only found between the home language biographical
and the ART, the following post-hoc (Table 40) was run to discover where these
differences lie.

68
Table 40: Post-hoc LSD differences between Home Language and ART
(I) Home Language (J) Home Language Mean Difference (I-J) p
English siSwati 1.05 .02
Sepedi .93 .00
Xitsonga .60 .04
Afrikaans isiZulu 1.26 .02
siSwati 2.00 .00
isiNdebele 1.33 .00
Sepedi 1.87 .00
Xitsonga 1.54 .00
Setswana 1.40 .01
Sesotho 1.33 .03
The major differences found, as in Phase 1, were between Afrikaans and the African
languages. These differences were much bigger than those found between English
and siSwati, Sepedi and Xitsonga, which were still significant.
The final biographical variable under analysis is that of race, for which the following
ANOVA results were calculated (Table 41).
Table 41: ANOVA table between the psychometric tests and race
Sum of
Squares
df Mean
Square
F p
ART Grouping Between Groups 14.32 3 4.77 17.52 .00
Within Groups 29.95 110 .27
Total 44.28 113
Raven’s Grouping Between Groups 11.34 3 3.78 6.92 .00
Within Groups 60.10 110 .54
Total 71.447 113
As both the ART and the Raven’s returned significant results, post-hoc tests have
been run for both psychometric tests.
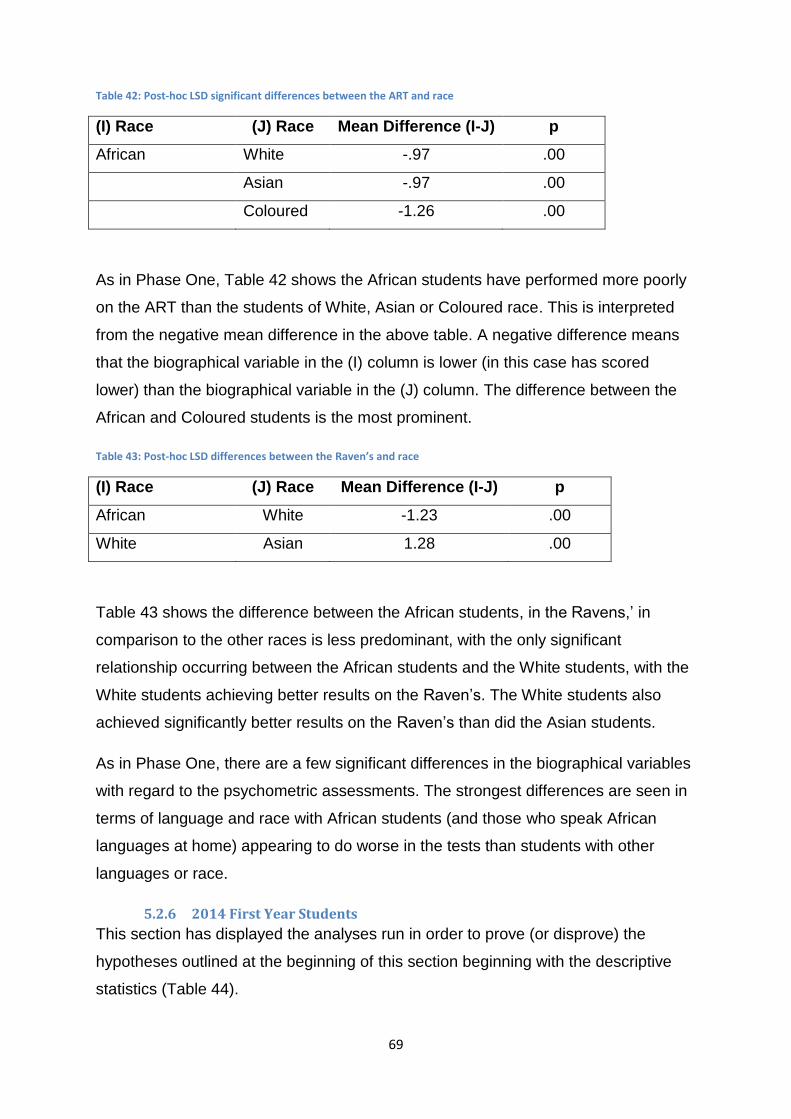
69
Table 42: Post-hoc LSD significant differences between the ART and race
(I) Race (J) Race Mean Difference (I-J) p
African White -.97 .00
Asian -.97 .00
Coloured -1.26 .00
As in Phase One, Table 42 shows the African students have performed more poorly
on the ART than the students of White, Asian or Coloured race. This is interpreted
from the negative mean difference in the above table. A negative difference means
that the biographical variable in the (I) column is lower (in this case has scored
lower) than the biographical variable in the (J) column. The difference between the
African and Coloured students is the most prominent.
Table 43: Post-hoc LSD differences between the Raven’s and race
(I) Race (J) Race Mean Difference (I-J) p
African White -1.23 .00
White Asian 1.28 .00
Table 43 shows the difference between the African students, in the Ravens,’ in
comparison to the other races is less predominant, with the only significant
relationship occurring between the African students and the White students, with the
White students achieving better results on the Raven’s. The White students also
achieved significantly better results on the Raven’s than did the Asian students.
As in Phase One, there are a few significant differences in the biographical variables
with regard to the psychometric assessments. The strongest differences are seen in
terms of language and race with African students (and those who speak African
languages at home) appearing to do worse in the tests than students with other
languages or race.
5.2.6 2014 First Year Students
This section has displayed the analyses run in order to prove (or disprove) the
hypotheses outlined at the beginning of this section beginning with the descriptive
statistics (Table 44).

70
Table 44: Descriptive Statistics for Academic Results for 2014 First Year Students
Subject N Min Max Mean Std.
Dev.
Skewness Kurtosis
Statistic Std. Error Statistic Std. Error
CHMT1000 Mid-Year Marks (Chemical and
Metallurgical Engineering)
277 17.76 65.09 42.82 9.51 -.00 .14 -.22 .29
CHMT1000 End of Year Marks (Chemical and
Metallurgical Engineering)
178 12.00 69.00 46.69 10.02 -.23 .18 .02 .36
CHMT1001 Mid-Year Marks (Physics) 225 23.71 92.13 60.39 11.60 .06 .16 .28 .32
CHMT1001 End of Year Marks (Physics) 144 32.00 90.00 62.34 12.57 -.01 .20 -.52 .40
CHEM1031 Mid-Year Marks (Chemistry) 163 30.66 85.60 56.69 11.28 .36 .19 .06 .37
CHEM1031 End of Year Marks (Chemistry) 142 38.00 83.00 58.24 9.65 .55 .20 .16 .40
ECON1007 Mid-Year Marks (Economics) 167 35.00 91.00 61.95 10.26 -.04 .18 -.03 .37
ECON1007 End of Year Marks (Economics) 141 35.00 86.00 62.00 10.11 -.03 .20 -.08 .40
MATH1014 Mid-Year Marks (Mathematics) 174 13.80 93.56 61.78 16.00 -.14 .18 -.46 .36
MATH1014 End of Year Marks (Mathematics) 146 20.00 98.00 62.21 16.14 .00 .20 -.69 .39
As with the trend found in Phase One, the number of students in each class decreases as the year progresses, possibly due to
failure or leaving the university. The lowest mark is 12% for CHMT1001 (End of Year) and the highest is 98% for MATH1014 (End of
Year). The lowest average is for CHMT1000 (Mid-Year), while the highest is for CHMT1001 (End of Year). The biggest discrepancy

71
between marks (given by the standard deviation) is for MATH1014 (End of Year). The skewness and kurtosis show the normality of
the marks, which in this case shows all the groups as normally distributed.
Table 45 shows the descriptive statistics for the psychometric tests.
Table 45: Descriptive statistics for the psychometric tests (2014 students)
Subject N Min Max Mean Std.
Dev.
Skewness Kurtosis
Statistic Std.
Error
Statistic Std.
Error
Abstract Reasoning Test 278 9 35 23.17 4.69 .05 .14 -.15 .29
Raven’s Advanced Progressive Matrices 180 8 67 23.58 5.58 2.43 .18 19.44 .36
Table 45 shows the mean scores on both tests to be similar, with the skewness statistics both within the range of 1 and -1 which
show they are normally distributed.

72
5.2.7 H1: The Abstract Reasoning Test scores predict first year engineering students’ mid and end of year results (2014 intake).
Table 46: Results of a Pearson Correlation between academic results and ART (2014 students)
Subject N Pearson
Correlation
p
CHMT1000 Mid-Year Marks (Chemical and Metallurgical Engineering) 277 .33** .00
CHMT1000 End of Year Marks (Chemical and Metallurgical Engineering) 178 .27** .00
CHMT1001 Mid-Year Marks (Physics) 225 .06 .33
CHMT1001 End of Year Marks (Physics) 144 .08 .29
CHEM1031 Mid-Year Marks (Chemistry) 163 .18* .01
CHEM1031 End of Year Marks (Chemistry 142 .19* .02
ECON1007 Mid-Year Marks (Economics) 167 .17* .02
ECON1007 End of Year Marks (Economics) 141 .13 .10
MATH1014 Mid-Year Marks (Mathematics) 174 .06 .42
MATH1014 End of Year Marks (Mathematics) 146 .05 .49
*p<.05, **p<.01
Table 46 shows both CHMT1000 groupings are significant at the .05 level, while both groupings of CHEM1031 and ECON1007 (Mid-
Year) are significant at the .01 significance level. However, the majority of these relationships are weak, with the Mid Year
CHMT1000 results showing a weak to moderate relationship between the academic results and the ART.

73
Table 47: Results of a Linear Regression between the ART and academic results (2014 students)
Subject N R value R2 value p B
(Unstandardised
coefficients)
CHMT1000 Mid-Year Marks (Chemical and Metallurgical
Engineering)
277 .33 .11 .00 27.18
.67
CHMT1000 End of Year Marks (Chemical and
Metallurgical Engineering)
178 .27 .07 .00 32.74
.60
CHMT1001 Mid-Year Marks (Physics) 225 .06 .00 .33 56.71
.15
CHMT1001 End of Year Marks (Physics) 144 .08 .00 .29 56.87
.23
CHEM1031 Mid-Year Marks (Chemistry) 163 .18 .03 .01 46.33
.44
CHEM1031 End of Year Marks (Chemistry 142 .19 .03 .02 49.15
.39
ECON1007 Mid-Year Marks (Economics) 167 .17 .03 .02 52.87
.38
ECON1007 End of Year Marks (Economics) 141 .13 .01 .10 55.00
.30

74
Subject N R value R2 value p B
(Unstandardised
coefficients)
MATH1014 Mid-Year Marks (Mathematics) 174 .06 .00 .42 57.84
.21
MATH1014 End of Year Marks (Mathematics) 146 .05 .00 .49 57.59
.19
In Table 47, the R value shows the strongest relationships between the ART and both CHMT1000 groupings. The relationship
between CHMT1000 (Mid-Year) and the ART is weak to moderate, while the remaining relationships are weak. Both CHMT1000
relationships are significant, as are both CHEM1031 results and ECON1007 (Mid-Year) results to the ART. Overall, the predictability
is poor as R2 shows that a great number of the results cannot be explained at all by the ART score. The strongest subject in terms of
explainability is 11% for CHMT1000 Mid-Year academic results.
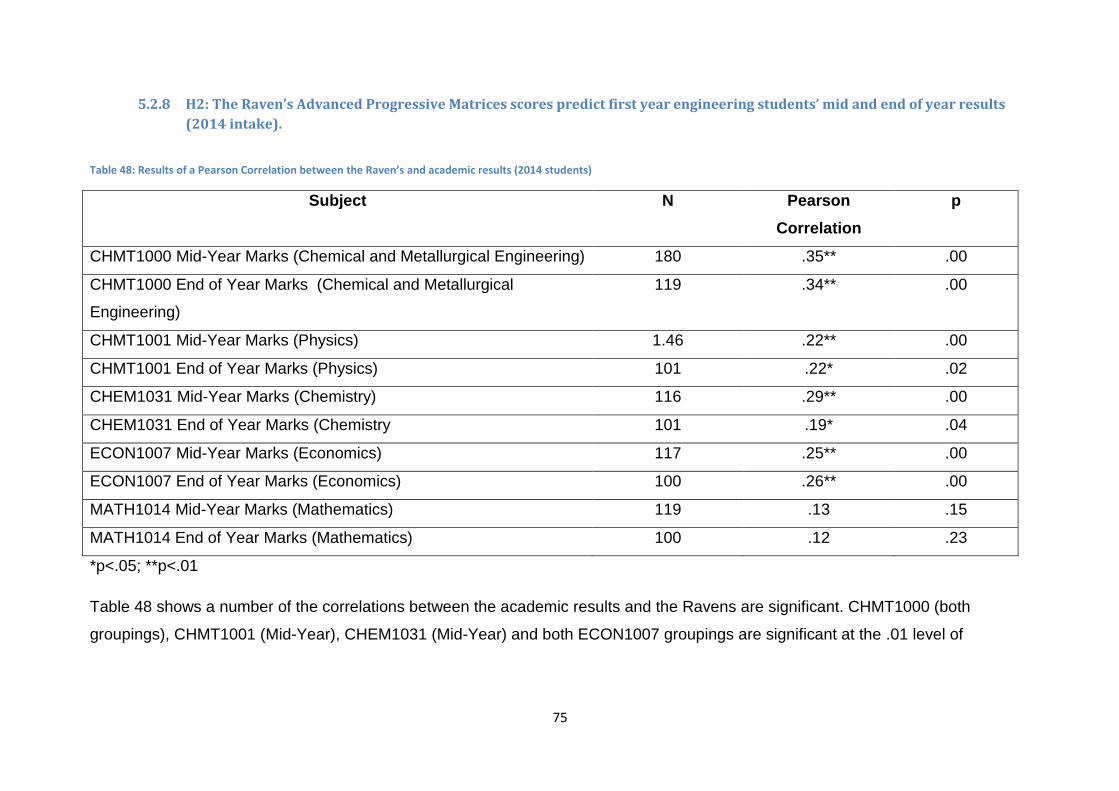
75
5.2.8 H2: The Raven’s Advanced Progressive Matrices scores predict first year engineering students’ mid and end of year results
(2014 intake).
Table 48: Results of a Pearson Correlation between the Raven’s and academic results (2014 students)
Subject N Pearson
Correlation
p
CHMT1000 Mid-Year Marks (Chemical and Metallurgical Engineering) 180 .35** .00
CHMT1000 End of Year Marks (Chemical and Metallurgical
Engineering)
119 .34** .00
CHMT1001 Mid-Year Marks (Physics) 1.46 .22** .00
CHMT1001 End of Year Marks (Physics) 101 .22* .02
CHEM1031 Mid-Year Marks (Chemistry) 116 .29** .00
CHEM1031 End of Year Marks (Chemistry 101 .19* .04
ECON1007 Mid-Year Marks (Economics) 117 .25** .00
ECON1007 End of Year Marks (Economics) 100 .26** .00
MATH1014 Mid-Year Marks (Mathematics) 119 .13 .15
MATH1014 End of Year Marks (Mathematics) 100 .12 .23
*p<.05; **p<.01
Table 48 shows a number of the correlations between the academic results and the Ravens are significant. CHMT1000 (both
groupings), CHMT1001 (Mid-Year), CHEM1031 (Mid-Year) and both ECON1007 groupings are significant at the .01 level of

76
significance. CHMT1001 (End of Year) and CHEM1031 (End of Year) are significant at the .05 level. Out of these significant
relationships however, most are weak, with the CHMT1000 groupings both displaying a weak to moderate relationship
Table 49: Results of a Linear Regression between the Ravens and Academic Results
Subject N R value R2 value p B
(Unstandardised
coefficients)
CHMT1000 Mid-Year Marks (Chemical and Metallurgical Engineering) 180 .35 .12 .00 29.95
.57
CHMT1000 End of Year Marks (Chemical and Metallurgical Engineering) 119 .34 .12 .00 32.87
.59
CHMT1001 Mid-Year Marks (Physics) 1.46 .22 .04 .00 50.72
.43
CHMT1001 End of Year Marks (Physics) 101 .22 .05 .02 46.91
.65
CHEM1031 Mid-Year Marks (Chemistry) 116 .29 .08 .00 41.20
.70
CHEM1031 End of Year Marks (Chemistry 101 .19 .04 .04 48.56
.42
ECON1007 Mid-Year Marks (Economics) 117 .25 .06 .00 48.52
.59

77
Subject N R value R2 value p B
(Unstandardised
coefficients)
ECON1007 End of Year Marks (Economics) 100 .26 .07 .00 48.26
.60
MATH1014 Mid-Year Marks (Mathematics) 119 .13 .01 .15 52.33
.46
MATH1014 End of Year Marks (Mathematics) 100 .12 .01 .23 52.16
.44
In Table 49, the R2 values are slightly higher overall in the 2014 group of this phase than in Phase One or the 2013 sample. 12% of
the CHMT1000 results can be explained by the Raven’s score 8% and 7% of CHEM1031 (mid-year) and ECON1007 (End of year)
respectively, can be explained through the score achieved on the Ravens. However, these scores are not sufficiently high to state
that the Ravens can be used to predict the academic marks that will be achieved by students.

78
5.2.9 H3: The Abstract Reasoning Test is a more powerful predictor for academic results than the Raven’s Advanced Progressive
Matrices (2014 intake).
Table 50: Comparison of predictability between tests in 2014 first-year students
Subject Strength of linear relationship % explained by the test
ART Ravens ART Ravens
CHMT1000 Mid-Year Marks (Chemical and Metallurgical
Engineering)
Weak to moderate Weak to moderate 11 12
CHMT1000 End of Year Marks (Chemical and
Metallurgical Engineering)
Weak Weak to moderate 7 12
CHMT1001 Mid-Year Marks (Physics) Not significant Weak Not significant 4
CHMT1001 End of Year Marks (Physics) Not significant Weak Not significant 5
CHEM1031 Mid-Year Marks (Chemistry) Weak Weak 3 8
CHEM1031 End of Year Marks (Chemistry Weak Weak 3 4
ECON1007 Mid-Year Marks (Economics) Weak Weak 3 6
ECON1007 End of Year Marks (Economics) Weak Weak 1 7
Table 50 displays the three weak to moderate relationships are the highest scores in the two phases, yet they are still not sufficient in
order to allow for unwavering decisions based on the correlations or relationships between the psychometric tests and the academic
results achieved by students. The predictability of either of the psychometric tests on the academic results achieved by first year
engineers is poor and will not offer any valuable input in the attempt at predicting students results for either subjects at either the mid-
year or end of year mark.
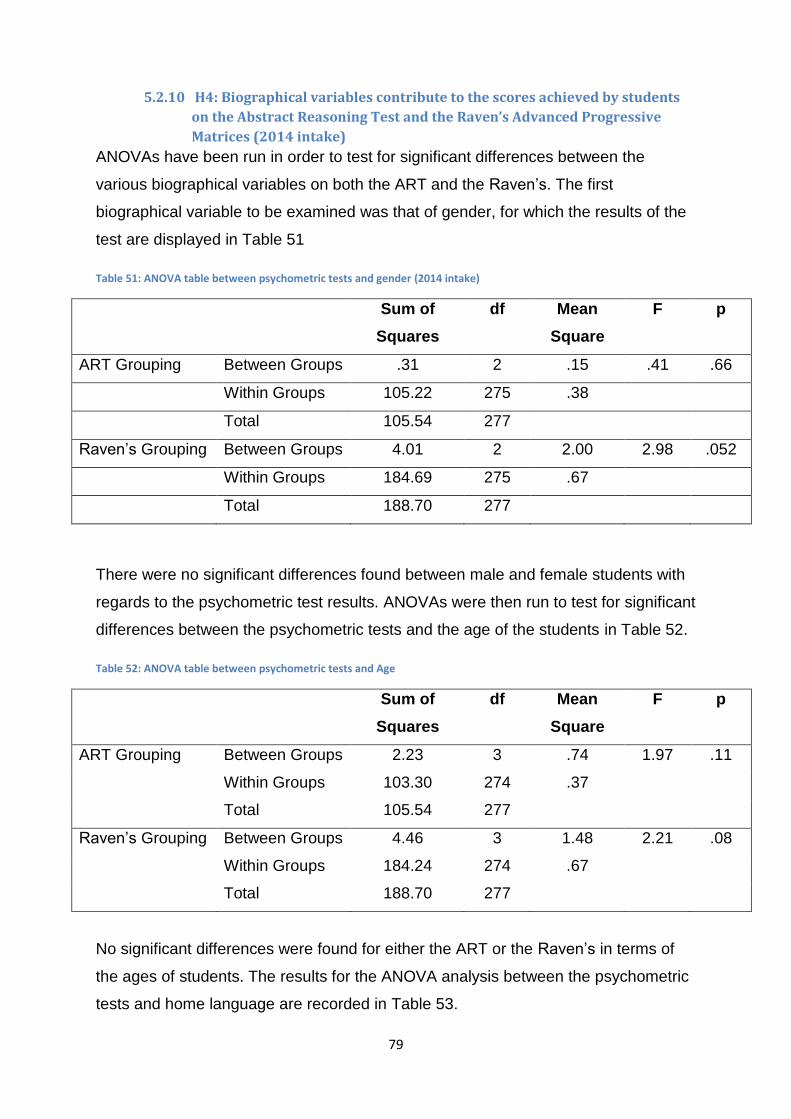
79
5.2.10 H4: Biographical variables contribute to the scores achieved by students
on the Abstract Reasoning Test and the Raven’s Advanced Progressive
Matrices (2014 intake)
ANOVAs have been run in order to test for significant differences between the
various biographical variables on both the ART and the Raven’s. The first
biographical variable to be examined was that of gender, for which the results of the
test are displayed in Table 51
Table 51: ANOVA table between psychometric tests and gender (2014 intake)
Sum of
Squares
df Mean
Square
F p
ART Grouping Between Groups .31 2 .15 .41 .66
Within Groups 105.22 275 .38
Total 105.54 277
Raven’s Grouping Between Groups 4.01 2 2.00 2.98 .052
Within Groups 184.69 275 .67
Total 188.70 277
There were no significant differences found between male and female students with
regards to the psychometric test results. ANOVAs were then run to test for significant
differences between the psychometric tests and the age of the students in Table 52.
Table 52: ANOVA table between psychometric tests and Age
Sum of
Squares
df Mean
Square
F p
ART Grouping Between Groups 2.23 3 .74 1.97 .11
Within Groups 103.30 274 .37
Total 105.54 277
Raven’s Grouping Between Groups 4.46 3 1.48 2.21 .08
Within Groups 184.24 274 .67
Total 188.70 277
No significant differences were found for either the ART or the Raven’s in terms of
the ages of students. The results for the ANOVA analysis between the psychometric
tests and home language are recorded in Table 53.

80
Table 53: ANOVA table between psychometric tests and home language
Sum of
Squares
df Mean
Square
F p
ART Grouping Between Groups 16.37 10 1.63 4.90 .00
Within Groups 89.16 267 .33
Total 105.54 277
Raven’s Grouping Between Groups 5.15 10 .51 .75 .67
Within Groups 183.55 267 .68
Total 188.70 277
The ART showed significant differences between the various home languages that
the students speak. There were no significant differences between the languages
with regard to the Raven’s scores. A post-hoc test was conducted for the ART,
where English and Afrikaans were grouped due to small sample sizes (Table 54).
Table 54: Post-hoc LSD differences between Home Language and the ART
(I) Home Language (J) Home Language Mean Difference (I-J) p
English and Afrikaans isiZulu .50 .00
siSwati .82 .00
isiNdebele .54 .04
Sepedi .54 .00
Xitsonga .54 .00
Setswana .54 .00
Sesotho .54 .00
Tshivenda .54 .00
isiXhosa .69 .00
Significant differences were found between the English and Afrikaans group and the
African languages, with the biggest difference between siSwati and the English and
Afrikaans students.
Finally, an ANOVA to test for differences in race and the following results calculated.

81
Table 55: ANOVA table between the psychometric tests and race
Sum of
Squares
df Mean
Square
F p
ART Grouping Between Groups 15.03 4 3.75 11.33 .00
Within Groups 90.50 273 .33
Total 105.54 277
Raven’s Grouping Between Groups 3.89 4 .97 1.43 .22
Within Groups 184.81 273 .67
Total 188.70 277
Table 55 shows the Raven’s did not produce any significant differences, but the
differences with regard to the ART will be analysed through the post-hoc test shown
in Table 56.
Table 56: Post-hoc LSD significant differences between the ART and race
(I) Race (J) Race Mean Difference (I-J) p
African White -.58 .00
Asian -.57 .00
The African students achieved lower scores than both the White and Asian students
on the ART. This follows the trend that has been seen predominantly throughout the
analysis. The possible bias with regard to non-White, non-English speaking
participants/students will be discussed later in this report.
5.3 Phase 3: Analysing the differences in the psychometric tests
using year as a covariate
In view of the differences in results between the 2013 and 2014 intake years, the
university results and the ART and Raven’s scores were examined, using the intake
year as a covariate. The research question for this Phase differs from the previous
two phases. What has been examined are the following two questions:
1. Do engineering students with high, low and medium scores on the Abstract
Reasoning Test achieve different university results when taking their intake
year into account?

82
2. Do engineering students with high, low and medium scores on the Raven’s
Advanced Progressive Matrices achieve different university results when
taking their intake year into account?
In order to examine these questions more effectively, the students were split into
three groups for both the ART and the Raven’s. They were divided into low, medium
and high depending on their scores in the psychometric test. The ART groups were
classified according to their raw scores, specifically 9-18 (low), 19-26 (medium) and
27-35 (high). The Raven’s has been categorised in the same manner with the raw
scores being grouped as follows: 0-12 (low), 13-23 (medium) and 24-35 (high).
Table 57 shows the number of students in each group.
Table 57: Number of students in low, medium and high groups for psychometric tests
Low Medium High
N (ART) 70 237 86
N (Raven’s) 157 122 114
Although this method of dividing the students resulted in an uneven number of
students in each group, it was felt that these divisions would more accurately reflect
where the candidates had scored, and as such, how well they had done in each test.
Equally sized groups result in the group scores all being drawn to a very similar
mean as those students who achieved a ‘medium’ score, far outnumber those who
achieved low or high scores and as such, all three groups would reflect similar
scores and not show meaningful differences.

83
ANCOVAs were run in order to gain clarity on these questions and the following results were obtained (Table 58).
Table 58: ANCOVAs on university results for low, medium and high ART scores with intake year as a covariate
Dependent variable Source R2 df
model; error
Mean square F p
CHMT1000 (Mid-year) Year
ART Groups
.36 1;387
2;387
17 083.81
83.21
205.27
15.61
.00
.00
CHMT1000 (End of year) Year
ART Groups
.34 1;289
2;289
12 129.29
903.00
146.27
10.83
.00
.00
CHMT1001 (Mid-year) Year
ART Groups
.39 1;287
2;287
689.76
487.09
5.04
3.56
.02
.03
CHEM1031 (Mid-Year) Year
ART Groups
.18 1;229
2;229
4 012.52
1 122.46
36.09
10.09
.00
.00
CHEM1031 (End of Year) Year
ART Groups
.21 1;208
2;208
4 208.09
527.09
50.25
6.30
.00
.00
ECON1007 (Mid-year) Year
ART Groups
.17 1;232
2;232
3 835.43
602.73
39.43
6.19
.00
.00
ECON1007 (End of Year) Year
ART Groups
.18 1;208
2;208
3 718.11
573.42
39.33
6.06
.00
.00

84
The results of the ART ANCOVA show that students who are in the different (low,
medium and high) groups according to their ART scores, do achieve different results
(depending on their grouping) in CHMT1000 (both mid-year and end of year),
CHMT1001 (mid-year), CHEM1031 (both mid-year and end of year) and ECON1007
(both mid-year and end of year).
Table 59 shows the significant results of the ANCOVA analysis to determine whether
the Raven’s groupings had an impact on the students’ academic results.
Table 59: Significant results for ANCOVAs on university results for low, medium and high Raven’s scores with intake year as a covariate
Dependent variable Source R2 df
model;
error
Mean
square
F p
CHMT1000 (Mid-year) Year
Raven’s
Groups
.33 1;387
2;387
15 998.09
656.70
184.87
7.59
.00
.00
CHMT1000 (End of year) Year
Raven’s
Groups
.32 1;289
2;289
11 369.07
614.24
133.20
7.19
.00
.00
CHEM1031 (Mid-year) Year
Raven’s
Groups
.14 1;229
2;229
434.60
117.18
29.30
3.70
.00
.02
ECON1007 (Mid-year) Year
Raven’s
Groups
.14 1;232
2;232
3 529.29
303.58
35.34
3.04
.00
.05
The high, medium and low Raven’s groupings of the students will lead to a difference
in their academic results in the subjects of CHMT1000 (both mid-year and end of
year), CHEM1031 (mid-year) and ECON1007 (mid-year). This means that those who
scored a lower score on the Raven’s, are also likely to receive a lower academic
result in the above subjects.

85
This section has analysed and displayed the statistics in order to answer the
research questions and hypotheses. The conclusions reached in this section, and
their resultant implications will be discussed in the following chapter of this report.

86
Chapter 6: Discussion
6. Discussion
This chapter gives an overview of the results that were found and the interpretations
that were derived in terms of each hypothesis for the first two phases, with a brief
discussion on the results to the research questions for phase three. A reflection on
the literature and the implications of the results is followed by the limitations of the
study, implications for further research and a conclusion.
This chapter discusses the findings and implications of the results. The discussion is
structured around the following four hypotheses as outlined in the previous chapters.
1. The Abstract Reasoning Test scores predict first year engineering students’
mid and end of year results.
2. The Raven’s Advanced Progressive Matrices scores predict first year
engineering students’ mid and end of year results.
3. The Abstract Reasoning Test is a more powerful predictor for academic
results than the Raven’s Advanced Progressive Matrices.
4. Biographical variables contribute to the scores achieved by students on the
Abstract Reasoning Test and the Raven’s Advanced Progressive Matrices
The four hypotheses have been analysed in two different phases. Phase one used
the sample as a whole, with both the 2013 and 2014 first year intakes incorporated.
Phase two was split into two sections, separating the 2013 intake from the 2014
intake. Finally, Phase three examined the following two research questions:
1. Do engineering students with high, low and medium scores on the Abstract
Reasoning Test achieve different university results when taking their intake
year into account?
2. Do engineering students with high, low and medium scores on the Raven’s
Advanced Progressive Matrices achieve different university results when
taking their intake year into account?
6.1 Phase One Discussion
This section discusses the results found for each research hypotheses for the
sample group as a whole.

87
6.1.1 H1: The Abstract Reasoning Test scores predict first year engineering
students’ mid and end of year results.
Although all of the correlations between the ART and the academic results were
significant, they all displayed weak relationships. In addition, the percentages of the
academic results that could be explained by the ART were low. The highest R value
was .15 for CHEM1031 for both the mid-year results and the end of year results. As
the highest R value, this effectively displays how weak the relationships are. The
highest R2 value is that of CHEM1013 (end of year) which shows that 2.5% of the
variation in academic results can be explained by the student’s ART score. This is
also a low percentage which again displays the weakness of the predictability of the
ART overall.
The overall outcome to this hypothesis is that it is false. The Abstract Reasoning
Test scores cannot be used to predict first year engineering students’ mid and end of
year results.
6.1.2 H2: The Raven’s Advanced Progressive Matrices scores predict first year
engineering students’ mid and end of year results.
The Raven’s regression displayed three significant correlations between the Raven’s
and the academic results. The subjects which showed significant correlations were
CHMT1000 (both mid and end of year results) and CHMT1001 (end of year results).
Out of those three significant correlations, the strongest R value was .27 for
CHMT1000 (mid-year). This is a weak correlation and corresponds to an poor R2
value of .07 (which, incidentally, was the strongest R2 value of the 3 significant
correlations). This shows that 7% of the variation in the CHMT1000 (mid-year)
results can be explained by the Raven’s score.
The overall outcome disproves this hypothesis. The Raven’s Advanced Progressive
Matrices scores cannot be used to predict first year engineering students’ mid and
end of year results.
6.1.3 H3: The Abstract Reasoning Test is a more powerful predictor for
academic results than the Raven’s Advanced Progressive Matrices.
The above results show that the ART has more significant relationships than the
Raven’s, but the strongest correlation and predictability value were found in the
Raven’s regression. However, as the conclusions for both of the previous
hypotheses show that neither the Abstract Reasoning Test nor the Raven’s

88
Advanced Progressive Matrices can be used as predictors for the academic results
of students, this hypothesis is obsolete.
6.1.4 H4: Biographical variables contribute to the scores achieved by students
on the Abstract Reasoning Test and the Raven’s Advanced Progressive
Matrices
The ART and the Raven’s were discussed separately in this section due to the
possibilities of differences within the biographical variables.
An initial observation of the means for each group showed that the ART scores had
males, 18 year olds, Afrikaans home language speakers and White students
attaining the highest results. ANOVAs were produced to discover whether any of the
differences between the biographical variables were significant. No significant
differences were found for gender in terms of the ART scores. Significant differences
were found in the age variable, specifically between the 18 and younger group and
both the 19 year old group and the 20 year old group. This difference indicated that
the 18 and younger group scored more highly than both the 19 year old and 20 year
old group, with the biggest difference between the 18 and younger group and the 20
year old group. In terms of home language, English showed significant differences to
all the African languages (namely, isiZulu, siSwati, isiNdebele, Sepedi, Xitsonga,
Setswana, Sesotho, Tshivenda and isiXhosa) where the English speakers attained
higher scores than those who speak an African language. Significant differences
were also found between those who spoke Afrikaans and all of the African language
speakers, as well as the ‘Other’ category. The final significant difference between
home languages on the ART was between isiNdebele and Sepedi where the Sepedi
speakers achieved higher results. Finally, race showed significant results with
African students scoring lower marks on the ART than the White, Asian and
Coloured students.
The overall conclusion is that biographical variables (with the exception of gender)
do contribute to the scores the students achieve in the Abstract Reasoning Test.
The Raven’s, upon a visual observation of means, appeared to show differences
within the biographical groups, thus ANOVAs were run to assess where the
significant differences lay. As with the ART, there were no significant differences in
terms of gender. In terms of age, there was a significant difference between the 20
year old and the 18 and younger and 19 year old age group where the 20 year olds

89
scored significantly less on the Raven’s than did the younger age groups. The
Raven’s showed no significant differences in home language. Significant differences
were found in the biographical variable of race, where African students scored lower
scores on the Raven’s than did White or Coloured students. The other significant
difference showed that White students achieved better scores on the Raven’s than
did Asian students.
6.2 Phase Two Discussion
As mentioned above, Phase two is split into two sub-sections for the 2013 intake and
the 2014 intake. The 2013 intake will be discussed first, after which the 2014 intake
synopsis will be given.
6.2.1 H1: The Abstract Reasoning Test scores predict first year engineering
students’ mid and end of year results (2013 intake).
The strongest R value was found between ECON1007 (mid-year) and the ART with
a score of .32. This is a weak relationship which results in the conclusion that all of
the other significant relationships are even weaker. In terms of the predictive value,
ECON1007 (mid-year) also shows the highest value, where 10% of the variation in
ECON1007 mid-year results could be explained by the ART.
This means that the ART scores do not hold much predictive value for the students’
academic results and cannot be used as a predictive measure.
6.2.2 H2: The Raven’s Advanced Progressive Matrices scores predict first year
engineering students’ mid and end of year results (2013 intake).
The Raven’s showed only two significant relationships, of which the strongest
(CHMT1001 – end of year) held an R value of .28, which relates to a weak
relationship. This subject also displayed the highest R2 value of .07, which relates to
a 7% ability to use the Raven’s score to explain the academic results.
However, as these results are the strongest predictors, while they themselves are
weak, shows that the Raven’s Advanced Progressive Matrices scores cannot be
used to predict first year engineering students’ mid and end of year results. This
could possibly be due to biased sampling as a small percentage of the 2013
students gave permission for their marks to be accessed.

90
6.2.3 H3: The Abstract Reasoning Test is a more powerful predictor for
academic results than the Raven’s Advanced Progressive Matrices (2013
intake).
The above results for the previous two hypotheses indicate that neither the Abstract
Reasoning Test nor the Raven’s Advanced Progressive Matrices can be used to
predict the academic results in the first year engineering students. As such, the
hypothesis is irrelevant.
6.2.4 H4: Biographical variables contribute to the scores achieved by students
on the Abstract Reasoning Test and the Raven’s Advanced Progressive
Matrices (2013 intake)
For this hypothesis, the ART and the Raven’s will be discussed separately.
The ART showed no significant differences in terms of gender or for the age
biographical. Home language showed numerous significant differences. The English
students scored higher on the ART than did the siSwati, Sepedi and Xitsonga
speaking students. The Afrikaans students achieved higher scores than did the
isiZulu, siSwati, isiNdebele, Sepedi, Xitsonga, Setswana and Sesotho students.
Finally, an analysis of race showed that African students scored lower marks than
did the White, Asian and Coloured students.
The Raven’s did not show any significant differences between gender and the
assessment. With regard to age, the 18 and younger age group scored higher on the
Raven’s than did the 20 year old age group, while the 19 year olds also scored
higher than did the 20 year old age group. Finally, the 20 year old age group scored
lower on the Raven’s than did the 21-and-over age group. No significant differences
were found for the home language biographical variable. Race showed a significant
difference between the African and White students, where the White students scored
higher results than did the African students. The White students also scored higher
scores on the Raven’s than did the Asian students.
The biographical variables of home language and race contribute to the scores
achieved by students in the ART, while age and race contribute to the scores
achieved by students in the Raven’s.
6.2.5 H1: The Abstract Reasoning Test scores predict first year engineering
students’ mid and end of year results (2014 intake).
The strongest correlation was found between CHMT1000 (mid-year) and the ART
which displays a weak to moderate relationship. This subject also displays the

91
highest R2 value in terms of the ART which shows that 11% of the subject’s results
can be explained by the ART results.
These scores are weak and do not allow the Abstract Reasoning Test to be used as
a predictor for academic results.
6.2.6 H2: The Raven’s Advanced Progressive Matrices scores predict first year
engineering students’ mid and end of year results (2014 intake).
The highest correlation was found between the Raven’s and CHMT1000 (mid-year)
results. The score shows a weak to moderate correlation. There was one other weak
to moderate correlation (between the Raven’s and CHMT1000 (end of year) results),
but all of the other significant correlations showed weak results. The highest R2 value
was 0.12 for CHMT1000 (both mid-year and end of year results).
These scores are not sufficiently high enough to allow for predictions to be made for
academic results using the Raven’s.
6.2.7 H3: The Abstract Reasoning Test is a more powerful predictor for
academic results than the Raven’s Advanced Progressive Matrices (2014
intake).
There are three weak to moderate relationships which are the highest r values in the
two phases, yet these scores are not high enough to allow for predictions about
academic results to be made using either the Abstract Reasoning Test or the
Raven’s Advanced Progressive Matrices.
As in Phase One and the 2013 intake section of Phase two, this question has
becomes obsolete.
6.2.8 H4: Biographical variables contribute to the scores achieved by students
on the Abstract Reasoning Test and the Raven’s Advanced Progressive
Matrices (2014 intake)
As for the fourth hypothesis in the above two sections, the Abstract Reasoning Test
will be analysed first, followed by the Raven’s Advanced Progressive Matrices.
No significant differences were found between the ART and gender or the ART and
age. English and Afrikaans were grouped for home language in this analysis due to
small sample sizes. Significant differences were found between this English-
Afrikaans group and isiZulu, siSwati, isiNdebele, Sepedi, Xitsonga, Setswana,
Sesotho, Tshivenda and isiXhosa. The students in the English-Afrikaans group
scored higher marks than the African language speakers. The African students

92
scored lower in the ART than did White and Asian students when race was
analysed.
The Raven’s analyses showed no significant differences in terms of any of the
biographical variables.
In conclusion, the biographical variables of home language and race showed
significant differences in terms of the ART scores. The Raven’s Advanced
Progressive Matrices did not display any differences in terms of the biographical
variables.
6.3 Phase Three
Phase three examined the following two questions:
1. Do engineering students with high, low and medium scores on the Abstract
Reasoning Test achieve different university results when taking their intake
year into account?
2. Do engineering students with high, low and medium scores on the Raven’s
Advanced Progressive Matrices achieve different university results when
taking their intake year into account?
The results displayed that the grouping the student belonged to in terms of their
scores on the ART and the Raven’s had an effect on the university results when the
year was taken into account. These results were all significant.
6.4 Comparing the results to the literature and its corresponding
implications
The main concern that arises from the literature are the issues surrounding the
education system in South Africa, including the educational issues that may still
remain due to unequal schooling opportunities within the Apartheid era to those of
different races (Zaaiman et al., 2001, Christie, 1998, Department of Basic Education,
2013). The racial differences in this study were not examined in terms of academic
results (as this was not the focus of the study), but they were analysed in terms of
the students’ performance on psychometric tests.
As found in a 2004 study at the University of the Witwatersrand, the Raven’s shows
a possible bias in terms of race (Rushton et al., 2004). This was reaffirmed in this

93
study where African students scored significantly lower than students of other races.
In Phase One, the African students achieved lower scores in the ART than students
of all other races, while in the Raven’s the African students scored significantly lower
than both the White and Coloured students. In the 2013 intake of Phase Two, the
African students achieved significantly less on the ART than did students of all other
races, and significantly less on the Raven’s than White students. In the 2014 intake,
African students scored significantly less on the ART than White and Asian students,
but no significant differences were found in terms of race on the Raven’s Advanced
Progressive Matrices. Due to the above differences, the ART appears to be more
racially biased than does the Raven’s, which one would not expect due to the ART
being a South African test, developed for use on a South African population
(Psytech, retrieved on 15/08/2014).
The Raven’s Progressive Matrices Test is designed to allow for the identification of
Spearman’s g – a factor of general, well-rounded, adaptable intelligence (Duncan,
Seitz, Kolodny, Bor, Herzog, Ahmed, Newell & Emslie, 2000, Embretson &
McCollam, 2000). Thus, students scoring highly in this should score highly in all
other subjects as they should have the ability to problem-solve and learn in such a
way that would enable them to achieve well in an academic context (Duncan, Seitz,
Kolodny, Bor, Herzog, Ahmed, Newell & Emslie, 2000, Embretson & McCollam,
2000). As no correlation or predictive value was found, one should tentatively
examine this concept as the Raven’s may not be a fully accurate measure of this
type of intelligence in this specific context. This may lead to a disinclination to use
this test as a measure of general intelligence under the assumption that the students
who score highly will naturally achieve well academically in a South African context.
Another cause for concern was the difference between the students’ home language,
and the language in which they were being taught (in cases where this varied). It is
important to take into account that students who experience a difference between
their home language and the language in which they are taught may struggle to
grasp concepts fully that are taught in subjects such as Mathematics due to an
additional difficulty, the barrier of language influencing their ability to succeed
(Schaap & Luwes, 2013). Very few of the students in this study have English as a
home language, yet the University of the Witwatersrand delivers its lectures in
English. This will be further discussed in the limitations, but it may offer an

94
explanation as to why the students continuously struggle in this subject and why it
did not correlate to the ART and Raven’s. When analysing Phase One (the sample
as a whole) it was discovered that only 19.7% of the sample were first language
English speakers. In total, 77.4% of the sample were students’ whose home
language was an African language. This means that the vast majority of students in
these courses under analysis, are not being taught in their first language, which is
their primary mode of communicating and understanding (Schaap & Luwes, 2013).
This poses numerous problems about whether the students’ are able to grasp what
is already acknowledged to be difficult content, in a language in which they may not
be fully fluent (Schaap & Luwes, 2013).
These results, in addition to the lack of predictability found for the tests, add to the
inability of the University to use this test as a predictive measure as this will show
(incorrectly) a vast number of candidates as achieving less than desirable scores.
The use of a test in a setting where the majority of the candidates/students would be
discriminated against would not be able to aid one’s knowledge or understanding
regarding the strengths and weaknesses of the group.
A flawed or incomplete education relates to a skills shortage within the country
(Chisholm, 1983). It was claimed that the education students’ receive in high school,
does not adequately prepare them for their tertiary education, which can lead to
failure in their first year (Laidra et al., 2006). This in turn will lead to less students
graduating from a particular course (in this case engineering), which will directly
translate to a further skills shortage in South Africa (Schaap & Luwes, 2013).
Following this train of thought, it is important to assess students results in their first
year to examine whether or not they have the ability to pass their courses. An
examination of the marks obtained in Phase One shows that not every student has
the ability to pass the Engineering first year course. For the mid-year marks in
CHMT1000, majority vast number of students failed as the mean score reflected a
mark of 46.9%, with a standard deviation of 11.38.The end of year mark for this
subject shows a slight increase to 51.59%, but the minimum marks displays a score
of 12%. From these statistics, one can assume that a possibility for these marks is
that not all the students are necessarily equipped for the learning that takes place on
a tertiary level.

95
Romer (2001) claimed that the most important economic question was how to
increase growth of output for each individual as this would enable the individual to
provide for not only his/her organisation, but the economy of the country too. The
aim of this research followed a similar vein, in that the engineering department
hoped that if the psychometric tests showed predictive validity, it would enable them
to focus on each individuals ‘development areas’, enabling them to provide
opportunities to further enhance the learning in these areas. Following Romer’s logic
(2001), a small increase in the growth rate will lead to a cumulative effect on the
standard of living within the country, and the enhancement of the training and
developing of engineers, would enable the university to make a small difference in
the skills shortage experienced in South Africa.
The subject of mathematics was presented as the most difficult subject in the
engineering degree and the one with which the students struggled the most (Rylands
& Coady, 2009). This theory was found to be disproven in the research as the
mathematics marks displayed the highest maximum mark (98%) as well as the
highest mean (64.85%) in Phase One with a standard deviation of 15.10. The 2013
intake of Phase Two also showed Mathematics as the highest average mark
(70.21%), with the 2014 intake reiterating this finding with the highest mean mark of
62.22% achieved by students in mathematics.
This study aimed to find a way of predicting a students’ mathematical ability at a
university level that could be used as a more reliable indicator than matric results.
Tests of intelligence such as the Abstract Reasoning Test and Raven’s Advanced
Progressive Matrices claim to test the aspect of reasoning that the students’ will also
make use of when solving some mathematical problems (Lam & Kirby, 2002). It was
believed that abstract reasoning and problem solving skills (which are tested in both
the ART and the Raven’s) would enable clear correlations between the psychometric
tests and the mathematics results (Lam & Kirby, 2002). However, there was no link
found between either of the tests and the students’ ability to perform well in
Mathematics. The result is that this study is unable to contribute to a measure of
predicting students’ ability to succeed in the subject of Mathematics.
Another disjuncture found between the literature and the results in the study is with
regard to the Economics courses. In both Phases, Economics correlated (albeit
weakly) to the ART and the Raven’s. These tests, as discussed above, are

96
measures of intelligence, abstract thinking and problem solving, while Economics is
more a subject of ‘book learning’ which would not require any of these skills
(Lubinski, 2004). Economics is the only subject out of the five that the first year
engineering students are required to complete, which would fall into the ‘book
learning’ category, but it was the subject that showed significant predictors most
consistently. The directions for future research will discuss possibly furthering the
inquisition as to why these results were found.
6.5 The limitations of the study
There are a number of limitations that have been identified with regard to this study
which may have influenced the results in a way which could lead to the results being
skewed:
1. The consent from the students to make use of their marks in this study was
only attained after the test had been completed and from students who were
present in lectures. Students who missed lectures may have lower marks
which would mean that the data that the researchers were given permission to
use in this study was skewed. The students whose consent was not gained
could form a similar group of students with lower academic results which may
have biased the sample.
2. Linked to the above point, consent from the 2013 first years to use their
university results in this study was only gained in 2014. Every student in that
class who formed part of the original database, had passed first year and
were part of the upper echelons of the class in terms of academic results. This
would have led to a bias in the sample and data, as the students who had
failed or withdrawn from the class were not included for ethical reasons. This
resulted in a restricted range for the correlations and regressions, and would
have led to smaller correlation coefficients. Therefore it is not known whether
the tests predicted university results for students who did not achieve well
academically, or whether the predictive ability of the tests would have been
better if these 2013 students had been included in the sample. However, as
permission was gained from the 2014 students early in the year before any of
the students had failed or left the course, it gives an opportunity to examine
the differences between the two groups and analyse these differences. A brief
overview shows weak correlations as the strongest relationships in the 2013

97
sample, but weak to moderate correlations as the strongest relationships in
the 2014 sample. It is possible that the inclusion of the students who were not
present in the class at the time of gaining consent, may have allowed for a
small difference in the results found.
3. These tests have shown a possible bias against African students. As most of
the research group comprised African students this may have led the
analyses to show no prediction for academic results as opposed to showing a
direct relationship that may have been found if the test was unbiased and fair.
4. The biographical variables were not analysed with regard to differences that
they may have on academic results. An analysis in this area may have added
valuable information to this topic and furthered understanding of why no
predictability could be found between the groups and their academic results.
If, for example, different groups were made in terms of biographical variables
and academic results, these separate groups could have been analysed
individually to assess whether the psychometric tests could be used for any
particular sub group as predictors of their academic results.
6.6 Directions for future research
The results of this study stand in direct contrast to previous studies with regard to the
correlation between test scores and levels of intelligence used in engineering
courses (Lam & Kirby, 2002, Lubinski, 2004, Duncan et al., 2000, Embretson &
McCollam, 2000, Prietual & Simon, 1989). In this case, there was a possible bias
against African students in terms of both the ART and Raven’s results. It may be
beneficial to do this study with tests that do not show a bias towards a large
percentage of the participant group.
No analysis was conducted into the extraneous variables of how successful the
students’ had been in adapting to their tertiary education climate. The low marks that
some students received could have been due to an inability to successfully adapt
from a high school framework to that of a university. As such, low marks could have
been a result of personal issues, not relating to the student’s level of intelligence or
ability to perform. This, in turn, could have impacted on the results, showing that the
psychometric tests could not be used to predict academic results. It would be useful
to see whether adaption to one’s new environment would play a significant role in
this study.

98
The different biographical variables were not analysed individually to assess whether
certain groups of students’ may allow for accurate predictions on academic results
using psychometric test scores. Although significant differences were found between
the groups on the test scores, it may be useful to analyse whether these differences
also exist in the academic results and (if so), whether this leads to a better overall
result on the predictability of the tests.
As discussed earlier in this section, it would add to the scope of this project to
examine the type of reasoning and intelligence used in each subject more fully. This
would aid in understanding the complete disassociation of Mathematics with the type
of problem solving ability test with which it is supposed to correlate, while Economics
shows correlations to a test which measures a facet of intelligence Economics claims
not to use.
Finally, the role of language in the teaching process, a reference to the type of
school attended and the new National Benchmarking Tests could have all played a
role in understanding the differential performance of different groups in their
academic results. This would have added insight to the study and possibly acted as
extraneous variables in understanding the relationship between the academic results
and the psychometric assessments.

99
Chapter 7: Conclusion
7. Conclusion
This research project aimed to test whether the Abstract Reasoning Test and the
Raven’s Advanced Progressive Matrices could be used as predictors for first year
engineering students mid and end of year results. In addition, biographical variables
were examined to analyse whether they contributed to the scores a student obtained
on the ART or the Raven’s. This theory was tested through two different Phases.
Phase One used the sample as a whole, incorporating both 2013 and 2014 first year
students, whereas Phase Two separated the 2013 first year students from the 2014
first year students.
Phase One showed significant relationships between every subject and the ART, yet
all of these correlations were weak. The percentages of the academic results that
could be explained by the scores on the ART were low.
Additionally, three significant correlations were found between the Raven’s and the
academic results, yet all of the relationships were weak with poor R2 values, leading
to the conclusion that for the Phase One sample, the Abstract Reasoning Test and
the Raven’s Advanced Progressive Matrices cannot be used as predictors for mid-
year and end of year academic results for first year engineering students.
For Phase Two, the 2013 students were analysed first. The significant relationships
between the ART and the academic results were all weak, with correspondingly
weak R2 values. The regression between the Raven’s and the academic results
produced only two significant relationships, both of which were weak and held even
weaker R2 values than those found in the regression between the ART and the
academic results. As such, the 2013 sample showed that no predictions could be
made for mid-year and end of year results using the scores students obtained on
either the Abstract Reasoning Test or the Raven’s Advanced Progressive Matrices.
Finally, the 2014 sample was analysed and it was discovered that weak to moderate
relationships existed between the Abstract Reasoning Test and the academic results
of the students’. However, these relationships corresponded to weak R2 values
which showed low levels of predictability. The Raven’s also produced a weak to

100
moderate relationship between itself and two of the academic subjects. However, the
predictability scores were as low as those found for the ART. The conclusion
reached was that for this sub-group the Abstract Reasoning Test and the Raven’s
Advanced Progressive Matrices could not be used as predictors for the academic
results of first year engineering students.
Biographical variables were analysed in order to see whether they contributed to the
scores achieved by the students on the Abstract Reasoning Test and the Raven’s
Advanced Progressive Matrices. Gender did not display any significant differences in
either of the tests for Phase One or Two.
Phase One showed significant differences between age, home language and race
on the ART. The age group of 18 years and younger scored significantly higher
marks than did the 19 year old age group and the 20 year old age group. Both
English and Afrikaans speakers scored significantly higher than the students’ whose
home language was an African language. The African students scored lower marks
than did the White, Asian and Coloured students. As with the ART, the Raven’s
showed a significant difference in age, where the 18 years and younger students
scored better than did the 19 year old or 20 year old students. No significant
differences were found in terms of home language, but race displayed differences,
showing that White and Asian students performed better than African students.
In Phase Two (the 2013 intake), the ART displayed a significant difference for home
language, where the English speaking students scored higher than the siSwati,
Sepedi and Xitsonga speaking students, while Afrikaans students scored more
highly than did any of the African language speakers. White, Asian and Coloured
students all achieved significantly better results than did the African students with
regard to race. The Raven’s showed significant differences for both age and race.
The 20 year old students scored significantly less than their younger counterparts,
while White students scored significantly more than either the Black or Asian
students.
For the 2014 intake of Phase Two, a significant difference in both home language
and race was found for the ART. The Afrikaans-English group of students scored
significantly more than isiZulu, siSwati, isiNdebele, Sepedi, Xitsonga, Setswana,
Sesotho, Tshivenda and Xhosa speakers, while the White and Asian students

101
scored higher than the African students. The Raven’s did not show any significant
differences in terms of the biographical variables.
In conclusion, the Abstract Reasoning Test and the Raven’s Advanced Progressive
Matrices cannot be used as predictors for mid-year or end of year academic results
for first year engineering students. In addition, biographical variables do contribute to
the scores achieved on both the Abstract Reasoning Test and the Raven’s
Advanced Progressive Matrices.

102
Chapter 8: References
8. References
Anastasi, A. (1990). Psychometric Testing. Macmillan Publishing Company:
Singapore.
Babcock, R.L. (1994). Analysis of Adult Age Differences on the Raven’s Advanced
Progressive Matrices Test. Psychology and Aging, 9, 203-314.
Carpenter, P. A., Just, M.A., & Shell, P (1990). What One Intelligence Test
Measures: A Theoretical Account of the Processing in the Raven Progressive
Matrices Test. Carnegie Mellon University: Pittsburgh, 1-70.
Chisholm, L. (1983).Redefining Skills: black education in South Africa in the 1980’s.
Comparative Education, 19, 357-371.
Christie, P. (1998). Schools as (Dis)Organisations: the ‘breakdown of the culture of
learning and teaching’ in South African schools. Cambridge Journal of
Education, 28, 283-300.
Coughlin, C.C. & Segev, E. (1999). Foreign Direct Investment in China: A Spatial
Econometric Study. Unpublished Manuscript. Retrieved from
http://research.stlouisfed.org/wp/1999/1999-001.pdf on 21/04/2015.
Cuthbert, R.H., & MacGillivray, H.L. (2007). Investigation of completion rates of
engineering students. In Proceedings 6th Southern Hemisphere conference on
Mathematics and Statistics Teaching and learning, (pp. 35-41),El Calafate,
Argentina.
Daniels, R.C. (2007). Skills Shortage in South Africa: A Literature Review.
Unpublished DPRU Working Paper, University of Cape Town, Cape Town,
South Africa.
Department of Basic Education (2013). Education Statistics in South Africa
2011.Retrieved on 18/09/2014 from www.education.gov.za.

103
Duncan, J., Seitz, R.J., Kolodny, J., Bor, D., Herzog, H., Ahmed, A., Newell, F.N., &
Emslie, H. (2000). A Neural Basis for General Intelligence. Science, 29, 457-
460.
Embretson, S.E., & McCollam, K.S. (2000). Psychometric Approaches to Measuring
and Understanding Intelligence. In Sternberg, R.J. (Ed.) Handbook of
Intelligence. Georgia Institute of Technology: Cambridge University Press.
Esterhuizen, I. (2013). SA’s engineering science graduates increasing, but still below
target – Nzimande. Engineering News. Retrieved on 19/09/2014 from
www.engineeringnews.co.za.
Fagan, J.F. (2000). A Theory of Intelligence as Processing: Implications for Society.
Psychology, Public Policy and Law, 6, 168-179.
Gliem, J.A., & Gliem, R.R. (2003). Calculating, Interpreting and Reporting
Cronbach’s Alpha Reliability Coefficient for Likert-type Scales. Midwest
Research-to-Practice Conference in Adult, Continuing and Community
Education.
Hamel, R., & Schmittmann, V.D. (2006). The 20-Minutes Version as a Predictor of
the Raven Advanced Progressive Matrices Test. Educational and
Psychological Measurement, 66, 1039-1046.
Hernandez-Orallo, J., & Dowe, D.L. (2010). Measuring Universal Intelligence:
Towards an Anytime Intelligence Test. Artificial Intelligence, not provided.
Jansen, J.D. (1998). Curriculum Reform in South Africa: a critical analysis of
outcomes-based education. Cambridge Journal of Education, 28, 321-331.
Kingdon, G. & Knight, J. Unemployment in South Africa, 1995-2003: causes,
problems and policies. (2005). Retrieved from Global Poverty Research
Group (http://www.gprg.org./).
Laidra, K., Pullmann, H., & Allik, J. (2006). Personality and intelligence as predictors
of academic achievement: A cross-sectional study from elementary to
secondary school. Personality and Individual Differences, not provided.

104
Lam, L.T., & Kirby, S.L. (2002). Is Emotional Intelligence an Advantage? An
Exploration of the Impact of Emotional and General Intelligence on Individual
Performance. The Journal of Social Psychology, 142, 133-143.
Lubinski, D. (2004). Introduction to the Special Section on Cognitive Abilities: 100
Years After Spearman’s (1904) “’General Intelligence,’ Objectively
Determined and Measured”. Journal of Personality and Social Psychology,
86, 96-111.
Messick, S. (1987). “Validity.” ETS Research Report Series 1987(2), 1-208.
Potter, C., & van der Merwe, E (2001, August). Spatial Ability, Visual Imagery and
Academic Performance in Engineering Graphics. Paper presented at the
International Conference on Engineering Education, Oslo, Norway.
Potter, C., van der Merwe, E., Kaufman, W., & Delcour, J. (2006). A longitudinal
evaluative study of student difficulties with engineering graphics. European
Journal of Engineering Education, 31, 201-214.
Prietula, M.J., & Simon, H.A. (1989). The Experts in Your Midst. Harvard Business
Review, Jan-Feb 1989, 120-124.
Psytech SA. Manual with questions for the Abstract Reasoning Test. Retrieved on
15/08/2014 from www.psytech.co.za.
Raven, J. (2000). The Raven’s Progressive Matrices: Change and Stability over
Culture and Time. Cognitive Psychology, 41, 1-48.
Romer, P.M. (2001). Should the government subsidize supply or demand in the
market for scientists and engineers? Innovation Policy and the Economy, 1,
221-252.
Rushton, J.P., Skuy, M., & Bons, T.A. (2004). Construct Validity of Raven’s
Advanced Progressive Matrices for African and Non-African Engineering
Students in South Africa. International Journal of Selection and Assessment,
12, 220-229.
105
Rushton, J.P., Skuy, M., & Pridjhon, P (2002). Jensen Effects among African, Indian
and White engineering students in South Africa on Raven’s Standard
Progressive Matrices. Intelligence, 30, 409-423.
Rylands, L.J., & Coady, C. (2009). Performance of students with weak mathematics
in first-year mathematics and science. International Journal of Methematical
Education in Science and Technology, 40, 741-753.
Schaap, P., & Luwes, M. (2013). Learning potential and academic literacy tests as
predictors of academic performance for engineering students. Acta
Academica, 24, 181-214.
Seggie, E. (2012). SA’s engineering shortage widens. Retrieved on 19/09/2014 from
www.moneyweb.co.za.
Sorby, S.A. (2009). Educational Research in Developing 3-D Spatial Skills for
Engineering Students. International Journal of Science Education, 31, 459-
480.
Stangor, C. (2011). Research Methods for the Behavioural Sciences, 4th ed.
Wadsworth: USA.
Statistics South Africa. Retrieved on 17/09/2014 from http://beta2.statssa.gov.za/.
Taylor, J.A., & Morgan, M.J. (1999). Mathematics support program for commencing
engineering students between 1990 and 1996: an Australian case study.
International Journal of Engineering Education, 15, 486-492.
Van Langen, A., & Dekkers, H. (2005). Cross-national differences in participating in
tertiary science, technology, engineering and mathematics education.
Comparative Education, 41, 329-350.
Winter, G. (2000). A Comparative Discussion of the Notion of ‘Validity’ in Qualitative
and Quantitative Research. The Qualitative Report,4, pages not provided.
Zaaiman, H., van der Flier, H., & Thijs, G.D. (2001). Dynamic Testing in Selection for
an Educational Programme: Assessing South African Performance on the
Raven Progressive Matrices. International Journal of Selection and
Assessment, 9, 258-269.

106
Chapter 9: Appendices
9. Appendices
9.1 Appendix A: Consent Form
I,.............................................................................(First and last name)
............................................(student number), hereby grant permission for my
Abstract Reasoning Test scores, Advanced Raven’s Test scores, thinking test
scores and mid- and end-of-year results to be used for research purposes.
I understand that this information will be kept confidential and that at no point will my
scores or marks be reported individually or accessed by anyone other than the
researcher and her supervisor.
...............................................
(Signature)
Please also fill in the below biographical information:
1. Gender? ___________________________
2. Age? ______________________________
3. Matric Examination Written: IEB or GDE? ____________
4. Home Language? _______________________________
5. What degree are you studying towards? ________________________
6. What year of study are you in currently? ________________________
7. Are you currently repeating any subjects? _______________________

107
9.2 Appendix B: Letter for 2014 Participants
Psychology
School of Human & Community Development
University of the
Witwatersrand
Private Bag 3, WITS, 2050
Tel: (011) 717 4500 Fax: (011) 717 4559
17 March 2014
Good day
My name is Julia Groves and I am conducting research for my Masters degree at the University of
the Witwatersrand. My research focuses on using psychometric tests, specifically the Abstract
Reasoning Test, Ravens Advanced Progressive Matrices and thinking tests, as predictors for student
marks.
By the end of the second block, you will have completed both these tests, and I would like to ask for
your permission to use the results and your university marks in the data for my study. Participation
is voluntary and confidential and I will link the results of the various assessments using student
numbers and not names. I will only report group trends and not individual results in the research
report. You will not be advantaged or disadvantaged in any way by choosing to participate in this
study. If are willing to participate, and you are interested in the results, they will be made available
on a public forum within the engineering department at the end of the year.
If you are willing to participate in this study, please could you fill out the attached consent form and
return it to me. If you have any further queries, I can be contacted telephonically on 082 547 8782 or
via email through [email protected] and my supervisor (Fiona Donald) can be contacted on 011
717 4507 or [email protected].
Thank you for taking the time to consider taking part in this study. This research will contribute to a
larger body of knowledge about psychometric testing and its predictive values.
Yours sincerely,
Julia Groves Dr Fiona Donald
108
9.3 Appendix C: Letter for 2013 Participants
Psychology
School of Human & Community Development
University of the
Witwatersrand
Private Bag 3, WITS, 2050
Tel: (011) 717 4500 Fax: (011) 717 4559
17 March 2014
Good day
My name is Julia Groves and I am conducting research for my Masters degree at the University of
the Witwatersrand. My research focuses on using psychometric tests, specifically the Abstract
Reasoning Test, Ravens Advanced Progressive Matrices and thinking tests, as predictors for student
marks.
Over the last year or two, you probably completed these tests, and I would like to ask for your
permission to use the results and your university marks in the data for my study. Participation is
voluntary and confidential and I will link the results of the various assessments using student
numbers and not names. I will only report group trends and not individual results in the research
report. You will not be advantaged or disadvantaged in any way by choosing to participate in this
study. If are willing to participate, and you are interested in the results, they will be made available
on a public forum within the engineering department at the end of the year.
Should you be willing to participate in this study, please complete the attached consent form and
return it to me. If you have any further queries, I can be contacted telephonically on 082 547 8782 or
via email through [email protected] and my supervisor (Fiona Donald) can be contacted on 011
717 4507 or [email protected].
Thank you for taking the time to consider taking part in this study. This research will contribute to a
larger body of knowledge about psychometric testing and its predictive values.
Yours sincerely,
Julia Groves Dr Fiona Donald

109
9.4 Appendix D

110
9.5 Appendix E
Related Documents